Zip Codes with the Highest Percentage of Households Heated by Bottled Gas / Liquid Propane in Benton, AR
RELATED REPORTS & OPTIONS
Bottled Gas / LP Heating
Benton
Compare Zip Codes
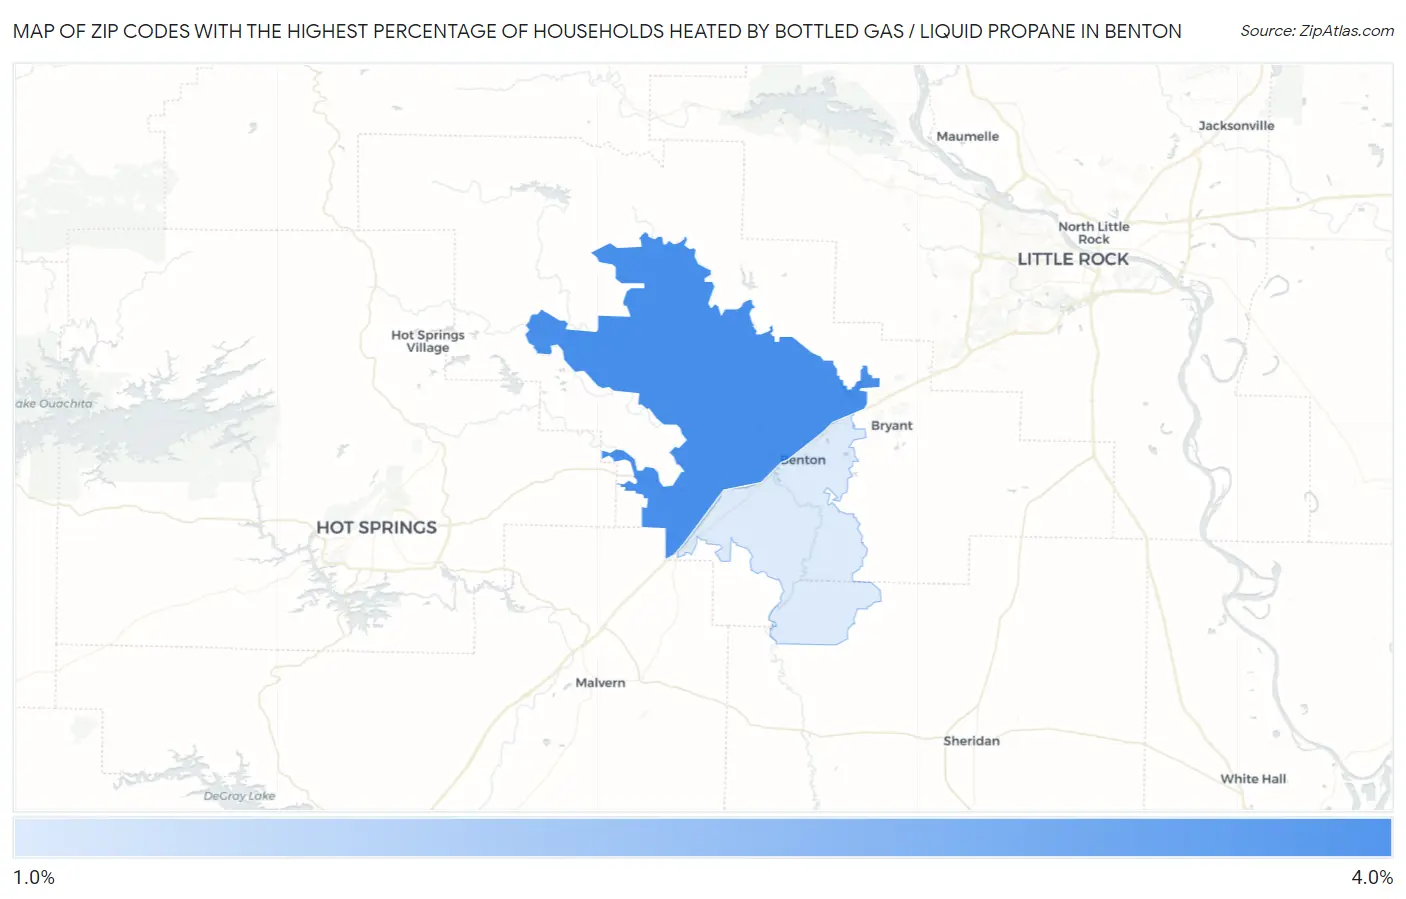
Map of Zip Codes with the Highest Percentage of Households Heated by Bottled Gas / Liquid Propane in Benton
1.2%
3.5%
Zip Codes with the Highest Percentage of Households Heated by Bottled Gas / Liquid Propane in Benton, AR
| Zip Code | Bottled Gas / LP Heating | vs State | vs National | |
| 1. | 72019 | 3.5% | 6.5%(-3.00)#420 | 4.9%(-1.40)#20,220 |
| 2. | 72015 | 1.2% | 6.5%(-5.30)#505 | 4.9%(-3.70)#25,888 |
1
Common Questions
What are the Top Zip Codes with the Highest Percentage of Households Heated by Bottled Gas / Liquid Propane in Benton, AR?
Top Zip Codes with the Highest Percentage of Households Heated by Bottled Gas / Liquid Propane in Benton, AR are:
What zip code has the Highest Percentage of Households Heated by Bottled Gas / Liquid Propane in Benton, AR?
72019 has the Highest Percentage of Households Heated by Bottled Gas / Liquid Propane in Benton, AR with 3.5%.
What is the Percentage of Households Heated by Bottled Gas / Liquid Propane in Benton, AR?
Percentage of Households Heated by Bottled Gas / Liquid Propane in Benton is 1.1%.
What is the Percentage of Households Heated by Bottled Gas / Liquid Propane in Arkansas?
Percentage of Households Heated by Bottled Gas / Liquid Propane in Arkansas is 6.5%.
What is the Percentage of Households Heated by Bottled Gas / Liquid Propane in the United States?
Percentage of Households Heated by Bottled Gas / Liquid Propane in the United States is 4.9%.