Zip Codes with the Highest Percentage of Population Employed in Office & Administration in Benton, AR
RELATED REPORTS & OPTIONS
Office & Administration
Benton
Compare Zip Codes
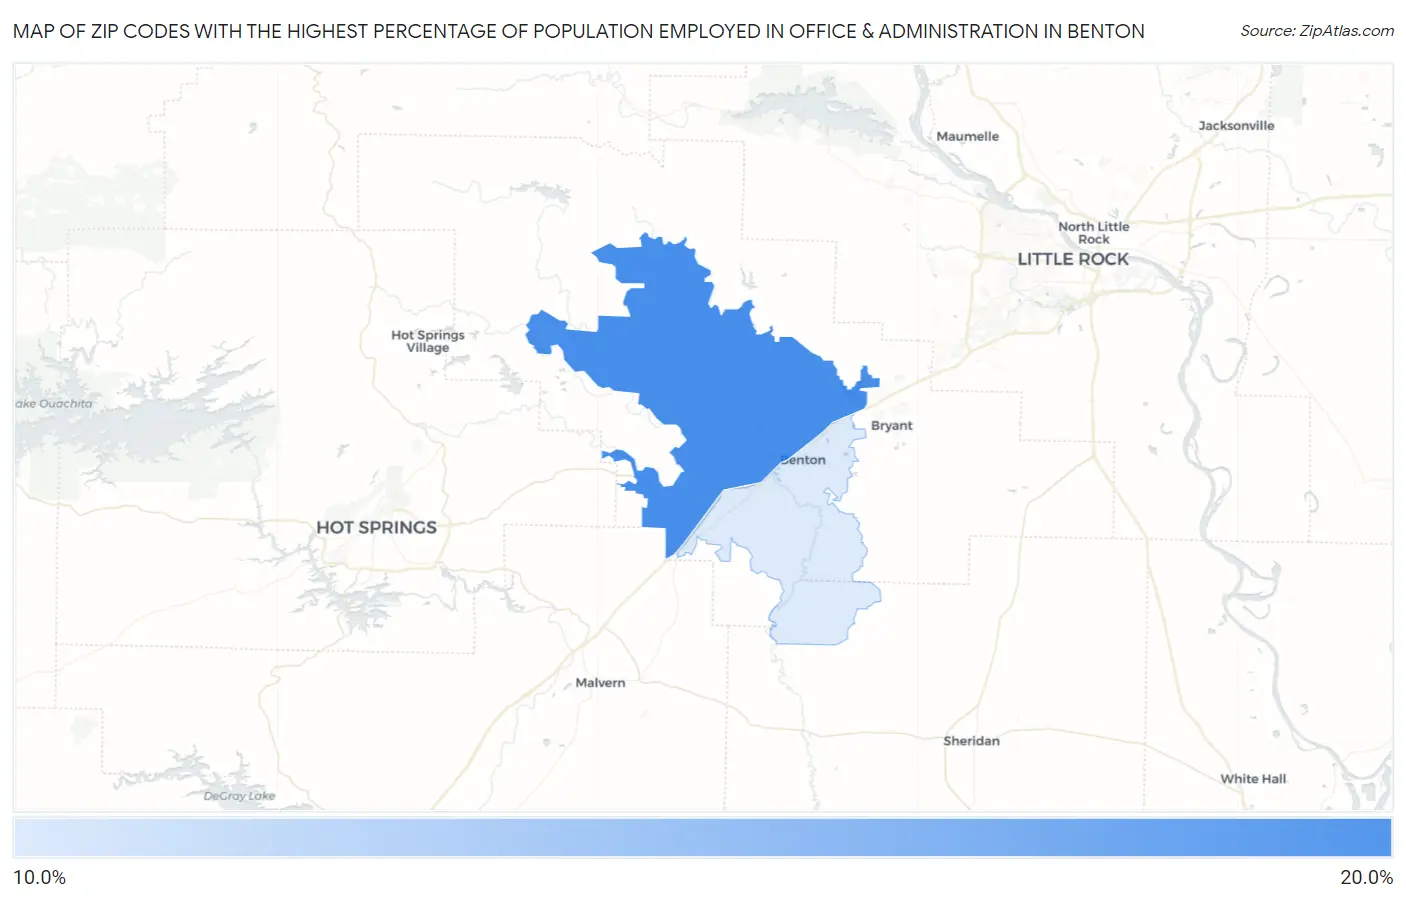
Map of Zip Codes with the Highest Percentage of Population Employed in Office & Administration in Benton
13.7%
15.3%
Zip Codes with the Highest Percentage of Population Employed in Office & Administration in Benton, AR
| Zip Code | % Employed | vs State | vs National | |
| 1. | 72019 | 15.3% | 10.8%(+4.49)#94 | 10.9%(+4.42)#4,235 |
| 2. | 72015 | 13.7% | 10.8%(+2.92)#118 | 10.9%(+2.85)#6,531 |
1
Common Questions
What are the Top Zip Codes with the Highest Percentage of Population Employed in Office & Administration in Benton, AR?
Top Zip Codes with the Highest Percentage of Population Employed in Office & Administration in Benton, AR are:
What zip code has the Highest Percentage of Population Employed in Office & Administration in Benton, AR?
72019 has the Highest Percentage of Population Employed in Office & Administration in Benton, AR with 15.3%.
What is the Percentage of Population Employed in Office & Administration in Benton, AR?
Percentage of Population Employed in Office & Administration in Benton is 14.6%.
What is the Percentage of Population Employed in Office & Administration in Arkansas?
Percentage of Population Employed in Office & Administration in Arkansas is 10.8%.
What is the Percentage of Population Employed in Office & Administration in the United States?
Percentage of Population Employed in Office & Administration in the United States is 10.9%.