Zip Codes with the Highest Percentage of Households Without a Vehicle in Benton, AR
RELATED REPORTS & OPTIONS
Households without a Cars
Benton
Compare Zip Codes
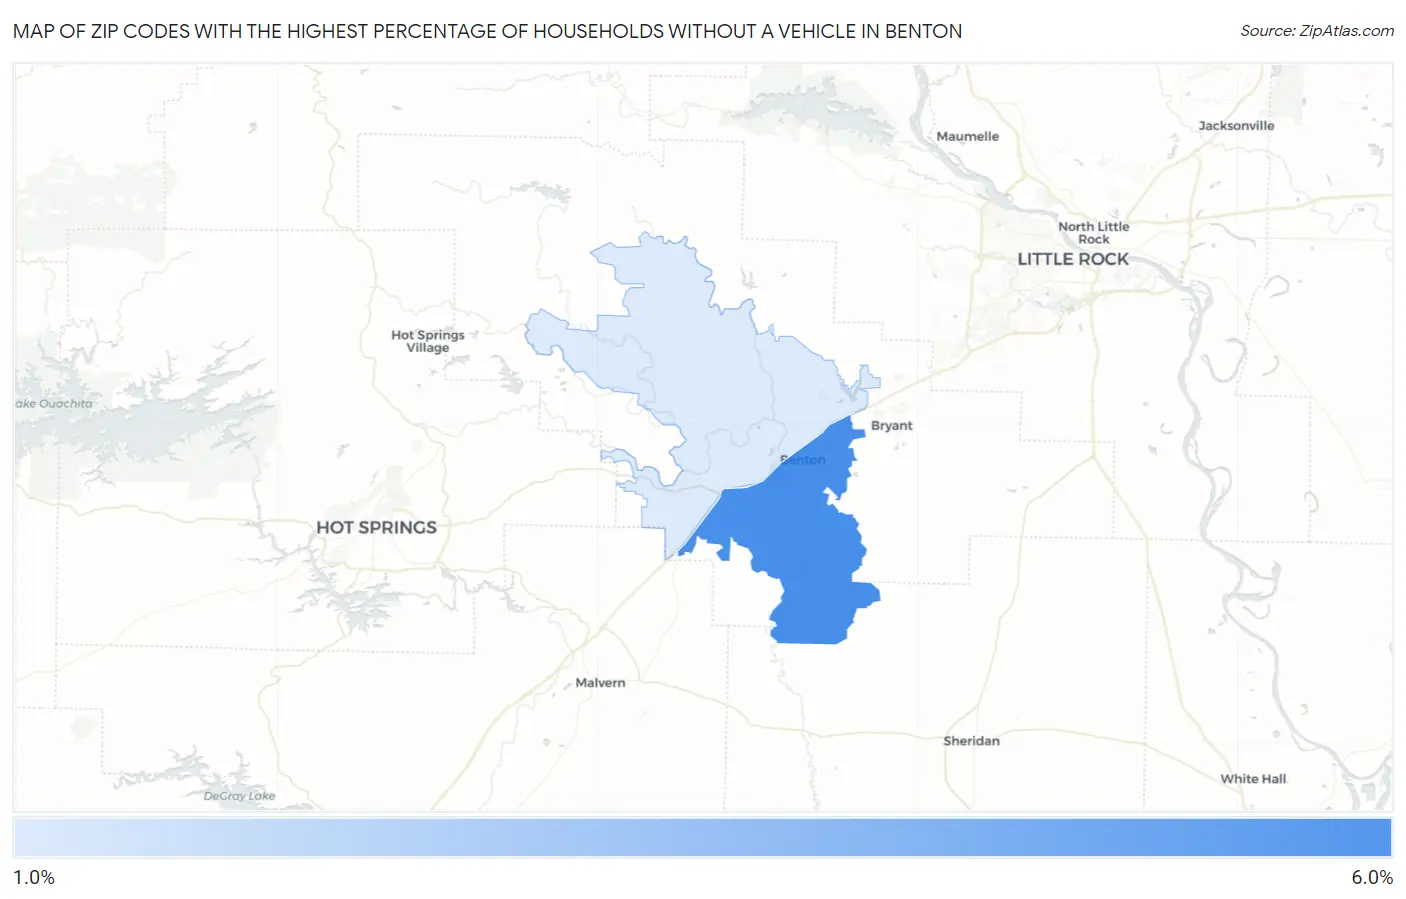
Map of Zip Codes with the Highest Percentage of Households Without a Vehicle in Benton
1.4%
5.3%
Zip Codes with the Highest Percentage of Households Without a Vehicle in Benton, AR
| Zip Code | Housholds Without a Car | vs State | vs National | |
| 1. | 72015 | 5.3% | 6.0%(-0.700)#218 | 8.3%(-3.00)#12,104 |
| 2. | 72019 | 1.4% | 6.0%(-4.60)#420 | 8.3%(-6.90)#24,425 |
1
Common Questions
What are the Top Zip Codes with the Highest Percentage of Households Without a Vehicle in Benton, AR?
Top Zip Codes with the Highest Percentage of Households Without a Vehicle in Benton, AR are:
What zip code has the Highest Percentage of Households Without a Vehicle in Benton, AR?
72015 has the Highest Percentage of Households Without a Vehicle in Benton, AR with 5.3%.
What is the Percentage of Households Without a Vehicle in Benton, AR?
Percentage of Households Without a Vehicle in Benton is 3.5%.
What is the Percentage of Households Without a Vehicle in Arkansas?
Percentage of Households Without a Vehicle in Arkansas is 6.0%.
What is the Percentage of Households Without a Vehicle in the United States?
Percentage of Households Without a Vehicle in the United States is 8.3%.