Zip Codes with the Highest Percentage of Population with a Degree in Arts and Humanities in Benton, AR
RELATED REPORTS & OPTIONS
Arts and Humanities
Benton
Compare Zip Codes
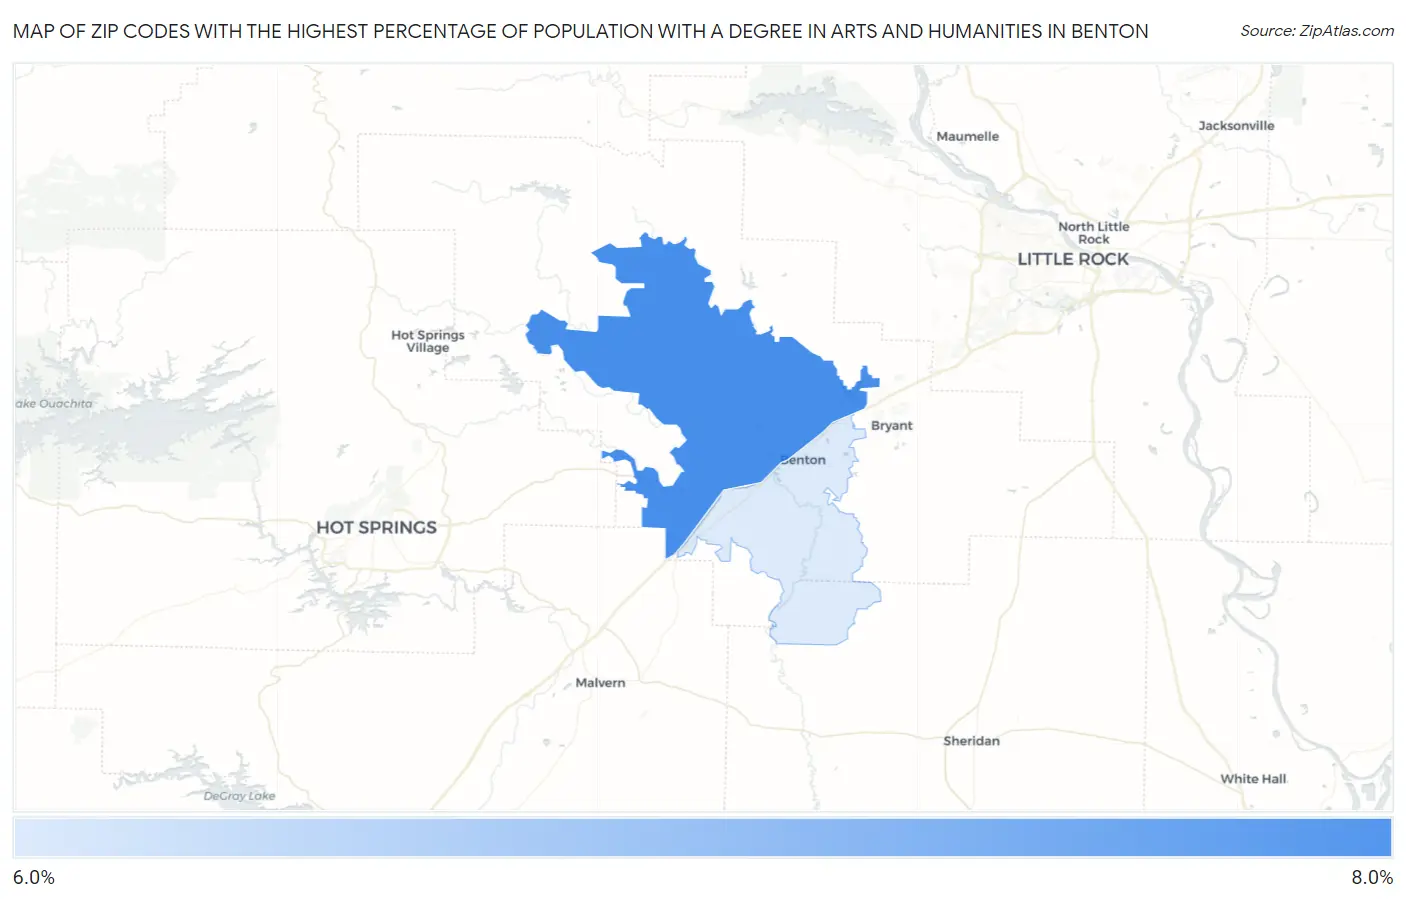
Map of Zip Codes with the Highest Percentage of Population with a Degree in Arts and Humanities in Benton
6.0%
7.9%
Zip Codes with the Highest Percentage of Population with a Degree in Arts and Humanities in Benton, AR
| Zip Code | % Graduates | vs State | vs National | |
| 1. | 72019 | 7.9% | 6.4%(+1.54)#149 | 6.0%(+1.94)#9,803 |
| 2. | 72015 | 6.0% | 6.4%(-0.367)#196 | 6.0%(+0.026)#14,613 |
1
Common Questions
What are the Top Zip Codes with the Highest Percentage of Population with a Degree in Arts and Humanities in Benton, AR?
Top Zip Codes with the Highest Percentage of Population with a Degree in Arts and Humanities in Benton, AR are:
What zip code has the Highest Percentage of Population with a Degree in Arts and Humanities in Benton, AR?
72019 has the Highest Percentage of Population with a Degree in Arts and Humanities in Benton, AR with 7.9%.
What is the Percentage of Population with a Degree in Arts and Humanities in Benton, AR?
Percentage of Population with a Degree in Arts and Humanities in Benton is 7.7%.
What is the Percentage of Population with a Degree in Arts and Humanities in Arkansas?
Percentage of Population with a Degree in Arts and Humanities in Arkansas is 6.4%.
What is the Percentage of Population with a Degree in Arts and Humanities in the United States?
Percentage of Population with a Degree in Arts and Humanities in the United States is 6.0%.