Cities with the Highest Percentage of Population Employed in Health Care & Social Assistance in Maryland
RELATED REPORTS & OPTIONS
Health Care & Social Assistance
Maryland
Compare Cities
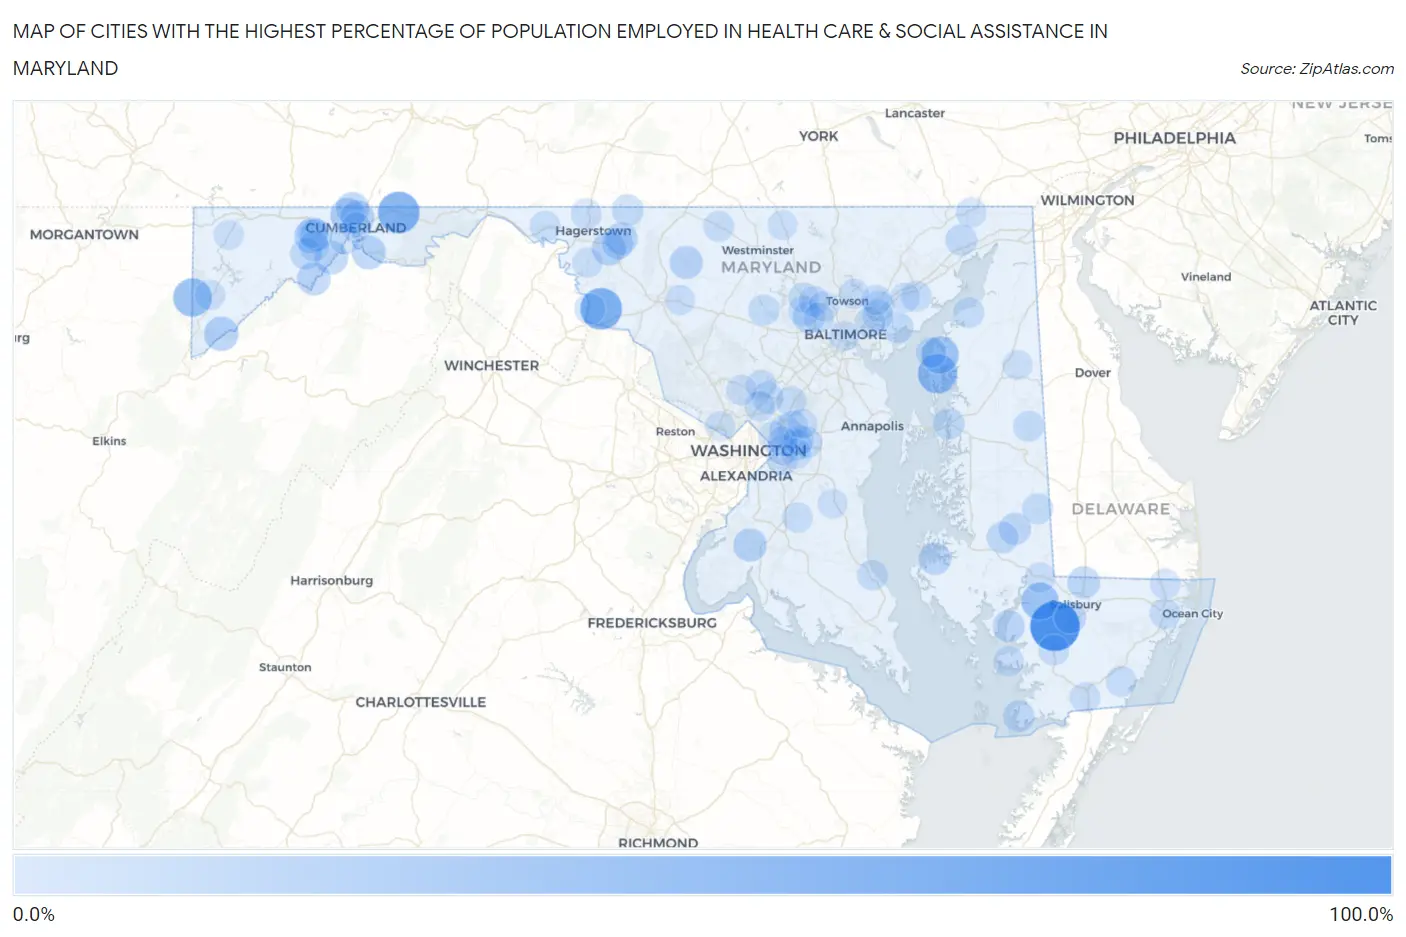
Map of Cities with the Highest Percentage of Population Employed in Health Care & Social Assistance in Maryland
0.0%
100.0%
Cities with the Highest Percentage of Population Employed in Health Care & Social Assistance in Maryland
| City | % Employed | vs State | vs National | |
| 1. | Allen | 100.0% | 13.5%(+86.5)#1 | 13.9%(+86.1)#15 |
| 2. | Yarrowsburg | 65.2% | 13.5%(+51.7)#2 | 13.9%(+51.3)#149 |
| 3. | Flintstone | 65.0% | 13.5%(+51.5)#3 | 13.9%(+51.1)#150 |
| 4. | Edesville | 55.6% | 13.5%(+42.0)#4 | 13.9%(+41.6)#235 |
| 5. | Hutton | 51.7% | 13.5%(+38.2)#5 | 13.9%(+37.8)#292 |
| 6. | Georgetown | 46.4% | 13.5%(+32.9)#6 | 13.9%(+32.5)#412 |
| 7. | Quantico | 46.4% | 13.5%(+32.9)#7 | 13.9%(+32.4)#415 |
| 8. | Crumpton | 38.5% | 13.5%(+25.0)#8 | 13.9%(+24.6)#661 |
| 9. | Gorman | 34.5% | 13.5%(+21.0)#9 | 13.9%(+20.6)#917 |
| 10. | Corriganville | 34.5% | 13.5%(+21.0)#10 | 13.9%(+20.5)#923 |
| 11. | Carlos | 32.4% | 13.5%(+18.9)#11 | 13.9%(+18.5)#1,130 |
| 12. | Bowmans Addition | 32.4% | 13.5%(+18.9)#12 | 13.9%(+18.4)#1,137 |
| 13. | Spring Gap | 32.1% | 13.5%(+18.6)#13 | 13.9%(+18.2)#1,170 |
| 14. | Beaver Creek | 31.1% | 13.5%(+17.6)#14 | 13.9%(+17.2)#1,320 |
| 15. | Bier | 30.8% | 13.5%(+17.3)#15 | 13.9%(+16.8)#1,354 |
| 16. | Pomfret | 30.0% | 13.5%(+16.5)#16 | 13.9%(+16.1)#1,463 |
| 17. | Dawson | 29.6% | 13.5%(+16.1)#17 | 13.9%(+15.7)#1,526 |
| 18. | Ellerslie | 29.5% | 13.5%(+16.0)#18 | 13.9%(+15.6)#1,546 |
| 19. | Woodsboro | 29.3% | 13.5%(+15.8)#19 | 13.9%(+15.4)#1,581 |
| 20. | Maryland Park | 28.8% | 13.5%(+15.3)#20 | 13.9%(+14.9)#1,674 |
| 21. | Jugtown | 27.3% | 13.5%(+13.8)#21 | 13.9%(+13.3)#1,987 |
| 22. | Delmar | 27.1% | 13.5%(+13.6)#22 | 13.9%(+13.1)#2,024 |
| 23. | Madison | 26.3% | 13.5%(+12.8)#23 | 13.9%(+12.4)#2,215 |
| 24. | Shaft | 26.0% | 13.5%(+12.5)#24 | 13.9%(+12.0)#2,314 |
| 25. | Fruitland | 25.4% | 13.5%(+11.9)#25 | 13.9%(+11.5)#2,457 |
| 26. | Hurlock | 25.4% | 13.5%(+11.9)#26 | 13.9%(+11.5)#2,470 |
| 27. | Jesterville | 25.0% | 13.5%(+11.5)#27 | 13.9%(+11.1)#2,618 |
| 28. | Milford Mill | 24.3% | 13.5%(+10.8)#28 | 13.9%(+10.3)#2,873 |
| 29. | Lonaconing | 24.2% | 13.5%(+10.7)#29 | 13.9%(+10.3)#2,908 |
| 30. | Woodmore | 23.7% | 13.5%(+10.2)#30 | 13.9%(+9.78)#3,092 |
| 31. | East New Market | 23.6% | 13.5%(+10.1)#31 | 13.9%(+9.69)#3,138 |
| 32. | Crisfield | 23.4% | 13.5%(+9.93)#32 | 13.9%(+9.51)#3,230 |
| 33. | Queenstown | 23.2% | 13.5%(+9.68)#33 | 13.9%(+9.26)#3,340 |
| 34. | Mount Aetna | 23.1% | 13.5%(+9.56)#34 | 13.9%(+9.14)#3,403 |
| 35. | Bowleys Quarters | 22.9% | 13.5%(+9.37)#35 | 13.9%(+8.94)#3,505 |
| 36. | Port Deposit | 22.8% | 13.5%(+9.28)#36 | 13.9%(+8.85)#3,544 |
| 37. | Fairland | 22.3% | 13.5%(+8.82)#37 | 13.9%(+8.40)#3,756 |
| 38. | Ringgold | 22.0% | 13.5%(+8.44)#38 | 13.9%(+8.02)#3,959 |
| 39. | Rossville | 21.6% | 13.5%(+8.09)#39 | 13.9%(+7.66)#4,197 |
| 40. | New Carrollton | 21.4% | 13.5%(+7.88)#40 | 13.9%(+7.46)#4,326 |
| 41. | Sykesville | 21.3% | 13.5%(+7.75)#41 | 13.9%(+7.33)#4,407 |
| 42. | White Marsh | 21.2% | 13.5%(+7.72)#42 | 13.9%(+7.30)#4,432 |
| 43. | Federalsburg | 21.1% | 13.5%(+7.61)#43 | 13.9%(+7.19)#4,523 |
| 44. | Betterton | 20.8% | 13.5%(+7.32)#44 | 13.9%(+6.90)#4,756 |
| 45. | Dargan | 20.8% | 13.5%(+7.27)#45 | 13.9%(+6.84)#4,795 |
| 46. | Potomac Park | 20.7% | 13.5%(+7.22)#46 | 13.9%(+6.79)#4,831 |
| 47. | Lake Arbor | 20.4% | 13.5%(+6.87)#47 | 13.9%(+6.44)#5,111 |
| 48. | Randallstown | 20.4% | 13.5%(+6.84)#48 | 13.9%(+6.41)#5,131 |
| 49. | Greensboro | 20.3% | 13.5%(+6.76)#49 | 13.9%(+6.34)#5,196 |
| 50. | Seabrook | 20.2% | 13.5%(+6.72)#50 | 13.9%(+6.30)#5,230 |
| 51. | St Leonard | 20.2% | 13.5%(+6.70)#51 | 13.9%(+6.28)#5,241 |
| 52. | Taneytown | 20.2% | 13.5%(+6.64)#52 | 13.9%(+6.22)#5,292 |
| 53. | Rosedale | 20.1% | 13.5%(+6.56)#53 | 13.9%(+6.13)#5,363 |
| 54. | Midlothian | 20.0% | 13.5%(+6.49)#54 | 13.9%(+6.06)#5,415 |
| 55. | District Heights | 20.0% | 13.5%(+6.46)#55 | 13.9%(+6.04)#5,473 |
| 56. | Clear Spring | 19.9% | 13.5%(+6.40)#56 | 13.9%(+5.97)#5,521 |
| 57. | Tolchester | 19.7% | 13.5%(+6.19)#57 | 13.9%(+5.77)#5,693 |
| 58. | Midland | 19.7% | 13.5%(+6.14)#58 | 13.9%(+5.72)#5,736 |
| 59. | Princess Anne | 19.5% | 13.5%(+6.01)#59 | 13.9%(+5.59)#5,842 |
| 60. | Girdletree | 19.4% | 13.5%(+5.89)#60 | 13.9%(+5.47)#5,945 |
| 61. | Spencerville | 19.4% | 13.5%(+5.85)#61 | 13.9%(+5.43)#5,985 |
| 62. | Edgewood | 19.3% | 13.5%(+5.78)#62 | 13.9%(+5.36)#6,061 |
| 63. | White Oak | 19.2% | 13.5%(+5.70)#63 | 13.9%(+5.28)#6,134 |
| 64. | Berlin | 19.1% | 13.5%(+5.63)#64 | 13.9%(+5.21)#6,202 |
| 65. | Honeygo | 19.1% | 13.5%(+5.60)#65 | 13.9%(+5.18)#6,225 |
| 66. | Maugansville | 19.0% | 13.5%(+5.49)#66 | 13.9%(+5.07)#6,345 |
| 67. | Owings Mills | 18.9% | 13.5%(+5.39)#67 | 13.9%(+4.96)#6,457 |
| 68. | Leisure World | 18.9% | 13.5%(+5.34)#68 | 13.9%(+4.92)#6,496 |
| 69. | Peppermill Village | 18.8% | 13.5%(+5.28)#69 | 13.9%(+4.86)#6,552 |
| 70. | Graceham | 18.8% | 13.5%(+5.24)#70 | 13.9%(+4.81)#6,594 |
| 71. | Oakland | 18.7% | 13.5%(+5.22)#71 | 13.9%(+4.80)#6,611 |
| 72. | Cedarville | 18.7% | 13.5%(+5.21)#72 | 13.9%(+4.79)#6,624 |
| 73. | Garrison | 18.6% | 13.5%(+5.07)#73 | 13.9%(+4.65)#6,777 |
| 74. | Rising Sun | 18.5% | 13.5%(+5.01)#74 | 13.9%(+4.59)#6,832 |
| 75. | Bladensburg | 18.5% | 13.5%(+4.95)#75 | 13.9%(+4.53)#6,897 |
| 76. | Pikesville | 18.4% | 13.5%(+4.84)#76 | 13.9%(+4.42)#7,006 |
| 77. | Cumberland | 18.4% | 13.5%(+4.84)#77 | 13.9%(+4.42)#7,013 |
| 78. | Largo | 18.3% | 13.5%(+4.83)#78 | 13.9%(+4.41)#7,021 |
| 79. | South Laurel | 18.3% | 13.5%(+4.80)#79 | 13.9%(+4.38)#7,056 |
| 80. | Dames Quarter | 18.3% | 13.5%(+4.79)#80 | 13.9%(+4.36)#7,071 |
| 81. | Baltimore | 18.3% | 13.5%(+4.75)#81 | 13.9%(+4.33)#7,110 |
| 82. | Bishopville | 18.2% | 13.5%(+4.73)#82 | 13.9%(+4.31)#7,134 |
| 83. | Mardela Springs | 18.2% | 13.5%(+4.67)#83 | 13.9%(+4.25)#7,203 |
| 84. | Spring Ridge | 18.0% | 13.5%(+4.50)#84 | 13.9%(+4.08)#7,430 |
| 85. | Mitchellville | 17.9% | 13.5%(+4.43)#85 | 13.9%(+4.00)#7,520 |
| 86. | Fairplay | 17.9% | 13.5%(+4.37)#86 | 13.9%(+3.95)#7,585 |
| 87. | Hampton | 17.9% | 13.5%(+4.37)#87 | 13.9%(+3.95)#7,588 |
| 88. | Pocomoke City | 17.7% | 13.5%(+4.17)#88 | 13.9%(+3.75)#7,835 |
| 89. | Perry Hall | 17.6% | 13.5%(+4.09)#89 | 13.9%(+3.67)#7,978 |
| 90. | Glenn Dale | 17.6% | 13.5%(+4.04)#90 | 13.9%(+3.61)#8,034 |
| 91. | Lochearn | 17.4% | 13.5%(+3.87)#91 | 13.9%(+3.45)#8,252 |
| 92. | Cabin John | 17.4% | 13.5%(+3.87)#92 | 13.9%(+3.45)#8,253 |
| 93. | Landover | 17.4% | 13.5%(+3.85)#93 | 13.9%(+3.43)#8,270 |
| 94. | Sudlersville | 17.3% | 13.5%(+3.75)#94 | 13.9%(+3.33)#8,417 |
| 95. | Lewistown | 17.0% | 13.5%(+3.49)#95 | 13.9%(+3.07)#8,754 |
| 96. | Accident | 17.0% | 13.5%(+3.48)#96 | 13.9%(+3.05)#8,781 |
| 97. | Joppatowne | 16.9% | 13.5%(+3.40)#97 | 13.9%(+2.98)#8,867 |
| 98. | Romancoke | 16.9% | 13.5%(+3.36)#98 | 13.9%(+2.94)#8,924 |
| 99. | Dunkirk | 16.8% | 13.5%(+3.32)#99 | 13.9%(+2.90)#8,970 |
| 100. | Manchester | 16.8% | 13.5%(+3.28)#100 | 13.9%(+2.86)#9,021 |
Common Questions
What are the Top 10 Cities with the Highest Percentage of Population Employed in Health Care & Social Assistance in Maryland?
Top 10 Cities with the Highest Percentage of Population Employed in Health Care & Social Assistance in Maryland are:
#1
100.0%
#2
65.2%
#3
65.0%
#4
55.6%
#5
51.7%
#6
46.4%
#7
46.4%
#8
34.5%
#9
34.5%
#10
32.4%
What city has the Highest Percentage of Population Employed in Health Care & Social Assistance in Maryland?
Allen has the Highest Percentage of Population Employed in Health Care & Social Assistance in Maryland with 100.0%.
What is the Percentage of Population Employed in Health Care & Social Assistance in the State of Maryland?
Percentage of Population Employed in Health Care & Social Assistance in Maryland is 13.5%.
What is the Percentage of Population Employed in Health Care & Social Assistance in the United States?
Percentage of Population Employed in Health Care & Social Assistance in the United States is 13.9%.