Midlothian, MD Map & Demographics
Midlothian Map
Midlothian Overview
$31,658
PER CAPITA INCOME
$73,594
AVG FAMILY INCOME
$38,333
AVG HOUSEHOLD INCOME
0.34
INEQUALITY / GINI INDEX
313
TOTAL POPULATION
143
MALE POPULATION
170
FEMALE POPULATION
84.12
MALES / 100 FEMALES
118.88
FEMALES / 100 MALES
47.8
MEDIAN AGE
3.2
AVG FAMILY SIZE
2.1
AVG HOUSEHOLD SIZE
186
LABOR FORCE [ PEOPLE ]
69.7%
PERCENT IN LABOR FORCE
40.9%
UNEMPLOYMENT RATE
Midlothian Zip Codes
Midlothian Area Codes
Income in Midlothian
Income Overview in Midlothian
Per Capita Income in Midlothian is $31,658, while median incomes of families and households are $73,594 and $38,333 respectively.
| Characteristic | Number | Measure |
| Per Capita Income | 313 | $31,658 |
| Median Family Income | 69 | $73,594 |
| Mean Family Income | 69 | $84,451 |
| Median Household Income | 152 | $38,333 |
| Mean Household Income | 152 | $65,312 |
| Income Deficit | 69 | $0 |
| Wage / Income Gap (%) | 313 | 0.00% |
| Wage / Income Gap ($) | 313 | 100.00¢ per $1 |
| Gini / Inequality Index | 313 | 0.34 |
Earnings by Sex in Midlothian
| Sex | Number | Average Earnings |
| Male | 59 (31.7%) | $0 |
| Female | 127 (68.3%) | $0 |
| Total | 186 (100.0%) | $0 |
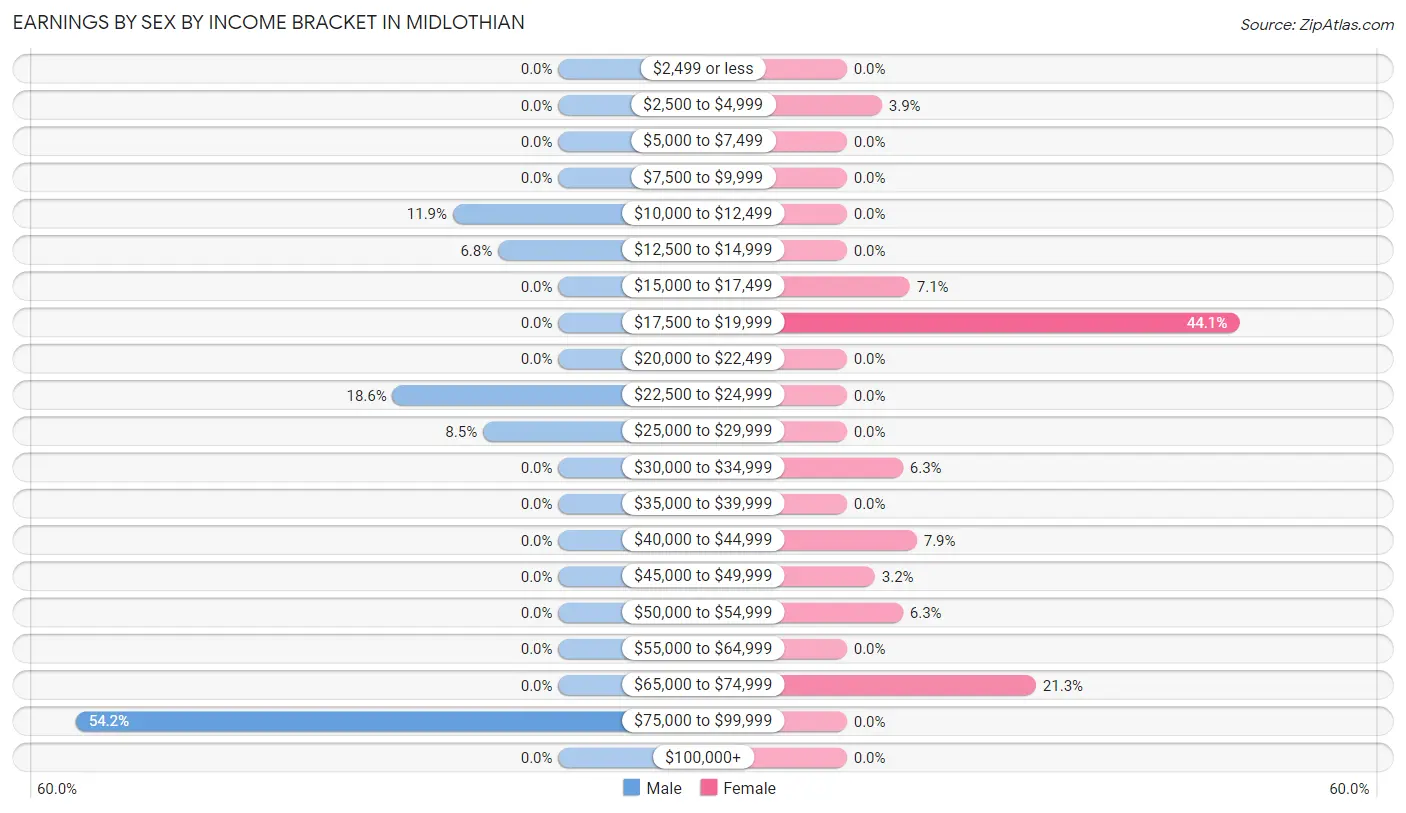
Earnings by Sex by Income Bracket in Midlothian
The most common earnings brackets in Midlothian are $75,000 to $99,999 for men (32 | 54.2%) and $17,500 to $19,999 for women (56 | 44.1%).
| Income | Male | Female |
| $2,499 or less | 0 (0.0%) | 0 (0.0%) |
| $2,500 to $4,999 | 0 (0.0%) | 5 (3.9%) |
| $5,000 to $7,499 | 0 (0.0%) | 0 (0.0%) |
| $7,500 to $9,999 | 0 (0.0%) | 0 (0.0%) |
| $10,000 to $12,499 | 7 (11.9%) | 0 (0.0%) |
| $12,500 to $14,999 | 4 (6.8%) | 0 (0.0%) |
| $15,000 to $17,499 | 0 (0.0%) | 9 (7.1%) |
| $17,500 to $19,999 | 0 (0.0%) | 56 (44.1%) |
| $20,000 to $22,499 | 0 (0.0%) | 0 (0.0%) |
| $22,500 to $24,999 | 11 (18.6%) | 0 (0.0%) |
| $25,000 to $29,999 | 5 (8.5%) | 0 (0.0%) |
| $30,000 to $34,999 | 0 (0.0%) | 8 (6.3%) |
| $35,000 to $39,999 | 0 (0.0%) | 0 (0.0%) |
| $40,000 to $44,999 | 0 (0.0%) | 10 (7.9%) |
| $45,000 to $49,999 | 0 (0.0%) | 4 (3.2%) |
| $50,000 to $54,999 | 0 (0.0%) | 8 (6.3%) |
| $55,000 to $64,999 | 0 (0.0%) | 0 (0.0%) |
| $65,000 to $74,999 | 0 (0.0%) | 27 (21.3%) |
| $75,000 to $99,999 | 32 (54.2%) | 0 (0.0%) |
| $100,000+ | 0 (0.0%) | 0 (0.0%) |
| Total | 59 (100.0%) | 127 (100.0%) |
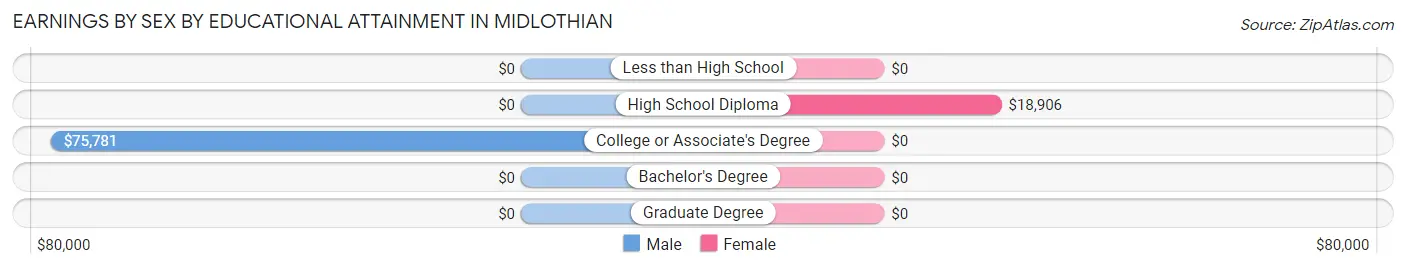
Earnings by Sex by Educational Attainment in Midlothian
| Educational Attainment | Male Income | Female Income |
| Less than High School | - | - |
| High School Diploma | - | - |
| College or Associate's Degree | $75,781 | $0 |
| Bachelor's Degree | - | - |
| Graduate Degree | - | - |
| Total | $76,875 | $0 |
Family Income in Midlothian
Family Income Brackets in Midlothian
According to the Midlothian family income data, there are 18 families falling into the $150,000 to $199,999 income range, which is the most common income bracket and makes up 26.1% of all families.
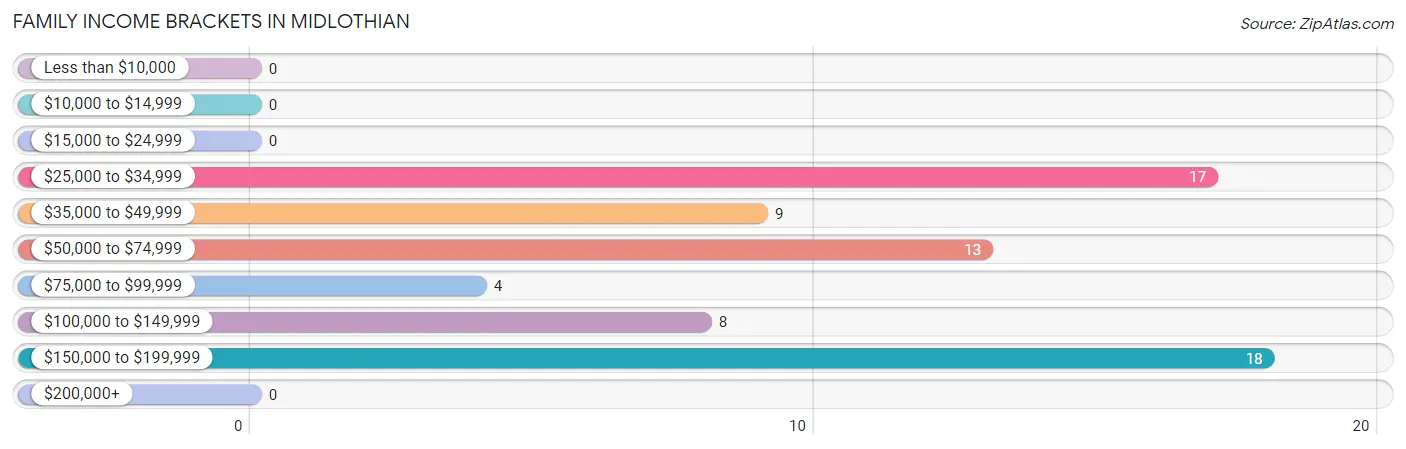
| Income Bracket | # Families | % Families |
| Less than $10,000 | 0 | 0.0% |
| $10,000 to $14,999 | 0 | 0.0% |
| $15,000 to $24,999 | 0 | 0.0% |
| $25,000 to $34,999 | 17 | 24.6% |
| $35,000 to $49,999 | 9 | 13.0% |
| $50,000 to $74,999 | 13 | 18.8% |
| $75,000 to $99,999 | 4 | 5.8% |
| $100,000 to $149,999 | 8 | 11.6% |
| $150,000 to $199,999 | 18 | 26.1% |
| $200,000+ | 0 | 0.0% |
Family Income by Famaliy Size in Midlothian
2-person families (38 | 55.1%) account for the highest median family income in Midlothian with $56,000 per family, while 2-person families (38 | 55.1%) have the highest median income of $28,000 per family member.
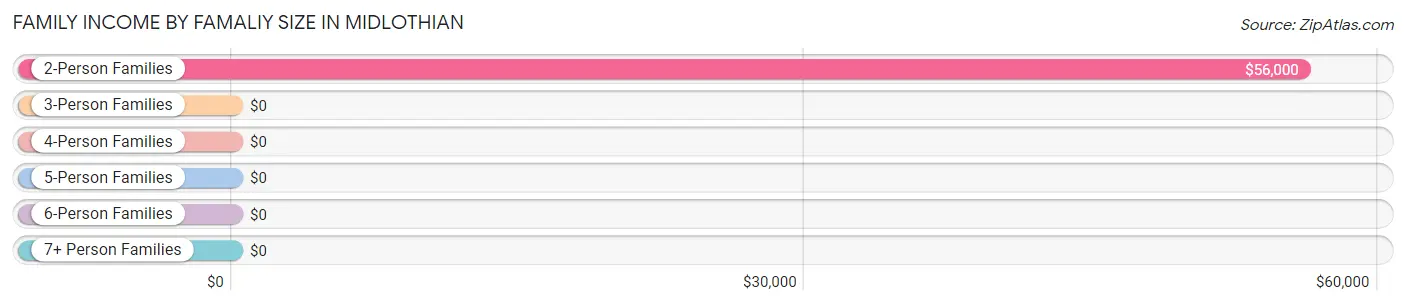
| Income Bracket | # Families | Median Income |
| 2-Person Families | 38 (55.1%) | $56,000 |
| 3-Person Families | 4 (5.8%) | $0 |
| 4-Person Families | 27 (39.1%) | $0 |
| 5-Person Families | 0 (0.0%) | $0 |
| 6-Person Families | 0 (0.0%) | $0 |
| 7+ Person Families | 0 (0.0%) | $0 |
| Total | 69 (100.0%) | $73,594 |
Family Income by Number of Earners in Midlothian
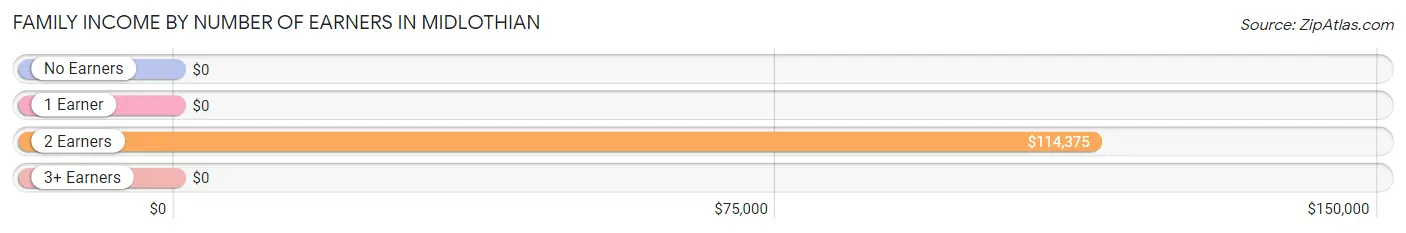
| Number of Earners | # Families | Median Income |
| No Earners | 17 (24.6%) | $0 |
| 1 Earner | 8 (11.6%) | $0 |
| 2 Earners | 40 (58.0%) | $114,375 |
| 3+ Earners | 4 (5.8%) | $0 |
| Total | 69 (100.0%) | $73,594 |
Household Income in Midlothian
Household Income Brackets in Midlothian
With 80 households falling in the category, the $35,000 to $49,999 income range is the most frequent in Midlothian, accounting for 52.6% of all households.
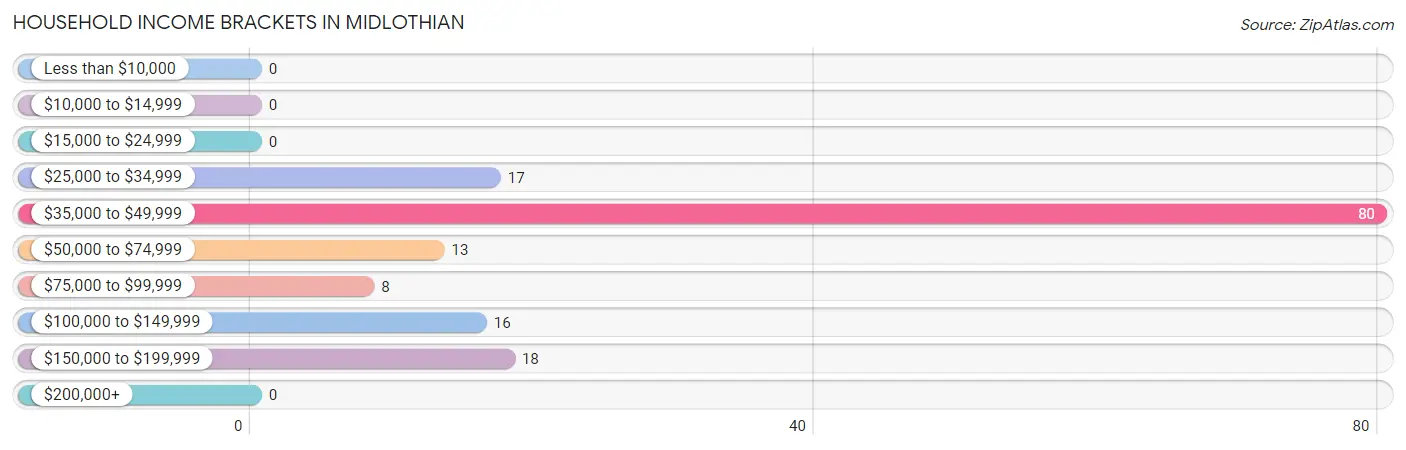
| Income Bracket | # Households | % Households |
| Less than $10,000 | 0 | 0.0% |
| $10,000 to $14,999 | 0 | 0.0% |
| $15,000 to $24,999 | 0 | 0.0% |
| $25,000 to $34,999 | 17 | 11.2% |
| $35,000 to $49,999 | 80 | 52.6% |
| $50,000 to $74,999 | 13 | 8.6% |
| $75,000 to $99,999 | 8 | 5.3% |
| $100,000 to $149,999 | 16 | 10.5% |
| $150,000 to $199,999 | 18 | 11.8% |
| $200,000+ | 0 | 0.0% |
Household Income by Householder Age in Midlothian
The median household income in Midlothian is $38,333, with the highest median household income of $142,188 found in the 45 to 64 years age bracket for the primary householder. A total of 38 households (25.0%) fall into this category.
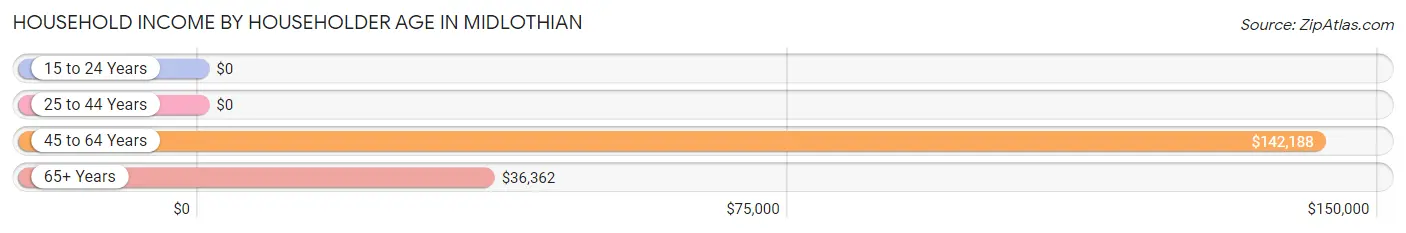
| Income Bracket | # Households | Median Income |
| 15 to 24 Years | 0 (0.0%) | $0 |
| 25 to 44 Years | 19 (12.5%) | $0 |
| 45 to 64 Years | 38 (25.0%) | $142,188 |
| 65+ Years | 95 (62.5%) | $36,362 |
| Total | 152 (100.0%) | $38,333 |
Poverty in Midlothian
Income Below Poverty by Sex and Age in Midlothian

| Age Bracket | Male | Female |
| Under 5 Years | 0 (0.0%) | 0 (0.0%) |
| 5 Years | 0 (0.0%) | 0 (0.0%) |
| 6 to 11 Years | 0 (0.0%) | 0 (0.0%) |
| 12 to 14 Years | 0 (0.0%) | 0 (0.0%) |
| 15 Years | 0 (0.0%) | 0 (0.0%) |
| 16 and 17 Years | 0 (0.0%) | 0 (0.0%) |
| 18 to 24 Years | 0 (0.0%) | 0 (0.0%) |
| 25 to 34 Years | 0 (0.0%) | 0 (0.0%) |
| 35 to 44 Years | 0 (0.0%) | 0 (0.0%) |
| 45 to 54 Years | 0 (0.0%) | 0 (0.0%) |
| 55 to 64 Years | 0 (0.0%) | 0 (0.0%) |
| 65 to 74 Years | 0 (0.0%) | 0 (0.0%) |
| 75 Years and over | 0 (0.0%) | 0 (0.0%) |
| Total | 0 (0.0%) | 0 (0.0%) |
Income Above Poverty by Sex and Age in Midlothian
According to the poverty statistics in Midlothian, males aged 6 to 11 years and females aged 12 to 14 years are the age groups that are most secure financially, with 100.0% of males and 100.0% of females in these age groups living above the poverty line.
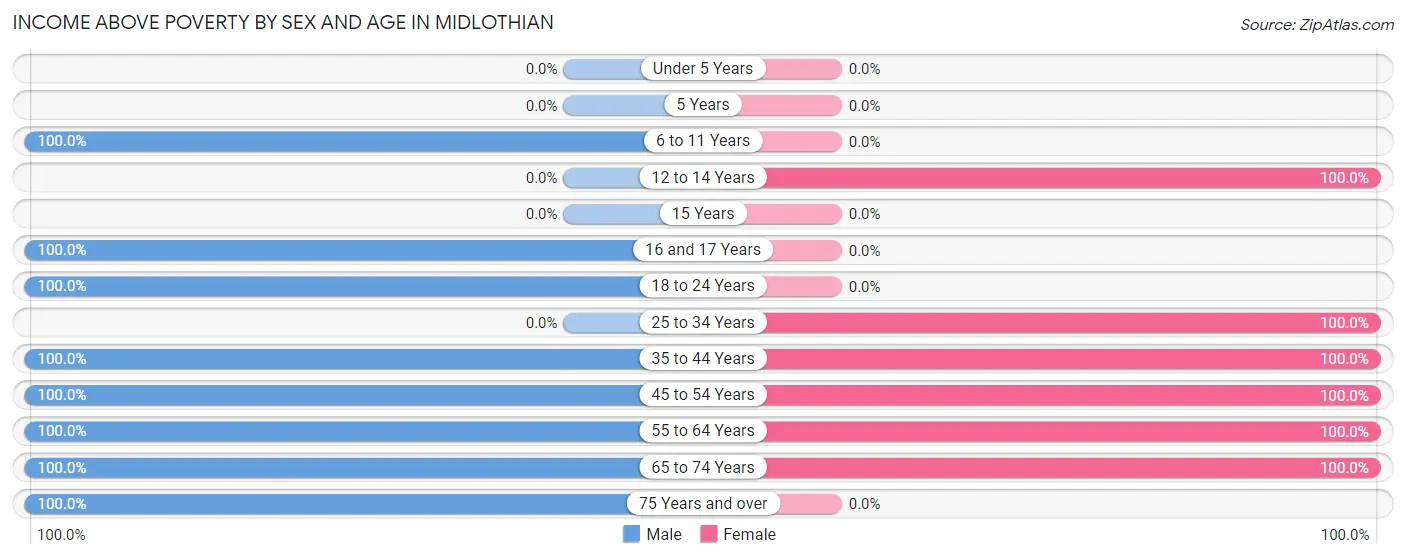
| Age Bracket | Male | Female |
| Under 5 Years | 0 (0.0%) | 0 (0.0%) |
| 5 Years | 0 (0.0%) | 0 (0.0%) |
| 6 to 11 Years | 27 (100.0%) | 0 (0.0%) |
| 12 to 14 Years | 0 (0.0%) | 19 (100.0%) |
| 15 Years | 0 (0.0%) | 0 (0.0%) |
| 16 and 17 Years | 29 (100.0%) | 0 (0.0%) |
| 18 to 24 Years | 16 (100.0%) | 0 (0.0%) |
| 25 to 34 Years | 0 (0.0%) | 19 (100.0%) |
| 35 to 44 Years | 11 (100.0%) | 9 (100.0%) |
| 45 to 54 Years | 29 (100.0%) | 22 (100.0%) |
| 55 to 64 Years | 8 (100.0%) | 16 (100.0%) |
| 65 to 74 Years | 16 (100.0%) | 85 (100.0%) |
| 75 Years and over | 7 (100.0%) | 0 (0.0%) |
| Total | 143 (100.0%) | 170 (100.0%) |
Income Below Poverty Among Married-Couple Families in Midlothian
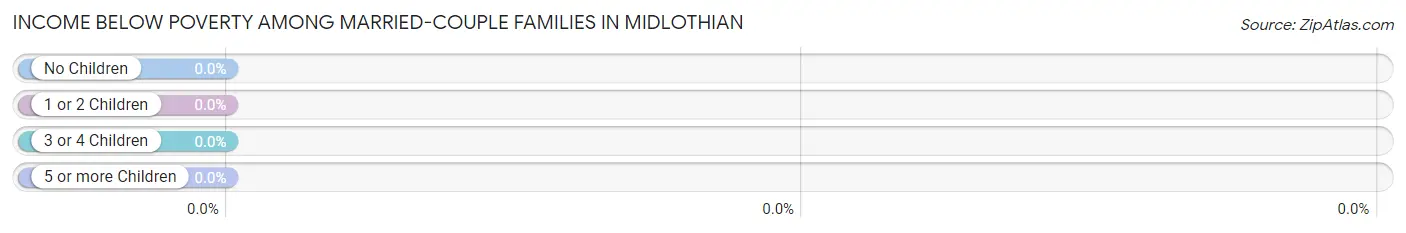
| Children | Above Poverty | Below Poverty |
| No Children | 32 (100.0%) | 0 (0.0%) |
| 1 or 2 Children | 27 (100.0%) | 0 (0.0%) |
| 3 or 4 Children | 0 (0.0%) | 0 (0.0%) |
| 5 or more Children | 0 (0.0%) | 0 (0.0%) |
| Total | 59 (100.0%) | 0 (0.0%) |
Income Below Poverty Among Single-Parent Households in Midlothian
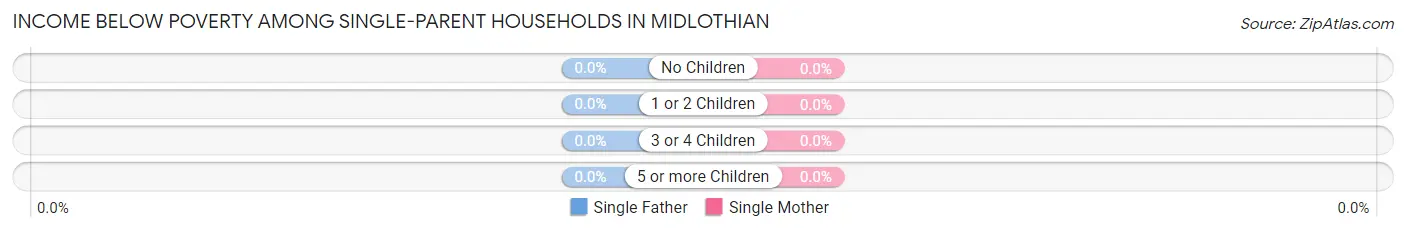
| Children | Single Father | Single Mother |
| No Children | 0 (0.0%) | 0 (0.0%) |
| 1 or 2 Children | 0 (0.0%) | 0 (0.0%) |
| 3 or 4 Children | 0 (0.0%) | 0 (0.0%) |
| 5 or more Children | 0 (0.0%) | 0 (0.0%) |
| Total | 0 (0.0%) | 0 (0.0%) |
Income Below Poverty Among Married-Couple vs Single-Parent Households in Midlothian
| Children | Married-Couple Families | Single-Parent Households |
| No Children | 0 (0.0%) | 0 (0.0%) |
| 1 or 2 Children | 0 (0.0%) | 0 (0.0%) |
| 3 or 4 Children | 0 (0.0%) | 0 (0.0%) |
| 5 or more Children | 0 (0.0%) | 0 (0.0%) |
| Total | 0 (0.0%) | 0 (0.0%) |
Race in Midlothian
The most populous races in Midlothian are White / Caucasian (304 | 97.1%), and Black / African American (9 | 2.9%).
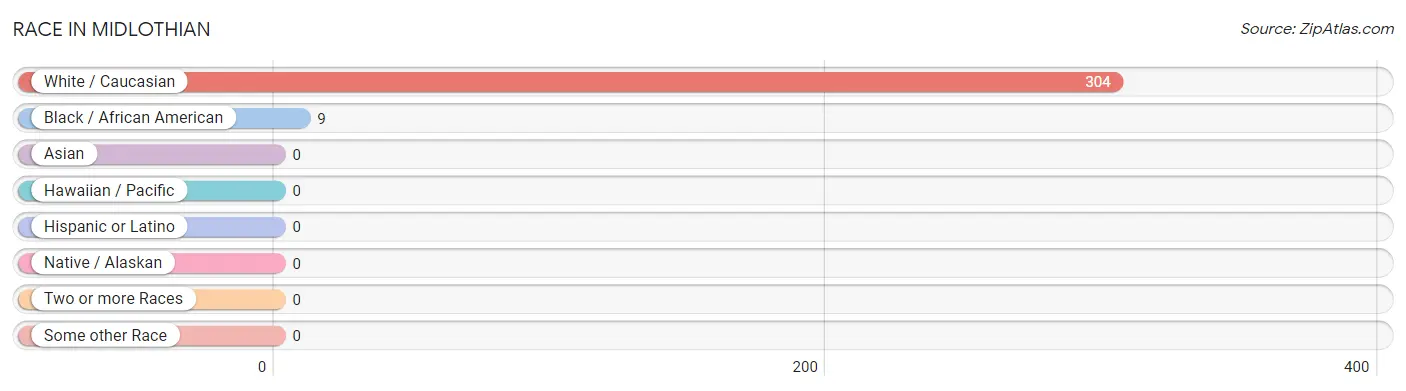
| Race | # Population | % Population |
| Asian | 0 | 0.0% |
| Black / African American | 9 | 2.9% |
| Hawaiian / Pacific | 0 | 0.0% |
| Hispanic or Latino | 0 | 0.0% |
| Native / Alaskan | 0 | 0.0% |
| White / Caucasian | 304 | 97.1% |
| Two or more Races | 0 | 0.0% |
| Some other Race | 0 | 0.0% |
| Total | 313 | 100.0% |
Ancestry in Midlothian
The most populous ancestries reported in Midlothian are Polish (82 | 26.2%), Pennsylvania German (56 | 17.9%), Irish (51 | 16.3%), German (48 | 15.3%), and English (47 | 15.0%), together accounting for 90.7% of all Midlothian residents.
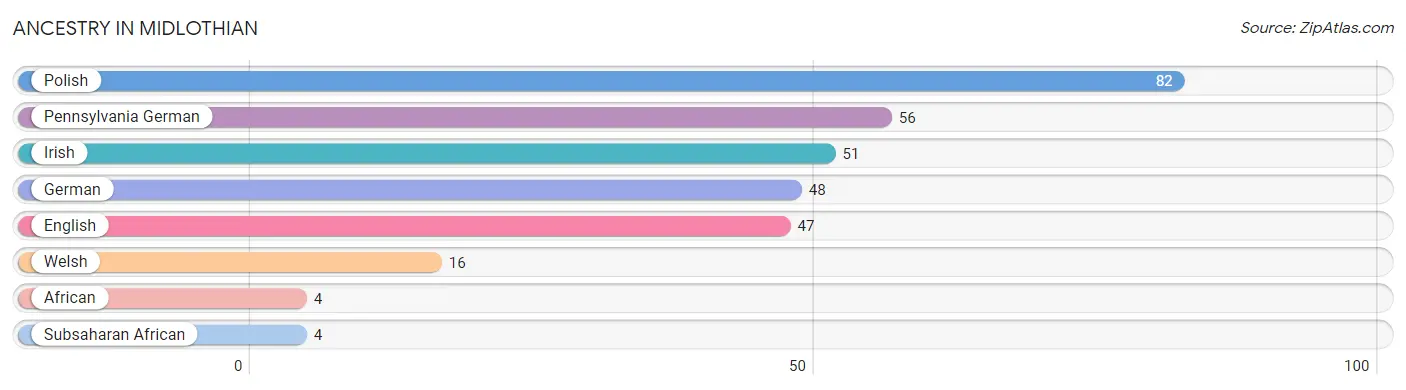
| Ancestry | # Population | % Population |
| African | 4 | 1.3% |
| English | 47 | 15.0% |
| German | 48 | 15.3% |
| Irish | 51 | 16.3% |
| Pennsylvania German | 56 | 17.9% |
| Polish | 82 | 26.2% |
| Subsaharan African | 4 | 1.3% |
| Welsh | 16 | 5.1% | View All 8 Rows |
Immigrants in Midlothian
The most numerous immigrant groups reported in Midlothian came from Africa (5 | 1.6%), Liberia (5 | 1.6%), and Western Africa (5 | 1.6%), together accounting for 4.8% of all Midlothian residents.
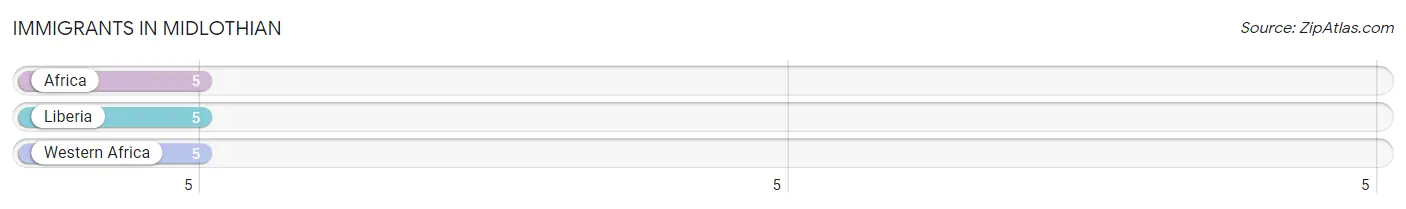
| Immigration Origin | # Population | % Population |
| Africa | 5 | 1.6% |
| Liberia | 5 | 1.6% |
| Western Africa | 5 | 1.6% | View All 3 Rows |
Sex and Age in Midlothian
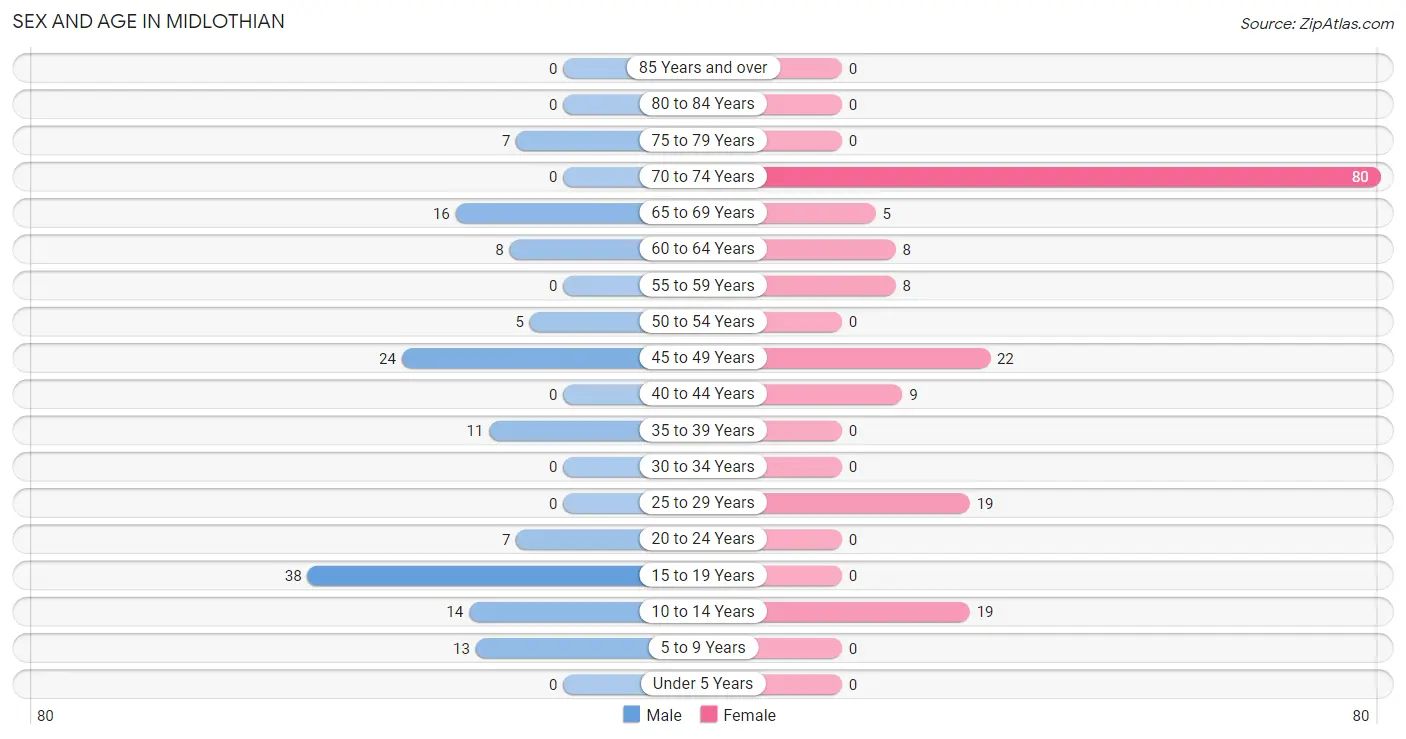
Sex and Age in Midlothian
The most populous age groups in Midlothian are 15 to 19 Years (38 | 26.6%) for men and 70 to 74 Years (80 | 47.1%) for women.
| Age Bracket | Male | Female |
| Under 5 Years | 0 (0.0%) | 0 (0.0%) |
| 5 to 9 Years | 13 (9.1%) | 0 (0.0%) |
| 10 to 14 Years | 14 (9.8%) | 19 (11.2%) |
| 15 to 19 Years | 38 (26.6%) | 0 (0.0%) |
| 20 to 24 Years | 7 (4.9%) | 0 (0.0%) |
| 25 to 29 Years | 0 (0.0%) | 19 (11.2%) |
| 30 to 34 Years | 0 (0.0%) | 0 (0.0%) |
| 35 to 39 Years | 11 (7.7%) | 0 (0.0%) |
| 40 to 44 Years | 0 (0.0%) | 9 (5.3%) |
| 45 to 49 Years | 24 (16.8%) | 22 (12.9%) |
| 50 to 54 Years | 5 (3.5%) | 0 (0.0%) |
| 55 to 59 Years | 0 (0.0%) | 8 (4.7%) |
| 60 to 64 Years | 8 (5.6%) | 8 (4.7%) |
| 65 to 69 Years | 16 (11.2%) | 5 (2.9%) |
| 70 to 74 Years | 0 (0.0%) | 80 (47.1%) |
| 75 to 79 Years | 7 (4.9%) | 0 (0.0%) |
| 80 to 84 Years | 0 (0.0%) | 0 (0.0%) |
| 85 Years and over | 0 (0.0%) | 0 (0.0%) |
| Total | 143 (100.0%) | 170 (100.0%) |
Families and Households in Midlothian
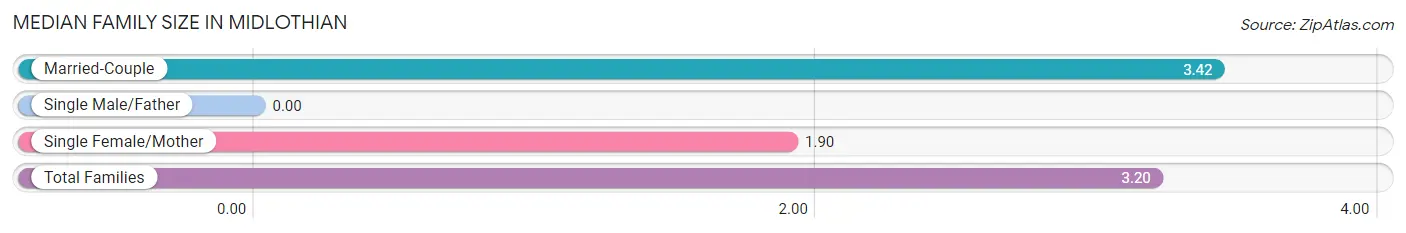
Median Family Size in Midlothian
| Family Type | # Families | Family Size |
| Married-Couple | 59 (85.5%) | 3.42 |
| Single Male/Father | 0 (0.0%) | - |
| Single Female/Mother | 10 (14.5%) | 1.90 |
| Total Families | 69 (100.0%) | 3.20 |
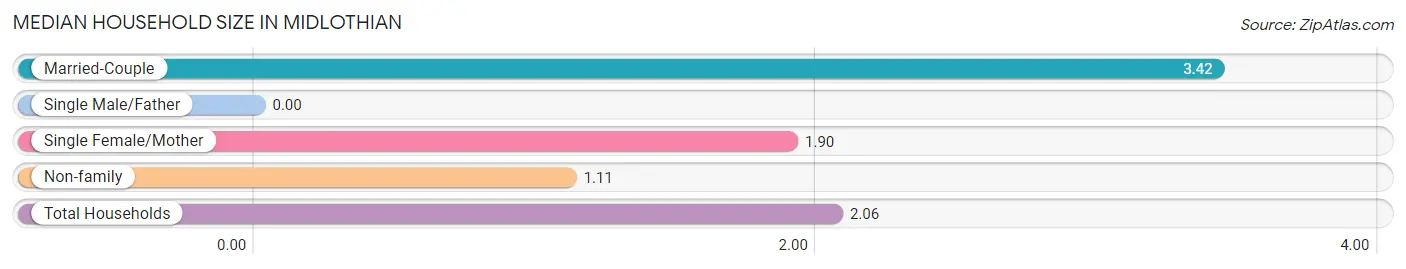
Median Household Size in Midlothian
| Household Type | # Households | Household Size |
| Married-Couple | 59 (38.8%) | 3.42 |
| Single Male/Father | 0 (0.0%) | - |
| Single Female/Mother | 10 (6.6%) | 1.90 |
| Non-family | 83 (54.6%) | 1.11 |
| Total Households | 152 (100.0%) | 2.06 |
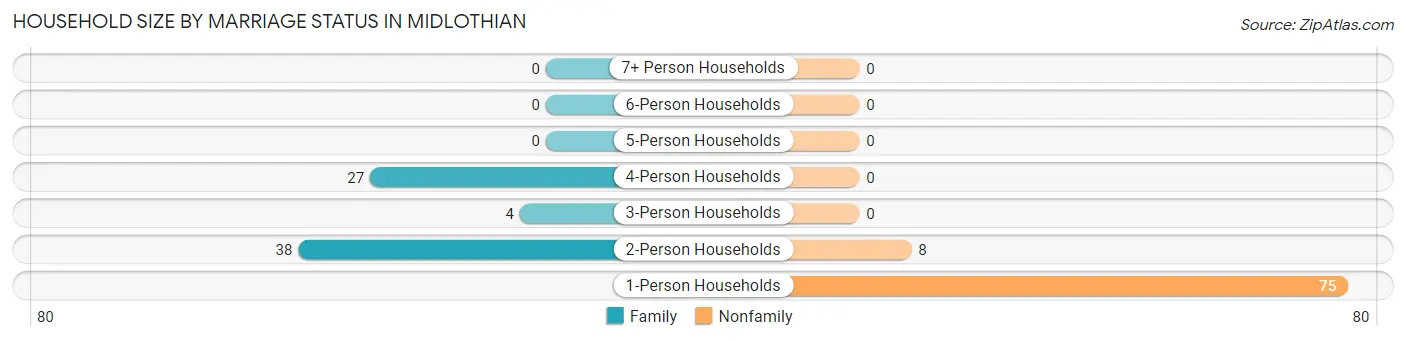
Household Size by Marriage Status in Midlothian
Out of a total of 152 households in Midlothian, 69 (45.4%) are family households, while 83 (54.6%) are nonfamily households. The most numerous type of family households are 2-person households, comprising 38, and the most common type of nonfamily households are 1-person households, comprising 75.
| Household Size | Family Households | Nonfamily Households |
| 1-Person Households | - | 75 (49.3%) |
| 2-Person Households | 38 (25.0%) | 8 (5.3%) |
| 3-Person Households | 4 (2.6%) | 0 (0.0%) |
| 4-Person Households | 27 (17.8%) | 0 (0.0%) |
| 5-Person Households | 0 (0.0%) | 0 (0.0%) |
| 6-Person Households | 0 (0.0%) | 0 (0.0%) |
| 7+ Person Households | 0 (0.0%) | 0 (0.0%) |
| Total | 69 (45.4%) | 83 (54.6%) |
Female Fertility in Midlothian
Fertility by Age in Midlothian
| Age Bracket | Women with Births | Births / 1,000 Women |
| 15 to 19 years | 0 (0.0%) | 0.0 |
| 20 to 34 years | 0 (0.0%) | 0.0 |
| 35 to 50 years | 0 (0.0%) | 0.0 |
| Total | 0 (0.0%) | 0.0 |
Fertility by Age by Marriage Status in Midlothian
| Age Bracket | Married | Unmarried |
| 15 to 19 years | 0 (0.0%) | 0 (0.0%) |
| 20 to 34 years | 0 (0.0%) | 0 (0.0%) |
| 35 to 50 years | 0 (0.0%) | 0 (0.0%) |
| Total | 0 (0.0%) | 0 (0.0%) |
Fertility by Education in Midlothian
| Educational Attainment | Women with Births | Births / 1,000 Women |
| Less than High School | 0 (0.0%) | 0.0 |
| High School Diploma | 0 (0.0%) | 0.0 |
| College or Associate's Degree | 0 (0.0%) | 0.0 |
| Bachelor's Degree | 0 (0.0%) | 0.0 |
| Graduate Degree | 0 (0.0%) | 0.0 |
| Total | 0 (0.0%) | 0.0 |
Fertility by Education by Marriage Status in Midlothian
| Educational Attainment | Married | Unmarried |
| Less than High School | 0 (0.0%) | 0 (0.0%) |
| High School Diploma | 0 (0.0%) | 0 (0.0%) |
| College or Associate's Degree | 0 (0.0%) | 0 (0.0%) |
| Bachelor's Degree | 0 (0.0%) | 0 (0.0%) |
| Graduate Degree | 0 (0.0%) | 0 (0.0%) |
| Total | 0 (0.0%) | 0 (0.0%) |
Employment Characteristics in Midlothian
Employment by Class of Employer in Midlothian
Among the 110 employed individuals in Midlothian, private company employees (52 | 47.3%), local government employees (42 | 38.2%), and not-for-profit organizations (16 | 14.5%) make up the most common classes of employment.
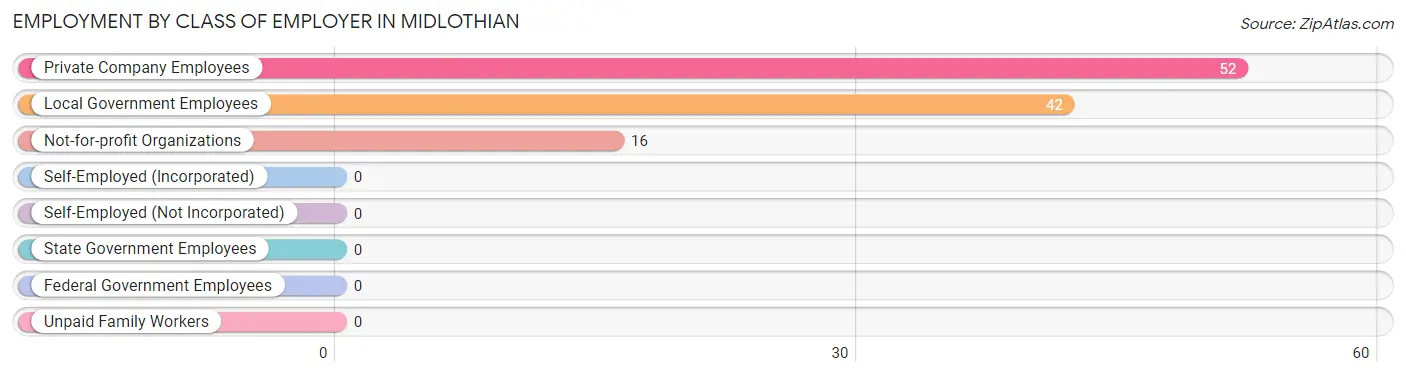
| Employer Class | # Employees | % Employees |
| Private Company Employees | 52 | 47.3% |
| Self-Employed (Incorporated) | 0 | 0.0% |
| Self-Employed (Not Incorporated) | 0 | 0.0% |
| Not-for-profit Organizations | 16 | 14.5% |
| Local Government Employees | 42 | 38.2% |
| State Government Employees | 0 | 0.0% |
| Federal Government Employees | 0 | 0.0% |
| Unpaid Family Workers | 0 | 0.0% |
| Total | 110 | 100.0% |
Employment Status by Age in Midlothian
According to the labor force statistics for Midlothian, out of the total population over 16 years of age (267), 69.7% or 186 individuals are in the labor force, with 40.9% or 76 of them unemployed. The age group with the highest labor force participation rate is 20 to 24 years, with 100.0% or 7 individuals in the labor force. Within the labor force, the 35 to 44 years age range has the highest percentage of unemployed individuals, with 100.0% or 20 of them being unemployed.
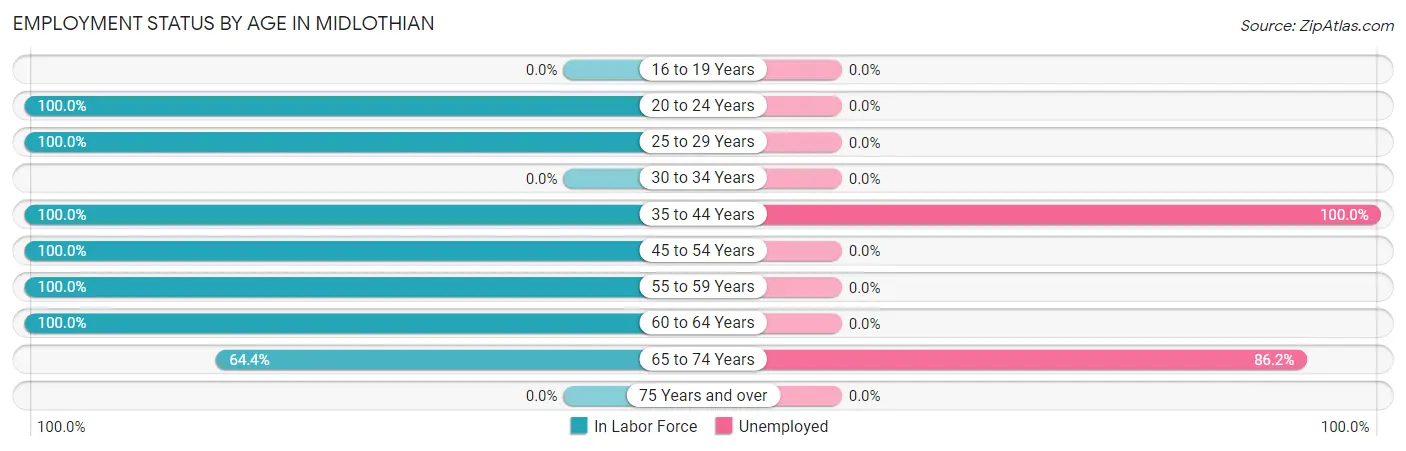
| Age Bracket | In Labor Force | Unemployed |
| 16 to 19 Years | 0 (0.0%) | 0 (0.0%) |
| 20 to 24 Years | 7 (100.0%) | 0 (0.0%) |
| 25 to 29 Years | 19 (100.0%) | 0 (0.0%) |
| 30 to 34 Years | 0 (0.0%) | 0 (0.0%) |
| 35 to 44 Years | 20 (100.0%) | 20 (100.0%) |
| 45 to 54 Years | 51 (100.0%) | 0 (0.0%) |
| 55 to 59 Years | 8 (100.0%) | 0 (0.0%) |
| 60 to 64 Years | 16 (100.0%) | 0 (0.0%) |
| 65 to 74 Years | 65 (64.4%) | 56 (86.2%) |
| 75 Years and over | 0 (0.0%) | 0 (0.0%) |
| Total | 186 (69.7%) | 76 (40.9%) |
Employment Status by Educational Attainment in Midlothian
According to labor force statistics for Midlothian, 100.0% of individuals (114) out of the total population between 25 and 64 years of age (114) are in the labor force, with 17.5% or 20 of them being unemployed. The group with the highest labor force participation rate are those with the educational attainment of high school diploma, with 100.0% or 17 individuals in the labor force. Within the labor force, individuals with college / associate degree education have the highest percentage of unemployment, with 37.7% or 20 of them being unemployed.
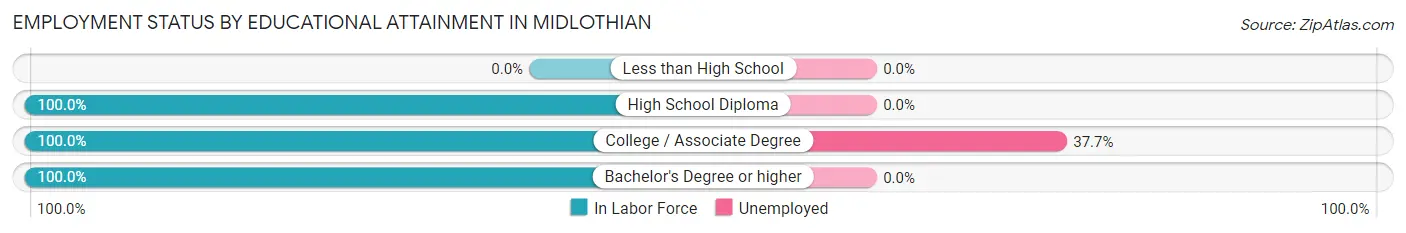
| Educational Attainment | In Labor Force | Unemployed |
| Less than High School | 0 (0.0%) | 0 (0.0%) |
| High School Diploma | 17 (100.0%) | 0 (0.0%) |
| College / Associate Degree | 53 (100.0%) | 20 (37.7%) |
| Bachelor's Degree or higher | 44 (100.0%) | 0 (0.0%) |
| Total | 114 (100.0%) | 20 (17.5%) |
Employment Occupations by Sex in Midlothian
Management, Business, Science and Arts Occupations
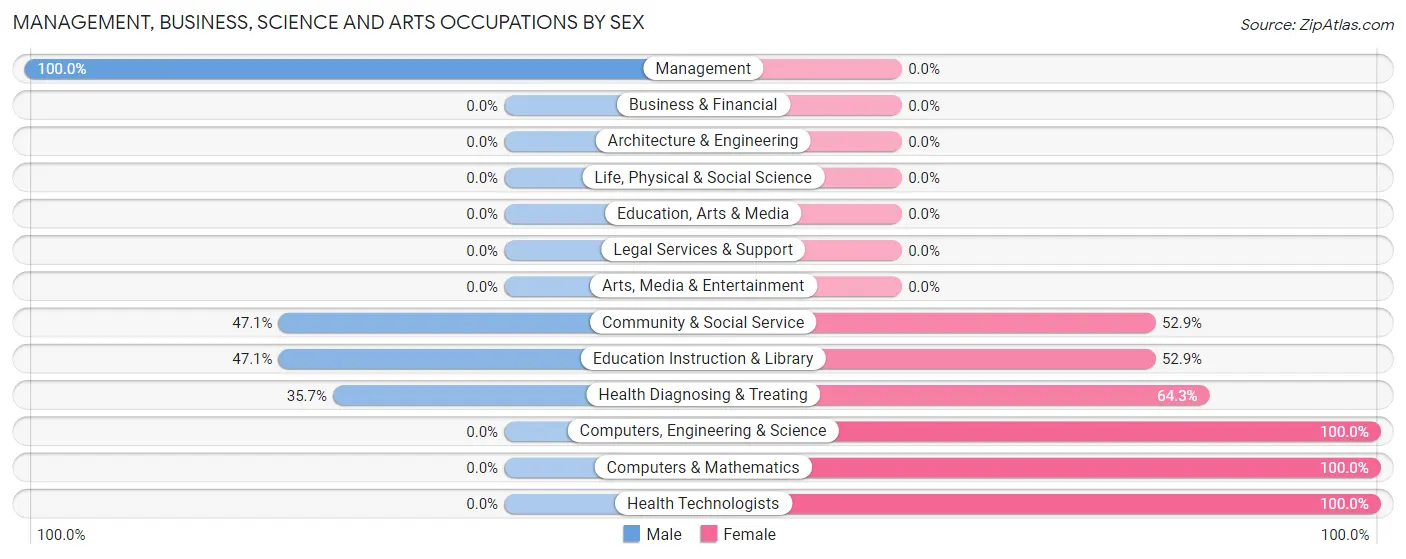
The most common Management, Business, Science and Arts occupations in Midlothian are Community & Social Service (34 | 30.9%), Education Instruction & Library (34 | 30.9%), Health Diagnosing & Treating (14 | 12.7%), Computers, Engineering & Science (10 | 9.1%), and Computers & Mathematics (10 | 9.1%).
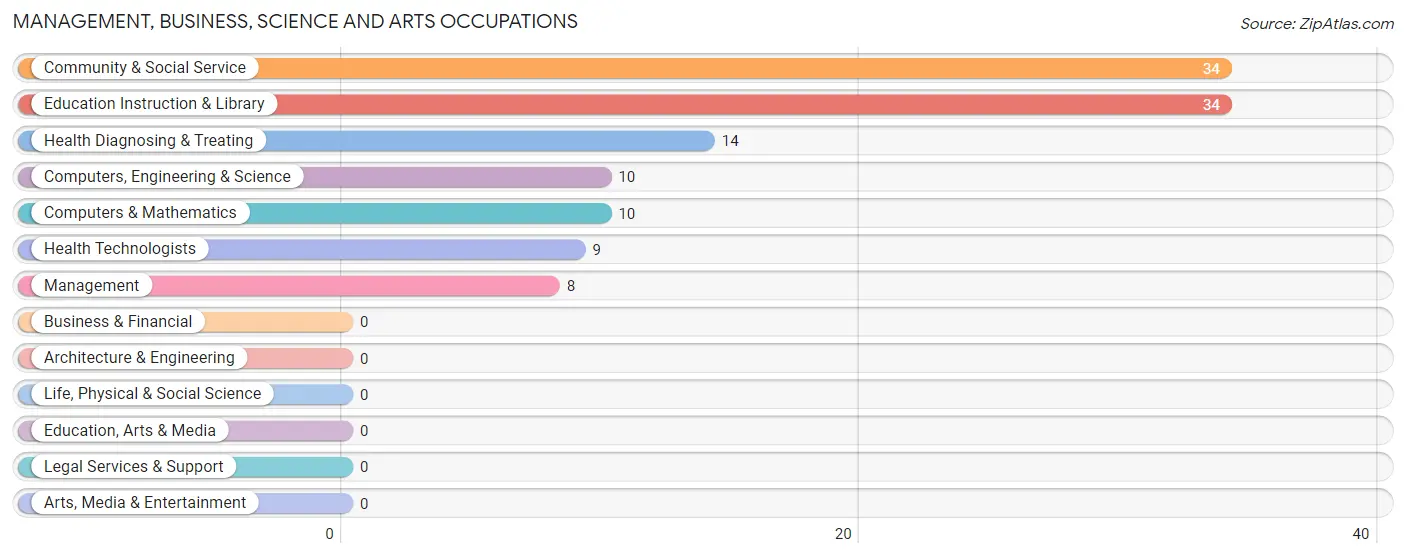
Management, Business, Science and Arts Occupations by Sex
Within the Management, Business, Science and Arts occupations in Midlothian, the most male-oriented occupations are Management (100.0%), Community & Social Service (47.1%), and Education Instruction & Library (47.1%), while the most female-oriented occupations are Computers, Engineering & Science (100.0%), Computers & Mathematics (100.0%), and Health Technologists (100.0%).
| Occupation | Male | Female |
| Management | 8 (100.0%) | 0 (0.0%) |
| Business & Financial | 0 (0.0%) | 0 (0.0%) |
| Computers, Engineering & Science | 0 (0.0%) | 10 (100.0%) |
| Computers & Mathematics | 0 (0.0%) | 10 (100.0%) |
| Architecture & Engineering | 0 (0.0%) | 0 (0.0%) |
| Life, Physical & Social Science | 0 (0.0%) | 0 (0.0%) |
| Community & Social Service | 16 (47.1%) | 18 (52.9%) |
| Education, Arts & Media | 0 (0.0%) | 0 (0.0%) |
| Legal Services & Support | 0 (0.0%) | 0 (0.0%) |
| Education Instruction & Library | 16 (47.1%) | 18 (52.9%) |
| Arts, Media & Entertainment | 0 (0.0%) | 0 (0.0%) |
| Health Diagnosing & Treating | 5 (35.7%) | 9 (64.3%) |
| Health Technologists | 0 (0.0%) | 9 (100.0%) |
| Total (Category) | 29 (43.9%) | 37 (56.1%) |
| Total (Overall) | 48 (43.6%) | 62 (56.4%) |
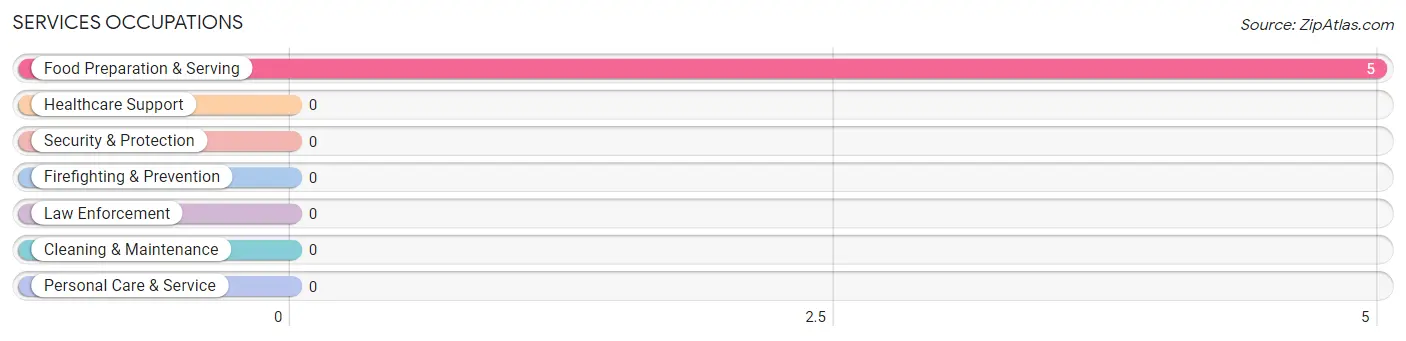
Services Occupations
The most common Services occupations in Midlothian are , and Food Preparation & Serving (5 | 4.5%).
Services Occupations by Sex
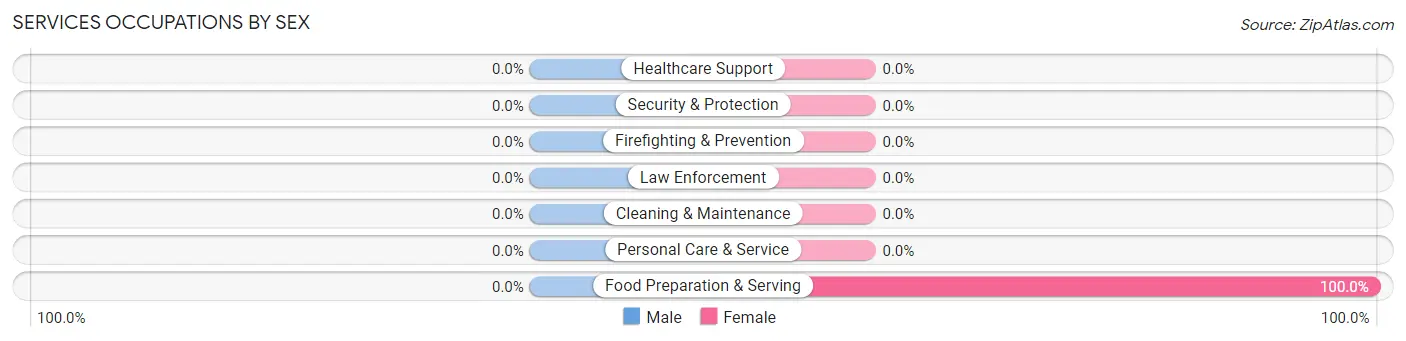
| Occupation | Male | Female |
| Healthcare Support | 0 (0.0%) | 0 (0.0%) |
| Security & Protection | 0 (0.0%) | 0 (0.0%) |
| Firefighting & Prevention | 0 (0.0%) | 0 (0.0%) |
| Law Enforcement | 0 (0.0%) | 0 (0.0%) |
| Food Preparation & Serving | 0 (0.0%) | 5 (100.0%) |
| Cleaning & Maintenance | 0 (0.0%) | 0 (0.0%) |
| Personal Care & Service | 0 (0.0%) | 0 (0.0%) |
| Total (Category) | 0 (0.0%) | 5 (100.0%) |
| Total (Overall) | 48 (43.6%) | 62 (56.4%) |
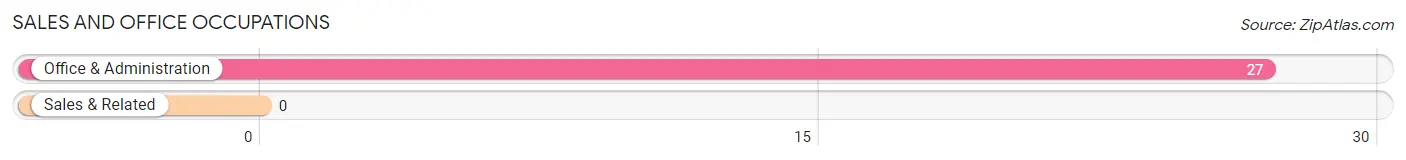
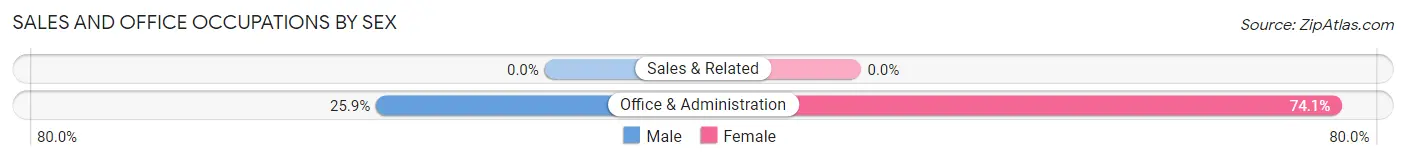
Sales and Office Occupations
The most common Sales and Office occupations in Midlothian are , and Office & Administration (27 | 24.5%).
Sales and Office Occupations by Sex
| Occupation | Male | Female |
| Sales & Related | 0 (0.0%) | 0 (0.0%) |
| Office & Administration | 7 (25.9%) | 20 (74.1%) |
| Total (Category) | 7 (25.9%) | 20 (74.1%) |
| Total (Overall) | 48 (43.6%) | 62 (56.4%) |
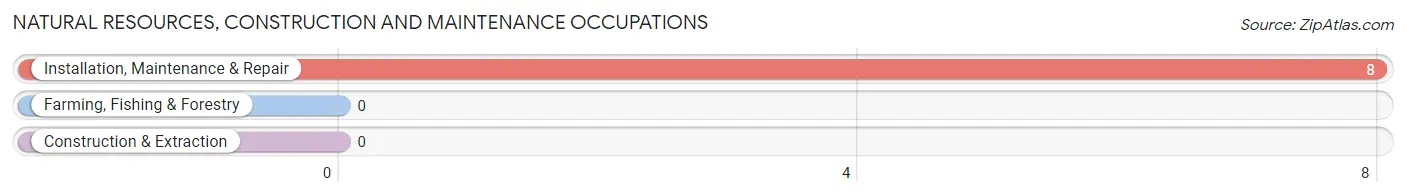
Natural Resources, Construction and Maintenance Occupations
The most common Natural Resources, Construction and Maintenance occupations in Midlothian are , and Installation, Maintenance & Repair (8 | 7.3%).
Natural Resources, Construction and Maintenance Occupations by Sex
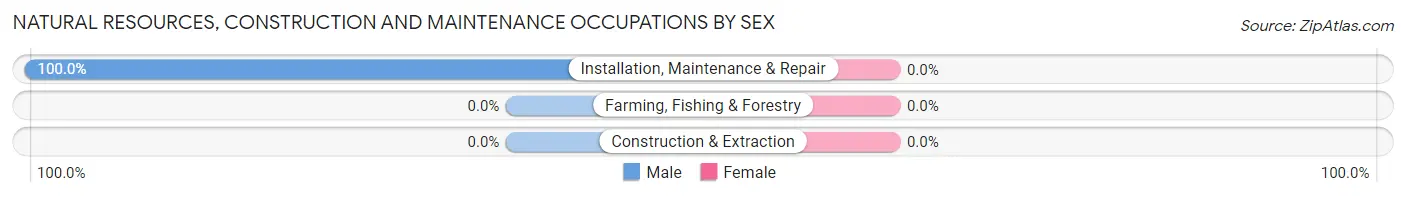
| Occupation | Male | Female |
| Farming, Fishing & Forestry | 0 (0.0%) | 0 (0.0%) |
| Construction & Extraction | 0 (0.0%) | 0 (0.0%) |
| Installation, Maintenance & Repair | 8 (100.0%) | 0 (0.0%) |
| Total (Category) | 8 (100.0%) | 0 (0.0%) |
| Total (Overall) | 48 (43.6%) | 62 (56.4%) |
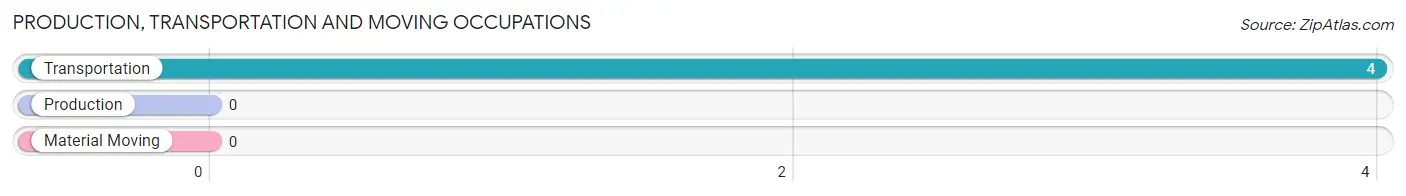
Production, Transportation and Moving Occupations
The most common Production, Transportation and Moving occupations in Midlothian are , and Transportation (4 | 3.6%).
Production, Transportation and Moving Occupations by Sex
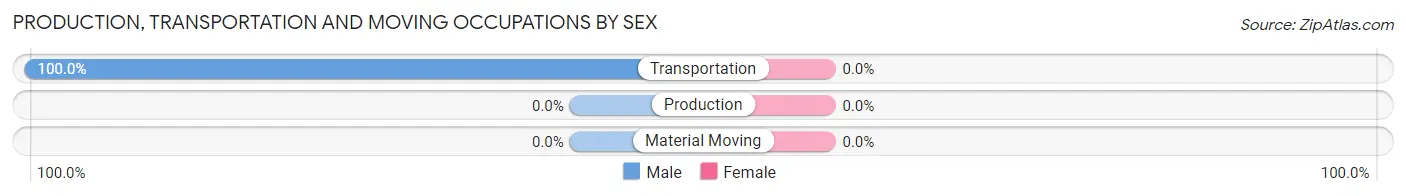
| Occupation | Male | Female |
| Production | 0 (0.0%) | 0 (0.0%) |
| Transportation | 4 (100.0%) | 0 (0.0%) |
| Material Moving | 0 (0.0%) | 0 (0.0%) |
| Total (Category) | 4 (100.0%) | 0 (0.0%) |
| Total (Overall) | 48 (43.6%) | 62 (56.4%) |
Employment Industries by Sex in Midlothian
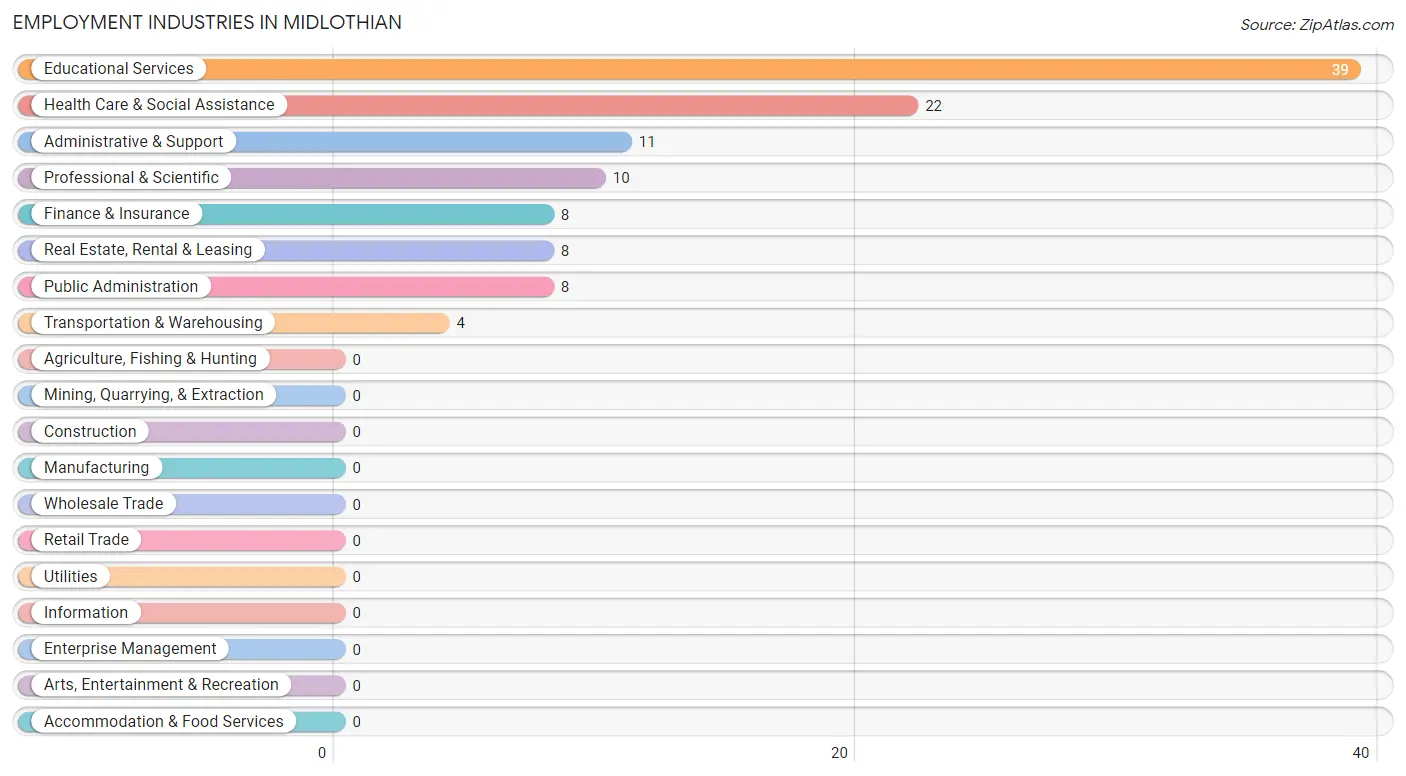
Employment Industries in Midlothian
The major employment industries in Midlothian include Educational Services (39 | 35.4%), Health Care & Social Assistance (22 | 20.0%), Administrative & Support (11 | 10.0%), Professional & Scientific (10 | 9.1%), and Finance & Insurance (8 | 7.3%).
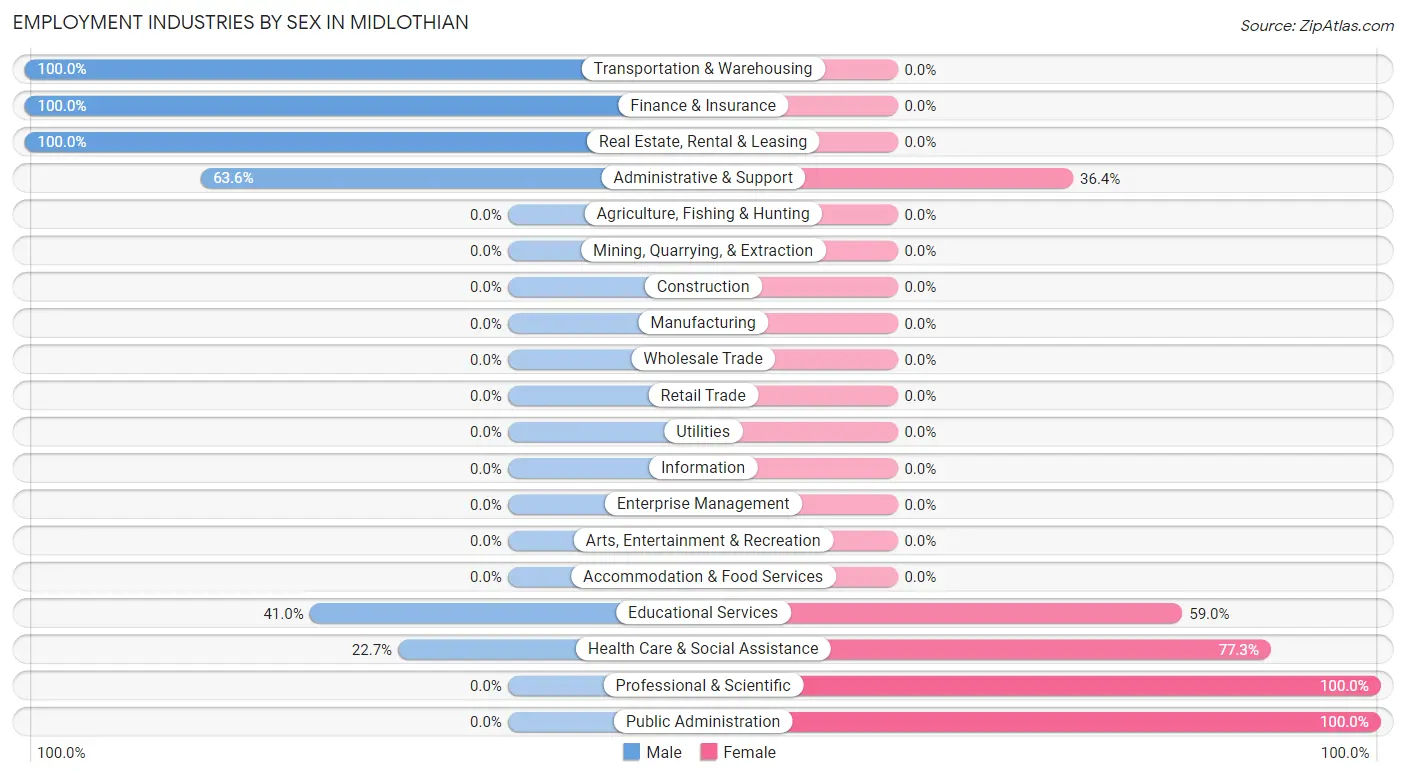
Employment Industries by Sex in Midlothian
The Midlothian industries that see more men than women are Transportation & Warehousing (100.0%), Finance & Insurance (100.0%), and Real Estate, Rental & Leasing (100.0%), whereas the industries that tend to have a higher number of women are Professional & Scientific (100.0%), Public Administration (100.0%), and Health Care & Social Assistance (77.3%).
| Industry | Male | Female |
| Agriculture, Fishing & Hunting | 0 (0.0%) | 0 (0.0%) |
| Mining, Quarrying, & Extraction | 0 (0.0%) | 0 (0.0%) |
| Construction | 0 (0.0%) | 0 (0.0%) |
| Manufacturing | 0 (0.0%) | 0 (0.0%) |
| Wholesale Trade | 0 (0.0%) | 0 (0.0%) |
| Retail Trade | 0 (0.0%) | 0 (0.0%) |
| Transportation & Warehousing | 4 (100.0%) | 0 (0.0%) |
| Utilities | 0 (0.0%) | 0 (0.0%) |
| Information | 0 (0.0%) | 0 (0.0%) |
| Finance & Insurance | 8 (100.0%) | 0 (0.0%) |
| Real Estate, Rental & Leasing | 8 (100.0%) | 0 (0.0%) |
| Professional & Scientific | 0 (0.0%) | 10 (100.0%) |
| Enterprise Management | 0 (0.0%) | 0 (0.0%) |
| Administrative & Support | 7 (63.6%) | 4 (36.4%) |
| Educational Services | 16 (41.0%) | 23 (59.0%) |
| Health Care & Social Assistance | 5 (22.7%) | 17 (77.3%) |
| Arts, Entertainment & Recreation | 0 (0.0%) | 0 (0.0%) |
| Accommodation & Food Services | 0 (0.0%) | 0 (0.0%) |
| Public Administration | 0 (0.0%) | 8 (100.0%) |
| Total | 48 (43.6%) | 62 (56.4%) |
Education in Midlothian
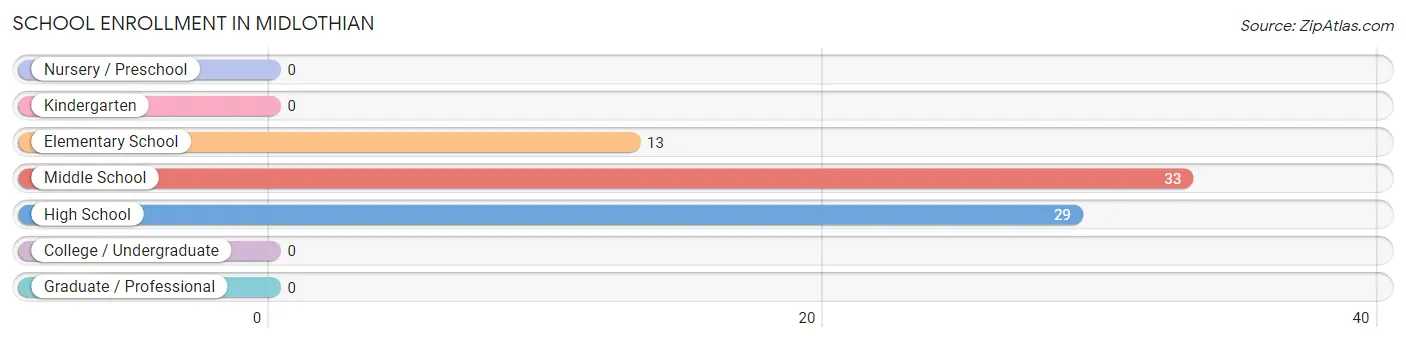
School Enrollment in Midlothian
The most common levels of schooling among the 75 students in Midlothian are middle school (33 | 44.0%), high school (29 | 38.7%), and elementary school (13 | 17.3%).
| School Level | # Students | % Students |
| Nursery / Preschool | 0 | 0.0% |
| Kindergarten | 0 | 0.0% |
| Elementary School | 13 | 17.3% |
| Middle School | 33 | 44.0% |
| High School | 29 | 38.7% |
| College / Undergraduate | 0 | 0.0% |
| Graduate / Professional | 0 | 0.0% |
| Total | 75 | 100.0% |
School Enrollment by Age by Funding Source in Midlothian
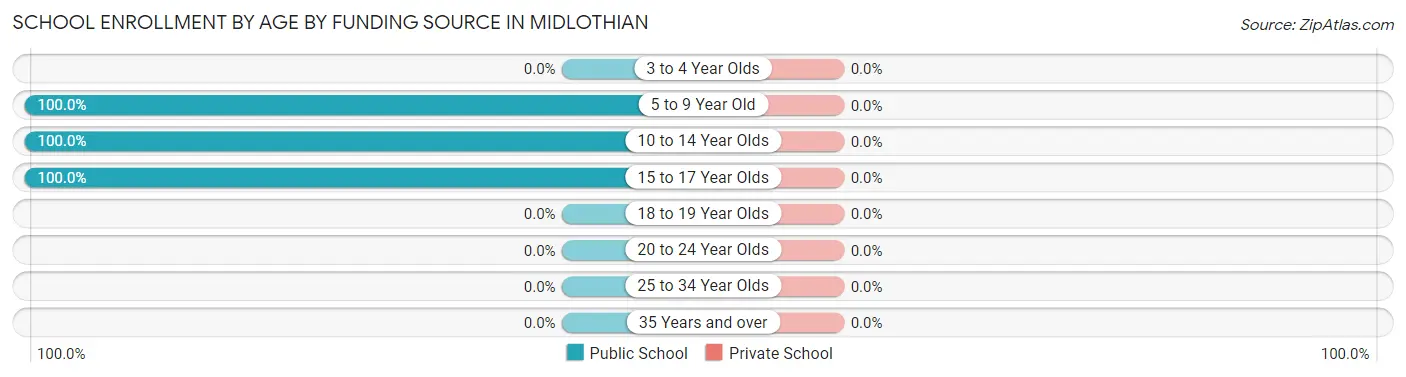
| Age Bracket | Public School | Private School |
| 3 to 4 Year Olds | 0 (0.0%) | 0 (0.0%) |
| 5 to 9 Year Old | 13 (100.0%) | 0 (0.0%) |
| 10 to 14 Year Olds | 33 (100.0%) | 0 (0.0%) |
| 15 to 17 Year Olds | 29 (100.0%) | 0 (0.0%) |
| 18 to 19 Year Olds | 0 (0.0%) | 0 (0.0%) |
| 20 to 24 Year Olds | 0 (0.0%) | 0 (0.0%) |
| 25 to 34 Year Olds | 0 (0.0%) | 0 (0.0%) |
| 35 Years and over | 0 (0.0%) | 0 (0.0%) |
| Total | 75 (100.0%) | 0 (0.0%) |
Educational Attainment by Field of Study in Midlothian
Education (34 | 63.0%), computers & mathematics (10 | 18.5%), and social sciences (10 | 18.5%) are the most common fields of study among 54 individuals in Midlothian who have obtained a bachelor's degree or higher.
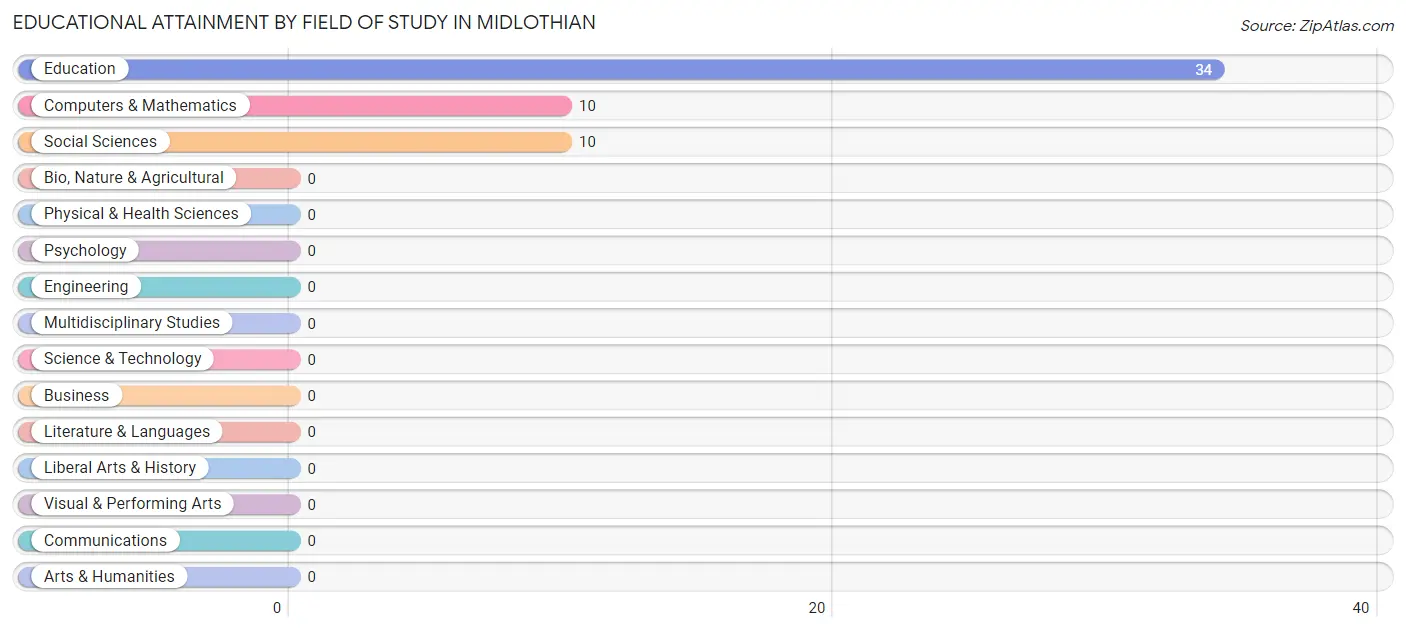
| Field of Study | # Graduates | % Graduates |
| Computers & Mathematics | 10 | 18.5% |
| Bio, Nature & Agricultural | 0 | 0.0% |
| Physical & Health Sciences | 0 | 0.0% |
| Psychology | 0 | 0.0% |
| Social Sciences | 10 | 18.5% |
| Engineering | 0 | 0.0% |
| Multidisciplinary Studies | 0 | 0.0% |
| Science & Technology | 0 | 0.0% |
| Business | 0 | 0.0% |
| Education | 34 | 63.0% |
| Literature & Languages | 0 | 0.0% |
| Liberal Arts & History | 0 | 0.0% |
| Visual & Performing Arts | 0 | 0.0% |
| Communications | 0 | 0.0% |
| Arts & Humanities | 0 | 0.0% |
| Total | 54 | 100.0% |
Transportation & Commute in Midlothian
Vehicle Availability by Sex in Midlothian
The most prevalent vehicle ownership categories in Midlothian are males with 3 vehicles (20, accounting for 41.7%) and females with 3 vehicles (23, making up 32.3%).
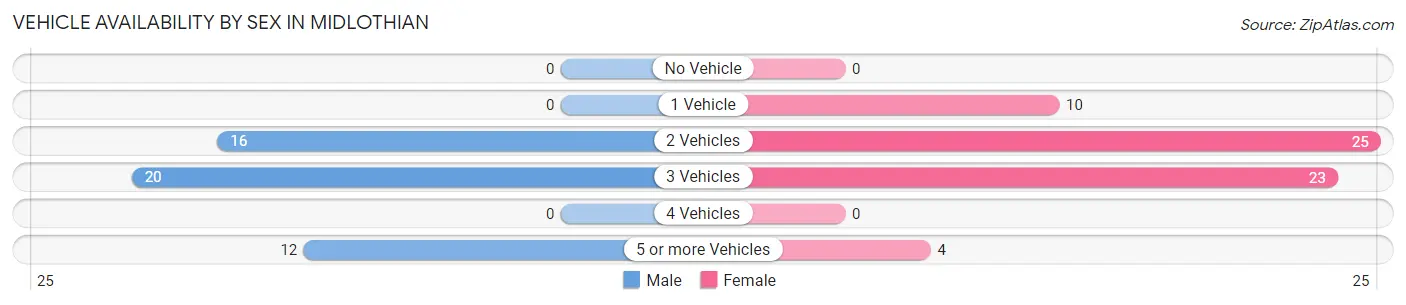
| Vehicles Available | Male | Female |
| No Vehicle | 0 (0.0%) | 0 (0.0%) |
| 1 Vehicle | 0 (0.0%) | 10 (16.1%) |
| 2 Vehicles | 16 (33.3%) | 25 (40.3%) |
| 3 Vehicles | 20 (41.7%) | 23 (37.1%) |
| 4 Vehicles | 0 (0.0%) | 0 (0.0%) |
| 5 or more Vehicles | 12 (25.0%) | 4 (6.5%) |
| Total | 48 (100.0%) | 62 (100.0%) |
Commute Time in Midlothian
The most frequently occuring commute durations in Midlothian are 20 to 24 minutes (47 commuters, 47.0%), 5 to 9 minutes (19 commuters, 19.0%), and 15 to 19 minutes (13 commuters, 13.0%).
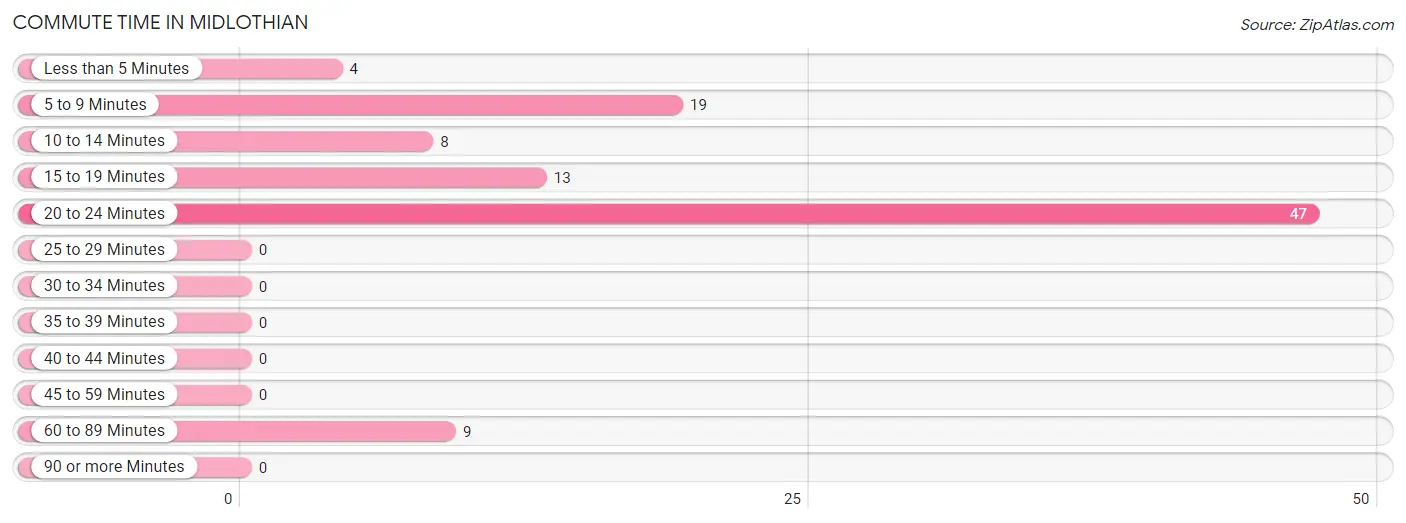
| Commute Time | # Commuters | % Commuters |
| Less than 5 Minutes | 4 | 4.0% |
| 5 to 9 Minutes | 19 | 19.0% |
| 10 to 14 Minutes | 8 | 8.0% |
| 15 to 19 Minutes | 13 | 13.0% |
| 20 to 24 Minutes | 47 | 47.0% |
| 25 to 29 Minutes | 0 | 0.0% |
| 30 to 34 Minutes | 0 | 0.0% |
| 35 to 39 Minutes | 0 | 0.0% |
| 40 to 44 Minutes | 0 | 0.0% |
| 45 to 59 Minutes | 0 | 0.0% |
| 60 to 89 Minutes | 9 | 9.0% |
| 90 or more Minutes | 0 | 0.0% |
Commute Time by Sex in Midlothian
The most common commute times in Midlothian are 20 to 24 minutes (16 commuters, 33.3%) for males and 20 to 24 minutes (31 commuters, 59.6%) for females.
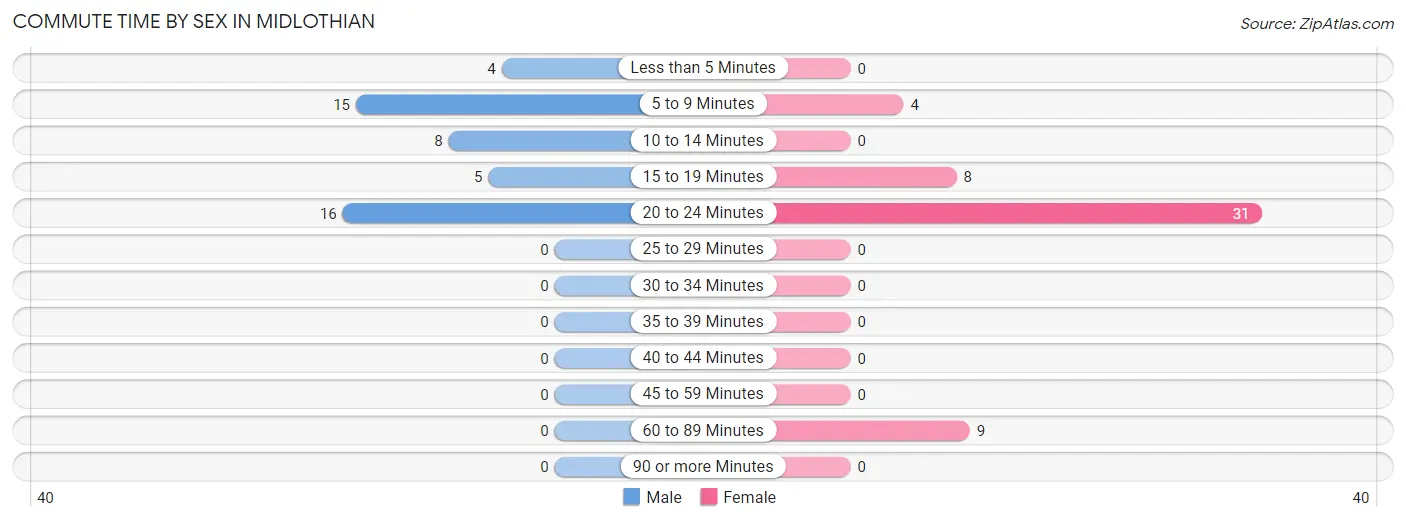
| Commute Time | Male | Female |
| Less than 5 Minutes | 4 (8.3%) | 0 (0.0%) |
| 5 to 9 Minutes | 15 (31.2%) | 4 (7.7%) |
| 10 to 14 Minutes | 8 (16.7%) | 0 (0.0%) |
| 15 to 19 Minutes | 5 (10.4%) | 8 (15.4%) |
| 20 to 24 Minutes | 16 (33.3%) | 31 (59.6%) |
| 25 to 29 Minutes | 0 (0.0%) | 0 (0.0%) |
| 30 to 34 Minutes | 0 (0.0%) | 0 (0.0%) |
| 35 to 39 Minutes | 0 (0.0%) | 0 (0.0%) |
| 40 to 44 Minutes | 0 (0.0%) | 0 (0.0%) |
| 45 to 59 Minutes | 0 (0.0%) | 0 (0.0%) |
| 60 to 89 Minutes | 0 (0.0%) | 9 (17.3%) |
| 90 or more Minutes | 0 (0.0%) | 0 (0.0%) |
Time of Departure to Work by Sex in Midlothian
The most frequent times of departure to work in Midlothian are 6:30 AM to 6:59 AM (16, 33.3%) for males and 7:00 AM to 7:29 AM (26, 50.0%) for females.
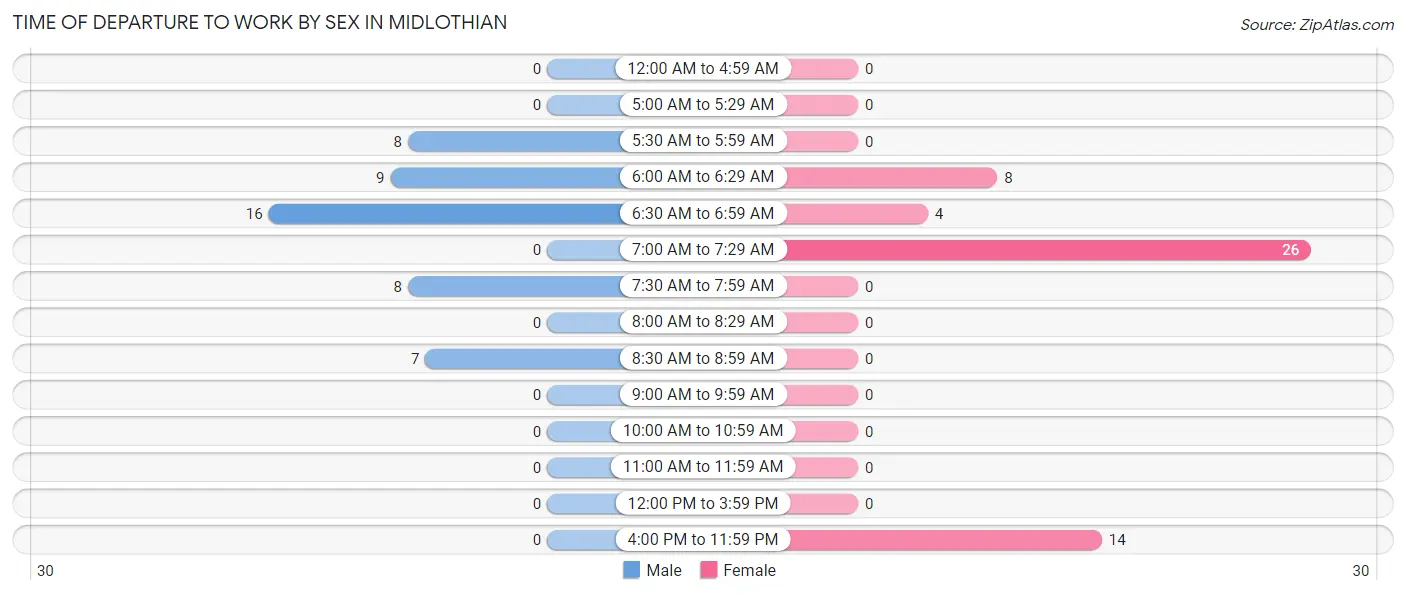
| Time of Departure | Male | Female |
| 12:00 AM to 4:59 AM | 0 (0.0%) | 0 (0.0%) |
| 5:00 AM to 5:29 AM | 0 (0.0%) | 0 (0.0%) |
| 5:30 AM to 5:59 AM | 8 (16.7%) | 0 (0.0%) |
| 6:00 AM to 6:29 AM | 9 (18.8%) | 8 (15.4%) |
| 6:30 AM to 6:59 AM | 16 (33.3%) | 4 (7.7%) |
| 7:00 AM to 7:29 AM | 0 (0.0%) | 26 (50.0%) |
| 7:30 AM to 7:59 AM | 8 (16.7%) | 0 (0.0%) |
| 8:00 AM to 8:29 AM | 0 (0.0%) | 0 (0.0%) |
| 8:30 AM to 8:59 AM | 7 (14.6%) | 0 (0.0%) |
| 9:00 AM to 9:59 AM | 0 (0.0%) | 0 (0.0%) |
| 10:00 AM to 10:59 AM | 0 (0.0%) | 0 (0.0%) |
| 11:00 AM to 11:59 AM | 0 (0.0%) | 0 (0.0%) |
| 12:00 PM to 3:59 PM | 0 (0.0%) | 0 (0.0%) |
| 4:00 PM to 11:59 PM | 0 (0.0%) | 14 (26.9%) |
| Total | 48 (100.0%) | 52 (100.0%) |
Housing Occupancy in Midlothian
Occupancy by Ownership in Midlothian
Of the total 152 dwellings in Midlothian, owner-occupied units account for 143 (94.1%), while renter-occupied units make up 9 (5.9%).
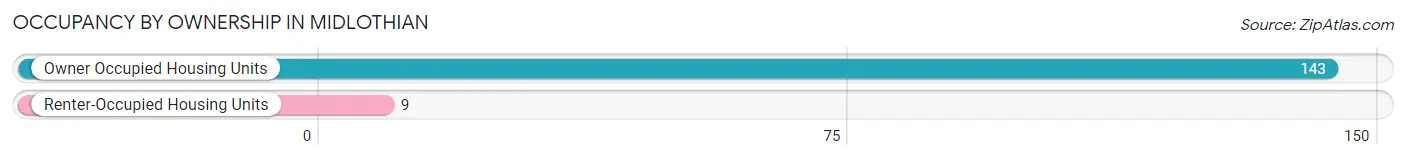
| Occupancy | # Housing Units | % Housing Units |
| Owner Occupied Housing Units | 143 | 94.1% |
| Renter-Occupied Housing Units | 9 | 5.9% |
| Total Occupied Housing Units | 152 | 100.0% |
Occupancy by Household Size in Midlothian
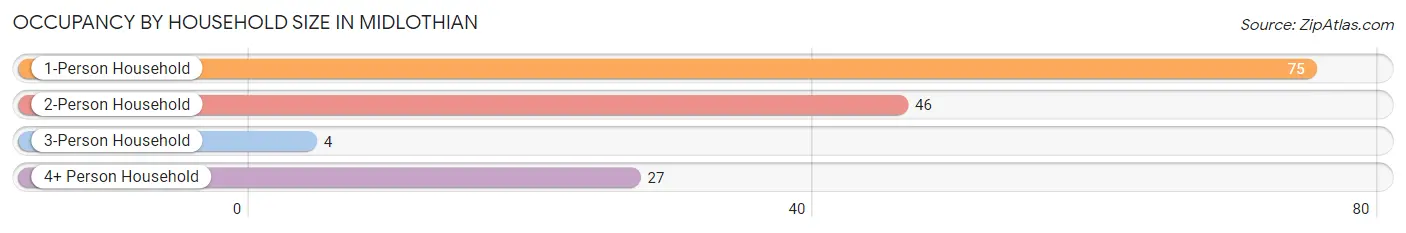
| Household Size | # Housing Units | % Housing Units |
| 1-Person Household | 75 | 49.3% |
| 2-Person Household | 46 | 30.3% |
| 3-Person Household | 4 | 2.6% |
| 4+ Person Household | 27 | 17.8% |
| Total Housing Units | 152 | 100.0% |
Occupancy by Ownership by Household Size in Midlothian
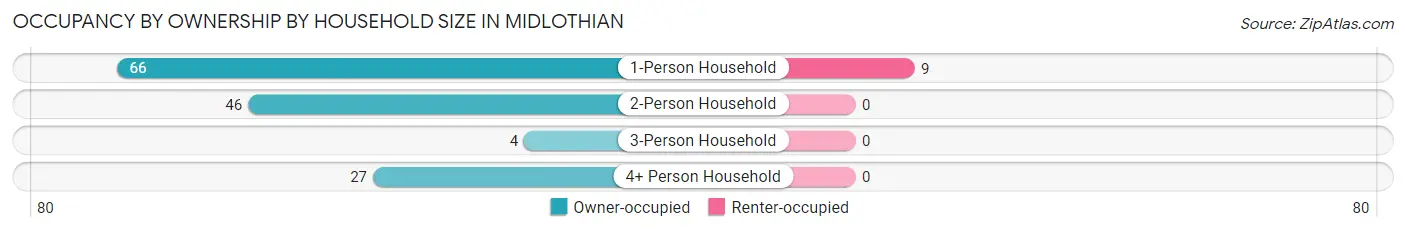
| Household Size | Owner-occupied | Renter-occupied |
| 1-Person Household | 66 (88.0%) | 9 (12.0%) |
| 2-Person Household | 46 (100.0%) | 0 (0.0%) |
| 3-Person Household | 4 (100.0%) | 0 (0.0%) |
| 4+ Person Household | 27 (100.0%) | 0 (0.0%) |
| Total Housing Units | 143 (94.1%) | 9 (5.9%) |
Occupancy by Educational Attainment in Midlothian
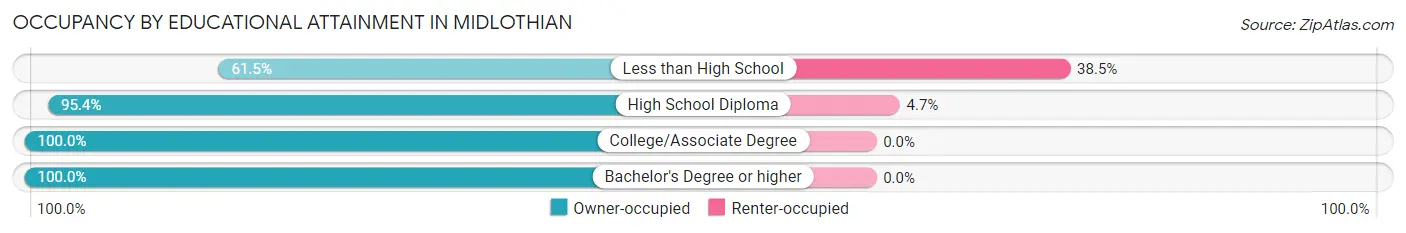
| Household Size | Owner-occupied | Renter-occupied |
| Less than High School | 8 (61.5%) | 5 (38.5%) |
| High School Diploma | 82 (95.4%) | 4 (4.6%) |
| College/Associate Degree | 25 (100.0%) | 0 (0.0%) |
| Bachelor's Degree or higher | 28 (100.0%) | 0 (0.0%) |
Occupancy by Age of Householder in Midlothian
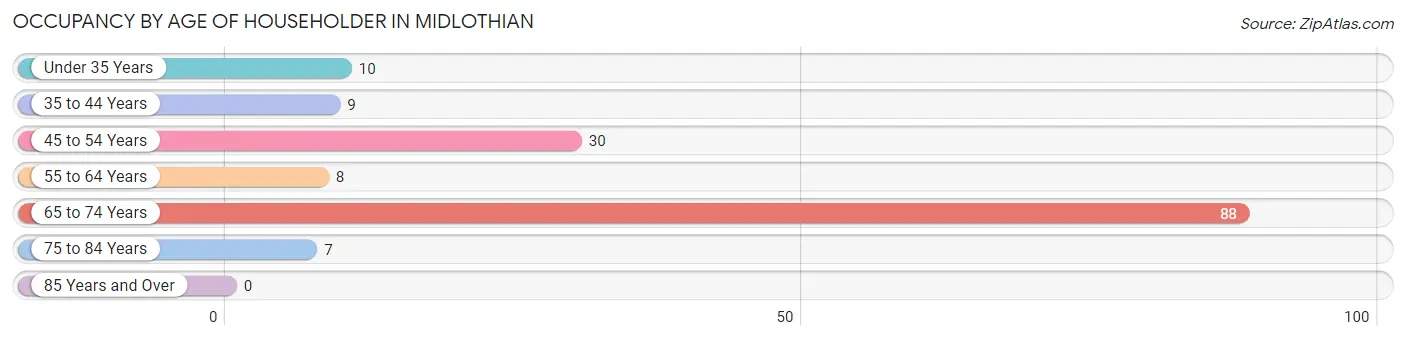
| Age Bracket | # Households | % Households |
| Under 35 Years | 10 | 6.6% |
| 35 to 44 Years | 9 | 5.9% |
| 45 to 54 Years | 30 | 19.7% |
| 55 to 64 Years | 8 | 5.3% |
| 65 to 74 Years | 88 | 57.9% |
| 75 to 84 Years | 7 | 4.6% |
| 85 Years and Over | 0 | 0.0% |
| Total | 152 | 100.0% |
Housing Finances in Midlothian
Median Income by Occupancy in Midlothian
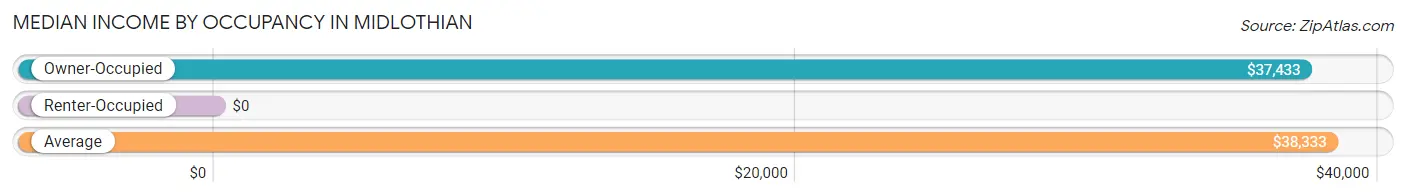
| Occupancy Type | # Households | Median Income |
| Owner-Occupied | 143 (94.1%) | $37,433 |
| Renter-Occupied | 9 (5.9%) | $0 |
| Average | 152 (100.0%) | $38,333 |
Occupancy by Householder Income Bracket in Midlothian
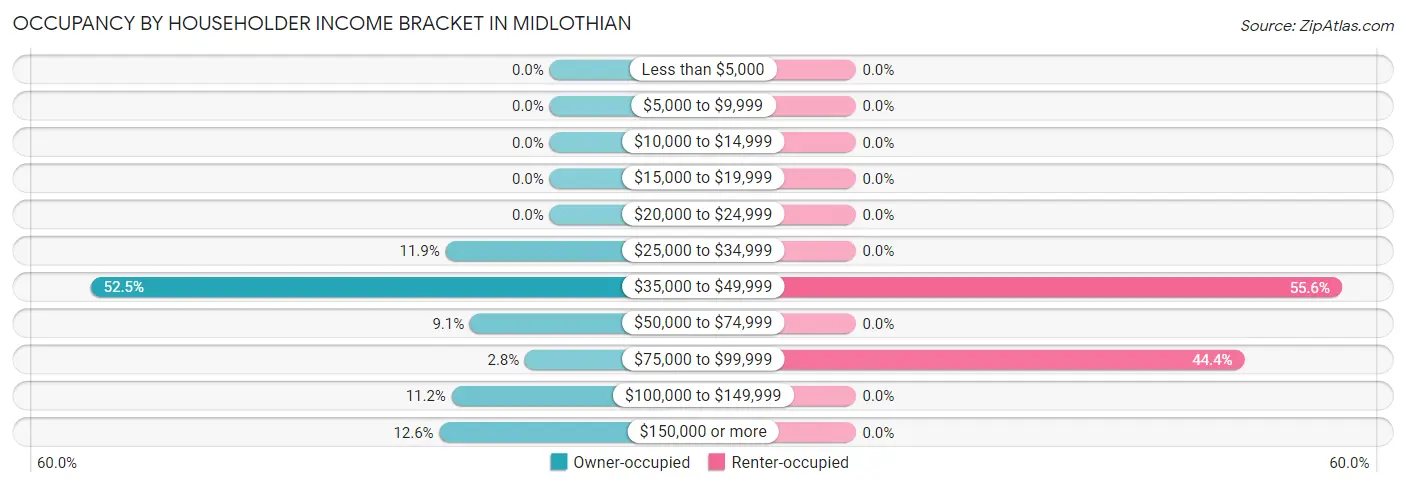
| Income Bracket | Owner-occupied | Renter-occupied |
| Less than $5,000 | 0 (0.0%) | 0 (0.0%) |
| $5,000 to $9,999 | 0 (0.0%) | 0 (0.0%) |
| $10,000 to $14,999 | 0 (0.0%) | 0 (0.0%) |
| $15,000 to $19,999 | 0 (0.0%) | 0 (0.0%) |
| $20,000 to $24,999 | 0 (0.0%) | 0 (0.0%) |
| $25,000 to $34,999 | 17 (11.9%) | 0 (0.0%) |
| $35,000 to $49,999 | 75 (52.4%) | 5 (55.6%) |
| $50,000 to $74,999 | 13 (9.1%) | 0 (0.0%) |
| $75,000 to $99,999 | 4 (2.8%) | 4 (44.4%) |
| $100,000 to $149,999 | 16 (11.2%) | 0 (0.0%) |
| $150,000 or more | 18 (12.6%) | 0 (0.0%) |
| Total | 143 (100.0%) | 9 (100.0%) |
Monthly Housing Cost Tiers in Midlothian
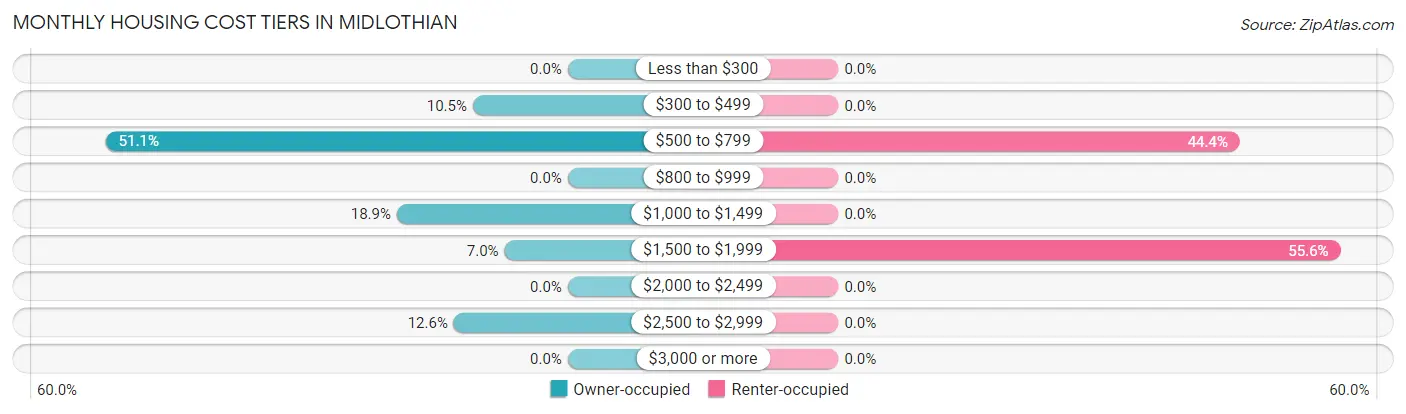
| Monthly Cost | Owner-occupied | Renter-occupied |
| Less than $300 | 0 (0.0%) | 0 (0.0%) |
| $300 to $499 | 15 (10.5%) | 0 (0.0%) |
| $500 to $799 | 73 (51.0%) | 4 (44.4%) |
| $800 to $999 | 0 (0.0%) | 0 (0.0%) |
| $1,000 to $1,499 | 27 (18.9%) | 0 (0.0%) |
| $1,500 to $1,999 | 10 (7.0%) | 5 (55.6%) |
| $2,000 to $2,499 | 0 (0.0%) | 0 (0.0%) |
| $2,500 to $2,999 | 18 (12.6%) | 0 (0.0%) |
| $3,000 or more | 0 (0.0%) | 0 (0.0%) |
| Total | 143 (100.0%) | 9 (100.0%) |
Physical Housing Characteristics in Midlothian
Housing Structures in Midlothian
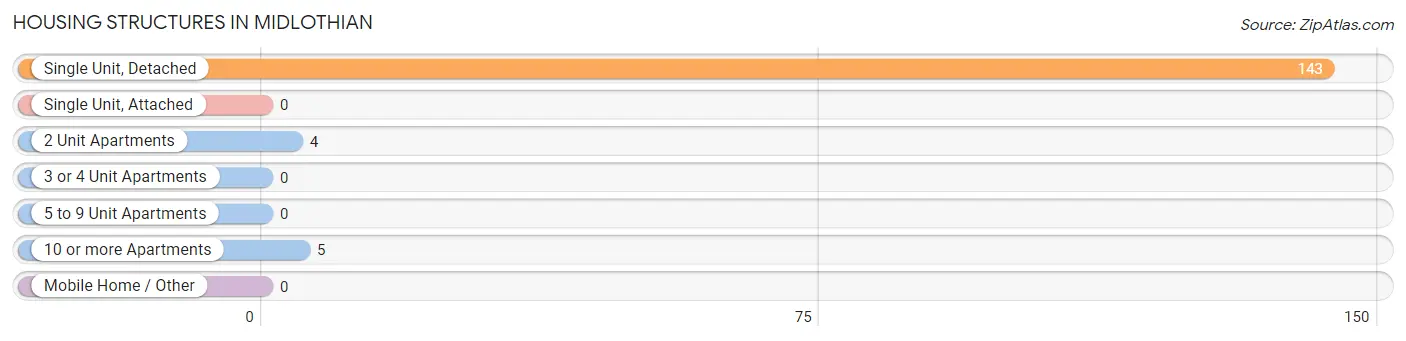
| Structure Type | # Housing Units | % Housing Units |
| Single Unit, Detached | 143 | 94.1% |
| Single Unit, Attached | 0 | 0.0% |
| 2 Unit Apartments | 4 | 2.6% |
| 3 or 4 Unit Apartments | 0 | 0.0% |
| 5 to 9 Unit Apartments | 0 | 0.0% |
| 10 or more Apartments | 5 | 3.3% |
| Mobile Home / Other | 0 | 0.0% |
| Total | 152 | 100.0% |
Housing Structures by Occupancy in Midlothian

| Structure Type | Owner-occupied | Renter-occupied |
| Single Unit, Detached | 143 (100.0%) | 0 (0.0%) |
| Single Unit, Attached | 0 (0.0%) | 0 (0.0%) |
| 2 Unit Apartments | 0 (0.0%) | 4 (100.0%) |
| 3 or 4 Unit Apartments | 0 (0.0%) | 0 (0.0%) |
| 5 to 9 Unit Apartments | 0 (0.0%) | 0 (0.0%) |
| 10 or more Apartments | 0 (0.0%) | 5 (100.0%) |
| Mobile Home / Other | 0 (0.0%) | 0 (0.0%) |
| Total | 143 (94.1%) | 9 (5.9%) |
Housing Structures by Number of Rooms in Midlothian
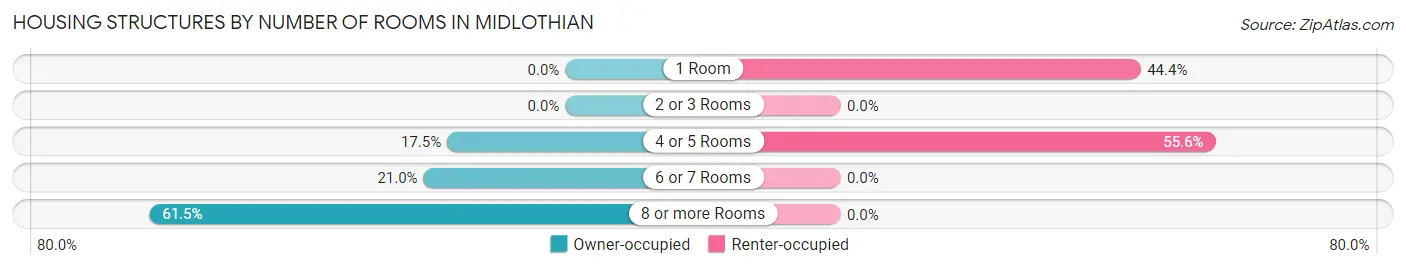
| Number of Rooms | Owner-occupied | Renter-occupied |
| 1 Room | 0 (0.0%) | 4 (44.4%) |
| 2 or 3 Rooms | 0 (0.0%) | 0 (0.0%) |
| 4 or 5 Rooms | 25 (17.5%) | 5 (55.6%) |
| 6 or 7 Rooms | 30 (21.0%) | 0 (0.0%) |
| 8 or more Rooms | 88 (61.5%) | 0 (0.0%) |
| Total | 143 (100.0%) | 9 (100.0%) |
Housing Structure by Heating Type in Midlothian
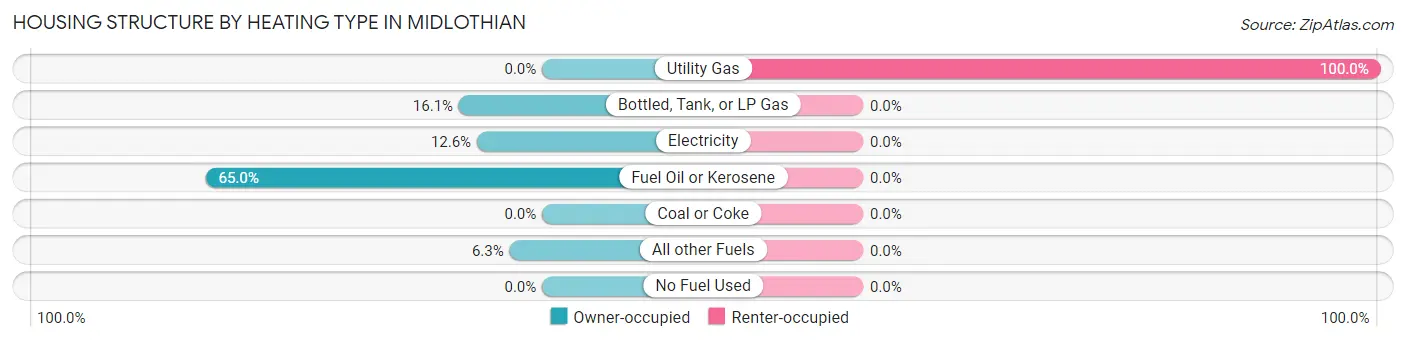
| Heating Type | Owner-occupied | Renter-occupied |
| Utility Gas | 0 (0.0%) | 9 (100.0%) |
| Bottled, Tank, or LP Gas | 23 (16.1%) | 0 (0.0%) |
| Electricity | 18 (12.6%) | 0 (0.0%) |
| Fuel Oil or Kerosene | 93 (65.0%) | 0 (0.0%) |
| Coal or Coke | 0 (0.0%) | 0 (0.0%) |
| All other Fuels | 9 (6.3%) | 0 (0.0%) |
| No Fuel Used | 0 (0.0%) | 0 (0.0%) |
| Total | 143 (100.0%) | 9 (100.0%) |
Household Vehicle Usage in Midlothian
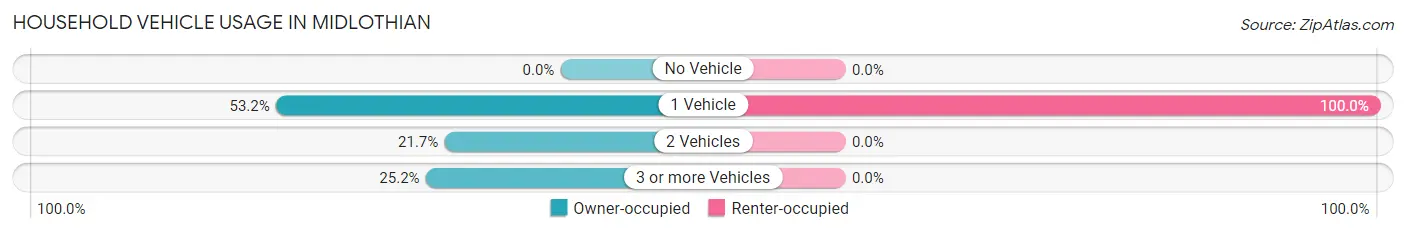
| Vehicles per Household | Owner-occupied | Renter-occupied |
| No Vehicle | 0 (0.0%) | 0 (0.0%) |
| 1 Vehicle | 76 (53.1%) | 9 (100.0%) |
| 2 Vehicles | 31 (21.7%) | 0 (0.0%) |
| 3 or more Vehicles | 36 (25.2%) | 0 (0.0%) |
| Total | 143 (100.0%) | 9 (100.0%) |
Real Estate & Mortgages in Midlothian
Real Estate and Mortgage Overview in Midlothian
| Characteristic | Without Mortgage | With Mortgage |
| Housing Units | 96 | 47 |
| Median Property Value | $164,700 | $161,300 |
| Median Household Income | $36,830 | $18 |
| Monthly Housing Costs | $652 | $0 |
| Real Estate Taxes | $2,385 | $0 |
Property Value by Mortgage Status in Midlothian
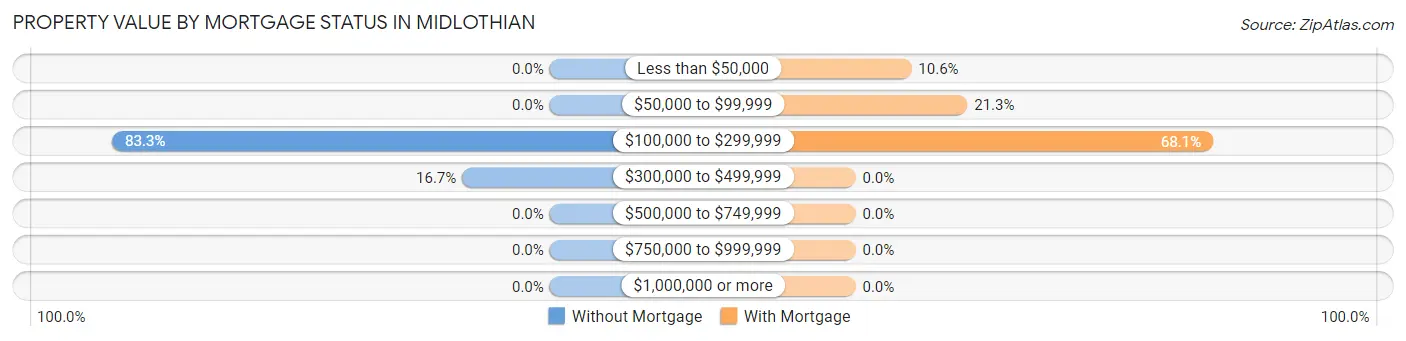
| Property Value | Without Mortgage | With Mortgage |
| Less than $50,000 | 0 (0.0%) | 5 (10.6%) |
| $50,000 to $99,999 | 0 (0.0%) | 10 (21.3%) |
| $100,000 to $299,999 | 80 (83.3%) | 32 (68.1%) |
| $300,000 to $499,999 | 16 (16.7%) | 0 (0.0%) |
| $500,000 to $749,999 | 0 (0.0%) | 0 (0.0%) |
| $750,000 to $999,999 | 0 (0.0%) | 0 (0.0%) |
| $1,000,000 or more | 0 (0.0%) | 0 (0.0%) |
| Total | 96 (100.0%) | 47 (100.0%) |
Household Income by Mortgage Status in Midlothian
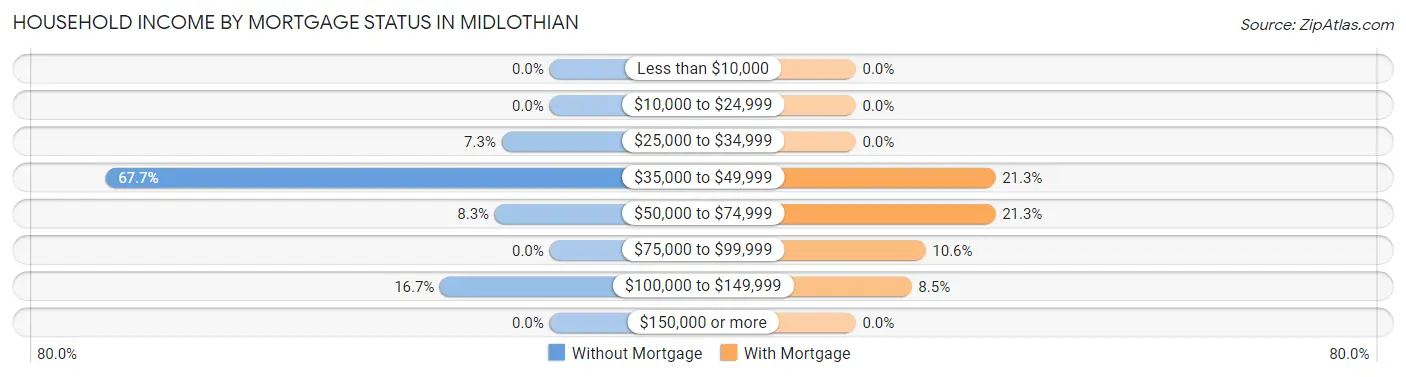
| Household Income | Without Mortgage | With Mortgage |
| Less than $10,000 | 0 (0.0%) | 0 (0.0%) |
| $10,000 to $24,999 | 0 (0.0%) | 0 (0.0%) |
| $25,000 to $34,999 | 7 (7.3%) | 0 (0.0%) |
| $35,000 to $49,999 | 65 (67.7%) | 10 (21.3%) |
| $50,000 to $74,999 | 8 (8.3%) | 10 (21.3%) |
| $75,000 to $99,999 | 0 (0.0%) | 5 (10.6%) |
| $100,000 to $149,999 | 16 (16.7%) | 4 (8.5%) |
| $150,000 or more | 0 (0.0%) | 0 (0.0%) |
| Total | 96 (100.0%) | 47 (100.0%) |
Property Value to Household Income Ratio in Midlothian
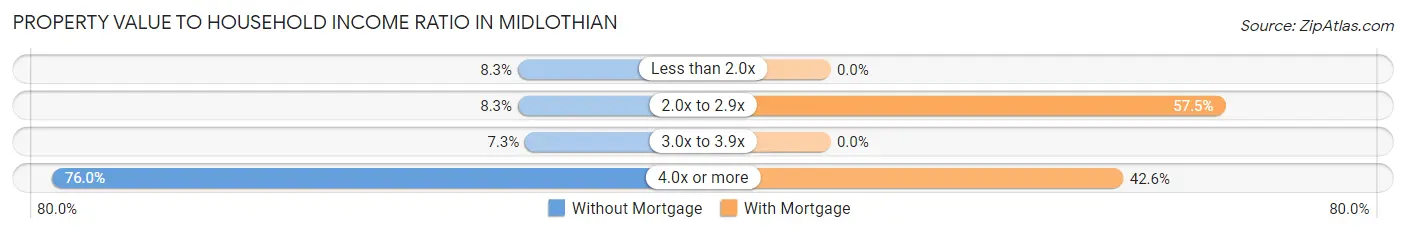
| Value-to-Income Ratio | Without Mortgage | With Mortgage |
| Less than 2.0x | 8 (8.3%) | 0 (0.0%) |
| 2.0x to 2.9x | 8 (8.3%) | 27 (57.5%) |
| 3.0x to 3.9x | 7 (7.3%) | 0 (0.0%) |
| 4.0x or more | 73 (76.0%) | 20 (42.5%) |
| Total | 96 (100.0%) | 47 (100.0%) |
Real Estate Taxes by Mortgage Status in Midlothian
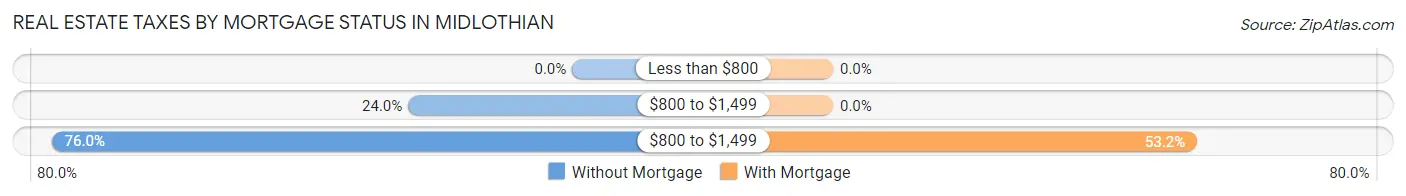
| Property Taxes | Without Mortgage | With Mortgage |
| Less than $800 | 0 (0.0%) | 0 (0.0%) |
| $800 to $1,499 | 23 (24.0%) | 0 (0.0%) |
| $800 to $1,499 | 73 (76.0%) | 25 (53.2%) |
| Total | 96 (100.0%) | 47 (100.0%) |
Health & Disability in Midlothian
Health Insurance Coverage by Age in Midlothian
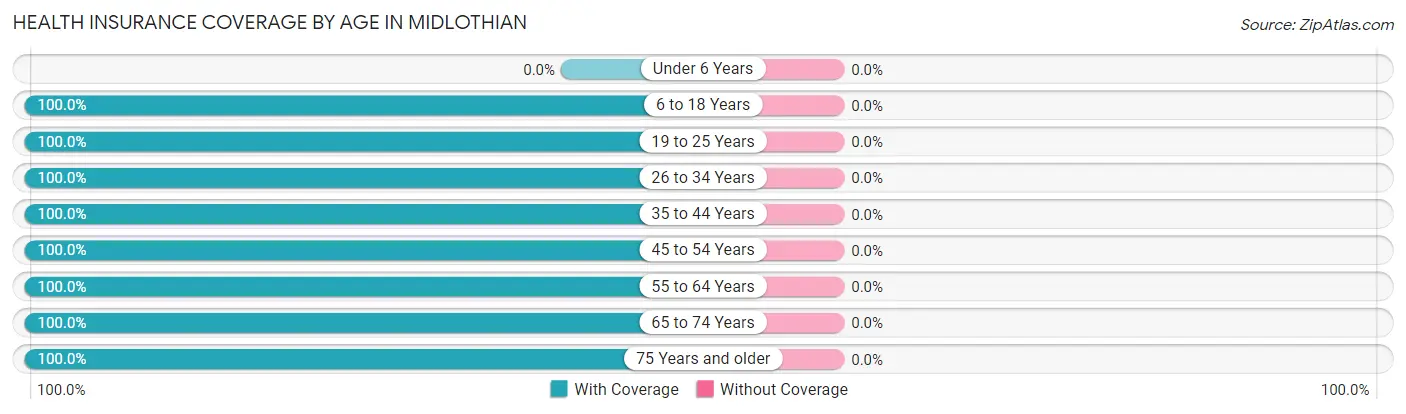
| Age Bracket | With Coverage | Without Coverage |
| Under 6 Years | 0 (0.0%) | 0 (0.0%) |
| 6 to 18 Years | 75 (100.0%) | 0 (0.0%) |
| 19 to 25 Years | 16 (100.0%) | 0 (0.0%) |
| 26 to 34 Years | 19 (100.0%) | 0 (0.0%) |
| 35 to 44 Years | 20 (100.0%) | 0 (0.0%) |
| 45 to 54 Years | 51 (100.0%) | 0 (0.0%) |
| 55 to 64 Years | 24 (100.0%) | 0 (0.0%) |
| 65 to 74 Years | 101 (100.0%) | 0 (0.0%) |
| 75 Years and older | 7 (100.0%) | 0 (0.0%) |
| Total | 313 (100.0%) | 0 (0.0%) |
Health Insurance Coverage by Citizenship Status in Midlothian
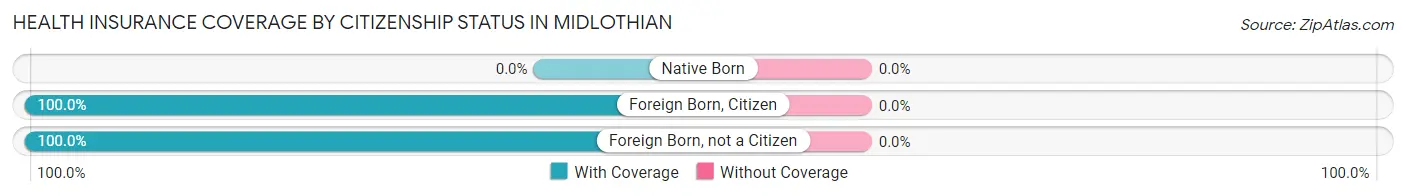
| Citizenship Status | With Coverage | Without Coverage |
| Native Born | 0 (0.0%) | 0 (0.0%) |
| Foreign Born, Citizen | 75 (100.0%) | 0 (0.0%) |
| Foreign Born, not a Citizen | 16 (100.0%) | 0 (0.0%) |
Health Insurance Coverage by Household Income in Midlothian
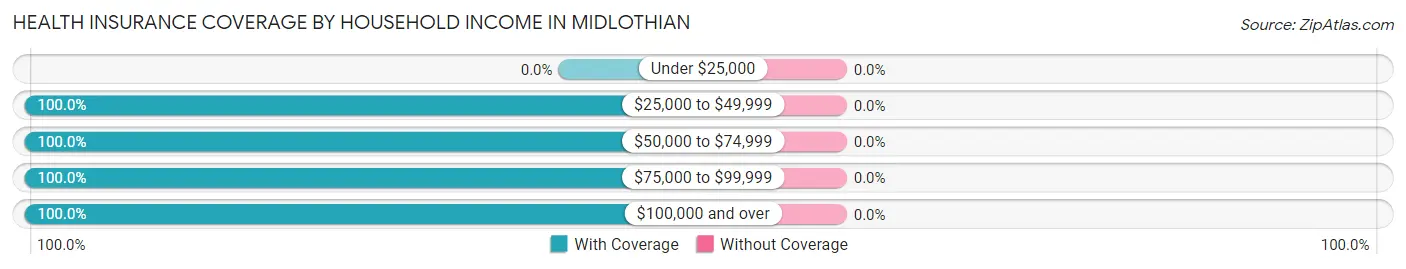
| Household Income | With Coverage | Without Coverage |
| Under $25,000 | 0 (0.0%) | 0 (0.0%) |
| $25,000 to $49,999 | 153 (100.0%) | 0 (0.0%) |
| $50,000 to $74,999 | 25 (100.0%) | 0 (0.0%) |
| $75,000 to $99,999 | 20 (100.0%) | 0 (0.0%) |
| $100,000 and over | 115 (100.0%) | 0 (0.0%) |
Public vs Private Health Insurance Coverage by Age in Midlothian
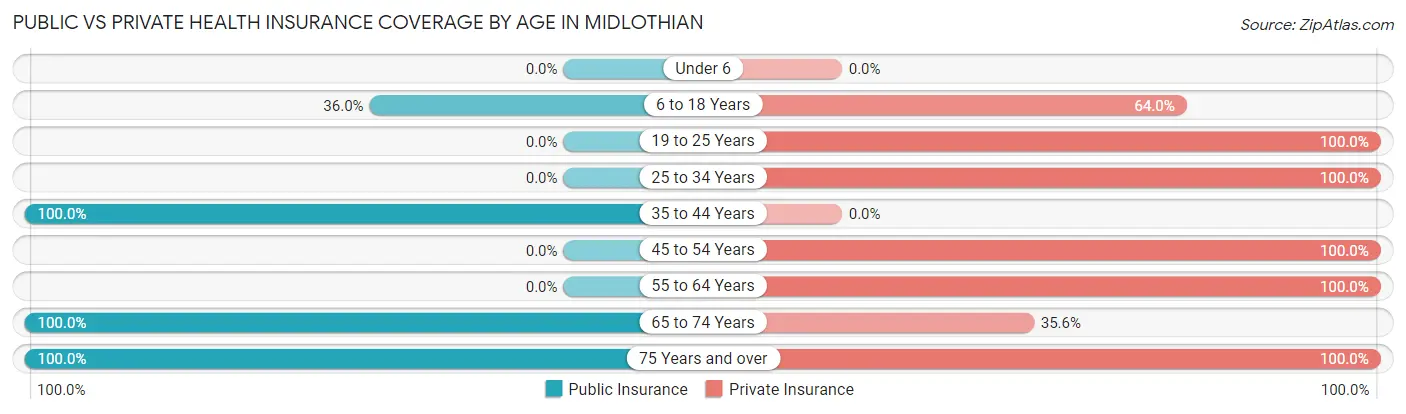
| Age Bracket | Public Insurance | Private Insurance |
| Under 6 | 0 (0.0%) | 0 (0.0%) |
| 6 to 18 Years | 27 (36.0%) | 48 (64.0%) |
| 19 to 25 Years | 0 (0.0%) | 16 (100.0%) |
| 25 to 34 Years | 0 (0.0%) | 19 (100.0%) |
| 35 to 44 Years | 20 (100.0%) | 0 (0.0%) |
| 45 to 54 Years | 0 (0.0%) | 51 (100.0%) |
| 55 to 64 Years | 0 (0.0%) | 24 (100.0%) |
| 65 to 74 Years | 101 (100.0%) | 36 (35.6%) |
| 75 Years and over | 7 (100.0%) | 7 (100.0%) |
| Total | 155 (49.5%) | 201 (64.2%) |
Disability Status by Sex by Age in Midlothian
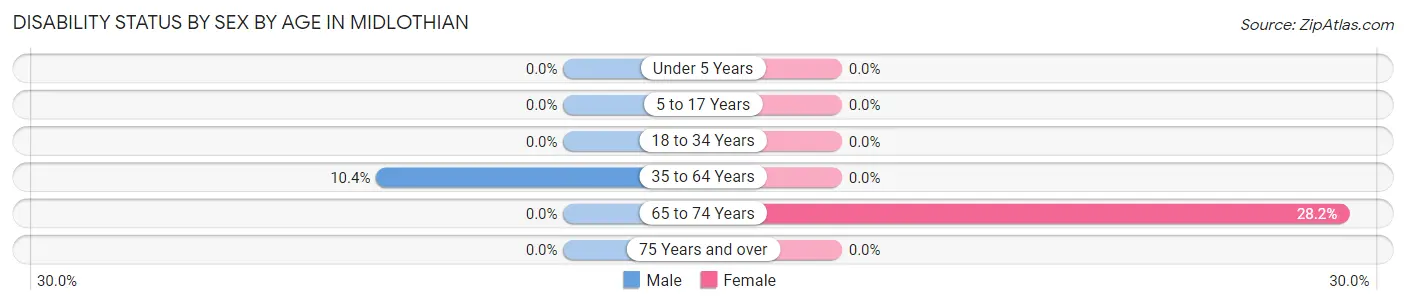
| Age Bracket | Male | Female |
| Under 5 Years | 0 (0.0%) | 0 (0.0%) |
| 5 to 17 Years | 0 (0.0%) | 0 (0.0%) |
| 18 to 34 Years | 0 (0.0%) | 0 (0.0%) |
| 35 to 64 Years | 5 (10.4%) | 0 (0.0%) |
| 65 to 74 Years | 0 (0.0%) | 24 (28.2%) |
| 75 Years and over | 0 (0.0%) | 0 (0.0%) |
Disability Class by Sex by Age in Midlothian
Disability Class: Hearing Difficulty
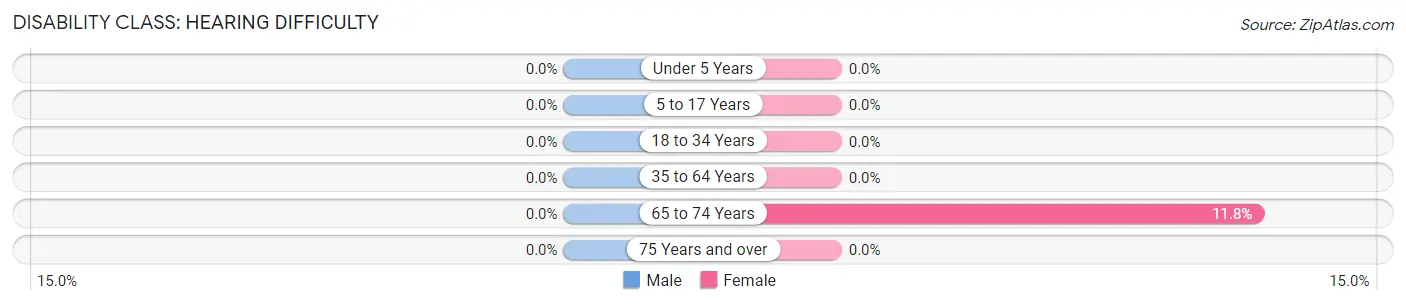
| Age Bracket | Male | Female |
| Under 5 Years | 0 (0.0%) | 0 (0.0%) |
| 5 to 17 Years | 0 (0.0%) | 0 (0.0%) |
| 18 to 34 Years | 0 (0.0%) | 0 (0.0%) |
| 35 to 64 Years | 0 (0.0%) | 0 (0.0%) |
| 65 to 74 Years | 0 (0.0%) | 10 (11.8%) |
| 75 Years and over | 0 (0.0%) | 0 (0.0%) |
Disability Class: Vision Difficulty
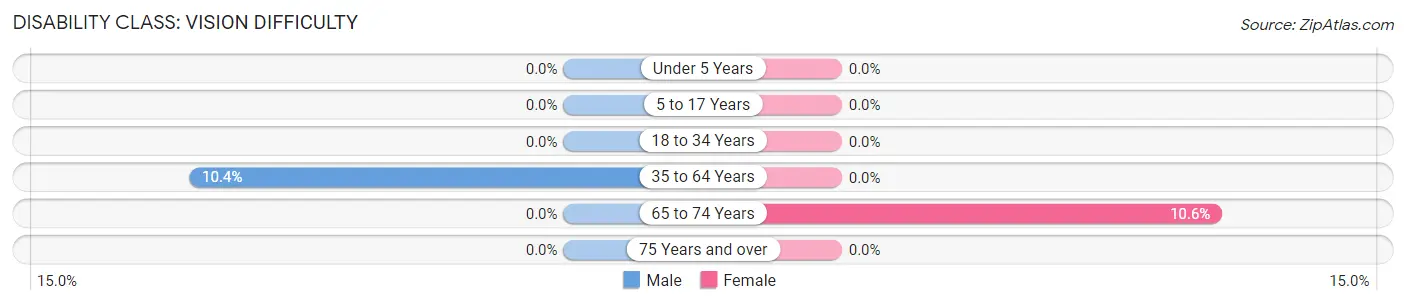
| Age Bracket | Male | Female |
| Under 5 Years | 0 (0.0%) | 0 (0.0%) |
| 5 to 17 Years | 0 (0.0%) | 0 (0.0%) |
| 18 to 34 Years | 0 (0.0%) | 0 (0.0%) |
| 35 to 64 Years | 5 (10.4%) | 0 (0.0%) |
| 65 to 74 Years | 0 (0.0%) | 9 (10.6%) |
| 75 Years and over | 0 (0.0%) | 0 (0.0%) |
Disability Class: Cognitive Difficulty
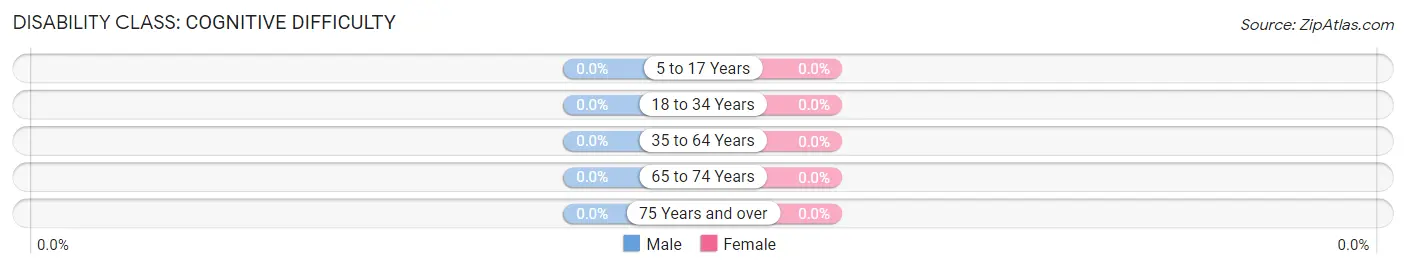
| Age Bracket | Male | Female |
| 5 to 17 Years | 0 (0.0%) | 0 (0.0%) |
| 18 to 34 Years | 0 (0.0%) | 0 (0.0%) |
| 35 to 64 Years | 0 (0.0%) | 0 (0.0%) |
| 65 to 74 Years | 0 (0.0%) | 0 (0.0%) |
| 75 Years and over | 0 (0.0%) | 0 (0.0%) |
Disability Class: Ambulatory Difficulty
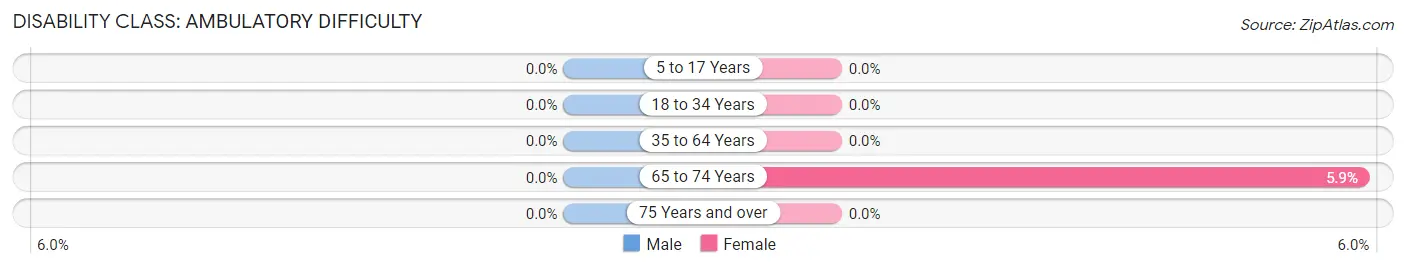
| Age Bracket | Male | Female |
| 5 to 17 Years | 0 (0.0%) | 0 (0.0%) |
| 18 to 34 Years | 0 (0.0%) | 0 (0.0%) |
| 35 to 64 Years | 0 (0.0%) | 0 (0.0%) |
| 65 to 74 Years | 0 (0.0%) | 5 (5.9%) |
| 75 Years and over | 0 (0.0%) | 0 (0.0%) |
Disability Class: Self-Care Difficulty
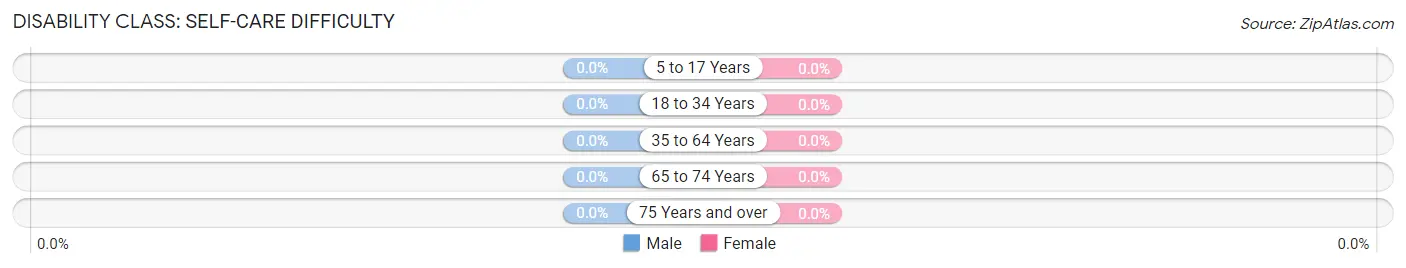
| Age Bracket | Male | Female |
| 5 to 17 Years | 0 (0.0%) | 0 (0.0%) |
| 18 to 34 Years | 0 (0.0%) | 0 (0.0%) |
| 35 to 64 Years | 0 (0.0%) | 0 (0.0%) |
| 65 to 74 Years | 0 (0.0%) | 0 (0.0%) |
| 75 Years and over | 0 (0.0%) | 0 (0.0%) |
Technology Access in Midlothian
Computing Device Access in Midlothian
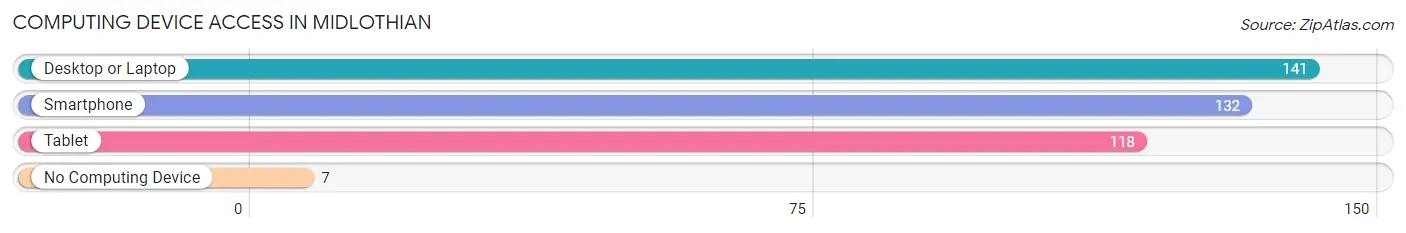
| Device Type | # Households | % Households |
| Desktop or Laptop | 141 | 92.8% |
| Smartphone | 132 | 86.8% |
| Tablet | 118 | 77.6% |
| No Computing Device | 7 | 4.6% |
| Total | 152 | 100.0% |
Internet Access in Midlothian
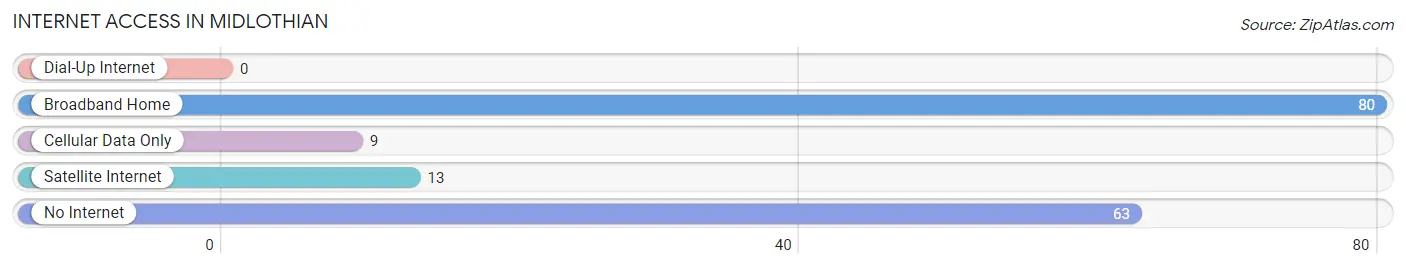
| Internet Type | # Households | % Households |
| Dial-Up Internet | 0 | 0.0% |
| Broadband Home | 80 | 52.6% |
| Cellular Data Only | 9 | 5.9% |
| Satellite Internet | 13 | 8.6% |
| No Internet | 63 | 41.4% |
| Total | 152 | 100.0% |
Midlothian Summary
Midlothian, Maryland is a small town located in the eastern part of the state, in Baltimore County. It is situated on the banks of the Patapsco River, and is bordered by the towns of Ellicott City and Catonsville. The town has a population of approximately 4,000 people, and is home to a variety of businesses, including a number of small shops and restaurants.
History
Midlothian was first settled in the late 1700s by a group of German immigrants. The town was originally known as “Midlothian Village” and was part of Baltimore County. In 1845, the town was officially incorporated as the Town of Midlothian. The town was named after the Midlothian region of Scotland, which was the ancestral home of many of the town’s early settlers.
In the late 1800s, Midlothian was a thriving industrial center, with a number of factories and mills located in the area. The town was also home to a number of coal mines, which provided employment for many of the town’s residents. In the early 1900s, the town began to decline as the coal industry began to decline. By the mid-1900s, the town had become a quiet, rural community.
Geography
Midlothian is located in the eastern part of Baltimore County, in the state of Maryland. The town is situated on the banks of the Patapsco River, and is bordered by the towns of Ellicott City and Catonsville. The town is located approximately 20 miles from downtown Baltimore.
The town has a total area of 1.2 square miles, all of which is land. The town is located at an elevation of approximately 200 feet above sea level. The town is located in a temperate climate zone, with hot, humid summers and cold, wet winters.
Economy
Midlothian’s economy is largely based on small businesses and local services. The town is home to a number of small shops and restaurants, as well as a few larger businesses. The town is also home to a number of professional services, such as lawyers, accountants, and doctors.
The town is also home to a number of manufacturing and industrial businesses, including a number of small factories and mills. The town is also home to a number of coal mines, which provide employment for many of the town’s residents.
Demographics
As of the 2010 census, Midlothian had a population of 4,000 people. The town has a population density of 3,400 people per square mile. The town is approximately 75% white, 15% African American, and 5% Hispanic. The median household income in the town is $50,000, and the median home value is $250,000. The town has a high rate of homeownership, with approximately 80% of the town’s residents owning their own homes.
Common Questions
What is Per Capita Income in Midlothian?
Per Capita income in Midlothian is $31,658.
What is the Median Family Income in Midlothian?
Median Family Income in Midlothian is $73,594.
What is the Median Household income in Midlothian?
Median Household Income in Midlothian is $38,333.
What is Inequality or Gini Index in Midlothian?
Inequality or Gini Index in Midlothian is 0.34.
What is the Total Population of Midlothian?
Total Population of Midlothian is 313.
What is the Total Male Population of Midlothian?
Total Male Population of Midlothian is 143.
What is the Total Female Population of Midlothian?
Total Female Population of Midlothian is 170.
What is the Ratio of Males per 100 Females in Midlothian?
There are 84.12 Males per 100 Females in Midlothian.
What is the Ratio of Females per 100 Males in Midlothian?
There are 118.88 Females per 100 Males in Midlothian.
What is the Median Population Age in Midlothian?
Median Population Age in Midlothian is 47.8 Years.
What is the Average Family Size in Midlothian
Average Family Size in Midlothian is 3.2 People.
What is the Average Household Size in Midlothian
Average Household Size in Midlothian is 2.1 People.
How Large is the Labor Force in Midlothian?
There are 186 People in the Labor Forcein in Midlothian.
What is the Percentage of People in the Labor Force in Midlothian?
69.7% of People are in the Labor Force in Midlothian.
What is the Unemployment Rate in Midlothian?
Unemployment Rate in Midlothian is 40.9%.