Cities with the Highest Percentage of Population Employed in Health Care & Social Assistance in Ohio
RELATED REPORTS & OPTIONS
Health Care & Social Assistance
Ohio
Compare Cities
Map of Cities with the Highest Percentage of Population Employed in Health Care & Social Assistance in Ohio
0.0%
100.0%
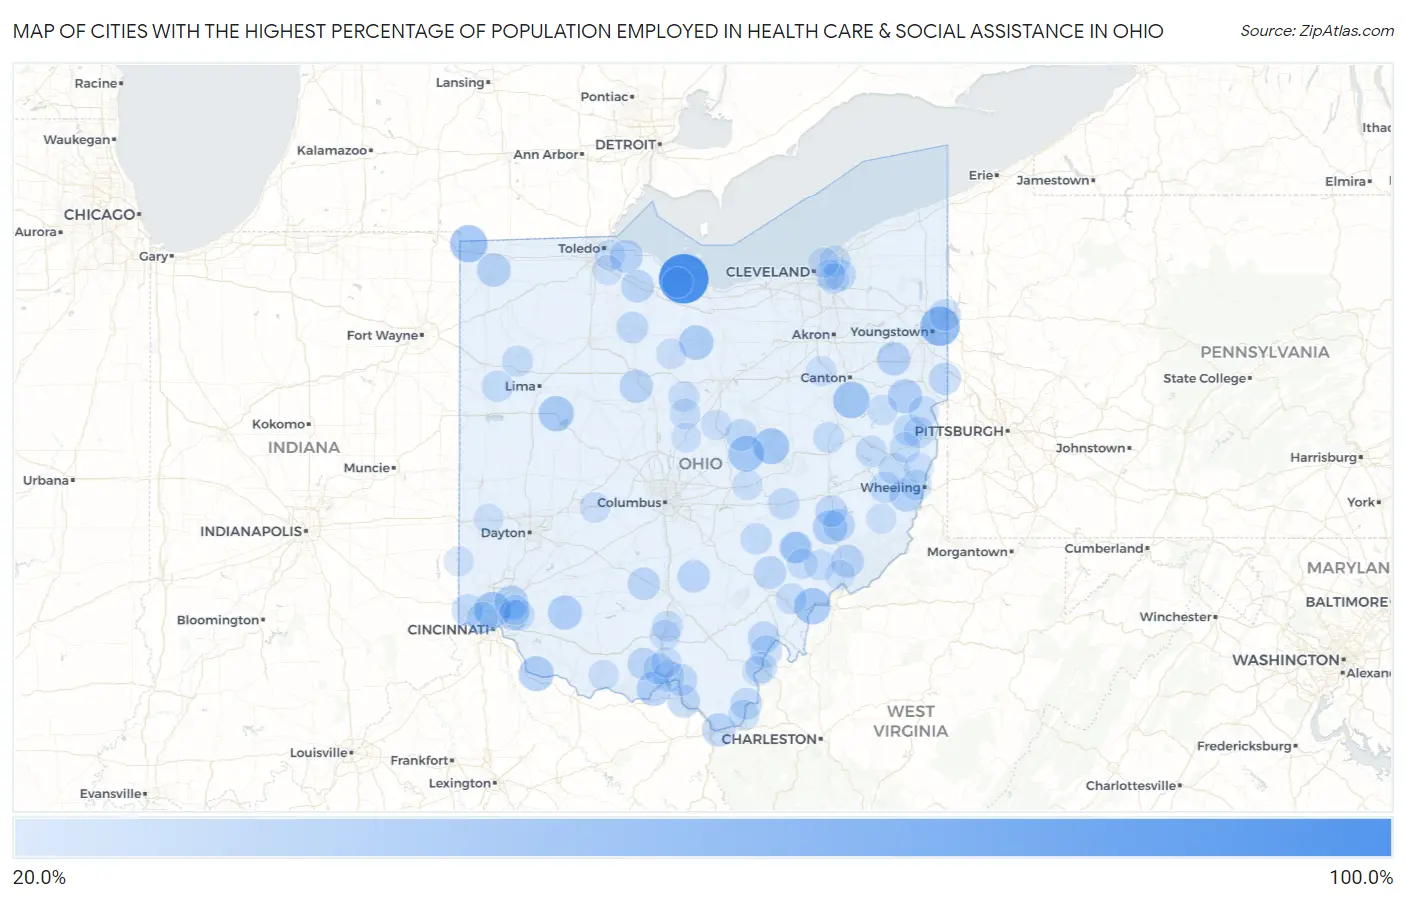
Cities with the Highest Percentage of Population Employed in Health Care & Social Assistance in Ohio
| City | % Employed | vs State | vs National | |
| 1. | Crystal Rock | 100.0% | 15.7%(+84.3)#1 | 13.9%(+86.1)#23 |
| 2. | Maplewood Park | 59.8% | 15.7%(+44.1)#2 | 13.9%(+45.9)#185 |
| 3. | Nettle Lake | 51.4% | 15.7%(+35.8)#3 | 13.9%(+37.5)#299 |
| 4. | Sandyville | 48.7% | 15.7%(+33.0)#4 | 13.9%(+34.8)#367 |
| 5. | East Alliance | 47.9% | 15.7%(+32.2)#5 | 13.9%(+34.0)#375 |
| 6. | Little Hocking | 47.6% | 15.7%(+31.9)#6 | 13.9%(+33.6)#383 |
| 7. | Pleasant Hills | 47.3% | 15.7%(+31.6)#7 | 13.9%(+33.3)#387 |
| 8. | Nellie | 46.4% | 15.7%(+30.7)#8 | 13.9%(+32.5)#414 |
| 9. | Bladensburg | 46.3% | 15.7%(+30.7)#9 | 13.9%(+32.4)#417 |
| 10. | New Hampshire | 43.8% | 15.7%(+28.1)#10 | 13.9%(+29.8)#474 |
| 11. | Chilo | 42.9% | 15.7%(+27.2)#11 | 13.9%(+28.9)#505 |
| 12. | Celeryville | 41.3% | 15.7%(+25.6)#12 | 13.9%(+27.4)#546 |
| 13. | Friendship | 40.6% | 15.7%(+25.0)#13 | 13.9%(+26.7)#565 |
| 14. | Summitville | 40.0% | 15.7%(+24.3)#14 | 13.9%(+26.1)#585 |
| 15. | Belle Valley | 40.0% | 15.7%(+24.3)#15 | 13.9%(+26.1)#589 |
| 16. | St Martin | 40.0% | 15.7%(+24.3)#16 | 13.9%(+26.1)#591 |
| 17. | Brecon | 39.1% | 15.7%(+23.5)#17 | 13.9%(+25.2)#626 |
| 18. | Brandt | 38.9% | 15.7%(+23.2)#18 | 13.9%(+25.0)#641 |
| 19. | Pulaski | 37.2% | 15.7%(+21.5)#19 | 13.9%(+23.3)#723 |
| 20. | Beloit | 37.1% | 15.7%(+21.4)#20 | 13.9%(+23.2)#729 |
| 21. | Glencoe | 36.7% | 15.7%(+21.0)#21 | 13.9%(+22.7)#754 |
| 22. | Harpster | 36.6% | 15.7%(+20.9)#22 | 13.9%(+22.6)#758 |
| 23. | Burlington | 36.5% | 15.7%(+20.8)#23 | 13.9%(+22.6)#766 |
| 24. | Bidwell | 36.4% | 15.7%(+20.8)#24 | 13.9%(+22.5)#770 |
| 25. | Williston | 34.8% | 15.7%(+19.1)#25 | 13.9%(+20.8)#890 |
| 26. | Bolton | 34.7% | 15.7%(+19.1)#26 | 13.9%(+20.8)#901 |
| 27. | Lower Salem | 34.6% | 15.7%(+18.9)#27 | 13.9%(+20.7)#909 |
| 28. | Adelphi | 34.2% | 15.7%(+18.6)#28 | 13.9%(+20.3)#942 |
| 29. | Hessville | 34.1% | 15.7%(+18.5)#29 | 13.9%(+20.2)#949 |
| 30. | Trimble | 34.1% | 15.7%(+18.4)#30 | 13.9%(+20.1)#955 |
| 31. | Franklin Furnace | 33.6% | 15.7%(+17.9)#31 | 13.9%(+19.7)#995 |
| 32. | Frankfort | 33.3% | 15.7%(+17.7)#32 | 13.9%(+19.4)#1,003 |
| 33. | Sarahsville | 32.6% | 15.7%(+16.9)#33 | 13.9%(+18.6)#1,113 |
| 34. | Negley | 32.4% | 15.7%(+16.7)#34 | 13.9%(+18.5)#1,134 |
| 35. | Rutland | 32.1% | 15.7%(+16.4)#35 | 13.9%(+18.1)#1,183 |
| 36. | Otway | 32.0% | 15.7%(+16.3)#36 | 13.9%(+18.1)#1,195 |
| 37. | Masury | 31.6% | 15.7%(+15.9)#37 | 13.9%(+17.7)#1,252 |
| 38. | Howard | 31.5% | 15.7%(+15.9)#38 | 13.9%(+17.6)#1,260 |
| 39. | Cheshire | 31.5% | 15.7%(+15.8)#39 | 13.9%(+17.5)#1,266 |
| 40. | Sciotodale | 31.4% | 15.7%(+15.8)#40 | 13.9%(+17.5)#1,270 |
| 41. | Bascom | 31.1% | 15.7%(+15.5)#41 | 13.9%(+17.2)#1,315 |
| 42. | Pepper Pike | 31.1% | 15.7%(+15.4)#42 | 13.9%(+17.1)#1,324 |
| 43. | Pleasant City | 30.6% | 15.7%(+14.9)#43 | 13.9%(+16.7)#1,372 |
| 44. | Crown City | 30.6% | 15.7%(+14.9)#44 | 13.9%(+16.6)#1,381 |
| 45. | Fort Mckinley | 30.5% | 15.7%(+14.8)#45 | 13.9%(+16.6)#1,389 |
| 46. | Malta | 30.5% | 15.7%(+14.8)#46 | 13.9%(+16.6)#1,391 |
| 47. | Blue Jay | 30.5% | 15.7%(+14.8)#47 | 13.9%(+16.5)#1,395 |
| 48. | Rosemount | 30.4% | 15.7%(+14.7)#48 | 13.9%(+16.4)#1,410 |
| 49. | East Springfield | 30.0% | 15.7%(+14.3)#49 | 13.9%(+16.1)#1,470 |
| 50. | Elgin | 30.0% | 15.7%(+14.3)#50 | 13.9%(+16.1)#1,471 |
| 51. | Pleasant Grove | 30.0% | 15.7%(+14.3)#51 | 13.9%(+16.0)#1,485 |
| 52. | Morristown | 29.9% | 15.7%(+14.2)#52 | 13.9%(+16.0)#1,494 |
| 53. | New Lexington | 29.8% | 15.7%(+14.1)#53 | 13.9%(+15.8)#1,513 |
| 54. | Deersville | 29.6% | 15.7%(+14.0)#54 | 13.9%(+15.7)#1,528 |
| 55. | Kanauga | 29.6% | 15.7%(+13.9)#55 | 13.9%(+15.6)#1,539 |
| 56. | Mcconnelsville | 29.5% | 15.7%(+13.8)#56 | 13.9%(+15.5)#1,561 |
| 57. | Monfort Heights | 29.4% | 15.7%(+13.7)#57 | 13.9%(+15.4)#1,577 |
| 58. | Camp Dennison | 29.3% | 15.7%(+13.6)#58 | 13.9%(+15.3)#1,588 |
| 59. | Richmond Heights | 28.9% | 15.7%(+13.2)#59 | 13.9%(+15.0)#1,657 |
| 60. | New Athens | 28.7% | 15.7%(+13.0)#60 | 13.9%(+14.7)#1,689 |
| 61. | Stewart | 28.6% | 15.7%(+12.9)#61 | 13.9%(+14.6)#1,704 |
| 62. | Mcdermott | 28.5% | 15.7%(+12.8)#62 | 13.9%(+14.6)#1,747 |
| 63. | Richmond | 28.5% | 15.7%(+12.8)#63 | 13.9%(+14.5)#1,753 |
| 64. | Hopedale | 28.4% | 15.7%(+12.8)#64 | 13.9%(+14.5)#1,756 |
| 65. | Stone Creek | 28.4% | 15.7%(+12.7)#65 | 13.9%(+14.4)#1,769 |
| 66. | Lansing | 28.3% | 15.7%(+12.6)#66 | 13.9%(+14.4)#1,782 |
| 67. | Fort Jennings | 28.3% | 15.7%(+12.6)#67 | 13.9%(+14.3)#1,791 |
| 68. | Athalia | 28.1% | 15.7%(+12.4)#68 | 13.9%(+14.2)#1,822 |
| 69. | Waverly | 28.0% | 15.7%(+12.3)#69 | 13.9%(+14.0)#1,843 |
| 70. | The Village Of Indian Hill | 27.5% | 15.7%(+11.8)#70 | 13.9%(+13.6)#1,941 |
| 71. | Irondale | 27.5% | 15.7%(+11.8)#71 | 13.9%(+13.5)#1,949 |
| 72. | Waterford | 27.4% | 15.7%(+11.8)#72 | 13.9%(+13.5)#1,952 |
| 73. | Iberia | 27.3% | 15.7%(+11.7)#73 | 13.9%(+13.4)#1,964 |
| 74. | Highland Hills | 27.3% | 15.7%(+11.6)#74 | 13.9%(+13.4)#1,971 |
| 75. | Whites Landing | 27.0% | 15.7%(+11.4)#75 | 13.9%(+13.1)#2,026 |
| 76. | Mount Gilead | 27.0% | 15.7%(+11.3)#76 | 13.9%(+13.1)#2,036 |
| 77. | Stockport | 26.9% | 15.7%(+11.2)#77 | 13.9%(+12.9)#2,071 |
| 78. | Shaker Heights | 26.7% | 15.7%(+11.0)#78 | 13.9%(+12.8)#2,099 |
| 79. | Northwood | 26.7% | 15.7%(+11.0)#79 | 13.9%(+12.8)#2,101 |
| 80. | Piketon | 26.5% | 15.7%(+10.8)#80 | 13.9%(+12.6)#2,169 |
| 81. | Fredericktown | 26.3% | 15.7%(+10.6)#81 | 13.9%(+12.3)#2,227 |
| 82. | Chatfield | 26.2% | 15.7%(+10.6)#82 | 13.9%(+12.3)#2,232 |
| 83. | Hanover | 26.0% | 15.7%(+10.4)#83 | 13.9%(+12.1)#2,297 |
| 84. | Lucasville | 26.0% | 15.7%(+10.3)#84 | 13.9%(+12.0)#2,310 |
| 85. | Carrollton | 26.0% | 15.7%(+10.3)#85 | 13.9%(+12.0)#2,311 |
| 86. | West Union | 25.9% | 15.7%(+10.3)#86 | 13.9%(+12.0)#2,321 |
| 87. | South Vienna | 25.8% | 15.7%(+10.1)#87 | 13.9%(+11.9)#2,357 |
| 88. | North Lawrence | 25.8% | 15.7%(+10.1)#88 | 13.9%(+11.8)#2,366 |
| 89. | Remington | 25.5% | 15.7%(+9.83)#89 | 13.9%(+11.6)#2,439 |
| 90. | Devola | 25.4% | 15.7%(+9.76)#90 | 13.9%(+11.5)#2,462 |
| 91. | Bratenahl | 25.4% | 15.7%(+9.71)#91 | 13.9%(+11.4)#2,476 |
| 92. | Madison Place | 25.4% | 15.7%(+9.70)#92 | 13.9%(+11.4)#2,479 |
| 93. | Gallipolis | 25.3% | 15.7%(+9.66)#93 | 13.9%(+11.4)#2,487 |
| 94. | Kingsville | 25.2% | 15.7%(+9.57)#94 | 13.9%(+11.3)#2,519 |
| 95. | Stony Ridge | 25.1% | 15.7%(+9.40)#95 | 13.9%(+11.1)#2,569 |
| 96. | College Corner | 25.0% | 15.7%(+9.33)#96 | 13.9%(+11.1)#2,590 |
| 97. | Jerusalem | 25.0% | 15.7%(+9.33)#97 | 13.9%(+11.1)#2,609 |
| 98. | Dillonvale | 24.9% | 15.7%(+9.23)#98 | 13.9%(+11.0)#2,662 |
| 99. | Lewisburg | 24.9% | 15.7%(+9.19)#99 | 13.9%(+10.9)#2,680 |
| 100. | Marengo | 24.8% | 15.7%(+9.18)#100 | 13.9%(+10.9)#2,684 |
Common Questions
What are the Top 10 Cities with the Highest Percentage of Population Employed in Health Care & Social Assistance in Ohio?
Top 10 Cities with the Highest Percentage of Population Employed in Health Care & Social Assistance in Ohio are:
#1
100.0%
#2
59.8%
#3
51.4%
#4
48.7%
#5
47.6%
#6
47.3%
#7
46.4%
#8
46.3%
#9
43.8%
#10
42.9%
What city has the Highest Percentage of Population Employed in Health Care & Social Assistance in Ohio?
Crystal Rock has the Highest Percentage of Population Employed in Health Care & Social Assistance in Ohio with 100.0%.
What is the Percentage of Population Employed in Health Care & Social Assistance in the State of Ohio?
Percentage of Population Employed in Health Care & Social Assistance in Ohio is 15.7%.
What is the Percentage of Population Employed in Health Care & Social Assistance in the United States?
Percentage of Population Employed in Health Care & Social Assistance in the United States is 13.9%.