Cities with the Highest Percentage of Finnish Population in Washington
RELATED REPORTS & OPTIONS
Finnish
Washington
Compare Cities
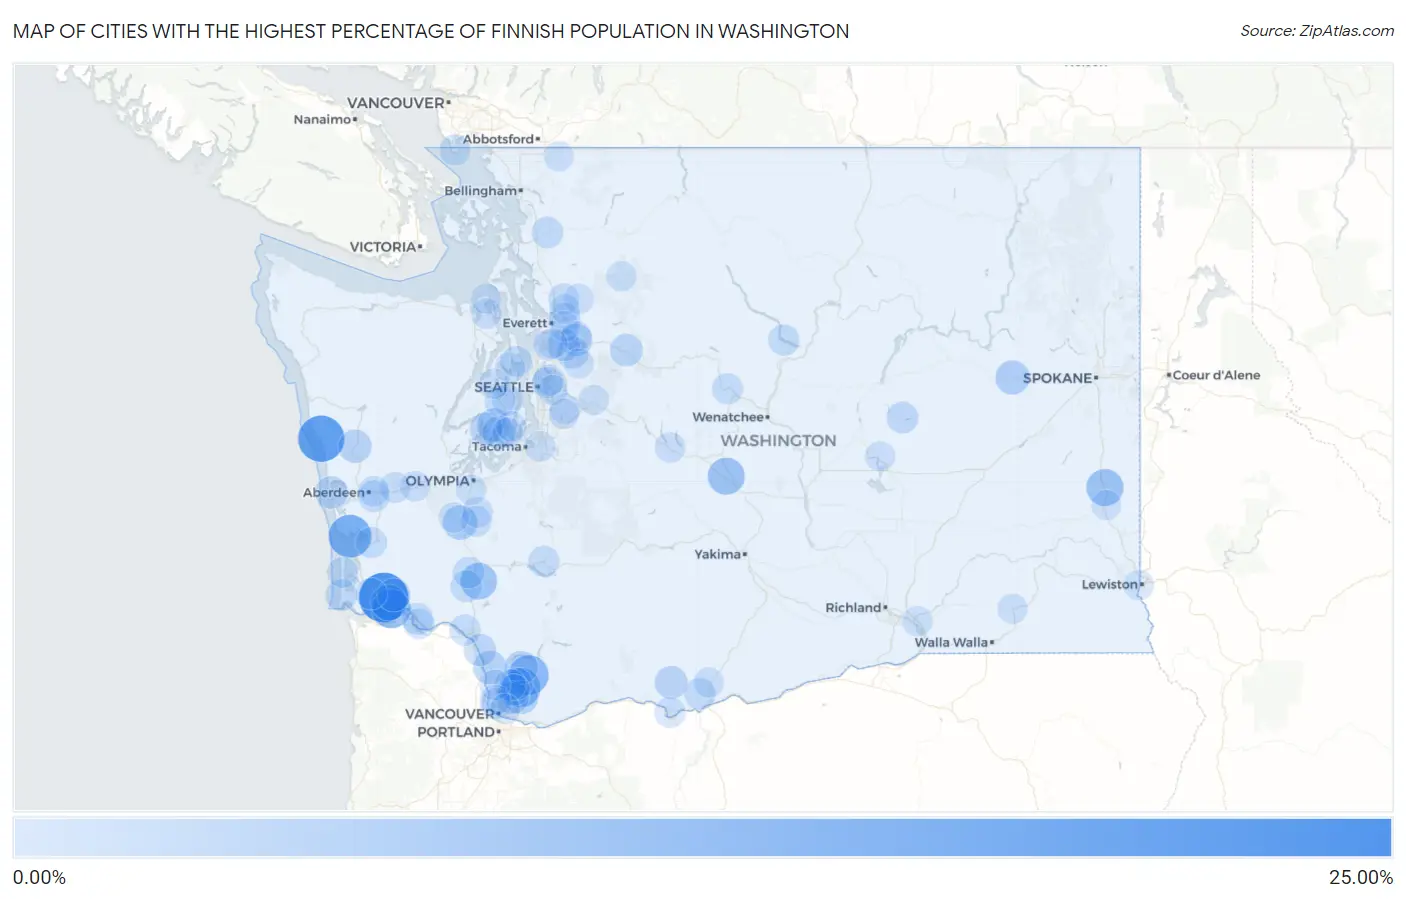
Map of Cities with the Highest Percentage of Finnish Population in Washington
0.00%
25.00%
Cities with the Highest Percentage of Finnish Population in Washington
| City | Finnish | vs State | vs National | |
| 1. | Deep River | 23.90% | 0.61%(+23.3)#1 | 0.19%(+23.7)#46 |
| 2. | Santiago | 20.00% | 0.61%(+19.4)#2 | 0.19%(+19.8)#59 |
| 3. | Tokeland | 15.69% | 0.61%(+15.1)#3 | 0.19%(+15.5)#89 |
| 4. | Yacolt | 12.09% | 0.61%(+11.5)#4 | 0.19%(+11.9)#122 |
| 5. | Altoona | 11.32% | 0.61%(+10.7)#5 | 0.19%(+11.1)#131 |
| 6. | Venersborg | 11.28% | 0.61%(+10.7)#6 | 0.19%(+11.1)#133 |
| 7. | Steptoe | 9.00% | 0.61%(+8.39)#7 | 0.19%(+8.81)#171 |
| 8. | Thorp | 8.89% | 0.61%(+8.28)#8 | 0.19%(+8.70)#175 |
| 9. | Toledo | 8.41% | 0.61%(+7.80)#9 | 0.19%(+8.22)#183 |
| 10. | Rosburg | 7.69% | 0.61%(+7.08)#10 | 0.19%(+7.50)#204 |
| 11. | Grand Mound | 5.96% | 0.61%(+5.34)#11 | 0.19%(+5.77)#258 |
| 12. | Davenport | 5.51% | 0.61%(+4.90)#12 | 0.19%(+5.32)#281 |
| 13. | Beacon Hill | 5.42% | 0.61%(+4.81)#13 | 0.19%(+5.23)#284 |
| 14. | Woodland | 4.86% | 0.61%(+4.24)#14 | 0.19%(+4.67)#310 |
| 15. | Hockinson | 4.82% | 0.61%(+4.20)#15 | 0.19%(+4.63)#315 |
| 16. | Stansberry Lake | 4.75% | 0.61%(+4.14)#16 | 0.19%(+4.56)#324 |
| 17. | Humptulips | 4.49% | 0.61%(+3.88)#17 | 0.19%(+4.30)#341 |
| 18. | Erlands Point | 4.48% | 0.61%(+3.87)#18 | 0.19%(+4.29)#343 |
| 19. | Amboy | 4.40% | 0.61%(+3.79)#19 | 0.19%(+4.21)#347 |
| 20. | Grays River | 4.28% | 0.61%(+3.67)#20 | 0.19%(+4.09)#353 |
| 21. | Raft Island | 4.21% | 0.61%(+3.60)#21 | 0.19%(+4.02)#355 |
| 22. | Klickitat | 4.18% | 0.61%(+3.57)#22 | 0.19%(+3.99)#360 |
| 23. | Brush Prairie | 4.16% | 0.61%(+3.54)#23 | 0.19%(+3.97)#363 |
| 24. | Vaughn | 3.88% | 0.61%(+3.27)#24 | 0.19%(+3.69)#384 |
| 25. | Index | 3.79% | 0.61%(+3.17)#25 | 0.19%(+3.60)#398 |
| 26. | Monroe North | 3.67% | 0.61%(+3.06)#26 | 0.19%(+3.48)#408 |
| 27. | Ocean Shores | 3.51% | 0.61%(+2.90)#27 | 0.19%(+3.32)#420 |
| 28. | Lewisville | 3.40% | 0.61%(+2.78)#28 | 0.19%(+3.21)#434 |
| 29. | Kalama | 3.32% | 0.61%(+2.71)#29 | 0.19%(+3.13)#445 |
| 30. | High Bridge | 3.24% | 0.61%(+2.63)#30 | 0.19%(+3.05)#463 |
| 31. | Cathcart | 3.23% | 0.61%(+2.62)#31 | 0.19%(+3.04)#467 |
| 32. | Wilson Creek | 2.87% | 0.61%(+2.26)#32 | 0.19%(+2.68)#533 |
| 33. | Cherry Grove | 2.85% | 0.61%(+2.24)#33 | 0.19%(+2.66)#537 |
| 34. | Long Beach | 2.79% | 0.61%(+2.17)#34 | 0.19%(+2.60)#544 |
| 35. | Cathlamet | 2.75% | 0.61%(+2.13)#35 | 0.19%(+2.56)#552 |
| 36. | Sunland Estates | 2.73% | 0.61%(+2.11)#36 | 0.19%(+2.54)#558 |
| 37. | Vader | 2.69% | 0.61%(+2.08)#37 | 0.19%(+2.50)#566 |
| 38. | Sedro Woolley | 2.69% | 0.61%(+2.07)#38 | 0.19%(+2.50)#568 |
| 39. | Winlock | 2.66% | 0.61%(+2.04)#39 | 0.19%(+2.47)#580 |
| 40. | Centerville | 2.65% | 0.61%(+2.04)#40 | 0.19%(+2.46)#581 |
| 41. | Cosmopolis | 2.62% | 0.61%(+2.00)#41 | 0.19%(+2.43)#587 |
| 42. | Battle Ground | 2.59% | 0.61%(+1.98)#42 | 0.19%(+2.40)#595 |
| 43. | Naselle | 2.54% | 0.61%(+1.93)#43 | 0.19%(+2.35)#605 |
| 44. | Fairwood Cdp Spokane County | 2.45% | 0.61%(+1.84)#44 | 0.19%(+2.26)#624 |
| 45. | Manson | 2.38% | 0.61%(+1.77)#45 | 0.19%(+2.19)#640 |
| 46. | Longview | 2.36% | 0.61%(+1.75)#46 | 0.19%(+2.17)#642 |
| 47. | Lake Stevens | 2.30% | 0.61%(+1.69)#47 | 0.19%(+2.11)#651 |
| 48. | Hunts Point | 2.17% | 0.61%(+1.55)#48 | 0.19%(+1.98)#692 |
| 49. | Leavenworth | 2.14% | 0.61%(+1.52)#49 | 0.19%(+1.95)#698 |
| 50. | Medina | 2.12% | 0.61%(+1.51)#50 | 0.19%(+1.93)#703 |
| 51. | Morton | 2.10% | 0.61%(+1.49)#51 | 0.19%(+1.91)#714 |
| 52. | Parkwood | 2.08% | 0.61%(+1.47)#52 | 0.19%(+1.89)#719 |
| 53. | Point Roberts | 2.00% | 0.61%(+1.39)#53 | 0.19%(+1.81)#743 |
| 54. | Ocean Park | 1.99% | 0.61%(+1.38)#54 | 0.19%(+1.80)#748 |
| 55. | South Bend | 1.99% | 0.61%(+1.38)#55 | 0.19%(+1.80)#751 |
| 56. | Port Orchard | 1.87% | 0.61%(+1.26)#56 | 0.19%(+1.68)#805 |
| 57. | Martha Lake | 1.79% | 0.61%(+1.18)#57 | 0.19%(+1.60)#842 |
| 58. | Sisco Heights | 1.78% | 0.61%(+1.17)#58 | 0.19%(+1.59)#847 |
| 59. | Bucoda | 1.77% | 0.61%(+1.16)#59 | 0.19%(+1.58)#854 |
| 60. | Tenino | 1.66% | 0.61%(+1.05)#60 | 0.19%(+1.47)#900 |
| 61. | Lake Shore | 1.65% | 0.61%(+1.04)#61 | 0.19%(+1.46)#904 |
| 62. | Montesano | 1.65% | 0.61%(+1.04)#62 | 0.19%(+1.46)#907 |
| 63. | Indianola | 1.63% | 0.61%(+1.02)#63 | 0.19%(+1.44)#914 |
| 64. | Aberdeen | 1.59% | 0.61%(+0.971)#64 | 0.19%(+1.40)#941 |
| 65. | Clear Lake Cdp Pierce County | 1.56% | 0.61%(+0.942)#65 | 0.19%(+1.37)#957 |
| 66. | Dallesport | 1.54% | 0.61%(+0.929)#66 | 0.19%(+1.35)#965 |
| 67. | Easton | 1.52% | 0.61%(+0.911)#67 | 0.19%(+1.33)#980 |
| 68. | East Renton Highlands | 1.46% | 0.61%(+0.843)#68 | 0.19%(+1.27)#1,030 |
| 69. | Bunk Foss | 1.46% | 0.61%(+0.843)#69 | 0.19%(+1.27)#1,031 |
| 70. | Ridgefield | 1.42% | 0.61%(+0.805)#70 | 0.19%(+1.23)#1,061 |
| 71. | Puget Island | 1.42% | 0.61%(+0.805)#71 | 0.19%(+1.23)#1,062 |
| 72. | Port Hadlock Irondale | 1.41% | 0.61%(+0.799)#72 | 0.19%(+1.22)#1,071 |
| 73. | Felida | 1.38% | 0.61%(+0.765)#73 | 0.19%(+1.19)#1,094 |
| 74. | Elma | 1.37% | 0.61%(+0.758)#74 | 0.19%(+1.18)#1,098 |
| 75. | Milton | 1.36% | 0.61%(+0.744)#75 | 0.19%(+1.17)#1,110 |
| 76. | Maplewood | 1.34% | 0.61%(+0.727)#76 | 0.19%(+1.15)#1,129 |
| 77. | Snoqualmie | 1.33% | 0.61%(+0.716)#77 | 0.19%(+1.14)#1,136 |
| 78. | Chain Lake | 1.31% | 0.61%(+0.694)#78 | 0.19%(+1.12)#1,152 |
| 79. | Chico | 1.30% | 0.61%(+0.687)#79 | 0.19%(+1.11)#1,158 |
| 80. | Tumwater | 1.25% | 0.61%(+0.635)#80 | 0.19%(+1.06)#1,193 |
| 81. | Canyon Creek | 1.21% | 0.61%(+0.598)#81 | 0.19%(+1.02)#1,225 |
| 82. | Port Townsend | 1.21% | 0.61%(+0.597)#82 | 0.19%(+1.02)#1,226 |
| 83. | Moses Lake North | 1.21% | 0.61%(+0.596)#83 | 0.19%(+1.02)#1,227 |
| 84. | Duvall | 1.21% | 0.61%(+0.592)#84 | 0.19%(+1.02)#1,233 |
| 85. | Rochester | 1.19% | 0.61%(+0.580)#85 | 0.19%(+1.00)#1,250 |
| 86. | Mill Creek | 1.17% | 0.61%(+0.555)#86 | 0.19%(+0.979)#1,272 |
| 87. | Clarkston | 1.16% | 0.61%(+0.549)#87 | 0.19%(+0.973)#1,278 |
| 88. | Beaux Arts Village | 1.16% | 0.61%(+0.549)#88 | 0.19%(+0.973)#1,280 |
| 89. | Goldendale | 1.13% | 0.61%(+0.517)#89 | 0.19%(+0.941)#1,303 |
| 90. | Minnehaha | 1.13% | 0.61%(+0.517)#90 | 0.19%(+0.941)#1,304 |
| 91. | Burbank | 1.12% | 0.61%(+0.509)#91 | 0.19%(+0.933)#1,312 |
| 92. | Lake Cassidy | 1.11% | 0.61%(+0.501)#92 | 0.19%(+0.924)#1,320 |
| 93. | Tehaleh | 1.09% | 0.61%(+0.481)#93 | 0.19%(+0.905)#1,345 |
| 94. | Maple Heights Lake Desire | 1.08% | 0.61%(+0.463)#94 | 0.19%(+0.887)#1,377 |
| 95. | Peaceful Valley | 1.07% | 0.61%(+0.454)#95 | 0.19%(+0.878)#1,388 |
| 96. | Suquamish | 1.06% | 0.61%(+0.449)#96 | 0.19%(+0.873)#1,393 |
| 97. | Gig Harbor | 1.06% | 0.61%(+0.444)#97 | 0.19%(+0.867)#1,398 |
| 98. | Darrington | 1.05% | 0.61%(+0.441)#98 | 0.19%(+0.864)#1,400 |
| 99. | Waitsburg | 1.05% | 0.61%(+0.432)#99 | 0.19%(+0.856)#1,410 |
| 100. | Colfax | 1.04% | 0.61%(+0.422)#100 | 0.19%(+0.846)#1,421 |
Common Questions
What are the Top 10 Cities with the Highest Percentage of Finnish Population in Washington?
Top 10 Cities with the Highest Percentage of Finnish Population in Washington are:
#1
23.90%
#2
20.00%
#3
15.69%
#4
12.09%
#5
11.32%
#6
11.28%
#7
9.00%
#8
8.89%
#9
8.41%
#10
7.69%
What city has the Highest Percentage of Finnish Population in Washington?
Deep River has the Highest Percentage of Finnish Population in Washington with 23.90%.
What is the Percentage of Finnish Population in the State of Washington?
Percentage of Finnish Population in Washington is 0.61%.
What is the Percentage of Finnish Population in the United States?
Percentage of Finnish Population in the United States is 0.19%.