Spencer, MA Map & Demographics
Spencer Map
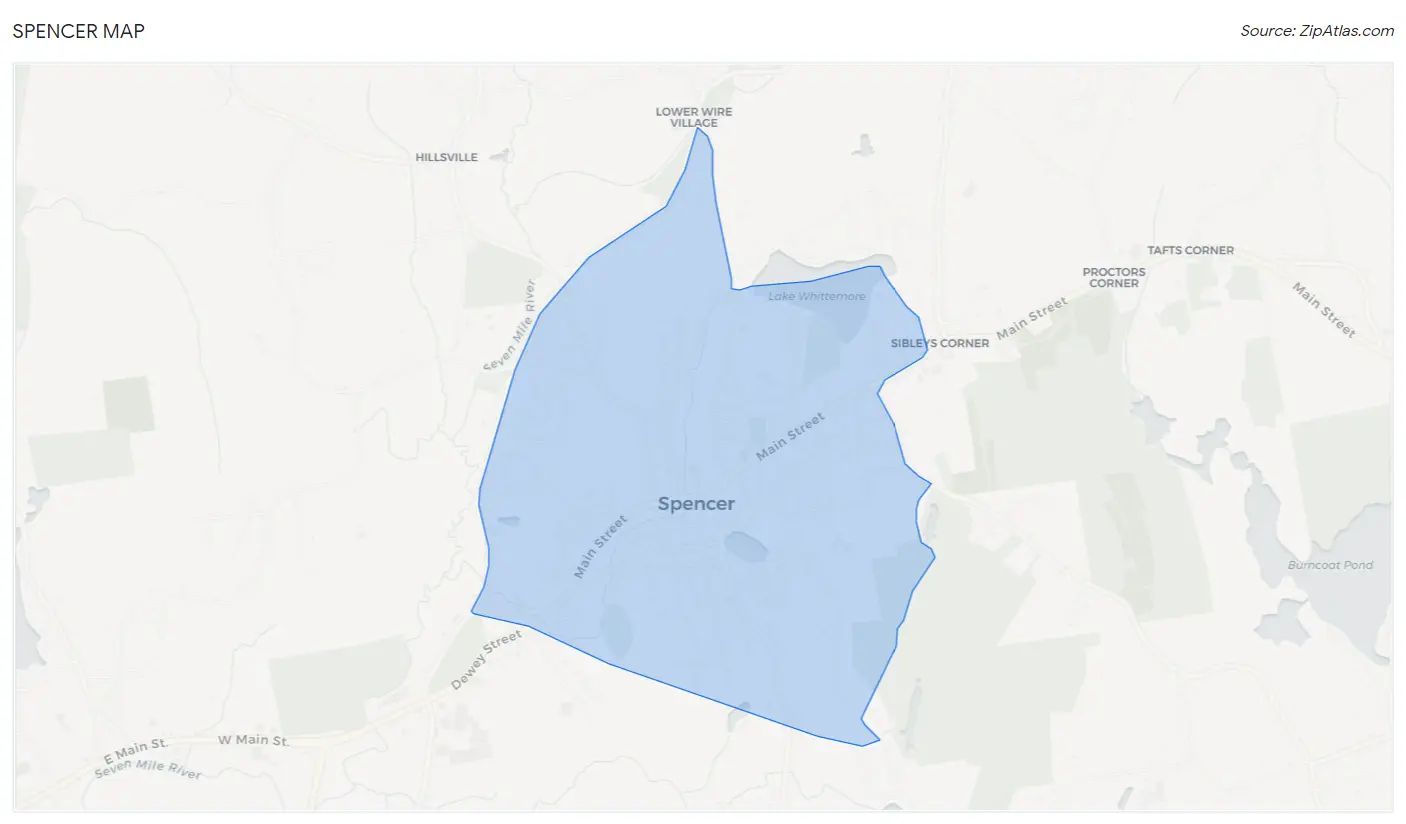
Spencer Overview
$36,976
PER CAPITA INCOME
$79,732
AVG FAMILY INCOME
$58,898
AVG HOUSEHOLD INCOME
6.6%
WAGE / INCOME GAP [ % ]
93.4¢/ $1
WAGE / INCOME GAP [ $ ]
0.46
INEQUALITY / GINI INDEX
5,637
TOTAL POPULATION
3,056
MALE POPULATION
2,581
FEMALE POPULATION
118.40
MALES / 100 FEMALES
84.46
FEMALES / 100 MALES
49.7
MEDIAN AGE
2.9
AVG FAMILY SIZE
2.1
AVG HOUSEHOLD SIZE
3,079
LABOR FORCE [ PEOPLE ]
60.8%
PERCENT IN LABOR FORCE
7.9%
UNEMPLOYMENT RATE
Spencer Zip Codes
Income in Spencer
Income Overview in Spencer
Per Capita Income in Spencer is $36,976, while median incomes of families and households are $79,732 and $58,898 respectively.
| Characteristic | Number | Measure |
| Per Capita Income | 5,637 | $36,976 |
| Median Family Income | 1,374 | $79,732 |
| Mean Family Income | 1,374 | $110,289 |
| Median Household Income | 2,643 | $58,898 |
| Mean Household Income | 2,643 | $76,399 |
| Income Deficit | 1,374 | $0 |
| Wage / Income Gap (%) | 5,637 | 6.63% |
| Wage / Income Gap ($) | 5,637 | 93.37¢ per $1 |
| Gini / Inequality Index | 5,637 | 0.46 |
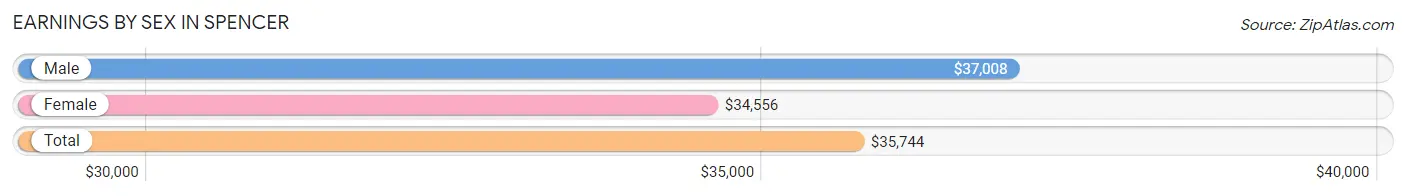
Earnings by Sex in Spencer
Average Earnings in Spencer are $35,744, $37,008 for men and $34,556 for women, a difference of 6.6%.
| Sex | Number | Average Earnings |
| Male | 1,487 (48.9%) | $37,008 |
| Female | 1,551 (51.0%) | $34,556 |
| Total | 3,038 (100.0%) | $35,744 |
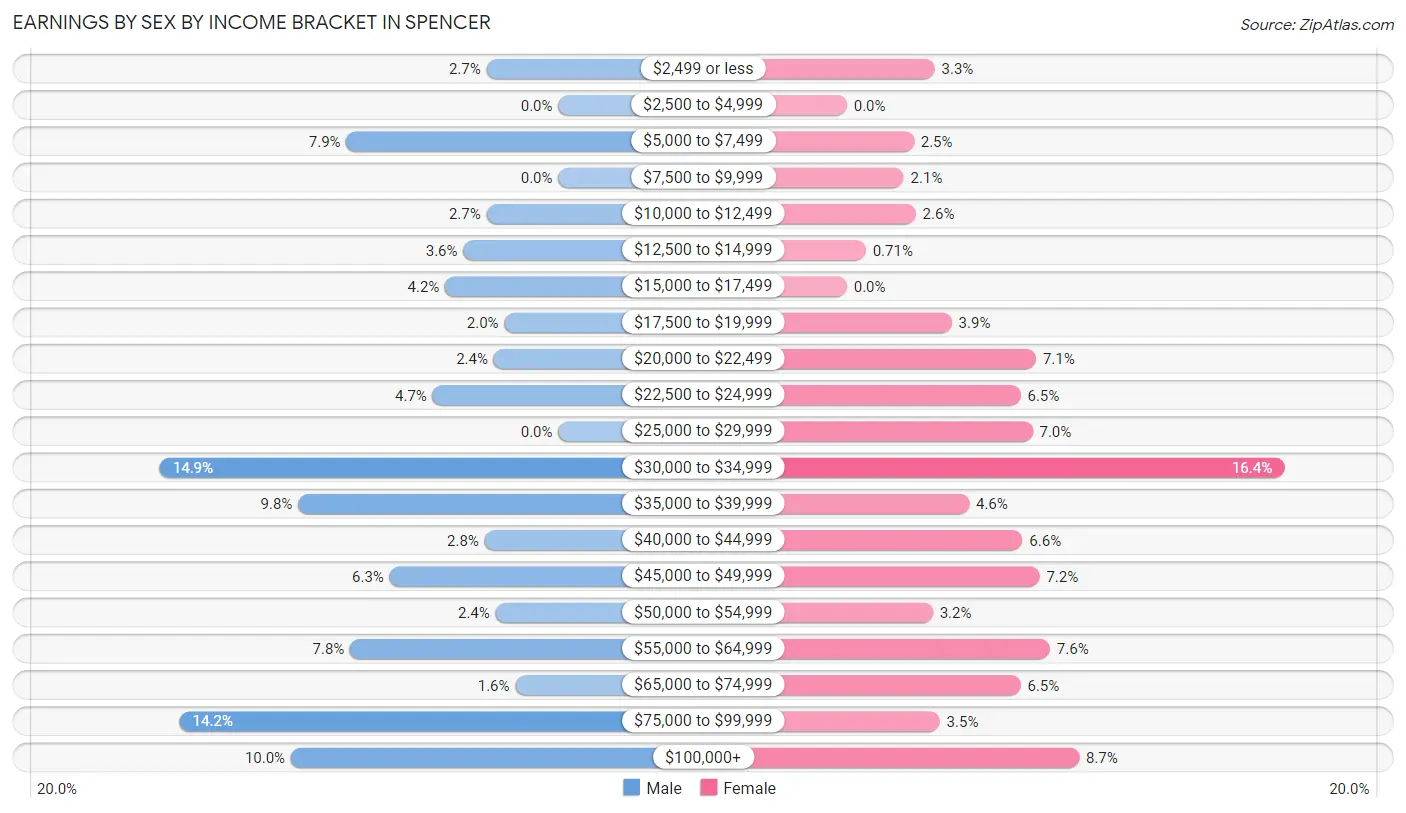
Earnings by Sex by Income Bracket in Spencer
The most common earnings brackets in Spencer are $30,000 to $34,999 for men (222 | 14.9%) and $30,000 to $34,999 for women (254 | 16.4%).
| Income | Male | Female |
| $2,499 or less | 40 (2.7%) | 51 (3.3%) |
| $2,500 to $4,999 | 0 (0.0%) | 0 (0.0%) |
| $5,000 to $7,499 | 118 (7.9%) | 39 (2.5%) |
| $7,500 to $9,999 | 0 (0.0%) | 33 (2.1%) |
| $10,000 to $12,499 | 40 (2.7%) | 40 (2.6%) |
| $12,500 to $14,999 | 53 (3.6%) | 11 (0.7%) |
| $15,000 to $17,499 | 63 (4.2%) | 0 (0.0%) |
| $17,500 to $19,999 | 30 (2.0%) | 61 (3.9%) |
| $20,000 to $22,499 | 36 (2.4%) | 110 (7.1%) |
| $22,500 to $24,999 | 70 (4.7%) | 101 (6.5%) |
| $25,000 to $29,999 | 0 (0.0%) | 108 (7.0%) |
| $30,000 to $34,999 | 222 (14.9%) | 254 (16.4%) |
| $35,000 to $39,999 | 145 (9.8%) | 71 (4.6%) |
| $40,000 to $44,999 | 41 (2.8%) | 102 (6.6%) |
| $45,000 to $49,999 | 94 (6.3%) | 112 (7.2%) |
| $50,000 to $54,999 | 35 (2.4%) | 50 (3.2%) |
| $55,000 to $64,999 | 116 (7.8%) | 118 (7.6%) |
| $65,000 to $74,999 | 24 (1.6%) | 101 (6.5%) |
| $75,000 to $99,999 | 211 (14.2%) | 54 (3.5%) |
| $100,000+ | 149 (10.0%) | 135 (8.7%) |
| Total | 1,487 (100.0%) | 1,551 (100.0%) |
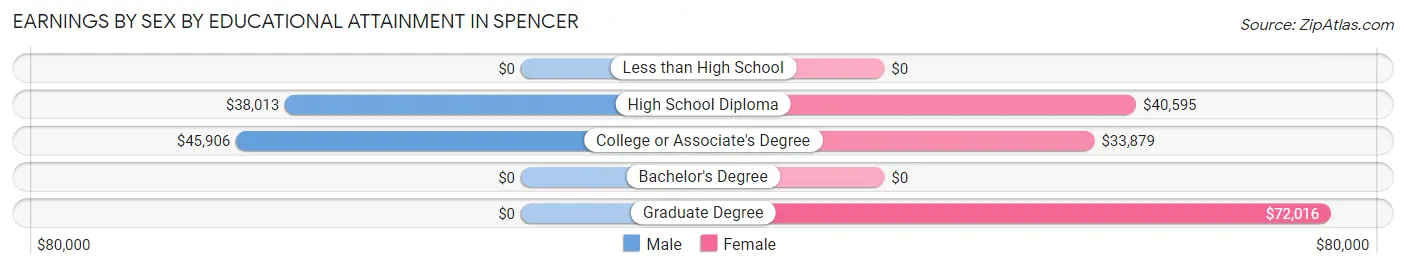
Earnings by Sex by Educational Attainment in Spencer
Average earnings in Spencer are $38,929 for men and $37,143 for women, a difference of 4.6%. Men with an educational attainment of college or associate's degree enjoy the highest average annual earnings of $45,906, while those with high school diploma education earn the least with $38,013. Women with an educational attainment of graduate degree earn the most with the average annual earnings of $72,016, while those with college or associate's degree education have the smallest earnings of $33,879.
| Educational Attainment | Male Income | Female Income |
| Less than High School | - | - |
| High School Diploma | $38,013 | $40,595 |
| College or Associate's Degree | $45,906 | $33,879 |
| Bachelor's Degree | - | - |
| Graduate Degree | - | - |
| Total | $38,929 | $37,143 |
Family Income in Spencer
Family Income Brackets in Spencer
According to the Spencer family income data, there are 379 families falling into the $50,000 to $74,999 income range, which is the most common income bracket and makes up 27.6% of all families.
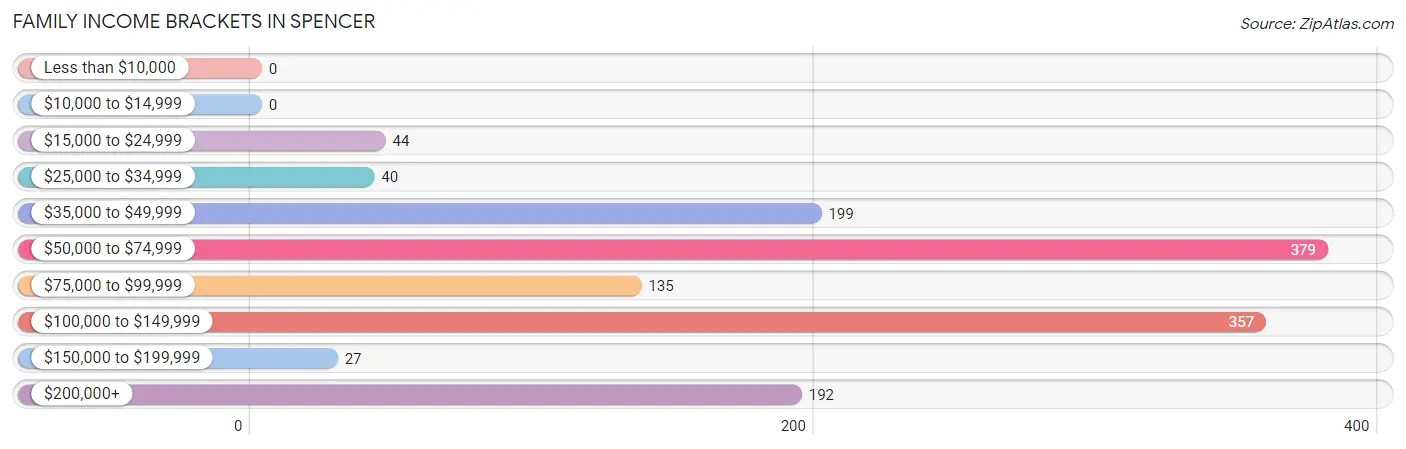
| Income Bracket | # Families | % Families |
| Less than $10,000 | 0 | 0.0% |
| $10,000 to $14,999 | 0 | 0.0% |
| $15,000 to $24,999 | 44 | 3.2% |
| $25,000 to $34,999 | 40 | 2.9% |
| $35,000 to $49,999 | 199 | 14.5% |
| $50,000 to $74,999 | 379 | 27.6% |
| $75,000 to $99,999 | 135 | 9.8% |
| $100,000 to $149,999 | 357 | 26.0% |
| $150,000 to $199,999 | 27 | 2.0% |
| $200,000+ | 192 | 14.0% |
Family Income by Famaliy Size in Spencer
3-person families (294 | 21.4%) account for the highest median family income in Spencer with $132,823 per family, while 3-person families (294 | 21.4%) have the highest median income of $44,274 per family member.
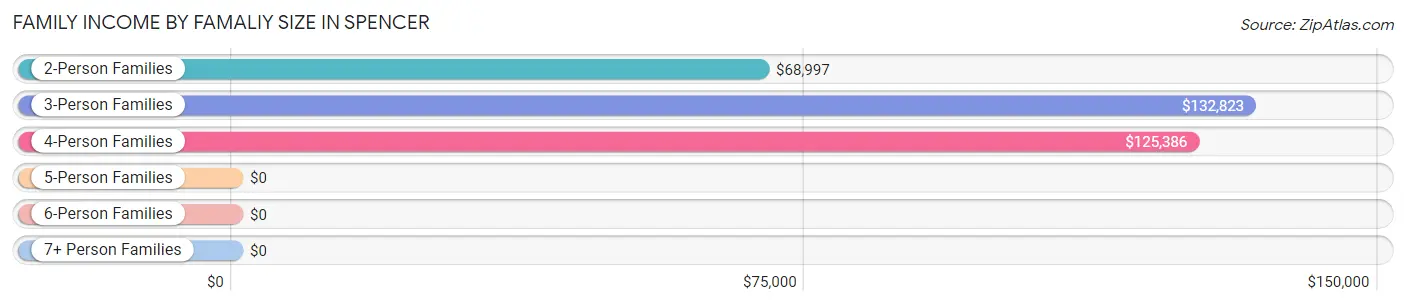
| Income Bracket | # Families | Median Income |
| 2-Person Families | 716 (52.1%) | $68,997 |
| 3-Person Families | 294 (21.4%) | $132,823 |
| 4-Person Families | 311 (22.6%) | $125,386 |
| 5-Person Families | 53 (3.9%) | $0 |
| 6-Person Families | 0 (0.0%) | $0 |
| 7+ Person Families | 0 (0.0%) | $0 |
| Total | 1,374 (100.0%) | $79,732 |
Family Income by Number of Earners in Spencer
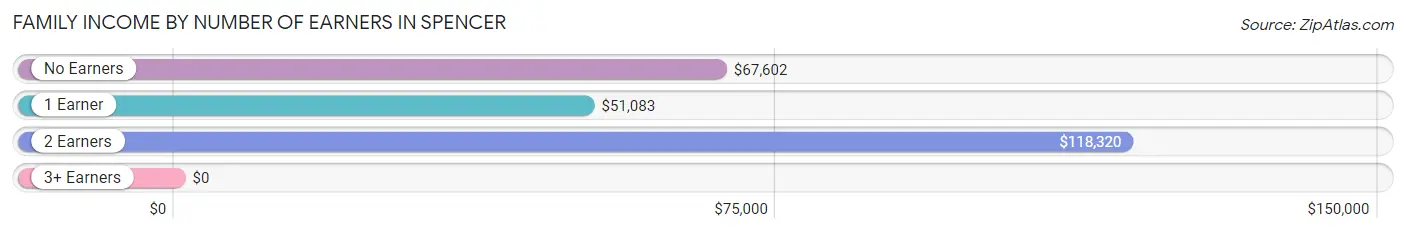
| Number of Earners | # Families | Median Income |
| No Earners | 236 (17.2%) | $67,602 |
| 1 Earner | 377 (27.4%) | $51,083 |
| 2 Earners | 558 (40.6%) | $118,320 |
| 3+ Earners | 203 (14.8%) | $0 |
| Total | 1,374 (100.0%) | $79,732 |
Household Income in Spencer
Household Income Brackets in Spencer
With 484 households falling in the category, the $50,000 to $74,999 income range is the most frequent in Spencer, accounting for 18.3% of all households. In contrast, only 29 households (1.1%) fall into the $150,000 to $199,999 income bracket, making it the least populous group.
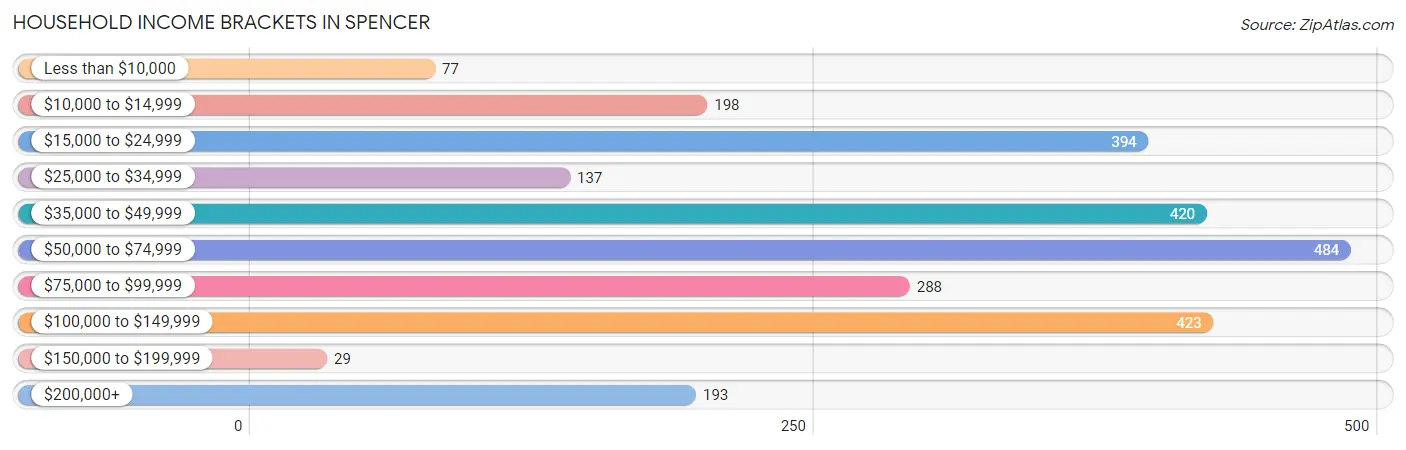
| Income Bracket | # Households | % Households |
| Less than $10,000 | 77 | 2.9% |
| $10,000 to $14,999 | 198 | 7.5% |
| $15,000 to $24,999 | 394 | 14.9% |
| $25,000 to $34,999 | 137 | 5.2% |
| $35,000 to $49,999 | 420 | 15.9% |
| $50,000 to $74,999 | 484 | 18.3% |
| $75,000 to $99,999 | 288 | 10.9% |
| $100,000 to $149,999 | 423 | 16.0% |
| $150,000 to $199,999 | 29 | 1.1% |
| $200,000+ | 193 | 7.3% |
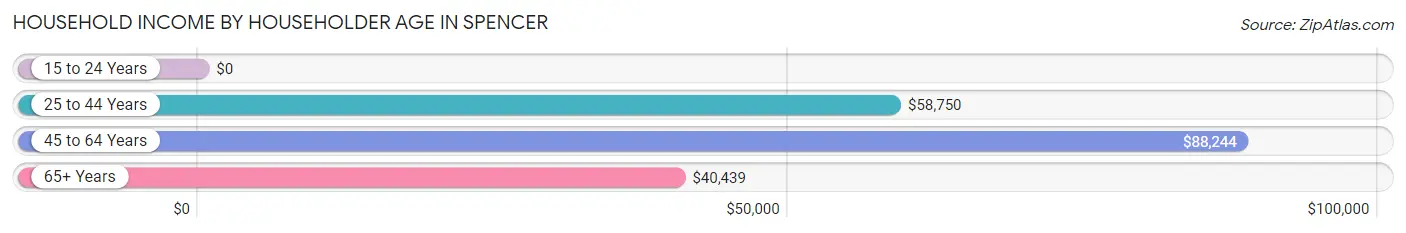
Household Income by Householder Age in Spencer
The median household income in Spencer is $58,898, with the highest median household income of $88,244 found in the 45 to 64 years age bracket for the primary householder. A total of 977 households (37.0%) fall into this category. Meanwhile, the 15 to 24 years age bracket for the primary householder has the lowest median household income of $0, with 34 households (1.3%) in this group.
| Income Bracket | # Households | Median Income |
| 15 to 24 Years | 34 (1.3%) | $0 |
| 25 to 44 Years | 542 (20.5%) | $58,750 |
| 45 to 64 Years | 977 (37.0%) | $88,244 |
| 65+ Years | 1,090 (41.2%) | $40,439 |
| Total | 2,643 (100.0%) | $58,898 |
Poverty in Spencer
Income Below Poverty by Sex and Age in Spencer
With 10.0% poverty level for males and 6.0% for females among the residents of Spencer, 75 year old and over males and 75 year old and over females are the most vulnerable to poverty, with 101 males (45.5%) and 79 females (21.5%) in their respective age groups living below the poverty level.
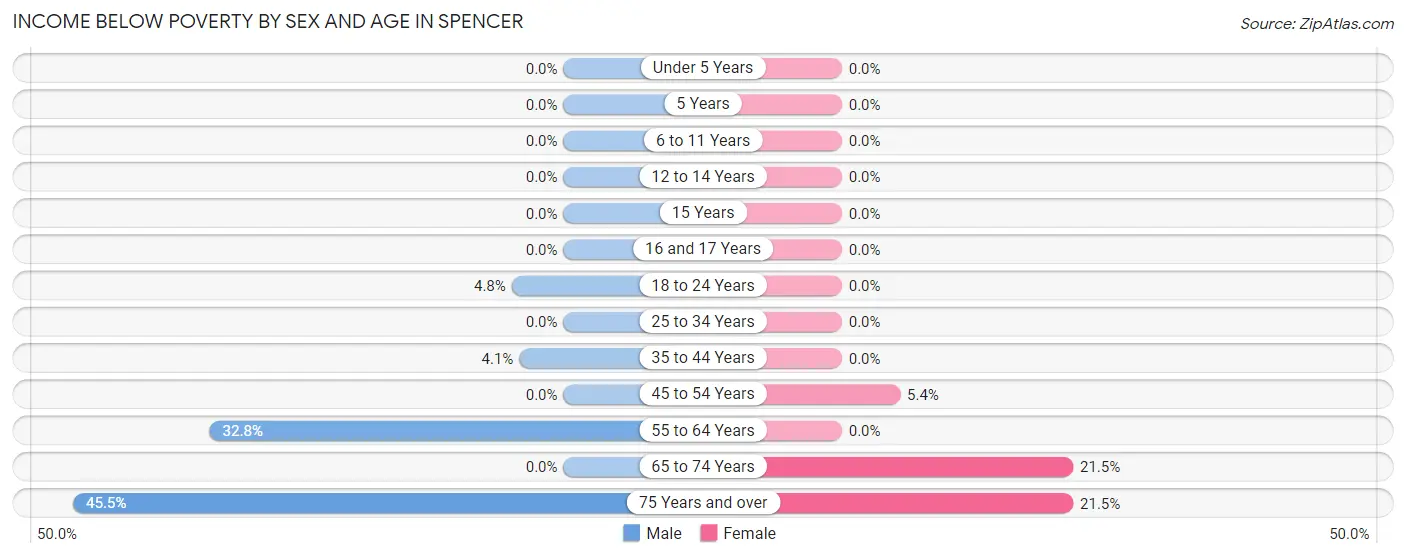
| Age Bracket | Male | Female |
| Under 5 Years | 0 (0.0%) | 0 (0.0%) |
| 5 Years | 0 (0.0%) | 0 (0.0%) |
| 6 to 11 Years | 0 (0.0%) | 0 (0.0%) |
| 12 to 14 Years | 0 (0.0%) | 0 (0.0%) |
| 15 Years | 0 (0.0%) | 0 (0.0%) |
| 16 and 17 Years | 0 (0.0%) | 0 (0.0%) |
| 18 to 24 Years | 18 (4.8%) | 0 (0.0%) |
| 25 to 34 Years | 0 (0.0%) | 0 (0.0%) |
| 35 to 44 Years | 16 (4.1%) | 0 (0.0%) |
| 45 to 54 Years | 0 (0.0%) | 21 (5.4%) |
| 55 to 64 Years | 170 (32.8%) | 0 (0.0%) |
| 65 to 74 Years | 0 (0.0%) | 56 (21.5%) |
| 75 Years and over | 101 (45.5%) | 79 (21.5%) |
| Total | 305 (10.0%) | 156 (6.0%) |
Income Above Poverty by Sex and Age in Spencer
According to the poverty statistics in Spencer, males aged under 5 years and females aged 5 years are the age groups that are most secure financially, with 100.0% of males and 100.0% of females in these age groups living above the poverty line.
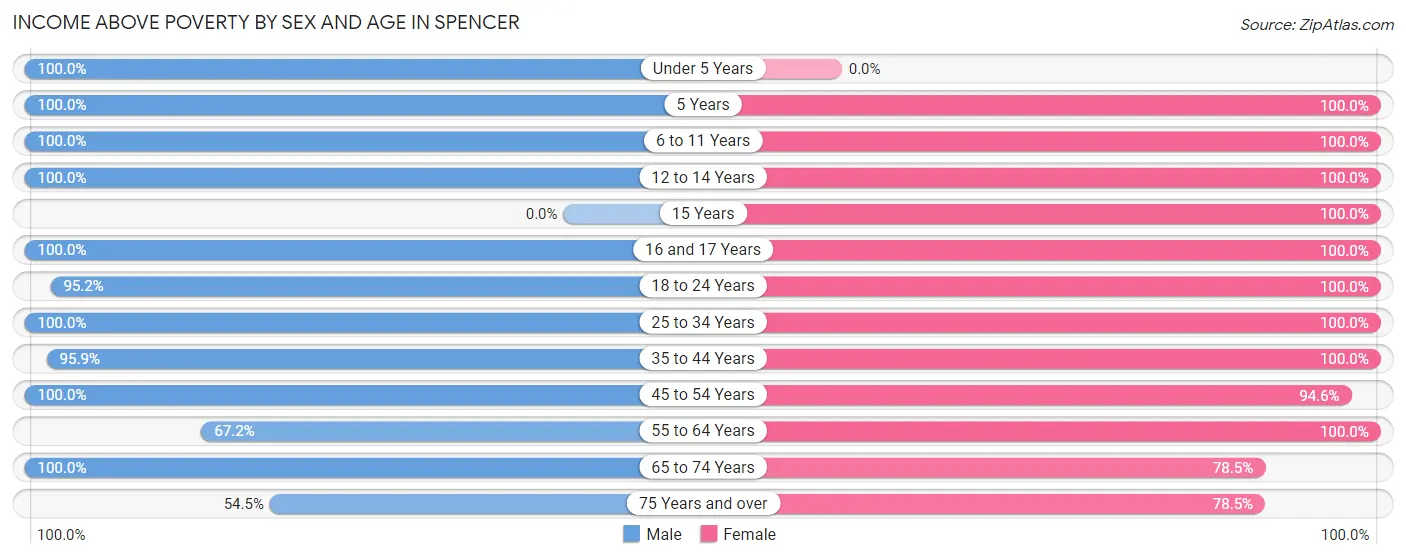
| Age Bracket | Male | Female |
| Under 5 Years | 24 (100.0%) | 0 (0.0%) |
| 5 Years | 32 (100.0%) | 31 (100.0%) |
| 6 to 11 Years | 137 (100.0%) | 137 (100.0%) |
| 12 to 14 Years | 138 (100.0%) | 40 (100.0%) |
| 15 Years | 0 (0.0%) | 34 (100.0%) |
| 16 and 17 Years | 110 (100.0%) | 40 (100.0%) |
| 18 to 24 Years | 357 (95.2%) | 137 (100.0%) |
| 25 to 34 Years | 289 (100.0%) | 268 (100.0%) |
| 35 to 44 Years | 374 (95.9%) | 312 (100.0%) |
| 45 to 54 Years | 275 (100.0%) | 367 (94.6%) |
| 55 to 64 Years | 348 (67.2%) | 565 (100.0%) |
| 65 to 74 Years | 546 (100.0%) | 205 (78.5%) |
| 75 Years and over | 121 (54.5%) | 289 (78.5%) |
| Total | 2,751 (90.0%) | 2,425 (94.0%) |
Income Below Poverty Among Married-Couple Families in Spencer
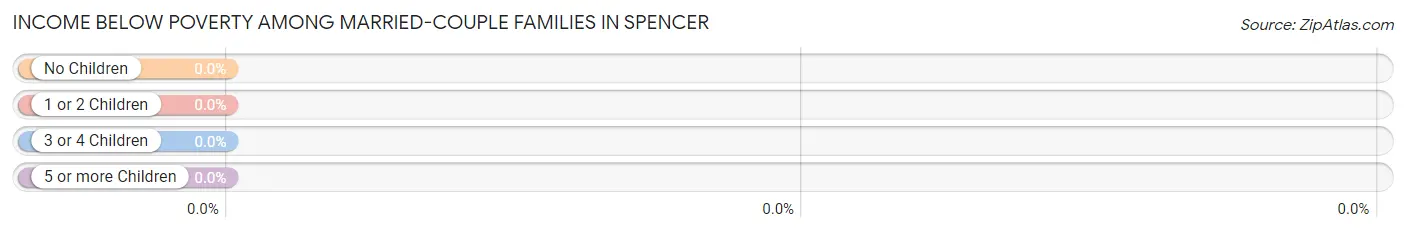
| Children | Above Poverty | Below Poverty |
| No Children | 705 (100.0%) | 0 (0.0%) |
| 1 or 2 Children | 247 (100.0%) | 0 (0.0%) |
| 3 or 4 Children | 16 (100.0%) | 0 (0.0%) |
| 5 or more Children | 0 (0.0%) | 0 (0.0%) |
| Total | 968 (100.0%) | 0 (0.0%) |
Income Below Poverty Among Single-Parent Households in Spencer
| Children | Single Father | Single Mother |
| No Children | 0 (0.0%) | 0 (0.0%) |
| 1 or 2 Children | 0 (0.0%) | 0 (0.0%) |
| 3 or 4 Children | 0 (0.0%) | 0 (0.0%) |
| 5 or more Children | 0 (0.0%) | 0 (0.0%) |
| Total | 0 (0.0%) | 0 (0.0%) |
Income Below Poverty Among Married-Couple vs Single-Parent Households in Spencer
| Children | Married-Couple Families | Single-Parent Households |
| No Children | 0 (0.0%) | 0 (0.0%) |
| 1 or 2 Children | 0 (0.0%) | 0 (0.0%) |
| 3 or 4 Children | 0 (0.0%) | 0 (0.0%) |
| 5 or more Children | 0 (0.0%) | 0 (0.0%) |
| Total | 0 (0.0%) | 0 (0.0%) |
Race in Spencer
The most populous races in Spencer are White / Caucasian (5,212 | 92.5%), Two or more Races (280 | 5.0%), and Hispanic or Latino (205 | 3.6%).
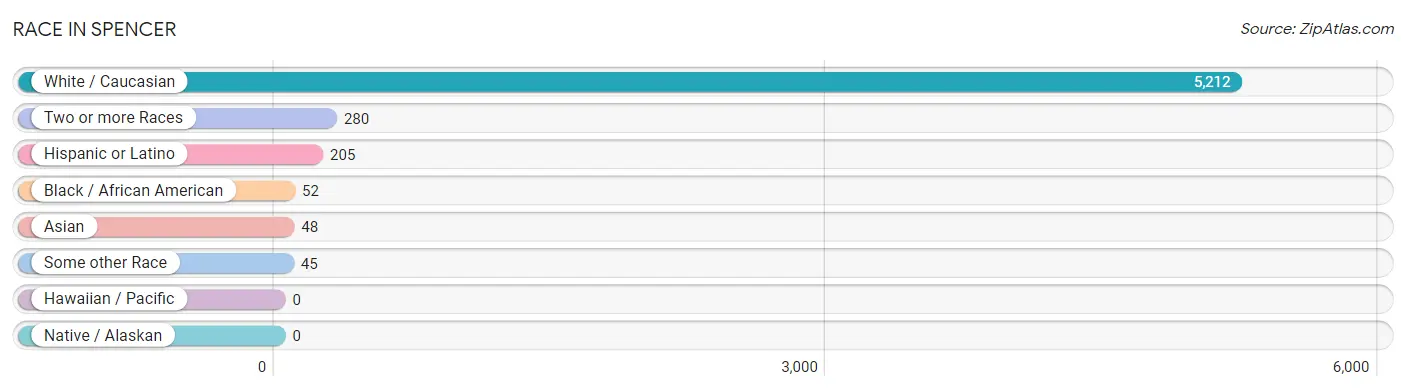
| Race | # Population | % Population |
| Asian | 48 | 0.9% |
| Black / African American | 52 | 0.9% |
| Hawaiian / Pacific | 0 | 0.0% |
| Hispanic or Latino | 205 | 3.6% |
| Native / Alaskan | 0 | 0.0% |
| White / Caucasian | 5,212 | 92.5% |
| Two or more Races | 280 | 5.0% |
| Some other Race | 45 | 0.8% |
| Total | 5,637 | 100.0% |
Ancestry in Spencer
The most populous ancestries reported in Spencer are American (914 | 16.2%), Irish (877 | 15.6%), French (688 | 12.2%), English (684 | 12.1%), and French Canadian (365 | 6.5%), together accounting for 62.6% of all Spencer residents.
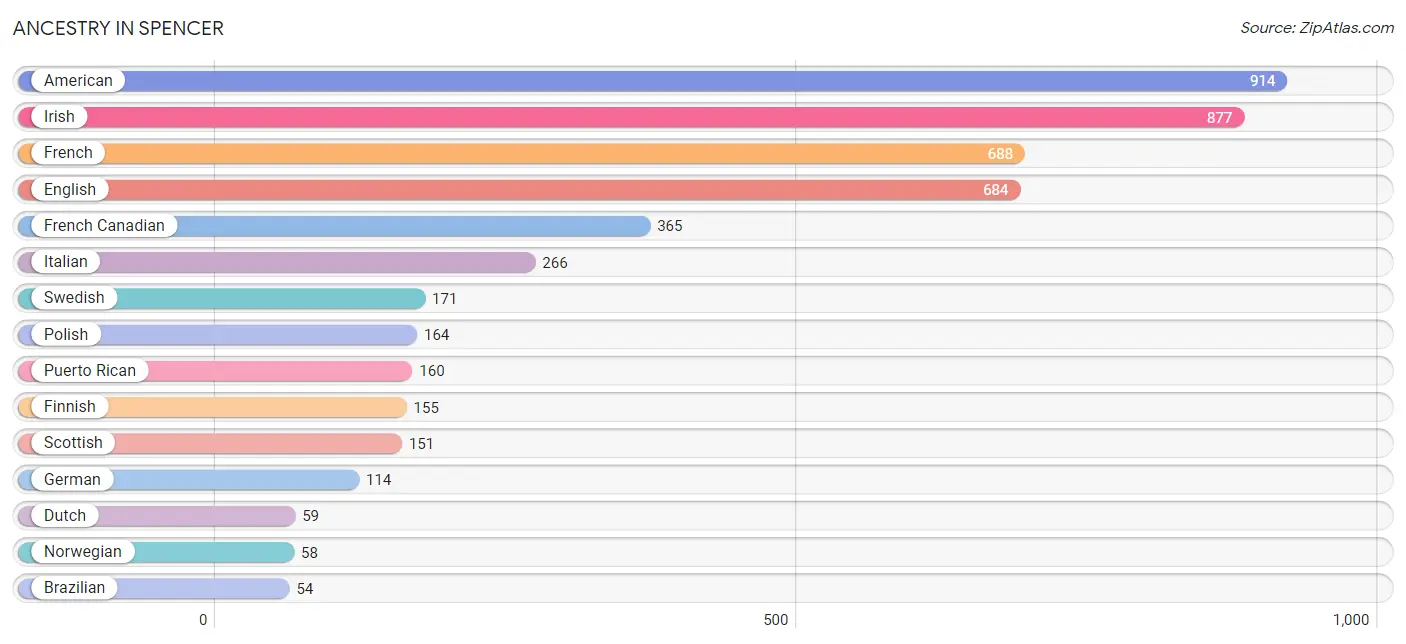
| Ancestry | # Population | % Population |
| American | 914 | 16.2% |
| Arab | 18 | 0.3% |
| Brazilian | 54 | 1.0% |
| Dominican | 45 | 0.8% |
| Dutch | 59 | 1.1% |
| Eastern European | 13 | 0.2% |
| English | 684 | 12.1% |
| Finnish | 155 | 2.8% |
| French | 688 | 12.2% |
| French Canadian | 365 | 6.5% |
| German | 114 | 2.0% |
| Greek | 27 | 0.5% |
| Indian (Asian) | 24 | 0.4% |
| Irish | 877 | 15.6% |
| Italian | 266 | 4.7% |
| Lebanese | 18 | 0.3% |
| Lithuanian | 39 | 0.7% |
| Norwegian | 58 | 1.0% |
| Polish | 164 | 2.9% |
| Puerto Rican | 160 | 2.8% |
| Scottish | 151 | 2.7% |
| Swedish | 171 | 3.0% |
| Syrian | 18 | 0.3% |
| Thai | 36 | 0.6% |
| Trinidadian and Tobagonian | 11 | 0.2% | View All 25 Rows |
Immigrants in Spencer
The most numerous immigrant groups reported in Spencer came from Latin America (99 | 1.8%), Africa (54 | 1.0%), Brazil (54 | 1.0%), South America (54 | 1.0%), and Caribbean (45 | 0.8%), together accounting for 5.4% of all Spencer residents.
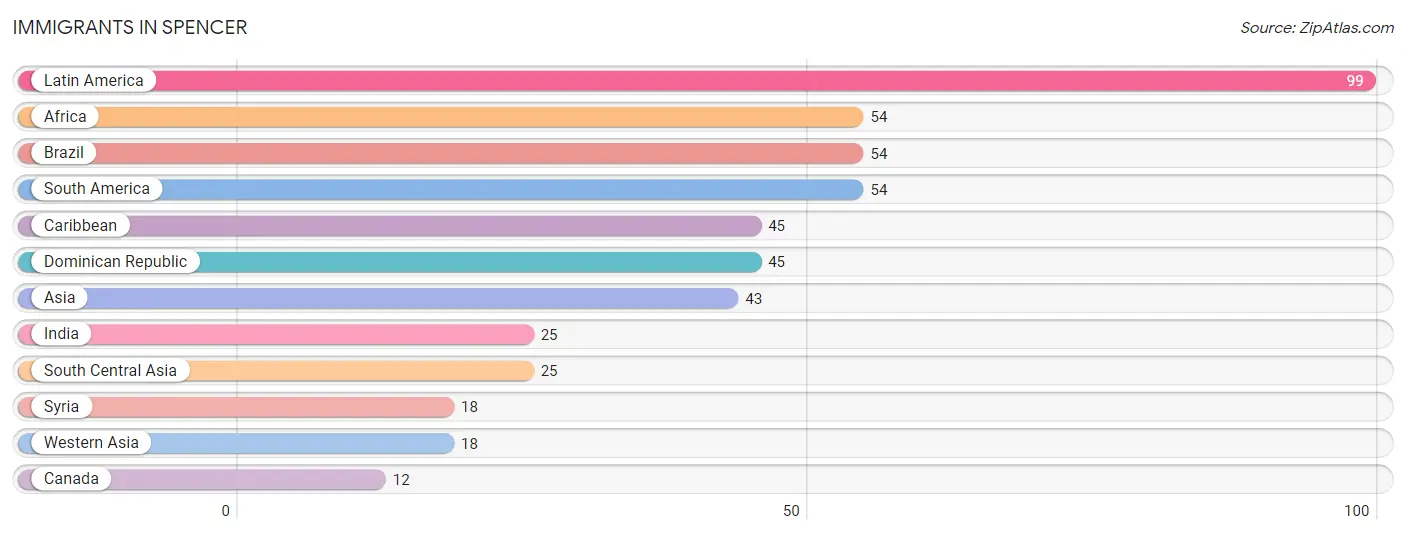
| Immigration Origin | # Population | % Population |
| Africa | 54 | 1.0% |
| Asia | 43 | 0.8% |
| Brazil | 54 | 1.0% |
| Canada | 12 | 0.2% |
| Caribbean | 45 | 0.8% |
| Dominican Republic | 45 | 0.8% |
| India | 25 | 0.4% |
| Latin America | 99 | 1.8% |
| South America | 54 | 1.0% |
| South Central Asia | 25 | 0.4% |
| Syria | 18 | 0.3% |
| Western Asia | 18 | 0.3% | View All 12 Rows |
Sex and Age in Spencer
Sex and Age in Spencer
The most populous age groups in Spencer are 55 to 59 Years (315 | 10.3%) for men and 60 to 64 Years (386 | 15.0%) for women.
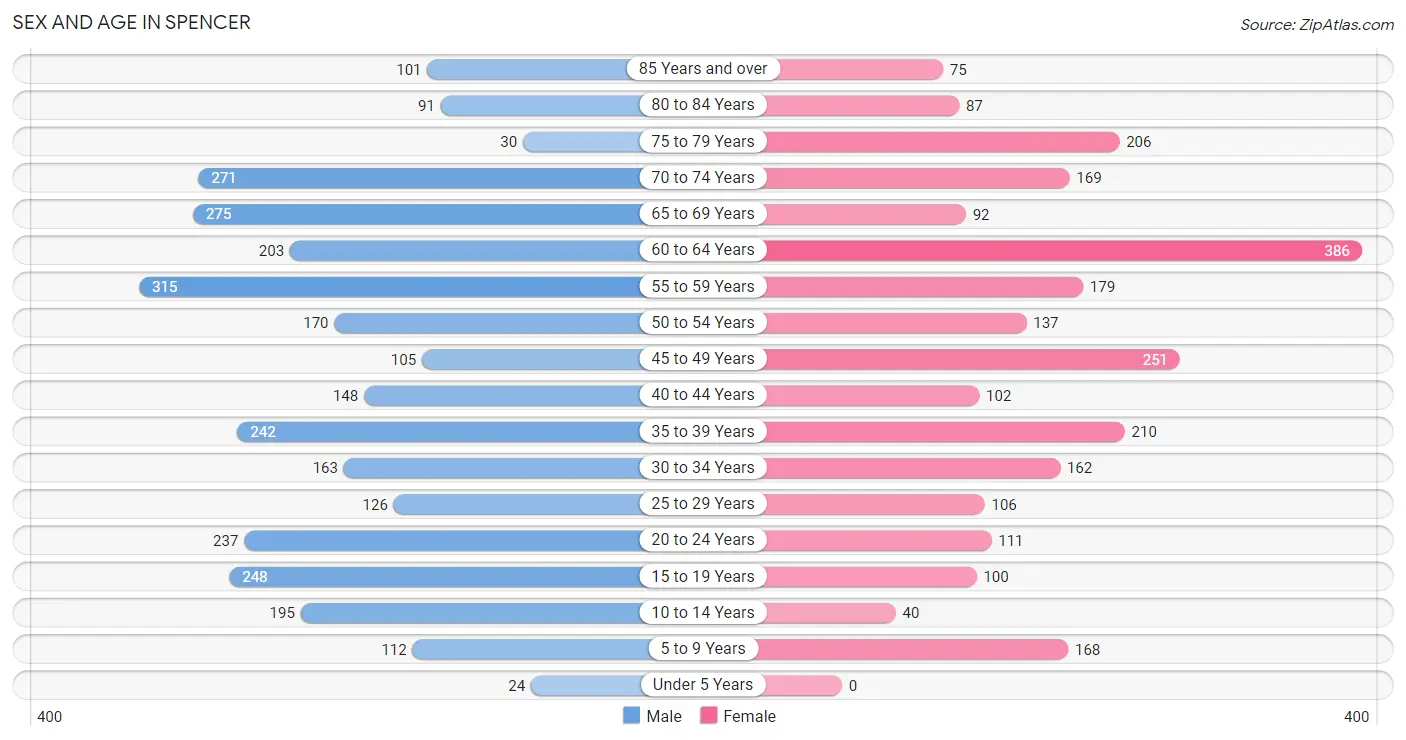
| Age Bracket | Male | Female |
| Under 5 Years | 24 (0.8%) | 0 (0.0%) |
| 5 to 9 Years | 112 (3.7%) | 168 (6.5%) |
| 10 to 14 Years | 195 (6.4%) | 40 (1.5%) |
| 15 to 19 Years | 248 (8.1%) | 100 (3.9%) |
| 20 to 24 Years | 237 (7.8%) | 111 (4.3%) |
| 25 to 29 Years | 126 (4.1%) | 106 (4.1%) |
| 30 to 34 Years | 163 (5.3%) | 162 (6.3%) |
| 35 to 39 Years | 242 (7.9%) | 210 (8.1%) |
| 40 to 44 Years | 148 (4.8%) | 102 (4.0%) |
| 45 to 49 Years | 105 (3.4%) | 251 (9.7%) |
| 50 to 54 Years | 170 (5.6%) | 137 (5.3%) |
| 55 to 59 Years | 315 (10.3%) | 179 (6.9%) |
| 60 to 64 Years | 203 (6.6%) | 386 (15.0%) |
| 65 to 69 Years | 275 (9.0%) | 92 (3.6%) |
| 70 to 74 Years | 271 (8.9%) | 169 (6.6%) |
| 75 to 79 Years | 30 (1.0%) | 206 (8.0%) |
| 80 to 84 Years | 91 (3.0%) | 87 (3.4%) |
| 85 Years and over | 101 (3.3%) | 75 (2.9%) |
| Total | 3,056 (100.0%) | 2,581 (100.0%) |
Families and Households in Spencer
Median Family Size in Spencer
The median family size in Spencer is 2.88 persons per family, with married-couple families (968 | 70.5%) accounting for the largest median family size of 2.94 persons per family. On the other hand, single female/mother families (277 | 20.2%) represent the smallest median family size with 2.72 persons per family.
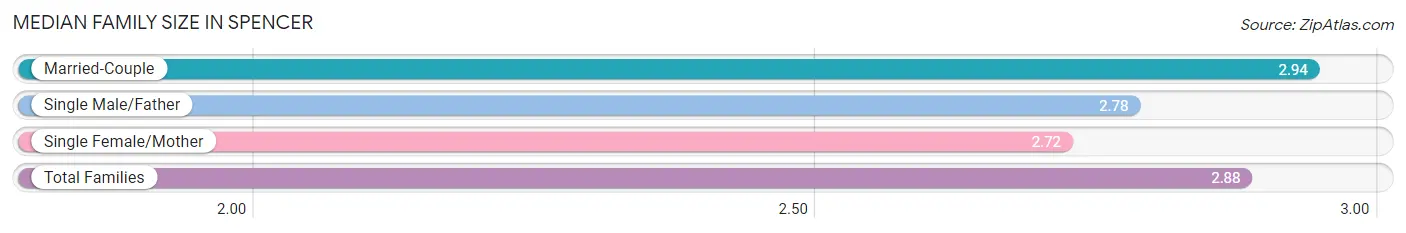
| Family Type | # Families | Family Size |
| Married-Couple | 968 (70.5%) | 2.94 |
| Single Male/Father | 129 (9.4%) | 2.78 |
| Single Female/Mother | 277 (20.2%) | 2.72 |
| Total Families | 1,374 (100.0%) | 2.88 |
Median Household Size in Spencer
The median household size in Spencer is 2.13 persons per household, with single male/father households (129 | 4.9%) accounting for the largest median household size of 3.29 persons per household. non-family households (1,269 | 48.0%) represent the smallest median household size with 1.20 persons per household.
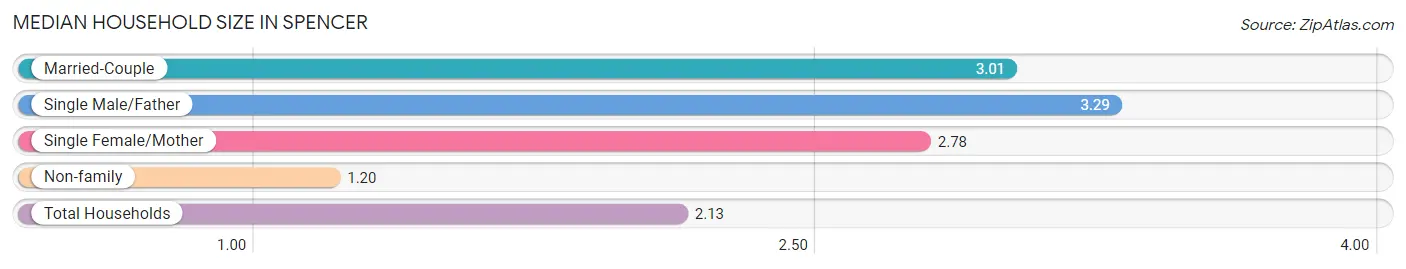
| Household Type | # Households | Household Size |
| Married-Couple | 968 (36.6%) | 3.01 |
| Single Male/Father | 129 (4.9%) | 3.29 |
| Single Female/Mother | 277 (10.5%) | 2.78 |
| Non-family | 1,269 (48.0%) | 1.20 |
| Total Households | 2,643 (100.0%) | 2.13 |
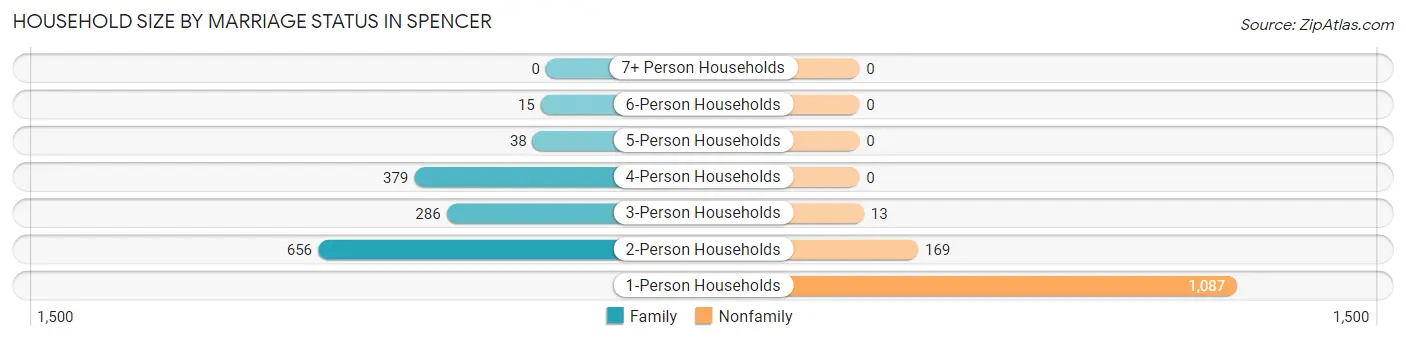
Household Size by Marriage Status in Spencer
Out of a total of 2,643 households in Spencer, 1,374 (52.0%) are family households, while 1,269 (48.0%) are nonfamily households. The most numerous type of family households are 2-person households, comprising 656, and the most common type of nonfamily households are 1-person households, comprising 1,087.
| Household Size | Family Households | Nonfamily Households |
| 1-Person Households | - | 1,087 (41.1%) |
| 2-Person Households | 656 (24.8%) | 169 (6.4%) |
| 3-Person Households | 286 (10.8%) | 13 (0.5%) |
| 4-Person Households | 379 (14.3%) | 0 (0.0%) |
| 5-Person Households | 38 (1.4%) | 0 (0.0%) |
| 6-Person Households | 15 (0.6%) | 0 (0.0%) |
| 7+ Person Households | 0 (0.0%) | 0 (0.0%) |
| Total | 1,374 (52.0%) | 1,269 (48.0%) |
Female Fertility in Spencer
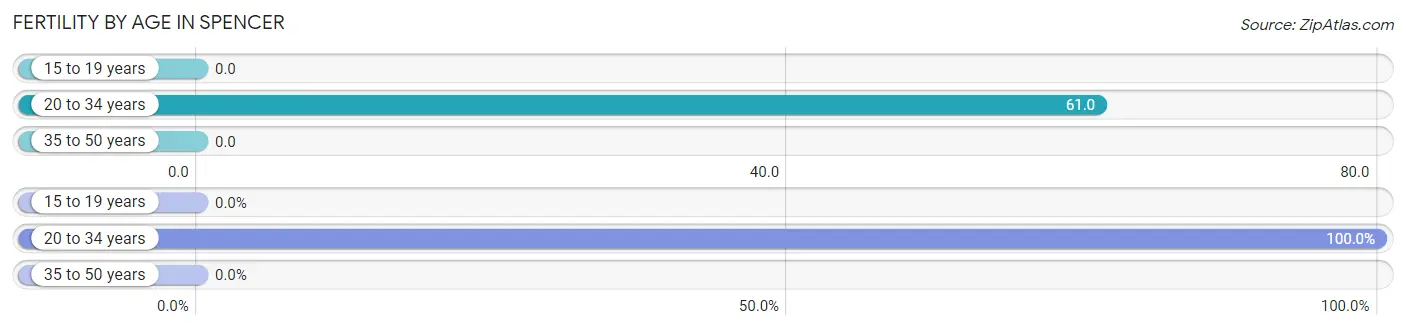
Fertility by Age in Spencer
Average fertility rate in Spencer is 22.0 births per 1,000 women. Women in the age bracket of 20 to 34 years have the highest fertility rate with 61.0 births per 1,000 women. Women in the age bracket of 20 to 34 years acount for 100.0% of all women with births.
| Age Bracket | Women with Births | Births / 1,000 Women |
| 15 to 19 years | 0 (0.0%) | 0.0 |
| 20 to 34 years | 23 (100.0%) | 61.0 |
| 35 to 50 years | 0 (0.0%) | 0.0 |
| Total | 23 (100.0%) | 22.0 |
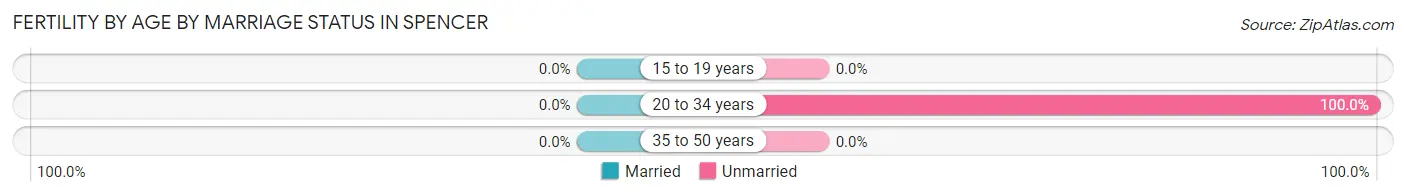
Fertility by Age by Marriage Status in Spencer
| Age Bracket | Married | Unmarried |
| 15 to 19 years | 0 (0.0%) | 0 (0.0%) |
| 20 to 34 years | 0 (0.0%) | 23 (100.0%) |
| 35 to 50 years | 0 (0.0%) | 0 (0.0%) |
| Total | 0 (0.0%) | 23 (100.0%) |
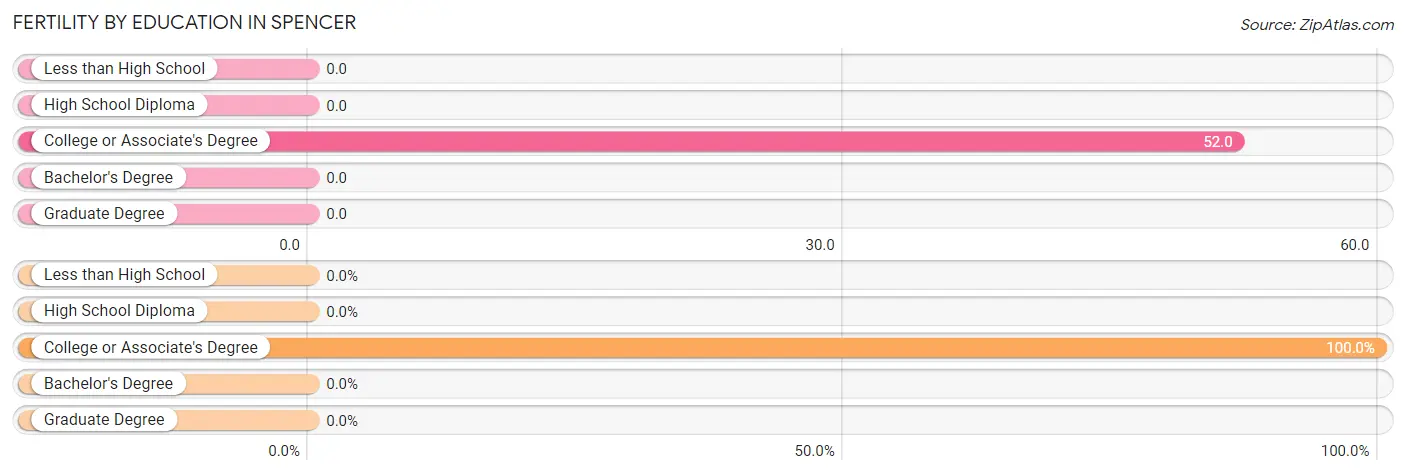
Fertility by Education in Spencer
| Educational Attainment | Women with Births | Births / 1,000 Women |
| Less than High School | 0 (0.0%) | 0.0 |
| High School Diploma | 0 (0.0%) | 0.0 |
| College or Associate's Degree | 23 (100.0%) | 52.0 |
| Bachelor's Degree | 0 (0.0%) | 0.0 |
| Graduate Degree | 0 (0.0%) | 0.0 |
| Total | 23 (100.0%) | 22.0 |
Fertility by Education by Marriage Status in Spencer
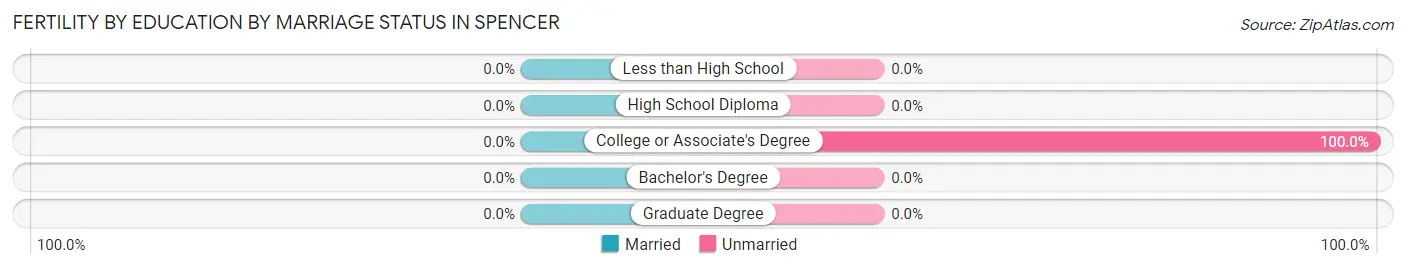
| Educational Attainment | Married | Unmarried |
| Less than High School | 0 (0.0%) | 0 (0.0%) |
| High School Diploma | 0 (0.0%) | 0 (0.0%) |
| College or Associate's Degree | 0 (0.0%) | 23 (100.0%) |
| Bachelor's Degree | 0 (0.0%) | 0 (0.0%) |
| Graduate Degree | 0 (0.0%) | 0 (0.0%) |
| Total | 0 (0.0%) | 23 (100.0%) |
Employment Characteristics in Spencer
Employment by Class of Employer in Spencer
Among the 2,818 employed individuals in Spencer, private company employees (2,160 | 76.6%), not-for-profit organizations (262 | 9.3%), and state government employees (144 | 5.1%) make up the most common classes of employment.
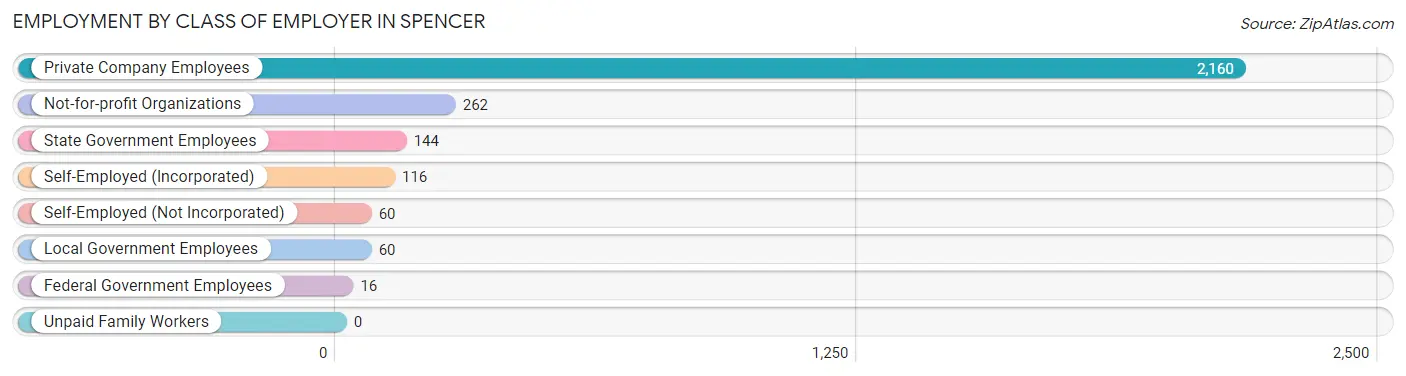
| Employer Class | # Employees | % Employees |
| Private Company Employees | 2,160 | 76.6% |
| Self-Employed (Incorporated) | 116 | 4.1% |
| Self-Employed (Not Incorporated) | 60 | 2.1% |
| Not-for-profit Organizations | 262 | 9.3% |
| Local Government Employees | 60 | 2.1% |
| State Government Employees | 144 | 5.1% |
| Federal Government Employees | 16 | 0.6% |
| Unpaid Family Workers | 0 | 0.0% |
| Total | 2,818 | 100.0% |
Employment Status by Age in Spencer
According to the labor force statistics for Spencer, out of the total population over 16 years of age (5,064), 60.8% or 3,079 individuals are in the labor force, with 7.9% or 243 of them unemployed. The age group with the highest labor force participation rate is 25 to 29 years, with 100.0% or 232 individuals in the labor force. Within the labor force, the 65 to 74 years age range has the highest percentage of unemployed individuals, with 60.2% or 53 of them being unemployed.
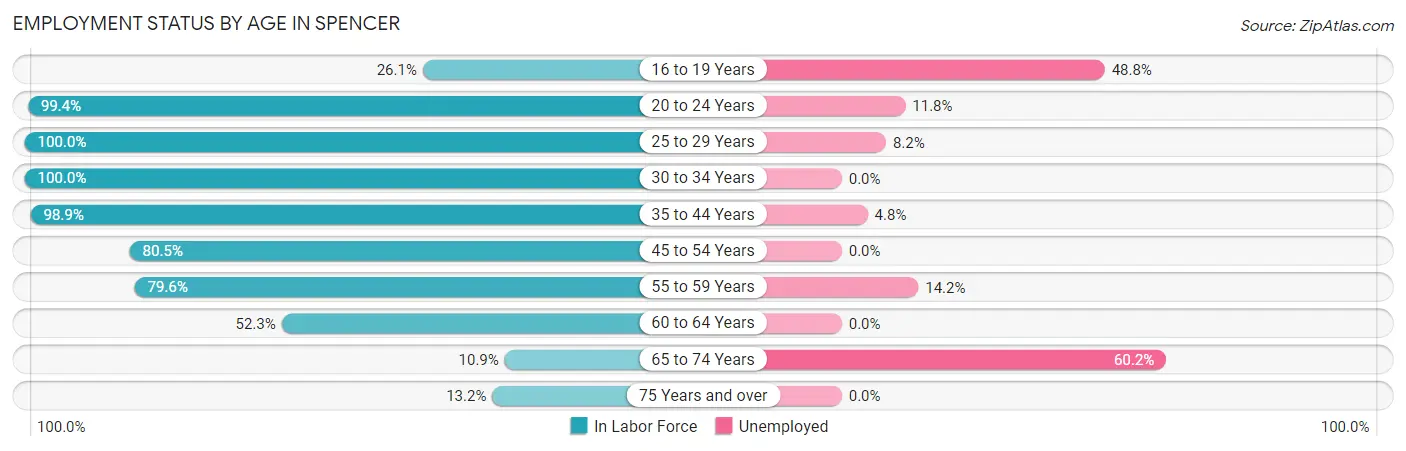
| Age Bracket | In Labor Force | Unemployed |
| 16 to 19 Years | 82 (26.1%) | 40 (48.8%) |
| 20 to 24 Years | 346 (99.4%) | 41 (11.8%) |
| 25 to 29 Years | 232 (100.0%) | 19 (8.2%) |
| 30 to 34 Years | 325 (100.0%) | 0 (0.0%) |
| 35 to 44 Years | 694 (98.9%) | 33 (4.8%) |
| 45 to 54 Years | 534 (80.5%) | 0 (0.0%) |
| 55 to 59 Years | 393 (79.6%) | 56 (14.2%) |
| 60 to 64 Years | 308 (52.3%) | 0 (0.0%) |
| 65 to 74 Years | 88 (10.9%) | 53 (60.2%) |
| 75 Years and over | 78 (13.2%) | 0 (0.0%) |
| Total | 3,079 (60.8%) | 243 (7.9%) |
Employment Status by Educational Attainment in Spencer
According to labor force statistics for Spencer, 82.7% of individuals (2,485) out of the total population between 25 and 64 years of age (3,005) are in the labor force, with 4.3% or 107 of them being unemployed. The group with the highest labor force participation rate are those with the educational attainment of college / associate degree, with 92.9% or 905 individuals in the labor force. Within the labor force, individuals with college / associate degree education have the highest percentage of unemployment, with 8.0% or 72 of them being unemployed.
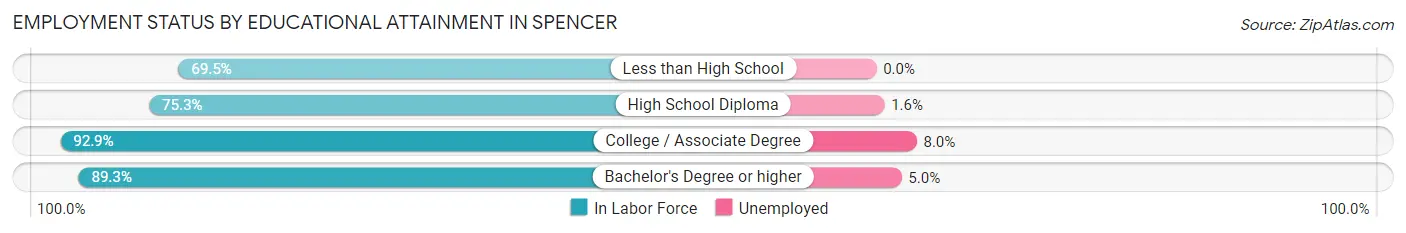
| Educational Attainment | In Labor Force | Unemployed |
| Less than High School | 105 (69.5%) | 0 (0.0%) |
| High School Diploma | 1,093 (75.3%) | 23 (1.6%) |
| College / Associate Degree | 905 (92.9%) | 78 (8.0%) |
| Bachelor's Degree or higher | 382 (89.3%) | 21 (5.0%) |
| Total | 2,485 (82.7%) | 129 (4.3%) |
Employment Occupations by Sex in Spencer
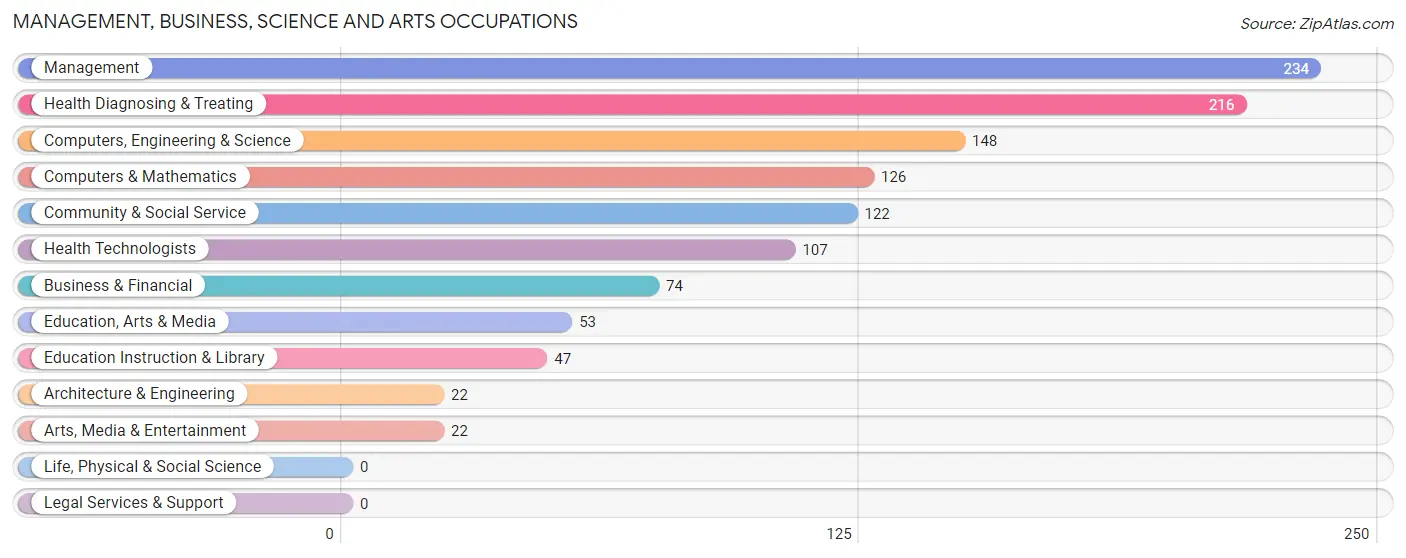
Management, Business, Science and Arts Occupations
The most common Management, Business, Science and Arts occupations in Spencer are Management (234 | 8.3%), Health Diagnosing & Treating (216 | 7.6%), Computers, Engineering & Science (148 | 5.2%), Computers & Mathematics (126 | 4.4%), and Community & Social Service (122 | 4.3%).
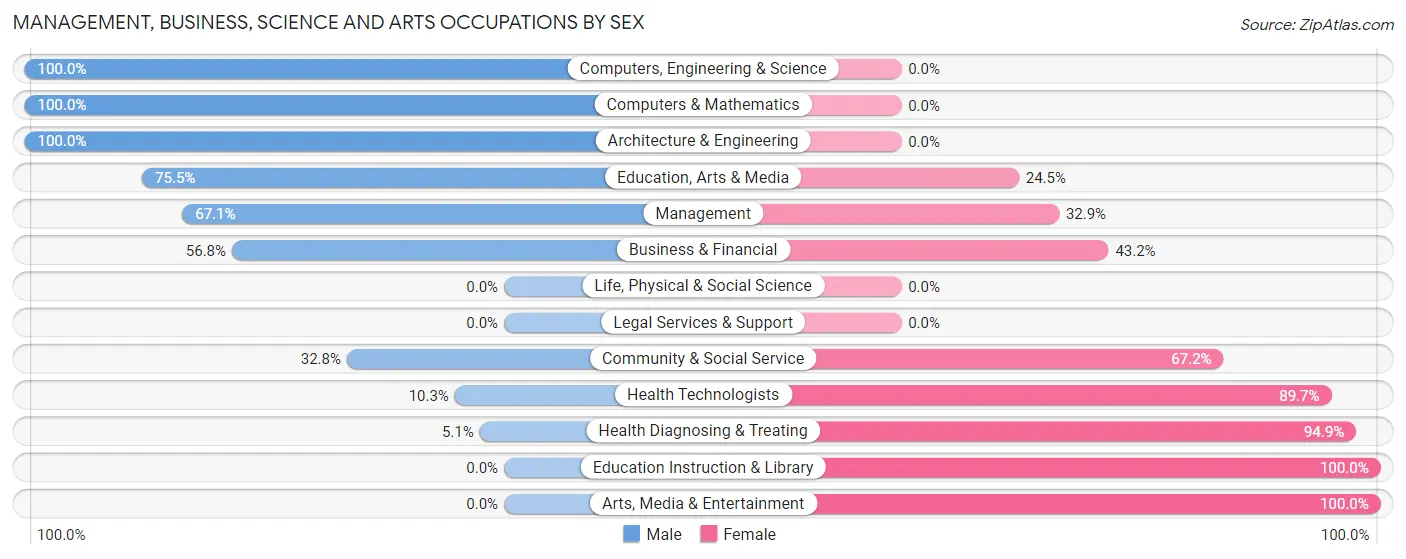
Management, Business, Science and Arts Occupations by Sex
Within the Management, Business, Science and Arts occupations in Spencer, the most male-oriented occupations are Computers, Engineering & Science (100.0%), Computers & Mathematics (100.0%), and Architecture & Engineering (100.0%), while the most female-oriented occupations are Education Instruction & Library (100.0%), Arts, Media & Entertainment (100.0%), and Health Diagnosing & Treating (94.9%).
| Occupation | Male | Female |
| Management | 157 (67.1%) | 77 (32.9%) |
| Business & Financial | 42 (56.8%) | 32 (43.2%) |
| Computers, Engineering & Science | 148 (100.0%) | 0 (0.0%) |
| Computers & Mathematics | 126 (100.0%) | 0 (0.0%) |
| Architecture & Engineering | 22 (100.0%) | 0 (0.0%) |
| Life, Physical & Social Science | 0 (0.0%) | 0 (0.0%) |
| Community & Social Service | 40 (32.8%) | 82 (67.2%) |
| Education, Arts & Media | 40 (75.5%) | 13 (24.5%) |
| Legal Services & Support | 0 (0.0%) | 0 (0.0%) |
| Education Instruction & Library | 0 (0.0%) | 47 (100.0%) |
| Arts, Media & Entertainment | 0 (0.0%) | 22 (100.0%) |
| Health Diagnosing & Treating | 11 (5.1%) | 205 (94.9%) |
| Health Technologists | 11 (10.3%) | 96 (89.7%) |
| Total (Category) | 398 (50.1%) | 396 (49.9%) |
| Total (Overall) | 1,384 (48.8%) | 1,454 (51.2%) |
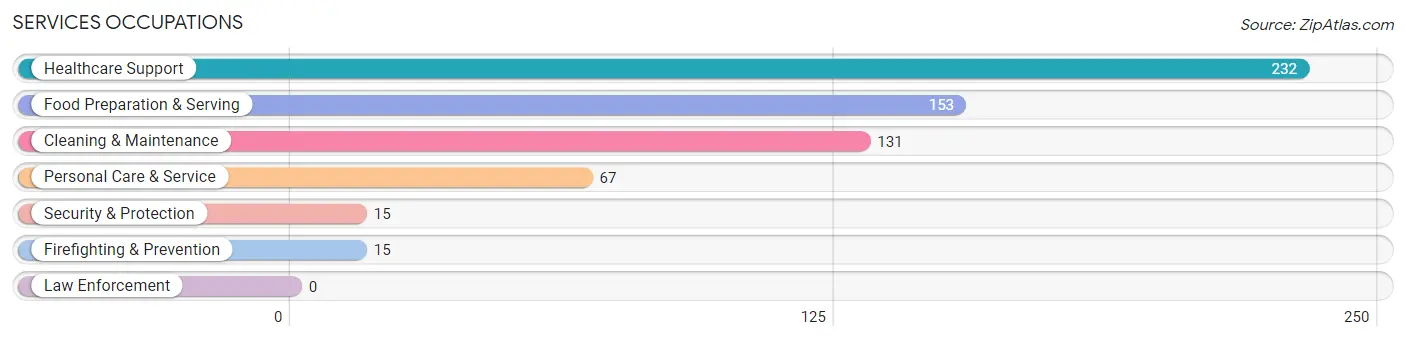
Services Occupations
The most common Services occupations in Spencer are Healthcare Support (232 | 8.2%), Food Preparation & Serving (153 | 5.4%), Cleaning & Maintenance (131 | 4.6%), Personal Care & Service (67 | 2.4%), and Security & Protection (15 | 0.5%).
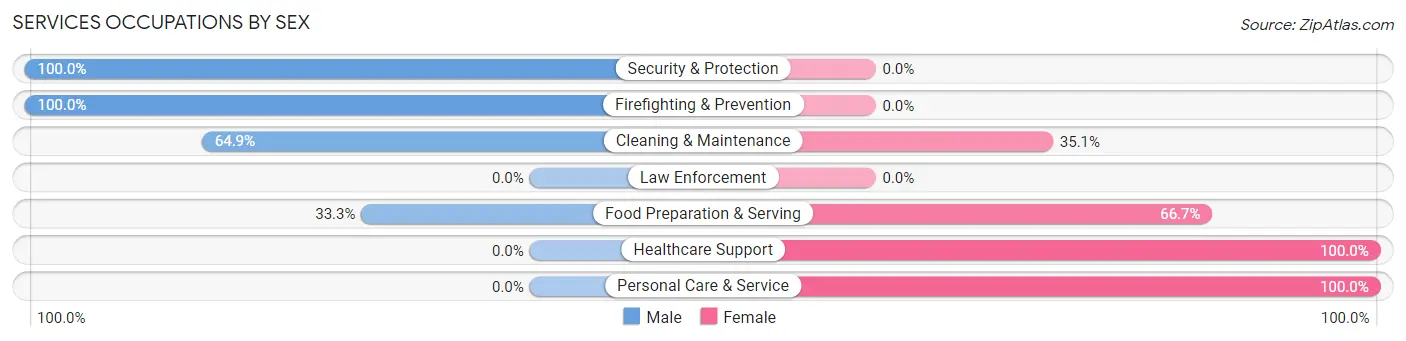
Services Occupations by Sex
Within the Services occupations in Spencer, the most male-oriented occupations are Security & Protection (100.0%), Firefighting & Prevention (100.0%), and Cleaning & Maintenance (64.9%), while the most female-oriented occupations are Healthcare Support (100.0%), Personal Care & Service (100.0%), and Food Preparation & Serving (66.7%).
| Occupation | Male | Female |
| Healthcare Support | 0 (0.0%) | 232 (100.0%) |
| Security & Protection | 15 (100.0%) | 0 (0.0%) |
| Firefighting & Prevention | 15 (100.0%) | 0 (0.0%) |
| Law Enforcement | 0 (0.0%) | 0 (0.0%) |
| Food Preparation & Serving | 51 (33.3%) | 102 (66.7%) |
| Cleaning & Maintenance | 85 (64.9%) | 46 (35.1%) |
| Personal Care & Service | 0 (0.0%) | 67 (100.0%) |
| Total (Category) | 151 (25.3%) | 447 (74.8%) |
| Total (Overall) | 1,384 (48.8%) | 1,454 (51.2%) |
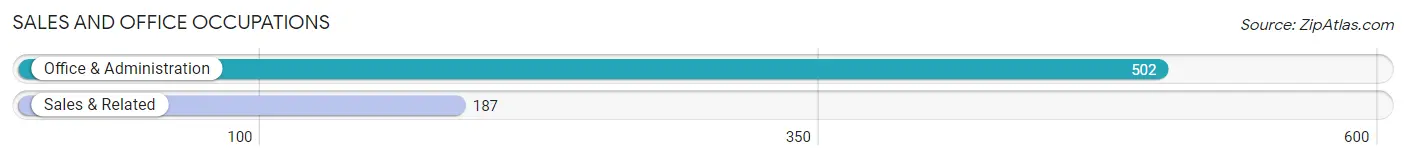
Sales and Office Occupations
The most common Sales and Office occupations in Spencer are Office & Administration (502 | 17.7%), and Sales & Related (187 | 6.6%).
Sales and Office Occupations by Sex
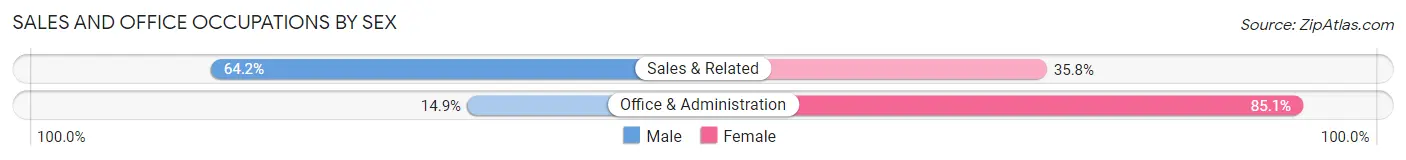
| Occupation | Male | Female |
| Sales & Related | 120 (64.2%) | 67 (35.8%) |
| Office & Administration | 75 (14.9%) | 427 (85.1%) |
| Total (Category) | 195 (28.3%) | 494 (71.7%) |
| Total (Overall) | 1,384 (48.8%) | 1,454 (51.2%) |
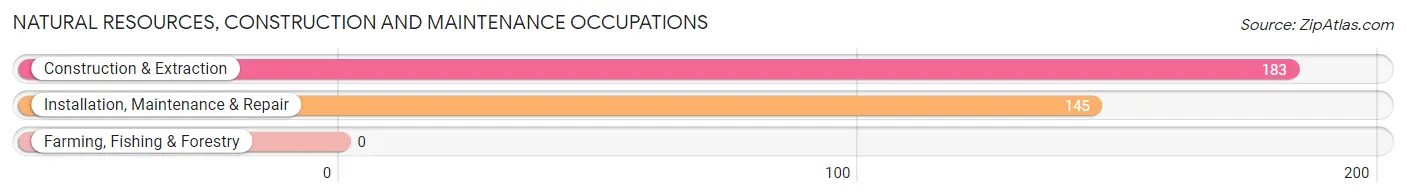
Natural Resources, Construction and Maintenance Occupations
The most common Natural Resources, Construction and Maintenance occupations in Spencer are Construction & Extraction (183 | 6.5%), and Installation, Maintenance & Repair (145 | 5.1%).
Natural Resources, Construction and Maintenance Occupations by Sex
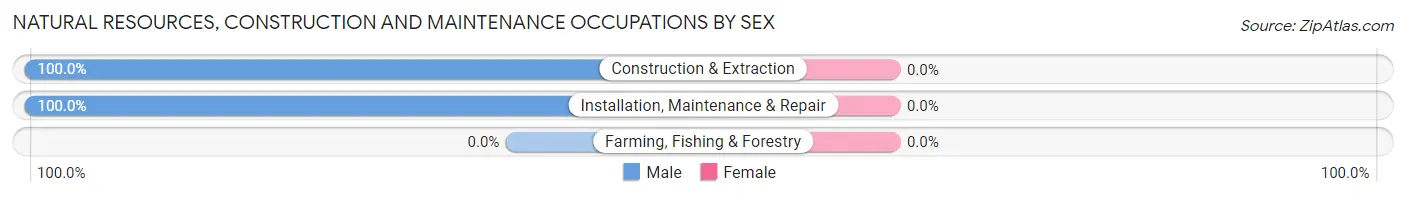
| Occupation | Male | Female |
| Farming, Fishing & Forestry | 0 (0.0%) | 0 (0.0%) |
| Construction & Extraction | 183 (100.0%) | 0 (0.0%) |
| Installation, Maintenance & Repair | 145 (100.0%) | 0 (0.0%) |
| Total (Category) | 328 (100.0%) | 0 (0.0%) |
| Total (Overall) | 1,384 (48.8%) | 1,454 (51.2%) |
Production, Transportation and Moving Occupations
The most common Production, Transportation and Moving occupations in Spencer are Transportation (250 | 8.8%), Production (114 | 4.0%), and Material Moving (65 | 2.3%).
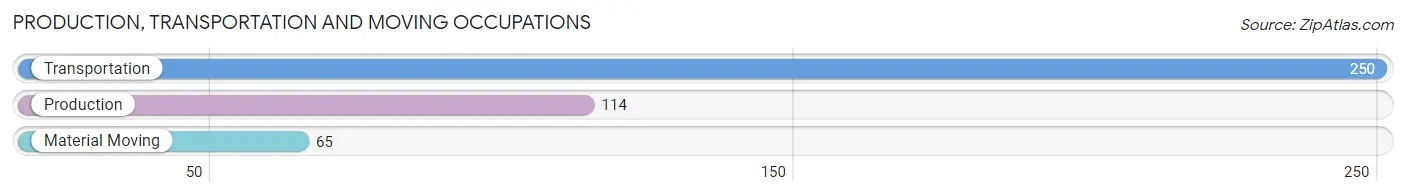
Production, Transportation and Moving Occupations by Sex
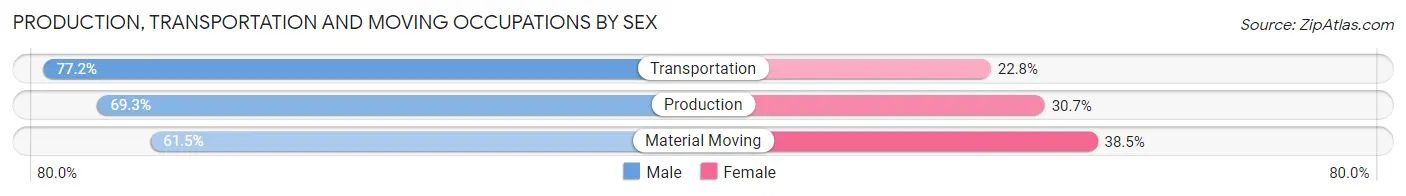
| Occupation | Male | Female |
| Production | 79 (69.3%) | 35 (30.7%) |
| Transportation | 193 (77.2%) | 57 (22.8%) |
| Material Moving | 40 (61.5%) | 25 (38.5%) |
| Total (Category) | 312 (72.7%) | 117 (27.3%) |
| Total (Overall) | 1,384 (48.8%) | 1,454 (51.2%) |
Employment Industries by Sex in Spencer
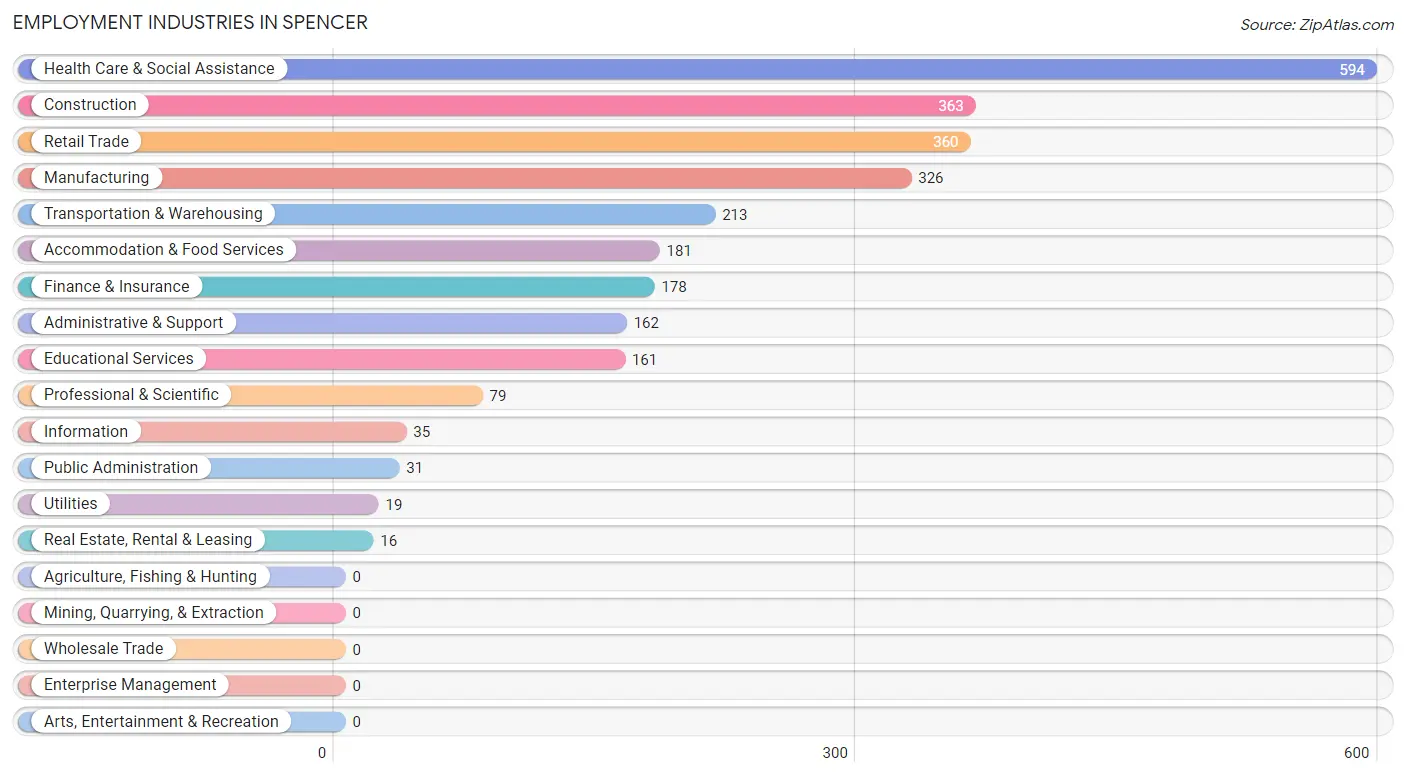
Employment Industries in Spencer
The major employment industries in Spencer include Health Care & Social Assistance (594 | 20.9%), Construction (363 | 12.8%), Retail Trade (360 | 12.7%), Manufacturing (326 | 11.5%), and Transportation & Warehousing (213 | 7.5%).
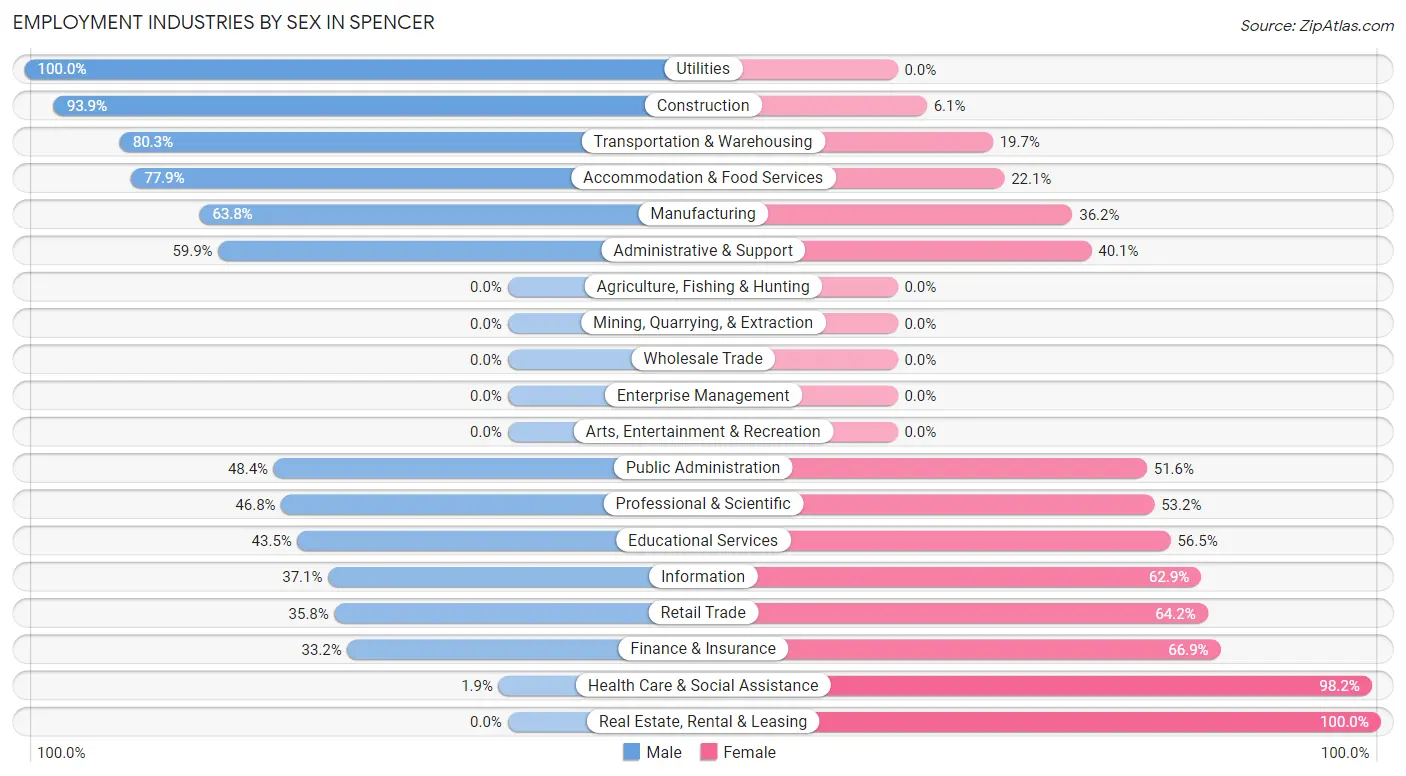
Employment Industries by Sex in Spencer
The Spencer industries that see more men than women are Utilities (100.0%), Construction (93.9%), and Transportation & Warehousing (80.3%), whereas the industries that tend to have a higher number of women are Real Estate, Rental & Leasing (100.0%), Health Care & Social Assistance (98.2%), and Finance & Insurance (66.8%).
| Industry | Male | Female |
| Agriculture, Fishing & Hunting | 0 (0.0%) | 0 (0.0%) |
| Mining, Quarrying, & Extraction | 0 (0.0%) | 0 (0.0%) |
| Construction | 341 (93.9%) | 22 (6.1%) |
| Manufacturing | 208 (63.8%) | 118 (36.2%) |
| Wholesale Trade | 0 (0.0%) | 0 (0.0%) |
| Retail Trade | 129 (35.8%) | 231 (64.2%) |
| Transportation & Warehousing | 171 (80.3%) | 42 (19.7%) |
| Utilities | 19 (100.0%) | 0 (0.0%) |
| Information | 13 (37.1%) | 22 (62.9%) |
| Finance & Insurance | 59 (33.2%) | 119 (66.8%) |
| Real Estate, Rental & Leasing | 0 (0.0%) | 16 (100.0%) |
| Professional & Scientific | 37 (46.8%) | 42 (53.2%) |
| Enterprise Management | 0 (0.0%) | 0 (0.0%) |
| Administrative & Support | 97 (59.9%) | 65 (40.1%) |
| Educational Services | 70 (43.5%) | 91 (56.5%) |
| Health Care & Social Assistance | 11 (1.8%) | 583 (98.2%) |
| Arts, Entertainment & Recreation | 0 (0.0%) | 0 (0.0%) |
| Accommodation & Food Services | 141 (77.9%) | 40 (22.1%) |
| Public Administration | 15 (48.4%) | 16 (51.6%) |
| Total | 1,384 (48.8%) | 1,454 (51.2%) |
Education in Spencer
School Enrollment in Spencer
The most common levels of schooling among the 1,191 students in Spencer are college / undergraduate (425 | 35.7%), high school (376 | 31.6%), and elementary school (217 | 18.2%).
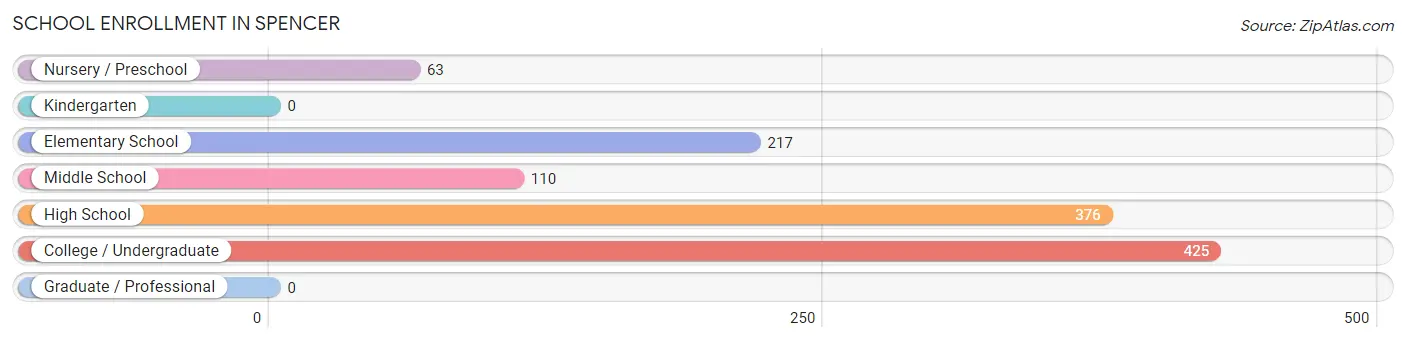
| School Level | # Students | % Students |
| Nursery / Preschool | 63 | 5.3% |
| Kindergarten | 0 | 0.0% |
| Elementary School | 217 | 18.2% |
| Middle School | 110 | 9.2% |
| High School | 376 | 31.6% |
| College / Undergraduate | 425 | 35.7% |
| Graduate / Professional | 0 | 0.0% |
| Total | 1,191 | 100.0% |
School Enrollment by Age by Funding Source in Spencer
Out of a total of 1,191 students who are enrolled in schools in Spencer, 316 (26.5%) attend a private institution, while the remaining 875 (73.5%) are enrolled in public schools. The age group of 20 to 24 year olds has the highest likelihood of being enrolled in private schools, with 74 (100.0% in the age bracket) enrolled. Conversely, the age group of 10 to 14 year olds has the lowest likelihood of being enrolled in a private school, with 195 (100.0% in the age bracket) attending a public institution.
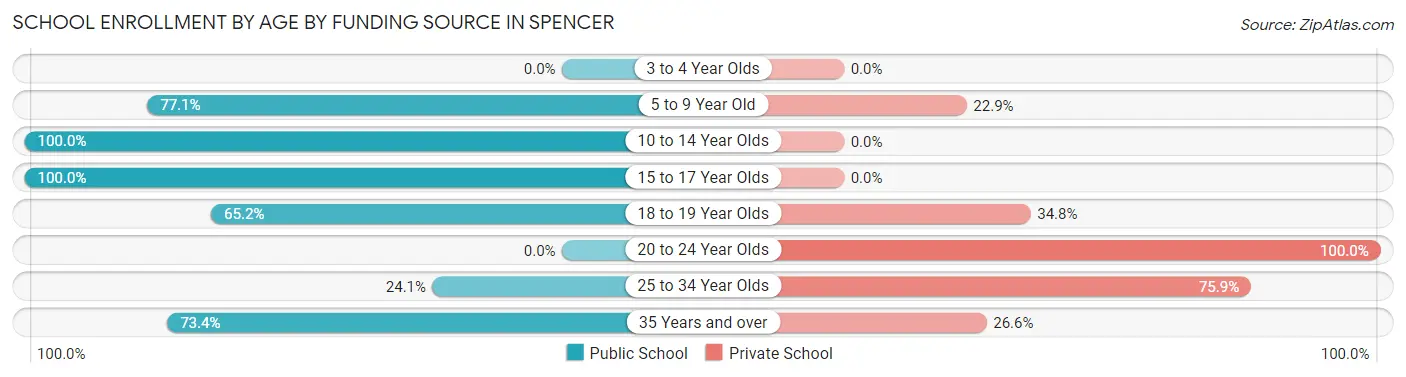
| Age Bracket | Public School | Private School |
| 3 to 4 Year Olds | 0 (0.0%) | 0 (0.0%) |
| 5 to 9 Year Old | 216 (77.1%) | 64 (22.9%) |
| 10 to 14 Year Olds | 195 (100.0%) | 0 (0.0%) |
| 15 to 17 Year Olds | 184 (100.0%) | 0 (0.0%) |
| 18 to 19 Year Olds | 107 (65.2%) | 57 (34.8%) |
| 20 to 24 Year Olds | 0 (0.0%) | 74 (100.0%) |
| 25 to 34 Year Olds | 21 (24.1%) | 66 (75.9%) |
| 35 Years and over | 152 (73.4%) | 55 (26.6%) |
| Total | 875 (73.5%) | 316 (26.5%) |
Educational Attainment by Field of Study in Spencer
Science & technology (110 | 17.9%), business (93 | 15.1%), engineering (78 | 12.7%), education (75 | 12.2%), and liberal arts & history (61 | 9.9%) are the most common fields of study among 614 individuals in Spencer who have obtained a bachelor's degree or higher.
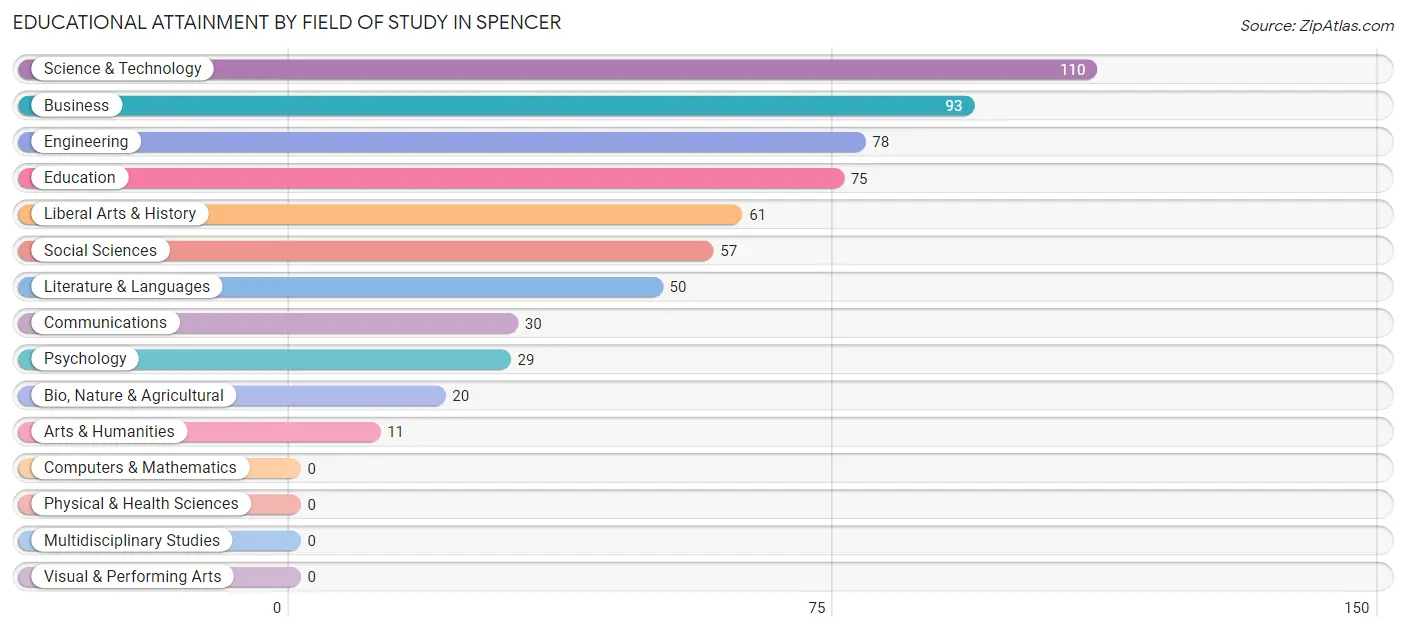
| Field of Study | # Graduates | % Graduates |
| Computers & Mathematics | 0 | 0.0% |
| Bio, Nature & Agricultural | 20 | 3.3% |
| Physical & Health Sciences | 0 | 0.0% |
| Psychology | 29 | 4.7% |
| Social Sciences | 57 | 9.3% |
| Engineering | 78 | 12.7% |
| Multidisciplinary Studies | 0 | 0.0% |
| Science & Technology | 110 | 17.9% |
| Business | 93 | 15.1% |
| Education | 75 | 12.2% |
| Literature & Languages | 50 | 8.1% |
| Liberal Arts & History | 61 | 9.9% |
| Visual & Performing Arts | 0 | 0.0% |
| Communications | 30 | 4.9% |
| Arts & Humanities | 11 | 1.8% |
| Total | 614 | 100.0% |
Transportation & Commute in Spencer
Vehicle Availability by Sex in Spencer
The most prevalent vehicle ownership categories in Spencer are males with 2 vehicles (699, accounting for 51.2%) and females with 2 vehicles (839, making up 48.1%).
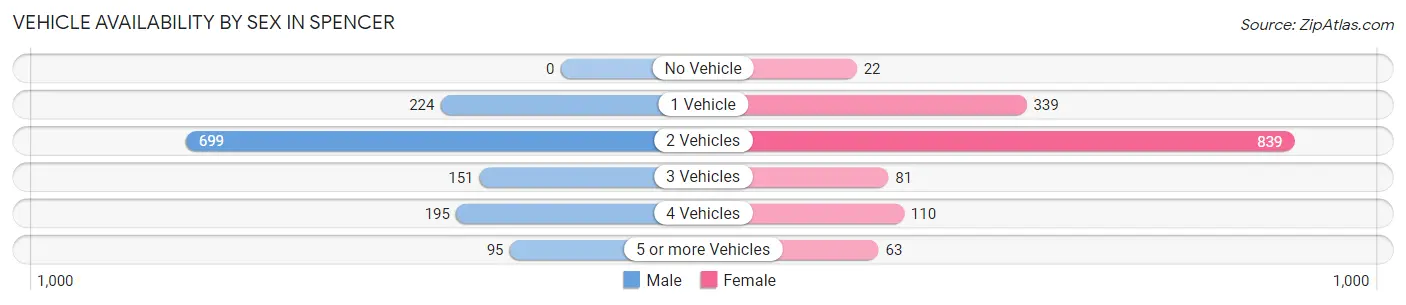
| Vehicles Available | Male | Female |
| No Vehicle | 0 (0.0%) | 22 (1.5%) |
| 1 Vehicle | 224 (16.4%) | 339 (23.3%) |
| 2 Vehicles | 699 (51.2%) | 839 (57.7%) |
| 3 Vehicles | 151 (11.1%) | 81 (5.6%) |
| 4 Vehicles | 195 (14.3%) | 110 (7.6%) |
| 5 or more Vehicles | 95 (7.0%) | 63 (4.3%) |
| Total | 1,364 (100.0%) | 1,454 (100.0%) |
Commute Time in Spencer
The most frequently occuring commute durations in Spencer are 30 to 34 minutes (657 commuters, 25.3%), 45 to 59 minutes (431 commuters, 16.6%), and 15 to 19 minutes (291 commuters, 11.2%).
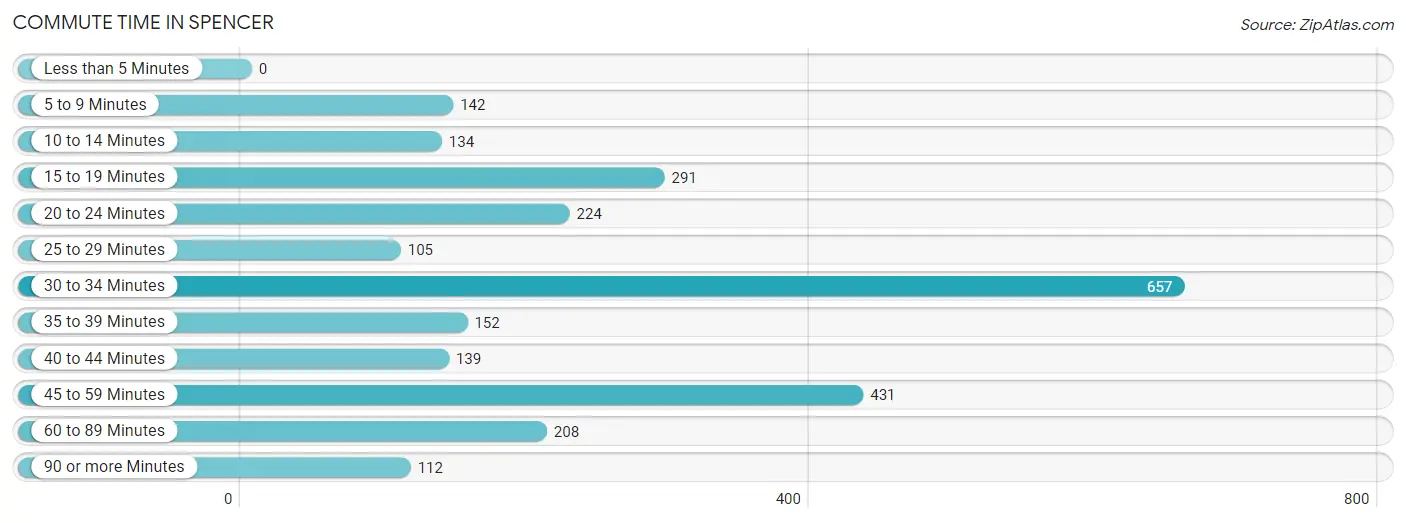
| Commute Time | # Commuters | % Commuters |
| Less than 5 Minutes | 0 | 0.0% |
| 5 to 9 Minutes | 142 | 5.5% |
| 10 to 14 Minutes | 134 | 5.2% |
| 15 to 19 Minutes | 291 | 11.2% |
| 20 to 24 Minutes | 224 | 8.6% |
| 25 to 29 Minutes | 105 | 4.1% |
| 30 to 34 Minutes | 657 | 25.3% |
| 35 to 39 Minutes | 152 | 5.9% |
| 40 to 44 Minutes | 139 | 5.4% |
| 45 to 59 Minutes | 431 | 16.6% |
| 60 to 89 Minutes | 208 | 8.0% |
| 90 or more Minutes | 112 | 4.3% |
Commute Time by Sex in Spencer
The most common commute times in Spencer are 30 to 34 minutes (295 commuters, 24.0%) for males and 30 to 34 minutes (362 commuters, 26.5%) for females.
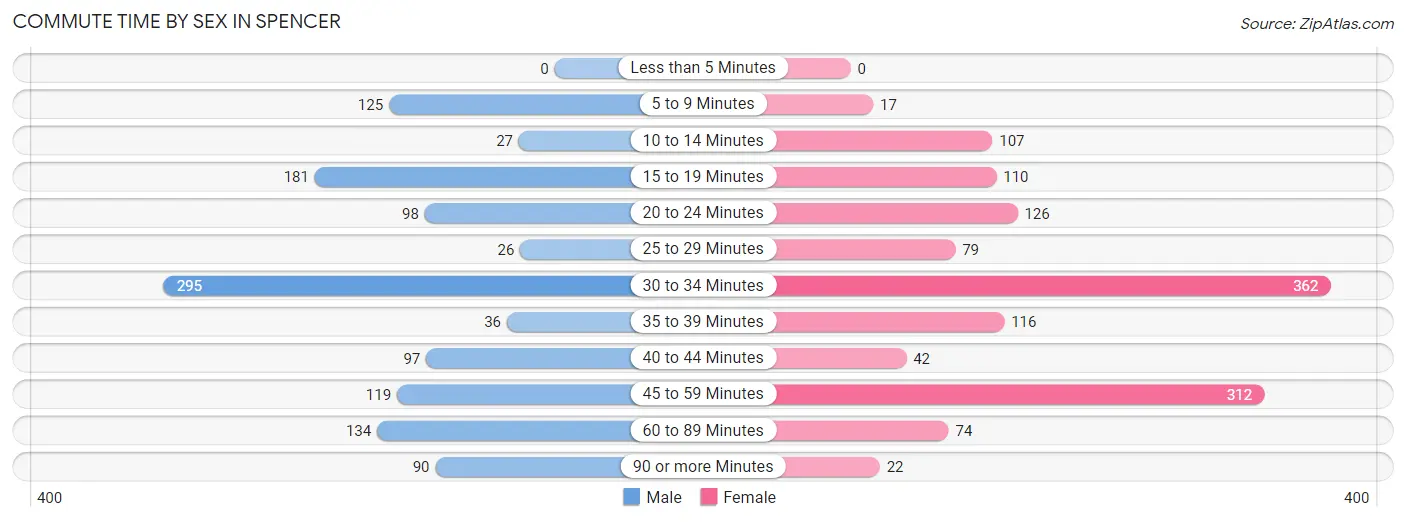
| Commute Time | Male | Female |
| Less than 5 Minutes | 0 (0.0%) | 0 (0.0%) |
| 5 to 9 Minutes | 125 (10.2%) | 17 (1.2%) |
| 10 to 14 Minutes | 27 (2.2%) | 107 (7.8%) |
| 15 to 19 Minutes | 181 (14.7%) | 110 (8.1%) |
| 20 to 24 Minutes | 98 (8.0%) | 126 (9.2%) |
| 25 to 29 Minutes | 26 (2.1%) | 79 (5.8%) |
| 30 to 34 Minutes | 295 (24.0%) | 362 (26.5%) |
| 35 to 39 Minutes | 36 (2.9%) | 116 (8.5%) |
| 40 to 44 Minutes | 97 (7.9%) | 42 (3.1%) |
| 45 to 59 Minutes | 119 (9.7%) | 312 (22.8%) |
| 60 to 89 Minutes | 134 (10.9%) | 74 (5.4%) |
| 90 or more Minutes | 90 (7.3%) | 22 (1.6%) |
Time of Departure to Work by Sex in Spencer
The most frequent times of departure to work in Spencer are 7:00 AM to 7:29 AM (203, 16.5%) for males and 7:30 AM to 7:59 AM (364, 26.6%) for females.
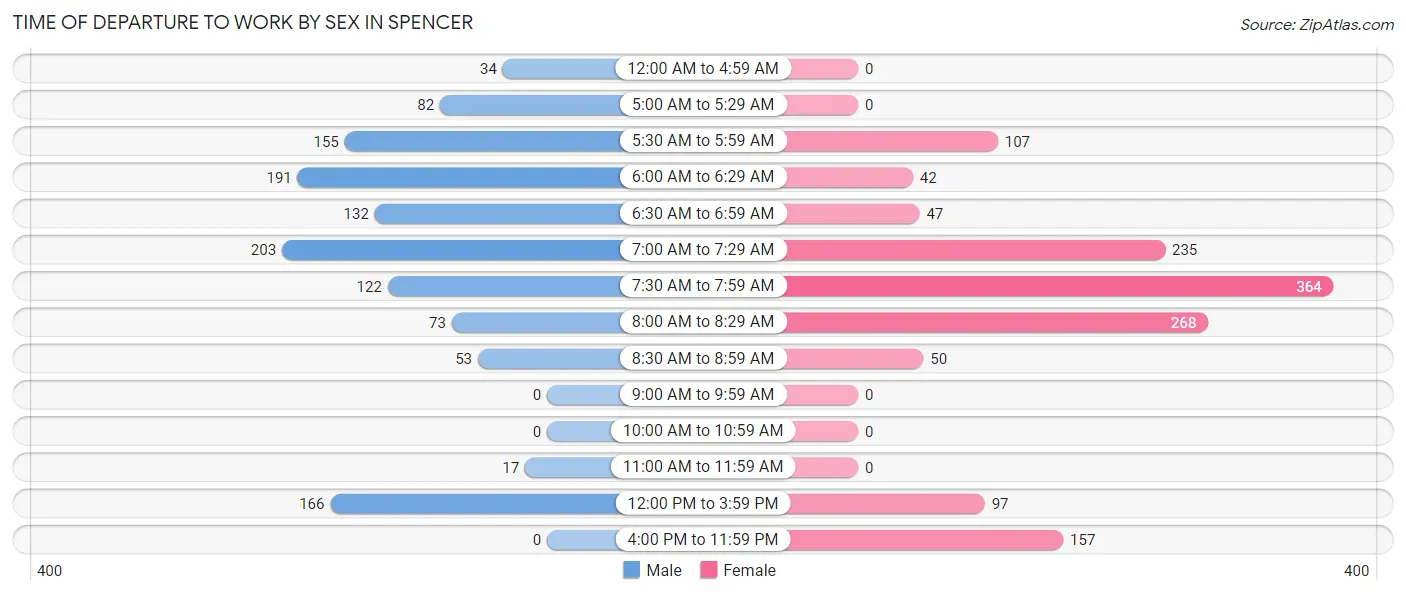
| Time of Departure | Male | Female |
| 12:00 AM to 4:59 AM | 34 (2.8%) | 0 (0.0%) |
| 5:00 AM to 5:29 AM | 82 (6.7%) | 0 (0.0%) |
| 5:30 AM to 5:59 AM | 155 (12.6%) | 107 (7.8%) |
| 6:00 AM to 6:29 AM | 191 (15.5%) | 42 (3.1%) |
| 6:30 AM to 6:59 AM | 132 (10.7%) | 47 (3.4%) |
| 7:00 AM to 7:29 AM | 203 (16.5%) | 235 (17.2%) |
| 7:30 AM to 7:59 AM | 122 (9.9%) | 364 (26.6%) |
| 8:00 AM to 8:29 AM | 73 (5.9%) | 268 (19.6%) |
| 8:30 AM to 8:59 AM | 53 (4.3%) | 50 (3.7%) |
| 9:00 AM to 9:59 AM | 0 (0.0%) | 0 (0.0%) |
| 10:00 AM to 10:59 AM | 0 (0.0%) | 0 (0.0%) |
| 11:00 AM to 11:59 AM | 17 (1.4%) | 0 (0.0%) |
| 12:00 PM to 3:59 PM | 166 (13.5%) | 97 (7.1%) |
| 4:00 PM to 11:59 PM | 0 (0.0%) | 157 (11.5%) |
| Total | 1,228 (100.0%) | 1,367 (100.0%) |
Housing Occupancy in Spencer
Occupancy by Ownership in Spencer
Of the total 2,643 dwellings in Spencer, owner-occupied units account for 1,116 (42.2%), while renter-occupied units make up 1,527 (57.8%).
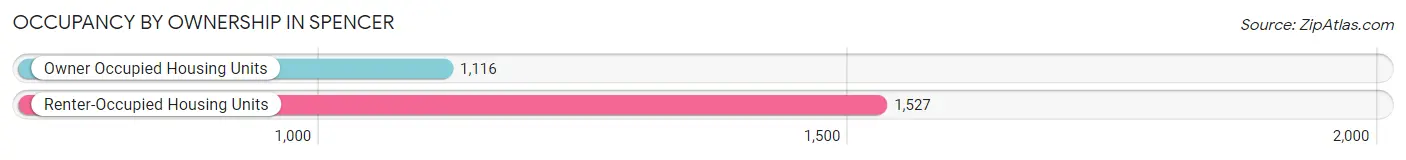
| Occupancy | # Housing Units | % Housing Units |
| Owner Occupied Housing Units | 1,116 | 42.2% |
| Renter-Occupied Housing Units | 1,527 | 57.8% |
| Total Occupied Housing Units | 2,643 | 100.0% |
Occupancy by Household Size in Spencer
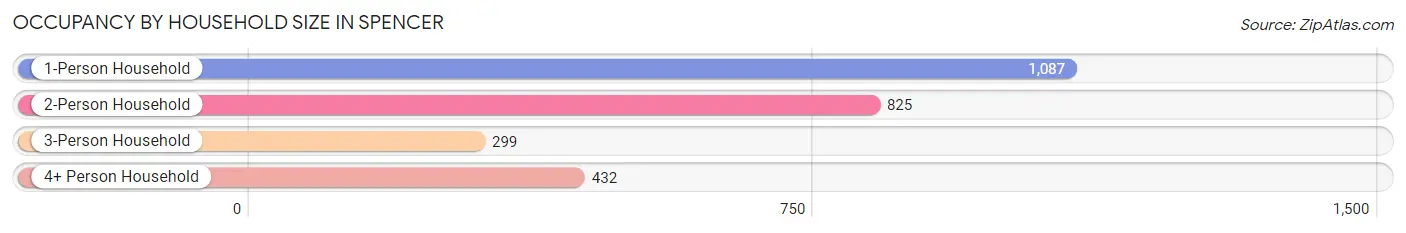
| Household Size | # Housing Units | % Housing Units |
| 1-Person Household | 1,087 | 41.1% |
| 2-Person Household | 825 | 31.2% |
| 3-Person Household | 299 | 11.3% |
| 4+ Person Household | 432 | 16.4% |
| Total Housing Units | 2,643 | 100.0% |
Occupancy by Ownership by Household Size in Spencer
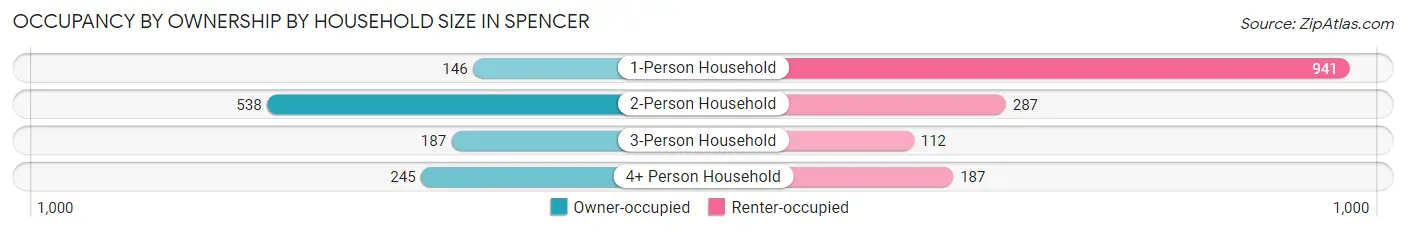
| Household Size | Owner-occupied | Renter-occupied |
| 1-Person Household | 146 (13.4%) | 941 (86.6%) |
| 2-Person Household | 538 (65.2%) | 287 (34.8%) |
| 3-Person Household | 187 (62.5%) | 112 (37.5%) |
| 4+ Person Household | 245 (56.7%) | 187 (43.3%) |
| Total Housing Units | 1,116 (42.2%) | 1,527 (57.8%) |
Occupancy by Educational Attainment in Spencer
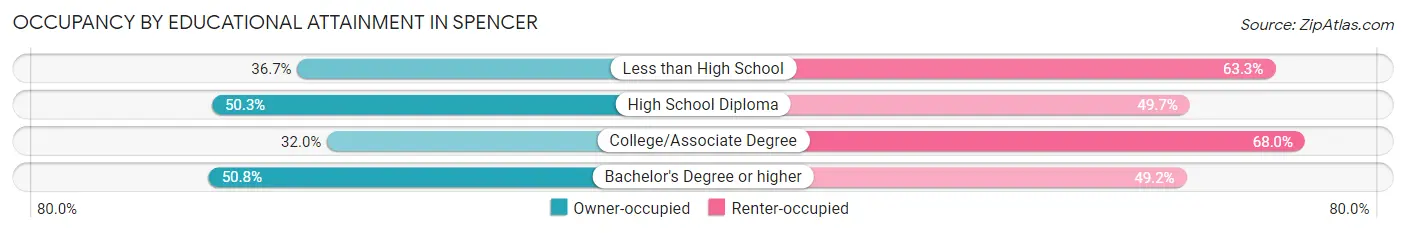
| Household Size | Owner-occupied | Renter-occupied |
| Less than High School | 108 (36.7%) | 186 (63.3%) |
| High School Diploma | 541 (50.3%) | 535 (49.7%) |
| College/Associate Degree | 306 (32.0%) | 650 (68.0%) |
| Bachelor's Degree or higher | 161 (50.8%) | 156 (49.2%) |
Occupancy by Age of Householder in Spencer
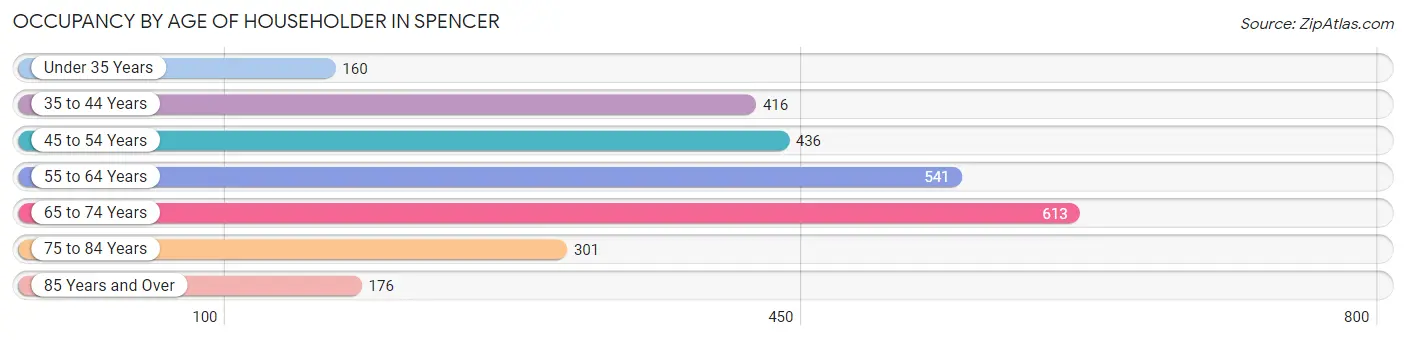
| Age Bracket | # Households | % Households |
| Under 35 Years | 160 | 6.0% |
| 35 to 44 Years | 416 | 15.7% |
| 45 to 54 Years | 436 | 16.5% |
| 55 to 64 Years | 541 | 20.5% |
| 65 to 74 Years | 613 | 23.2% |
| 75 to 84 Years | 301 | 11.4% |
| 85 Years and Over | 176 | 6.7% |
| Total | 2,643 | 100.0% |
Housing Finances in Spencer
Median Income by Occupancy in Spencer
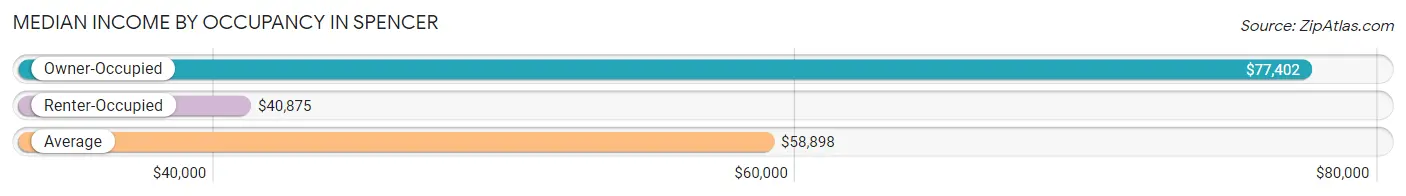
| Occupancy Type | # Households | Median Income |
| Owner-Occupied | 1,116 (42.2%) | $77,402 |
| Renter-Occupied | 1,527 (57.8%) | $40,875 |
| Average | 2,643 (100.0%) | $58,898 |
Occupancy by Householder Income Bracket in Spencer
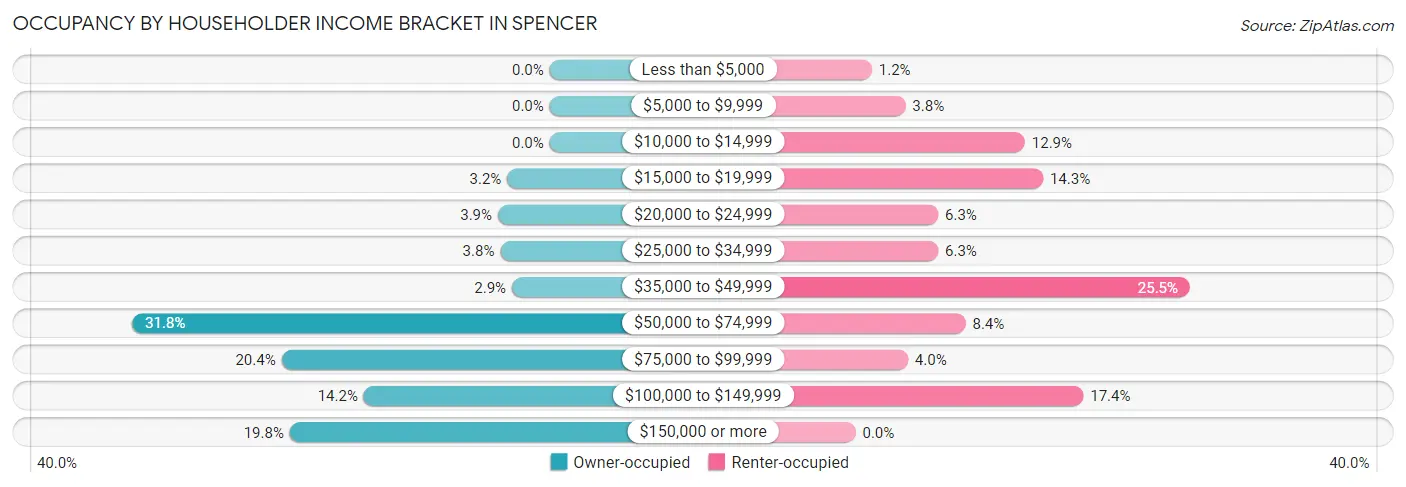
| Income Bracket | Owner-occupied | Renter-occupied |
| Less than $5,000 | 0 (0.0%) | 19 (1.2%) |
| $5,000 to $9,999 | 0 (0.0%) | 58 (3.8%) |
| $10,000 to $14,999 | 0 (0.0%) | 197 (12.9%) |
| $15,000 to $19,999 | 36 (3.2%) | 218 (14.3%) |
| $20,000 to $24,999 | 44 (3.9%) | 96 (6.3%) |
| $25,000 to $34,999 | 42 (3.8%) | 96 (6.3%) |
| $35,000 to $49,999 | 32 (2.9%) | 389 (25.5%) |
| $50,000 to $74,999 | 355 (31.8%) | 128 (8.4%) |
| $75,000 to $99,999 | 228 (20.4%) | 61 (4.0%) |
| $100,000 to $149,999 | 158 (14.2%) | 265 (17.3%) |
| $150,000 or more | 221 (19.8%) | 0 (0.0%) |
| Total | 1,116 (100.0%) | 1,527 (100.0%) |
Monthly Housing Cost Tiers in Spencer
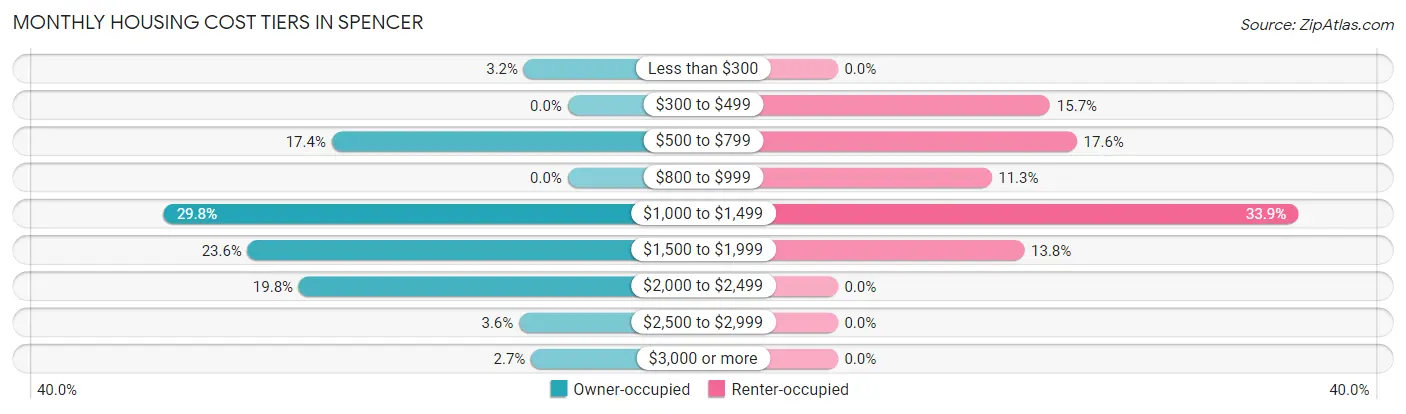
| Monthly Cost | Owner-occupied | Renter-occupied |
| Less than $300 | 36 (3.2%) | 0 (0.0%) |
| $300 to $499 | 0 (0.0%) | 239 (15.7%) |
| $500 to $799 | 194 (17.4%) | 269 (17.6%) |
| $800 to $999 | 0 (0.0%) | 173 (11.3%) |
| $1,000 to $1,499 | 332 (29.7%) | 518 (33.9%) |
| $1,500 to $1,999 | 263 (23.6%) | 210 (13.8%) |
| $2,000 to $2,499 | 221 (19.8%) | 0 (0.0%) |
| $2,500 to $2,999 | 40 (3.6%) | 0 (0.0%) |
| $3,000 or more | 30 (2.7%) | 0 (0.0%) |
| Total | 1,116 (100.0%) | 1,527 (100.0%) |
Physical Housing Characteristics in Spencer
Housing Structures in Spencer
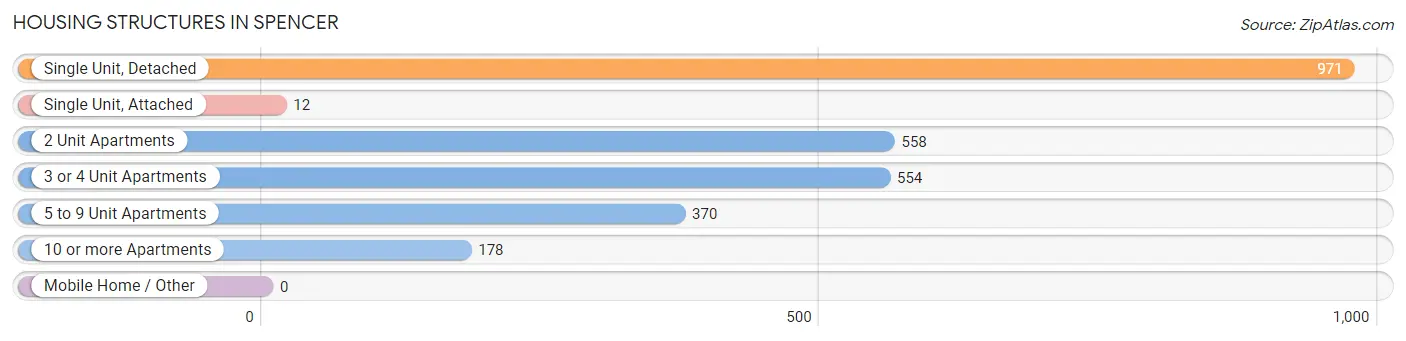
| Structure Type | # Housing Units | % Housing Units |
| Single Unit, Detached | 971 | 36.7% |
| Single Unit, Attached | 12 | 0.4% |
| 2 Unit Apartments | 558 | 21.1% |
| 3 or 4 Unit Apartments | 554 | 21.0% |
| 5 to 9 Unit Apartments | 370 | 14.0% |
| 10 or more Apartments | 178 | 6.7% |
| Mobile Home / Other | 0 | 0.0% |
| Total | 2,643 | 100.0% |
Housing Structures by Occupancy in Spencer
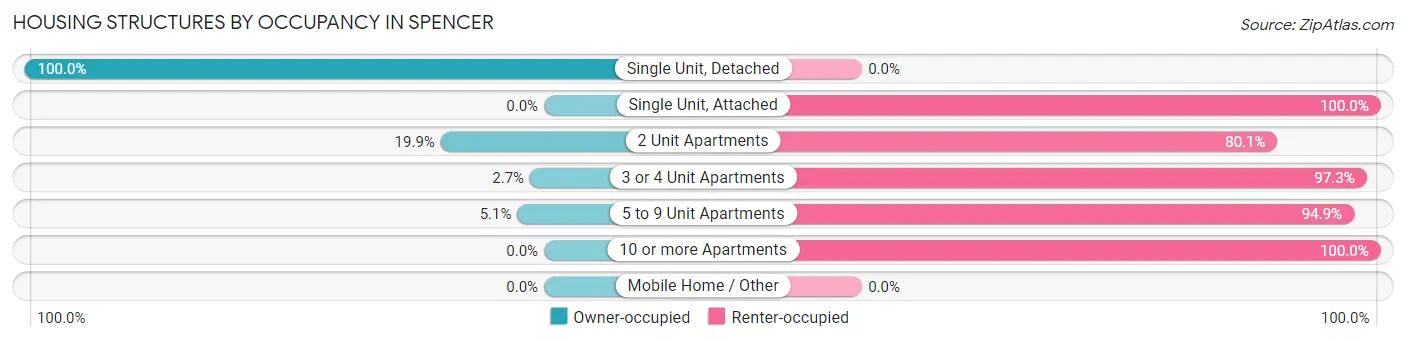
| Structure Type | Owner-occupied | Renter-occupied |
| Single Unit, Detached | 971 (100.0%) | 0 (0.0%) |
| Single Unit, Attached | 0 (0.0%) | 12 (100.0%) |
| 2 Unit Apartments | 111 (19.9%) | 447 (80.1%) |
| 3 or 4 Unit Apartments | 15 (2.7%) | 539 (97.3%) |
| 5 to 9 Unit Apartments | 19 (5.1%) | 351 (94.9%) |
| 10 or more Apartments | 0 (0.0%) | 178 (100.0%) |
| Mobile Home / Other | 0 (0.0%) | 0 (0.0%) |
| Total | 1,116 (42.2%) | 1,527 (57.8%) |
Housing Structures by Number of Rooms in Spencer
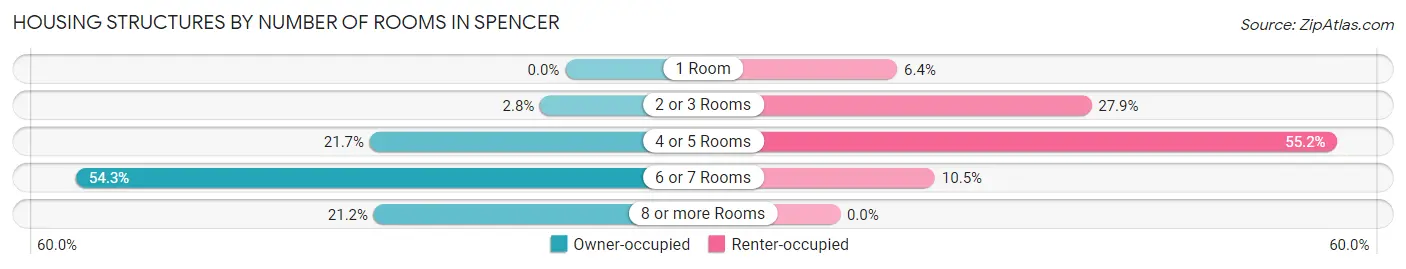
| Number of Rooms | Owner-occupied | Renter-occupied |
| 1 Room | 0 (0.0%) | 97 (6.4%) |
| 2 or 3 Rooms | 31 (2.8%) | 426 (27.9%) |
| 4 or 5 Rooms | 242 (21.7%) | 843 (55.2%) |
| 6 or 7 Rooms | 606 (54.3%) | 161 (10.5%) |
| 8 or more Rooms | 237 (21.2%) | 0 (0.0%) |
| Total | 1,116 (100.0%) | 1,527 (100.0%) |
Housing Structure by Heating Type in Spencer
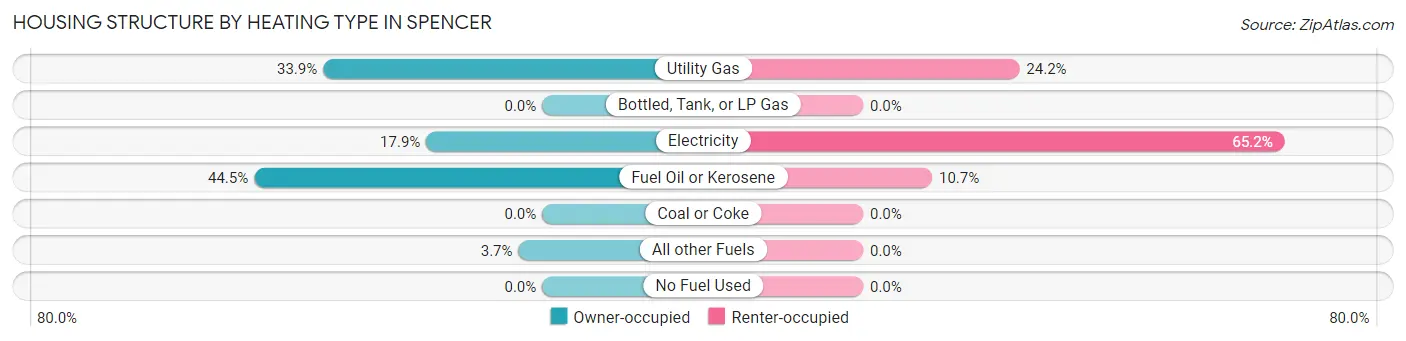
| Heating Type | Owner-occupied | Renter-occupied |
| Utility Gas | 378 (33.9%) | 369 (24.2%) |
| Bottled, Tank, or LP Gas | 0 (0.0%) | 0 (0.0%) |
| Electricity | 200 (17.9%) | 995 (65.2%) |
| Fuel Oil or Kerosene | 497 (44.5%) | 163 (10.7%) |
| Coal or Coke | 0 (0.0%) | 0 (0.0%) |
| All other Fuels | 41 (3.7%) | 0 (0.0%) |
| No Fuel Used | 0 (0.0%) | 0 (0.0%) |
| Total | 1,116 (100.0%) | 1,527 (100.0%) |
Household Vehicle Usage in Spencer
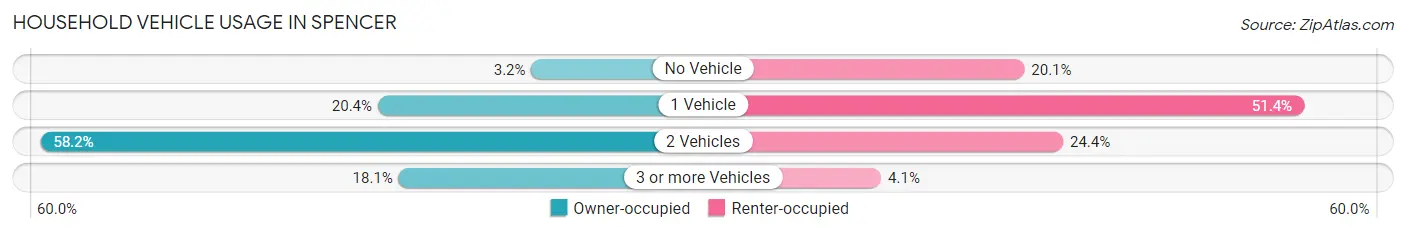
| Vehicles per Household | Owner-occupied | Renter-occupied |
| No Vehicle | 36 (3.2%) | 307 (20.1%) |
| 1 Vehicle | 228 (20.4%) | 785 (51.4%) |
| 2 Vehicles | 650 (58.2%) | 373 (24.4%) |
| 3 or more Vehicles | 202 (18.1%) | 62 (4.1%) |
| Total | 1,116 (100.0%) | 1,527 (100.0%) |
Real Estate & Mortgages in Spencer
Real Estate and Mortgage Overview in Spencer
| Characteristic | Without Mortgage | With Mortgage |
| Housing Units | 473 | 643 |
| Median Property Value | $283,800 | $304,700 |
| Median Household Income | $68,575 | $132 |
| Monthly Housing Costs | $1,004 | $30 |
| Real Estate Taxes | $3,629 | $0 |
Property Value by Mortgage Status in Spencer
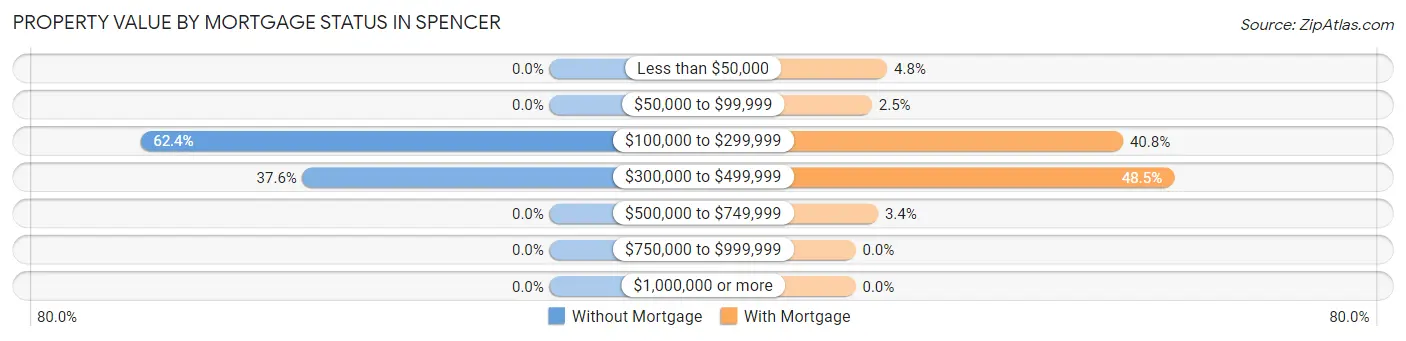
| Property Value | Without Mortgage | With Mortgage |
| Less than $50,000 | 0 (0.0%) | 31 (4.8%) |
| $50,000 to $99,999 | 0 (0.0%) | 16 (2.5%) |
| $100,000 to $299,999 | 295 (62.4%) | 262 (40.7%) |
| $300,000 to $499,999 | 178 (37.6%) | 312 (48.5%) |
| $500,000 to $749,999 | 0 (0.0%) | 22 (3.4%) |
| $750,000 to $999,999 | 0 (0.0%) | 0 (0.0%) |
| $1,000,000 or more | 0 (0.0%) | 0 (0.0%) |
| Total | 473 (100.0%) | 643 (100.0%) |
Household Income by Mortgage Status in Spencer
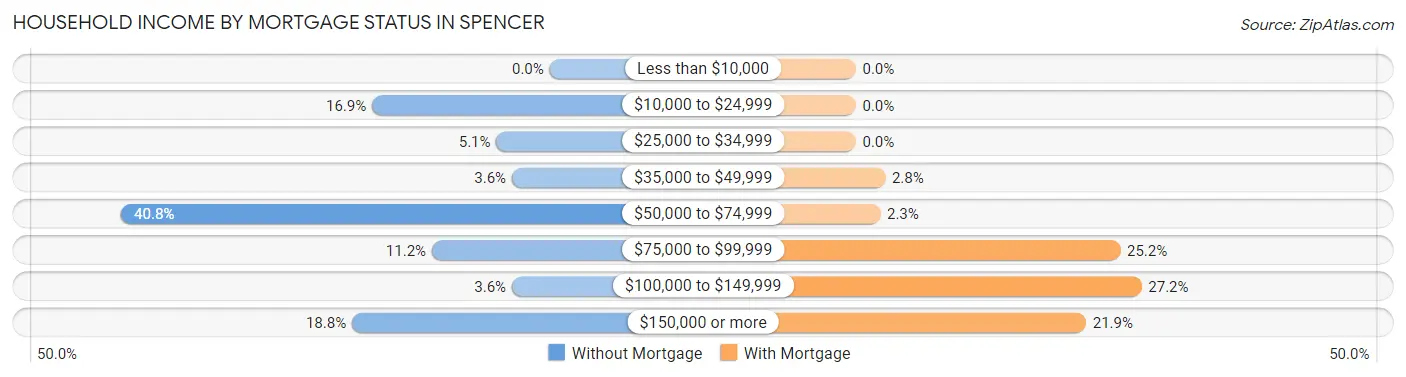
| Household Income | Without Mortgage | With Mortgage |
| Less than $10,000 | 0 (0.0%) | 0 (0.0%) |
| $10,000 to $24,999 | 80 (16.9%) | 0 (0.0%) |
| $25,000 to $34,999 | 24 (5.1%) | 0 (0.0%) |
| $35,000 to $49,999 | 17 (3.6%) | 18 (2.8%) |
| $50,000 to $74,999 | 193 (40.8%) | 15 (2.3%) |
| $75,000 to $99,999 | 53 (11.2%) | 162 (25.2%) |
| $100,000 to $149,999 | 17 (3.6%) | 175 (27.2%) |
| $150,000 or more | 89 (18.8%) | 141 (21.9%) |
| Total | 473 (100.0%) | 643 (100.0%) |
Property Value to Household Income Ratio in Spencer
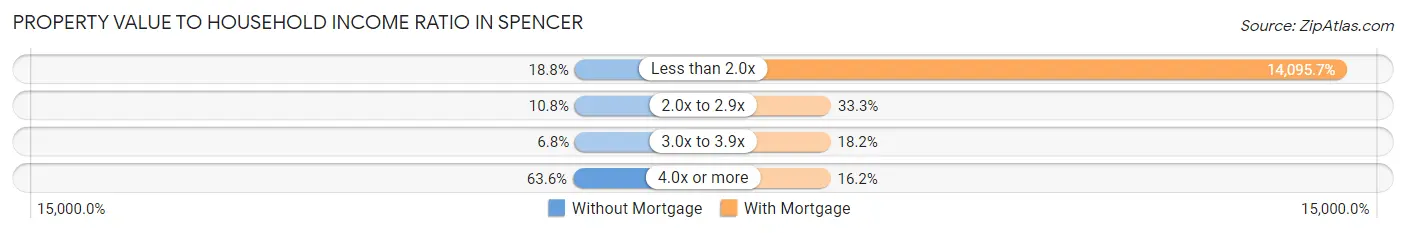
| Value-to-Income Ratio | Without Mortgage | With Mortgage |
| Less than 2.0x | 89 (18.8%) | 90,635 (14,095.7%) |
| 2.0x to 2.9x | 51 (10.8%) | 214 (33.3%) |
| 3.0x to 3.9x | 32 (6.8%) | 117 (18.2%) |
| 4.0x or more | 301 (63.6%) | 104 (16.2%) |
| Total | 473 (100.0%) | 643 (100.0%) |
Real Estate Taxes by Mortgage Status in Spencer
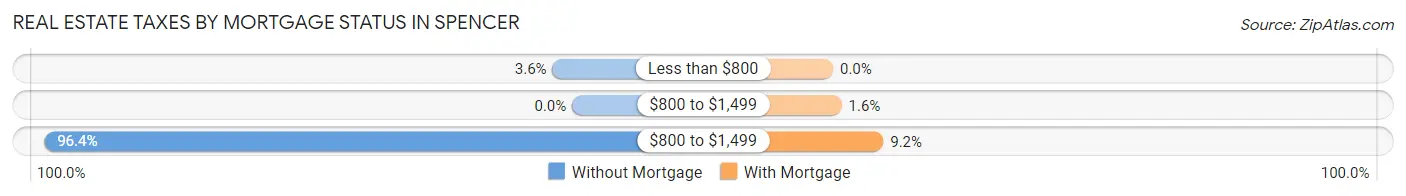
| Property Taxes | Without Mortgage | With Mortgage |
| Less than $800 | 17 (3.6%) | 0 (0.0%) |
| $800 to $1,499 | 0 (0.0%) | 10 (1.6%) |
| $800 to $1,499 | 456 (96.4%) | 59 (9.2%) |
| Total | 473 (100.0%) | 643 (100.0%) |
Health & Disability in Spencer
Health Insurance Coverage by Age in Spencer
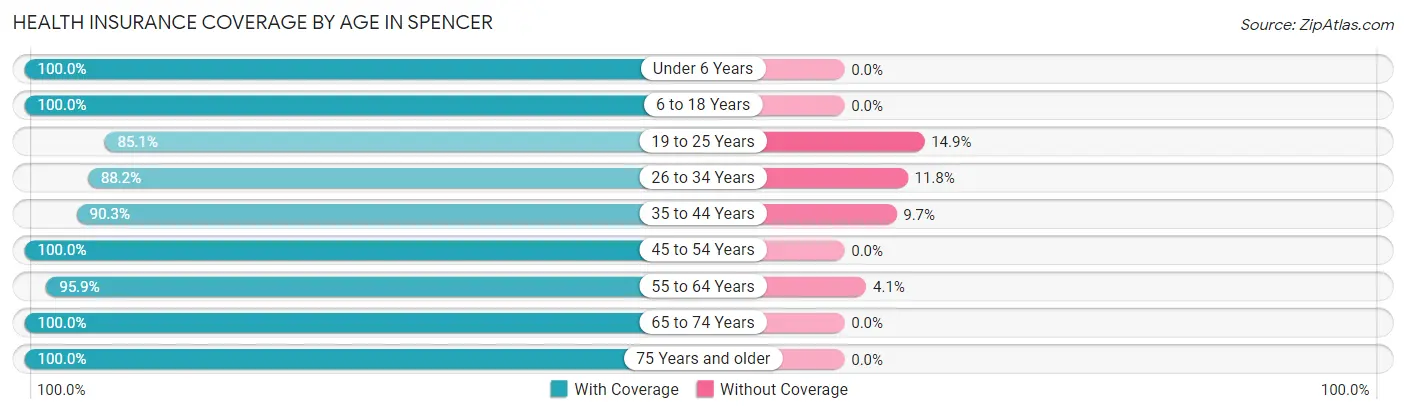
| Age Bracket | With Coverage | Without Coverage |
| Under 6 Years | 87 (100.0%) | 0 (0.0%) |
| 6 to 18 Years | 743 (100.0%) | 0 (0.0%) |
| 19 to 25 Years | 371 (85.1%) | 65 (14.9%) |
| 26 to 34 Years | 464 (88.2%) | 62 (11.8%) |
| 35 to 44 Years | 634 (90.3%) | 68 (9.7%) |
| 45 to 54 Years | 663 (100.0%) | 0 (0.0%) |
| 55 to 64 Years | 1,039 (95.9%) | 44 (4.1%) |
| 65 to 74 Years | 807 (100.0%) | 0 (0.0%) |
| 75 Years and older | 590 (100.0%) | 0 (0.0%) |
| Total | 5,398 (95.8%) | 239 (4.2%) |
Health Insurance Coverage by Citizenship Status in Spencer
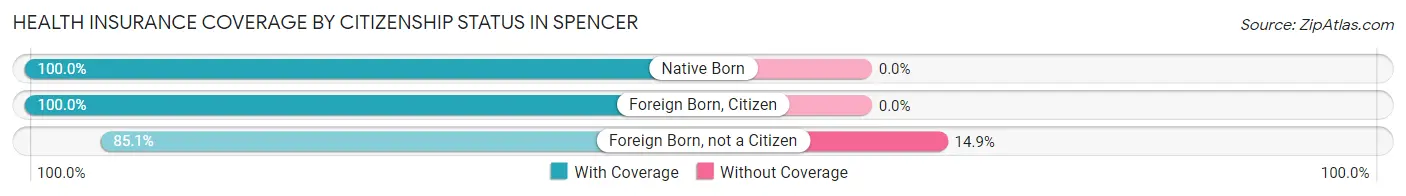
| Citizenship Status | With Coverage | Without Coverage |
| Native Born | 87 (100.0%) | 0 (0.0%) |
| Foreign Born, Citizen | 743 (100.0%) | 0 (0.0%) |
| Foreign Born, not a Citizen | 371 (85.1%) | 65 (14.9%) |
Health Insurance Coverage by Household Income in Spencer
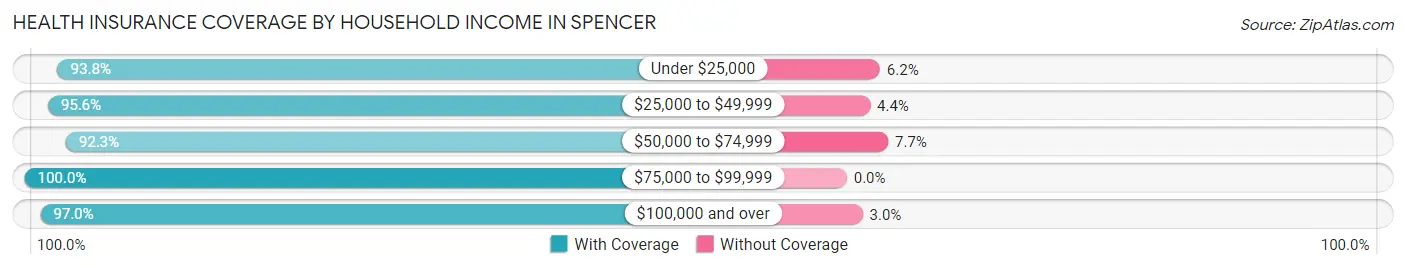
| Household Income | With Coverage | Without Coverage |
| Under $25,000 | 666 (93.8%) | 44 (6.2%) |
| $25,000 to $49,999 | 834 (95.6%) | 38 (4.4%) |
| $50,000 to $74,999 | 1,096 (92.3%) | 92 (7.7%) |
| $75,000 to $99,999 | 658 (100.0%) | 0 (0.0%) |
| $100,000 and over | 2,133 (97.0%) | 65 (3.0%) |
Public vs Private Health Insurance Coverage by Age in Spencer
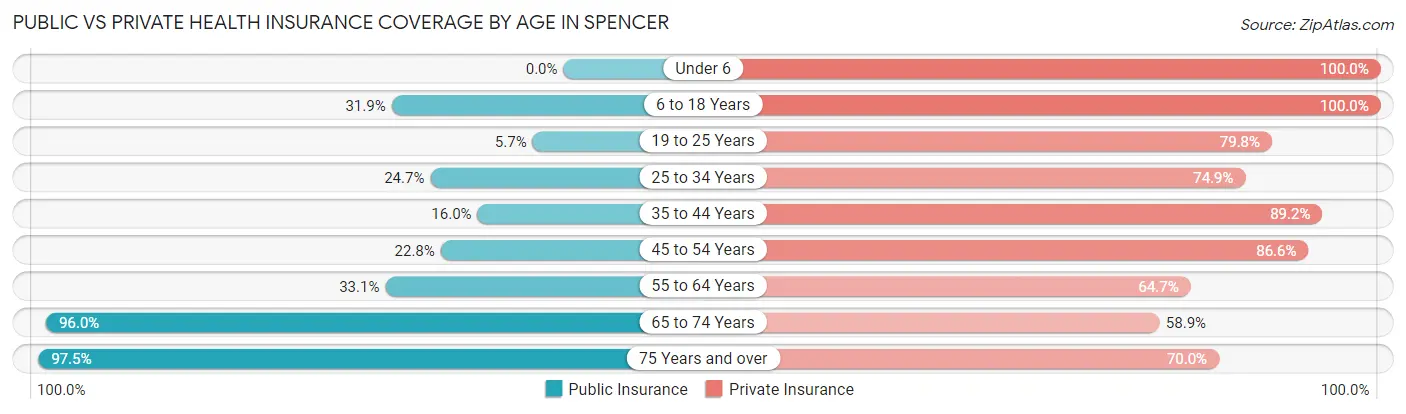
| Age Bracket | Public Insurance | Private Insurance |
| Under 6 | 0 (0.0%) | 87 (100.0%) |
| 6 to 18 Years | 237 (31.9%) | 743 (100.0%) |
| 19 to 25 Years | 25 (5.7%) | 348 (79.8%) |
| 25 to 34 Years | 130 (24.7%) | 394 (74.9%) |
| 35 to 44 Years | 112 (16.0%) | 626 (89.2%) |
| 45 to 54 Years | 151 (22.8%) | 574 (86.6%) |
| 55 to 64 Years | 358 (33.1%) | 701 (64.7%) |
| 65 to 74 Years | 775 (96.0%) | 475 (58.9%) |
| 75 Years and over | 575 (97.5%) | 413 (70.0%) |
| Total | 2,363 (41.9%) | 4,361 (77.4%) |
Disability Status by Sex by Age in Spencer
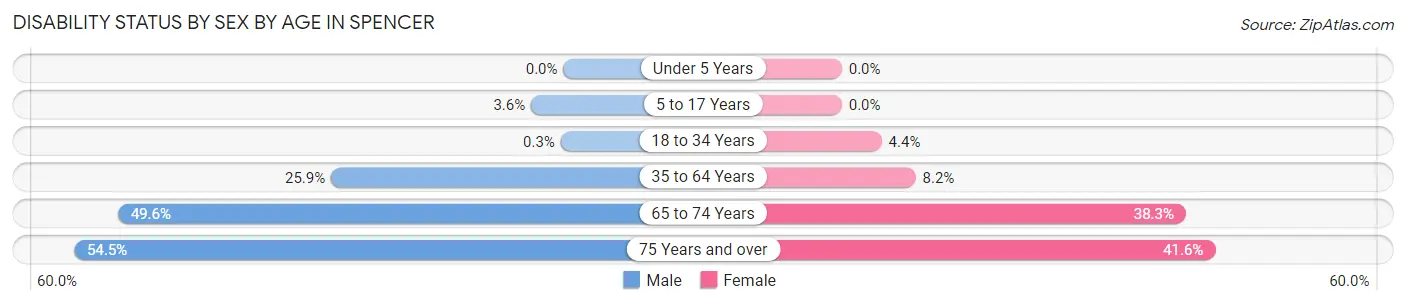
| Age Bracket | Male | Female |
| Under 5 Years | 0 (0.0%) | 0 (0.0%) |
| 5 to 17 Years | 15 (3.6%) | 0 (0.0%) |
| 18 to 34 Years | 2 (0.3%) | 18 (4.4%) |
| 35 to 64 Years | 306 (25.9%) | 104 (8.2%) |
| 65 to 74 Years | 271 (49.6%) | 100 (38.3%) |
| 75 Years and over | 121 (54.5%) | 153 (41.6%) |
Disability Class by Sex by Age in Spencer
Disability Class: Hearing Difficulty
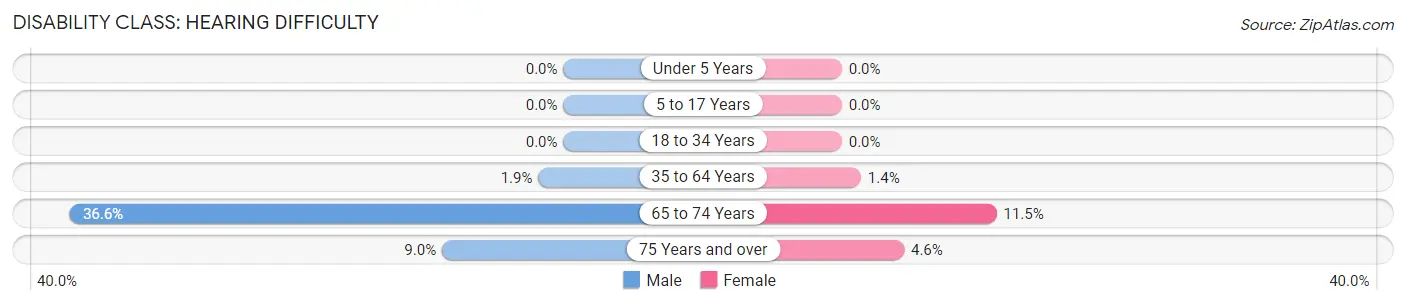
| Age Bracket | Male | Female |
| Under 5 Years | 0 (0.0%) | 0 (0.0%) |
| 5 to 17 Years | 0 (0.0%) | 0 (0.0%) |
| 18 to 34 Years | 0 (0.0%) | 0 (0.0%) |
| 35 to 64 Years | 22 (1.9%) | 18 (1.4%) |
| 65 to 74 Years | 200 (36.6%) | 30 (11.5%) |
| 75 Years and over | 20 (9.0%) | 17 (4.6%) |
Disability Class: Vision Difficulty
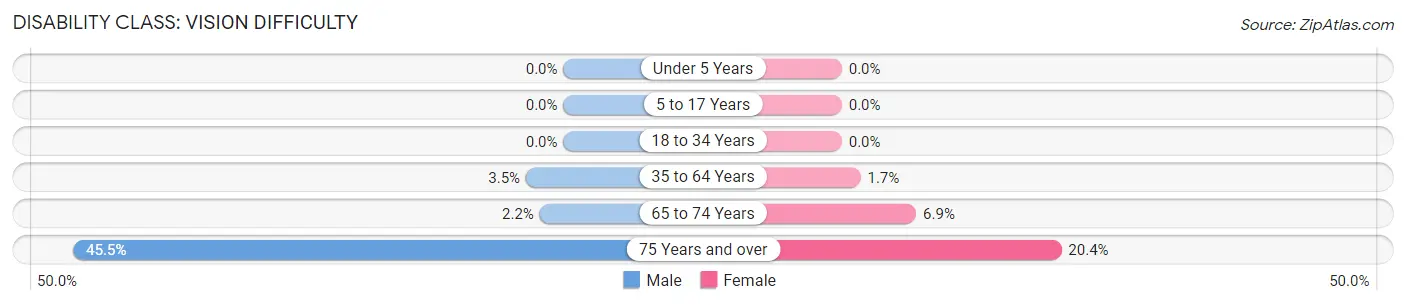
| Age Bracket | Male | Female |
| Under 5 Years | 0 (0.0%) | 0 (0.0%) |
| 5 to 17 Years | 0 (0.0%) | 0 (0.0%) |
| 18 to 34 Years | 0 (0.0%) | 0 (0.0%) |
| 35 to 64 Years | 41 (3.5%) | 22 (1.7%) |
| 65 to 74 Years | 12 (2.2%) | 18 (6.9%) |
| 75 Years and over | 101 (45.5%) | 75 (20.4%) |
Disability Class: Cognitive Difficulty
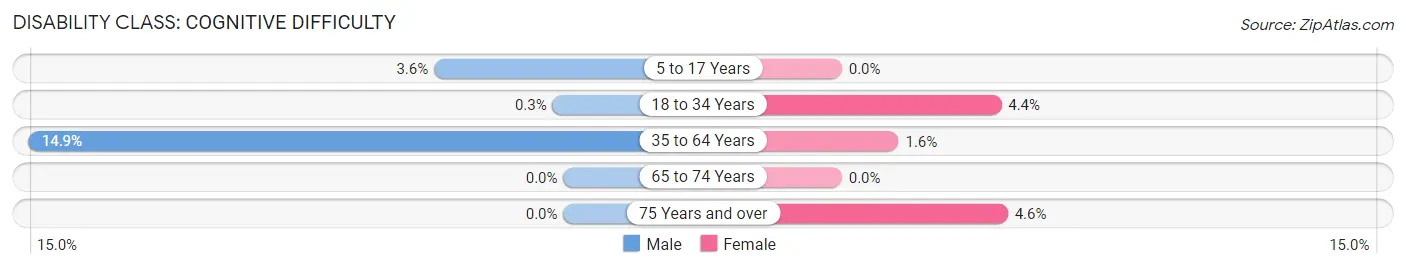
| Age Bracket | Male | Female |
| 5 to 17 Years | 15 (3.6%) | 0 (0.0%) |
| 18 to 34 Years | 2 (0.3%) | 18 (4.4%) |
| 35 to 64 Years | 176 (14.9%) | 20 (1.6%) |
| 65 to 74 Years | 0 (0.0%) | 0 (0.0%) |
| 75 Years and over | 0 (0.0%) | 17 (4.6%) |
Disability Class: Ambulatory Difficulty
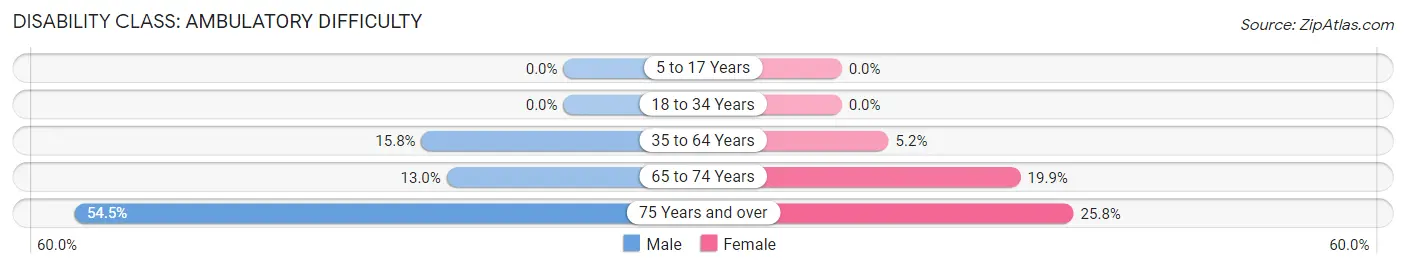
| Age Bracket | Male | Female |
| 5 to 17 Years | 0 (0.0%) | 0 (0.0%) |
| 18 to 34 Years | 0 (0.0%) | 0 (0.0%) |
| 35 to 64 Years | 187 (15.8%) | 66 (5.2%) |
| 65 to 74 Years | 71 (13.0%) | 52 (19.9%) |
| 75 Years and over | 121 (54.5%) | 95 (25.8%) |
Disability Class: Self-Care Difficulty
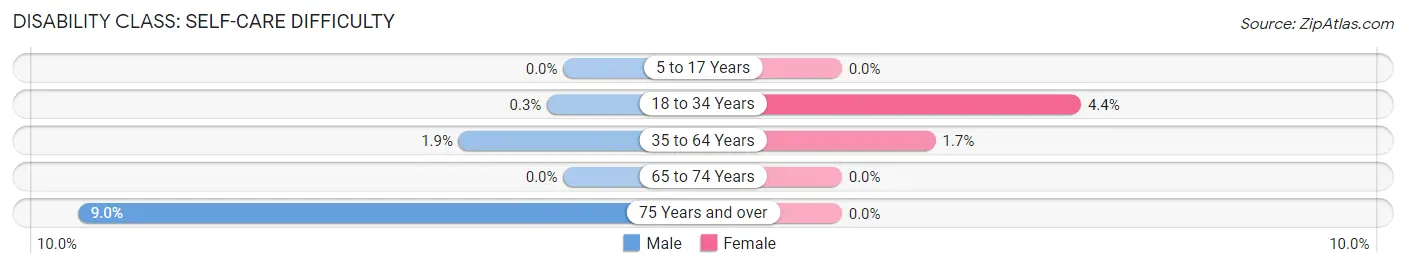
| Age Bracket | Male | Female |
| 5 to 17 Years | 0 (0.0%) | 0 (0.0%) |
| 18 to 34 Years | 2 (0.3%) | 18 (4.4%) |
| 35 to 64 Years | 23 (1.9%) | 22 (1.7%) |
| 65 to 74 Years | 0 (0.0%) | 0 (0.0%) |
| 75 Years and over | 20 (9.0%) | 0 (0.0%) |
Technology Access in Spencer
Computing Device Access in Spencer
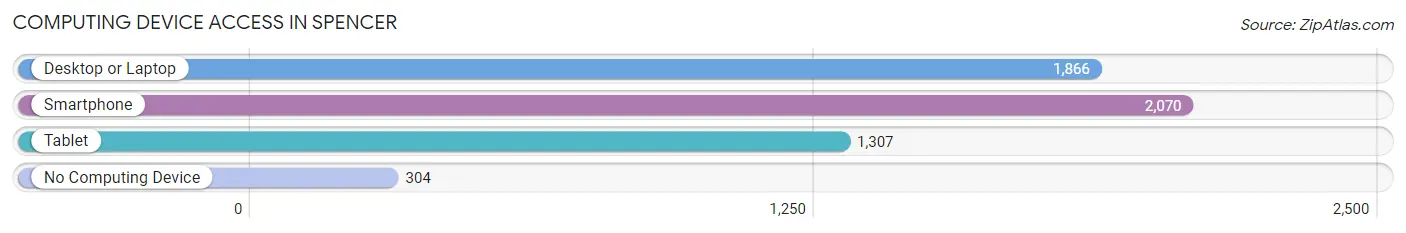
| Device Type | # Households | % Households |
| Desktop or Laptop | 1,866 | 70.6% |
| Smartphone | 2,070 | 78.3% |
| Tablet | 1,307 | 49.4% |
| No Computing Device | 304 | 11.5% |
| Total | 2,643 | 100.0% |
Internet Access in Spencer
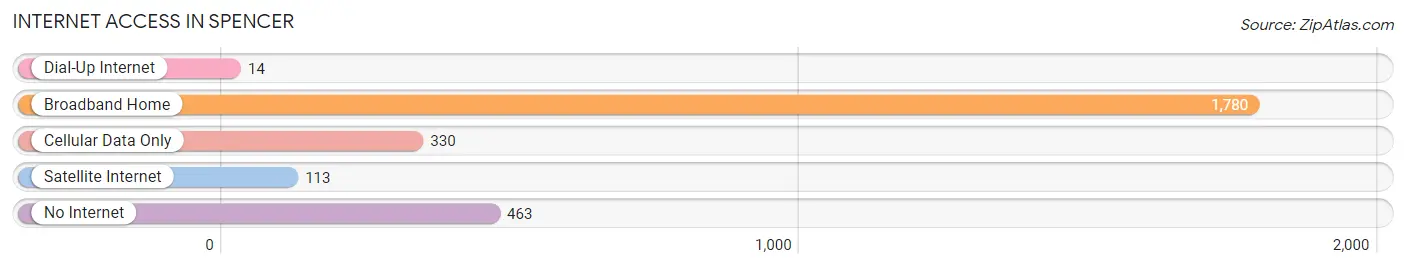
| Internet Type | # Households | % Households |
| Dial-Up Internet | 14 | 0.5% |
| Broadband Home | 1,780 | 67.3% |
| Cellular Data Only | 330 | 12.5% |
| Satellite Internet | 113 | 4.3% |
| No Internet | 463 | 17.5% |
| Total | 2,643 | 100.0% |
Spencer Summary
Spencer, Massachusetts is a small town located in Worcester County, approximately 40 miles west of Boston. It is bordered by Leicester, Worcester, and East Brookfield. The town has a population of 11,688, according to the 2010 census.
History
Spencer was first settled in 1717 and was officially incorporated in 1753. The town was named after the Spencer family, who were among the first settlers. The town was originally an agricultural community, with many of the early settlers being farmers. In the 19th century, the town began to industrialize, with the opening of several mills and factories. The town was also home to the first cotton mill in the United States, which was built in 1810.
Geography
Spencer is located in central Massachusetts, in Worcester County. It is bordered by Leicester, Worcester, and East Brookfield. The town is located on the Quaboag River, which runs through the center of town. The town is mostly rural, with a few small villages and hamlets. The highest point in town is the summit of Spencer Mountain, which is located in the northern part of town.
Economy
Spencer’s economy is largely based on agriculture and manufacturing. The town is home to several farms, which produce a variety of crops, including corn, hay, and apples. The town is also home to several small manufacturing companies, which produce a variety of products, including textiles, paper products, and plastics.
Demographics
According to the 2010 census, Spencer has a population of 11,688. The town has a median household income of $60,945, and a median family income of $71,945. The town is predominantly white, with 92.3% of the population identifying as such. The town also has a large Hispanic population, with 8.3% of the population identifying as Hispanic or Latino.
Spencer is a small town with a rich history and a diverse population. The town is home to several farms and manufacturing companies, which provide employment opportunities for its residents. The town is also home to a variety of recreational activities, including hiking, fishing, and camping. Spencer is a great place to live and work, and is a great example of a small New England town.
Common Questions
What is Per Capita Income in Spencer?
Per Capita income in Spencer is $36,976.
What is the Median Family Income in Spencer?
Median Family Income in Spencer is $79,732.
What is the Median Household income in Spencer?
Median Household Income in Spencer is $58,898.
What is Income or Wage Gap in Spencer?
Income or Wage Gap in Spencer is 6.6%.
Women in Spencer earn 93.4 cents for every dollar earned by a man.
What is Inequality or Gini Index in Spencer?
Inequality or Gini Index in Spencer is 0.46.
What is the Total Population of Spencer?
Total Population of Spencer is 5,637.
What is the Total Male Population of Spencer?
Total Male Population of Spencer is 3,056.
What is the Total Female Population of Spencer?
Total Female Population of Spencer is 2,581.
What is the Ratio of Males per 100 Females in Spencer?
There are 118.40 Males per 100 Females in Spencer.
What is the Ratio of Females per 100 Males in Spencer?
There are 84.46 Females per 100 Males in Spencer.
What is the Median Population Age in Spencer?
Median Population Age in Spencer is 49.7 Years.
What is the Average Family Size in Spencer
Average Family Size in Spencer is 2.9 People.
What is the Average Household Size in Spencer
Average Household Size in Spencer is 2.1 People.
How Large is the Labor Force in Spencer?
There are 3,079 People in the Labor Forcein in Spencer.
What is the Percentage of People in the Labor Force in Spencer?
60.8% of People are in the Labor Force in Spencer.
What is the Unemployment Rate in Spencer?
Unemployment Rate in Spencer is 7.9%.