Huntington, MA Map & Demographics
Huntington Map
Huntington Overview
$29,911
PER CAPITA INCOME
$75,972
AVG FAMILY INCOME
$58,646
AVG HOUSEHOLD INCOME
44.4%
WAGE / INCOME GAP [ % ]
55.6¢/ $1
WAGE / INCOME GAP [ $ ]
0.37
INEQUALITY / GINI INDEX
865
TOTAL POPULATION
381
MALE POPULATION
484
FEMALE POPULATION
78.72
MALES / 100 FEMALES
127.03
FEMALES / 100 MALES
34.8
MEDIAN AGE
3.2
AVG FAMILY SIZE
2.6
AVG HOUSEHOLD SIZE
458
LABOR FORCE [ PEOPLE ]
73.8%
PERCENT IN LABOR FORCE
3.5%
UNEMPLOYMENT RATE
Huntington Zip Codes
Huntington Area Codes
Income in Huntington
Income Overview in Huntington
Per Capita Income in Huntington is $29,911, while median incomes of families and households are $75,972 and $58,646 respectively.
| Characteristic | Number | Measure |
| Per Capita Income | 865 | $29,911 |
| Median Family Income | 225 | $75,972 |
| Mean Family Income | 225 | $89,025 |
| Median Household Income | 338 | $58,646 |
| Mean Household Income | 338 | $75,484 |
| Income Deficit | 225 | $0 |
| Wage / Income Gap (%) | 865 | 44.40% |
| Wage / Income Gap ($) | 865 | 55.60¢ per $1 |
| Gini / Inequality Index | 865 | 0.37 |
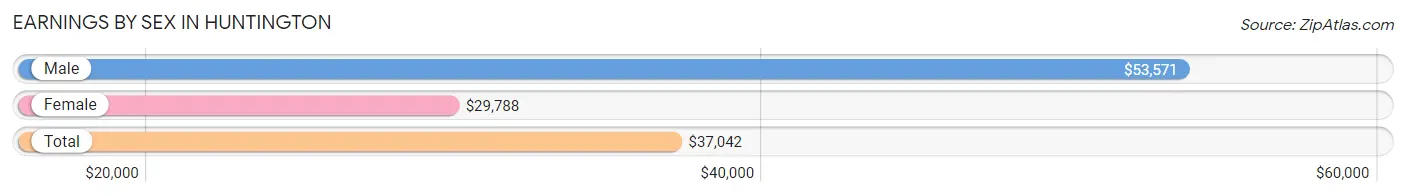
Earnings by Sex in Huntington
Average Earnings in Huntington are $37,042, $53,571 for men and $29,788 for women, a difference of 44.4%.
| Sex | Number | Average Earnings |
| Male | 212 (45.2%) | $53,571 |
| Female | 257 (54.8%) | $29,788 |
| Total | 469 (100.0%) | $37,042 |
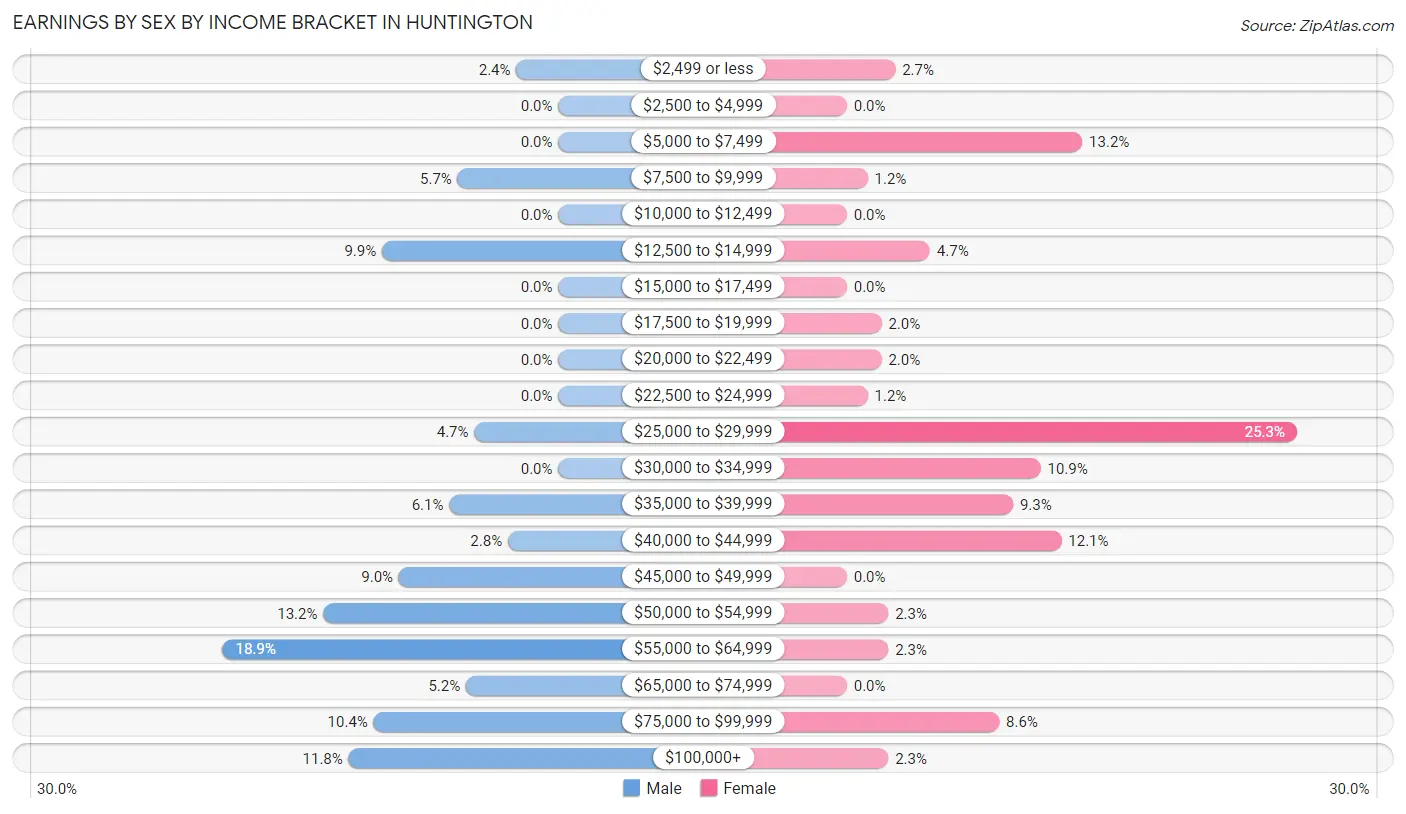
Earnings by Sex by Income Bracket in Huntington
The most common earnings brackets in Huntington are $55,000 to $64,999 for men (40 | 18.9%) and $25,000 to $29,999 for women (65 | 25.3%).
| Income | Male | Female |
| $2,499 or less | 5 (2.4%) | 7 (2.7%) |
| $2,500 to $4,999 | 0 (0.0%) | 0 (0.0%) |
| $5,000 to $7,499 | 0 (0.0%) | 34 (13.2%) |
| $7,500 to $9,999 | 12 (5.7%) | 3 (1.2%) |
| $10,000 to $12,499 | 0 (0.0%) | 0 (0.0%) |
| $12,500 to $14,999 | 21 (9.9%) | 12 (4.7%) |
| $15,000 to $17,499 | 0 (0.0%) | 0 (0.0%) |
| $17,500 to $19,999 | 0 (0.0%) | 5 (1.9%) |
| $20,000 to $22,499 | 0 (0.0%) | 5 (1.9%) |
| $22,500 to $24,999 | 0 (0.0%) | 3 (1.2%) |
| $25,000 to $29,999 | 10 (4.7%) | 65 (25.3%) |
| $30,000 to $34,999 | 0 (0.0%) | 28 (10.9%) |
| $35,000 to $39,999 | 13 (6.1%) | 24 (9.3%) |
| $40,000 to $44,999 | 6 (2.8%) | 31 (12.1%) |
| $45,000 to $49,999 | 19 (9.0%) | 0 (0.0%) |
| $50,000 to $54,999 | 28 (13.2%) | 6 (2.3%) |
| $55,000 to $64,999 | 40 (18.9%) | 6 (2.3%) |
| $65,000 to $74,999 | 11 (5.2%) | 0 (0.0%) |
| $75,000 to $99,999 | 22 (10.4%) | 22 (8.6%) |
| $100,000+ | 25 (11.8%) | 6 (2.3%) |
| Total | 212 (100.0%) | 257 (100.0%) |
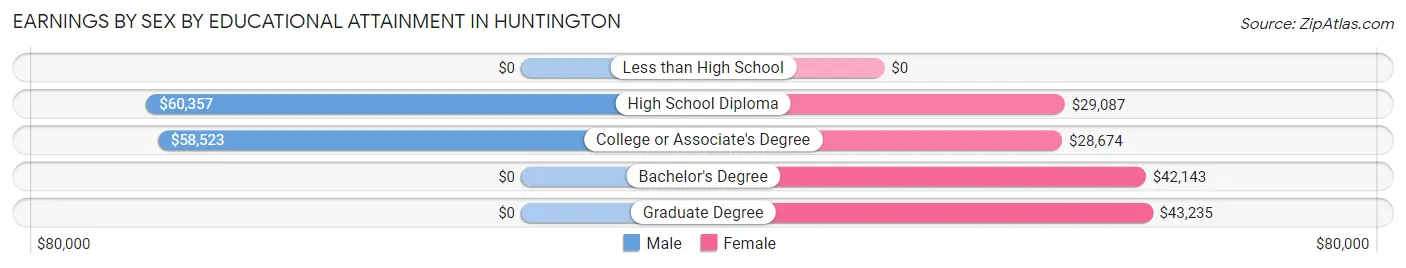
Earnings by Sex by Educational Attainment in Huntington
Average earnings in Huntington are $58,258 for men and $29,769 for women, a difference of 48.9%. Men with an educational attainment of high school diploma enjoy the highest average annual earnings of $60,357, while those with college or associate's degree education earn the least with $58,523. Women with an educational attainment of graduate degree earn the most with the average annual earnings of $43,235, while those with college or associate's degree education have the smallest earnings of $28,674.
| Educational Attainment | Male Income | Female Income |
| Less than High School | - | - |
| High School Diploma | $60,357 | $29,087 |
| College or Associate's Degree | $58,523 | $28,674 |
| Bachelor's Degree | - | - |
| Graduate Degree | - | - |
| Total | $58,258 | $29,769 |
Family Income in Huntington
Family Income Brackets in Huntington
According to the Huntington family income data, there are 52 families falling into the $35,000 to $49,999 income range, which is the most common income bracket and makes up 23.1% of all families.
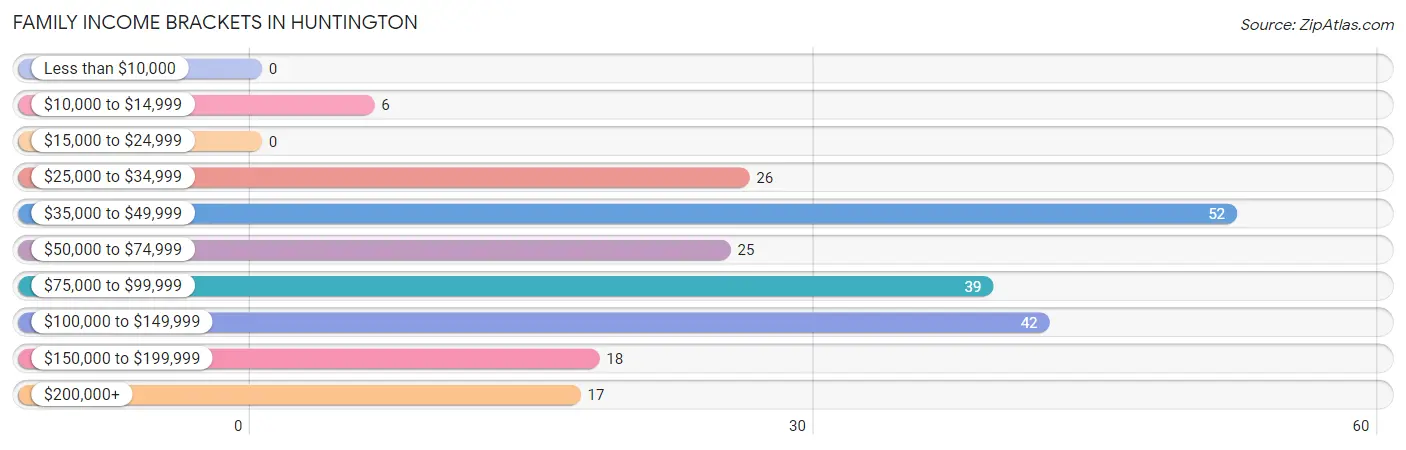
| Income Bracket | # Families | % Families |
| Less than $10,000 | 0 | 0.0% |
| $10,000 to $14,999 | 6 | 2.7% |
| $15,000 to $24,999 | 0 | 0.0% |
| $25,000 to $34,999 | 26 | 11.6% |
| $35,000 to $49,999 | 52 | 23.1% |
| $50,000 to $74,999 | 25 | 11.1% |
| $75,000 to $99,999 | 39 | 17.3% |
| $100,000 to $149,999 | 42 | 18.7% |
| $150,000 to $199,999 | 18 | 8.0% |
| $200,000+ | 17 | 7.6% |
Family Income by Famaliy Size in Huntington
4-person families (26 | 11.6%) account for the highest median family income in Huntington with $182,679 per family, while 4-person families (26 | 11.6%) have the highest median income of $45,670 per family member.
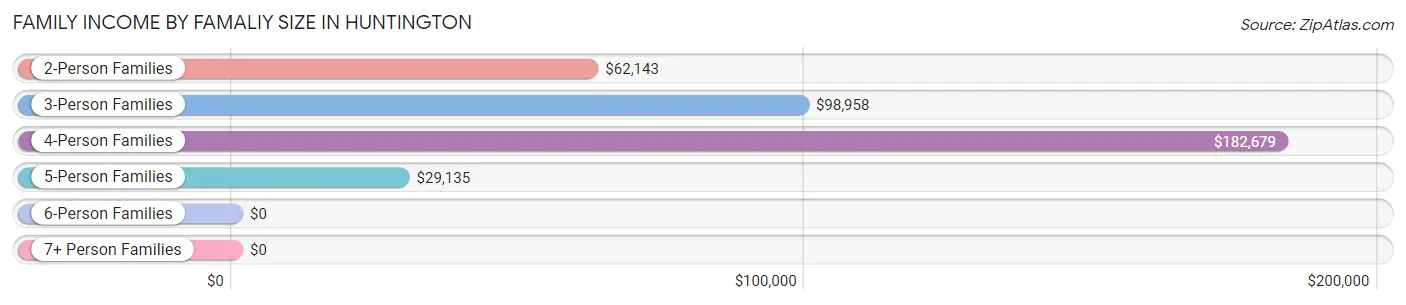
| Income Bracket | # Families | Median Income |
| 2-Person Families | 70 (31.1%) | $62,143 |
| 3-Person Families | 95 (42.2%) | $98,958 |
| 4-Person Families | 26 (11.6%) | $182,679 |
| 5-Person Families | 34 (15.1%) | $29,135 |
| 6-Person Families | 0 (0.0%) | $0 |
| 7+ Person Families | 0 (0.0%) | $0 |
| Total | 225 (100.0%) | $75,972 |
Family Income by Number of Earners in Huntington
The median family income in Huntington is $75,972, with families comprising 3+ earners (32) having the highest median family income of $168,750, while families with 1 earner (94) have the lowest median family income of $44,706, accounting for 14.2% and 41.8% of families, respectively.
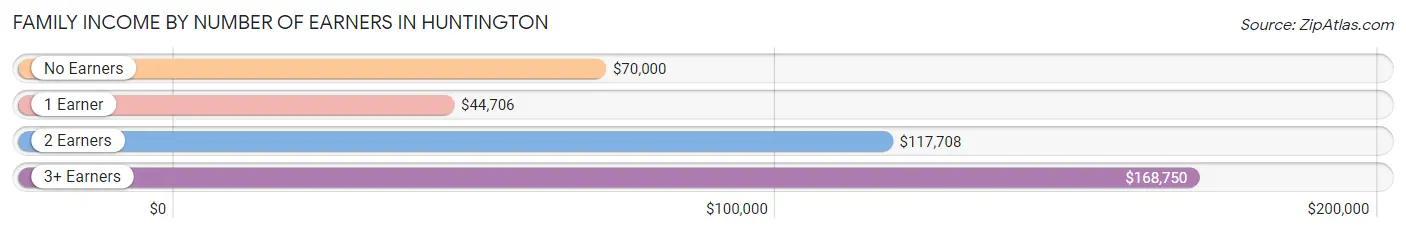
| Number of Earners | # Families | Median Income |
| No Earners | 30 (13.3%) | $70,000 |
| 1 Earner | 94 (41.8%) | $44,706 |
| 2 Earners | 69 (30.7%) | $117,708 |
| 3+ Earners | 32 (14.2%) | $168,750 |
| Total | 225 (100.0%) | $75,972 |
Household Income in Huntington
Household Income Brackets in Huntington
With 78 households falling in the category, the $50,000 to $74,999 income range is the most frequent in Huntington, accounting for 23.1% of all households.
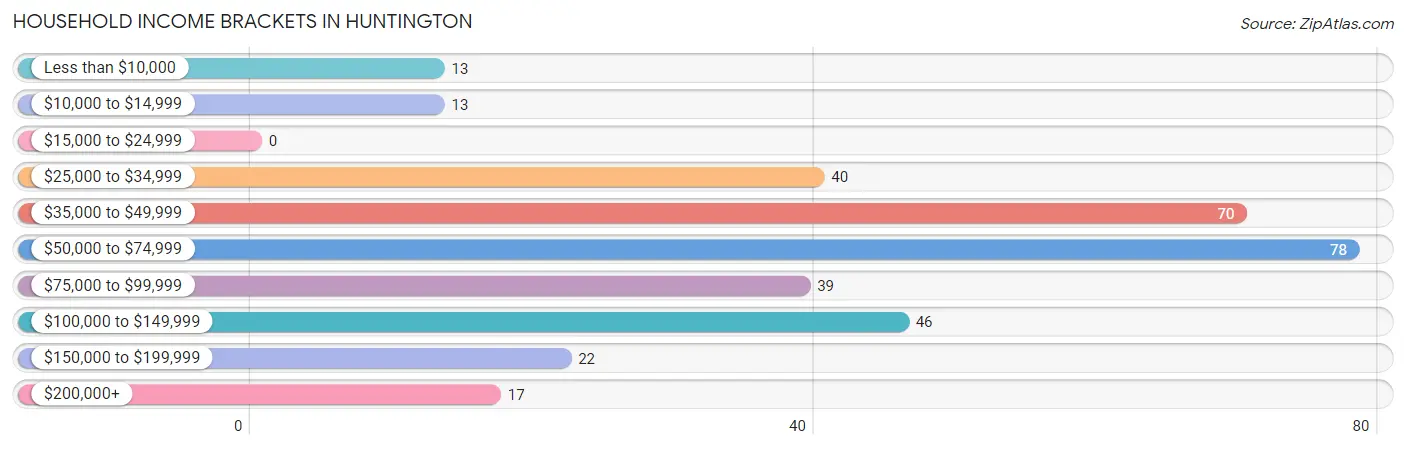
| Income Bracket | # Households | % Households |
| Less than $10,000 | 13 | 3.8% |
| $10,000 to $14,999 | 13 | 3.8% |
| $15,000 to $24,999 | 0 | 0.0% |
| $25,000 to $34,999 | 40 | 11.8% |
| $35,000 to $49,999 | 70 | 20.7% |
| $50,000 to $74,999 | 78 | 23.1% |
| $75,000 to $99,999 | 39 | 11.5% |
| $100,000 to $149,999 | 46 | 13.6% |
| $150,000 to $199,999 | 22 | 6.5% |
| $200,000+ | 17 | 5.0% |
Household Income by Householder Age in Huntington
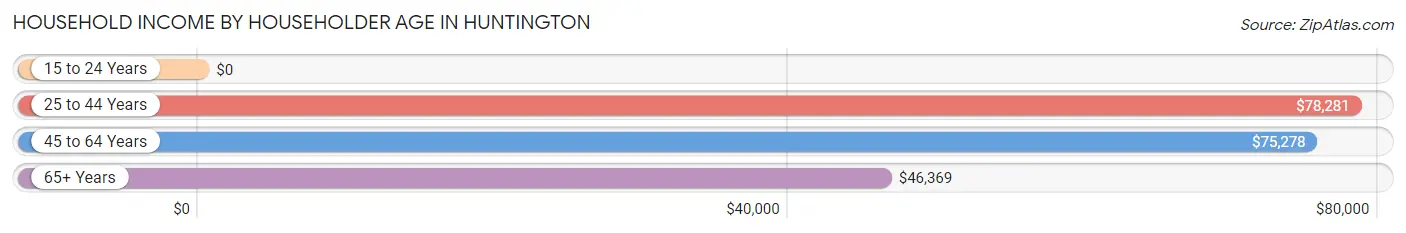
The median household income in Huntington is $58,646, with the highest median household income of $78,281 found in the 25 to 44 years age bracket for the primary householder. A total of 95 households (28.1%) fall into this category. Meanwhile, the 15 to 24 years age bracket for the primary householder has the lowest median household income of $0, with 16 households (4.7%) in this group.
| Income Bracket | # Households | Median Income |
| 15 to 24 Years | 16 (4.7%) | $0 |
| 25 to 44 Years | 95 (28.1%) | $78,281 |
| 45 to 64 Years | 116 (34.3%) | $75,278 |
| 65+ Years | 111 (32.8%) | $46,369 |
| Total | 338 (100.0%) | $58,646 |
Poverty in Huntington
Income Below Poverty by Sex and Age in Huntington
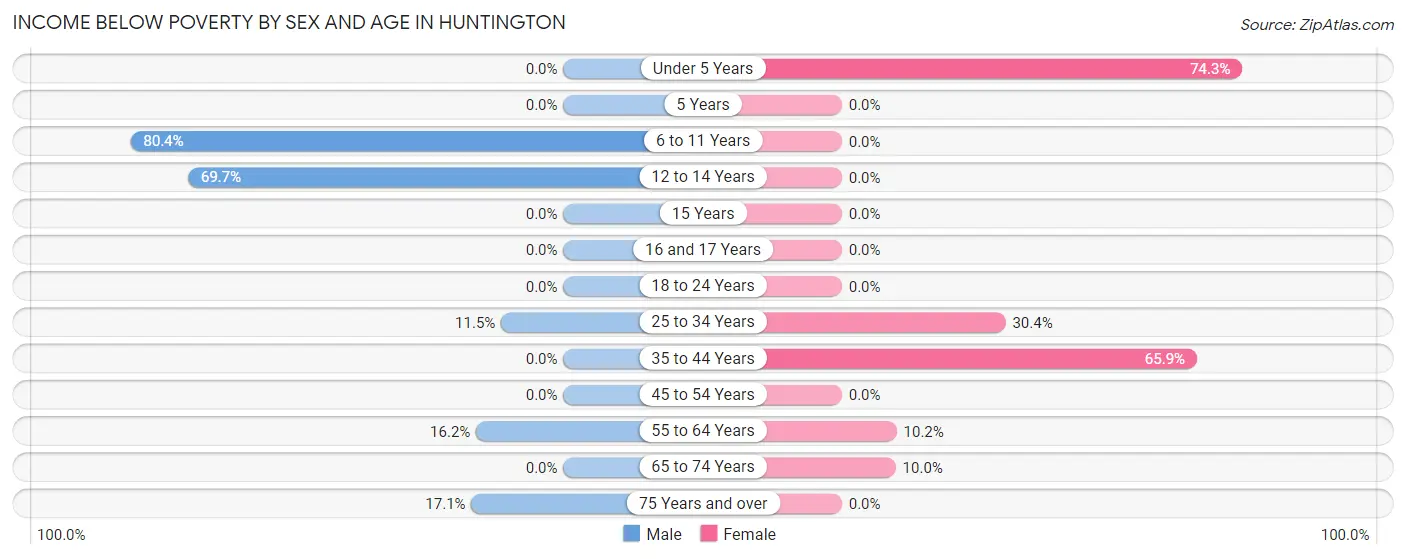
With 24.1% poverty level for males and 25.0% for females among the residents of Huntington, 6 to 11 year old males and under 5 year old females are the most vulnerable to poverty, with 45 males (80.4%) and 55 females (74.3%) in their respective age groups living below the poverty level.
| Age Bracket | Male | Female |
| Under 5 Years | 0 (0.0%) | 55 (74.3%) |
| 5 Years | 0 (0.0%) | 0 (0.0%) |
| 6 to 11 Years | 45 (80.4%) | 0 (0.0%) |
| 12 to 14 Years | 23 (69.7%) | 0 (0.0%) |
| 15 Years | 0 (0.0%) | 0 (0.0%) |
| 16 and 17 Years | 0 (0.0%) | 0 (0.0%) |
| 18 to 24 Years | 0 (0.0%) | 0 (0.0%) |
| 25 to 34 Years | 6 (11.5%) | 24 (30.4%) |
| 35 to 44 Years | 0 (0.0%) | 29 (65.9%) |
| 45 to 54 Years | 0 (0.0%) | 0 (0.0%) |
| 55 to 64 Years | 11 (16.2%) | 6 (10.2%) |
| 65 to 74 Years | 0 (0.0%) | 7 (10.0%) |
| 75 Years and over | 7 (17.1%) | 0 (0.0%) |
| Total | 92 (24.1%) | 121 (25.0%) |
Income Above Poverty by Sex and Age in Huntington
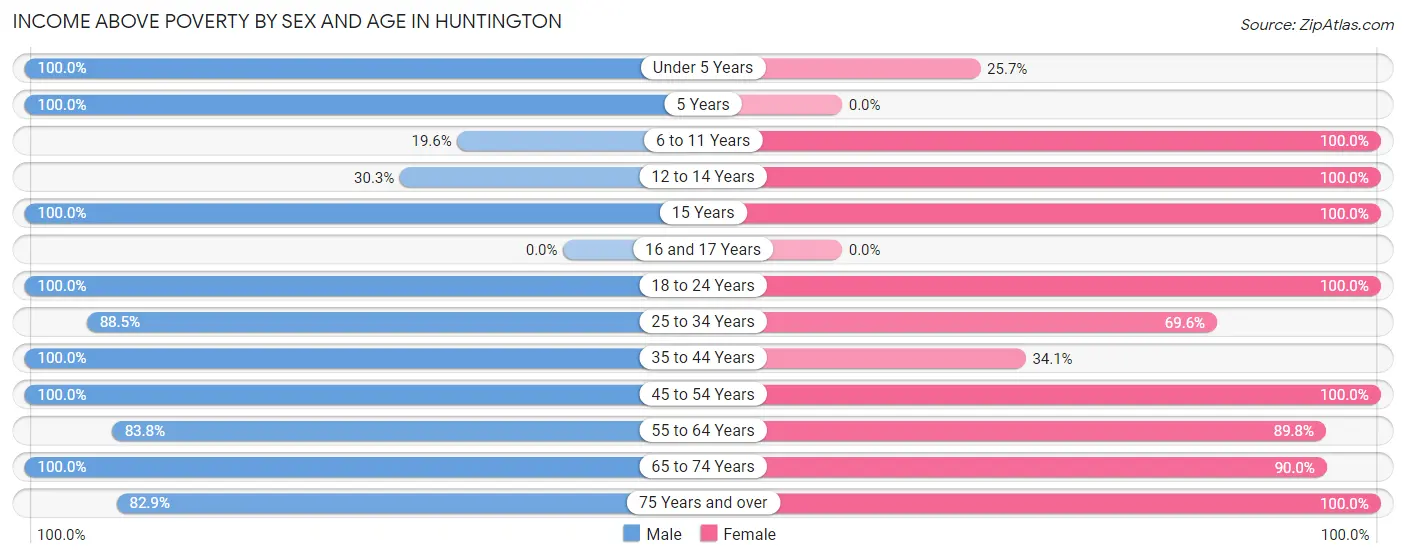
According to the poverty statistics in Huntington, males aged under 5 years and females aged 6 to 11 years are the age groups that are most secure financially, with 100.0% of males and 100.0% of females in these age groups living above the poverty line.
| Age Bracket | Male | Female |
| Under 5 Years | 12 (100.0%) | 19 (25.7%) |
| 5 Years | 11 (100.0%) | 0 (0.0%) |
| 6 to 11 Years | 11 (19.6%) | 9 (100.0%) |
| 12 to 14 Years | 10 (30.3%) | 34 (100.0%) |
| 15 Years | 9 (100.0%) | 6 (100.0%) |
| 16 and 17 Years | 0 (0.0%) | 0 (0.0%) |
| 18 to 24 Years | 36 (100.0%) | 25 (100.0%) |
| 25 to 34 Years | 46 (88.5%) | 55 (69.6%) |
| 35 to 44 Years | 23 (100.0%) | 15 (34.1%) |
| 45 to 54 Years | 34 (100.0%) | 55 (100.0%) |
| 55 to 64 Years | 57 (83.8%) | 53 (89.8%) |
| 65 to 74 Years | 6 (100.0%) | 63 (90.0%) |
| 75 Years and over | 34 (82.9%) | 29 (100.0%) |
| Total | 289 (75.8%) | 363 (75.0%) |
Income Below Poverty Among Married-Couple Families in Huntington
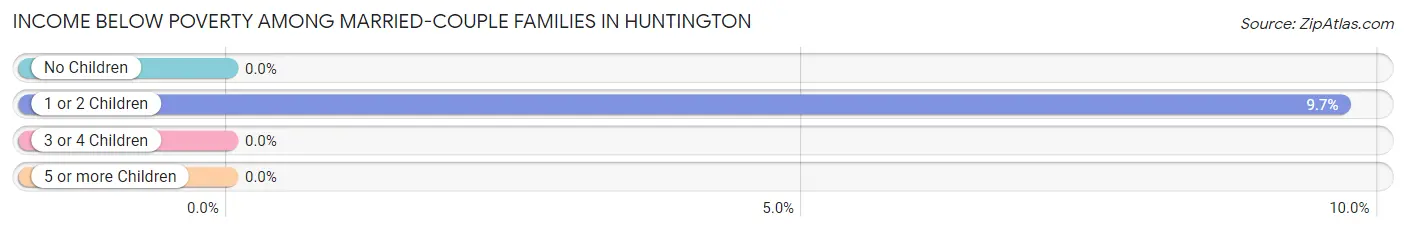
The poverty statistics for married-couple families in Huntington show that 3.5% or 6 of the total 169 families live below the poverty line. Families with 1 or 2 children have the highest poverty rate of 9.7%, comprising of 6 families. On the other hand, families with no children have the lowest poverty rate of 0.0%, which includes 0 families.
| Children | Above Poverty | Below Poverty |
| No Children | 99 (100.0%) | 0 (0.0%) |
| 1 or 2 Children | 56 (90.3%) | 6 (9.7%) |
| 3 or 4 Children | 8 (100.0%) | 0 (0.0%) |
| 5 or more Children | 0 (0.0%) | 0 (0.0%) |
| Total | 163 (96.5%) | 6 (3.5%) |
Income Below Poverty Among Single-Parent Households in Huntington
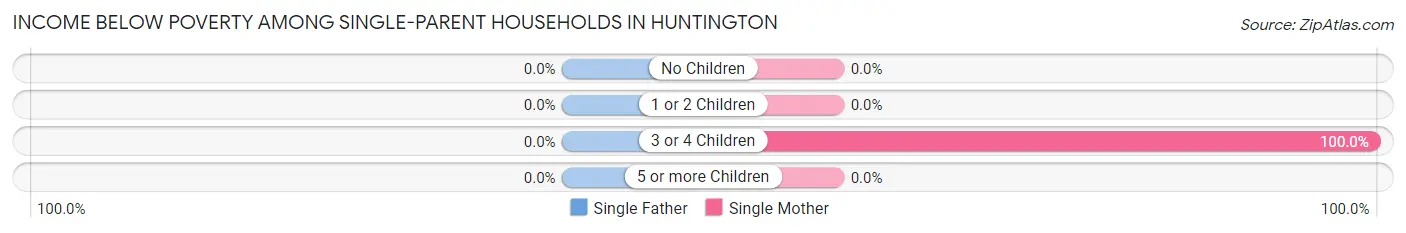
| Children | Single Father | Single Mother |
| No Children | 0 (0.0%) | 0 (0.0%) |
| 1 or 2 Children | 0 (0.0%) | 0 (0.0%) |
| 3 or 4 Children | 0 (0.0%) | 26 (100.0%) |
| 5 or more Children | 0 (0.0%) | 0 (0.0%) |
| Total | 0 (0.0%) | 26 (50.0%) |
Income Below Poverty Among Married-Couple vs Single-Parent Households in Huntington
The poverty data for Huntington shows that 6 of the married-couple family households (3.5%) and 26 of the single-parent households (46.4%) are living below the poverty level. Within the married-couple family households, those with 1 or 2 children have the highest poverty rate, with 6 households (9.7%) falling below the poverty line. Among the single-parent households, those with 3 or 4 children have the highest poverty rate, with 26 household (100.0%) living below poverty.
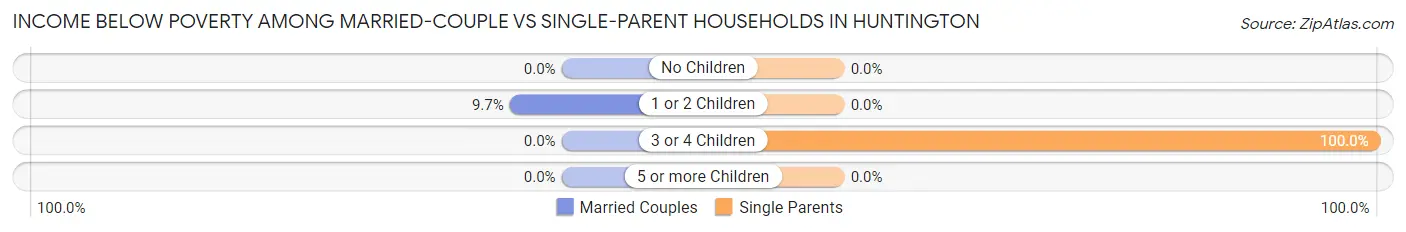
| Children | Married-Couple Families | Single-Parent Households |
| No Children | 0 (0.0%) | 0 (0.0%) |
| 1 or 2 Children | 6 (9.7%) | 0 (0.0%) |
| 3 or 4 Children | 0 (0.0%) | 26 (100.0%) |
| 5 or more Children | 0 (0.0%) | 0 (0.0%) |
| Total | 6 (3.5%) | 26 (46.4%) |
Race in Huntington
The most populous races in Huntington are White / Caucasian (804 | 92.9%), Two or more Races (44 | 5.1%), and Hispanic or Latino (21 | 2.4%).
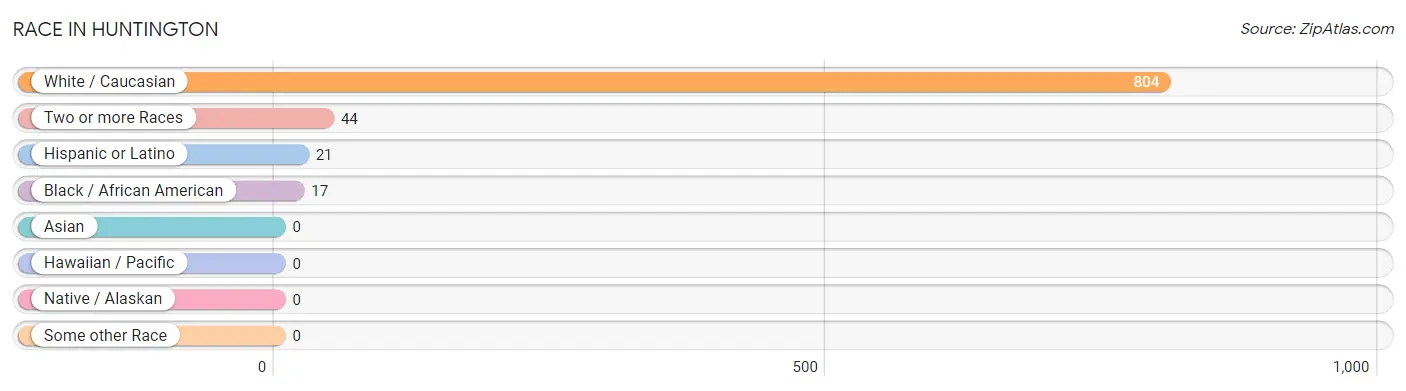
| Race | # Population | % Population |
| Asian | 0 | 0.0% |
| Black / African American | 17 | 2.0% |
| Hawaiian / Pacific | 0 | 0.0% |
| Hispanic or Latino | 21 | 2.4% |
| Native / Alaskan | 0 | 0.0% |
| White / Caucasian | 804 | 92.9% |
| Two or more Races | 44 | 5.1% |
| Some other Race | 0 | 0.0% |
| Total | 865 | 100.0% |
Ancestry in Huntington
The most populous ancestries reported in Huntington are Irish (145 | 16.8%), French (96 | 11.1%), English (88 | 10.2%), Polish (82 | 9.5%), and Italian (71 | 8.2%), together accounting for 55.7% of all Huntington residents.
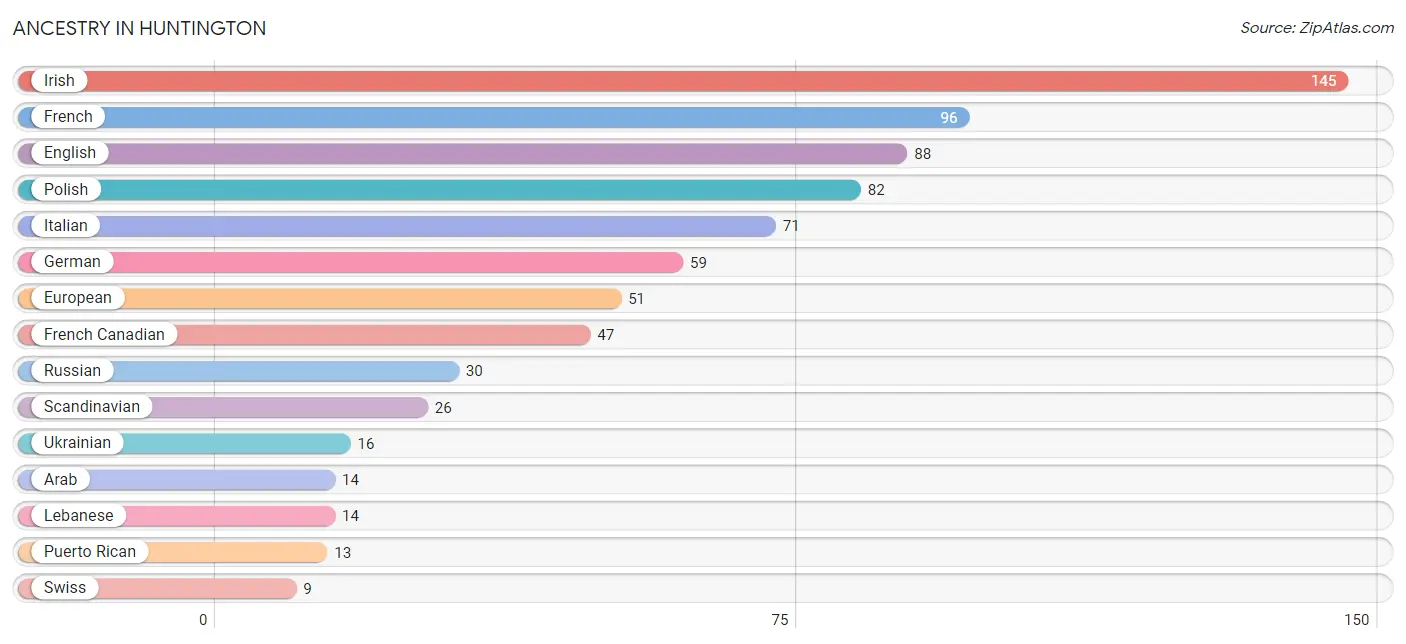
| Ancestry | # Population | % Population |
| African | 6 | 0.7% |
| American | 5 | 0.6% |
| Arab | 14 | 1.6% |
| British | 3 | 0.4% |
| Danish | 6 | 0.7% |
| Dutch | 6 | 0.7% |
| English | 88 | 10.2% |
| European | 51 | 5.9% |
| Finnish | 3 | 0.4% |
| French | 96 | 11.1% |
| French Canadian | 47 | 5.4% |
| German | 59 | 6.8% |
| Irish | 145 | 16.8% |
| Italian | 71 | 8.2% |
| Lebanese | 14 | 1.6% |
| Lithuanian | 8 | 0.9% |
| Mexican | 8 | 0.9% |
| Polish | 82 | 9.5% |
| Portuguese | 7 | 0.8% |
| Puerto Rican | 13 | 1.5% |
| Russian | 30 | 3.5% |
| Scandinavian | 26 | 3.0% |
| Scottish | 6 | 0.7% |
| Slovak | 7 | 0.8% |
| Subsaharan African | 6 | 0.7% |
| Swedish | 8 | 0.9% |
| Swiss | 9 | 1.0% |
| Ukrainian | 16 | 1.8% | View All 28 Rows |
Immigrants in Huntington
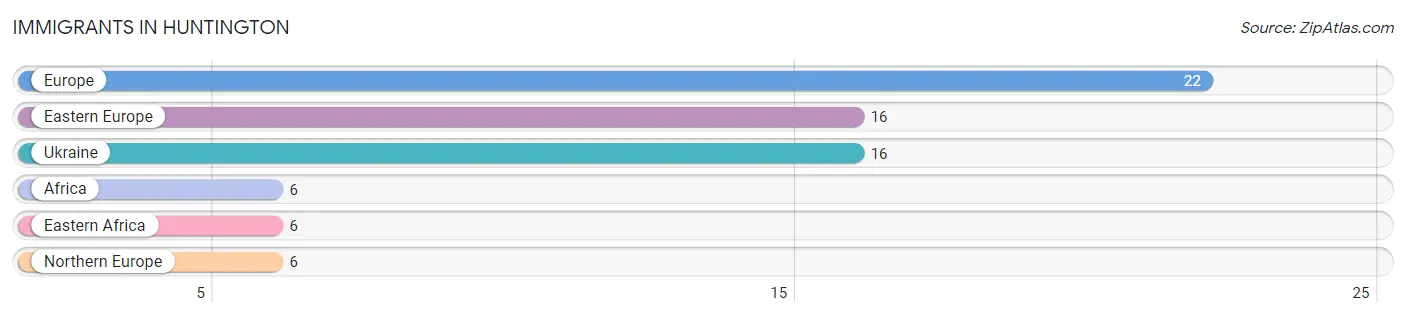
The most numerous immigrant groups reported in Huntington came from Europe (22 | 2.5%), Eastern Europe (16 | 1.8%), Ukraine (16 | 1.8%), Africa (6 | 0.7%), and Eastern Africa (6 | 0.7%), together accounting for 7.6% of all Huntington residents.
| Immigration Origin | # Population | % Population |
| Africa | 6 | 0.7% |
| Eastern Africa | 6 | 0.7% |
| Eastern Europe | 16 | 1.8% |
| Europe | 22 | 2.5% |
| Northern Europe | 6 | 0.7% |
| Ukraine | 16 | 1.8% | View All 6 Rows |
Sex and Age in Huntington
Sex and Age in Huntington
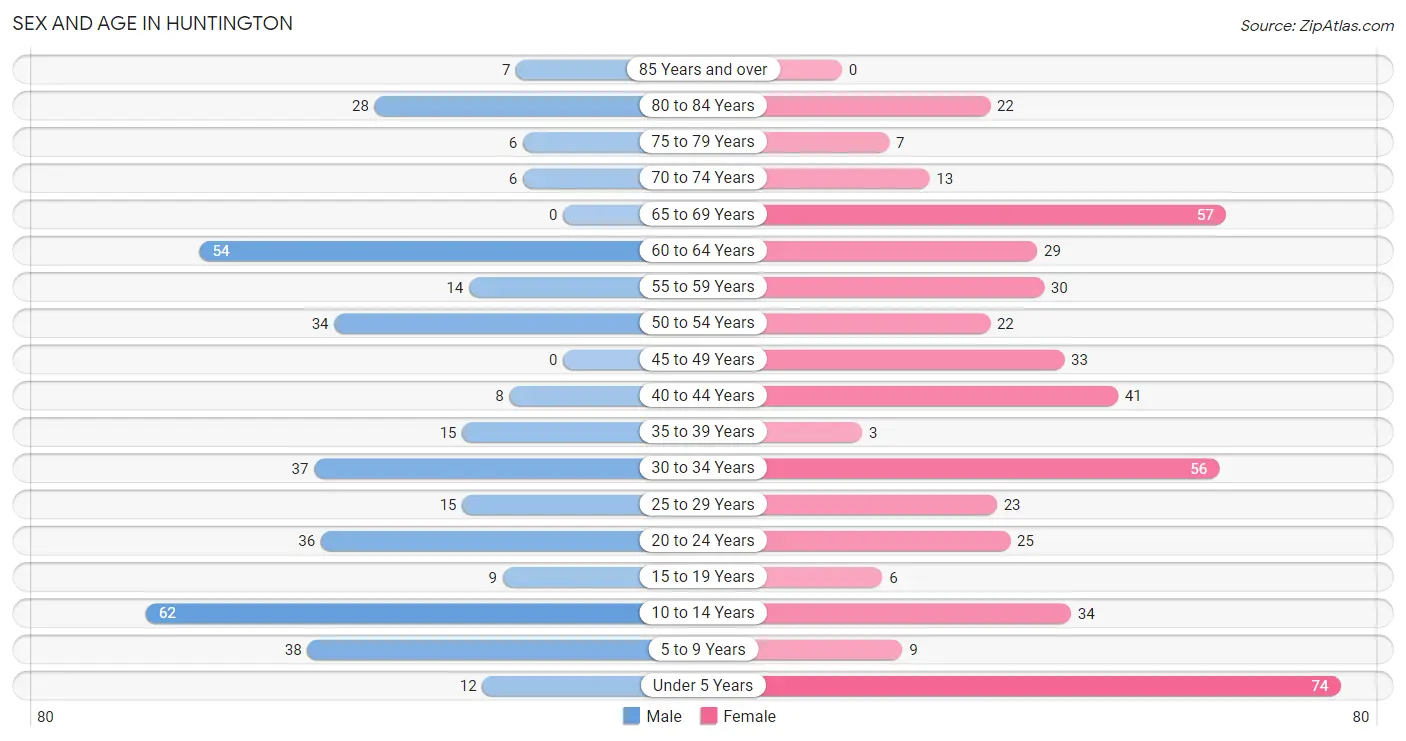
The most populous age groups in Huntington are 10 to 14 Years (62 | 16.3%) for men and Under 5 Years (74 | 15.3%) for women.
| Age Bracket | Male | Female |
| Under 5 Years | 12 (3.2%) | 74 (15.3%) |
| 5 to 9 Years | 38 (10.0%) | 9 (1.9%) |
| 10 to 14 Years | 62 (16.3%) | 34 (7.0%) |
| 15 to 19 Years | 9 (2.4%) | 6 (1.2%) |
| 20 to 24 Years | 36 (9.5%) | 25 (5.2%) |
| 25 to 29 Years | 15 (3.9%) | 23 (4.8%) |
| 30 to 34 Years | 37 (9.7%) | 56 (11.6%) |
| 35 to 39 Years | 15 (3.9%) | 3 (0.6%) |
| 40 to 44 Years | 8 (2.1%) | 41 (8.5%) |
| 45 to 49 Years | 0 (0.0%) | 33 (6.8%) |
| 50 to 54 Years | 34 (8.9%) | 22 (4.5%) |
| 55 to 59 Years | 14 (3.7%) | 30 (6.2%) |
| 60 to 64 Years | 54 (14.2%) | 29 (6.0%) |
| 65 to 69 Years | 0 (0.0%) | 57 (11.8%) |
| 70 to 74 Years | 6 (1.6%) | 13 (2.7%) |
| 75 to 79 Years | 6 (1.6%) | 7 (1.5%) |
| 80 to 84 Years | 28 (7.3%) | 22 (4.5%) |
| 85 Years and over | 7 (1.8%) | 0 (0.0%) |
| Total | 381 (100.0%) | 484 (100.0%) |
Families and Households in Huntington
Median Family Size in Huntington
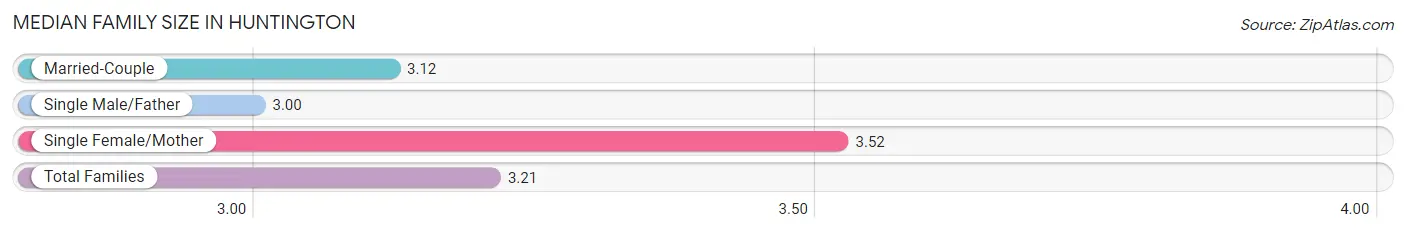
The median family size in Huntington is 3.21 persons per family, with single female/mother families (52 | 23.1%) accounting for the largest median family size of 3.52 persons per family. On the other hand, single male/father families (4 | 1.8%) represent the smallest median family size with 3.00 persons per family.
| Family Type | # Families | Family Size |
| Married-Couple | 169 (75.1%) | 3.12 |
| Single Male/Father | 4 (1.8%) | 3.00 |
| Single Female/Mother | 52 (23.1%) | 3.52 |
| Total Families | 225 (100.0%) | 3.21 |
Median Household Size in Huntington
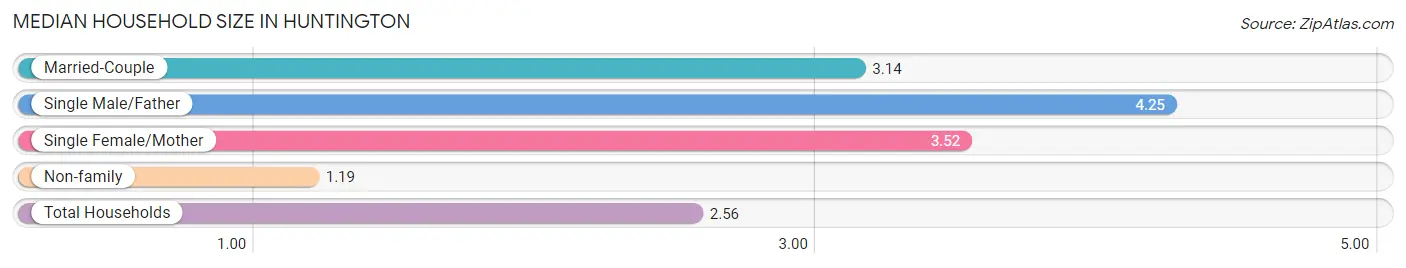
The median household size in Huntington is 2.56 persons per household, with single male/father households (4 | 1.2%) accounting for the largest median household size of 4.25 persons per household. non-family households (113 | 33.4%) represent the smallest median household size with 1.19 persons per household.
| Household Type | # Households | Household Size |
| Married-Couple | 169 (50.0%) | 3.14 |
| Single Male/Father | 4 (1.2%) | 4.25 |
| Single Female/Mother | 52 (15.4%) | 3.52 |
| Non-family | 113 (33.4%) | 1.19 |
| Total Households | 338 (100.0%) | 2.56 |
Household Size by Marriage Status in Huntington
Out of a total of 338 households in Huntington, 225 (66.6%) are family households, while 113 (33.4%) are nonfamily households. The most numerous type of family households are 3-person households, comprising 85, and the most common type of nonfamily households are 1-person households, comprising 100.
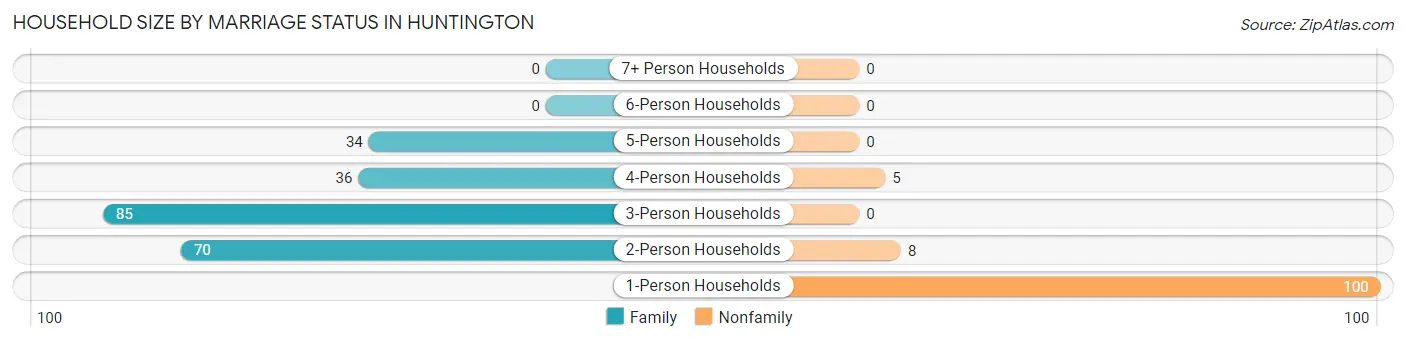
| Household Size | Family Households | Nonfamily Households |
| 1-Person Households | - | 100 (29.6%) |
| 2-Person Households | 70 (20.7%) | 8 (2.4%) |
| 3-Person Households | 85 (25.2%) | 0 (0.0%) |
| 4-Person Households | 36 (10.6%) | 5 (1.5%) |
| 5-Person Households | 34 (10.1%) | 0 (0.0%) |
| 6-Person Households | 0 (0.0%) | 0 (0.0%) |
| 7+ Person Households | 0 (0.0%) | 0 (0.0%) |
| Total | 225 (66.6%) | 113 (33.4%) |
Female Fertility in Huntington
Fertility by Age in Huntington
Average fertility rate in Huntington is 109.0 births per 1,000 women. Women in the age bracket of 20 to 34 years have the highest fertility rate with 212.0 births per 1,000 women. Women in the age bracket of 20 to 34 years acount for 100.0% of all women with births.
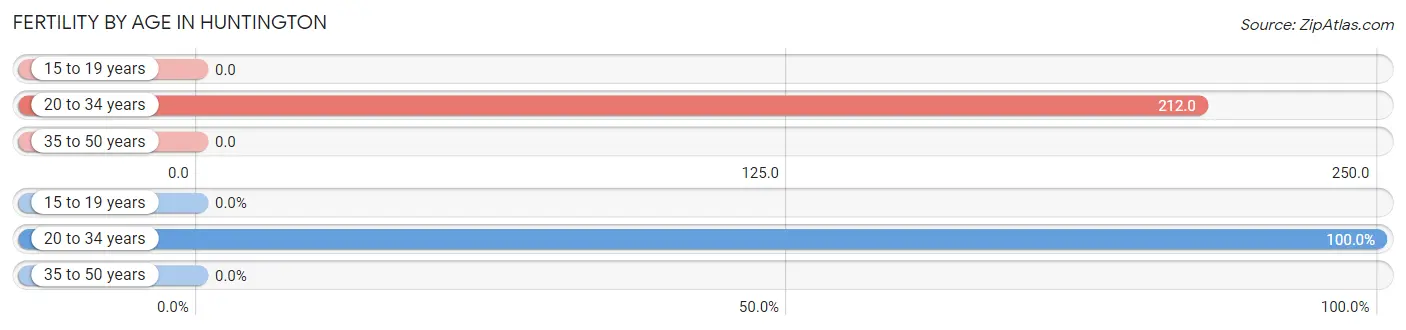
| Age Bracket | Women with Births | Births / 1,000 Women |
| 15 to 19 years | 0 (0.0%) | 0.0 |
| 20 to 34 years | 22 (100.0%) | 212.0 |
| 35 to 50 years | 0 (0.0%) | 0.0 |
| Total | 22 (100.0%) | 109.0 |
Fertility by Age by Marriage Status in Huntington
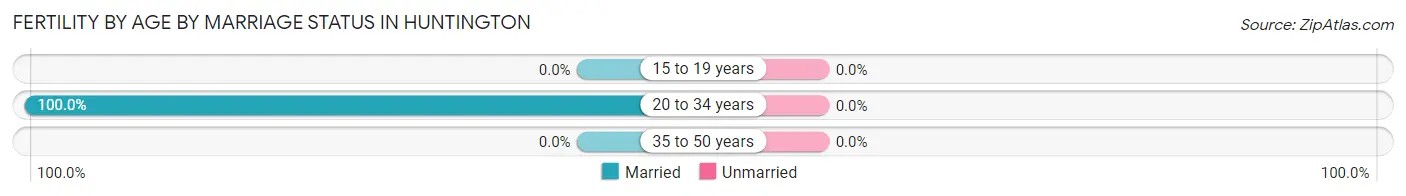
| Age Bracket | Married | Unmarried |
| 15 to 19 years | 0 (0.0%) | 0 (0.0%) |
| 20 to 34 years | 22 (100.0%) | 0 (0.0%) |
| 35 to 50 years | 0 (0.0%) | 0 (0.0%) |
| Total | 22 (100.0%) | 0 (0.0%) |
Fertility by Education in Huntington
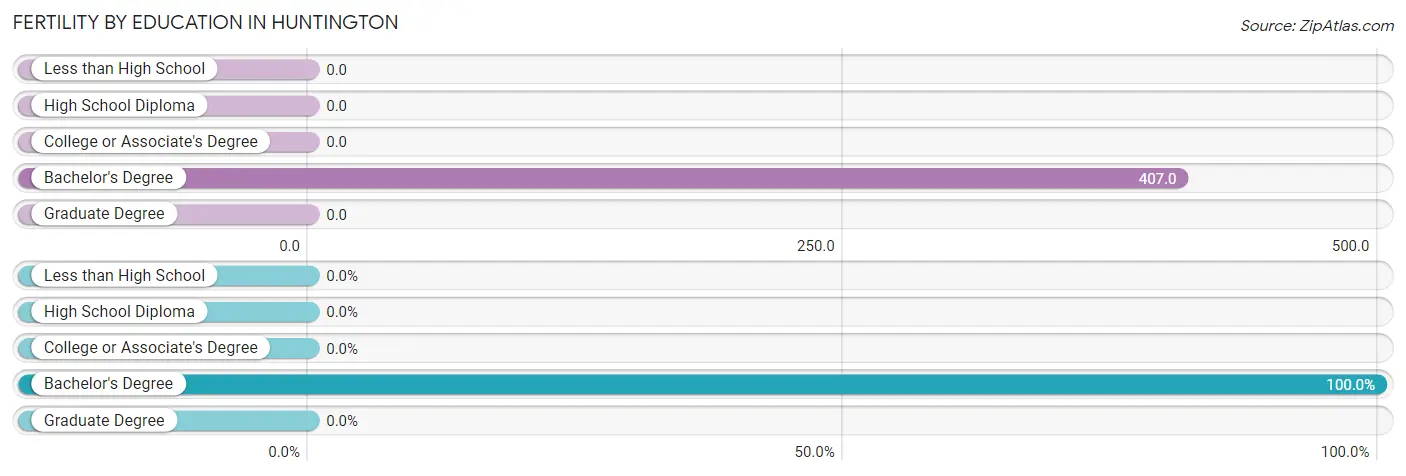
| Educational Attainment | Women with Births | Births / 1,000 Women |
| Less than High School | 0 (0.0%) | 0.0 |
| High School Diploma | 0 (0.0%) | 0.0 |
| College or Associate's Degree | 0 (0.0%) | 0.0 |
| Bachelor's Degree | 22 (100.0%) | 407.0 |
| Graduate Degree | 0 (0.0%) | 0.0 |
| Total | 22 (100.0%) | 109.0 |
Fertility by Education by Marriage Status in Huntington
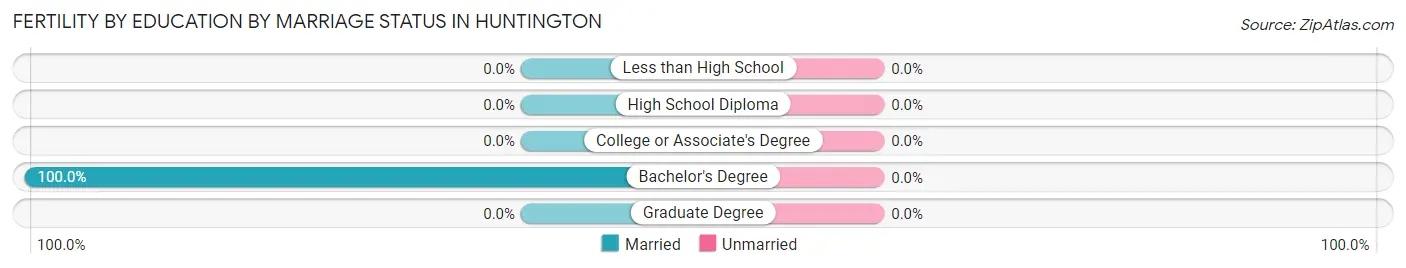
| Educational Attainment | Married | Unmarried |
| Less than High School | 0 (0.0%) | 0 (0.0%) |
| High School Diploma | 0 (0.0%) | 0 (0.0%) |
| College or Associate's Degree | 0 (0.0%) | 0 (0.0%) |
| Bachelor's Degree | 22 (100.0%) | 0 (0.0%) |
| Graduate Degree | 0 (0.0%) | 0 (0.0%) |
| Total | 22 (100.0%) | 0 (0.0%) |
Employment Characteristics in Huntington
Employment by Class of Employer in Huntington
Among the 442 employed individuals in Huntington, private company employees (208 | 47.1%), not-for-profit organizations (119 | 26.9%), and federal government employees (34 | 7.7%) make up the most common classes of employment.
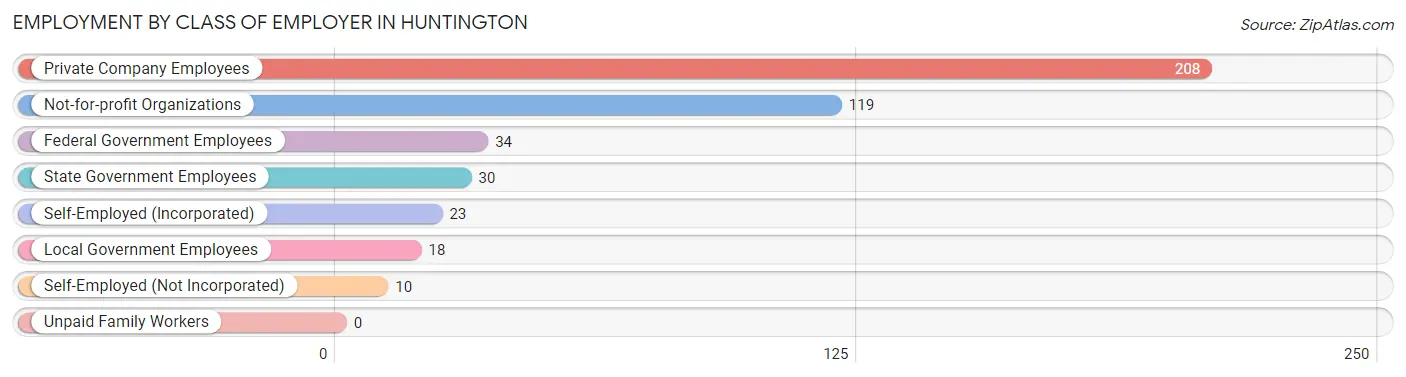
| Employer Class | # Employees | % Employees |
| Private Company Employees | 208 | 47.1% |
| Self-Employed (Incorporated) | 23 | 5.2% |
| Self-Employed (Not Incorporated) | 10 | 2.3% |
| Not-for-profit Organizations | 119 | 26.9% |
| Local Government Employees | 18 | 4.1% |
| State Government Employees | 30 | 6.8% |
| Federal Government Employees | 34 | 7.7% |
| Unpaid Family Workers | 0 | 0.0% |
| Total | 442 | 100.0% |
Employment Status by Age in Huntington
According to the labor force statistics for Huntington, out of the total population over 16 years of age (621), 73.8% or 458 individuals are in the labor force, with 3.5% or 16 of them unemployed. The age group with the highest labor force participation rate is 20 to 24 years, with 100.0% or 61 individuals in the labor force. Within the labor force, the 55 to 59 years age range has the highest percentage of unemployed individuals, with 21.4% or 6 of them being unemployed.
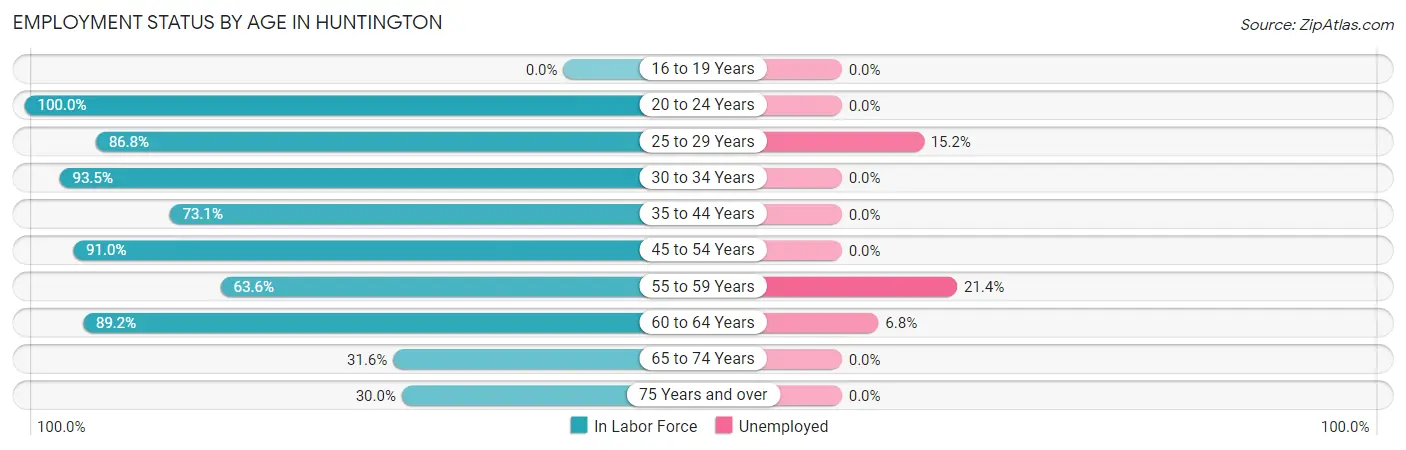
| Age Bracket | In Labor Force | Unemployed |
| 16 to 19 Years | 0 (0.0%) | 0 (0.0%) |
| 20 to 24 Years | 61 (100.0%) | 0 (0.0%) |
| 25 to 29 Years | 33 (86.8%) | 5 (15.2%) |
| 30 to 34 Years | 87 (93.5%) | 0 (0.0%) |
| 35 to 44 Years | 49 (73.1%) | 0 (0.0%) |
| 45 to 54 Years | 81 (91.0%) | 0 (0.0%) |
| 55 to 59 Years | 28 (63.6%) | 6 (21.4%) |
| 60 to 64 Years | 74 (89.2%) | 5 (6.8%) |
| 65 to 74 Years | 24 (31.6%) | 0 (0.0%) |
| 75 Years and over | 21 (30.0%) | 0 (0.0%) |
| Total | 458 (73.8%) | 16 (3.5%) |
Employment Status by Educational Attainment in Huntington
According to labor force statistics for Huntington, 85.0% of individuals (352) out of the total population between 25 and 64 years of age (414) are in the labor force, with 4.5% or 16 of them being unemployed. The group with the highest labor force participation rate are those with the educational attainment of college / associate degree, with 100.0% or 166 individuals in the labor force. Within the labor force, individuals with college / associate degree education have the highest percentage of unemployment, with 6.6% or 11 of them being unemployed.
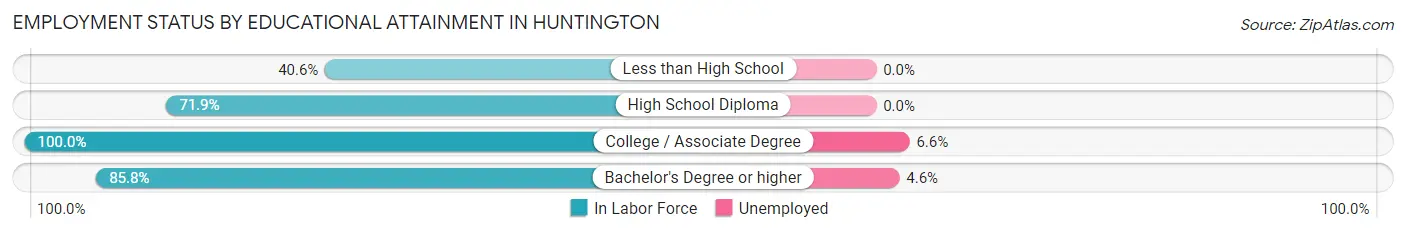
| Educational Attainment | In Labor Force | Unemployed |
| Less than High School | 13 (40.6%) | 0 (0.0%) |
| High School Diploma | 64 (71.9%) | 0 (0.0%) |
| College / Associate Degree | 166 (100.0%) | 11 (6.6%) |
| Bachelor's Degree or higher | 109 (85.8%) | 6 (4.6%) |
| Total | 352 (85.0%) | 19 (4.5%) |
Employment Occupations by Sex in Huntington
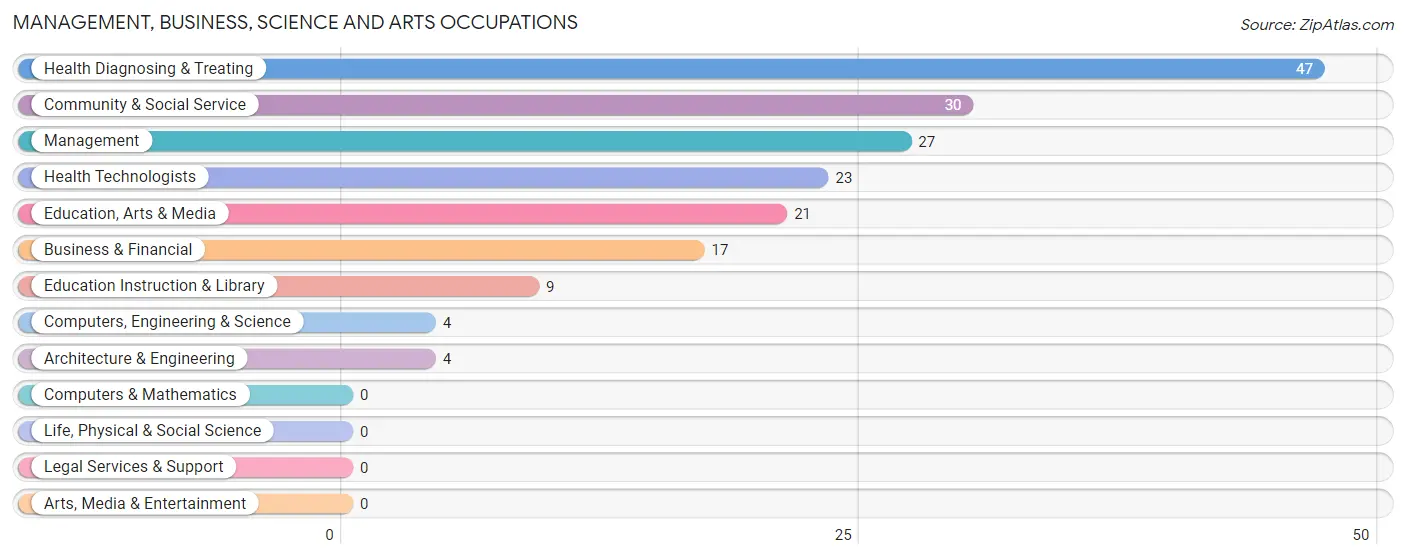
Management, Business, Science and Arts Occupations
The most common Management, Business, Science and Arts occupations in Huntington are Health Diagnosing & Treating (47 | 10.6%), Community & Social Service (30 | 6.8%), Management (27 | 6.1%), Health Technologists (23 | 5.2%), and Education, Arts & Media (21 | 4.8%).
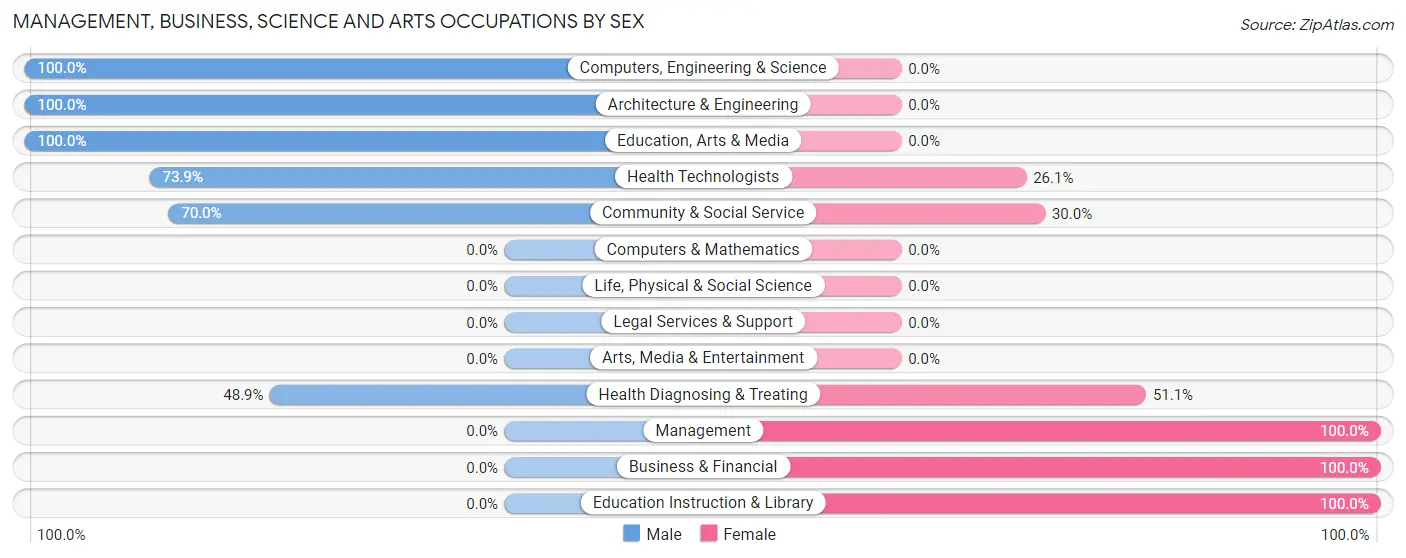
Management, Business, Science and Arts Occupations by Sex
Within the Management, Business, Science and Arts occupations in Huntington, the most male-oriented occupations are Computers, Engineering & Science (100.0%), Architecture & Engineering (100.0%), and Education, Arts & Media (100.0%), while the most female-oriented occupations are Management (100.0%), Business & Financial (100.0%), and Education Instruction & Library (100.0%).
| Occupation | Male | Female |
| Management | 0 (0.0%) | 27 (100.0%) |
| Business & Financial | 0 (0.0%) | 17 (100.0%) |
| Computers, Engineering & Science | 4 (100.0%) | 0 (0.0%) |
| Computers & Mathematics | 0 (0.0%) | 0 (0.0%) |
| Architecture & Engineering | 4 (100.0%) | 0 (0.0%) |
| Life, Physical & Social Science | 0 (0.0%) | 0 (0.0%) |
| Community & Social Service | 21 (70.0%) | 9 (30.0%) |
| Education, Arts & Media | 21 (100.0%) | 0 (0.0%) |
| Legal Services & Support | 0 (0.0%) | 0 (0.0%) |
| Education Instruction & Library | 0 (0.0%) | 9 (100.0%) |
| Arts, Media & Entertainment | 0 (0.0%) | 0 (0.0%) |
| Health Diagnosing & Treating | 23 (48.9%) | 24 (51.1%) |
| Health Technologists | 17 (73.9%) | 6 (26.1%) |
| Total (Category) | 48 (38.4%) | 77 (61.6%) |
| Total (Overall) | 201 (45.5%) | 241 (54.5%) |
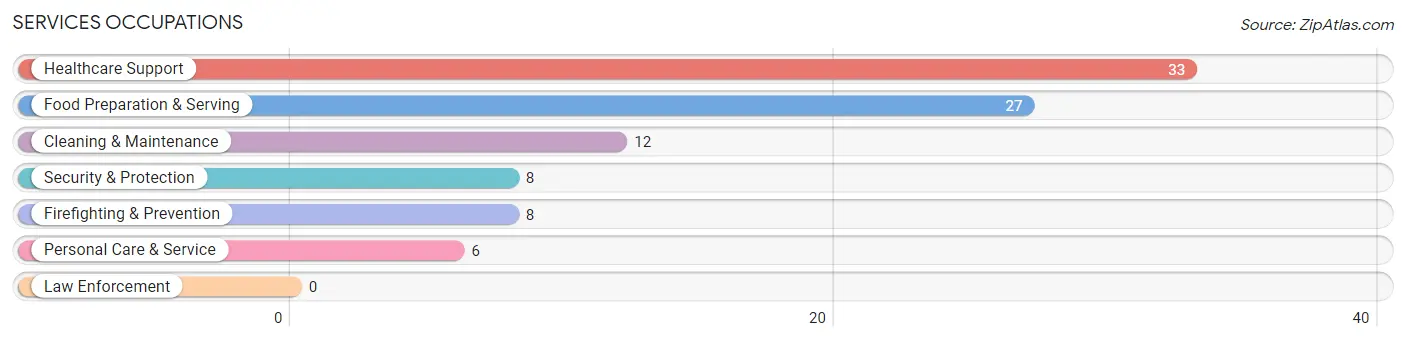
Services Occupations
The most common Services occupations in Huntington are Healthcare Support (33 | 7.5%), Food Preparation & Serving (27 | 6.1%), Cleaning & Maintenance (12 | 2.7%), Security & Protection (8 | 1.8%), and Firefighting & Prevention (8 | 1.8%).
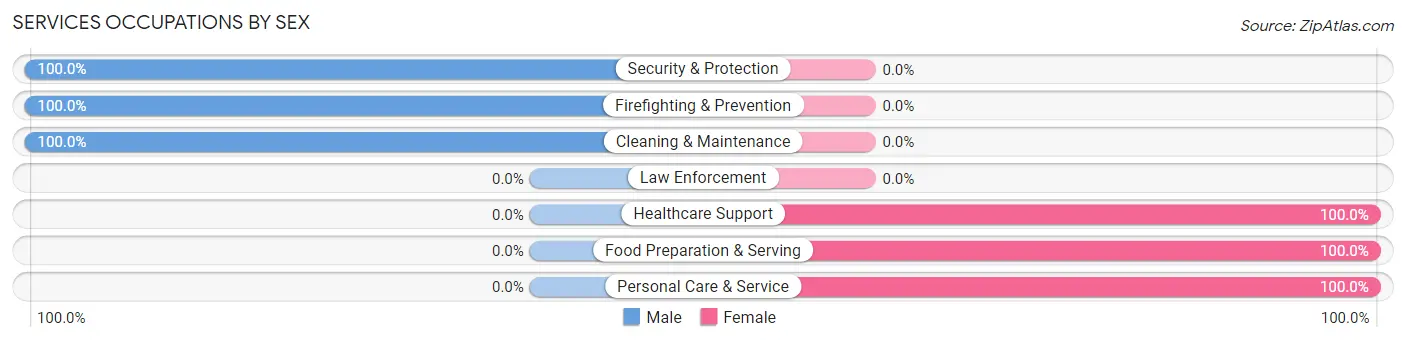
Services Occupations by Sex
Within the Services occupations in Huntington, the most male-oriented occupations are Security & Protection (100.0%), Firefighting & Prevention (100.0%), and Cleaning & Maintenance (100.0%), while the most female-oriented occupations are Healthcare Support (100.0%), Food Preparation & Serving (100.0%), and Personal Care & Service (100.0%).
| Occupation | Male | Female |
| Healthcare Support | 0 (0.0%) | 33 (100.0%) |
| Security & Protection | 8 (100.0%) | 0 (0.0%) |
| Firefighting & Prevention | 8 (100.0%) | 0 (0.0%) |
| Law Enforcement | 0 (0.0%) | 0 (0.0%) |
| Food Preparation & Serving | 0 (0.0%) | 27 (100.0%) |
| Cleaning & Maintenance | 12 (100.0%) | 0 (0.0%) |
| Personal Care & Service | 0 (0.0%) | 6 (100.0%) |
| Total (Category) | 20 (23.3%) | 66 (76.7%) |
| Total (Overall) | 201 (45.5%) | 241 (54.5%) |
Sales and Office Occupations
The most common Sales and Office occupations in Huntington are Office & Administration (86 | 19.5%), and Sales & Related (4 | 0.9%).
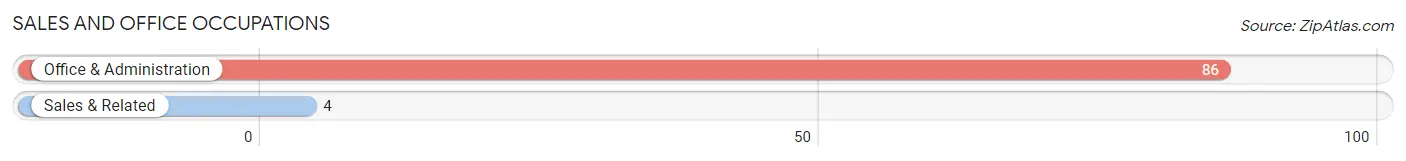
Sales and Office Occupations by Sex
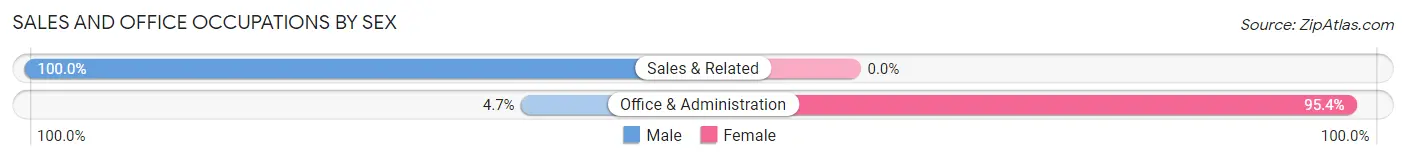
| Occupation | Male | Female |
| Sales & Related | 4 (100.0%) | 0 (0.0%) |
| Office & Administration | 4 (4.6%) | 82 (95.4%) |
| Total (Category) | 8 (8.9%) | 82 (91.1%) |
| Total (Overall) | 201 (45.5%) | 241 (54.5%) |
Natural Resources, Construction and Maintenance Occupations
The most common Natural Resources, Construction and Maintenance occupations in Huntington are Construction & Extraction (34 | 7.7%), Installation, Maintenance & Repair (24 | 5.4%), and Farming, Fishing & Forestry (6 | 1.4%).
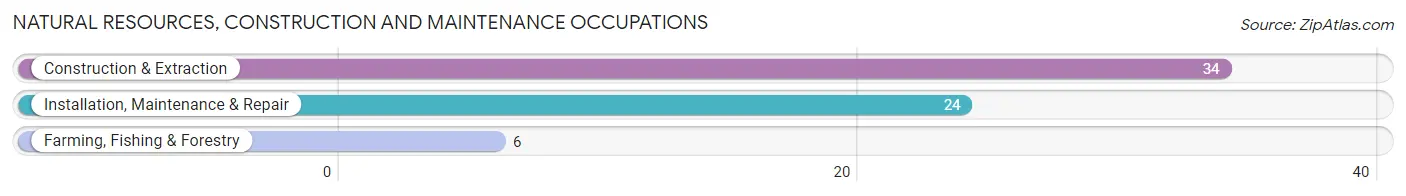
Natural Resources, Construction and Maintenance Occupations by Sex
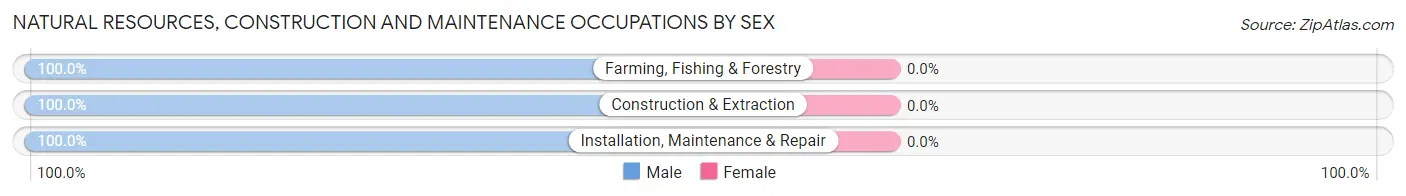
| Occupation | Male | Female |
| Farming, Fishing & Forestry | 6 (100.0%) | 0 (0.0%) |
| Construction & Extraction | 34 (100.0%) | 0 (0.0%) |
| Installation, Maintenance & Repair | 24 (100.0%) | 0 (0.0%) |
| Total (Category) | 64 (100.0%) | 0 (0.0%) |
| Total (Overall) | 201 (45.5%) | 241 (54.5%) |
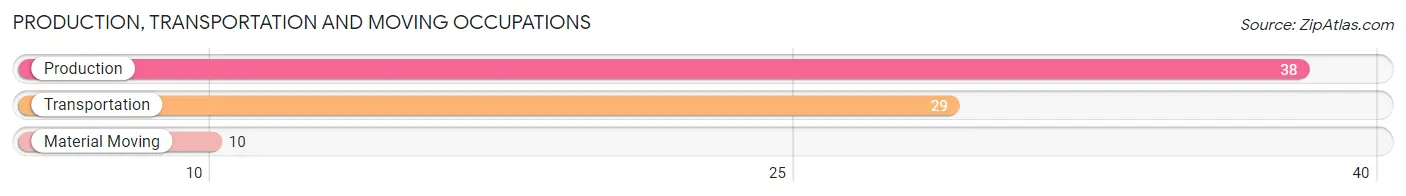
Production, Transportation and Moving Occupations
The most common Production, Transportation and Moving occupations in Huntington are Production (38 | 8.6%), Transportation (29 | 6.6%), and Material Moving (10 | 2.3%).
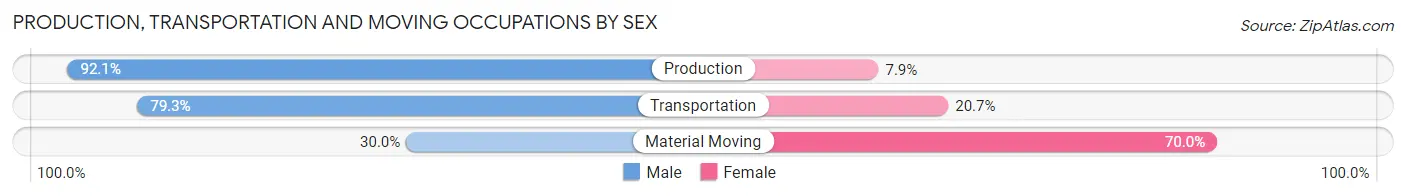
Production, Transportation and Moving Occupations by Sex
| Occupation | Male | Female |
| Production | 35 (92.1%) | 3 (7.9%) |
| Transportation | 23 (79.3%) | 6 (20.7%) |
| Material Moving | 3 (30.0%) | 7 (70.0%) |
| Total (Category) | 61 (79.2%) | 16 (20.8%) |
| Total (Overall) | 201 (45.5%) | 241 (54.5%) |
Employment Industries by Sex in Huntington
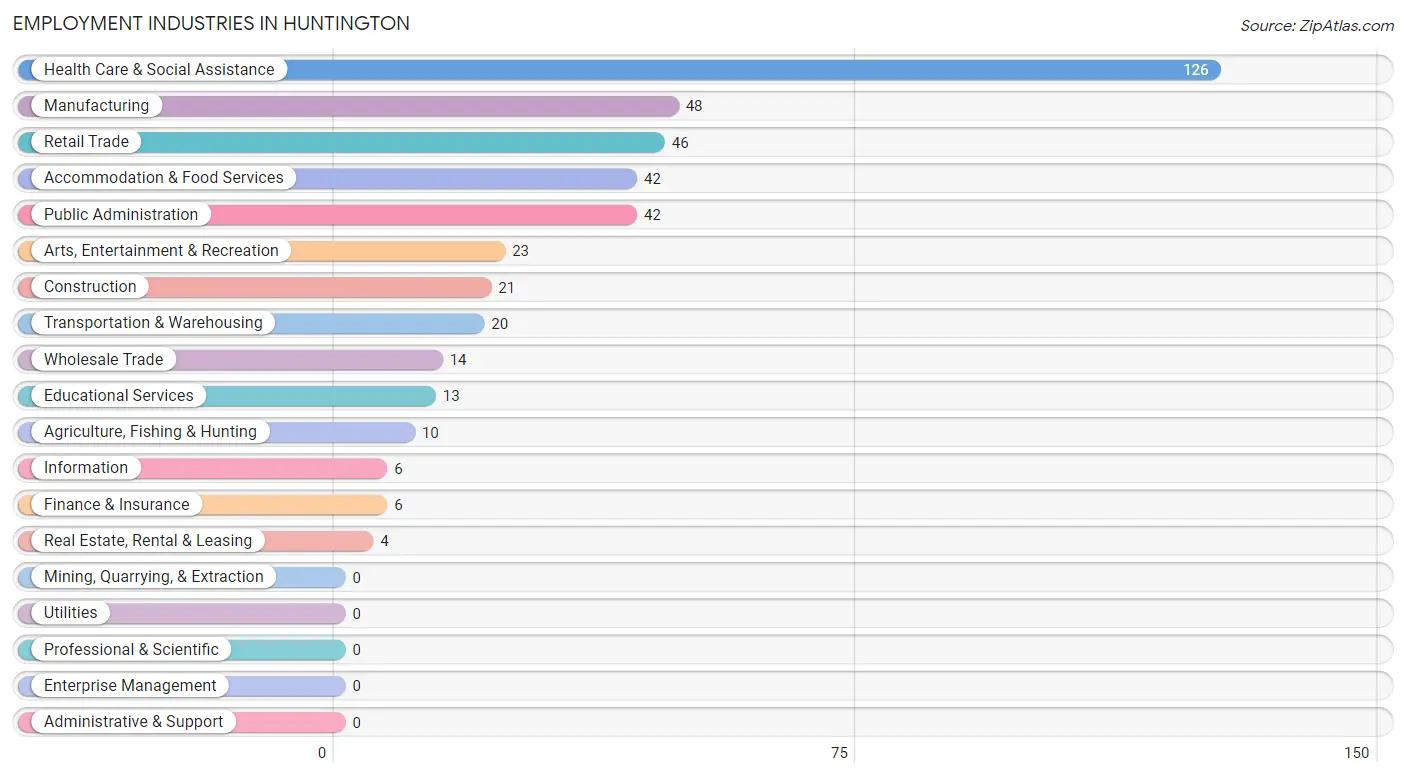
Employment Industries in Huntington
The major employment industries in Huntington include Health Care & Social Assistance (126 | 28.5%), Manufacturing (48 | 10.9%), Retail Trade (46 | 10.4%), Accommodation & Food Services (42 | 9.5%), and Public Administration (42 | 9.5%).
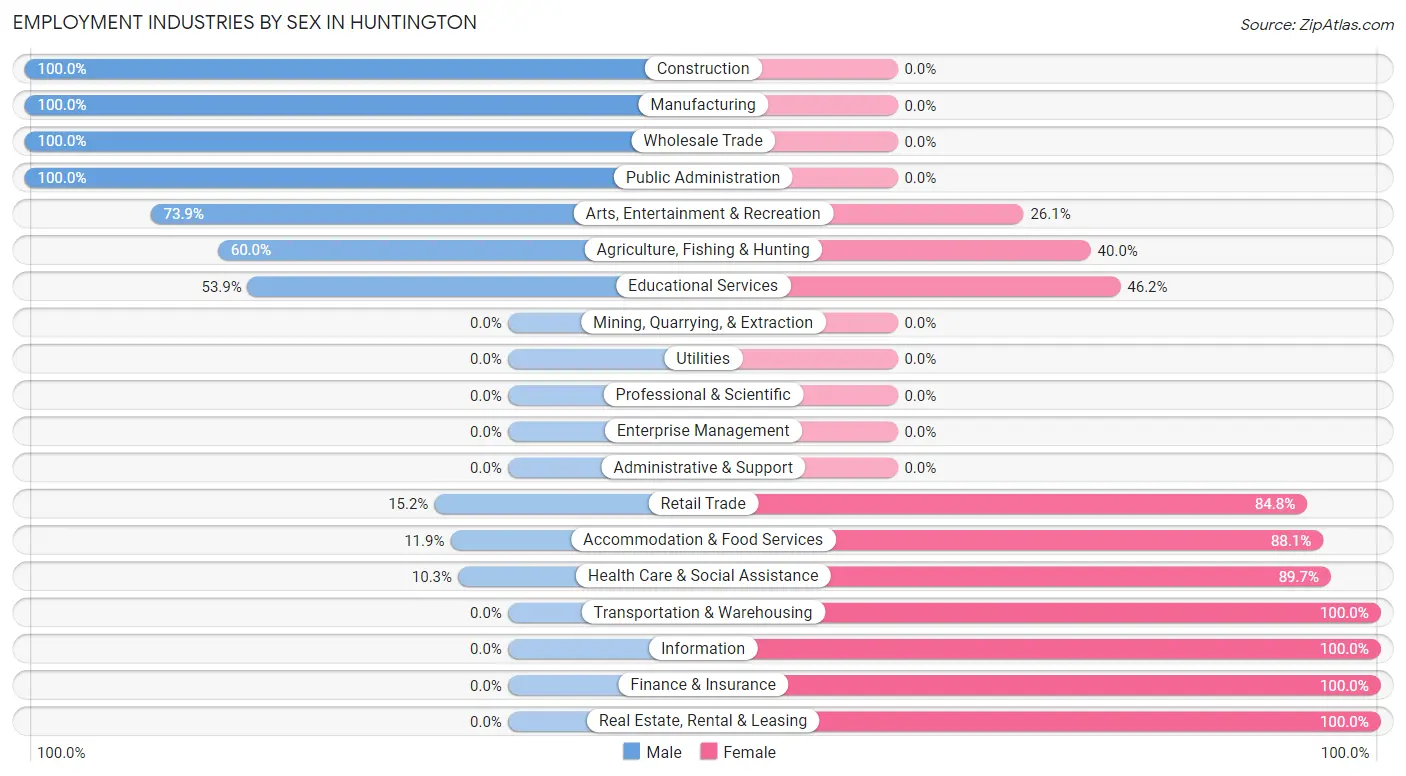
Employment Industries by Sex in Huntington
The Huntington industries that see more men than women are Construction (100.0%), Manufacturing (100.0%), and Wholesale Trade (100.0%), whereas the industries that tend to have a higher number of women are Transportation & Warehousing (100.0%), Information (100.0%), and Finance & Insurance (100.0%).
| Industry | Male | Female |
| Agriculture, Fishing & Hunting | 6 (60.0%) | 4 (40.0%) |
| Mining, Quarrying, & Extraction | 0 (0.0%) | 0 (0.0%) |
| Construction | 21 (100.0%) | 0 (0.0%) |
| Manufacturing | 48 (100.0%) | 0 (0.0%) |
| Wholesale Trade | 14 (100.0%) | 0 (0.0%) |
| Retail Trade | 7 (15.2%) | 39 (84.8%) |
| Transportation & Warehousing | 0 (0.0%) | 20 (100.0%) |
| Utilities | 0 (0.0%) | 0 (0.0%) |
| Information | 0 (0.0%) | 6 (100.0%) |
| Finance & Insurance | 0 (0.0%) | 6 (100.0%) |
| Real Estate, Rental & Leasing | 0 (0.0%) | 4 (100.0%) |
| Professional & Scientific | 0 (0.0%) | 0 (0.0%) |
| Enterprise Management | 0 (0.0%) | 0 (0.0%) |
| Administrative & Support | 0 (0.0%) | 0 (0.0%) |
| Educational Services | 7 (53.8%) | 6 (46.2%) |
| Health Care & Social Assistance | 13 (10.3%) | 113 (89.7%) |
| Arts, Entertainment & Recreation | 17 (73.9%) | 6 (26.1%) |
| Accommodation & Food Services | 5 (11.9%) | 37 (88.1%) |
| Public Administration | 42 (100.0%) | 0 (0.0%) |
| Total | 201 (45.5%) | 241 (54.5%) |
Education in Huntington
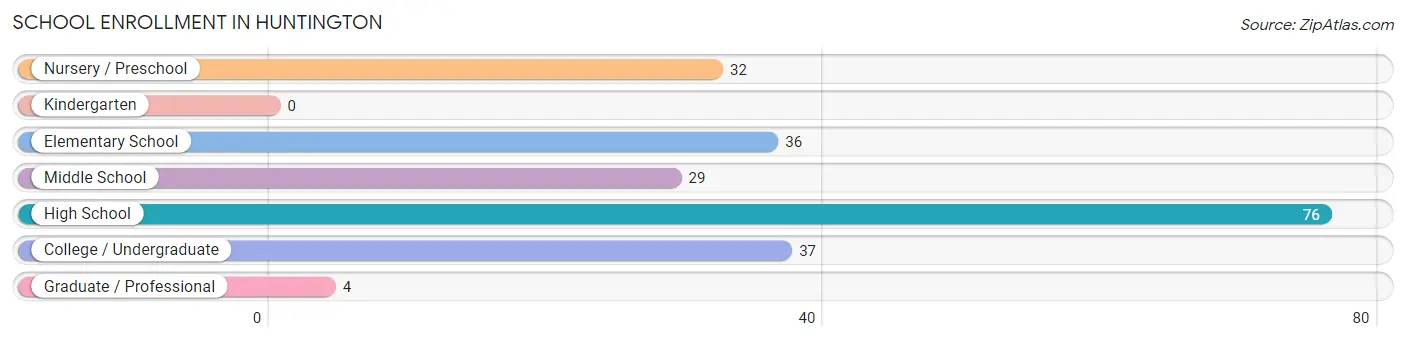
School Enrollment in Huntington
The most common levels of schooling among the 214 students in Huntington are high school (76 | 35.5%), college / undergraduate (37 | 17.3%), and elementary school (36 | 16.8%).
| School Level | # Students | % Students |
| Nursery / Preschool | 32 | 14.9% |
| Kindergarten | 0 | 0.0% |
| Elementary School | 36 | 16.8% |
| Middle School | 29 | 13.6% |
| High School | 76 | 35.5% |
| College / Undergraduate | 37 | 17.3% |
| Graduate / Professional | 4 | 1.9% |
| Total | 214 | 100.0% |
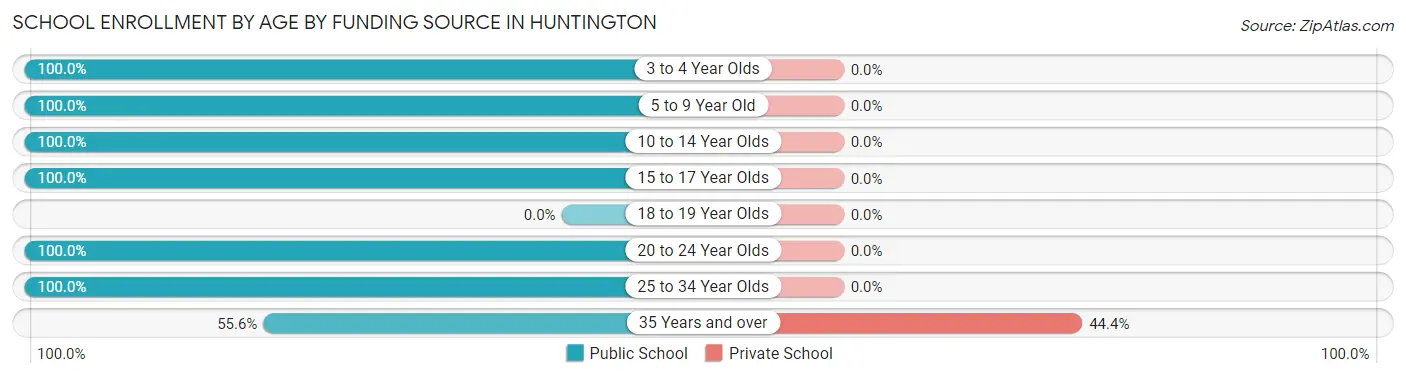
School Enrollment by Age by Funding Source in Huntington
Out of a total of 214 students who are enrolled in schools in Huntington, 4 (1.9%) attend a private institution, while the remaining 210 (98.1%) are enrolled in public schools. The age group of 35 years and over has the highest likelihood of being enrolled in private schools, with 4 (44.4% in the age bracket) enrolled. Conversely, the age group of 3 to 4 year olds has the lowest likelihood of being enrolled in a private school, with 21 (100.0% in the age bracket) attending a public institution.
| Age Bracket | Public School | Private School |
| 3 to 4 Year Olds | 21 (100.0%) | 0 (0.0%) |
| 5 to 9 Year Old | 47 (100.0%) | 0 (0.0%) |
| 10 to 14 Year Olds | 90 (100.0%) | 0 (0.0%) |
| 15 to 17 Year Olds | 15 (100.0%) | 0 (0.0%) |
| 18 to 19 Year Olds | 0 (0.0%) | 0 (0.0%) |
| 20 to 24 Year Olds | 25 (100.0%) | 0 (0.0%) |
| 25 to 34 Year Olds | 7 (100.0%) | 0 (0.0%) |
| 35 Years and over | 5 (55.6%) | 4 (44.4%) |
| Total | 210 (98.1%) | 4 (1.9%) |
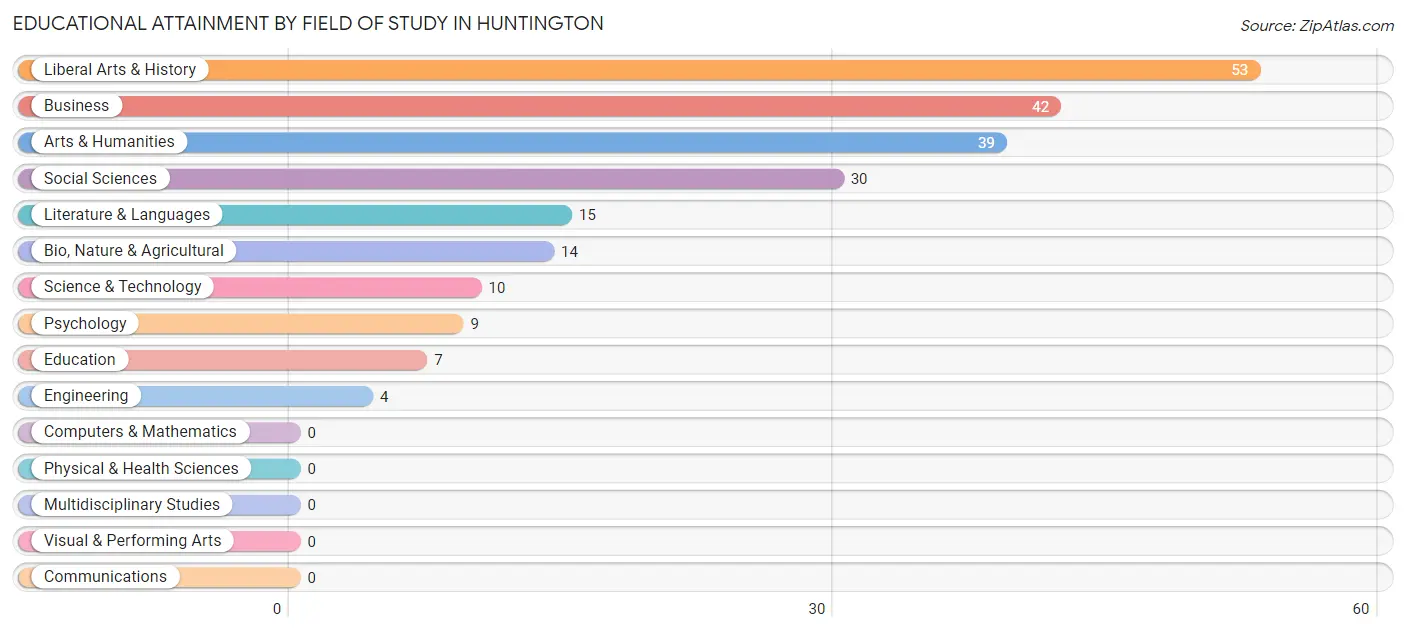
Educational Attainment by Field of Study in Huntington
Liberal arts & history (53 | 23.8%), business (42 | 18.8%), arts & humanities (39 | 17.5%), social sciences (30 | 13.5%), and literature & languages (15 | 6.7%) are the most common fields of study among 223 individuals in Huntington who have obtained a bachelor's degree or higher.
| Field of Study | # Graduates | % Graduates |
| Computers & Mathematics | 0 | 0.0% |
| Bio, Nature & Agricultural | 14 | 6.3% |
| Physical & Health Sciences | 0 | 0.0% |
| Psychology | 9 | 4.0% |
| Social Sciences | 30 | 13.5% |
| Engineering | 4 | 1.8% |
| Multidisciplinary Studies | 0 | 0.0% |
| Science & Technology | 10 | 4.5% |
| Business | 42 | 18.8% |
| Education | 7 | 3.1% |
| Literature & Languages | 15 | 6.7% |
| Liberal Arts & History | 53 | 23.8% |
| Visual & Performing Arts | 0 | 0.0% |
| Communications | 0 | 0.0% |
| Arts & Humanities | 39 | 17.5% |
| Total | 223 | 100.0% |
Transportation & Commute in Huntington
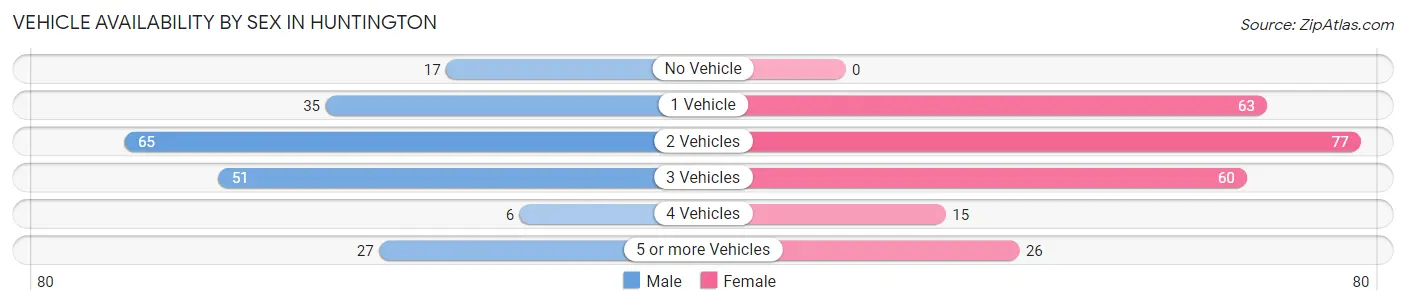
Vehicle Availability by Sex in Huntington
The most prevalent vehicle ownership categories in Huntington are males with 2 vehicles (65, accounting for 32.3%) and females with 2 vehicles (77, making up 27.0%).
| Vehicles Available | Male | Female |
| No Vehicle | 17 (8.5%) | 0 (0.0%) |
| 1 Vehicle | 35 (17.4%) | 63 (26.1%) |
| 2 Vehicles | 65 (32.3%) | 77 (32.0%) |
| 3 Vehicles | 51 (25.4%) | 60 (24.9%) |
| 4 Vehicles | 6 (3.0%) | 15 (6.2%) |
| 5 or more Vehicles | 27 (13.4%) | 26 (10.8%) |
| Total | 201 (100.0%) | 241 (100.0%) |
Commute Time in Huntington
The most frequently occuring commute durations in Huntington are 30 to 34 minutes (96 commuters, 22.8%), 35 to 39 minutes (86 commuters, 20.4%), and 45 to 59 minutes (75 commuters, 17.8%).
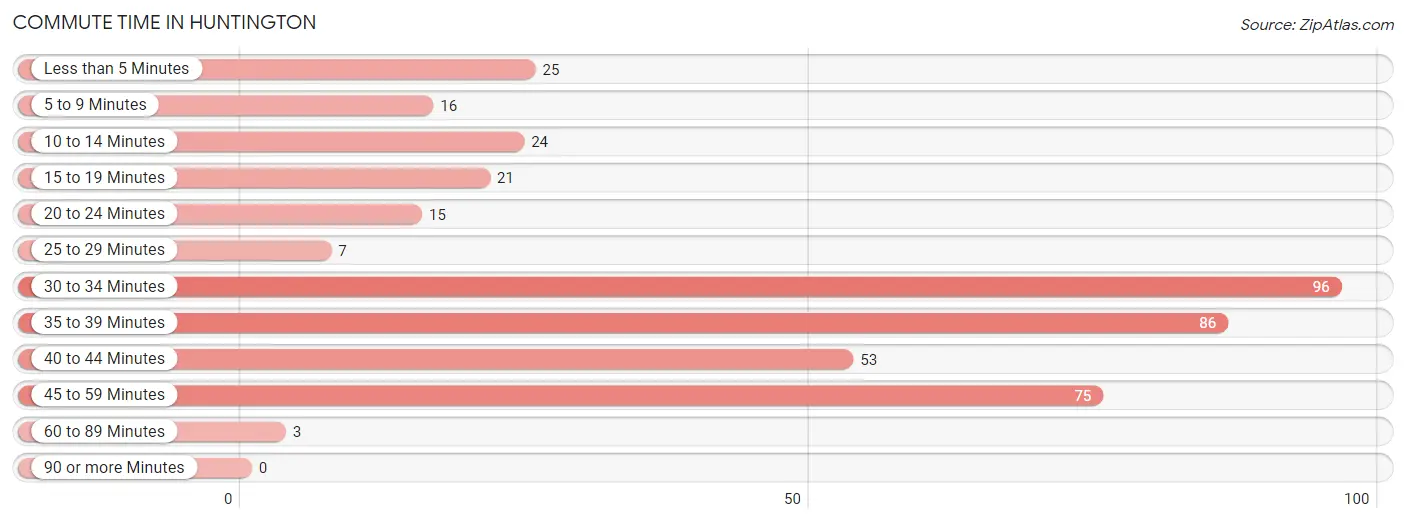
| Commute Time | # Commuters | % Commuters |
| Less than 5 Minutes | 25 | 5.9% |
| 5 to 9 Minutes | 16 | 3.8% |
| 10 to 14 Minutes | 24 | 5.7% |
| 15 to 19 Minutes | 21 | 5.0% |
| 20 to 24 Minutes | 15 | 3.6% |
| 25 to 29 Minutes | 7 | 1.7% |
| 30 to 34 Minutes | 96 | 22.8% |
| 35 to 39 Minutes | 86 | 20.4% |
| 40 to 44 Minutes | 53 | 12.6% |
| 45 to 59 Minutes | 75 | 17.8% |
| 60 to 89 Minutes | 3 | 0.7% |
| 90 or more Minutes | 0 | 0.0% |
Commute Time by Sex in Huntington
The most common commute times in Huntington are 30 to 34 minutes (74 commuters, 41.1%) for males and 35 to 39 minutes (74 commuters, 30.7%) for females.
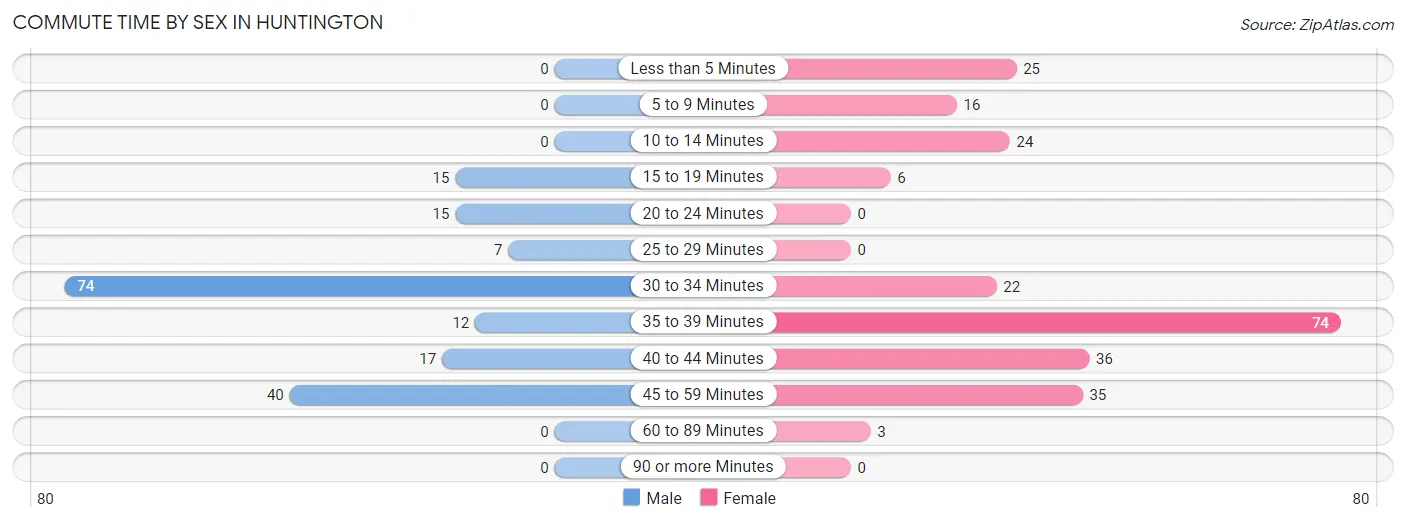
| Commute Time | Male | Female |
| Less than 5 Minutes | 0 (0.0%) | 25 (10.4%) |
| 5 to 9 Minutes | 0 (0.0%) | 16 (6.6%) |
| 10 to 14 Minutes | 0 (0.0%) | 24 (10.0%) |
| 15 to 19 Minutes | 15 (8.3%) | 6 (2.5%) |
| 20 to 24 Minutes | 15 (8.3%) | 0 (0.0%) |
| 25 to 29 Minutes | 7 (3.9%) | 0 (0.0%) |
| 30 to 34 Minutes | 74 (41.1%) | 22 (9.1%) |
| 35 to 39 Minutes | 12 (6.7%) | 74 (30.7%) |
| 40 to 44 Minutes | 17 (9.4%) | 36 (14.9%) |
| 45 to 59 Minutes | 40 (22.2%) | 35 (14.5%) |
| 60 to 89 Minutes | 0 (0.0%) | 3 (1.2%) |
| 90 or more Minutes | 0 (0.0%) | 0 (0.0%) |
Time of Departure to Work by Sex in Huntington
The most frequent times of departure to work in Huntington are 6:00 AM to 6:29 AM (46, 25.6%) for males and 8:00 AM to 8:29 AM (72, 29.9%) for females.
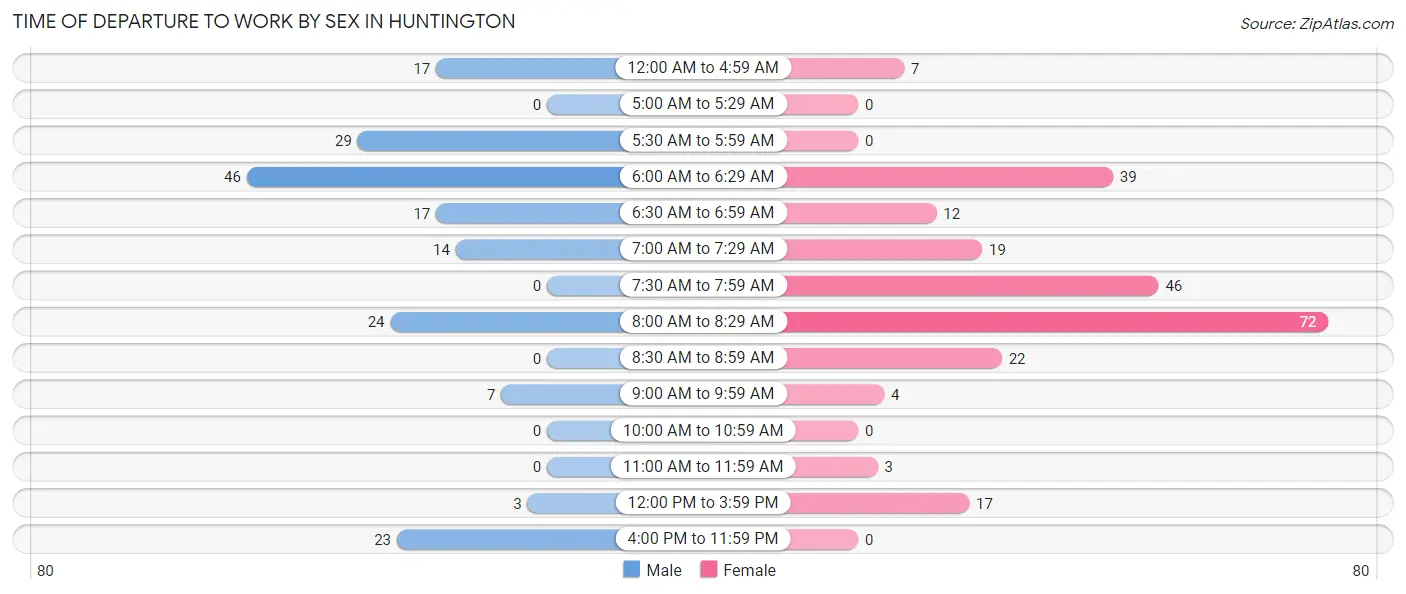
| Time of Departure | Male | Female |
| 12:00 AM to 4:59 AM | 17 (9.4%) | 7 (2.9%) |
| 5:00 AM to 5:29 AM | 0 (0.0%) | 0 (0.0%) |
| 5:30 AM to 5:59 AM | 29 (16.1%) | 0 (0.0%) |
| 6:00 AM to 6:29 AM | 46 (25.6%) | 39 (16.2%) |
| 6:30 AM to 6:59 AM | 17 (9.4%) | 12 (5.0%) |
| 7:00 AM to 7:29 AM | 14 (7.8%) | 19 (7.9%) |
| 7:30 AM to 7:59 AM | 0 (0.0%) | 46 (19.1%) |
| 8:00 AM to 8:29 AM | 24 (13.3%) | 72 (29.9%) |
| 8:30 AM to 8:59 AM | 0 (0.0%) | 22 (9.1%) |
| 9:00 AM to 9:59 AM | 7 (3.9%) | 4 (1.7%) |
| 10:00 AM to 10:59 AM | 0 (0.0%) | 0 (0.0%) |
| 11:00 AM to 11:59 AM | 0 (0.0%) | 3 (1.2%) |
| 12:00 PM to 3:59 PM | 3 (1.7%) | 17 (7.0%) |
| 4:00 PM to 11:59 PM | 23 (12.8%) | 0 (0.0%) |
| Total | 180 (100.0%) | 241 (100.0%) |
Housing Occupancy in Huntington
Occupancy by Ownership in Huntington
Of the total 338 dwellings in Huntington, owner-occupied units account for 214 (63.3%), while renter-occupied units make up 124 (36.7%).
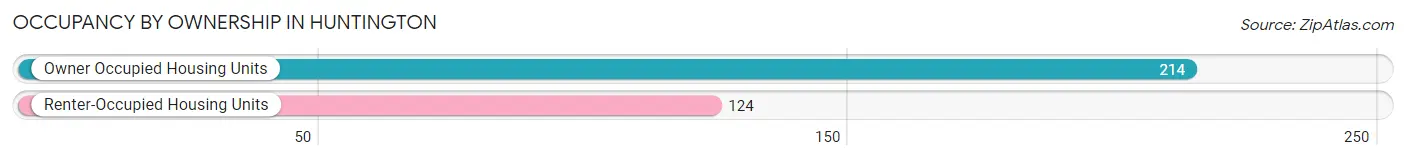
| Occupancy | # Housing Units | % Housing Units |
| Owner Occupied Housing Units | 214 | 63.3% |
| Renter-Occupied Housing Units | 124 | 36.7% |
| Total Occupied Housing Units | 338 | 100.0% |
Occupancy by Household Size in Huntington
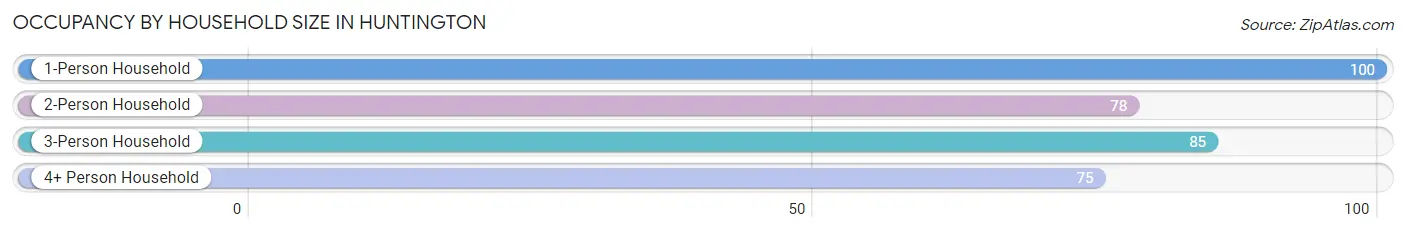
| Household Size | # Housing Units | % Housing Units |
| 1-Person Household | 100 | 29.6% |
| 2-Person Household | 78 | 23.1% |
| 3-Person Household | 85 | 25.2% |
| 4+ Person Household | 75 | 22.2% |
| Total Housing Units | 338 | 100.0% |
Occupancy by Ownership by Household Size in Huntington
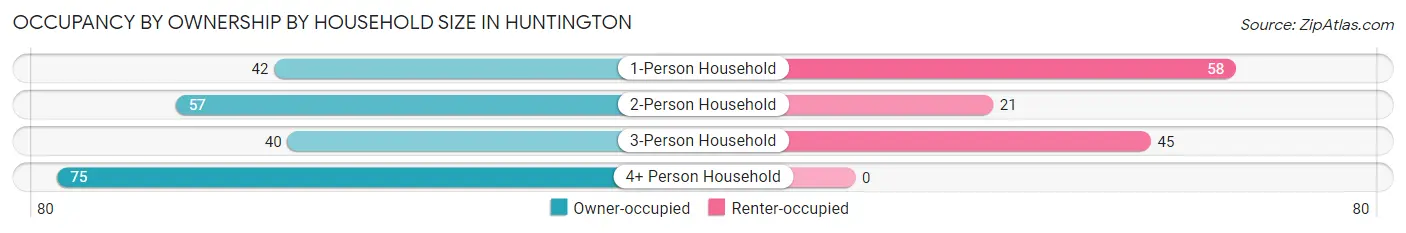
| Household Size | Owner-occupied | Renter-occupied |
| 1-Person Household | 42 (42.0%) | 58 (58.0%) |
| 2-Person Household | 57 (73.1%) | 21 (26.9%) |
| 3-Person Household | 40 (47.1%) | 45 (52.9%) |
| 4+ Person Household | 75 (100.0%) | 0 (0.0%) |
| Total Housing Units | 214 (63.3%) | 124 (36.7%) |
Occupancy by Educational Attainment in Huntington
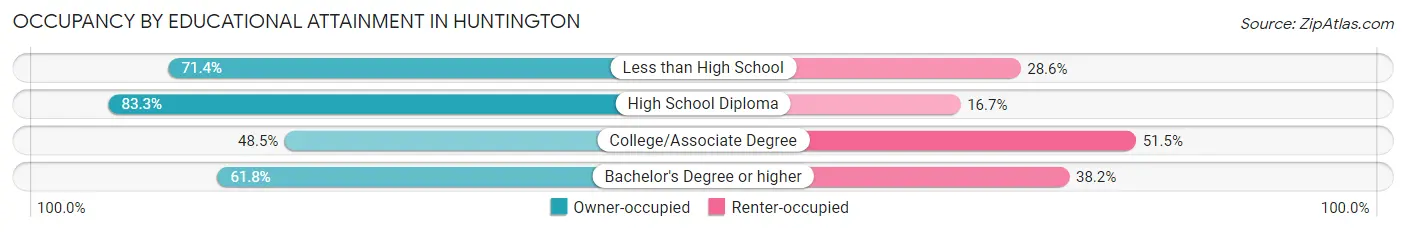
| Household Size | Owner-occupied | Renter-occupied |
| Less than High School | 15 (71.4%) | 6 (28.6%) |
| High School Diploma | 65 (83.3%) | 13 (16.7%) |
| College/Associate Degree | 50 (48.5%) | 53 (51.5%) |
| Bachelor's Degree or higher | 84 (61.8%) | 52 (38.2%) |
Occupancy by Age of Householder in Huntington
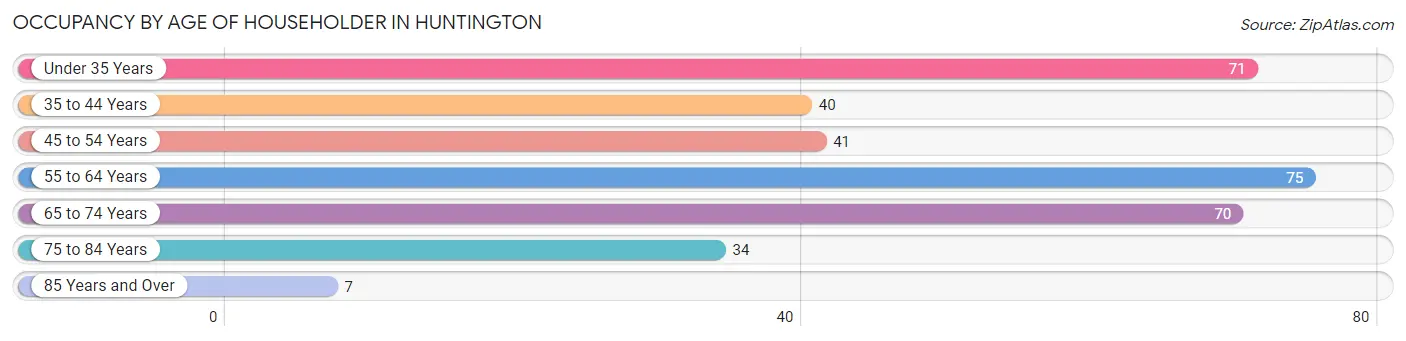
| Age Bracket | # Households | % Households |
| Under 35 Years | 71 | 21.0% |
| 35 to 44 Years | 40 | 11.8% |
| 45 to 54 Years | 41 | 12.1% |
| 55 to 64 Years | 75 | 22.2% |
| 65 to 74 Years | 70 | 20.7% |
| 75 to 84 Years | 34 | 10.1% |
| 85 Years and Over | 7 | 2.1% |
| Total | 338 | 100.0% |
Housing Finances in Huntington
Median Income by Occupancy in Huntington
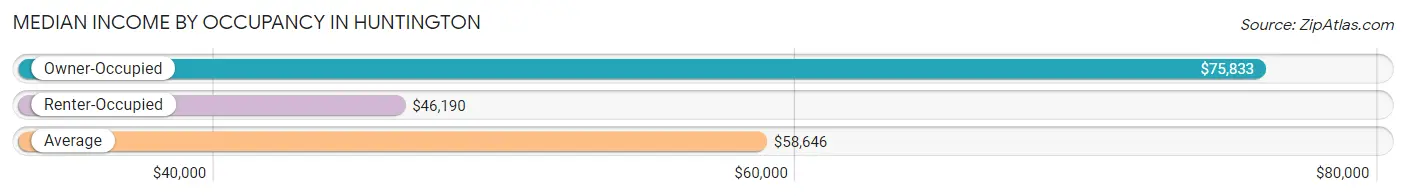
| Occupancy Type | # Households | Median Income |
| Owner-Occupied | 214 (63.3%) | $75,833 |
| Renter-Occupied | 124 (36.7%) | $46,190 |
| Average | 338 (100.0%) | $58,646 |
Occupancy by Householder Income Bracket in Huntington
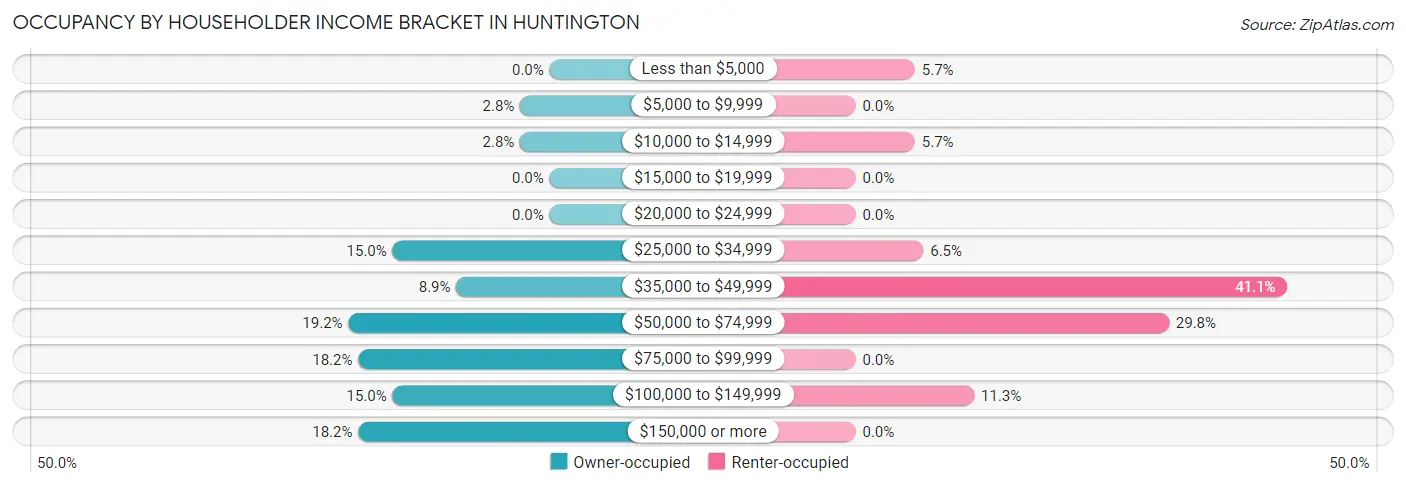
| Income Bracket | Owner-occupied | Renter-occupied |
| Less than $5,000 | 0 (0.0%) | 7 (5.7%) |
| $5,000 to $9,999 | 6 (2.8%) | 0 (0.0%) |
| $10,000 to $14,999 | 6 (2.8%) | 7 (5.7%) |
| $15,000 to $19,999 | 0 (0.0%) | 0 (0.0%) |
| $20,000 to $24,999 | 0 (0.0%) | 0 (0.0%) |
| $25,000 to $34,999 | 32 (14.9%) | 8 (6.5%) |
| $35,000 to $49,999 | 19 (8.9%) | 51 (41.1%) |
| $50,000 to $74,999 | 41 (19.2%) | 37 (29.8%) |
| $75,000 to $99,999 | 39 (18.2%) | 0 (0.0%) |
| $100,000 to $149,999 | 32 (14.9%) | 14 (11.3%) |
| $150,000 or more | 39 (18.2%) | 0 (0.0%) |
| Total | 214 (100.0%) | 124 (100.0%) |
Monthly Housing Cost Tiers in Huntington
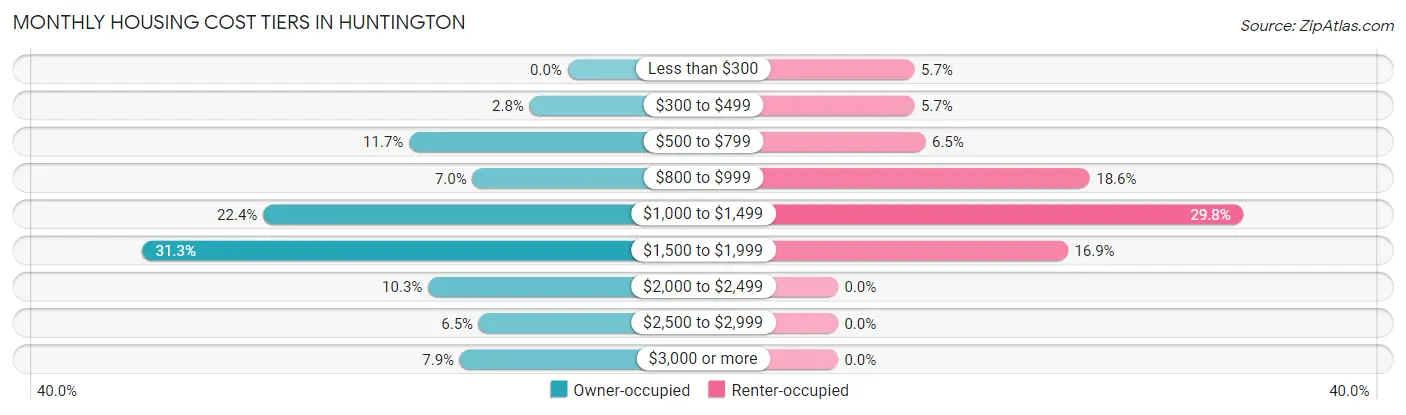
| Monthly Cost | Owner-occupied | Renter-occupied |
| Less than $300 | 0 (0.0%) | 7 (5.7%) |
| $300 to $499 | 6 (2.8%) | 7 (5.7%) |
| $500 to $799 | 25 (11.7%) | 8 (6.5%) |
| $800 to $999 | 15 (7.0%) | 23 (18.5%) |
| $1,000 to $1,499 | 48 (22.4%) | 37 (29.8%) |
| $1,500 to $1,999 | 67 (31.3%) | 21 (16.9%) |
| $2,000 to $2,499 | 22 (10.3%) | 0 (0.0%) |
| $2,500 to $2,999 | 14 (6.5%) | 0 (0.0%) |
| $3,000 or more | 17 (7.9%) | 0 (0.0%) |
| Total | 214 (100.0%) | 124 (100.0%) |
Physical Housing Characteristics in Huntington
Housing Structures in Huntington
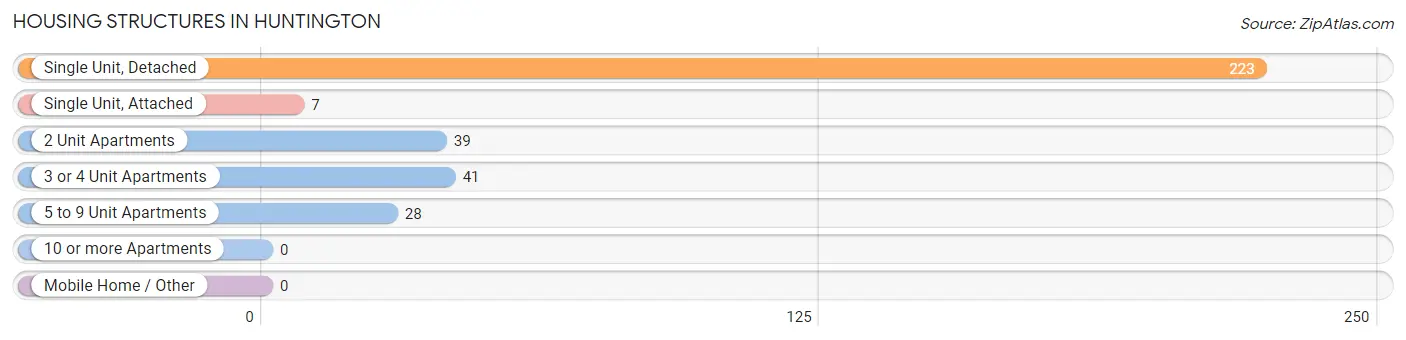
| Structure Type | # Housing Units | % Housing Units |
| Single Unit, Detached | 223 | 66.0% |
| Single Unit, Attached | 7 | 2.1% |
| 2 Unit Apartments | 39 | 11.5% |
| 3 or 4 Unit Apartments | 41 | 12.1% |
| 5 to 9 Unit Apartments | 28 | 8.3% |
| 10 or more Apartments | 0 | 0.0% |
| Mobile Home / Other | 0 | 0.0% |
| Total | 338 | 100.0% |
Housing Structures by Occupancy in Huntington
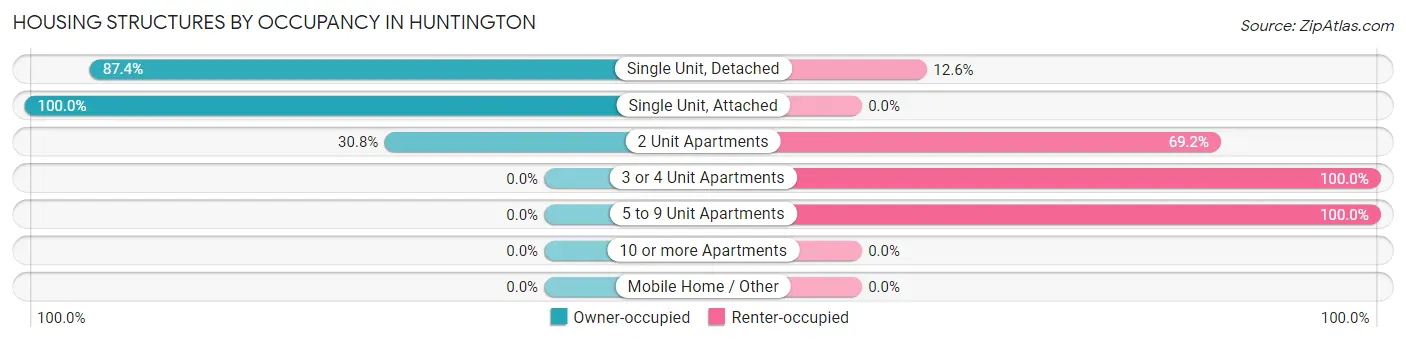
| Structure Type | Owner-occupied | Renter-occupied |
| Single Unit, Detached | 195 (87.4%) | 28 (12.6%) |
| Single Unit, Attached | 7 (100.0%) | 0 (0.0%) |
| 2 Unit Apartments | 12 (30.8%) | 27 (69.2%) |
| 3 or 4 Unit Apartments | 0 (0.0%) | 41 (100.0%) |
| 5 to 9 Unit Apartments | 0 (0.0%) | 28 (100.0%) |
| 10 or more Apartments | 0 (0.0%) | 0 (0.0%) |
| Mobile Home / Other | 0 (0.0%) | 0 (0.0%) |
| Total | 214 (63.3%) | 124 (36.7%) |
Housing Structures by Number of Rooms in Huntington
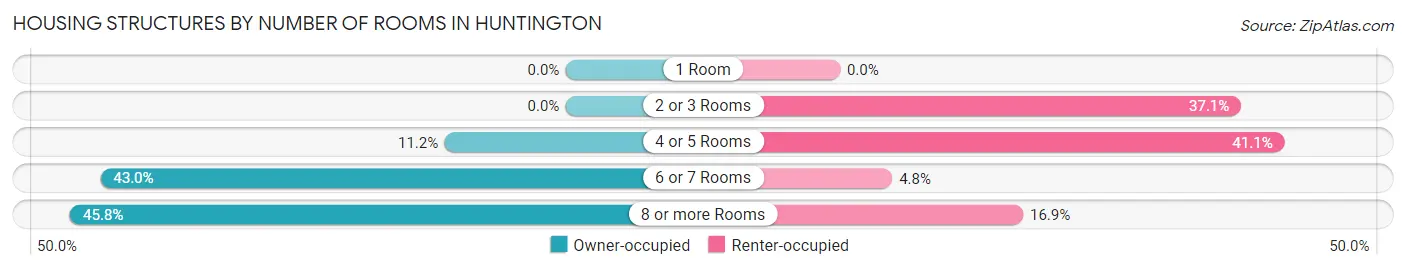
| Number of Rooms | Owner-occupied | Renter-occupied |
| 1 Room | 0 (0.0%) | 0 (0.0%) |
| 2 or 3 Rooms | 0 (0.0%) | 46 (37.1%) |
| 4 or 5 Rooms | 24 (11.2%) | 51 (41.1%) |
| 6 or 7 Rooms | 92 (43.0%) | 6 (4.8%) |
| 8 or more Rooms | 98 (45.8%) | 21 (16.9%) |
| Total | 214 (100.0%) | 124 (100.0%) |
Housing Structure by Heating Type in Huntington
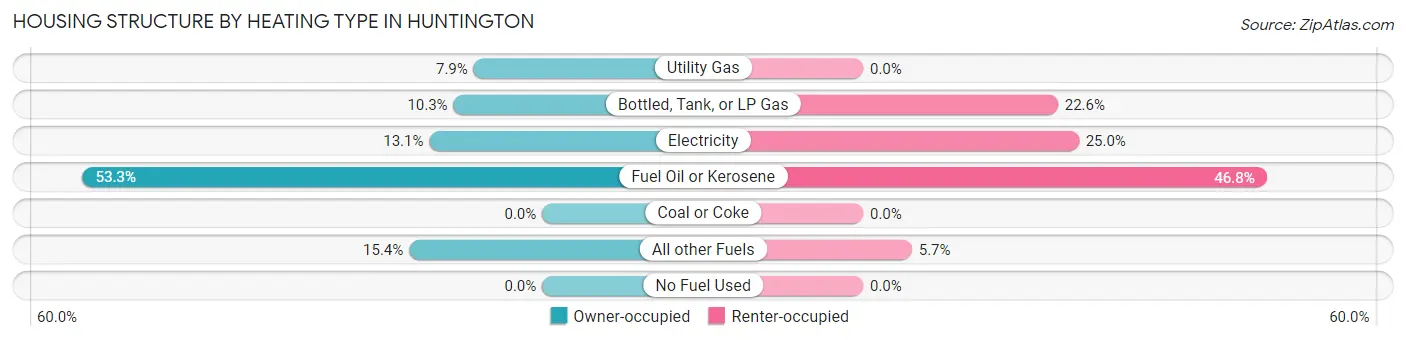
| Heating Type | Owner-occupied | Renter-occupied |
| Utility Gas | 17 (7.9%) | 0 (0.0%) |
| Bottled, Tank, or LP Gas | 22 (10.3%) | 28 (22.6%) |
| Electricity | 28 (13.1%) | 31 (25.0%) |
| Fuel Oil or Kerosene | 114 (53.3%) | 58 (46.8%) |
| Coal or Coke | 0 (0.0%) | 0 (0.0%) |
| All other Fuels | 33 (15.4%) | 7 (5.7%) |
| No Fuel Used | 0 (0.0%) | 0 (0.0%) |
| Total | 214 (100.0%) | 124 (100.0%) |
Household Vehicle Usage in Huntington
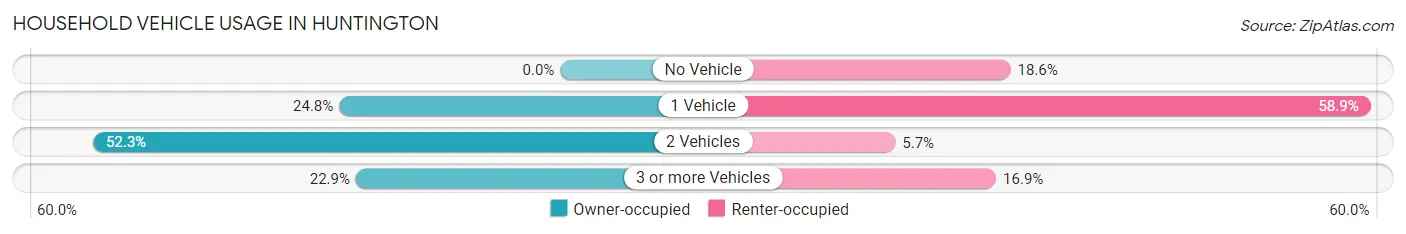
| Vehicles per Household | Owner-occupied | Renter-occupied |
| No Vehicle | 0 (0.0%) | 23 (18.5%) |
| 1 Vehicle | 53 (24.8%) | 73 (58.9%) |
| 2 Vehicles | 112 (52.3%) | 7 (5.7%) |
| 3 or more Vehicles | 49 (22.9%) | 21 (16.9%) |
| Total | 214 (100.0%) | 124 (100.0%) |
Real Estate & Mortgages in Huntington
Real Estate and Mortgage Overview in Huntington
| Characteristic | Without Mortgage | With Mortgage |
| Housing Units | 57 | 157 |
| Median Property Value | $251,600 | $235,500 |
| Median Household Income | $61,250 | $39 |
| Monthly Housing Costs | $785 | $17 |
| Real Estate Taxes | $5,054 | $6 |
Property Value by Mortgage Status in Huntington
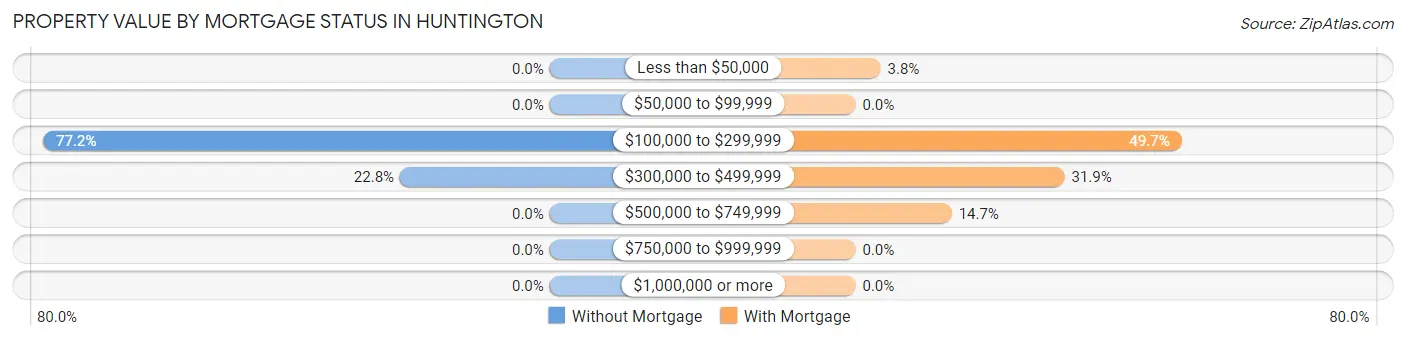
| Property Value | Without Mortgage | With Mortgage |
| Less than $50,000 | 0 (0.0%) | 6 (3.8%) |
| $50,000 to $99,999 | 0 (0.0%) | 0 (0.0%) |
| $100,000 to $299,999 | 44 (77.2%) | 78 (49.7%) |
| $300,000 to $499,999 | 13 (22.8%) | 50 (31.9%) |
| $500,000 to $749,999 | 0 (0.0%) | 23 (14.6%) |
| $750,000 to $999,999 | 0 (0.0%) | 0 (0.0%) |
| $1,000,000 or more | 0 (0.0%) | 0 (0.0%) |
| Total | 57 (100.0%) | 157 (100.0%) |
Household Income by Mortgage Status in Huntington
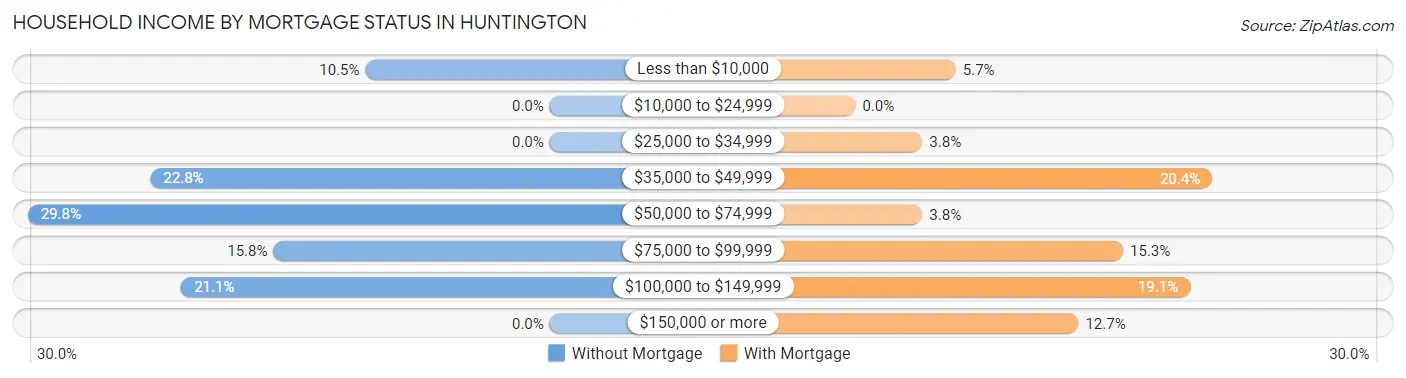
| Household Income | Without Mortgage | With Mortgage |
| Less than $10,000 | 6 (10.5%) | 9 (5.7%) |
| $10,000 to $24,999 | 0 (0.0%) | 0 (0.0%) |
| $25,000 to $34,999 | 0 (0.0%) | 6 (3.8%) |
| $35,000 to $49,999 | 13 (22.8%) | 32 (20.4%) |
| $50,000 to $74,999 | 17 (29.8%) | 6 (3.8%) |
| $75,000 to $99,999 | 9 (15.8%) | 24 (15.3%) |
| $100,000 to $149,999 | 12 (21.0%) | 30 (19.1%) |
| $150,000 or more | 0 (0.0%) | 20 (12.7%) |
| Total | 57 (100.0%) | 157 (100.0%) |
Property Value to Household Income Ratio in Huntington
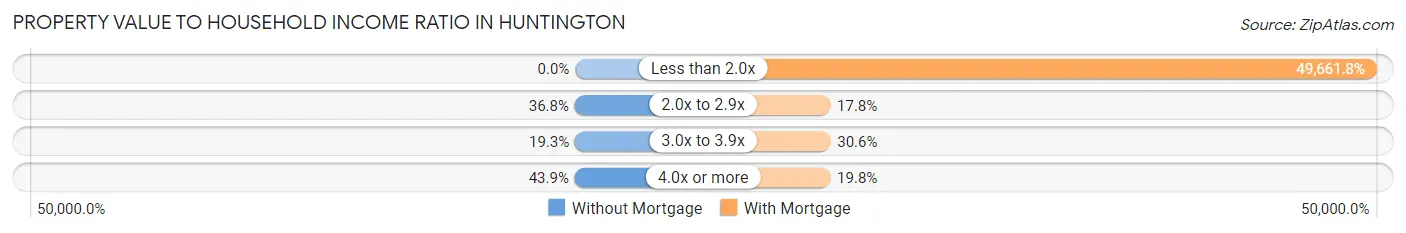
| Value-to-Income Ratio | Without Mortgage | With Mortgage |
| Less than 2.0x | 0 (0.0%) | 77,969 (49,661.8%) |
| 2.0x to 2.9x | 21 (36.8%) | 28 (17.8%) |
| 3.0x to 3.9x | 11 (19.3%) | 48 (30.6%) |
| 4.0x or more | 25 (43.9%) | 31 (19.8%) |
| Total | 57 (100.0%) | 157 (100.0%) |
Real Estate Taxes by Mortgage Status in Huntington
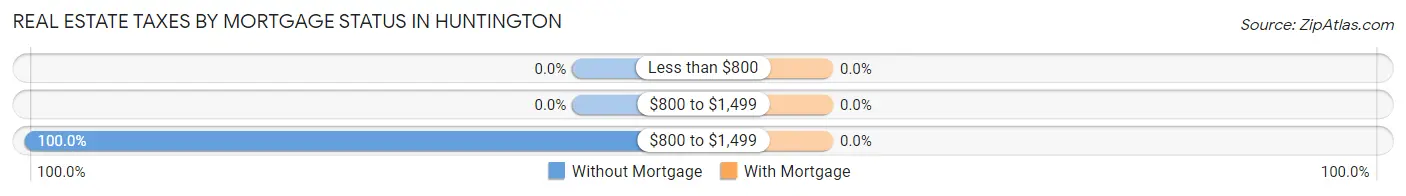
| Property Taxes | Without Mortgage | With Mortgage |
| Less than $800 | 0 (0.0%) | 0 (0.0%) |
| $800 to $1,499 | 0 (0.0%) | 0 (0.0%) |
| $800 to $1,499 | 57 (100.0%) | 0 (0.0%) |
| Total | 57 (100.0%) | 157 (100.0%) |
Health & Disability in Huntington
Health Insurance Coverage by Age in Huntington
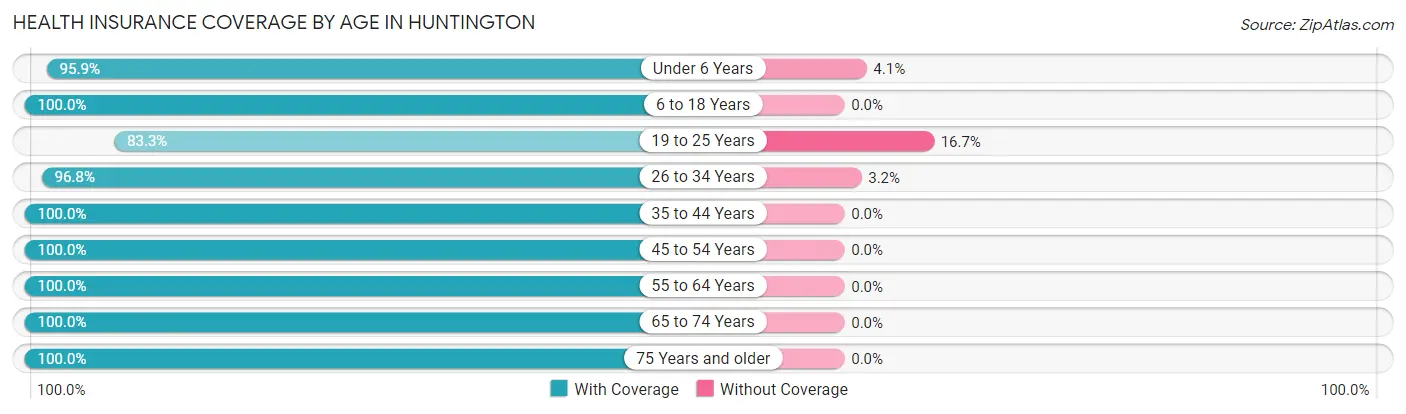
| Age Bracket | With Coverage | Without Coverage |
| Under 6 Years | 93 (95.9%) | 4 (4.1%) |
| 6 to 18 Years | 147 (100.0%) | 0 (0.0%) |
| 19 to 25 Years | 55 (83.3%) | 11 (16.7%) |
| 26 to 34 Years | 122 (96.8%) | 4 (3.2%) |
| 35 to 44 Years | 67 (100.0%) | 0 (0.0%) |
| 45 to 54 Years | 89 (100.0%) | 0 (0.0%) |
| 55 to 64 Years | 127 (100.0%) | 0 (0.0%) |
| 65 to 74 Years | 76 (100.0%) | 0 (0.0%) |
| 75 Years and older | 70 (100.0%) | 0 (0.0%) |
| Total | 846 (97.8%) | 19 (2.2%) |
Health Insurance Coverage by Citizenship Status in Huntington
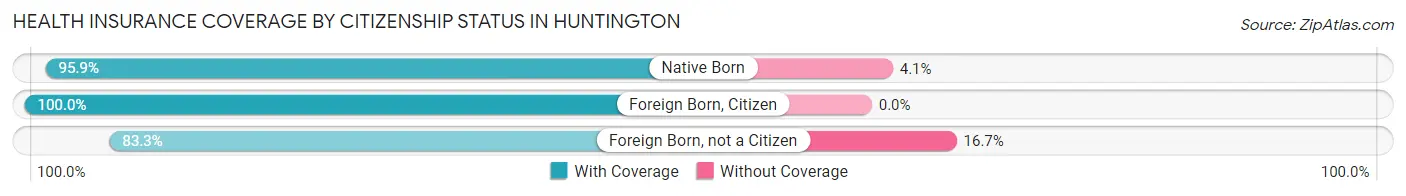
| Citizenship Status | With Coverage | Without Coverage |
| Native Born | 93 (95.9%) | 4 (4.1%) |
| Foreign Born, Citizen | 147 (100.0%) | 0 (0.0%) |
| Foreign Born, not a Citizen | 55 (83.3%) | 11 (16.7%) |
Health Insurance Coverage by Household Income in Huntington
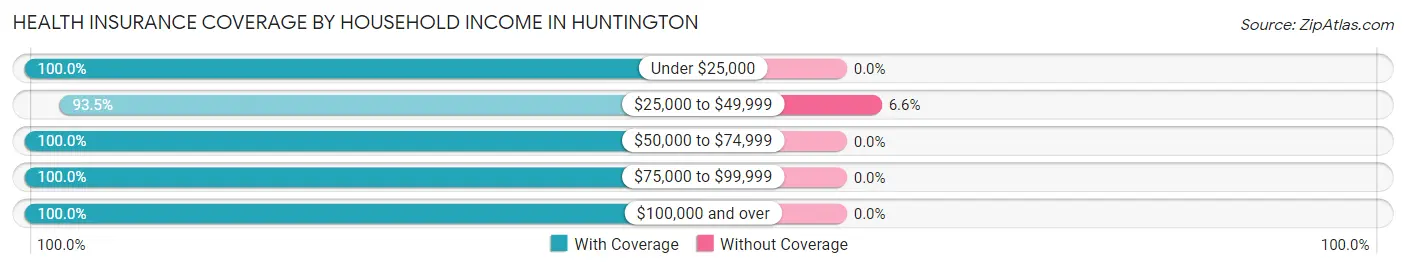
| Household Income | With Coverage | Without Coverage |
| Under $25,000 | 80 (100.0%) | 0 (0.0%) |
| $25,000 to $49,999 | 271 (93.4%) | 19 (6.6%) |
| $50,000 to $74,999 | 120 (100.0%) | 0 (0.0%) |
| $75,000 to $99,999 | 110 (100.0%) | 0 (0.0%) |
| $100,000 and over | 265 (100.0%) | 0 (0.0%) |
Public vs Private Health Insurance Coverage by Age in Huntington
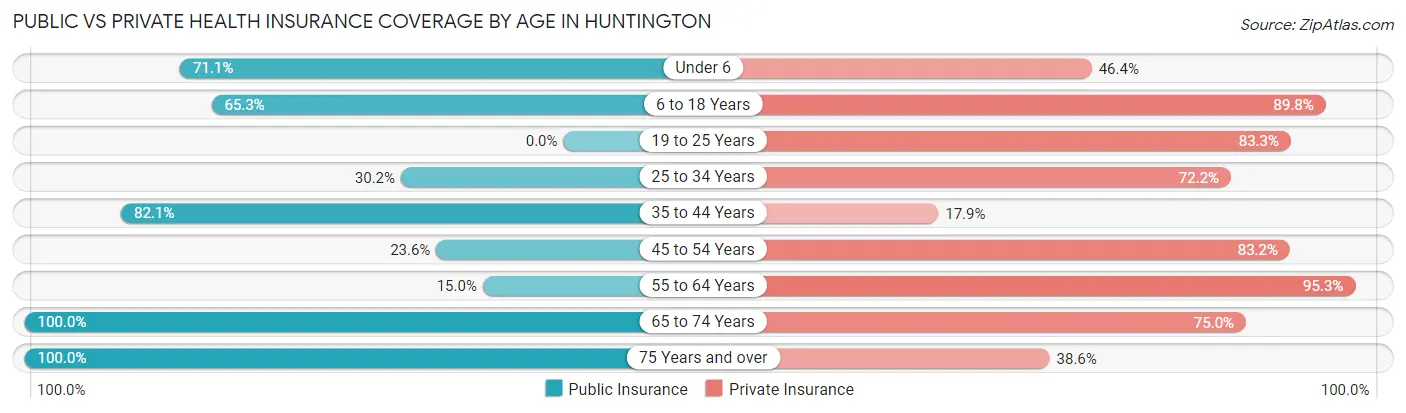
| Age Bracket | Public Insurance | Private Insurance |
| Under 6 | 69 (71.1%) | 45 (46.4%) |
| 6 to 18 Years | 96 (65.3%) | 132 (89.8%) |
| 19 to 25 Years | 0 (0.0%) | 55 (83.3%) |
| 25 to 34 Years | 38 (30.2%) | 91 (72.2%) |
| 35 to 44 Years | 55 (82.1%) | 12 (17.9%) |
| 45 to 54 Years | 21 (23.6%) | 74 (83.2%) |
| 55 to 64 Years | 19 (15.0%) | 121 (95.3%) |
| 65 to 74 Years | 76 (100.0%) | 57 (75.0%) |
| 75 Years and over | 70 (100.0%) | 27 (38.6%) |
| Total | 444 (51.3%) | 614 (71.0%) |
Disability Status by Sex by Age in Huntington
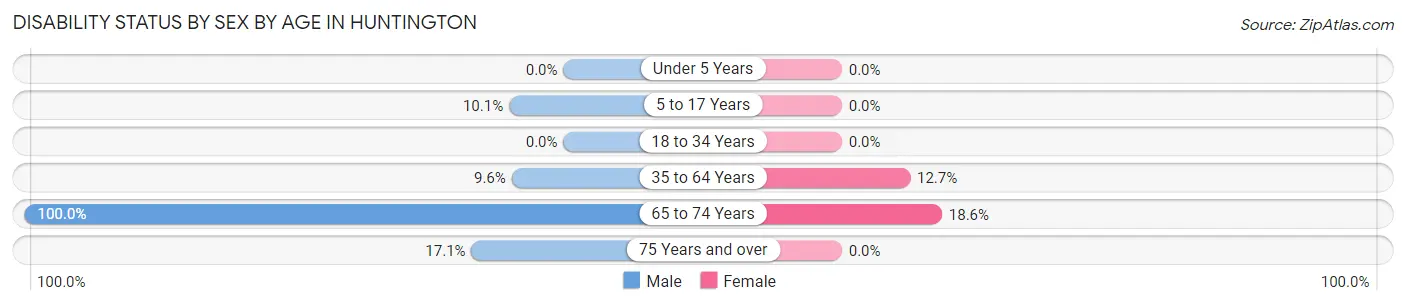
| Age Bracket | Male | Female |
| Under 5 Years | 0 (0.0%) | 0 (0.0%) |
| 5 to 17 Years | 11 (10.1%) | 0 (0.0%) |
| 18 to 34 Years | 0 (0.0%) | 0 (0.0%) |
| 35 to 64 Years | 12 (9.6%) | 20 (12.7%) |
| 65 to 74 Years | 6 (100.0%) | 13 (18.6%) |
| 75 Years and over | 7 (17.1%) | 0 (0.0%) |
Disability Class by Sex by Age in Huntington
Disability Class: Hearing Difficulty
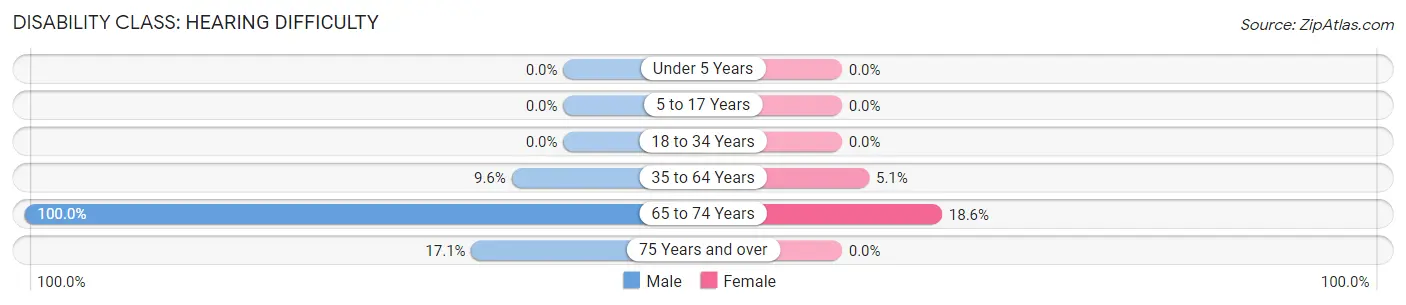
| Age Bracket | Male | Female |
| Under 5 Years | 0 (0.0%) | 0 (0.0%) |
| 5 to 17 Years | 0 (0.0%) | 0 (0.0%) |
| 18 to 34 Years | 0 (0.0%) | 0 (0.0%) |
| 35 to 64 Years | 12 (9.6%) | 8 (5.1%) |
| 65 to 74 Years | 6 (100.0%) | 13 (18.6%) |
| 75 Years and over | 7 (17.1%) | 0 (0.0%) |
Disability Class: Vision Difficulty
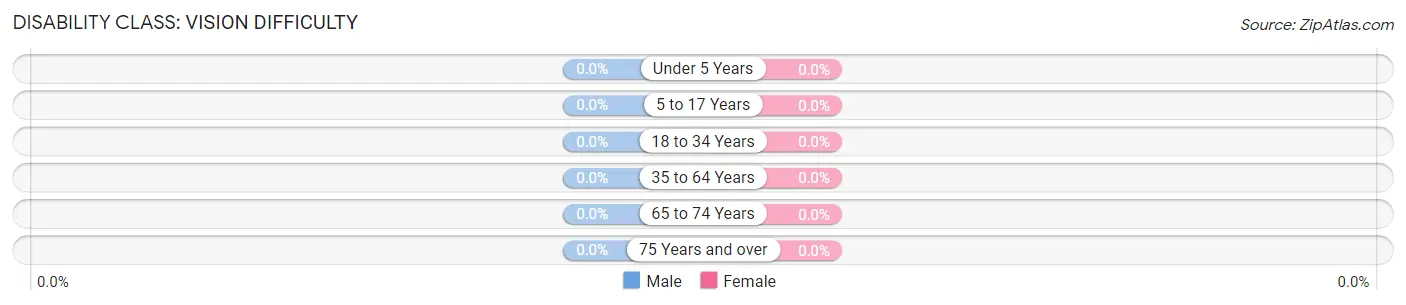
| Age Bracket | Male | Female |
| Under 5 Years | 0 (0.0%) | 0 (0.0%) |
| 5 to 17 Years | 0 (0.0%) | 0 (0.0%) |
| 18 to 34 Years | 0 (0.0%) | 0 (0.0%) |
| 35 to 64 Years | 0 (0.0%) | 0 (0.0%) |
| 65 to 74 Years | 0 (0.0%) | 0 (0.0%) |
| 75 Years and over | 0 (0.0%) | 0 (0.0%) |
Disability Class: Cognitive Difficulty
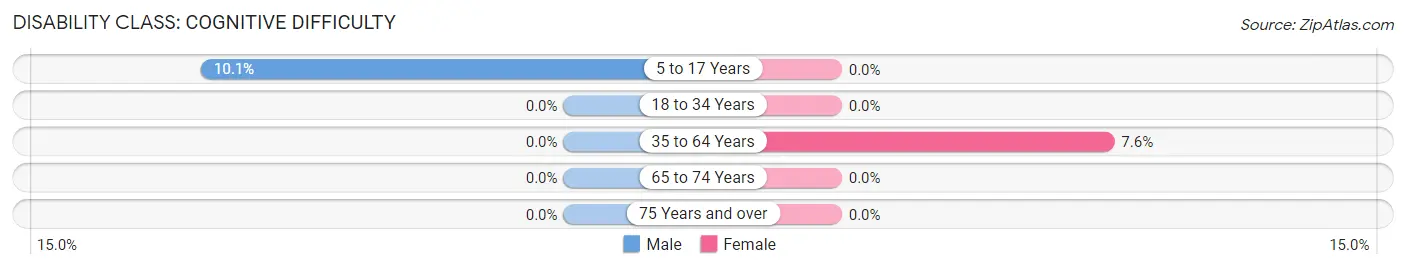
| Age Bracket | Male | Female |
| 5 to 17 Years | 11 (10.1%) | 0 (0.0%) |
| 18 to 34 Years | 0 (0.0%) | 0 (0.0%) |
| 35 to 64 Years | 0 (0.0%) | 12 (7.6%) |
| 65 to 74 Years | 0 (0.0%) | 0 (0.0%) |
| 75 Years and over | 0 (0.0%) | 0 (0.0%) |
Disability Class: Ambulatory Difficulty
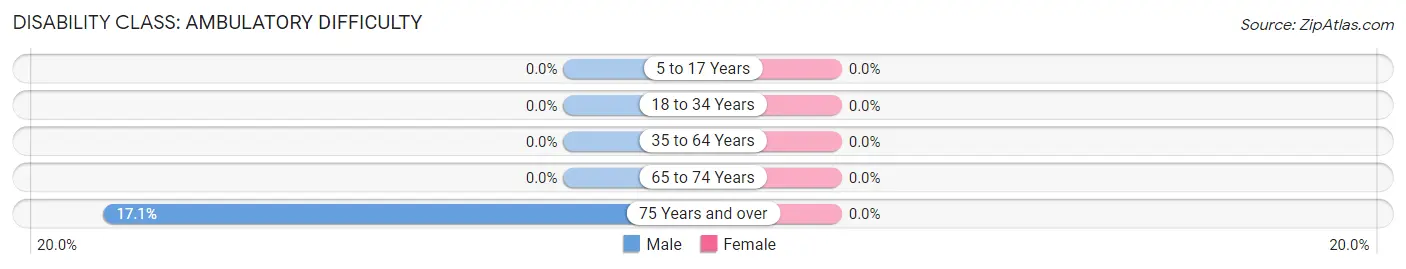
| Age Bracket | Male | Female |
| 5 to 17 Years | 0 (0.0%) | 0 (0.0%) |
| 18 to 34 Years | 0 (0.0%) | 0 (0.0%) |
| 35 to 64 Years | 0 (0.0%) | 0 (0.0%) |
| 65 to 74 Years | 0 (0.0%) | 0 (0.0%) |
| 75 Years and over | 7 (17.1%) | 0 (0.0%) |
Disability Class: Self-Care Difficulty
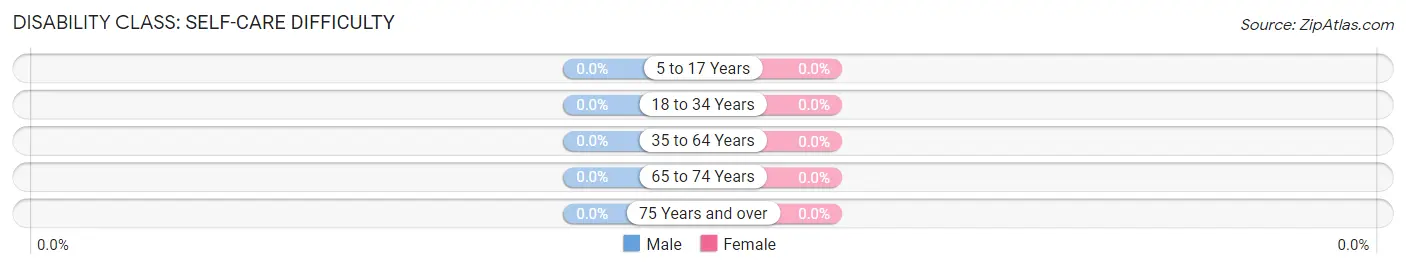
| Age Bracket | Male | Female |
| 5 to 17 Years | 0 (0.0%) | 0 (0.0%) |
| 18 to 34 Years | 0 (0.0%) | 0 (0.0%) |
| 35 to 64 Years | 0 (0.0%) | 0 (0.0%) |
| 65 to 74 Years | 0 (0.0%) | 0 (0.0%) |
| 75 Years and over | 0 (0.0%) | 0 (0.0%) |
Technology Access in Huntington
Computing Device Access in Huntington
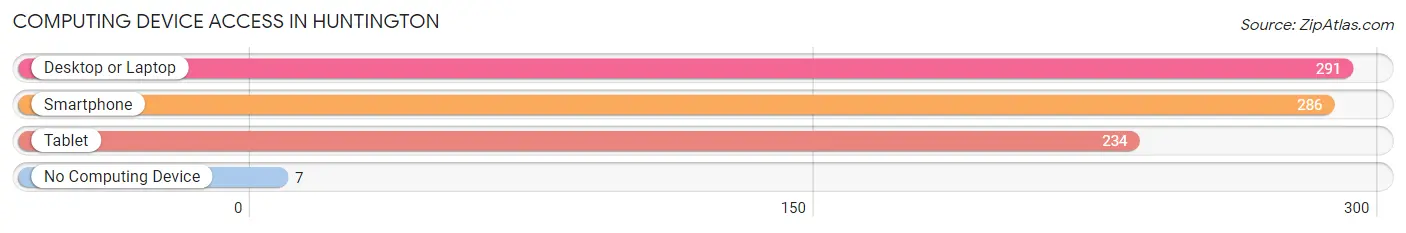
| Device Type | # Households | % Households |
| Desktop or Laptop | 291 | 86.1% |
| Smartphone | 286 | 84.6% |
| Tablet | 234 | 69.2% |
| No Computing Device | 7 | 2.1% |
| Total | 338 | 100.0% |
Internet Access in Huntington
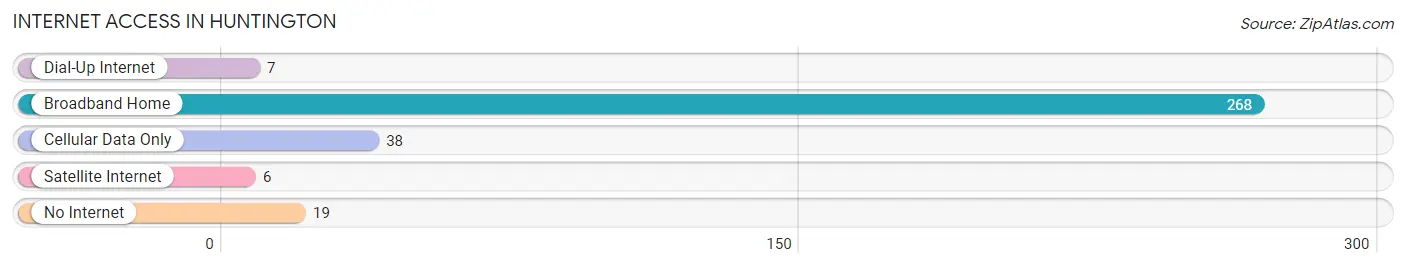
| Internet Type | # Households | % Households |
| Dial-Up Internet | 7 | 2.1% |
| Broadband Home | 268 | 79.3% |
| Cellular Data Only | 38 | 11.2% |
| Satellite Internet | 6 | 1.8% |
| No Internet | 19 | 5.6% |
| Total | 338 | 100.0% |
Huntington Summary
Huntington, Massachusetts is a small town located in the western part of the state, in Hampshire County. It is bordered by the towns of Chesterfield, Williamsburg, Worthington, and Middlefield. The town has a population of 1,741 people, according to the 2010 census.
History
The area that is now Huntington was first settled in 1735 by a group of settlers from Northampton. The town was officially incorporated in 1775, and was named after Samuel Huntington, a signer of the Declaration of Independence.
In the 19th century, Huntington was a rural farming community. The town was known for its production of apples, and the local economy was largely based on agriculture. In the late 19th century, the town began to experience a period of industrialization, with the opening of several factories.
Geography
Huntington is located in the western part of Hampshire County, in the Pioneer Valley region of Massachusetts. The town is situated on the eastern side of the Connecticut River, and is bordered by the towns of Chesterfield, Williamsburg, Worthington, and Middlefield. The town has a total area of 16.2 square miles, of which 15.9 square miles is land and 0.3 square miles is water.
The town is located in the foothills of the Berkshires, and is home to several small hills and mountains. The highest point in the town is the summit of Mount Toby, which has an elevation of 1,717 feet.
Economy
The economy of Huntington is largely based on agriculture and tourism. The town is home to several apple orchards, and is known for its production of apples. The town is also home to several small businesses, including a winery, a brewery, and a distillery.
The town is also home to several tourist attractions, including the historic Huntington Town Hall, the Huntington Historical Society, and the Huntington State Park. The town is also home to several small inns and bed and breakfasts.
Demographics
According to the 2010 census, the population of Huntington was 1,741 people. The racial makeup of the town was 97.2% White, 0.7% African American, 0.2% Native American, 0.3% Asian, 0.1% Pacific Islander, 0.3% from other races, and 1.2% from two or more races. Hispanic or Latino of any race were 1.2% of the population.
The median household income in Huntington was $60,938, and the median family income was $68,750. The per capita income for the town was $27,945. About 5.2% of families and 6.7% of the population were below the poverty line, including 8.2% of those under age 18 and 4.2% of those age 65 or over.
Common Questions
What is Per Capita Income in Huntington?
Per Capita income in Huntington is $29,911.
What is the Median Family Income in Huntington?
Median Family Income in Huntington is $75,972.
What is the Median Household income in Huntington?
Median Household Income in Huntington is $58,646.
What is Income or Wage Gap in Huntington?
Income or Wage Gap in Huntington is 44.4%.
Women in Huntington earn 55.6 cents for every dollar earned by a man.
What is Inequality or Gini Index in Huntington?
Inequality or Gini Index in Huntington is 0.37.
What is the Total Population of Huntington?
Total Population of Huntington is 865.
What is the Total Male Population of Huntington?
Total Male Population of Huntington is 381.
What is the Total Female Population of Huntington?
Total Female Population of Huntington is 484.
What is the Ratio of Males per 100 Females in Huntington?
There are 78.72 Males per 100 Females in Huntington.
What is the Ratio of Females per 100 Males in Huntington?
There are 127.03 Females per 100 Males in Huntington.
What is the Median Population Age in Huntington?
Median Population Age in Huntington is 34.8 Years.
What is the Average Family Size in Huntington
Average Family Size in Huntington is 3.2 People.
What is the Average Household Size in Huntington
Average Household Size in Huntington is 2.6 People.
How Large is the Labor Force in Huntington?
There are 458 People in the Labor Forcein in Huntington.
What is the Percentage of People in the Labor Force in Huntington?
73.8% of People are in the Labor Force in Huntington.
What is the Unemployment Rate in Huntington?
Unemployment Rate in Huntington is 3.5%.