Crescent, IA Map & Demographics
Crescent Map
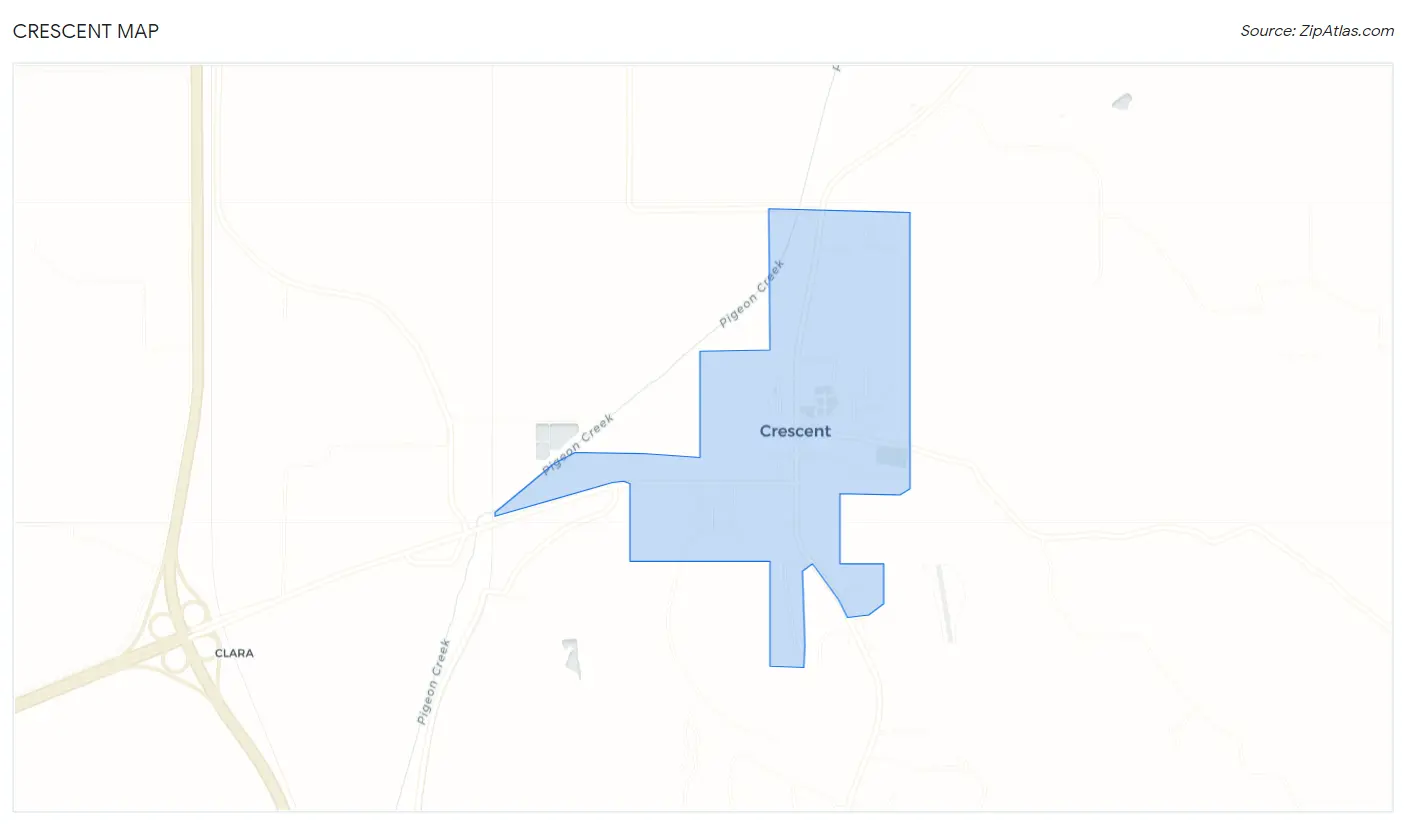
Crescent Overview
$45,486
PER CAPITA INCOME
$107,885
AVG FAMILY INCOME
$100,625
AVG HOUSEHOLD INCOME
45.5%
WAGE / INCOME GAP [ % ]
54.5¢/ $1
WAGE / INCOME GAP [ $ ]
0.30
INEQUALITY / GINI INDEX
651
TOTAL POPULATION
310
MALE POPULATION
341
FEMALE POPULATION
90.91
MALES / 100 FEMALES
110.00
FEMALES / 100 MALES
43.0
MEDIAN AGE
2.8
AVG FAMILY SIZE
2.5
AVG HOUSEHOLD SIZE
379
LABOR FORCE [ PEOPLE ]
72.3%
PERCENT IN LABOR FORCE
Crescent Zip Codes
Crescent Area Codes
Income in Crescent
Income Overview in Crescent
Per Capita Income in Crescent is $45,486, while median incomes of families and households are $107,885 and $100,625 respectively.
| Characteristic | Number | Measure |
| Per Capita Income | 651 | $45,486 |
| Median Family Income | 206 | $107,885 |
| Mean Family Income | 206 | $119,552 |
| Median Household Income | 261 | $100,625 |
| Mean Household Income | 261 | $112,546 |
| Income Deficit | 206 | $0 |
| Wage / Income Gap (%) | 651 | 45.55% |
| Wage / Income Gap ($) | 651 | 54.45¢ per $1 |
| Gini / Inequality Index | 651 | 0.30 |
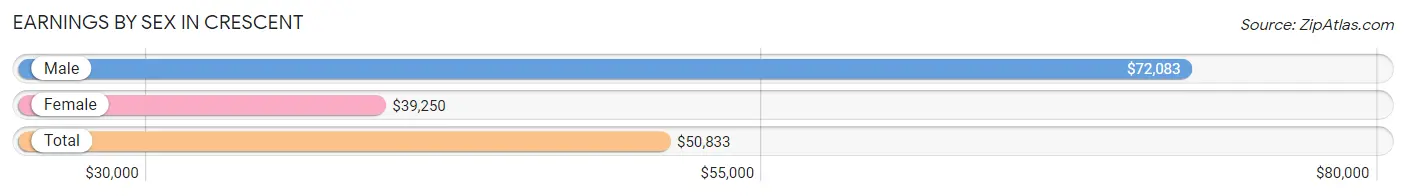
Earnings by Sex in Crescent
Average Earnings in Crescent are $50,833, $72,083 for men and $39,250 for women, a difference of 45.6%.
| Sex | Number | Average Earnings |
| Male | 181 (46.7%) | $72,083 |
| Female | 207 (53.3%) | $39,250 |
| Total | 388 (100.0%) | $50,833 |
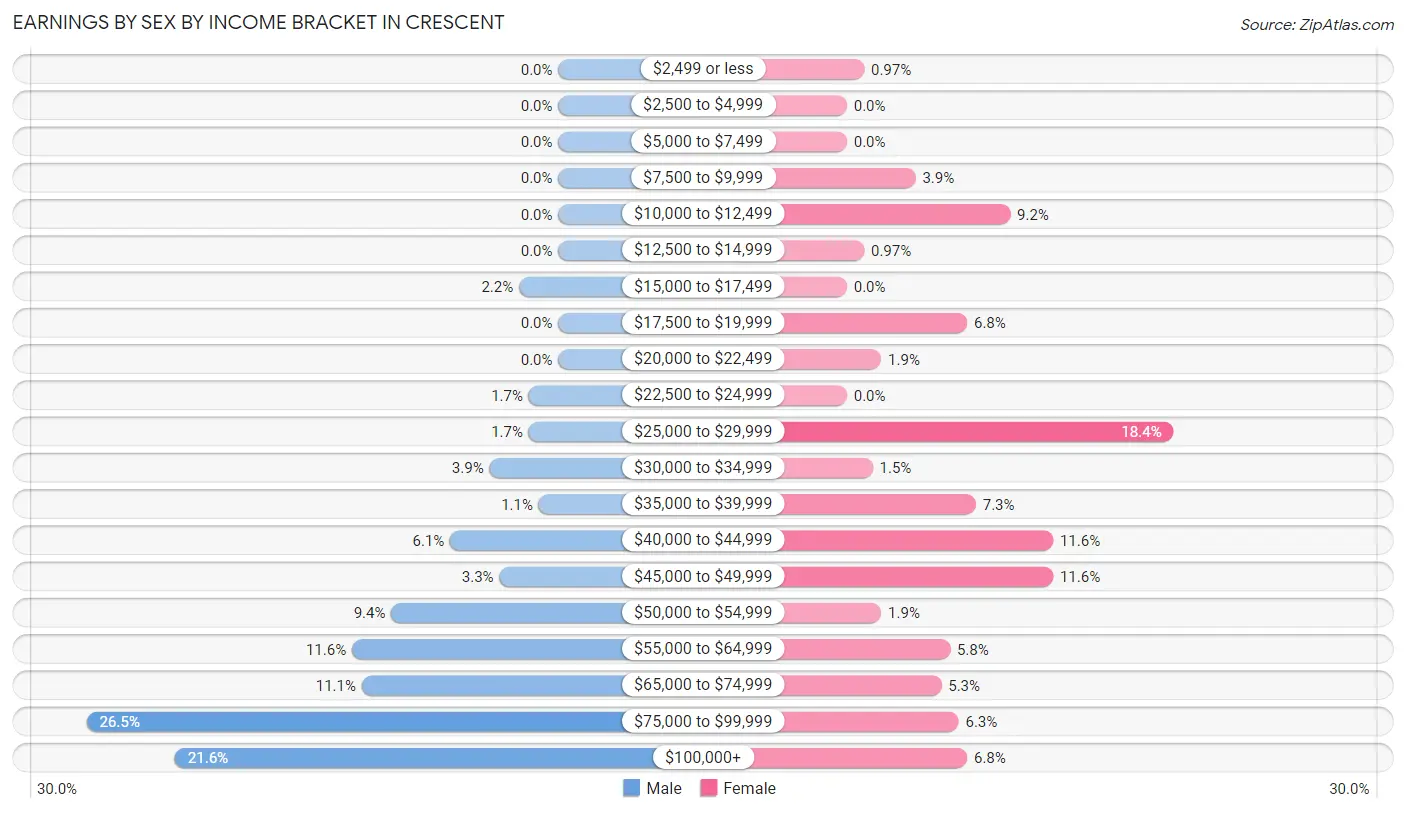
Earnings by Sex by Income Bracket in Crescent
The most common earnings brackets in Crescent are $75,000 to $99,999 for men (48 | 26.5%) and $25,000 to $29,999 for women (38 | 18.4%).
| Income | Male | Female |
| $2,499 or less | 0 (0.0%) | 2 (1.0%) |
| $2,500 to $4,999 | 0 (0.0%) | 0 (0.0%) |
| $5,000 to $7,499 | 0 (0.0%) | 0 (0.0%) |
| $7,500 to $9,999 | 0 (0.0%) | 8 (3.9%) |
| $10,000 to $12,499 | 0 (0.0%) | 19 (9.2%) |
| $12,500 to $14,999 | 0 (0.0%) | 2 (1.0%) |
| $15,000 to $17,499 | 4 (2.2%) | 0 (0.0%) |
| $17,500 to $19,999 | 0 (0.0%) | 14 (6.8%) |
| $20,000 to $22,499 | 0 (0.0%) | 4 (1.9%) |
| $22,500 to $24,999 | 3 (1.7%) | 0 (0.0%) |
| $25,000 to $29,999 | 3 (1.7%) | 38 (18.4%) |
| $30,000 to $34,999 | 7 (3.9%) | 3 (1.5%) |
| $35,000 to $39,999 | 2 (1.1%) | 15 (7.2%) |
| $40,000 to $44,999 | 11 (6.1%) | 24 (11.6%) |
| $45,000 to $49,999 | 6 (3.3%) | 24 (11.6%) |
| $50,000 to $54,999 | 17 (9.4%) | 4 (1.9%) |
| $55,000 to $64,999 | 21 (11.6%) | 12 (5.8%) |
| $65,000 to $74,999 | 20 (11.1%) | 11 (5.3%) |
| $75,000 to $99,999 | 48 (26.5%) | 13 (6.3%) |
| $100,000+ | 39 (21.5%) | 14 (6.8%) |
| Total | 181 (100.0%) | 207 (100.0%) |
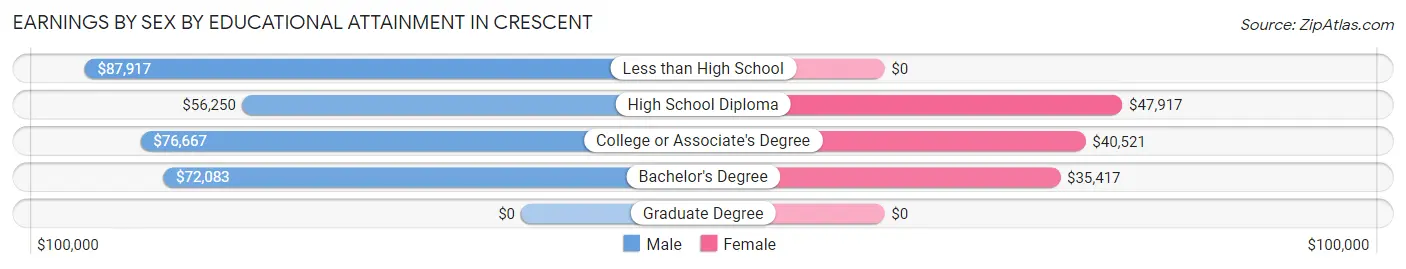
Earnings by Sex by Educational Attainment in Crescent
Average earnings in Crescent are $73,750 for men and $41,176 for women, a difference of 44.2%. Men with an educational attainment of less than high school enjoy the highest average annual earnings of $87,917, while those with high school diploma education earn the least with $56,250. Women with an educational attainment of high school diploma earn the most with the average annual earnings of $47,917, while those with bachelor's degree education have the smallest earnings of $35,417.
| Educational Attainment | Male Income | Female Income |
| Less than High School | $87,917 | $0 |
| High School Diploma | $56,250 | $47,917 |
| College or Associate's Degree | $76,667 | $40,521 |
| Bachelor's Degree | $72,083 | $35,417 |
| Graduate Degree | - | - |
| Total | $73,750 | $41,176 |
Family Income in Crescent
Family Income Brackets in Crescent
According to the Crescent family income data, there are 69 families falling into the $100,000 to $149,999 income range, which is the most common income bracket and makes up 33.5% of all families.
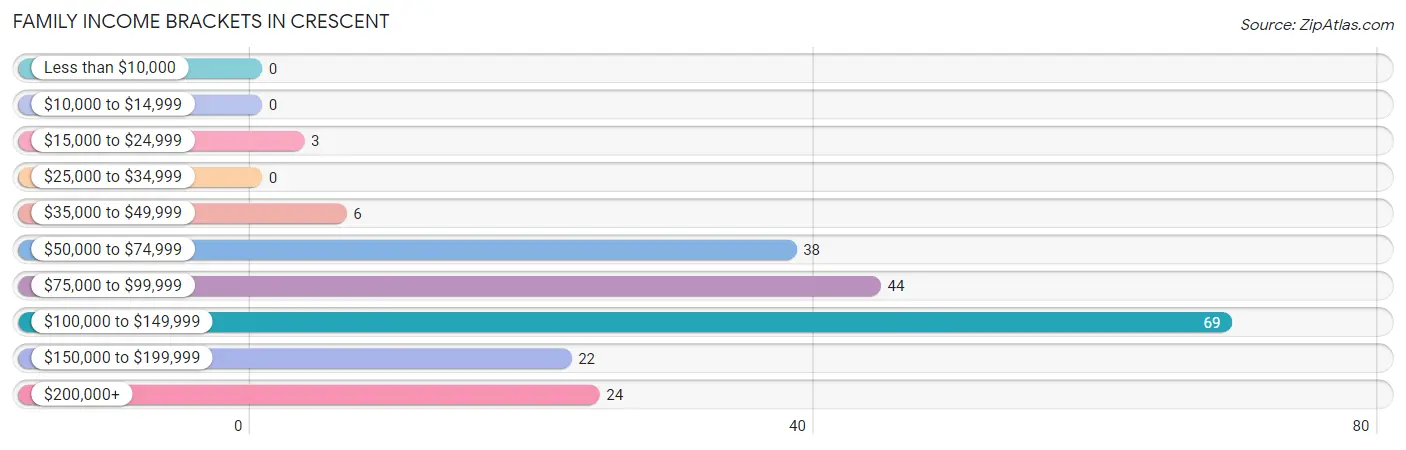
| Income Bracket | # Families | % Families |
| Less than $10,000 | 0 | 0.0% |
| $10,000 to $14,999 | 0 | 0.0% |
| $15,000 to $24,999 | 3 | 1.5% |
| $25,000 to $34,999 | 0 | 0.0% |
| $35,000 to $49,999 | 6 | 2.9% |
| $50,000 to $74,999 | 38 | 18.4% |
| $75,000 to $99,999 | 44 | 21.4% |
| $100,000 to $149,999 | 69 | 33.5% |
| $150,000 to $199,999 | 22 | 10.7% |
| $200,000+ | 24 | 11.7% |
Family Income by Famaliy Size in Crescent
2-person families (99 | 48.1%) account for the highest median family income in Crescent with $116,875 per family, while 2-person families (99 | 48.1%) have the highest median income of $58,438 per family member.
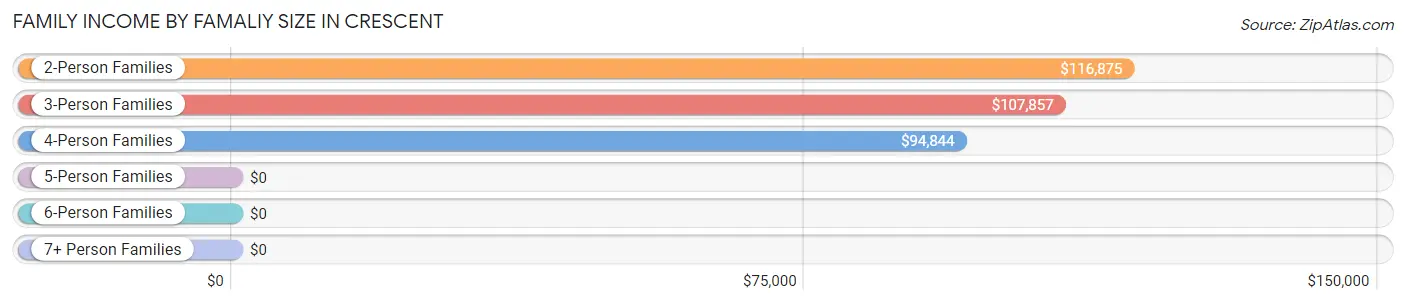
| Income Bracket | # Families | Median Income |
| 2-Person Families | 99 (48.1%) | $116,875 |
| 3-Person Families | 76 (36.9%) | $107,857 |
| 4-Person Families | 19 (9.2%) | $94,844 |
| 5-Person Families | 12 (5.8%) | $0 |
| 6-Person Families | 0 (0.0%) | $0 |
| 7+ Person Families | 0 (0.0%) | $0 |
| Total | 206 (100.0%) | $107,885 |
Family Income by Number of Earners in Crescent
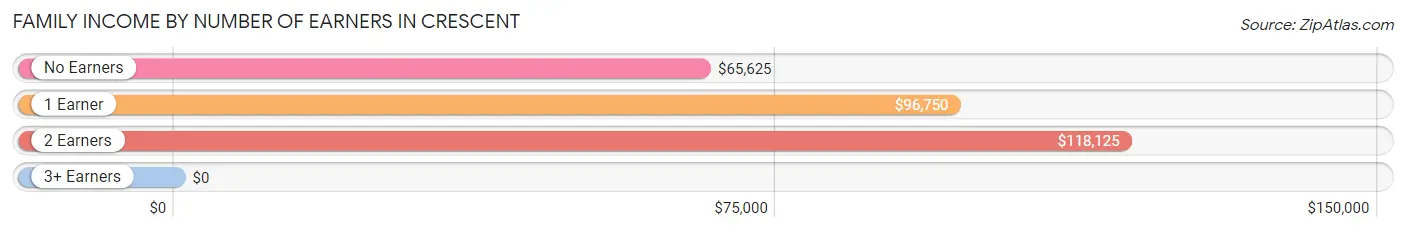
| Number of Earners | # Families | Median Income |
| No Earners | 35 (17.0%) | $65,625 |
| 1 Earner | 25 (12.1%) | $96,750 |
| 2 Earners | 135 (65.5%) | $118,125 |
| 3+ Earners | 11 (5.3%) | $0 |
| Total | 206 (100.0%) | $107,885 |
Household Income in Crescent
Household Income Brackets in Crescent
With 77 households falling in the category, the $100,000 to $149,999 income range is the most frequent in Crescent, accounting for 29.5% of all households.
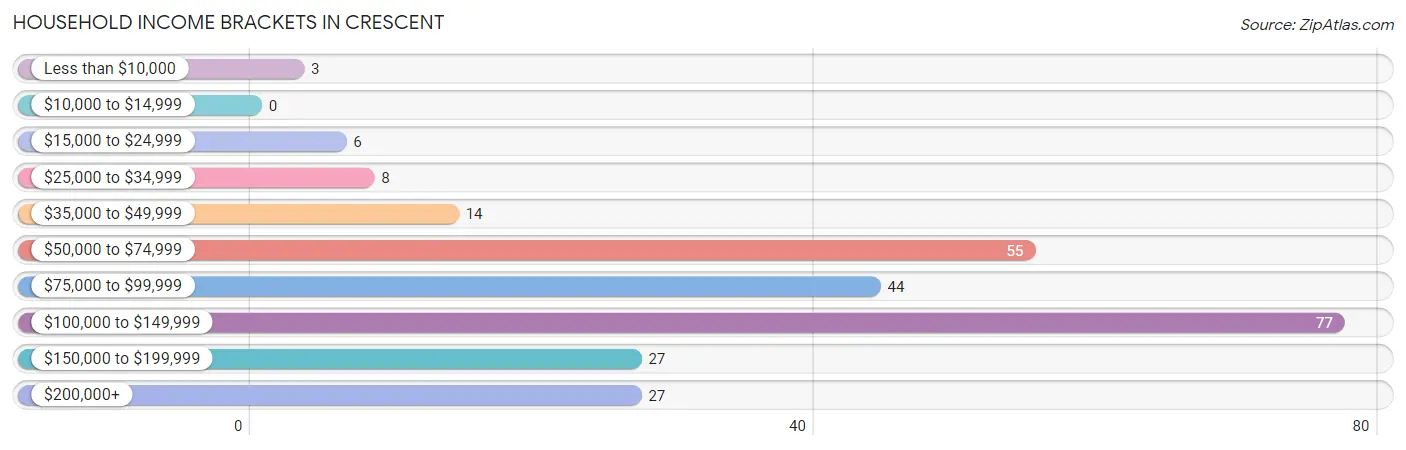
| Income Bracket | # Households | % Households |
| Less than $10,000 | 3 | 1.1% |
| $10,000 to $14,999 | 0 | 0.0% |
| $15,000 to $24,999 | 6 | 2.3% |
| $25,000 to $34,999 | 8 | 3.1% |
| $35,000 to $49,999 | 14 | 5.4% |
| $50,000 to $74,999 | 55 | 21.1% |
| $75,000 to $99,999 | 44 | 16.9% |
| $100,000 to $149,999 | 77 | 29.5% |
| $150,000 to $199,999 | 27 | 10.3% |
| $200,000+ | 27 | 10.3% |
Household Income by Householder Age in Crescent
The median household income in Crescent is $100,625, with the highest median household income of $146,563 found in the 45 to 64 years age bracket for the primary householder. A total of 95 households (36.4%) fall into this category. Meanwhile, the 15 to 24 years age bracket for the primary householder has the lowest median household income of $0, with 9 households (3.5%) in this group.
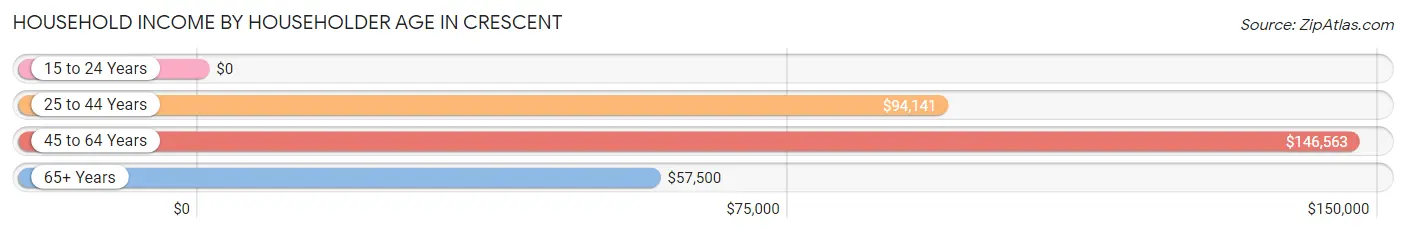
| Income Bracket | # Households | Median Income |
| 15 to 24 Years | 9 (3.5%) | $0 |
| 25 to 44 Years | 81 (31.0%) | $94,141 |
| 45 to 64 Years | 95 (36.4%) | $146,563 |
| 65+ Years | 76 (29.1%) | $57,500 |
| Total | 261 (100.0%) | $100,625 |
Poverty in Crescent
Income Below Poverty by Sex and Age in Crescent
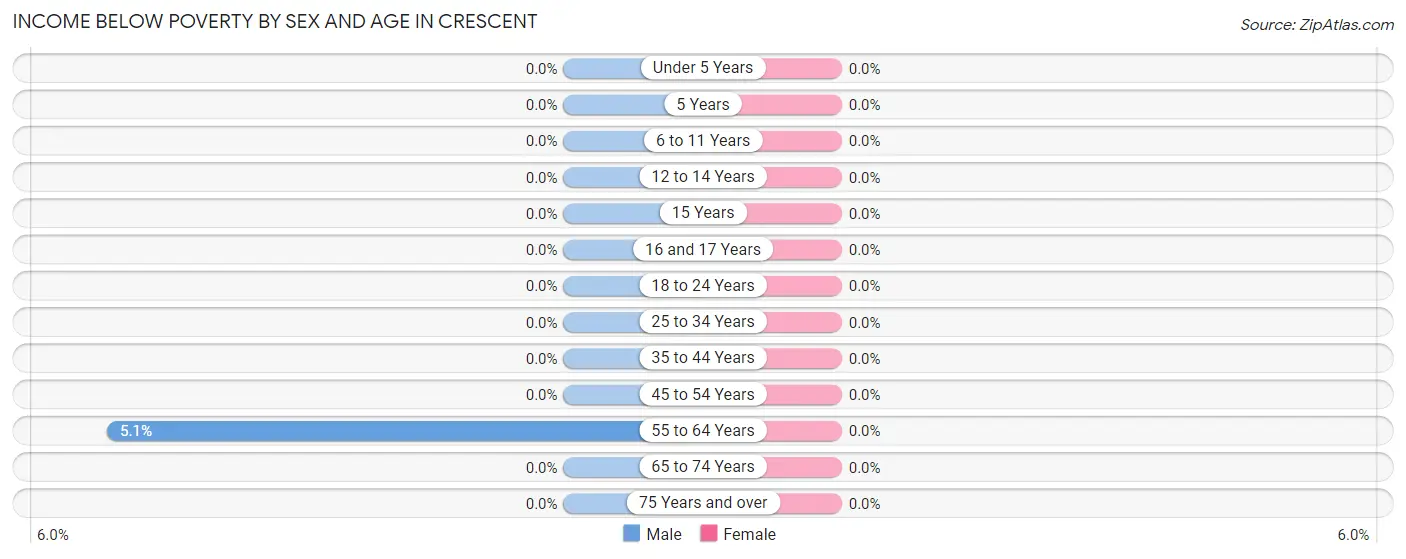
| Age Bracket | Male | Female |
| Under 5 Years | 0 (0.0%) | 0 (0.0%) |
| 5 Years | 0 (0.0%) | 0 (0.0%) |
| 6 to 11 Years | 0 (0.0%) | 0 (0.0%) |
| 12 to 14 Years | 0 (0.0%) | 0 (0.0%) |
| 15 Years | 0 (0.0%) | 0 (0.0%) |
| 16 and 17 Years | 0 (0.0%) | 0 (0.0%) |
| 18 to 24 Years | 0 (0.0%) | 0 (0.0%) |
| 25 to 34 Years | 0 (0.0%) | 0 (0.0%) |
| 35 to 44 Years | 0 (0.0%) | 0 (0.0%) |
| 45 to 54 Years | 0 (0.0%) | 0 (0.0%) |
| 55 to 64 Years | 3 (5.1%) | 0 (0.0%) |
| 65 to 74 Years | 0 (0.0%) | 0 (0.0%) |
| 75 Years and over | 0 (0.0%) | 0 (0.0%) |
| Total | 3 (1.0%) | 0 (0.0%) |
Income Above Poverty by Sex and Age in Crescent
According to the poverty statistics in Crescent, males aged under 5 years and females aged under 5 years are the age groups that are most secure financially, with 100.0% of males and 100.0% of females in these age groups living above the poverty line.
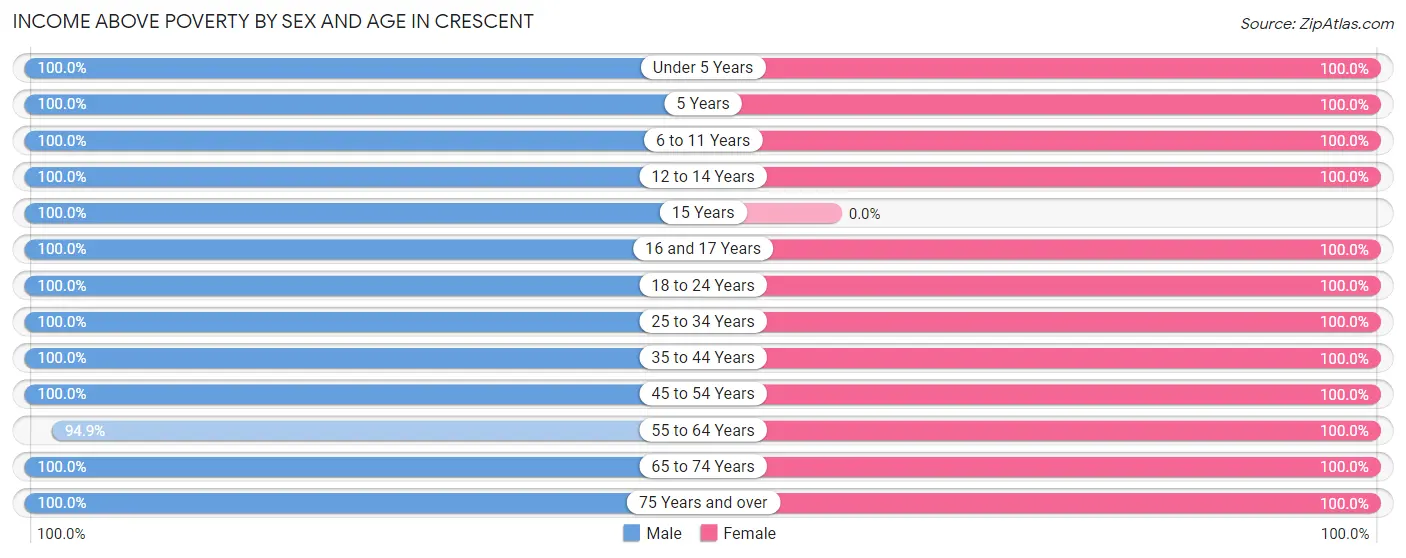
| Age Bracket | Male | Female |
| Under 5 Years | 26 (100.0%) | 2 (100.0%) |
| 5 Years | 3 (100.0%) | 6 (100.0%) |
| 6 to 11 Years | 22 (100.0%) | 32 (100.0%) |
| 12 to 14 Years | 7 (100.0%) | 13 (100.0%) |
| 15 Years | 16 (100.0%) | 0 (0.0%) |
| 16 and 17 Years | 2 (100.0%) | 17 (100.0%) |
| 18 to 24 Years | 4 (100.0%) | 25 (100.0%) |
| 25 to 34 Years | 41 (100.0%) | 35 (100.0%) |
| 35 to 44 Years | 35 (100.0%) | 60 (100.0%) |
| 45 to 54 Years | 48 (100.0%) | 22 (100.0%) |
| 55 to 64 Years | 56 (94.9%) | 53 (100.0%) |
| 65 to 74 Years | 29 (100.0%) | 36 (100.0%) |
| 75 Years and over | 18 (100.0%) | 40 (100.0%) |
| Total | 307 (99.0%) | 341 (100.0%) |
Income Below Poverty Among Married-Couple Families in Crescent
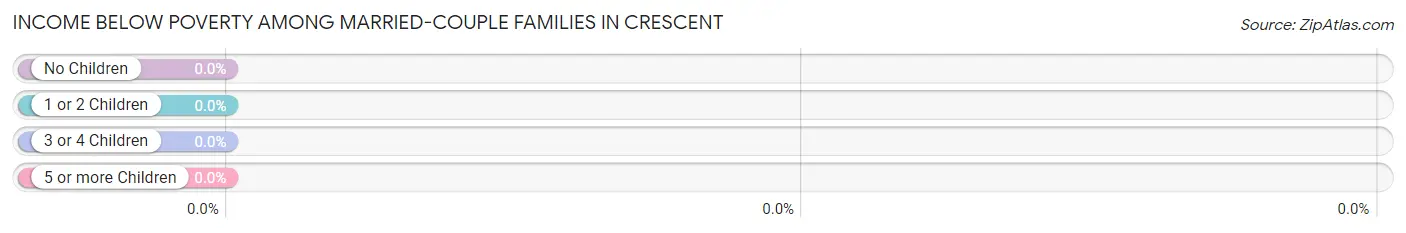
| Children | Above Poverty | Below Poverty |
| No Children | 107 (100.0%) | 0 (0.0%) |
| 1 or 2 Children | 74 (100.0%) | 0 (0.0%) |
| 3 or 4 Children | 8 (100.0%) | 0 (0.0%) |
| 5 or more Children | 0 (0.0%) | 0 (0.0%) |
| Total | 189 (100.0%) | 0 (0.0%) |
Income Below Poverty Among Single-Parent Households in Crescent
| Children | Single Father | Single Mother |
| No Children | 0 (0.0%) | 0 (0.0%) |
| 1 or 2 Children | 0 (0.0%) | 0 (0.0%) |
| 3 or 4 Children | 0 (0.0%) | 0 (0.0%) |
| 5 or more Children | 0 (0.0%) | 0 (0.0%) |
| Total | 0 (0.0%) | 0 (0.0%) |
Income Below Poverty Among Married-Couple vs Single-Parent Households in Crescent
| Children | Married-Couple Families | Single-Parent Households |
| No Children | 0 (0.0%) | 0 (0.0%) |
| 1 or 2 Children | 0 (0.0%) | 0 (0.0%) |
| 3 or 4 Children | 0 (0.0%) | 0 (0.0%) |
| 5 or more Children | 0 (0.0%) | 0 (0.0%) |
| Total | 0 (0.0%) | 0 (0.0%) |
Race in Crescent
The most populous races in Crescent are White / Caucasian (649 | 99.7%), Hispanic or Latino (29 | 4.4%), and Two or more Races (2 | 0.3%).
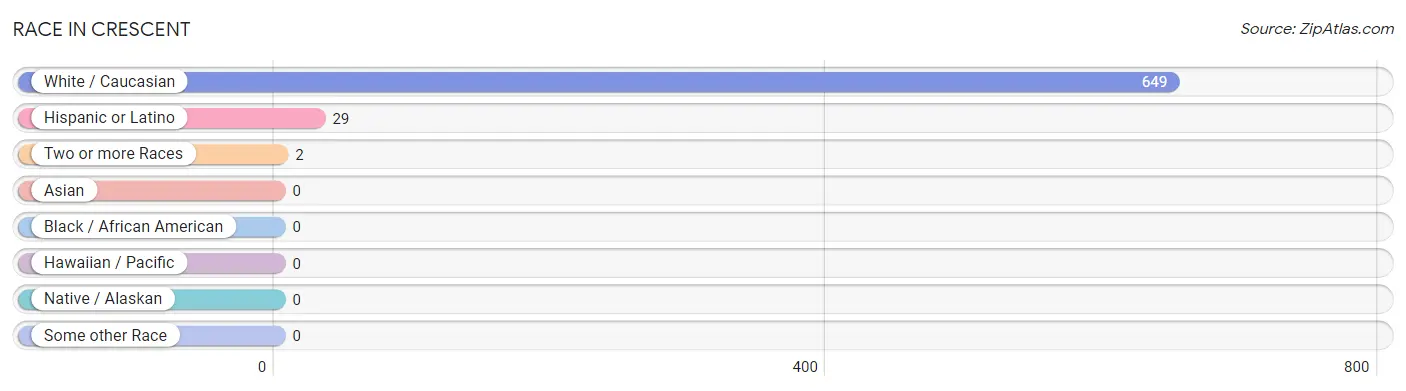
| Race | # Population | % Population |
| Asian | 0 | 0.0% |
| Black / African American | 0 | 0.0% |
| Hawaiian / Pacific | 0 | 0.0% |
| Hispanic or Latino | 29 | 4.4% |
| Native / Alaskan | 0 | 0.0% |
| White / Caucasian | 649 | 99.7% |
| Two or more Races | 2 | 0.3% |
| Some other Race | 0 | 0.0% |
| Total | 651 | 100.0% |
Ancestry in Crescent
The most populous ancestries reported in Crescent are German (196 | 30.1%), Irish (183 | 28.1%), English (84 | 12.9%), Italian (43 | 6.6%), and American (38 | 5.8%), together accounting for 83.6% of all Crescent residents.
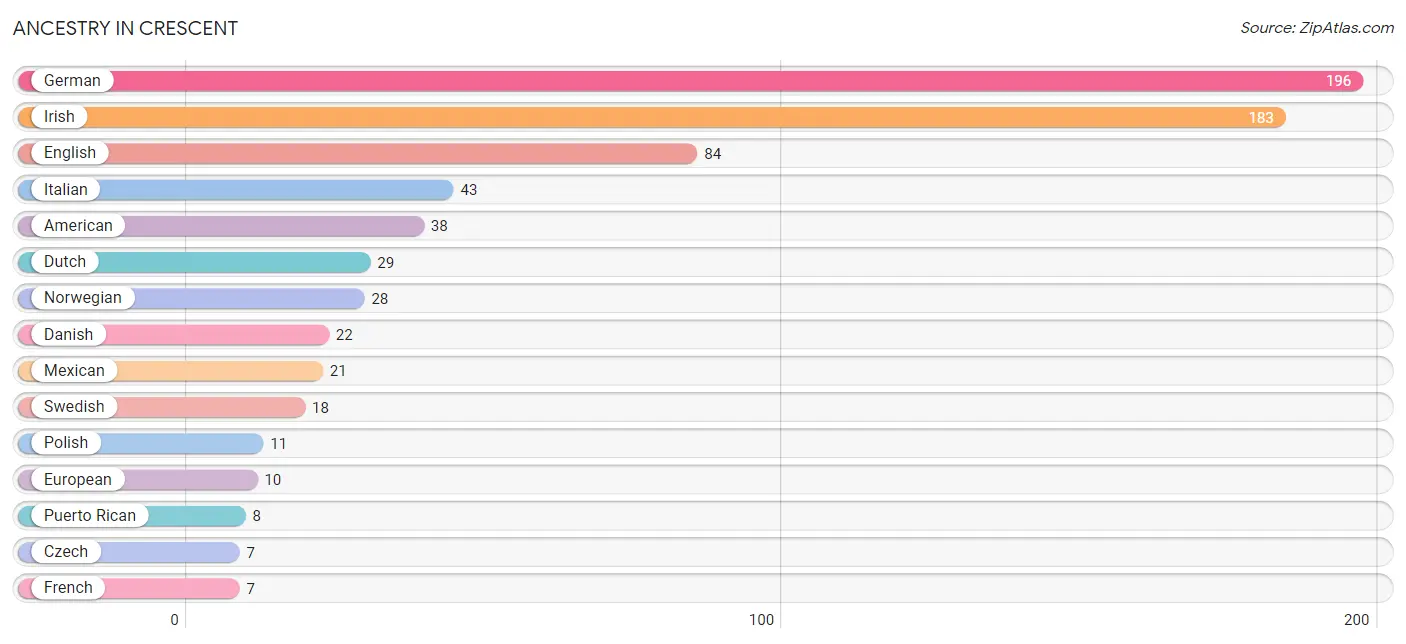
| Ancestry | # Population | % Population |
| American | 38 | 5.8% |
| Czech | 7 | 1.1% |
| Danish | 22 | 3.4% |
| Dutch | 29 | 4.4% |
| English | 84 | 12.9% |
| European | 10 | 1.5% |
| French | 7 | 1.1% |
| German | 196 | 30.1% |
| Irish | 183 | 28.1% |
| Italian | 43 | 6.6% |
| Mexican | 21 | 3.2% |
| Norwegian | 28 | 4.3% |
| Polish | 11 | 1.7% |
| Puerto Rican | 8 | 1.2% |
| Scandinavian | 3 | 0.5% |
| Swedish | 18 | 2.8% |
| Welsh | 3 | 0.5% | View All 17 Rows |
Immigrants in Crescent

| Immigration Origin | # Population | % Population | View All 0 Rows |
Sex and Age in Crescent
Sex and Age in Crescent
The most populous age groups in Crescent are 55 to 59 Years (39 | 12.6%) for men and 40 to 44 Years (39 | 11.4%) for women.
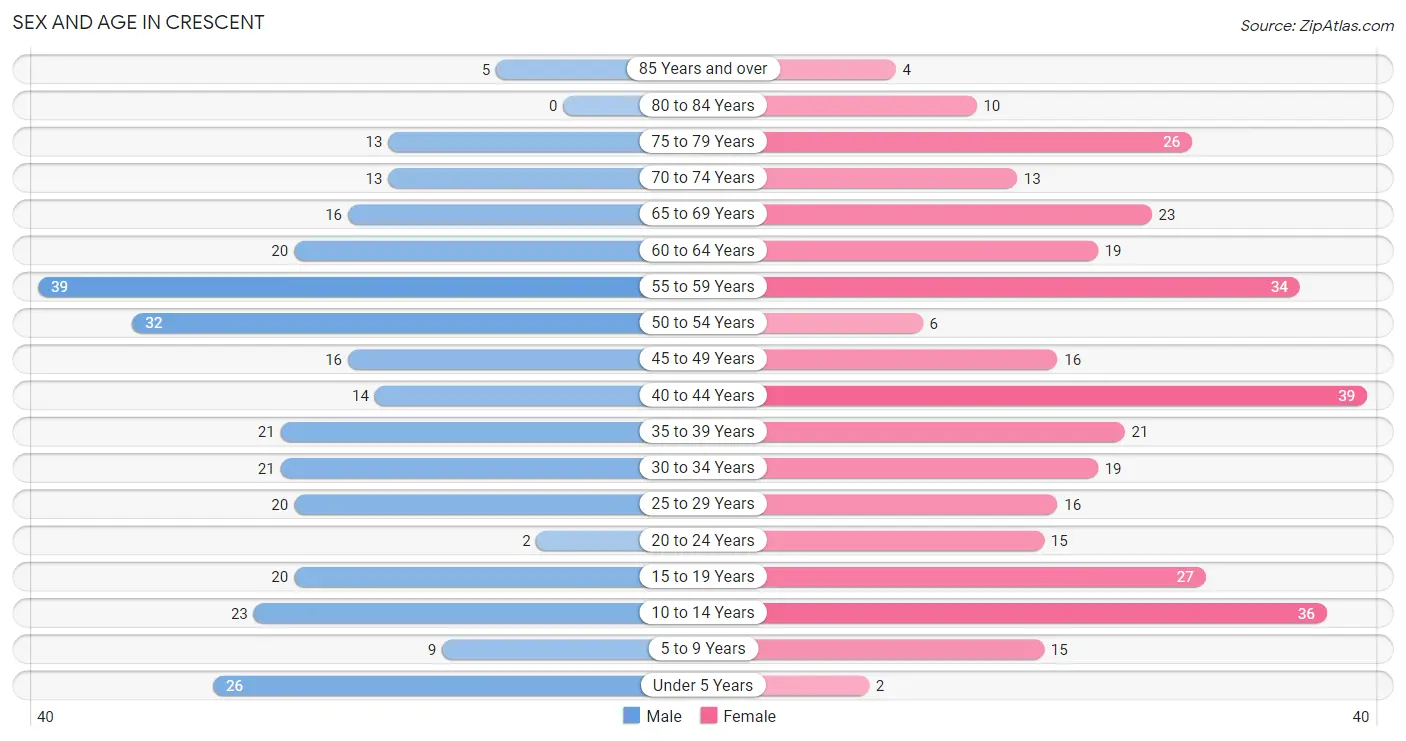
| Age Bracket | Male | Female |
| Under 5 Years | 26 (8.4%) | 2 (0.6%) |
| 5 to 9 Years | 9 (2.9%) | 15 (4.4%) |
| 10 to 14 Years | 23 (7.4%) | 36 (10.6%) |
| 15 to 19 Years | 20 (6.5%) | 27 (7.9%) |
| 20 to 24 Years | 2 (0.6%) | 15 (4.4%) |
| 25 to 29 Years | 20 (6.5%) | 16 (4.7%) |
| 30 to 34 Years | 21 (6.8%) | 19 (5.6%) |
| 35 to 39 Years | 21 (6.8%) | 21 (6.2%) |
| 40 to 44 Years | 14 (4.5%) | 39 (11.4%) |
| 45 to 49 Years | 16 (5.2%) | 16 (4.7%) |
| 50 to 54 Years | 32 (10.3%) | 6 (1.8%) |
| 55 to 59 Years | 39 (12.6%) | 34 (10.0%) |
| 60 to 64 Years | 20 (6.5%) | 19 (5.6%) |
| 65 to 69 Years | 16 (5.2%) | 23 (6.7%) |
| 70 to 74 Years | 13 (4.2%) | 13 (3.8%) |
| 75 to 79 Years | 13 (4.2%) | 26 (7.6%) |
| 80 to 84 Years | 0 (0.0%) | 10 (2.9%) |
| 85 Years and over | 5 (1.6%) | 4 (1.2%) |
| Total | 310 (100.0%) | 341 (100.0%) |
Families and Households in Crescent
Median Family Size in Crescent
The median family size in Crescent is 2.83 persons per family, with married-couple families (189 | 91.7%) accounting for the largest median family size of 2.88 persons per family. On the other hand, single male/father families (5 | 2.4%) represent the smallest median family size with 1.60 persons per family.
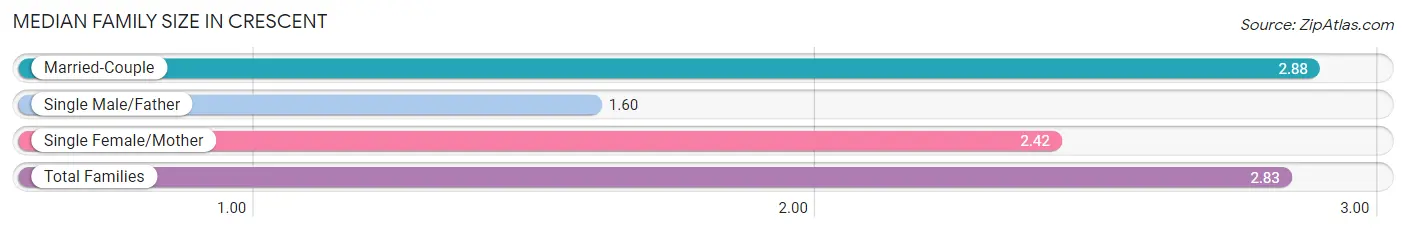
| Family Type | # Families | Family Size |
| Married-Couple | 189 (91.7%) | 2.88 |
| Single Male/Father | 5 (2.4%) | 1.60 |
| Single Female/Mother | 12 (5.8%) | 2.42 |
| Total Families | 206 (100.0%) | 2.83 |
Median Household Size in Crescent
The median household size in Crescent is 2.49 persons per household, with married-couple households (189 | 72.4%) accounting for the largest median household size of 2.88 persons per household. non-family households (55 | 21.1%) represent the smallest median household size with 1.18 persons per household.
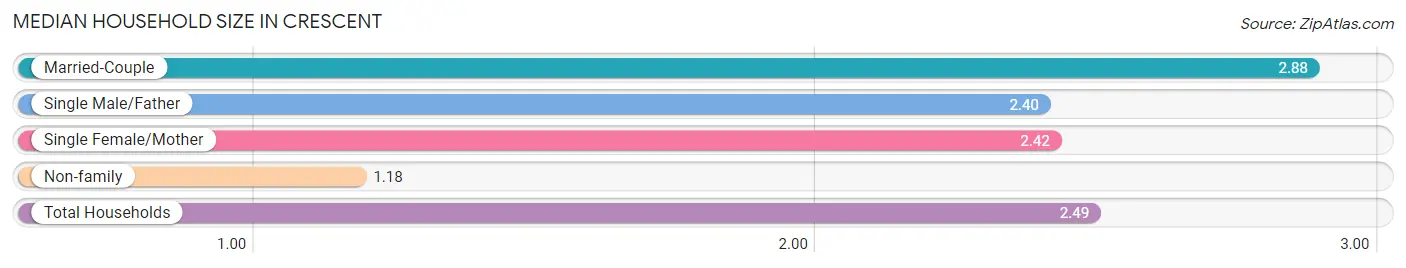
| Household Type | # Households | Household Size |
| Married-Couple | 189 (72.4%) | 2.88 |
| Single Male/Father | 5 (1.9%) | 2.40 |
| Single Female/Mother | 12 (4.6%) | 2.42 |
| Non-family | 55 (21.1%) | 1.18 |
| Total Households | 261 (100.0%) | 2.49 |
Household Size by Marriage Status in Crescent
Out of a total of 261 households in Crescent, 206 (78.9%) are family households, while 55 (21.1%) are nonfamily households. The most numerous type of family households are 2-person households, comprising 94, and the most common type of nonfamily households are 1-person households, comprising 45.
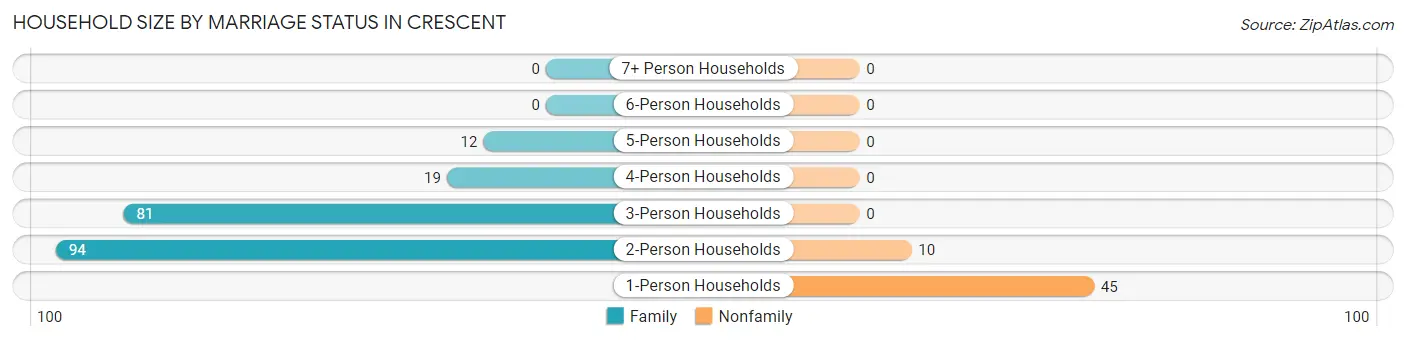
| Household Size | Family Households | Nonfamily Households |
| 1-Person Households | - | 45 (17.2%) |
| 2-Person Households | 94 (36.0%) | 10 (3.8%) |
| 3-Person Households | 81 (31.0%) | 0 (0.0%) |
| 4-Person Households | 19 (7.3%) | 0 (0.0%) |
| 5-Person Households | 12 (4.6%) | 0 (0.0%) |
| 6-Person Households | 0 (0.0%) | 0 (0.0%) |
| 7+ Person Households | 0 (0.0%) | 0 (0.0%) |
| Total | 206 (78.9%) | 55 (21.1%) |
Female Fertility in Crescent
Fertility by Age in Crescent
Average fertility rate in Crescent is 39.0 births per 1,000 women. Women in the age bracket of 20 to 34 years have the highest fertility rate with 120.0 births per 1,000 women. Women in the age bracket of 20 to 34 years acount for 100.0% of all women with births.
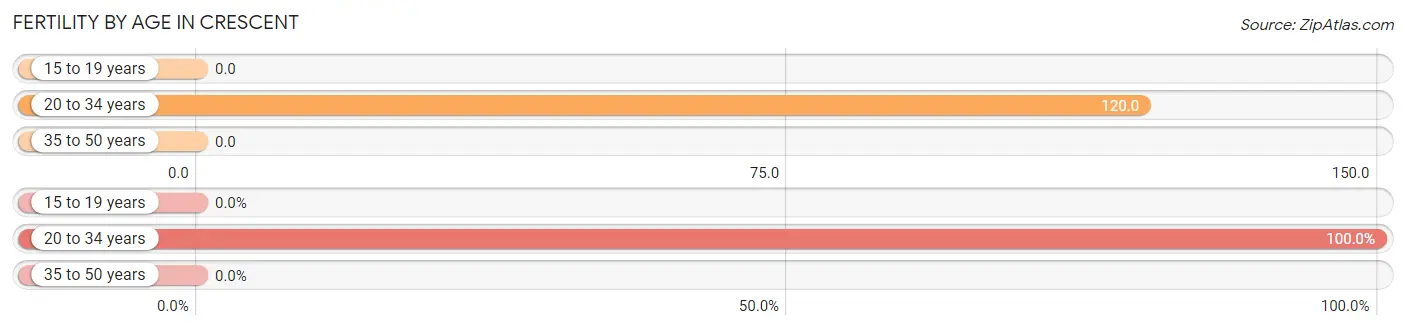
| Age Bracket | Women with Births | Births / 1,000 Women |
| 15 to 19 years | 0 (0.0%) | 0.0 |
| 20 to 34 years | 6 (100.0%) | 120.0 |
| 35 to 50 years | 0 (0.0%) | 0.0 |
| Total | 6 (100.0%) | 39.0 |
Fertility by Age by Marriage Status in Crescent
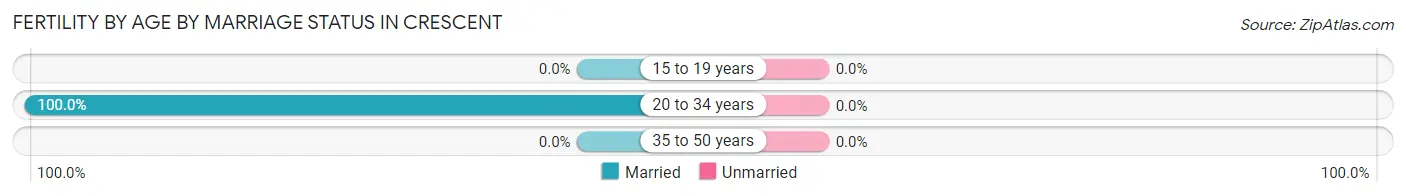
| Age Bracket | Married | Unmarried |
| 15 to 19 years | 0 (0.0%) | 0 (0.0%) |
| 20 to 34 years | 6 (100.0%) | 0 (0.0%) |
| 35 to 50 years | 0 (0.0%) | 0 (0.0%) |
| Total | 6 (100.0%) | 0 (0.0%) |
Fertility by Education in Crescent
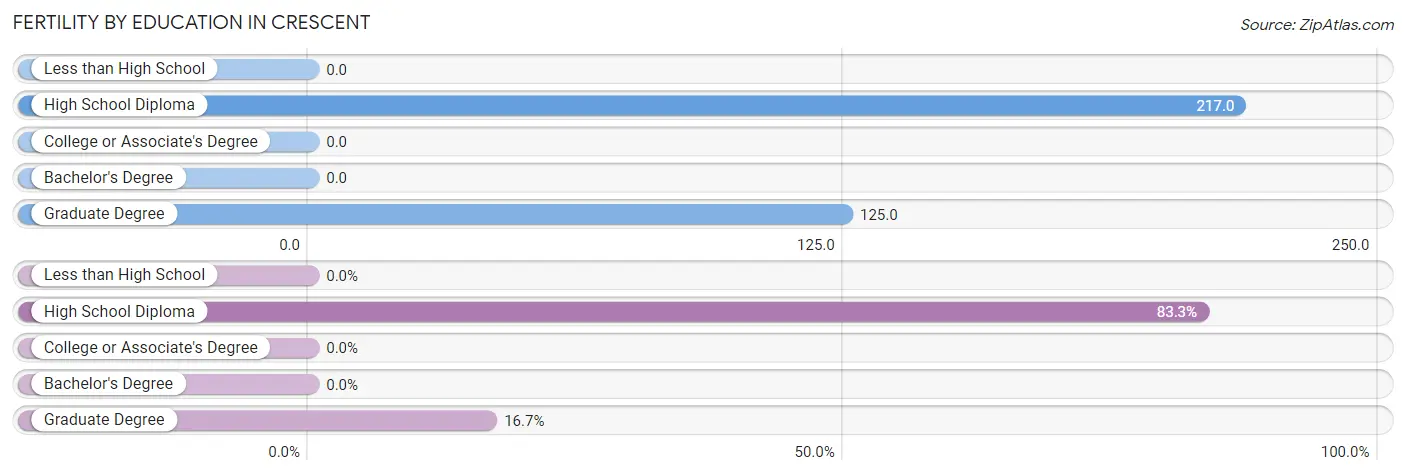
| Educational Attainment | Women with Births | Births / 1,000 Women |
| Less than High School | 0 (0.0%) | 0.0 |
| High School Diploma | 5 (83.3%) | 217.0 |
| College or Associate's Degree | 0 (0.0%) | 0.0 |
| Bachelor's Degree | 0 (0.0%) | 0.0 |
| Graduate Degree | 1 (16.7%) | 125.0 |
| Total | 6 (100.0%) | 39.0 |
Fertility by Education by Marriage Status in Crescent
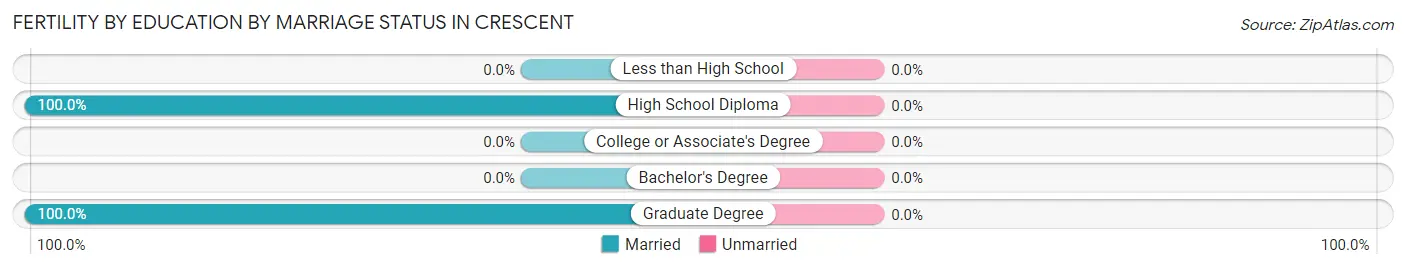
| Educational Attainment | Married | Unmarried |
| Less than High School | 0 (0.0%) | 0 (0.0%) |
| High School Diploma | 5 (100.0%) | 0 (0.0%) |
| College or Associate's Degree | 0 (0.0%) | 0 (0.0%) |
| Bachelor's Degree | 0 (0.0%) | 0 (0.0%) |
| Graduate Degree | 1 (100.0%) | 0 (0.0%) |
| Total | 6 (100.0%) | 0 (0.0%) |
Employment Characteristics in Crescent
Employment by Class of Employer in Crescent
Among the 379 employed individuals in Crescent, private company employees (254 | 67.0%), self-employed (incorporated) (38 | 10.0%), and local government employees (29 | 7.6%) make up the most common classes of employment.
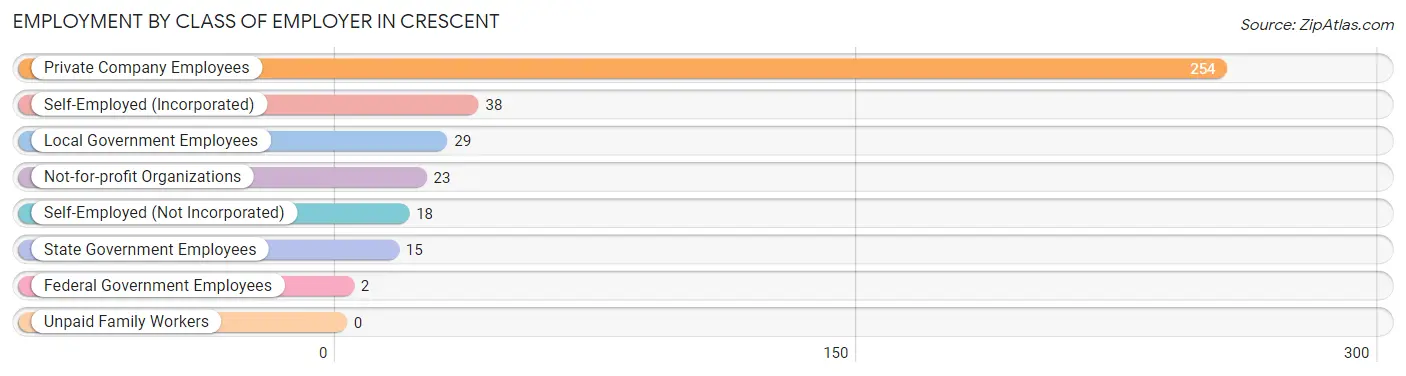
| Employer Class | # Employees | % Employees |
| Private Company Employees | 254 | 67.0% |
| Self-Employed (Incorporated) | 38 | 10.0% |
| Self-Employed (Not Incorporated) | 18 | 4.8% |
| Not-for-profit Organizations | 23 | 6.1% |
| Local Government Employees | 29 | 7.6% |
| State Government Employees | 15 | 4.0% |
| Federal Government Employees | 2 | 0.5% |
| Unpaid Family Workers | 0 | 0.0% |
| Total | 379 | 100.0% |
Employment Status by Age in Crescent
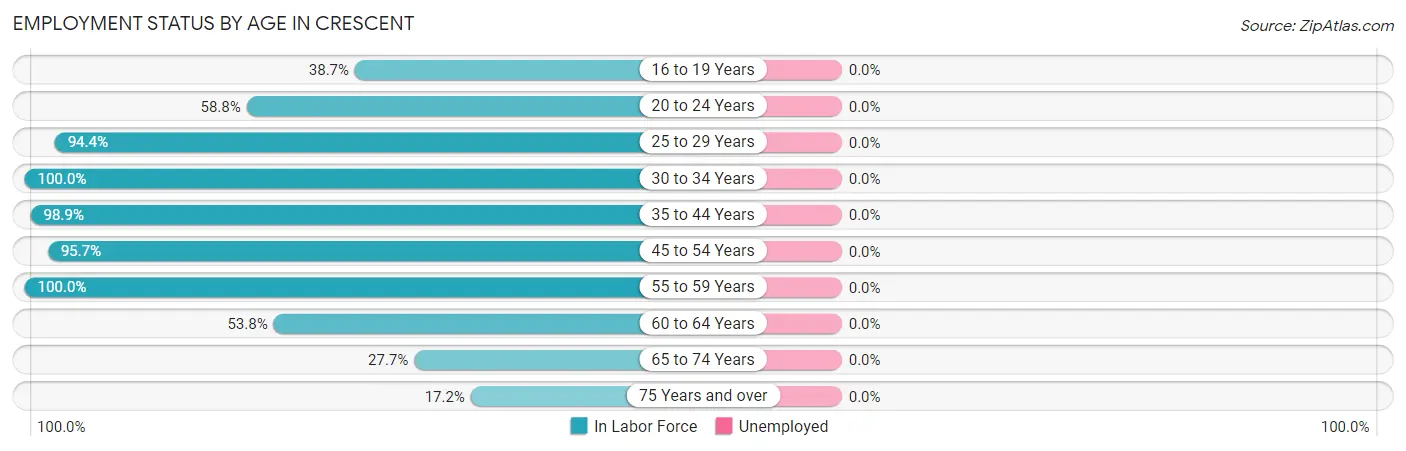
| Age Bracket | In Labor Force | Unemployed |
| 16 to 19 Years | 12 (38.7%) | 0 (0.0%) |
| 20 to 24 Years | 10 (58.8%) | 0 (0.0%) |
| 25 to 29 Years | 34 (94.4%) | 0 (0.0%) |
| 30 to 34 Years | 40 (100.0%) | 0 (0.0%) |
| 35 to 44 Years | 94 (98.9%) | 0 (0.0%) |
| 45 to 54 Years | 67 (95.7%) | 0 (0.0%) |
| 55 to 59 Years | 73 (100.0%) | 0 (0.0%) |
| 60 to 64 Years | 21 (53.8%) | 0 (0.0%) |
| 65 to 74 Years | 18 (27.7%) | 0 (0.0%) |
| 75 Years and over | 10 (17.2%) | 0 (0.0%) |
| Total | 379 (72.3%) | 0 (0.0%) |
Employment Status by Educational Attainment in Crescent
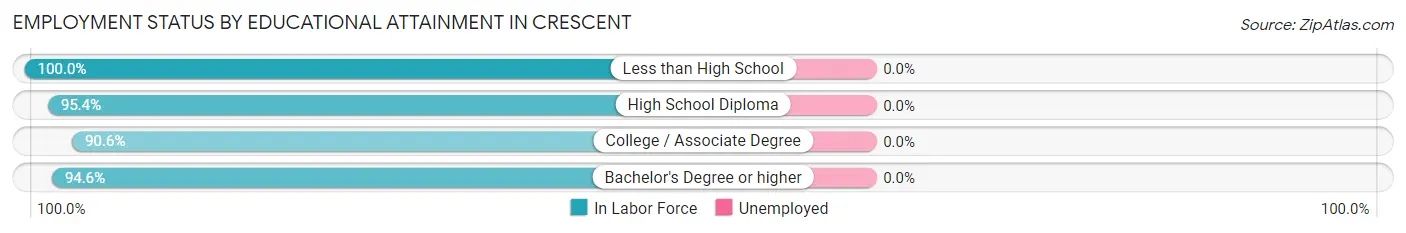
| Educational Attainment | In Labor Force | Unemployed |
| Less than High School | 12 (100.0%) | 0 (0.0%) |
| High School Diploma | 103 (95.4%) | 0 (0.0%) |
| College / Associate Degree | 144 (90.6%) | 0 (0.0%) |
| Bachelor's Degree or higher | 70 (94.6%) | 0 (0.0%) |
| Total | 329 (93.2%) | 0 (0.0%) |
Employment Occupations by Sex in Crescent
Management, Business, Science and Arts Occupations
The most common Management, Business, Science and Arts occupations in Crescent are Management (55 | 14.5%), Computers, Engineering & Science (18 | 4.8%), Community & Social Service (17 | 4.5%), Business & Financial (15 | 4.0%), and Education Instruction & Library (12 | 3.2%).
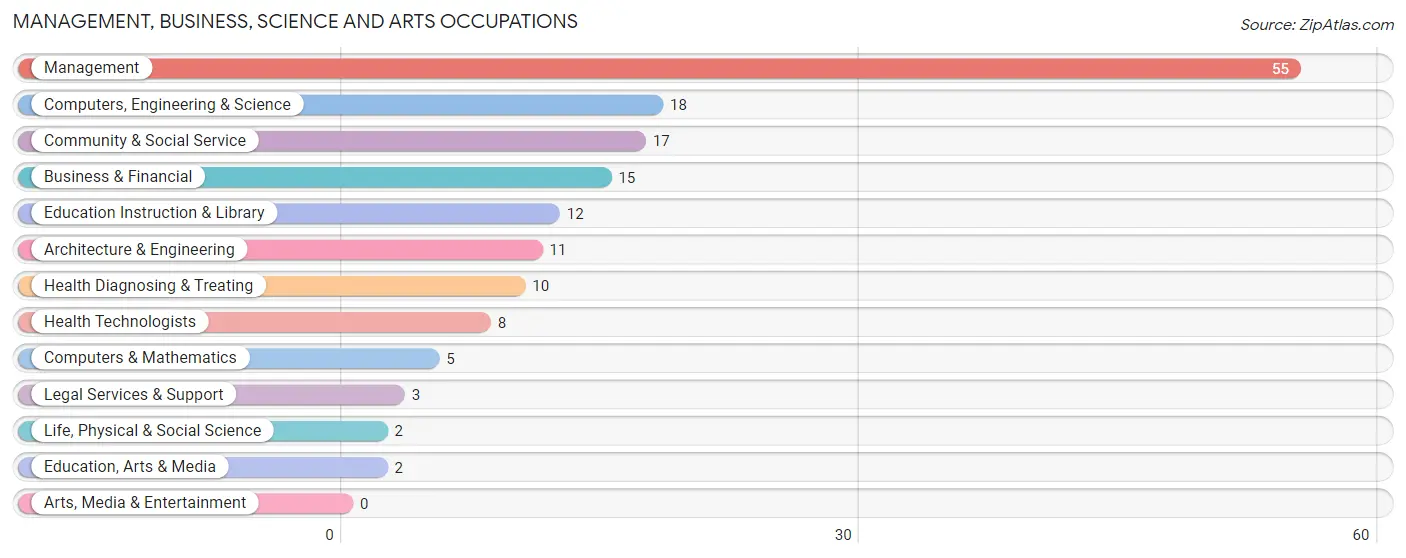
Management, Business, Science and Arts Occupations by Sex
Within the Management, Business, Science and Arts occupations in Crescent, the most male-oriented occupations are Architecture & Engineering (63.6%), Computers & Mathematics (60.0%), and Computers, Engineering & Science (55.6%), while the most female-oriented occupations are Business & Financial (100.0%), Life, Physical & Social Science (100.0%), and Education, Arts & Media (100.0%).
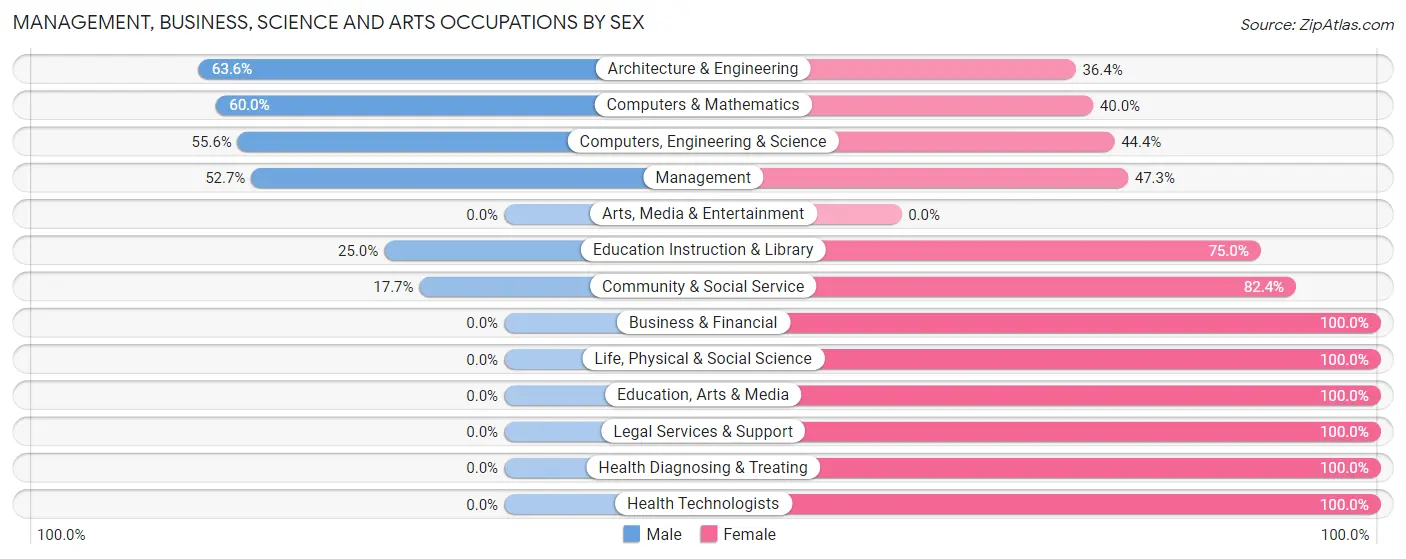
| Occupation | Male | Female |
| Management | 29 (52.7%) | 26 (47.3%) |
| Business & Financial | 0 (0.0%) | 15 (100.0%) |
| Computers, Engineering & Science | 10 (55.6%) | 8 (44.4%) |
| Computers & Mathematics | 3 (60.0%) | 2 (40.0%) |
| Architecture & Engineering | 7 (63.6%) | 4 (36.4%) |
| Life, Physical & Social Science | 0 (0.0%) | 2 (100.0%) |
| Community & Social Service | 3 (17.6%) | 14 (82.4%) |
| Education, Arts & Media | 0 (0.0%) | 2 (100.0%) |
| Legal Services & Support | 0 (0.0%) | 3 (100.0%) |
| Education Instruction & Library | 3 (25.0%) | 9 (75.0%) |
| Arts, Media & Entertainment | 0 (0.0%) | 0 (0.0%) |
| Health Diagnosing & Treating | 0 (0.0%) | 10 (100.0%) |
| Health Technologists | 0 (0.0%) | 8 (100.0%) |
| Total (Category) | 42 (36.5%) | 73 (63.5%) |
| Total (Overall) | 181 (47.8%) | 198 (52.2%) |
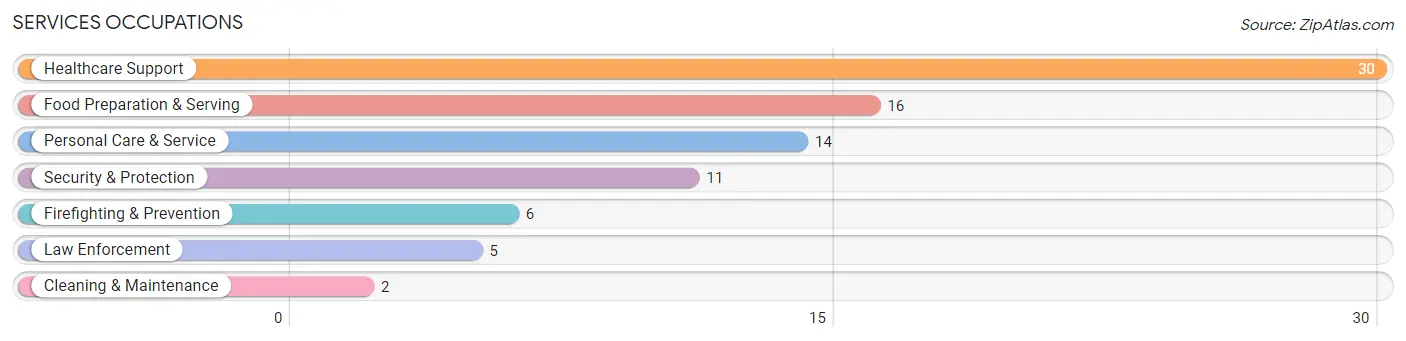
Services Occupations
The most common Services occupations in Crescent are Healthcare Support (30 | 7.9%), Food Preparation & Serving (16 | 4.2%), Personal Care & Service (14 | 3.7%), Security & Protection (11 | 2.9%), and Firefighting & Prevention (6 | 1.6%).
Services Occupations by Sex
Within the Services occupations in Crescent, the most male-oriented occupations are Cleaning & Maintenance (100.0%), Law Enforcement (60.0%), and Security & Protection (54.5%), while the most female-oriented occupations are Healthcare Support (100.0%), Personal Care & Service (100.0%), and Food Preparation & Serving (87.5%).
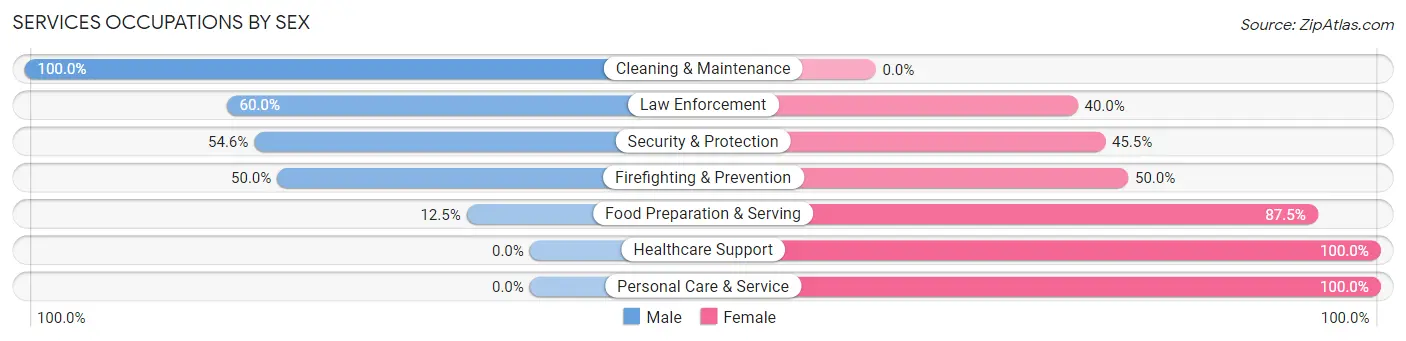
| Occupation | Male | Female |
| Healthcare Support | 0 (0.0%) | 30 (100.0%) |
| Security & Protection | 6 (54.5%) | 5 (45.5%) |
| Firefighting & Prevention | 3 (50.0%) | 3 (50.0%) |
| Law Enforcement | 3 (60.0%) | 2 (40.0%) |
| Food Preparation & Serving | 2 (12.5%) | 14 (87.5%) |
| Cleaning & Maintenance | 2 (100.0%) | 0 (0.0%) |
| Personal Care & Service | 0 (0.0%) | 14 (100.0%) |
| Total (Category) | 10 (13.7%) | 63 (86.3%) |
| Total (Overall) | 181 (47.8%) | 198 (52.2%) |
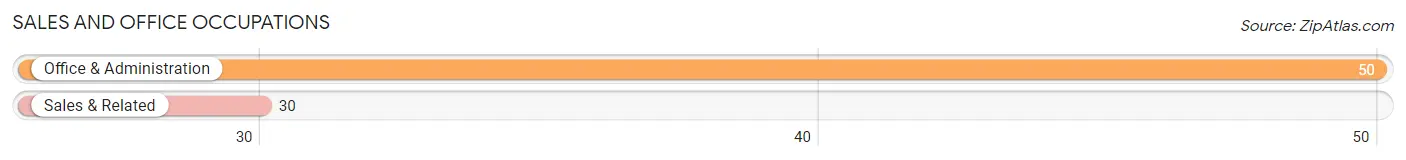
Sales and Office Occupations
The most common Sales and Office occupations in Crescent are Office & Administration (50 | 13.2%), and Sales & Related (30 | 7.9%).
Sales and Office Occupations by Sex
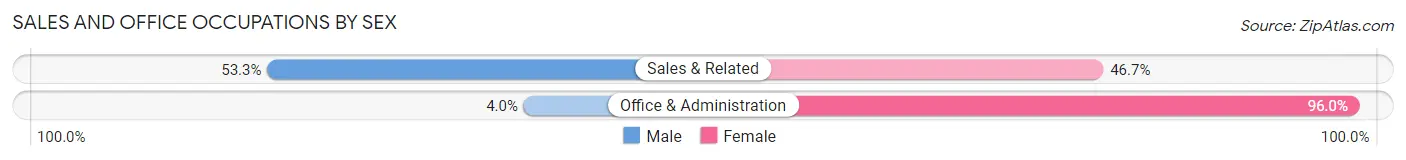
| Occupation | Male | Female |
| Sales & Related | 16 (53.3%) | 14 (46.7%) |
| Office & Administration | 2 (4.0%) | 48 (96.0%) |
| Total (Category) | 18 (22.5%) | 62 (77.5%) |
| Total (Overall) | 181 (47.8%) | 198 (52.2%) |
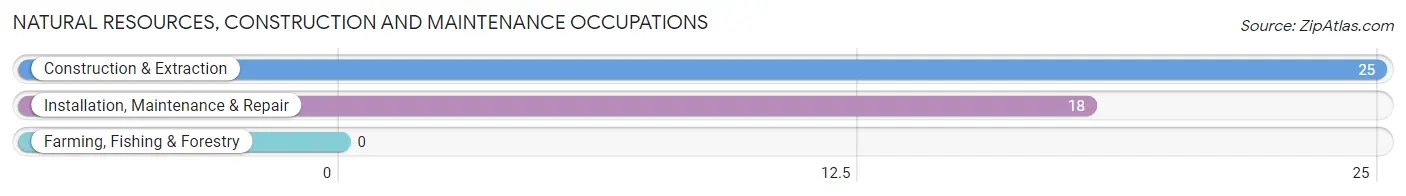
Natural Resources, Construction and Maintenance Occupations
The most common Natural Resources, Construction and Maintenance occupations in Crescent are Construction & Extraction (25 | 6.6%), and Installation, Maintenance & Repair (18 | 4.8%).
Natural Resources, Construction and Maintenance Occupations by Sex
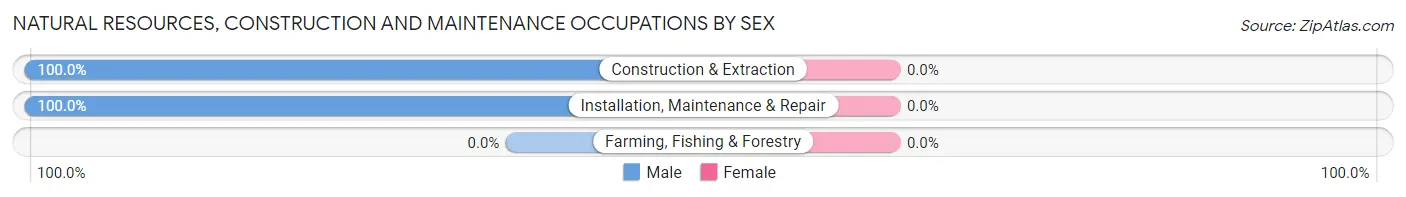
| Occupation | Male | Female |
| Farming, Fishing & Forestry | 0 (0.0%) | 0 (0.0%) |
| Construction & Extraction | 25 (100.0%) | 0 (0.0%) |
| Installation, Maintenance & Repair | 18 (100.0%) | 0 (0.0%) |
| Total (Category) | 43 (100.0%) | 0 (0.0%) |
| Total (Overall) | 181 (47.8%) | 198 (52.2%) |
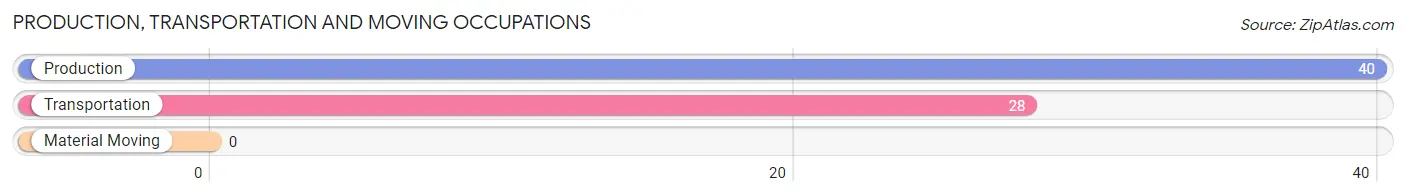
Production, Transportation and Moving Occupations
The most common Production, Transportation and Moving occupations in Crescent are Production (40 | 10.5%), and Transportation (28 | 7.4%).
Production, Transportation and Moving Occupations by Sex
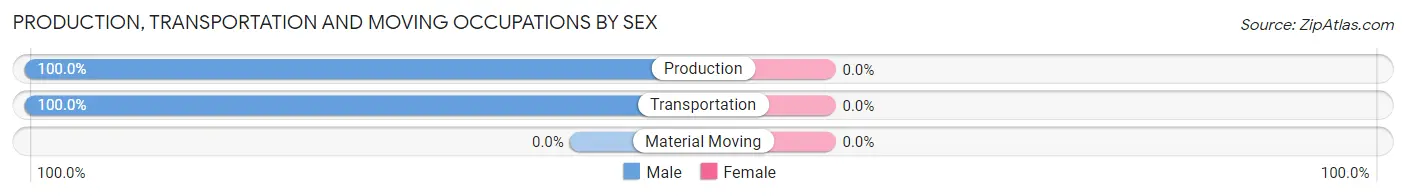
| Occupation | Male | Female |
| Production | 40 (100.0%) | 0 (0.0%) |
| Transportation | 28 (100.0%) | 0 (0.0%) |
| Material Moving | 0 (0.0%) | 0 (0.0%) |
| Total (Category) | 68 (100.0%) | 0 (0.0%) |
| Total (Overall) | 181 (47.8%) | 198 (52.2%) |
Employment Industries by Sex in Crescent
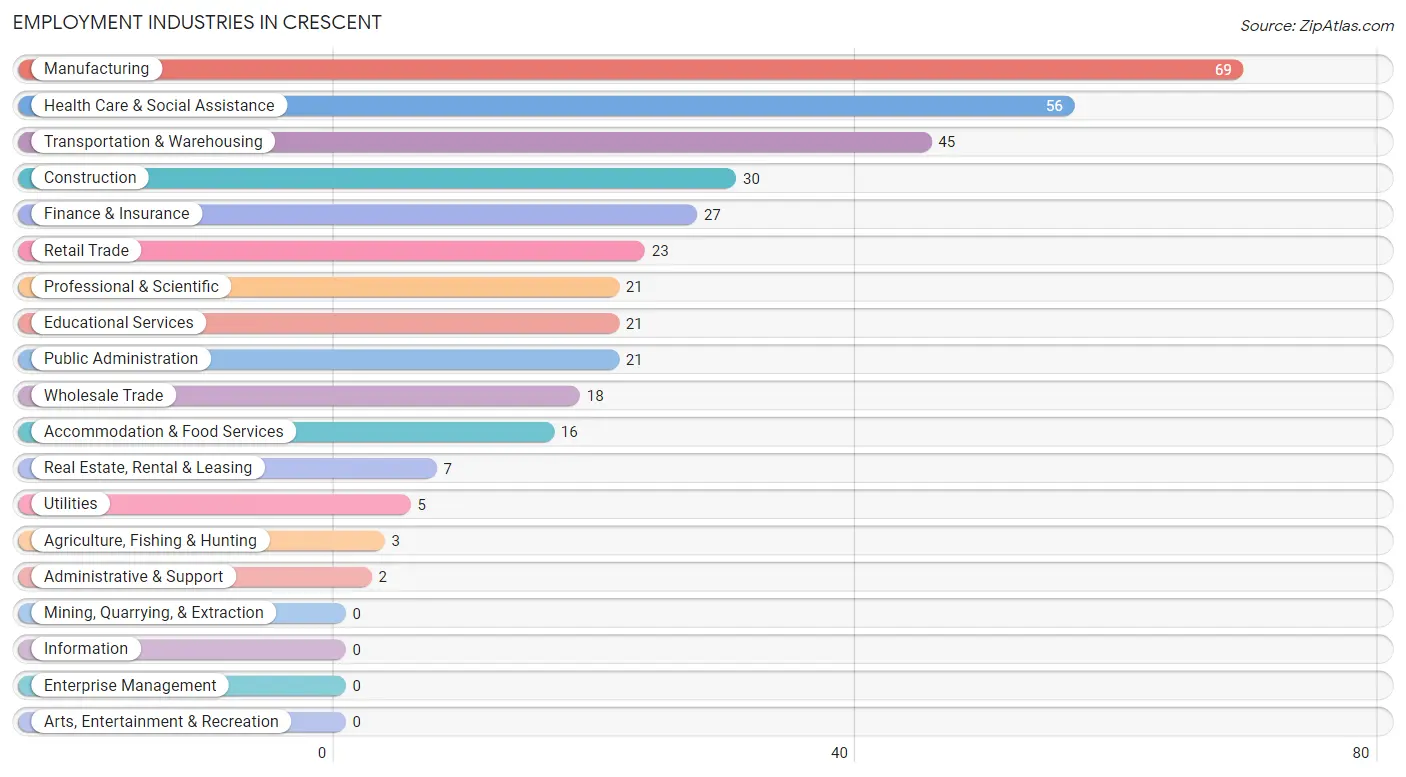
Employment Industries in Crescent
The major employment industries in Crescent include Manufacturing (69 | 18.2%), Health Care & Social Assistance (56 | 14.8%), Transportation & Warehousing (45 | 11.9%), Construction (30 | 7.9%), and Finance & Insurance (27 | 7.1%).
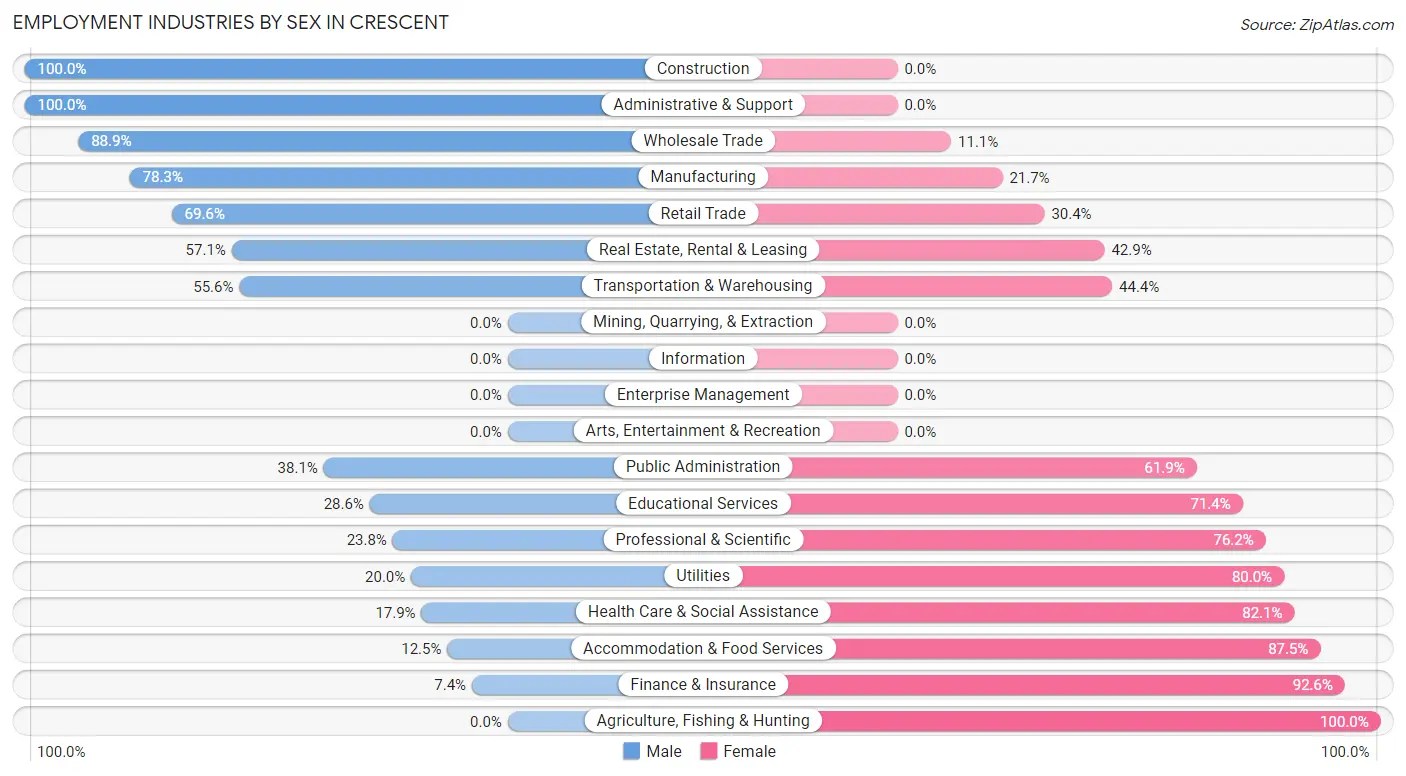
Employment Industries by Sex in Crescent
The Crescent industries that see more men than women are Construction (100.0%), Administrative & Support (100.0%), and Wholesale Trade (88.9%), whereas the industries that tend to have a higher number of women are Agriculture, Fishing & Hunting (100.0%), Finance & Insurance (92.6%), and Accommodation & Food Services (87.5%).
| Industry | Male | Female |
| Agriculture, Fishing & Hunting | 0 (0.0%) | 3 (100.0%) |
| Mining, Quarrying, & Extraction | 0 (0.0%) | 0 (0.0%) |
| Construction | 30 (100.0%) | 0 (0.0%) |
| Manufacturing | 54 (78.3%) | 15 (21.7%) |
| Wholesale Trade | 16 (88.9%) | 2 (11.1%) |
| Retail Trade | 16 (69.6%) | 7 (30.4%) |
| Transportation & Warehousing | 25 (55.6%) | 20 (44.4%) |
| Utilities | 1 (20.0%) | 4 (80.0%) |
| Information | 0 (0.0%) | 0 (0.0%) |
| Finance & Insurance | 2 (7.4%) | 25 (92.6%) |
| Real Estate, Rental & Leasing | 4 (57.1%) | 3 (42.9%) |
| Professional & Scientific | 5 (23.8%) | 16 (76.2%) |
| Enterprise Management | 0 (0.0%) | 0 (0.0%) |
| Administrative & Support | 2 (100.0%) | 0 (0.0%) |
| Educational Services | 6 (28.6%) | 15 (71.4%) |
| Health Care & Social Assistance | 10 (17.9%) | 46 (82.1%) |
| Arts, Entertainment & Recreation | 0 (0.0%) | 0 (0.0%) |
| Accommodation & Food Services | 2 (12.5%) | 14 (87.5%) |
| Public Administration | 8 (38.1%) | 13 (61.9%) |
| Total | 181 (47.8%) | 198 (52.2%) |
Education in Crescent
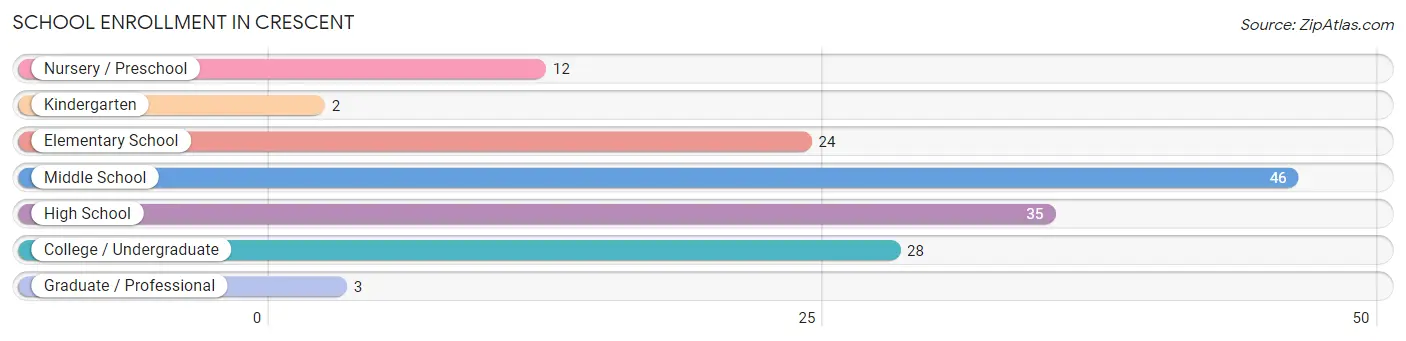
School Enrollment in Crescent
The most common levels of schooling among the 150 students in Crescent are middle school (46 | 30.7%), high school (35 | 23.3%), and college / undergraduate (28 | 18.7%).
| School Level | # Students | % Students |
| Nursery / Preschool | 12 | 8.0% |
| Kindergarten | 2 | 1.3% |
| Elementary School | 24 | 16.0% |
| Middle School | 46 | 30.7% |
| High School | 35 | 23.3% |
| College / Undergraduate | 28 | 18.7% |
| Graduate / Professional | 3 | 2.0% |
| Total | 150 | 100.0% |
School Enrollment by Age by Funding Source in Crescent
Out of a total of 150 students who are enrolled in schools in Crescent, 16 (10.7%) attend a private institution, while the remaining 134 (89.3%) are enrolled in public schools. The age group of 3 to 4 year olds has the highest likelihood of being enrolled in private schools, with 4 (100.0% in the age bracket) enrolled. Conversely, the age group of 15 to 17 year olds has the lowest likelihood of being enrolled in a private school, with 35 (100.0% in the age bracket) attending a public institution.
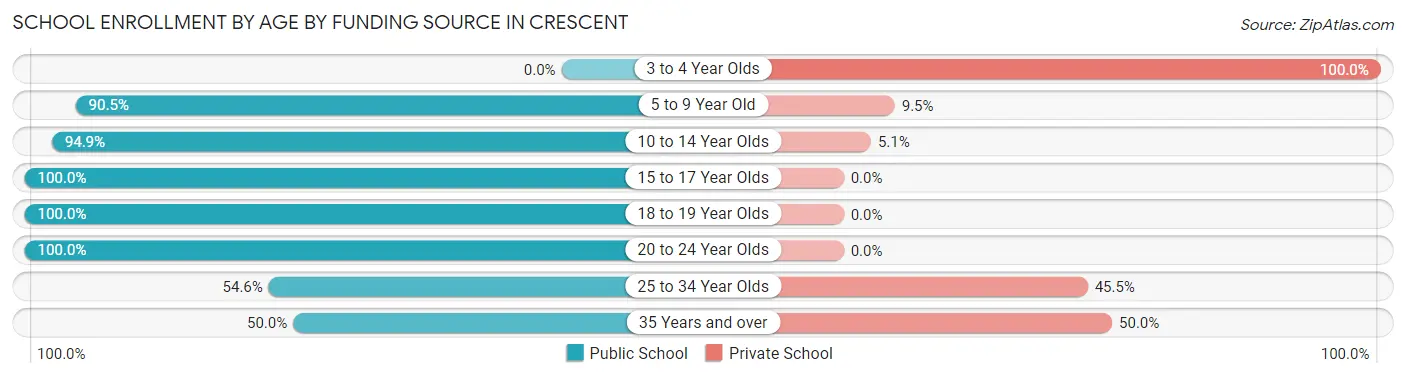
| Age Bracket | Public School | Private School |
| 3 to 4 Year Olds | 0 (0.0%) | 4 (100.0%) |
| 5 to 9 Year Old | 19 (90.5%) | 2 (9.5%) |
| 10 to 14 Year Olds | 56 (94.9%) | 3 (5.1%) |
| 15 to 17 Year Olds | 35 (100.0%) | 0 (0.0%) |
| 18 to 19 Year Olds | 12 (100.0%) | 0 (0.0%) |
| 20 to 24 Year Olds | 4 (100.0%) | 0 (0.0%) |
| 25 to 34 Year Olds | 6 (54.5%) | 5 (45.5%) |
| 35 Years and over | 2 (50.0%) | 2 (50.0%) |
| Total | 134 (89.3%) | 16 (10.7%) |
Educational Attainment by Field of Study in Crescent
Psychology (29 | 25.4%), business (20 | 17.5%), science & technology (11 | 9.7%), education (11 | 9.7%), and bio, nature & agricultural (10 | 8.8%) are the most common fields of study among 114 individuals in Crescent who have obtained a bachelor's degree or higher.
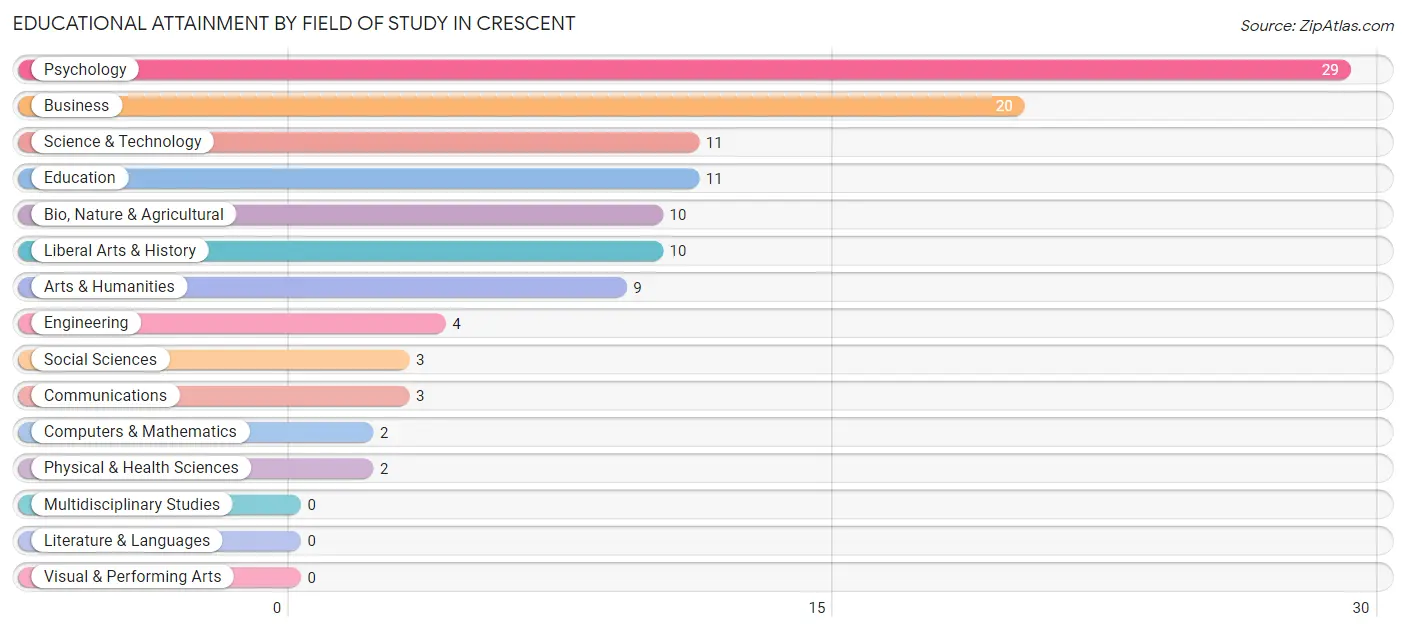
| Field of Study | # Graduates | % Graduates |
| Computers & Mathematics | 2 | 1.8% |
| Bio, Nature & Agricultural | 10 | 8.8% |
| Physical & Health Sciences | 2 | 1.8% |
| Psychology | 29 | 25.4% |
| Social Sciences | 3 | 2.6% |
| Engineering | 4 | 3.5% |
| Multidisciplinary Studies | 0 | 0.0% |
| Science & Technology | 11 | 9.7% |
| Business | 20 | 17.5% |
| Education | 11 | 9.7% |
| Literature & Languages | 0 | 0.0% |
| Liberal Arts & History | 10 | 8.8% |
| Visual & Performing Arts | 0 | 0.0% |
| Communications | 3 | 2.6% |
| Arts & Humanities | 9 | 7.9% |
| Total | 114 | 100.0% |
Transportation & Commute in Crescent
Vehicle Availability by Sex in Crescent
The most prevalent vehicle ownership categories in Crescent are males with 2 vehicles (72, accounting for 39.8%) and females with 2 vehicles (82, making up 36.4%).
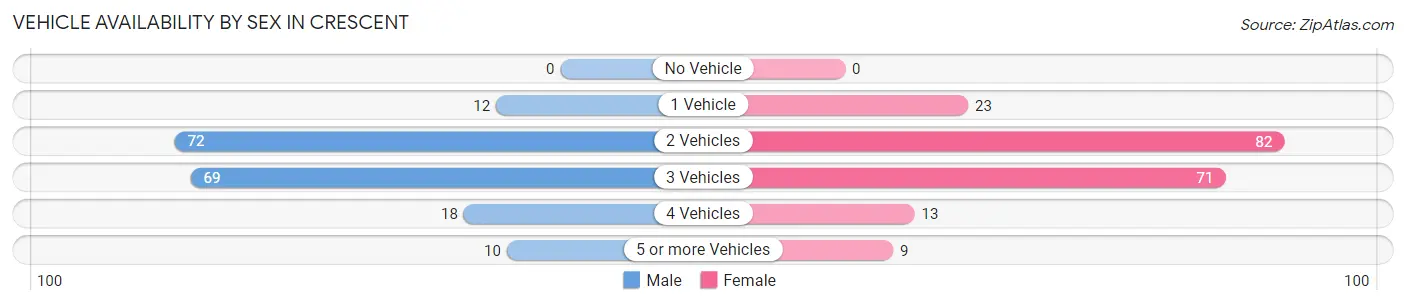
| Vehicles Available | Male | Female |
| No Vehicle | 0 (0.0%) | 0 (0.0%) |
| 1 Vehicle | 12 (6.6%) | 23 (11.6%) |
| 2 Vehicles | 72 (39.8%) | 82 (41.4%) |
| 3 Vehicles | 69 (38.1%) | 71 (35.9%) |
| 4 Vehicles | 18 (9.9%) | 13 (6.6%) |
| 5 or more Vehicles | 10 (5.5%) | 9 (4.5%) |
| Total | 181 (100.0%) | 198 (100.0%) |
Commute Time in Crescent
The most frequently occuring commute durations in Crescent are 15 to 19 minutes (85 commuters, 24.1%), 20 to 24 minutes (59 commuters, 16.8%), and 5 to 9 minutes (58 commuters, 16.5%).
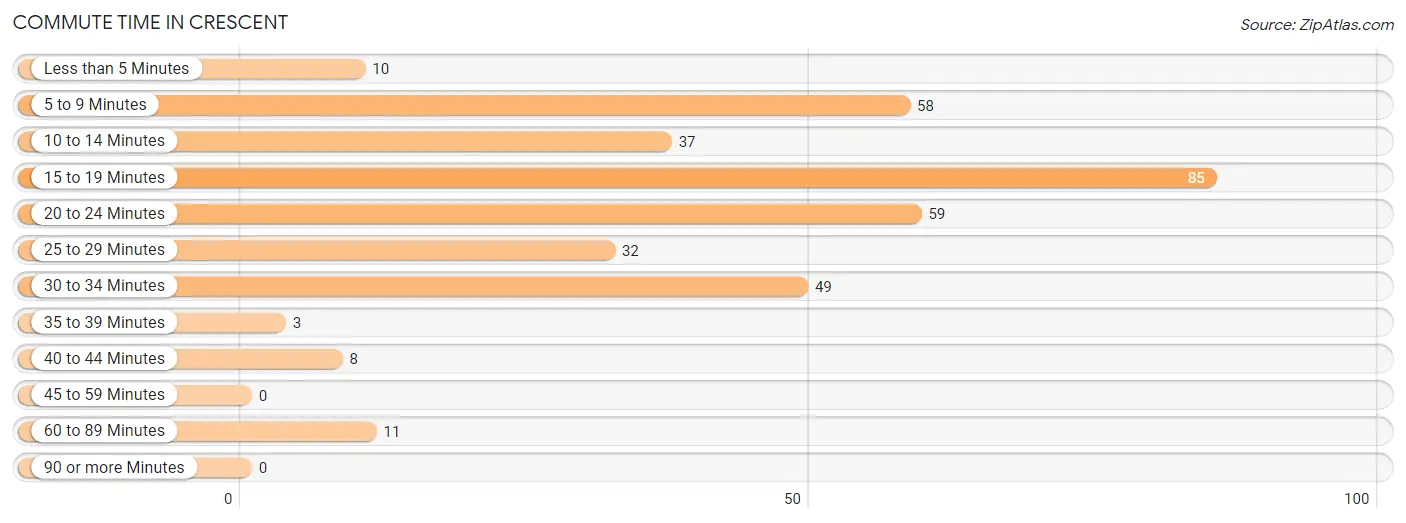
| Commute Time | # Commuters | % Commuters |
| Less than 5 Minutes | 10 | 2.8% |
| 5 to 9 Minutes | 58 | 16.5% |
| 10 to 14 Minutes | 37 | 10.5% |
| 15 to 19 Minutes | 85 | 24.1% |
| 20 to 24 Minutes | 59 | 16.8% |
| 25 to 29 Minutes | 32 | 9.1% |
| 30 to 34 Minutes | 49 | 13.9% |
| 35 to 39 Minutes | 3 | 0.9% |
| 40 to 44 Minutes | 8 | 2.3% |
| 45 to 59 Minutes | 0 | 0.0% |
| 60 to 89 Minutes | 11 | 3.1% |
| 90 or more Minutes | 0 | 0.0% |
Commute Time by Sex in Crescent
The most common commute times in Crescent are 15 to 19 minutes (51 commuters, 28.6%) for males and 15 to 19 minutes (34 commuters, 19.5%) for females.
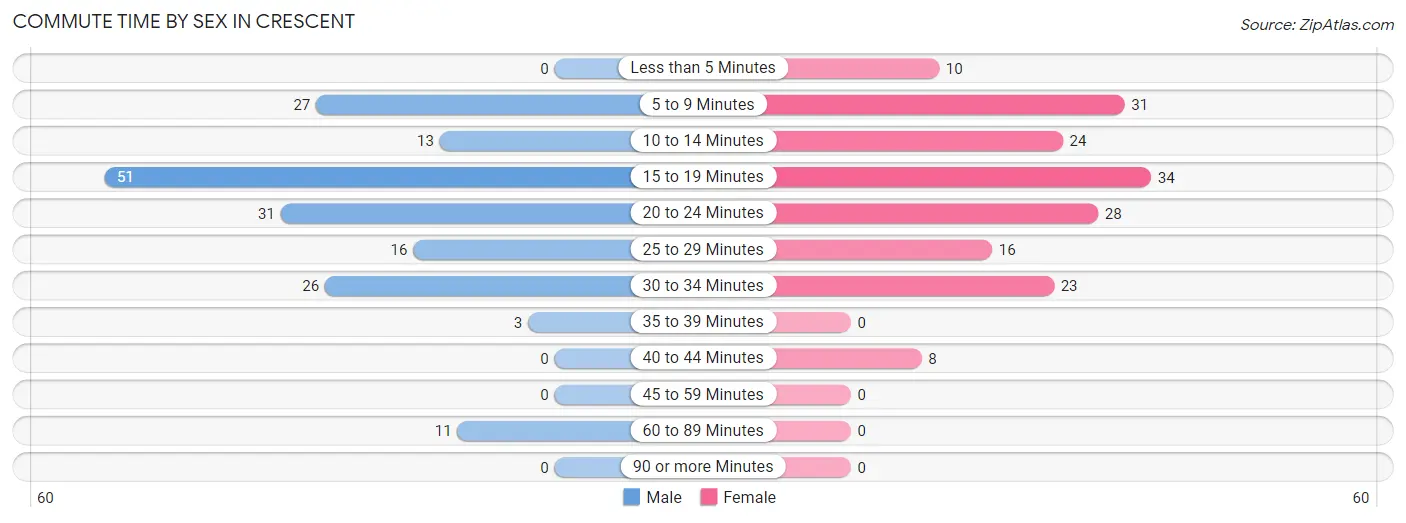
| Commute Time | Male | Female |
| Less than 5 Minutes | 0 (0.0%) | 10 (5.8%) |
| 5 to 9 Minutes | 27 (15.2%) | 31 (17.8%) |
| 10 to 14 Minutes | 13 (7.3%) | 24 (13.8%) |
| 15 to 19 Minutes | 51 (28.6%) | 34 (19.5%) |
| 20 to 24 Minutes | 31 (17.4%) | 28 (16.1%) |
| 25 to 29 Minutes | 16 (9.0%) | 16 (9.2%) |
| 30 to 34 Minutes | 26 (14.6%) | 23 (13.2%) |
| 35 to 39 Minutes | 3 (1.7%) | 0 (0.0%) |
| 40 to 44 Minutes | 0 (0.0%) | 8 (4.6%) |
| 45 to 59 Minutes | 0 (0.0%) | 0 (0.0%) |
| 60 to 89 Minutes | 11 (6.2%) | 0 (0.0%) |
| 90 or more Minutes | 0 (0.0%) | 0 (0.0%) |
Time of Departure to Work by Sex in Crescent
The most frequent times of departure to work in Crescent are 6:00 AM to 6:29 AM (50, 28.1%) for males and 7:00 AM to 7:29 AM (27, 15.5%) for females.
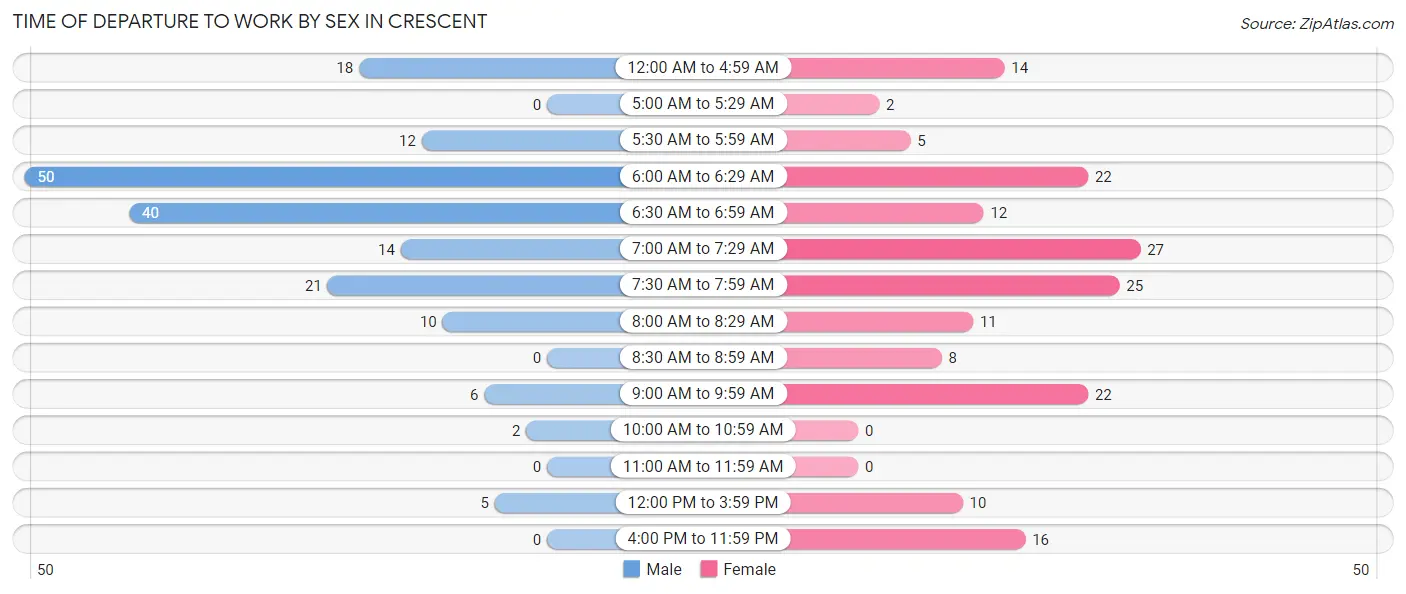
| Time of Departure | Male | Female |
| 12:00 AM to 4:59 AM | 18 (10.1%) | 14 (8.1%) |
| 5:00 AM to 5:29 AM | 0 (0.0%) | 2 (1.1%) |
| 5:30 AM to 5:59 AM | 12 (6.7%) | 5 (2.9%) |
| 6:00 AM to 6:29 AM | 50 (28.1%) | 22 (12.6%) |
| 6:30 AM to 6:59 AM | 40 (22.5%) | 12 (6.9%) |
| 7:00 AM to 7:29 AM | 14 (7.9%) | 27 (15.5%) |
| 7:30 AM to 7:59 AM | 21 (11.8%) | 25 (14.4%) |
| 8:00 AM to 8:29 AM | 10 (5.6%) | 11 (6.3%) |
| 8:30 AM to 8:59 AM | 0 (0.0%) | 8 (4.6%) |
| 9:00 AM to 9:59 AM | 6 (3.4%) | 22 (12.6%) |
| 10:00 AM to 10:59 AM | 2 (1.1%) | 0 (0.0%) |
| 11:00 AM to 11:59 AM | 0 (0.0%) | 0 (0.0%) |
| 12:00 PM to 3:59 PM | 5 (2.8%) | 10 (5.8%) |
| 4:00 PM to 11:59 PM | 0 (0.0%) | 16 (9.2%) |
| Total | 178 (100.0%) | 174 (100.0%) |
Housing Occupancy in Crescent
Occupancy by Ownership in Crescent
Of the total 261 dwellings in Crescent, owner-occupied units account for 241 (92.3%), while renter-occupied units make up 20 (7.7%).
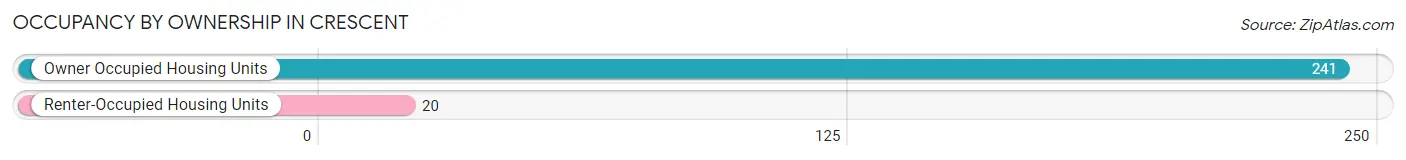
| Occupancy | # Housing Units | % Housing Units |
| Owner Occupied Housing Units | 241 | 92.3% |
| Renter-Occupied Housing Units | 20 | 7.7% |
| Total Occupied Housing Units | 261 | 100.0% |
Occupancy by Household Size in Crescent
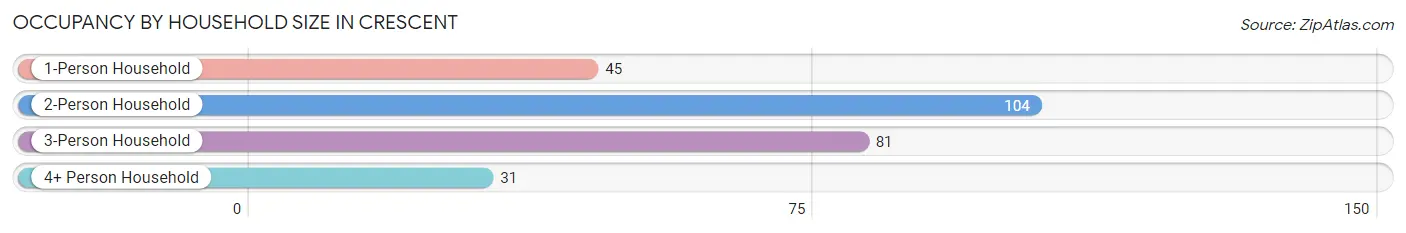
| Household Size | # Housing Units | % Housing Units |
| 1-Person Household | 45 | 17.2% |
| 2-Person Household | 104 | 39.9% |
| 3-Person Household | 81 | 31.0% |
| 4+ Person Household | 31 | 11.9% |
| Total Housing Units | 261 | 100.0% |
Occupancy by Ownership by Household Size in Crescent
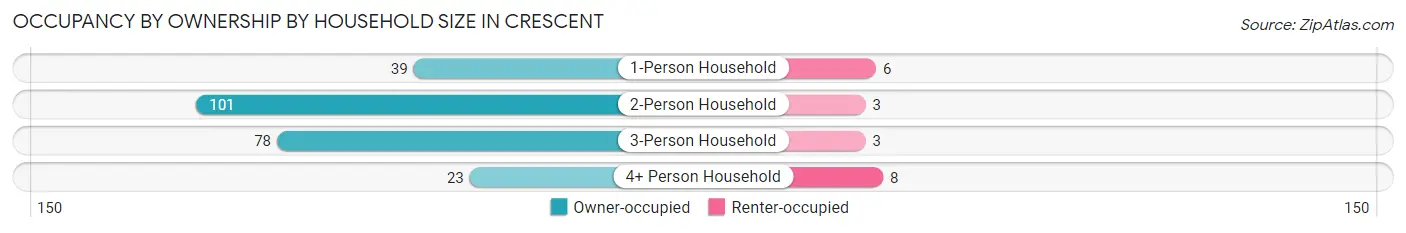
| Household Size | Owner-occupied | Renter-occupied |
| 1-Person Household | 39 (86.7%) | 6 (13.3%) |
| 2-Person Household | 101 (97.1%) | 3 (2.9%) |
| 3-Person Household | 78 (96.3%) | 3 (3.7%) |
| 4+ Person Household | 23 (74.2%) | 8 (25.8%) |
| Total Housing Units | 241 (92.3%) | 20 (7.7%) |
Occupancy by Educational Attainment in Crescent
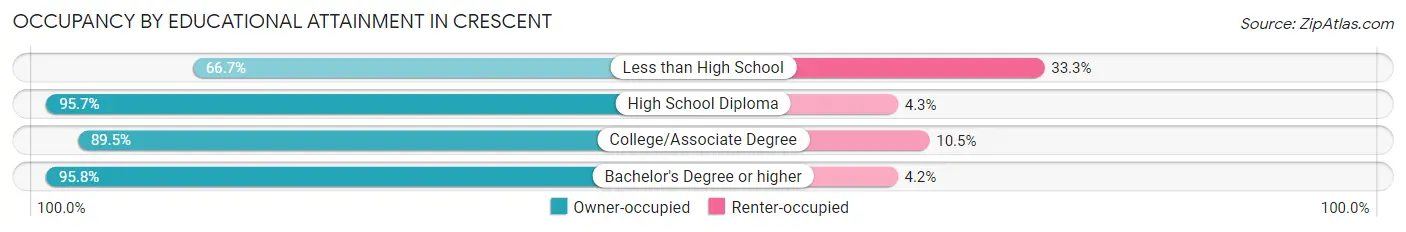
| Household Size | Owner-occupied | Renter-occupied |
| Less than High School | 4 (66.7%) | 2 (33.3%) |
| High School Diploma | 67 (95.7%) | 3 (4.3%) |
| College/Associate Degree | 102 (89.5%) | 12 (10.5%) |
| Bachelor's Degree or higher | 68 (95.8%) | 3 (4.2%) |
Occupancy by Age of Householder in Crescent
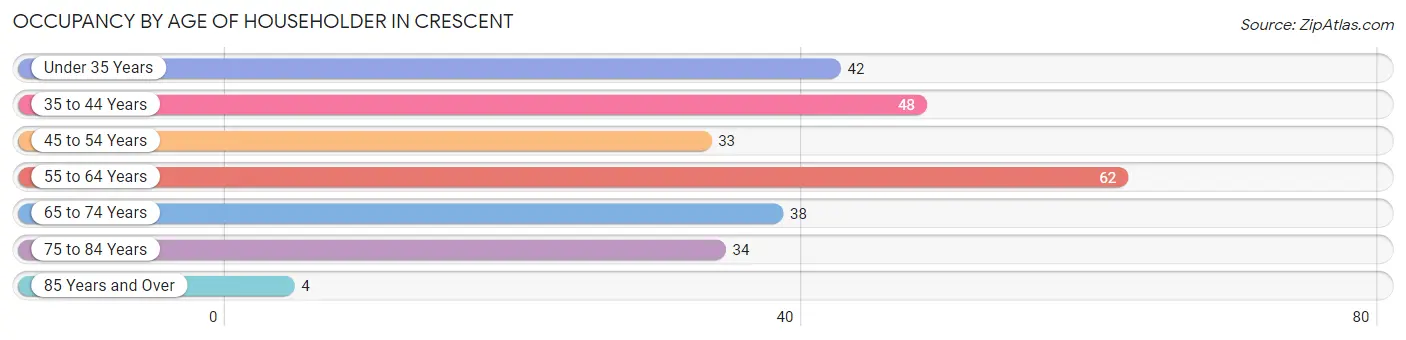
| Age Bracket | # Households | % Households |
| Under 35 Years | 42 | 16.1% |
| 35 to 44 Years | 48 | 18.4% |
| 45 to 54 Years | 33 | 12.6% |
| 55 to 64 Years | 62 | 23.7% |
| 65 to 74 Years | 38 | 14.6% |
| 75 to 84 Years | 34 | 13.0% |
| 85 Years and Over | 4 | 1.5% |
| Total | 261 | 100.0% |
Housing Finances in Crescent
Median Income by Occupancy in Crescent
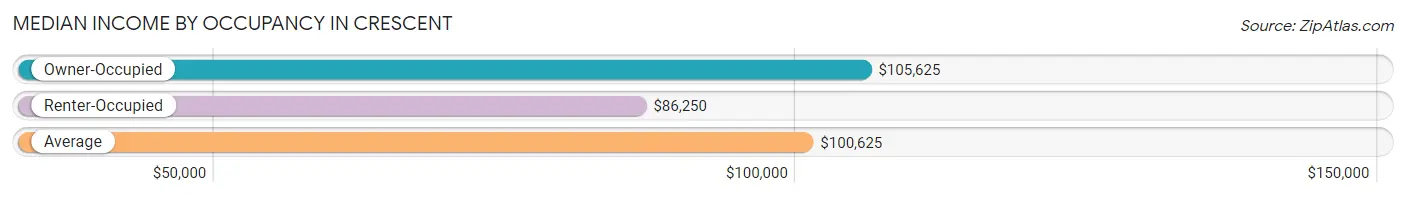
| Occupancy Type | # Households | Median Income |
| Owner-Occupied | 241 (92.3%) | $105,625 |
| Renter-Occupied | 20 (7.7%) | $86,250 |
| Average | 261 (100.0%) | $100,625 |
Occupancy by Householder Income Bracket in Crescent
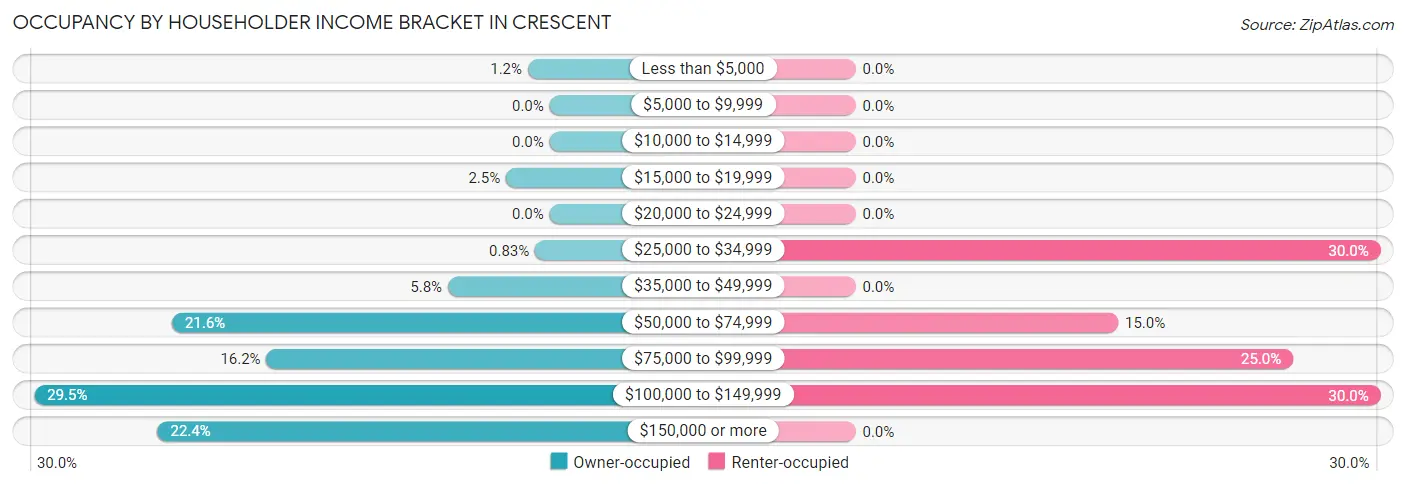
| Income Bracket | Owner-occupied | Renter-occupied |
| Less than $5,000 | 3 (1.2%) | 0 (0.0%) |
| $5,000 to $9,999 | 0 (0.0%) | 0 (0.0%) |
| $10,000 to $14,999 | 0 (0.0%) | 0 (0.0%) |
| $15,000 to $19,999 | 6 (2.5%) | 0 (0.0%) |
| $20,000 to $24,999 | 0 (0.0%) | 0 (0.0%) |
| $25,000 to $34,999 | 2 (0.8%) | 6 (30.0%) |
| $35,000 to $49,999 | 14 (5.8%) | 0 (0.0%) |
| $50,000 to $74,999 | 52 (21.6%) | 3 (15.0%) |
| $75,000 to $99,999 | 39 (16.2%) | 5 (25.0%) |
| $100,000 to $149,999 | 71 (29.5%) | 6 (30.0%) |
| $150,000 or more | 54 (22.4%) | 0 (0.0%) |
| Total | 241 (100.0%) | 20 (100.0%) |
Monthly Housing Cost Tiers in Crescent
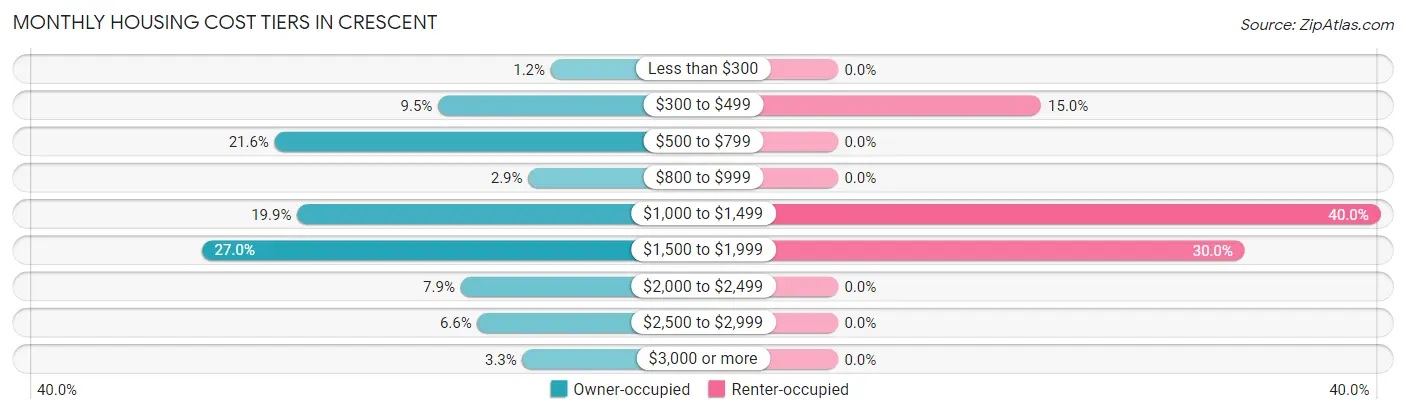
| Monthly Cost | Owner-occupied | Renter-occupied |
| Less than $300 | 3 (1.2%) | 0 (0.0%) |
| $300 to $499 | 23 (9.5%) | 3 (15.0%) |
| $500 to $799 | 52 (21.6%) | 0 (0.0%) |
| $800 to $999 | 7 (2.9%) | 0 (0.0%) |
| $1,000 to $1,499 | 48 (19.9%) | 8 (40.0%) |
| $1,500 to $1,999 | 65 (27.0%) | 6 (30.0%) |
| $2,000 to $2,499 | 19 (7.9%) | 0 (0.0%) |
| $2,500 to $2,999 | 16 (6.6%) | 0 (0.0%) |
| $3,000 or more | 8 (3.3%) | 0 (0.0%) |
| Total | 241 (100.0%) | 20 (100.0%) |
Physical Housing Characteristics in Crescent
Housing Structures in Crescent
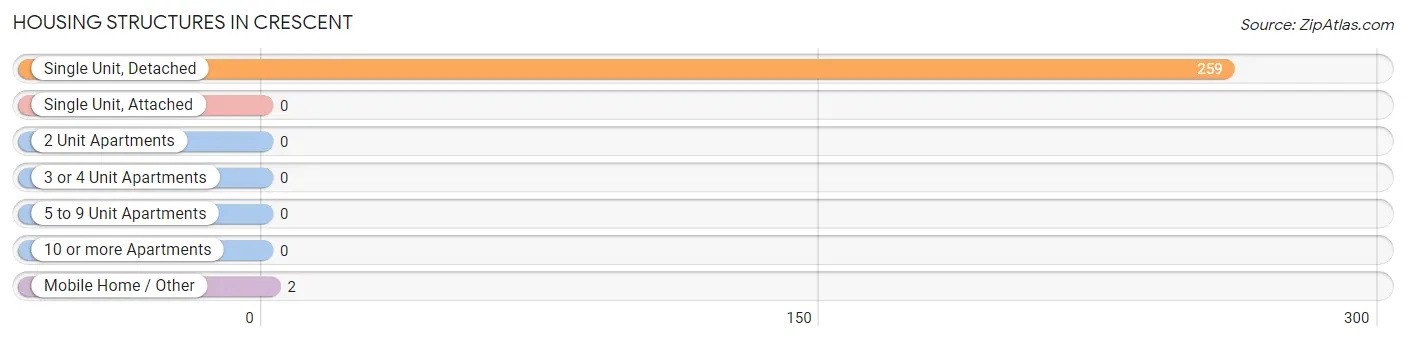
| Structure Type | # Housing Units | % Housing Units |
| Single Unit, Detached | 259 | 99.2% |
| Single Unit, Attached | 0 | 0.0% |
| 2 Unit Apartments | 0 | 0.0% |
| 3 or 4 Unit Apartments | 0 | 0.0% |
| 5 to 9 Unit Apartments | 0 | 0.0% |
| 10 or more Apartments | 0 | 0.0% |
| Mobile Home / Other | 2 | 0.8% |
| Total | 261 | 100.0% |
Housing Structures by Occupancy in Crescent
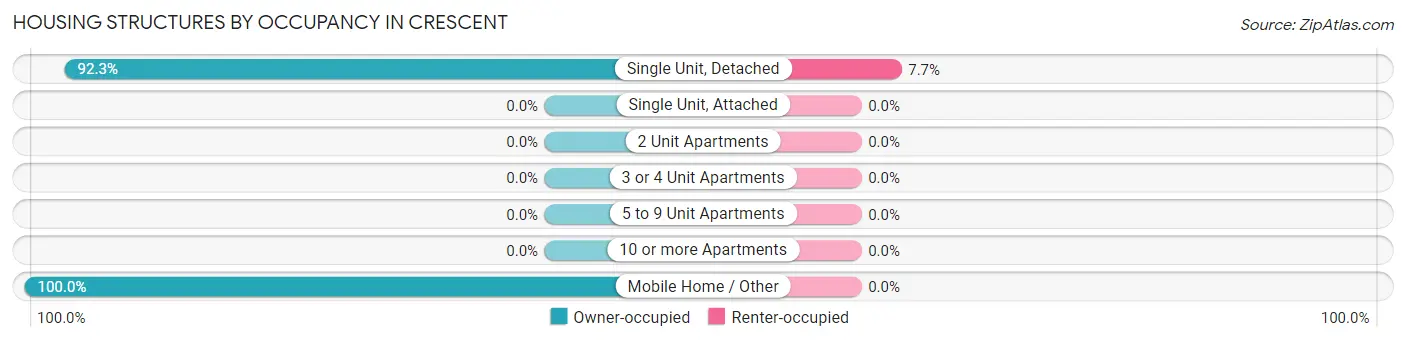
| Structure Type | Owner-occupied | Renter-occupied |
| Single Unit, Detached | 239 (92.3%) | 20 (7.7%) |
| Single Unit, Attached | 0 (0.0%) | 0 (0.0%) |
| 2 Unit Apartments | 0 (0.0%) | 0 (0.0%) |
| 3 or 4 Unit Apartments | 0 (0.0%) | 0 (0.0%) |
| 5 to 9 Unit Apartments | 0 (0.0%) | 0 (0.0%) |
| 10 or more Apartments | 0 (0.0%) | 0 (0.0%) |
| Mobile Home / Other | 2 (100.0%) | 0 (0.0%) |
| Total | 241 (92.3%) | 20 (7.7%) |
Housing Structures by Number of Rooms in Crescent
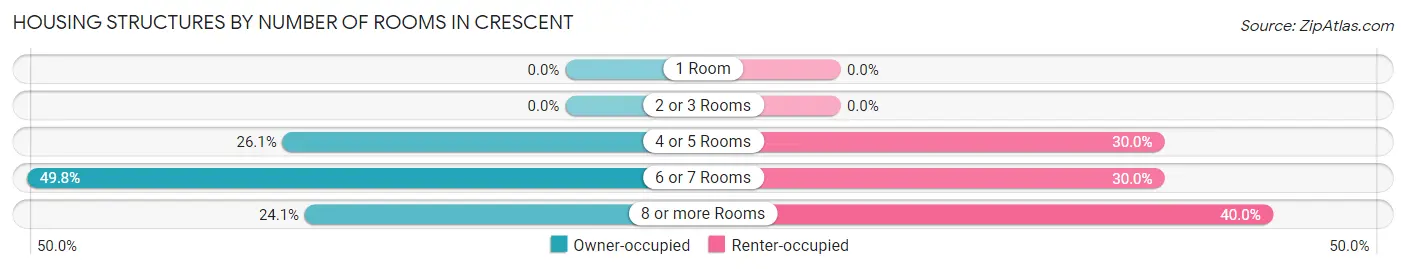
| Number of Rooms | Owner-occupied | Renter-occupied |
| 1 Room | 0 (0.0%) | 0 (0.0%) |
| 2 or 3 Rooms | 0 (0.0%) | 0 (0.0%) |
| 4 or 5 Rooms | 63 (26.1%) | 6 (30.0%) |
| 6 or 7 Rooms | 120 (49.8%) | 6 (30.0%) |
| 8 or more Rooms | 58 (24.1%) | 8 (40.0%) |
| Total | 241 (100.0%) | 20 (100.0%) |
Housing Structure by Heating Type in Crescent
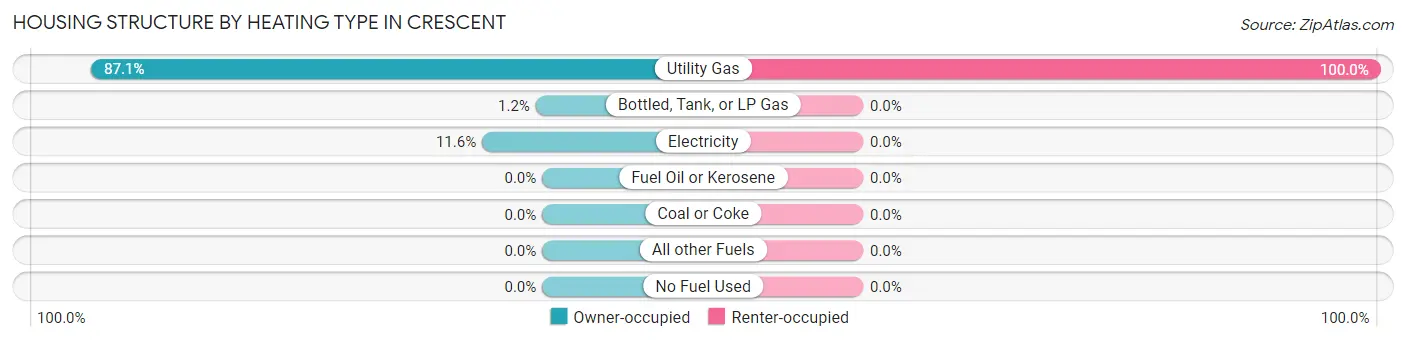
| Heating Type | Owner-occupied | Renter-occupied |
| Utility Gas | 210 (87.1%) | 20 (100.0%) |
| Bottled, Tank, or LP Gas | 3 (1.2%) | 0 (0.0%) |
| Electricity | 28 (11.6%) | 0 (0.0%) |
| Fuel Oil or Kerosene | 0 (0.0%) | 0 (0.0%) |
| Coal or Coke | 0 (0.0%) | 0 (0.0%) |
| All other Fuels | 0 (0.0%) | 0 (0.0%) |
| No Fuel Used | 0 (0.0%) | 0 (0.0%) |
| Total | 241 (100.0%) | 20 (100.0%) |
Household Vehicle Usage in Crescent
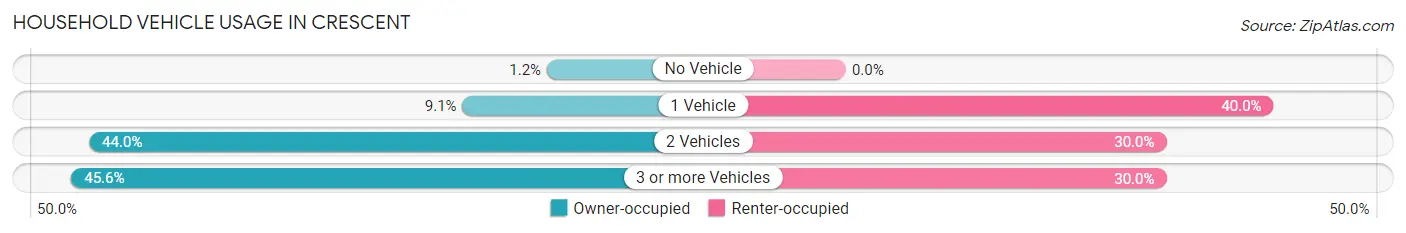
| Vehicles per Household | Owner-occupied | Renter-occupied |
| No Vehicle | 3 (1.2%) | 0 (0.0%) |
| 1 Vehicle | 22 (9.1%) | 8 (40.0%) |
| 2 Vehicles | 106 (44.0%) | 6 (30.0%) |
| 3 or more Vehicles | 110 (45.6%) | 6 (30.0%) |
| Total | 241 (100.0%) | 20 (100.0%) |
Real Estate & Mortgages in Crescent
Real Estate and Mortgage Overview in Crescent
| Characteristic | Without Mortgage | With Mortgage |
| Housing Units | 96 | 145 |
| Median Property Value | $220,600 | $249,300 |
| Median Household Income | $71,250 | $36 |
| Monthly Housing Costs | $619 | $8 |
| Real Estate Taxes | $2,850 | $0 |
Property Value by Mortgage Status in Crescent
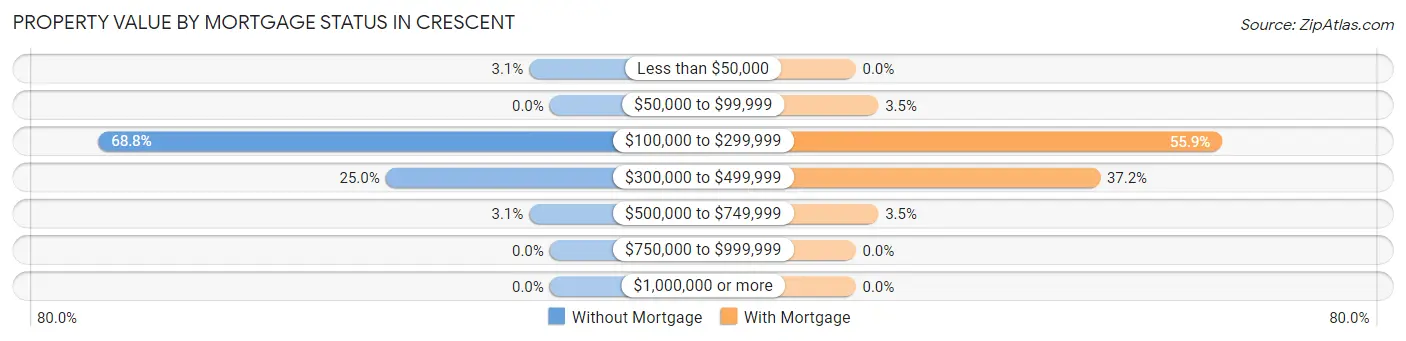
| Property Value | Without Mortgage | With Mortgage |
| Less than $50,000 | 3 (3.1%) | 0 (0.0%) |
| $50,000 to $99,999 | 0 (0.0%) | 5 (3.5%) |
| $100,000 to $299,999 | 66 (68.8%) | 81 (55.9%) |
| $300,000 to $499,999 | 24 (25.0%) | 54 (37.2%) |
| $500,000 to $749,999 | 3 (3.1%) | 5 (3.5%) |
| $750,000 to $999,999 | 0 (0.0%) | 0 (0.0%) |
| $1,000,000 or more | 0 (0.0%) | 0 (0.0%) |
| Total | 96 (100.0%) | 145 (100.0%) |
Household Income by Mortgage Status in Crescent
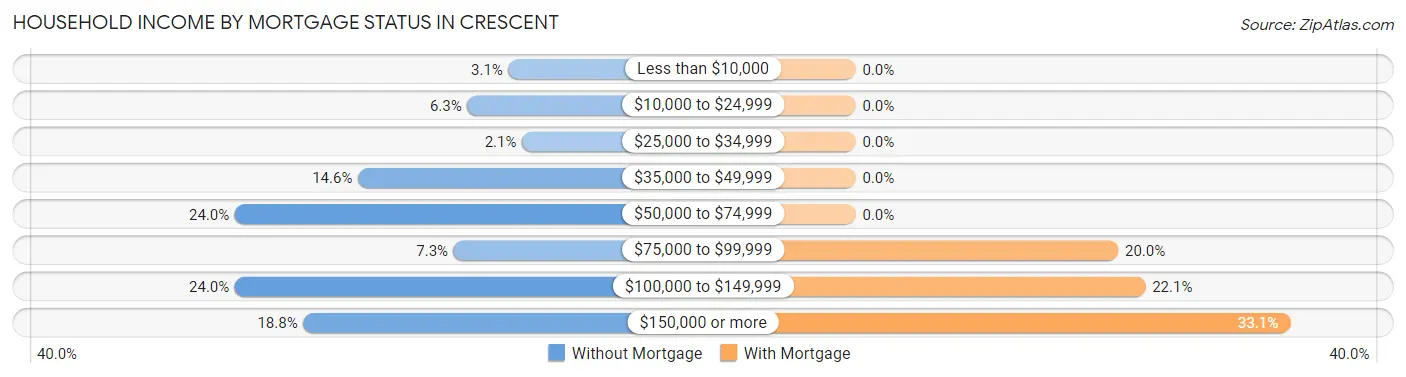
| Household Income | Without Mortgage | With Mortgage |
| Less than $10,000 | 3 (3.1%) | 0 (0.0%) |
| $10,000 to $24,999 | 6 (6.2%) | 0 (0.0%) |
| $25,000 to $34,999 | 2 (2.1%) | 0 (0.0%) |
| $35,000 to $49,999 | 14 (14.6%) | 0 (0.0%) |
| $50,000 to $74,999 | 23 (24.0%) | 0 (0.0%) |
| $75,000 to $99,999 | 7 (7.3%) | 29 (20.0%) |
| $100,000 to $149,999 | 23 (24.0%) | 32 (22.1%) |
| $150,000 or more | 18 (18.8%) | 48 (33.1%) |
| Total | 96 (100.0%) | 145 (100.0%) |
Property Value to Household Income Ratio in Crescent
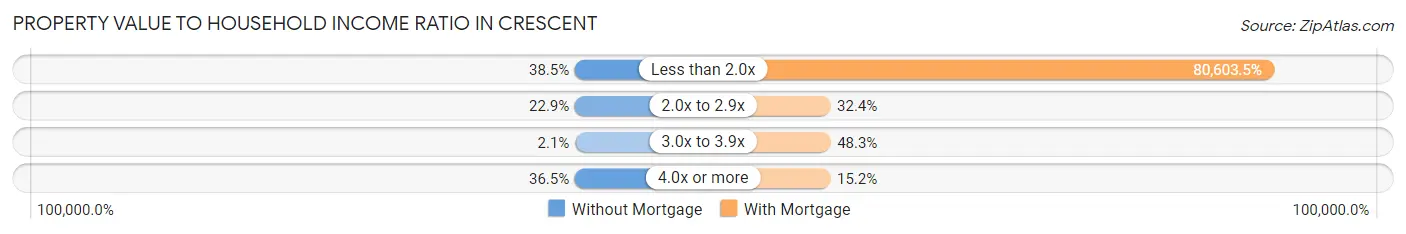
| Value-to-Income Ratio | Without Mortgage | With Mortgage |
| Less than 2.0x | 37 (38.5%) | 116,875 (80,603.4%) |
| 2.0x to 2.9x | 22 (22.9%) | 47 (32.4%) |
| 3.0x to 3.9x | 2 (2.1%) | 70 (48.3%) |
| 4.0x or more | 35 (36.5%) | 22 (15.2%) |
| Total | 96 (100.0%) | 145 (100.0%) |
Real Estate Taxes by Mortgage Status in Crescent
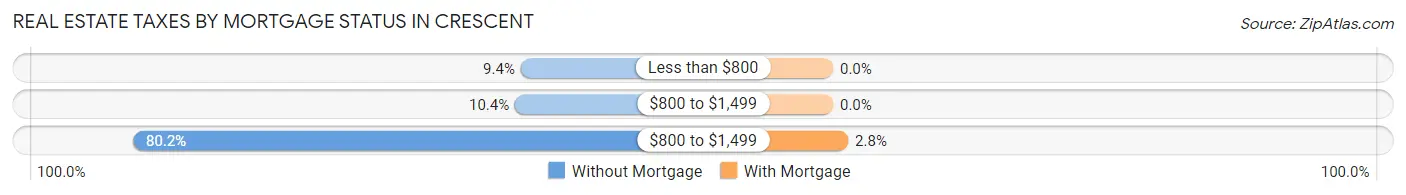
| Property Taxes | Without Mortgage | With Mortgage |
| Less than $800 | 9 (9.4%) | 0 (0.0%) |
| $800 to $1,499 | 10 (10.4%) | 0 (0.0%) |
| $800 to $1,499 | 77 (80.2%) | 4 (2.8%) |
| Total | 96 (100.0%) | 145 (100.0%) |
Health & Disability in Crescent
Health Insurance Coverage by Age in Crescent
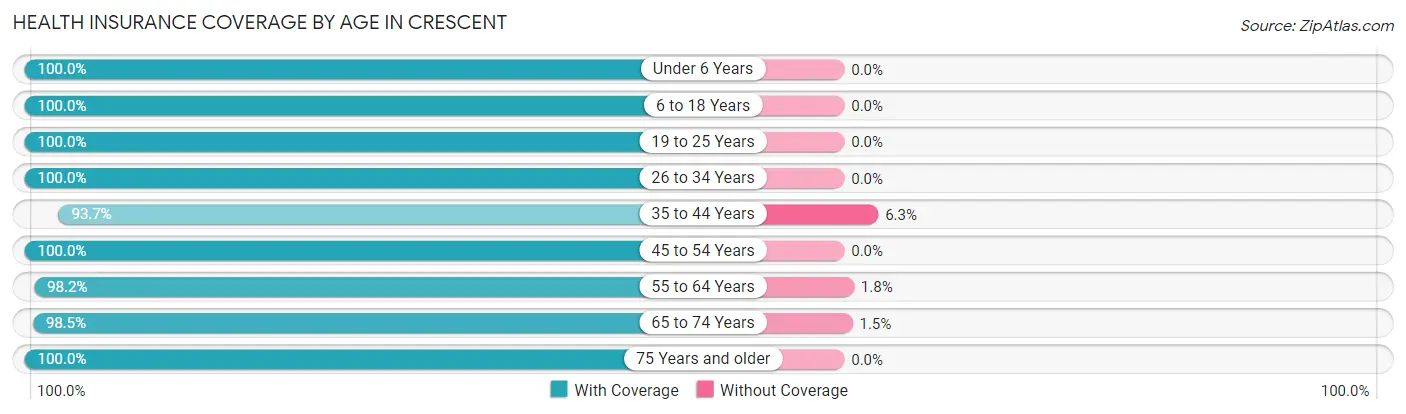
| Age Bracket | With Coverage | Without Coverage |
| Under 6 Years | 37 (100.0%) | 0 (0.0%) |
| 6 to 18 Years | 117 (100.0%) | 0 (0.0%) |
| 19 to 25 Years | 31 (100.0%) | 0 (0.0%) |
| 26 to 34 Years | 66 (100.0%) | 0 (0.0%) |
| 35 to 44 Years | 89 (93.7%) | 6 (6.3%) |
| 45 to 54 Years | 70 (100.0%) | 0 (0.0%) |
| 55 to 64 Years | 110 (98.2%) | 2 (1.8%) |
| 65 to 74 Years | 64 (98.5%) | 1 (1.5%) |
| 75 Years and older | 58 (100.0%) | 0 (0.0%) |
| Total | 642 (98.6%) | 9 (1.4%) |
Health Insurance Coverage by Citizenship Status in Crescent
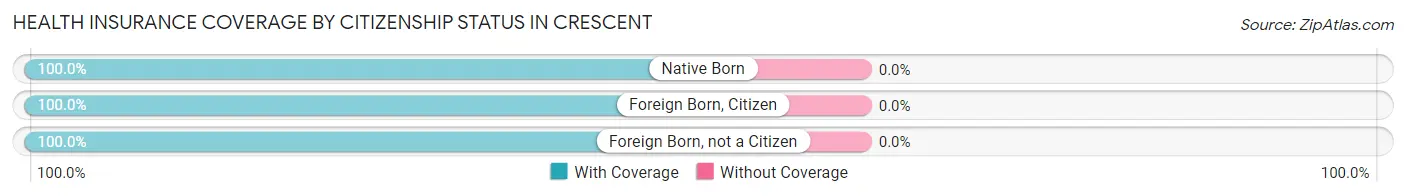
| Citizenship Status | With Coverage | Without Coverage |
| Native Born | 37 (100.0%) | 0 (0.0%) |
| Foreign Born, Citizen | 117 (100.0%) | 0 (0.0%) |
| Foreign Born, not a Citizen | 31 (100.0%) | 0 (0.0%) |
Health Insurance Coverage by Household Income in Crescent
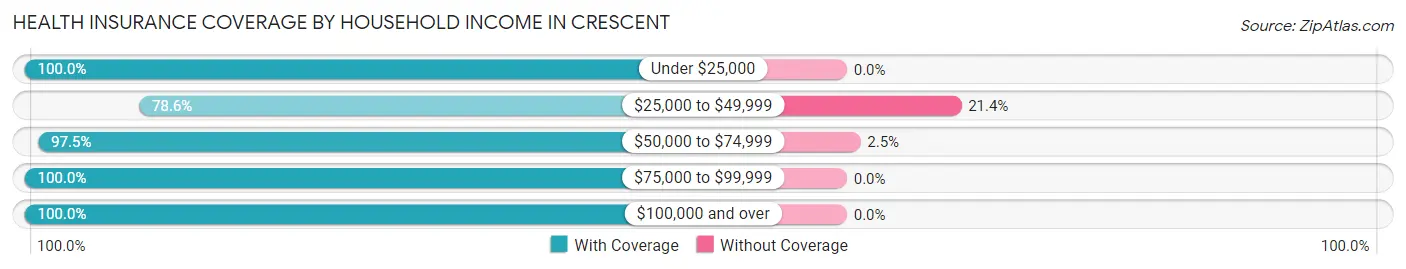
| Household Income | With Coverage | Without Coverage |
| Under $25,000 | 10 (100.0%) | 0 (0.0%) |
| $25,000 to $49,999 | 22 (78.6%) | 6 (21.4%) |
| $50,000 to $74,999 | 115 (97.5%) | 3 (2.5%) |
| $75,000 to $99,999 | 142 (100.0%) | 0 (0.0%) |
| $100,000 and over | 353 (100.0%) | 0 (0.0%) |
Public vs Private Health Insurance Coverage by Age in Crescent
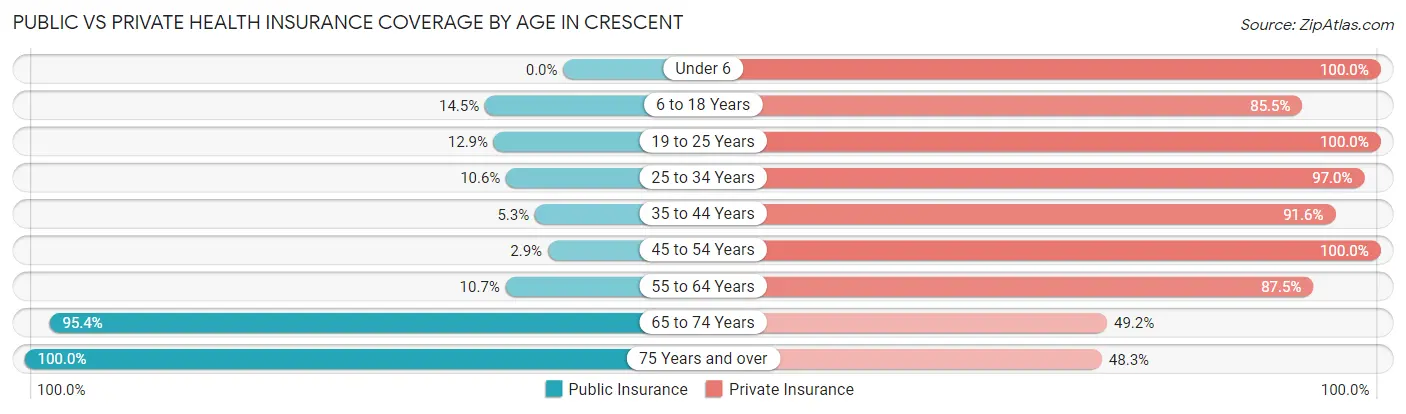
| Age Bracket | Public Insurance | Private Insurance |
| Under 6 | 0 (0.0%) | 37 (100.0%) |
| 6 to 18 Years | 17 (14.5%) | 100 (85.5%) |
| 19 to 25 Years | 4 (12.9%) | 31 (100.0%) |
| 25 to 34 Years | 7 (10.6%) | 64 (97.0%) |
| 35 to 44 Years | 5 (5.3%) | 87 (91.6%) |
| 45 to 54 Years | 2 (2.9%) | 70 (100.0%) |
| 55 to 64 Years | 12 (10.7%) | 98 (87.5%) |
| 65 to 74 Years | 62 (95.4%) | 32 (49.2%) |
| 75 Years and over | 58 (100.0%) | 28 (48.3%) |
| Total | 167 (25.7%) | 547 (84.0%) |
Disability Status by Sex by Age in Crescent
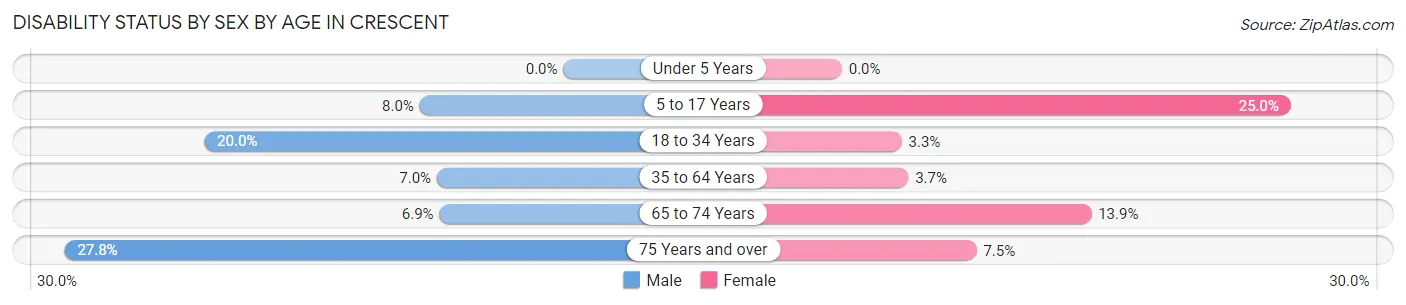
| Age Bracket | Male | Female |
| Under 5 Years | 0 (0.0%) | 0 (0.0%) |
| 5 to 17 Years | 4 (8.0%) | 17 (25.0%) |
| 18 to 34 Years | 9 (20.0%) | 2 (3.3%) |
| 35 to 64 Years | 10 (7.0%) | 5 (3.7%) |
| 65 to 74 Years | 2 (6.9%) | 5 (13.9%) |
| 75 Years and over | 5 (27.8%) | 3 (7.5%) |
Disability Class by Sex by Age in Crescent
Disability Class: Hearing Difficulty
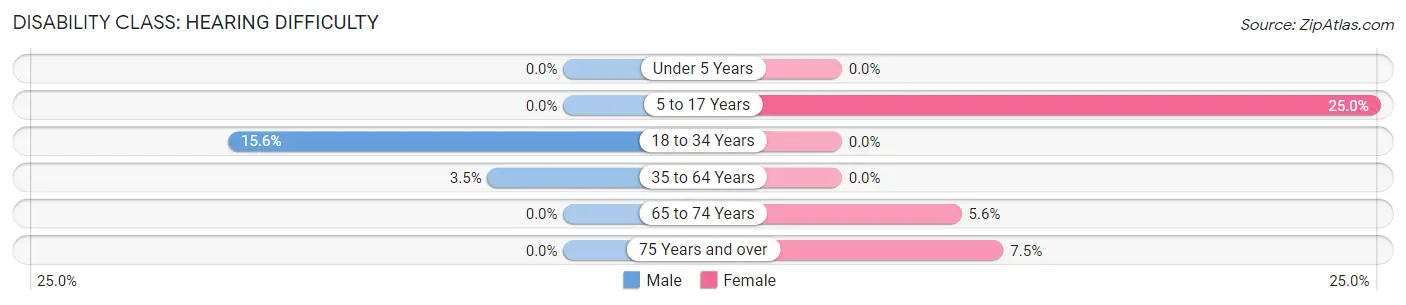
| Age Bracket | Male | Female |
| Under 5 Years | 0 (0.0%) | 0 (0.0%) |
| 5 to 17 Years | 0 (0.0%) | 17 (25.0%) |
| 18 to 34 Years | 7 (15.6%) | 0 (0.0%) |
| 35 to 64 Years | 5 (3.5%) | 0 (0.0%) |
| 65 to 74 Years | 0 (0.0%) | 2 (5.6%) |
| 75 Years and over | 0 (0.0%) | 3 (7.5%) |
Disability Class: Vision Difficulty
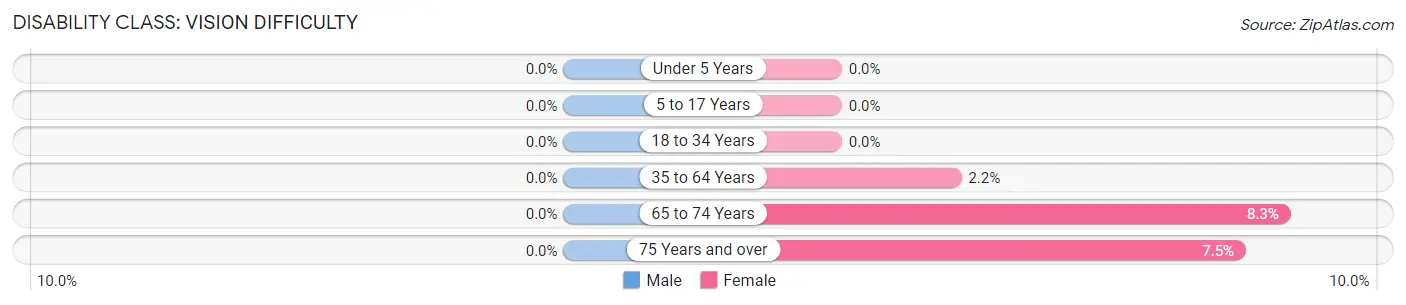
| Age Bracket | Male | Female |
| Under 5 Years | 0 (0.0%) | 0 (0.0%) |
| 5 to 17 Years | 0 (0.0%) | 0 (0.0%) |
| 18 to 34 Years | 0 (0.0%) | 0 (0.0%) |
| 35 to 64 Years | 0 (0.0%) | 3 (2.2%) |
| 65 to 74 Years | 0 (0.0%) | 3 (8.3%) |
| 75 Years and over | 0 (0.0%) | 3 (7.5%) |
Disability Class: Cognitive Difficulty
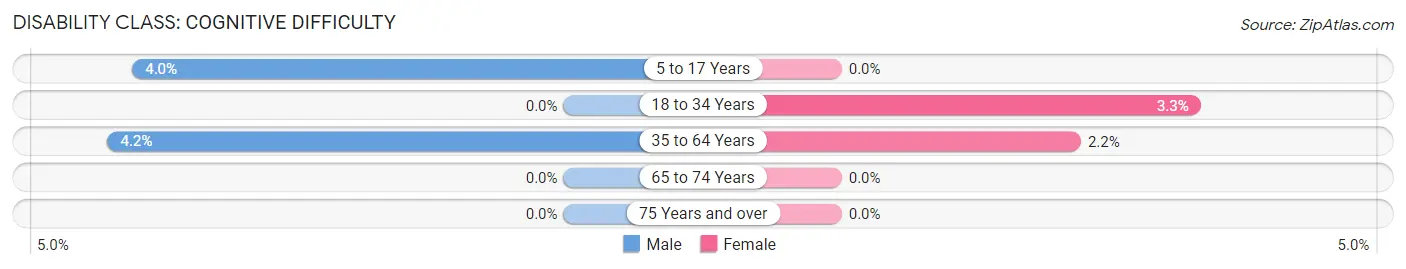
| Age Bracket | Male | Female |
| 5 to 17 Years | 2 (4.0%) | 0 (0.0%) |
| 18 to 34 Years | 0 (0.0%) | 2 (3.3%) |
| 35 to 64 Years | 6 (4.2%) | 3 (2.2%) |
| 65 to 74 Years | 0 (0.0%) | 0 (0.0%) |
| 75 Years and over | 0 (0.0%) | 0 (0.0%) |
Disability Class: Ambulatory Difficulty
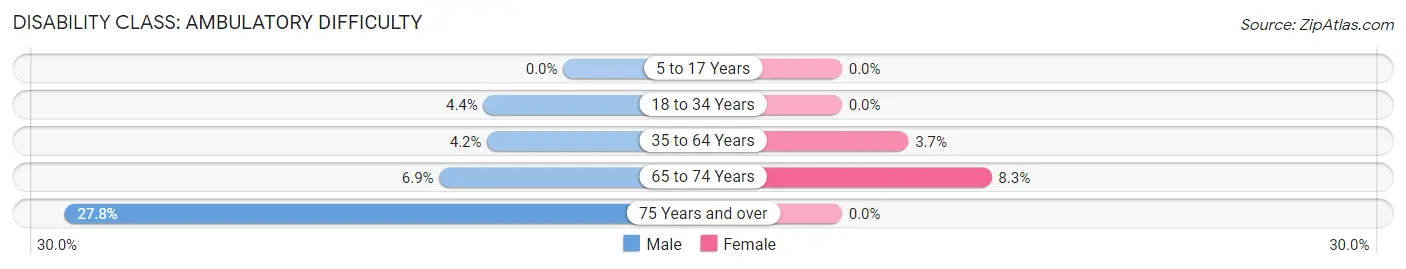
| Age Bracket | Male | Female |
| 5 to 17 Years | 0 (0.0%) | 0 (0.0%) |
| 18 to 34 Years | 2 (4.4%) | 0 (0.0%) |
| 35 to 64 Years | 6 (4.2%) | 5 (3.7%) |
| 65 to 74 Years | 2 (6.9%) | 3 (8.3%) |
| 75 Years and over | 5 (27.8%) | 0 (0.0%) |
Disability Class: Self-Care Difficulty
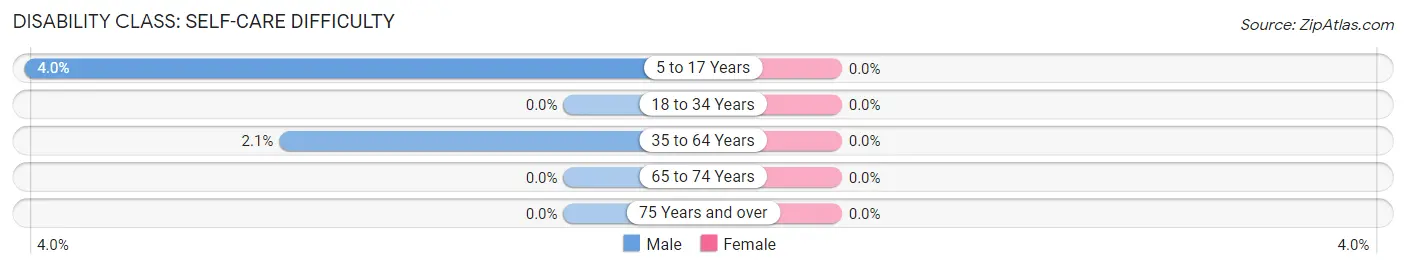
| Age Bracket | Male | Female |
| 5 to 17 Years | 2 (4.0%) | 0 (0.0%) |
| 18 to 34 Years | 0 (0.0%) | 0 (0.0%) |
| 35 to 64 Years | 3 (2.1%) | 0 (0.0%) |
| 65 to 74 Years | 0 (0.0%) | 0 (0.0%) |
| 75 Years and over | 0 (0.0%) | 0 (0.0%) |
Technology Access in Crescent
Computing Device Access in Crescent
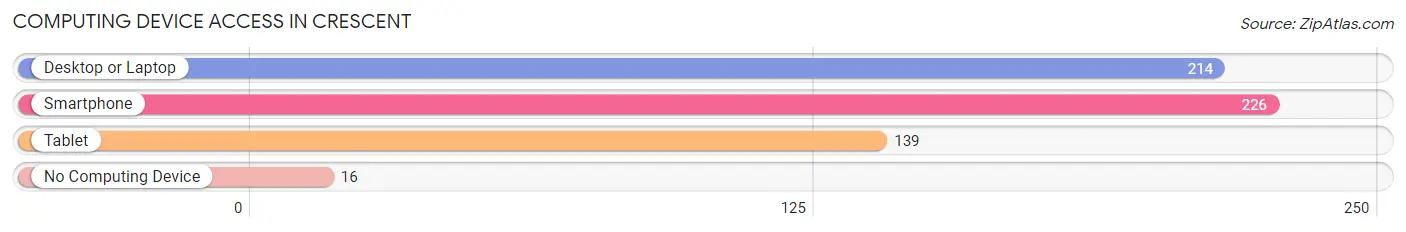
| Device Type | # Households | % Households |
| Desktop or Laptop | 214 | 82.0% |
| Smartphone | 226 | 86.6% |
| Tablet | 139 | 53.3% |
| No Computing Device | 16 | 6.1% |
| Total | 261 | 100.0% |
Internet Access in Crescent
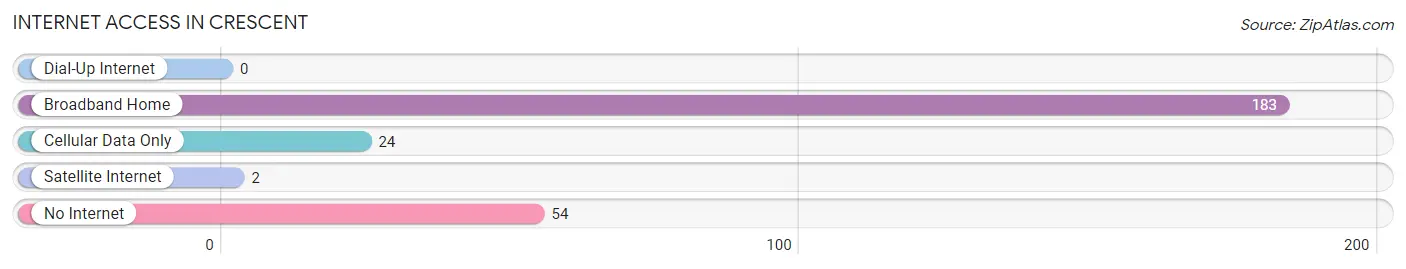
| Internet Type | # Households | % Households |
| Dial-Up Internet | 0 | 0.0% |
| Broadband Home | 183 | 70.1% |
| Cellular Data Only | 24 | 9.2% |
| Satellite Internet | 2 | 0.8% |
| No Internet | 54 | 20.7% |
| Total | 261 | 100.0% |
Crescent Summary
Crescent, Iowa is a small city located in Pottawattamie County, Iowa. It is situated on the banks of the Missouri River, just south of Omaha, Nebraska. The city has a population of 1,845 people, according to the 2010 census.
Geography
Crescent is located in the Loess Hills region of western Iowa. The city is situated on the banks of the Missouri River, just south of Omaha, Nebraska. The city is surrounded by rolling hills and farmland, and is located in the heart of the Loess Hills National Scenic Byway. The city is located in the Central Time Zone and has a humid continental climate, with hot summers and cold winters.
Economy
Crescent’s economy is largely based on agriculture and manufacturing. The city is home to several large agricultural companies, including Cargill, Tyson Foods, and Land O’Lakes. The city also has a number of small businesses, including restaurants, retail stores, and service providers. The city is also home to a number of manufacturing companies, including a plastics plant, a metal fabrication plant, and a paper mill.
Demographics
According to the 2010 census, Crescent has a population of 1,845 people. The population is predominantly white, with a small percentage of African Americans, Hispanics, and Asians. The median household income is $45,000, and the median home value is $125,000. The city has a high rate of homeownership, with nearly 80% of residents owning their own homes.
Education
Crescent is served by the Pottawattamie County School District. The district operates three elementary schools, one middle school, and one high school. The city also has a number of private schools, including a Catholic school and a Lutheran school.
Conclusion
Crescent, Iowa is a small city located in Pottawattamie County, Iowa. It is situated on the banks of the Missouri River, just south of Omaha, Nebraska. The city has a population of 1,845 people, according to the 2010 census. The city’s economy is largely based on agriculture and manufacturing, and the city is home to several large agricultural companies and a number of small businesses. The city is served by the Pottawattamie County School District, and has a number of private schools.
Common Questions
What is Per Capita Income in Crescent?
Per Capita income in Crescent is $45,486.
What is the Median Family Income in Crescent?
Median Family Income in Crescent is $107,885.
What is the Median Household income in Crescent?
Median Household Income in Crescent is $100,625.
What is Income or Wage Gap in Crescent?
Income or Wage Gap in Crescent is 45.5%.
Women in Crescent earn 54.5 cents for every dollar earned by a man.
What is Inequality or Gini Index in Crescent?
Inequality or Gini Index in Crescent is 0.30.
What is the Total Population of Crescent?
Total Population of Crescent is 651.
What is the Total Male Population of Crescent?
Total Male Population of Crescent is 310.
What is the Total Female Population of Crescent?
Total Female Population of Crescent is 341.
What is the Ratio of Males per 100 Females in Crescent?
There are 90.91 Males per 100 Females in Crescent.
What is the Ratio of Females per 100 Males in Crescent?
There are 110.00 Females per 100 Males in Crescent.
What is the Median Population Age in Crescent?
Median Population Age in Crescent is 43.0 Years.
What is the Average Family Size in Crescent
Average Family Size in Crescent is 2.8 People.
What is the Average Household Size in Crescent
Average Household Size in Crescent is 2.5 People.
How Large is the Labor Force in Crescent?
There are 379 People in the Labor Forcein in Crescent.
What is the Percentage of People in the Labor Force in Crescent?
72.3% of People are in the Labor Force in Crescent.