Zip Codes with the Highest Percentage of Households with Income Above $100,000 in Iowa
RELATED REPORTS & OPTIONS
Household Income | $100k+
Iowa
Compare Zip Codes
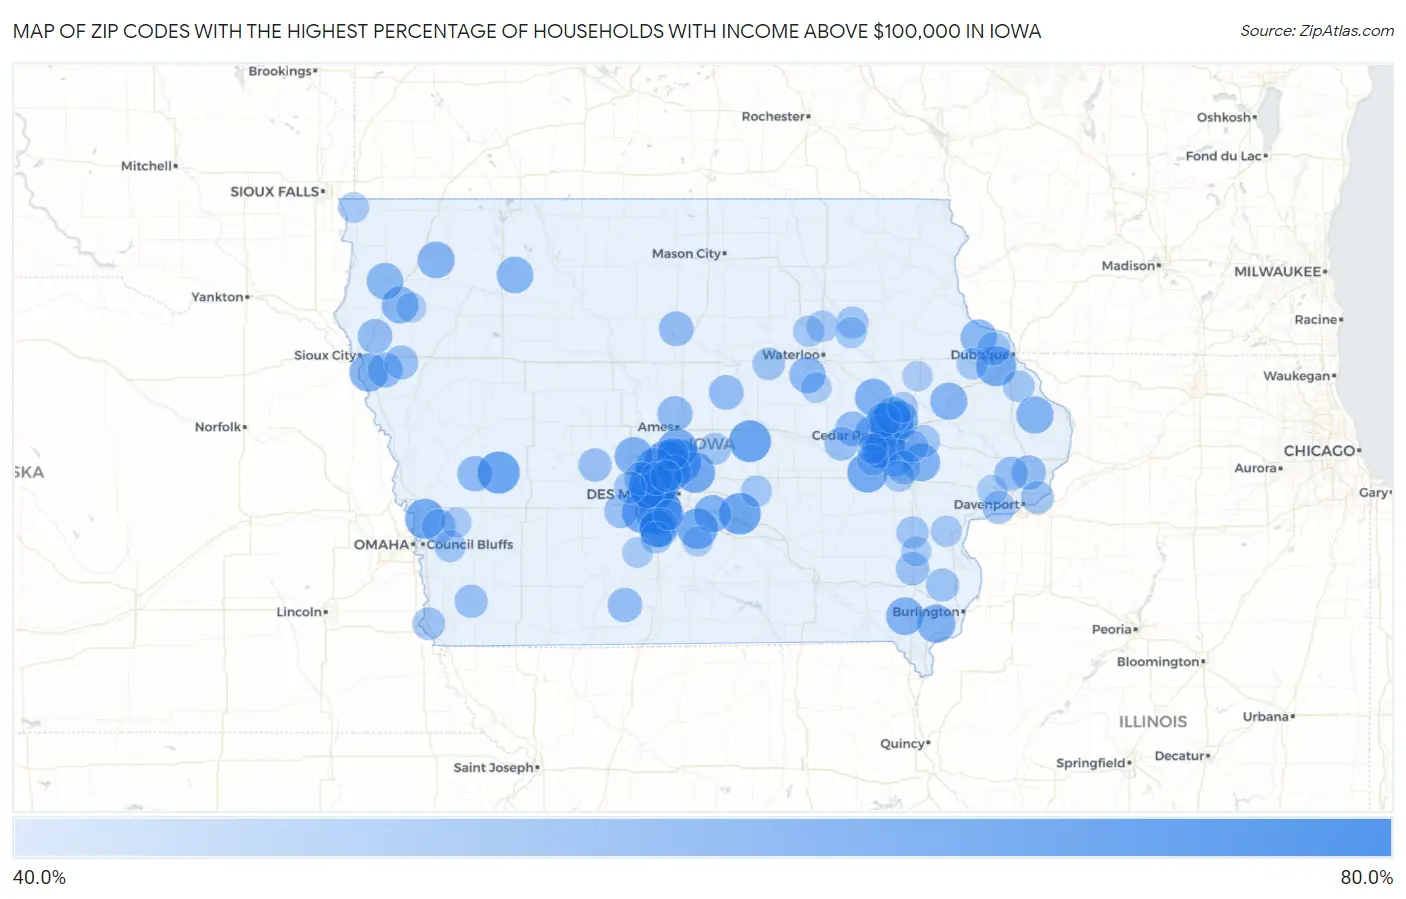
Map of Zip Codes with the Highest Percentage of Households with Income Above $100,000 in Iowa
40.0%
80.0%
Zip Codes with the Highest Percentage of Households with Income Above $100,000 in Iowa
| Zip Code | Households with Income > $100k | vs State | vs National | |
| 1. | 50323 | 79.7% | 32.9%(+46.8)#1 | 37.3%(+42.4)#352 |
| 2. | 50061 | 74.4% | 32.9%(+41.5)#2 | 37.3%(+37.1)#614 |
| 3. | 50007 | 71.0% | 32.9%(+38.1)#3 | 37.3%(+33.7)#877 |
| 4. | 50226 | 70.1% | 32.9%(+37.2)#4 | 37.3%(+32.8)#960 |
| 5. | 52411 | 69.8% | 32.9%(+36.9)#5 | 37.3%(+32.5)#988 |
| 6. | 51447 | 66.7% | 32.9%(+33.8)#6 | 37.3%(+29.4)#1,317 |
| 7. | 50120 | 66.3% | 32.9%(+33.4)#7 | 37.3%(+29.0)#1,371 |
| 8. | 50214 | 65.8% | 32.9%(+32.9)#8 | 37.3%(+28.5)#1,425 |
| 9. | 50261 | 64.6% | 32.9%(+31.7)#9 | 37.3%(+27.3)#1,599 |
| 10. | 50035 | 63.6% | 32.9%(+30.7)#10 | 37.3%(+26.3)#1,741 |
| 11. | 50001 | 63.6% | 32.9%(+30.7)#11 | 37.3%(+26.3)#1,745 |
| 12. | 52334 | 63.5% | 32.9%(+30.6)#12 | 37.3%(+26.2)#1,765 |
| 13. | 52068 | 63.0% | 32.9%(+30.1)#13 | 37.3%(+25.7)#1,849 |
| 14. | 51542 | 62.9% | 32.9%(+30.0)#14 | 37.3%(+25.6)#1,874 |
| 15. | 50124 | 62.5% | 32.9%(+29.6)#15 | 37.3%(+25.2)#1,934 |
| 16. | 50229 | 62.3% | 32.9%(+29.4)#16 | 37.3%(+25.0)#1,961 |
| 17. | 52228 | 62.2% | 32.9%(+29.3)#17 | 37.3%(+24.9)#1,974 |
| 18. | 50109 | 61.3% | 32.9%(+28.4)#18 | 37.3%(+24.0)#2,122 |
| 19. | 52328 | 60.9% | 32.9%(+28.0)#19 | 37.3%(+23.6)#2,200 |
| 20. | 51054 | 60.6% | 32.9%(+27.7)#20 | 37.3%(+23.3)#2,254 |
| 21. | 50325 | 60.1% | 32.9%(+27.2)#21 | 37.3%(+22.8)#2,341 |
| 22. | 52624 | 60.1% | 32.9%(+27.2)#22 | 37.3%(+22.8)#2,351 |
| 23. | 50039 | 59.8% | 32.9%(+26.9)#23 | 37.3%(+22.5)#2,420 |
| 24. | 52333 | 59.2% | 32.9%(+26.3)#24 | 37.3%(+21.9)#2,528 |
| 25. | 52631 | 59.0% | 32.9%(+26.1)#25 | 37.3%(+21.7)#2,579 |
| 26. | 52338 | 58.9% | 32.9%(+26.0)#26 | 37.3%(+21.6)#2,588 |
| 27. | 52345 | 58.8% | 32.9%(+25.9)#27 | 37.3%(+21.5)#2,610 |
| 28. | 52206 | 58.4% | 32.9%(+25.5)#28 | 37.3%(+21.1)#2,692 |
| 29. | 50252 | 58.4% | 32.9%(+25.5)#29 | 37.3%(+21.1)#2,698 |
| 30. | 52074 | 58.2% | 32.9%(+25.3)#30 | 37.3%(+20.9)#2,736 |
| 31. | 52252 | 58.1% | 32.9%(+25.2)#31 | 37.3%(+20.8)#2,754 |
| 32. | 52351 | 57.8% | 32.9%(+24.9)#32 | 37.3%(+20.5)#2,816 |
| 33. | 51231 | 57.6% | 32.9%(+24.7)#33 | 37.3%(+20.3)#2,859 |
| 34. | 51045 | 57.5% | 32.9%(+24.6)#34 | 37.3%(+20.2)#2,884 |
| 35. | 51036 | 57.3% | 32.9%(+24.4)#35 | 37.3%(+20.0)#2,922 |
| 36. | 50033 | 57.2% | 32.9%(+24.3)#36 | 37.3%(+19.9)#2,941 |
| 37. | 51341 | 57.1% | 32.9%(+24.2)#37 | 37.3%(+19.8)#2,967 |
| 38. | 52341 | 56.9% | 32.9%(+24.0)#38 | 37.3%(+19.6)#3,011 |
| 39. | 50643 | 56.6% | 32.9%(+23.7)#39 | 37.3%(+19.3)#3,081 |
| 40. | 52053 | 56.5% | 32.9%(+23.6)#40 | 37.3%(+19.2)#3,100 |
| 41. | 51578 | 55.1% | 32.9%(+22.2)#41 | 37.3%(+17.8)#3,445 |
| 42. | 50023 | 54.8% | 32.9%(+21.9)#42 | 37.3%(+17.5)#3,495 |
| 43. | 52324 | 54.7% | 32.9%(+21.8)#43 | 37.3%(+17.4)#3,534 |
| 44. | 50105 | 54.6% | 32.9%(+21.7)#44 | 37.3%(+17.3)#3,561 |
| 45. | 51007 | 54.4% | 32.9%(+21.5)#45 | 37.3%(+17.1)#3,628 |
| 46. | 50206 | 53.9% | 32.9%(+21.0)#46 | 37.3%(+16.6)#3,756 |
| 47. | 51024 | 53.8% | 32.9%(+20.9)#47 | 37.3%(+16.5)#3,770 |
| 48. | 52346 | 53.8% | 32.9%(+20.9)#48 | 37.3%(+16.5)#3,772 |
| 49. | 50101 | 53.8% | 32.9%(+20.9)#49 | 37.3%(+16.5)#3,778 |
| 50. | 52756 | 53.5% | 32.9%(+20.6)#50 | 37.3%(+16.2)#3,845 |
| 51. | 50074 | 53.4% | 32.9%(+20.5)#51 | 37.3%(+16.1)#3,876 |
| 52. | 50072 | 52.8% | 32.9%(+19.9)#52 | 37.3%(+15.5)#4,036 |
| 53. | 50263 | 52.7% | 32.9%(+19.8)#53 | 37.3%(+15.4)#4,060 |
| 54. | 51576 | 52.7% | 32.9%(+19.8)#54 | 37.3%(+15.4)#4,072 |
| 55. | 52746 | 52.6% | 32.9%(+19.7)#55 | 37.3%(+15.3)#4,098 |
| 56. | 51039 | 52.5% | 32.9%(+19.6)#56 | 37.3%(+15.2)#4,123 |
| 57. | 50063 | 52.4% | 32.9%(+19.5)#57 | 37.3%(+15.1)#4,144 |
| 58. | 52257 | 52.1% | 32.9%(+19.2)#58 | 37.3%(+14.8)#4,231 |
| 59. | 52317 | 52.0% | 32.9%(+19.1)#59 | 37.3%(+14.7)#4,244 |
| 60. | 52039 | 51.8% | 32.9%(+18.9)#60 | 37.3%(+14.5)#4,313 |
| 61. | 52652 | 51.8% | 32.9%(+18.9)#61 | 37.3%(+14.5)#4,323 |
| 62. | 50277 | 51.7% | 32.9%(+18.8)#62 | 37.3%(+14.4)#4,355 |
| 63. | 51645 | 51.5% | 32.9%(+18.6)#63 | 37.3%(+14.2)#4,419 |
| 64. | 52660 | 51.1% | 32.9%(+18.2)#64 | 37.3%(+13.8)#4,522 |
| 65. | 52722 | 51.0% | 32.9%(+18.1)#65 | 37.3%(+13.7)#4,530 |
| 66. | 52726 | 51.0% | 32.9%(+18.1)#66 | 37.3%(+13.7)#4,549 |
| 67. | 50111 | 50.8% | 32.9%(+17.9)#67 | 37.3%(+13.5)#4,605 |
| 68. | 51648 | 50.7% | 32.9%(+17.8)#68 | 37.3%(+13.4)#4,645 |
| 69. | 50642 | 50.2% | 32.9%(+17.3)#69 | 37.3%(+12.9)#4,792 |
| 70. | 52314 | 50.0% | 32.9%(+17.1)#70 | 37.3%(+12.7)#4,827 |
| 71. | 50003 | 49.7% | 32.9%(+16.8)#71 | 37.3%(+12.4)#4,957 |
| 72. | 52201 | 49.7% | 32.9%(+16.8)#72 | 37.3%(+12.4)#4,964 |
| 73. | 50244 | 49.5% | 32.9%(+16.6)#73 | 37.3%(+12.2)#5,032 |
| 74. | 50664 | 49.4% | 32.9%(+16.5)#74 | 37.3%(+12.1)#5,079 |
| 75. | 50131 | 49.2% | 32.9%(+16.3)#75 | 37.3%(+11.9)#5,106 |
| 76. | 50240 | 49.2% | 32.9%(+16.3)#76 | 37.3%(+11.9)#5,118 |
| 77. | 52227 | 49.1% | 32.9%(+16.2)#77 | 37.3%(+11.8)#5,151 |
| 78. | 50055 | 49.0% | 32.9%(+16.1)#78 | 37.3%(+11.7)#5,188 |
| 79. | 51575 | 48.9% | 32.9%(+16.0)#79 | 37.3%(+11.6)#5,213 |
| 80. | 52054 | 48.9% | 32.9%(+16.0)#80 | 37.3%(+11.6)#5,219 |
| 81. | 52046 | 48.8% | 32.9%(+15.9)#81 | 37.3%(+11.5)#5,244 |
| 82. | 52203 | 48.8% | 32.9%(+15.9)#82 | 37.3%(+11.5)#5,246 |
| 83. | 50622 | 48.6% | 32.9%(+15.7)#83 | 37.3%(+11.3)#5,299 |
| 84. | 50137 | 48.6% | 32.9%(+15.7)#84 | 37.3%(+11.3)#5,311 |
| 85. | 50647 | 48.3% | 32.9%(+15.4)#85 | 37.3%(+11.0)#5,399 |
| 86. | 52340 | 48.1% | 32.9%(+15.2)#86 | 37.3%(+10.8)#5,469 |
| 87. | 52754 | 48.1% | 32.9%(+15.2)#87 | 37.3%(+10.8)#5,474 |
| 88. | 50629 | 48.0% | 32.9%(+15.1)#88 | 37.3%(+10.7)#5,515 |
| 89. | 52202 | 47.6% | 32.9%(+14.7)#89 | 37.3%(+10.3)#5,654 |
| 90. | 50612 | 47.4% | 32.9%(+14.5)#90 | 37.3%(+10.1)#5,719 |
| 91. | 51241 | 47.2% | 32.9%(+14.3)#91 | 37.3%(+9.90)#5,783 |
| 92. | 50222 | 47.1% | 32.9%(+14.2)#92 | 37.3%(+9.80)#5,818 |
| 93. | 51553 | 47.0% | 32.9%(+14.1)#93 | 37.3%(+9.70)#5,840 |
| 94. | 52318 | 47.0% | 32.9%(+14.1)#94 | 37.3%(+9.70)#5,842 |
| 95. | 52769 | 47.0% | 32.9%(+14.1)#95 | 37.3%(+9.70)#5,845 |
| 96. | 50211 | 46.7% | 32.9%(+13.8)#96 | 37.3%(+9.40)#5,942 |
| 97. | 50166 | 46.7% | 32.9%(+13.8)#97 | 37.3%(+9.40)#5,955 |
| 98. | 52330 | 46.6% | 32.9%(+13.7)#98 | 37.3%(+9.30)#5,993 |
| 99. | 51050 | 46.5% | 32.9%(+13.6)#99 | 37.3%(+9.20)#6,026 |
| 100. | 52621 | 46.5% | 32.9%(+13.6)#100 | 37.3%(+9.20)#6,031 |
Common Questions
What are the Top 10 Zip Codes with the Highest Percentage of Households with Income Above $100,000 in Iowa?
Top 10 Zip Codes with the Highest Percentage of Households with Income Above $100,000 in Iowa are:
What zip code has the Highest Percentage of Households with Income Above $100,000 in Iowa?
50323 has the Highest Percentage of Households with Income Above $100,000 in Iowa with 79.7%.
What is the Percentage of Households with Income Above $100,000 in the State of Iowa?
Percentage of Households with Income Above $100,000 in Iowa is 32.9%.
What is the Percentage of Households with Income Above $100,000 in the United States?
Percentage of Households with Income Above $100,000 in the United States is 37.3%.