Pleasanton, IA Map & Demographics
Pleasanton Map
Pleasanton Overview
$36,861
PER CAPITA INCOME
0.26
INEQUALITY / GINI INDEX
62
TOTAL POPULATION
25
MALE POPULATION
37
FEMALE POPULATION
67.57
MALES / 100 FEMALES
148.00
FEMALES / 100 MALES
50.9
MEDIAN AGE
2.3
AVG FAMILY SIZE
2.1
AVG HOUSEHOLD SIZE
24
LABOR FORCE [ PEOPLE ]
44.4%
PERCENT IN LABOR FORCE
Pleasanton Area Codes
Income in Pleasanton
Income Overview in Pleasanton
| Characteristic | Number | Measure |
| Per Capita Income | 62 | $36,861 |
| Median Family Income | 26 | $0 |
| Mean Family Income | 26 | $85,469 |
| Median Household Income | 29 | $0 |
| Mean Household Income | 29 | $78,848 |
| Income Deficit | 26 | $0 |
| Wage / Income Gap (%) | 62 | 0.00% |
| Wage / Income Gap ($) | 62 | 100.00¢ per $1 |
| Gini / Inequality Index | 62 | 0.26 |
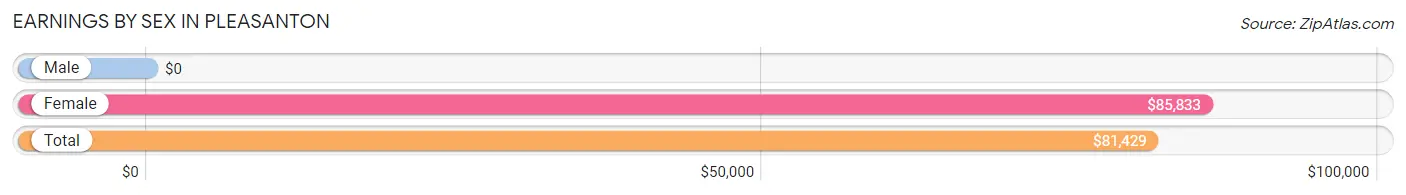
Earnings by Sex in Pleasanton
| Sex | Number | Average Earnings |
| Male | 12 (50.0%) | $0 |
| Female | 12 (50.0%) | $85,833 |
| Total | 24 (100.0%) | $81,429 |
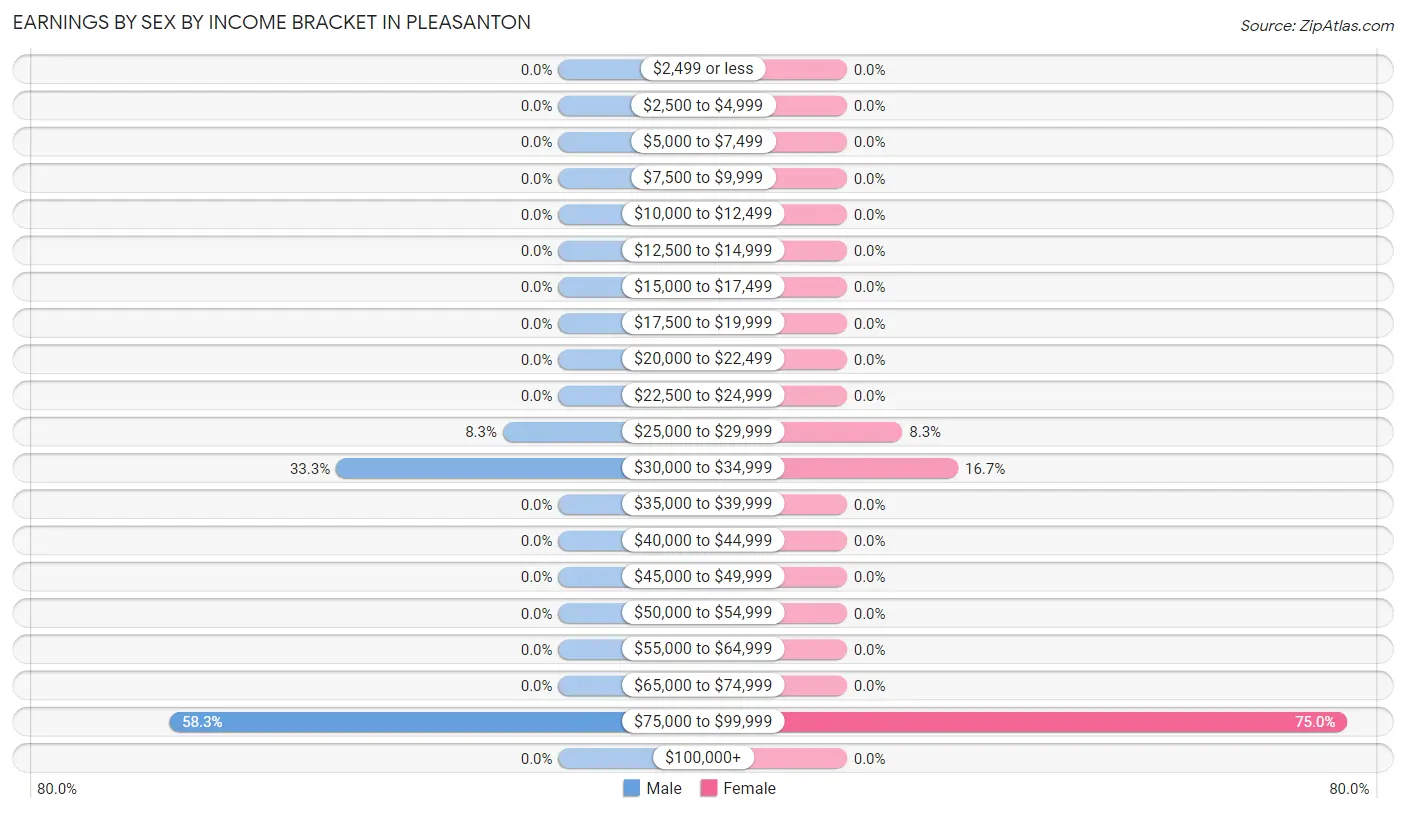
Earnings by Sex by Income Bracket in Pleasanton
The most common earnings brackets in Pleasanton are $75,000 to $99,999 for men (7 | 58.3%) and $75,000 to $99,999 for women (9 | 75.0%).
| Income | Male | Female |
| $2,499 or less | 0 (0.0%) | 0 (0.0%) |
| $2,500 to $4,999 | 0 (0.0%) | 0 (0.0%) |
| $5,000 to $7,499 | 0 (0.0%) | 0 (0.0%) |
| $7,500 to $9,999 | 0 (0.0%) | 0 (0.0%) |
| $10,000 to $12,499 | 0 (0.0%) | 0 (0.0%) |
| $12,500 to $14,999 | 0 (0.0%) | 0 (0.0%) |
| $15,000 to $17,499 | 0 (0.0%) | 0 (0.0%) |
| $17,500 to $19,999 | 0 (0.0%) | 0 (0.0%) |
| $20,000 to $22,499 | 0 (0.0%) | 0 (0.0%) |
| $22,500 to $24,999 | 0 (0.0%) | 0 (0.0%) |
| $25,000 to $29,999 | 1 (8.3%) | 1 (8.3%) |
| $30,000 to $34,999 | 4 (33.3%) | 2 (16.7%) |
| $35,000 to $39,999 | 0 (0.0%) | 0 (0.0%) |
| $40,000 to $44,999 | 0 (0.0%) | 0 (0.0%) |
| $45,000 to $49,999 | 0 (0.0%) | 0 (0.0%) |
| $50,000 to $54,999 | 0 (0.0%) | 0 (0.0%) |
| $55,000 to $64,999 | 0 (0.0%) | 0 (0.0%) |
| $65,000 to $74,999 | 0 (0.0%) | 0 (0.0%) |
| $75,000 to $99,999 | 7 (58.3%) | 9 (75.0%) |
| $100,000+ | 0 (0.0%) | 0 (0.0%) |
| Total | 12 (100.0%) | 12 (100.0%) |
Earnings by Sex by Educational Attainment in Pleasanton
| Educational Attainment | Male Income | Female Income |
| Less than High School | - | - |
| High School Diploma | - | - |
| College or Associate's Degree | - | - |
| Bachelor's Degree | - | - |
| Graduate Degree | - | - |
| Total | - | - |
Family Income in Pleasanton
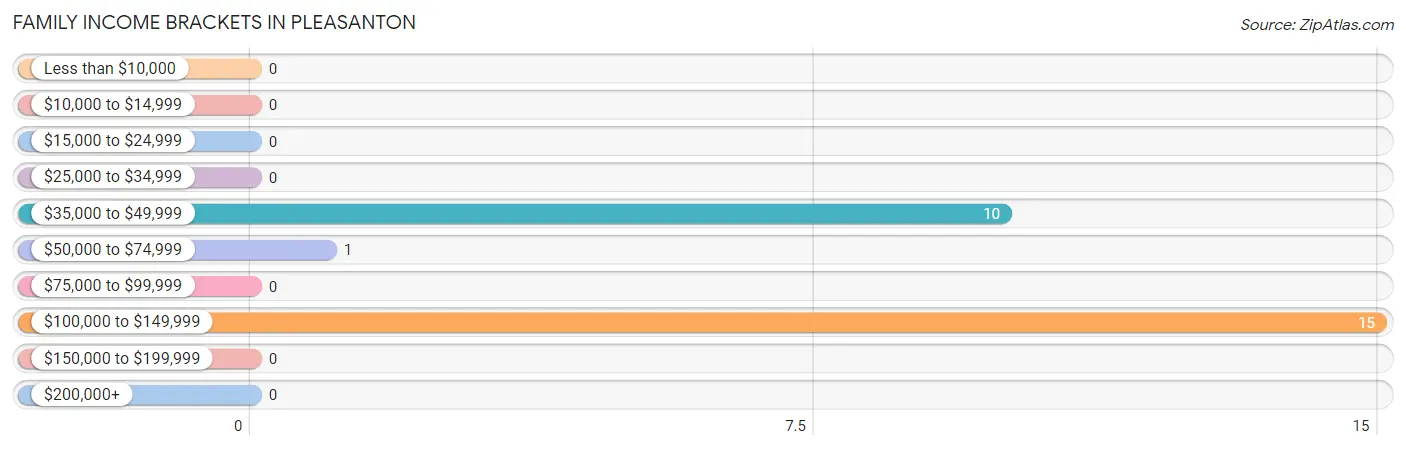
Family Income Brackets in Pleasanton
According to the Pleasanton family income data, there are 15 families falling into the $100,000 to $149,999 income range, which is the most common income bracket and makes up 57.7% of all families.
| Income Bracket | # Families | % Families |
| Less than $10,000 | 0 | 0.0% |
| $10,000 to $14,999 | 0 | 0.0% |
| $15,000 to $24,999 | 0 | 0.0% |
| $25,000 to $34,999 | 0 | 0.0% |
| $35,000 to $49,999 | 10 | 38.5% |
| $50,000 to $74,999 | 1 | 3.8% |
| $75,000 to $99,999 | 0 | 0.0% |
| $100,000 to $149,999 | 15 | 57.7% |
| $150,000 to $199,999 | 0 | 0.0% |
| $200,000+ | 0 | 0.0% |
Family Income by Famaliy Size in Pleasanton
| Income Bracket | # Families | Median Income |
| 2-Person Families | 19 (73.1%) | $0 |
| 3-Person Families | 6 (23.1%) | $0 |
| 4-Person Families | 1 (3.8%) | $0 |
| 5-Person Families | 0 (0.0%) | $0 |
| 6-Person Families | 0 (0.0%) | $0 |
| 7+ Person Families | 0 (0.0%) | $0 |
| Total | 26 (100.0%) | $0 |
Family Income by Number of Earners in Pleasanton
| Number of Earners | # Families | Median Income |
| No Earners | 8 (30.8%) | $0 |
| 1 Earner | 8 (30.8%) | $0 |
| 2 Earners | 10 (38.5%) | $0 |
| 3+ Earners | 0 (0.0%) | $0 |
| Total | 26 (100.0%) | $0 |
Household Income in Pleasanton
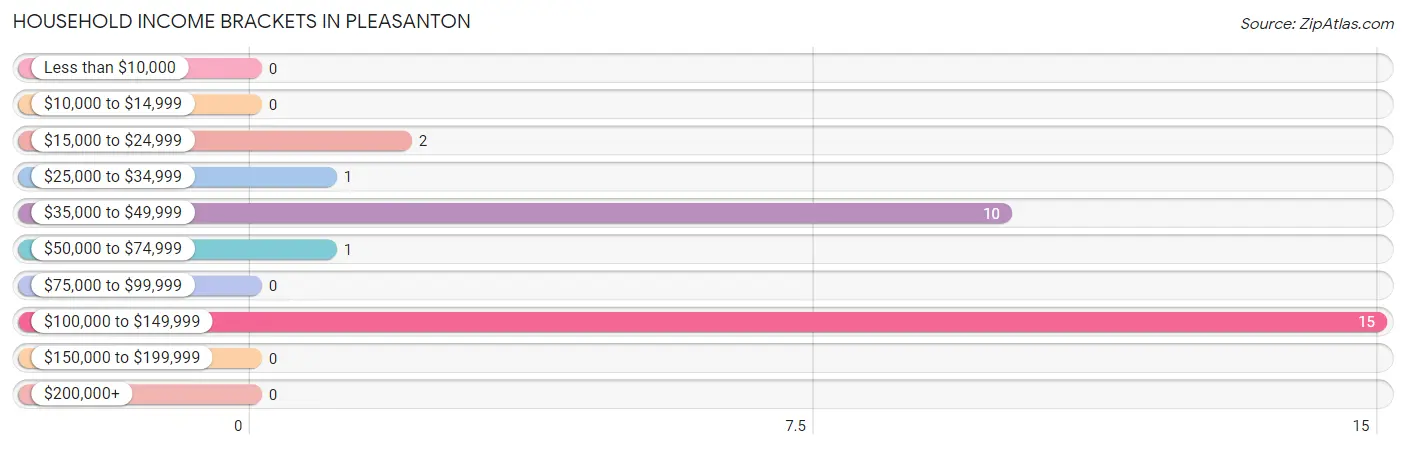
Household Income Brackets in Pleasanton
With 15 households falling in the category, the $100,000 to $149,999 income range is the most frequent in Pleasanton, accounting for 51.7% of all households.
| Income Bracket | # Households | % Households |
| Less than $10,000 | 0 | 0.0% |
| $10,000 to $14,999 | 0 | 0.0% |
| $15,000 to $24,999 | 2 | 6.9% |
| $25,000 to $34,999 | 1 | 3.4% |
| $35,000 to $49,999 | 10 | 34.5% |
| $50,000 to $74,999 | 1 | 3.4% |
| $75,000 to $99,999 | 0 | 0.0% |
| $100,000 to $149,999 | 15 | 51.7% |
| $150,000 to $199,999 | 0 | 0.0% |
| $200,000+ | 0 | 0.0% |
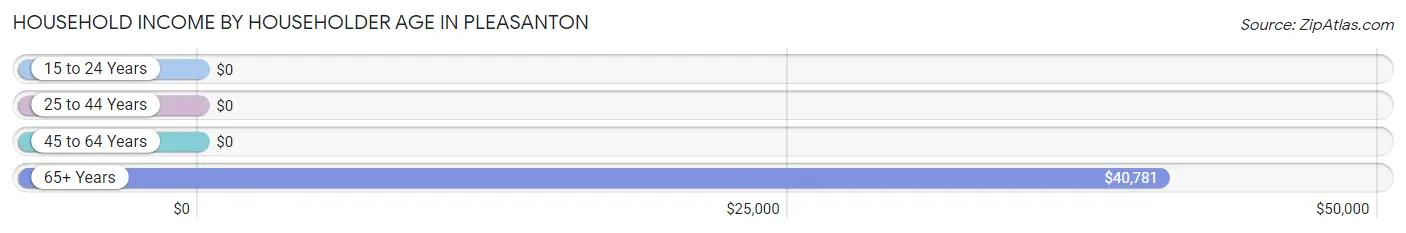
Household Income by Householder Age in Pleasanton
The median household income in Pleasanton is $0, with the highest median household income of $40,781 found in the 65+ years age bracket for the primary householder. A total of 11 households (37.9%) fall into this category.
| Income Bracket | # Households | Median Income |
| 15 to 24 Years | 0 (0.0%) | $0 |
| 25 to 44 Years | 7 (24.1%) | $0 |
| 45 to 64 Years | 11 (37.9%) | $0 |
| 65+ Years | 11 (37.9%) | $40,781 |
| Total | 29 (100.0%) | $0 |
Poverty in Pleasanton
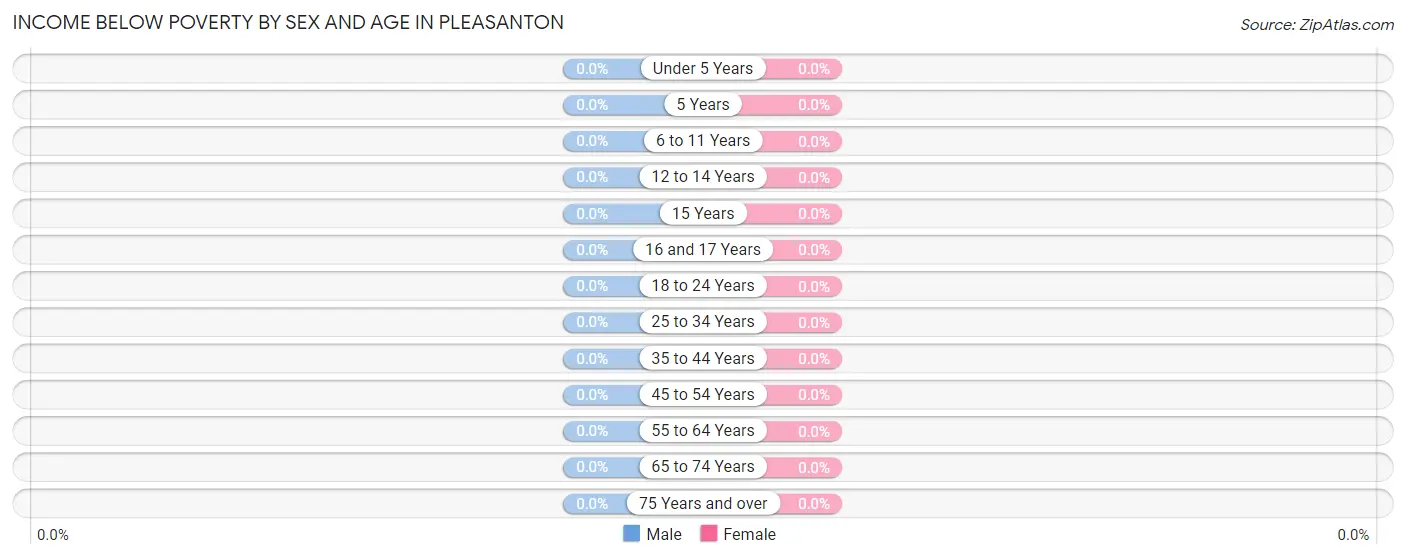
Income Below Poverty by Sex and Age in Pleasanton
| Age Bracket | Male | Female |
| Under 5 Years | 0 (0.0%) | 0 (0.0%) |
| 5 Years | 0 (0.0%) | 0 (0.0%) |
| 6 to 11 Years | 0 (0.0%) | 0 (0.0%) |
| 12 to 14 Years | 0 (0.0%) | 0 (0.0%) |
| 15 Years | 0 (0.0%) | 0 (0.0%) |
| 16 and 17 Years | 0 (0.0%) | 0 (0.0%) |
| 18 to 24 Years | 0 (0.0%) | 0 (0.0%) |
| 25 to 34 Years | 0 (0.0%) | 0 (0.0%) |
| 35 to 44 Years | 0 (0.0%) | 0 (0.0%) |
| 45 to 54 Years | 0 (0.0%) | 0 (0.0%) |
| 55 to 64 Years | 0 (0.0%) | 0 (0.0%) |
| 65 to 74 Years | 0 (0.0%) | 0 (0.0%) |
| 75 Years and over | 0 (0.0%) | 0 (0.0%) |
| Total | 0 (0.0%) | 0 (0.0%) |
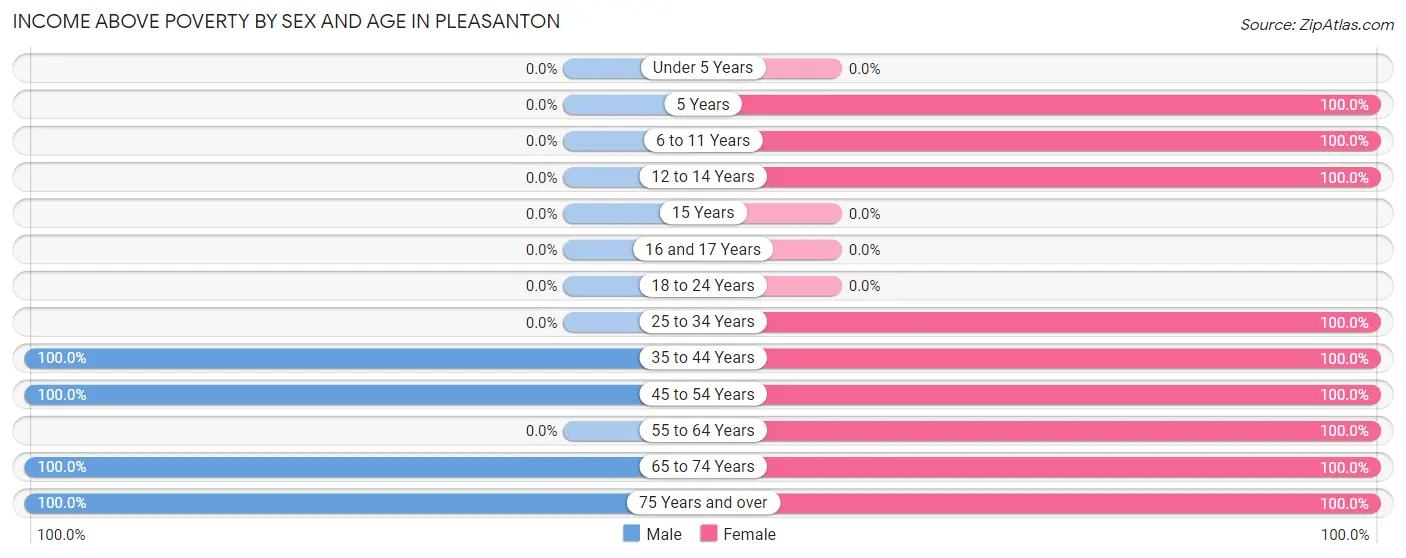
Income Above Poverty by Sex and Age in Pleasanton
According to the poverty statistics in Pleasanton, males aged 35 to 44 years and females aged 5 years are the age groups that are most secure financially, with 100.0% of males and 100.0% of females in these age groups living above the poverty line.
| Age Bracket | Male | Female |
| Under 5 Years | 0 (0.0%) | 0 (0.0%) |
| 5 Years | 0 (0.0%) | 6 (100.0%) |
| 6 to 11 Years | 0 (0.0%) | 1 (100.0%) |
| 12 to 14 Years | 0 (0.0%) | 1 (100.0%) |
| 15 Years | 0 (0.0%) | 0 (0.0%) |
| 16 and 17 Years | 0 (0.0%) | 0 (0.0%) |
| 18 to 24 Years | 0 (0.0%) | 0 (0.0%) |
| 25 to 34 Years | 0 (0.0%) | 6 (100.0%) |
| 35 to 44 Years | 8 (100.0%) | 1 (100.0%) |
| 45 to 54 Years | 4 (100.0%) | 9 (100.0%) |
| 55 to 64 Years | 0 (0.0%) | 2 (100.0%) |
| 65 to 74 Years | 3 (100.0%) | 8 (100.0%) |
| 75 Years and over | 10 (100.0%) | 3 (100.0%) |
| Total | 25 (100.0%) | 37 (100.0%) |
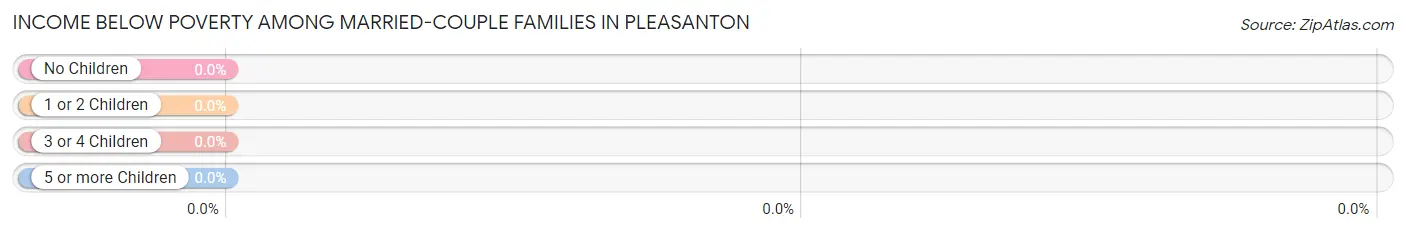
Income Below Poverty Among Married-Couple Families in Pleasanton
| Children | Above Poverty | Below Poverty |
| No Children | 19 (100.0%) | 0 (0.0%) |
| 1 or 2 Children | 7 (100.0%) | 0 (0.0%) |
| 3 or 4 Children | 0 (0.0%) | 0 (0.0%) |
| 5 or more Children | 0 (0.0%) | 0 (0.0%) |
| Total | 26 (100.0%) | 0 (0.0%) |
Income Below Poverty Among Single-Parent Households in Pleasanton
| Children | Single Father | Single Mother |
| No Children | 0 (0.0%) | 0 (0.0%) |
| 1 or 2 Children | 0 (0.0%) | 0 (0.0%) |
| 3 or 4 Children | 0 (0.0%) | 0 (0.0%) |
| 5 or more Children | 0 (0.0%) | 0 (0.0%) |
| Total | 0 (0.0%) | 0 (0.0%) |
Income Below Poverty Among Married-Couple vs Single-Parent Households in Pleasanton
| Children | Married-Couple Families | Single-Parent Households |
| No Children | 0 (0.0%) | 0 (0.0%) |
| 1 or 2 Children | 0 (0.0%) | 0 (0.0%) |
| 3 or 4 Children | 0 (0.0%) | 0 (0.0%) |
| 5 or more Children | 0 (0.0%) | 0 (0.0%) |
| Total | 0 (0.0%) | 0 (0.0%) |
Race in Pleasanton
The most populous races in Pleasanton are , and White / Caucasian (62 | 100.0%).
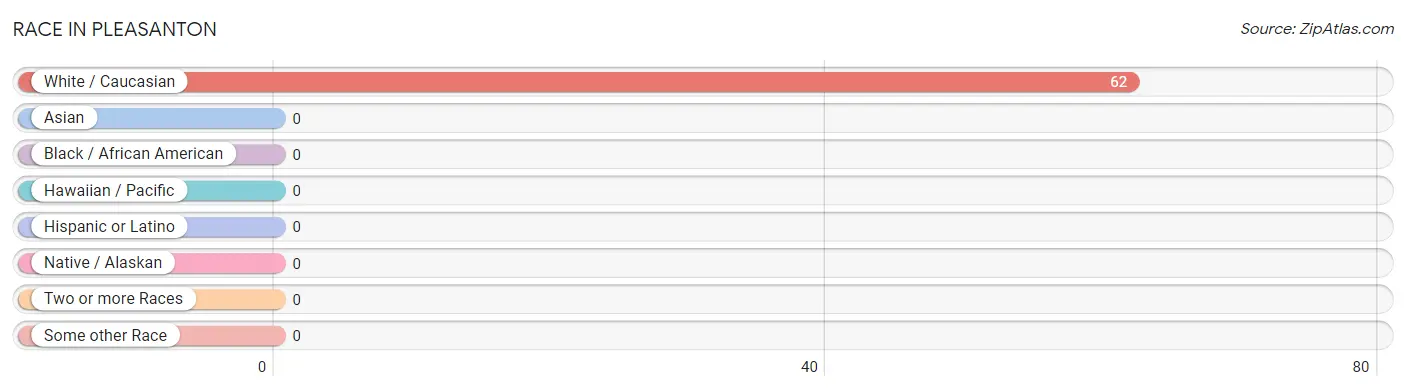
| Race | # Population | % Population |
| Asian | 0 | 0.0% |
| Black / African American | 0 | 0.0% |
| Hawaiian / Pacific | 0 | 0.0% |
| Hispanic or Latino | 0 | 0.0% |
| Native / Alaskan | 0 | 0.0% |
| White / Caucasian | 62 | 100.0% |
| Two or more Races | 0 | 0.0% |
| Some other Race | 0 | 0.0% |
| Total | 62 | 100.0% |
Ancestry in Pleasanton
The most populous ancestries reported in Pleasanton are Italian (15 | 24.2%), American (4 | 6.5%), Norwegian (3 | 4.8%), Polish (3 | 4.8%), and Czech (2 | 3.2%), together accounting for 43.5% of all Pleasanton residents.
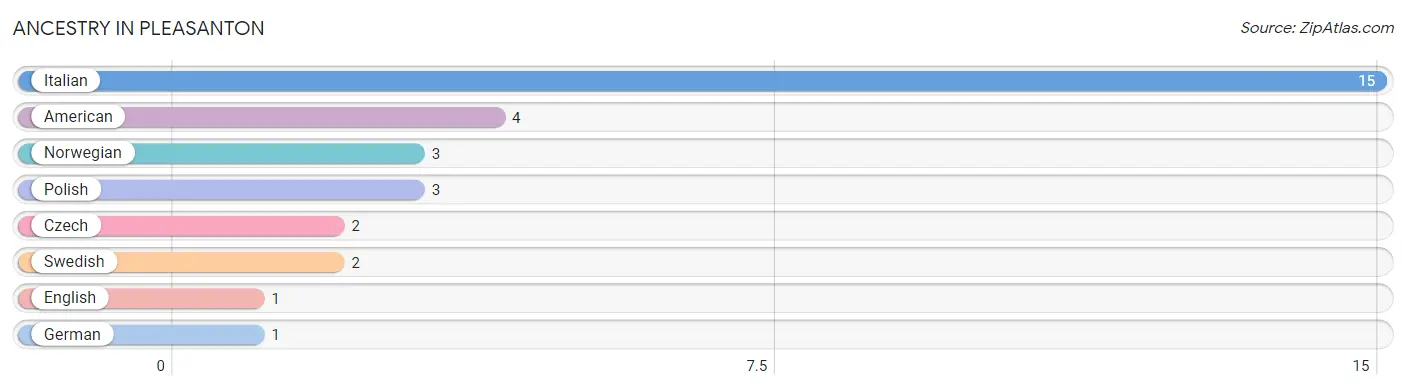
| Ancestry | # Population | % Population |
| American | 4 | 6.5% |
| Czech | 2 | 3.2% |
| English | 1 | 1.6% |
| German | 1 | 1.6% |
| Italian | 15 | 24.2% |
| Norwegian | 3 | 4.8% |
| Polish | 3 | 4.8% |
| Swedish | 2 | 3.2% | View All 8 Rows |
Immigrants in Pleasanton

| Immigration Origin | # Population | % Population | View All 0 Rows |
Sex and Age in Pleasanton
Sex and Age in Pleasanton
The most populous age groups in Pleasanton are 80 to 84 Years (10 | 40.0%) for men and 50 to 54 Years (9 | 24.3%) for women.
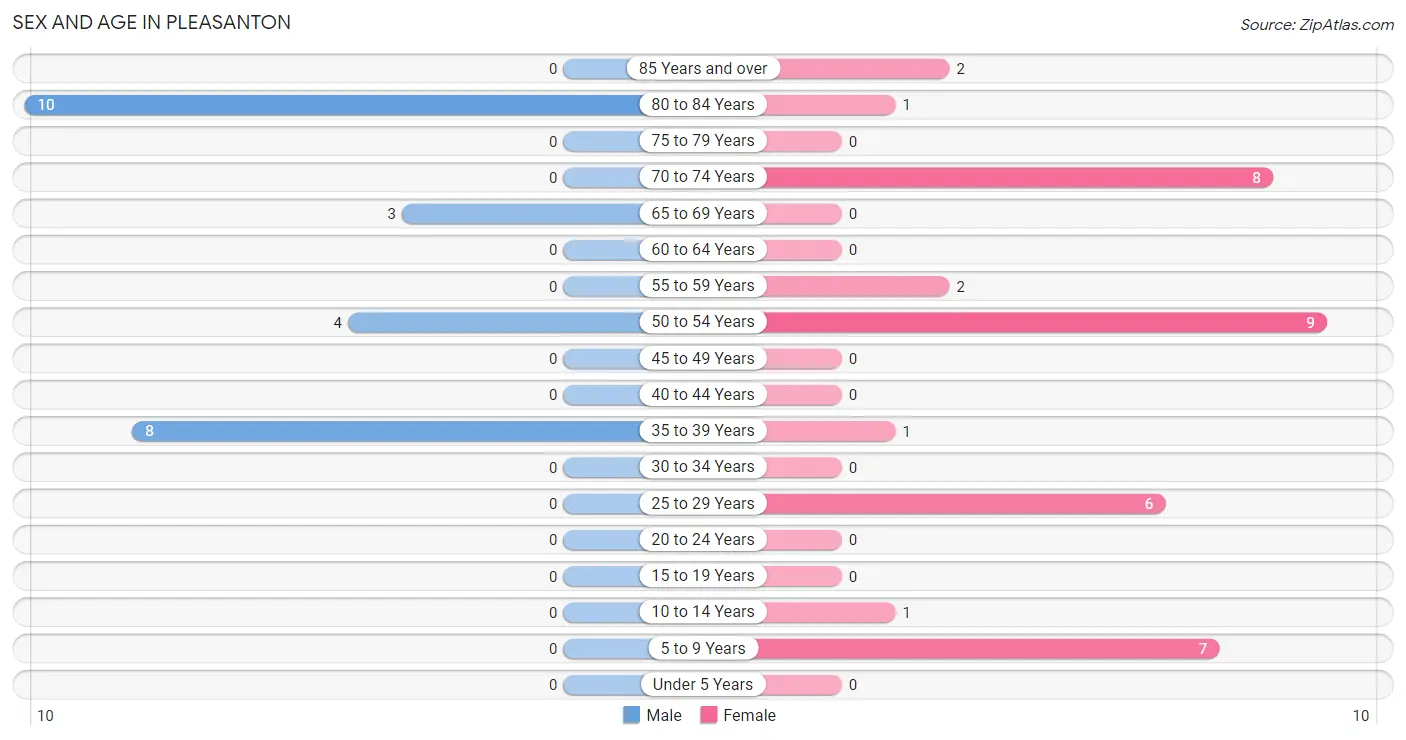
| Age Bracket | Male | Female |
| Under 5 Years | 0 (0.0%) | 0 (0.0%) |
| 5 to 9 Years | 0 (0.0%) | 7 (18.9%) |
| 10 to 14 Years | 0 (0.0%) | 1 (2.7%) |
| 15 to 19 Years | 0 (0.0%) | 0 (0.0%) |
| 20 to 24 Years | 0 (0.0%) | 0 (0.0%) |
| 25 to 29 Years | 0 (0.0%) | 6 (16.2%) |
| 30 to 34 Years | 0 (0.0%) | 0 (0.0%) |
| 35 to 39 Years | 8 (32.0%) | 1 (2.7%) |
| 40 to 44 Years | 0 (0.0%) | 0 (0.0%) |
| 45 to 49 Years | 0 (0.0%) | 0 (0.0%) |
| 50 to 54 Years | 4 (16.0%) | 9 (24.3%) |
| 55 to 59 Years | 0 (0.0%) | 2 (5.4%) |
| 60 to 64 Years | 0 (0.0%) | 0 (0.0%) |
| 65 to 69 Years | 3 (12.0%) | 0 (0.0%) |
| 70 to 74 Years | 0 (0.0%) | 8 (21.6%) |
| 75 to 79 Years | 0 (0.0%) | 0 (0.0%) |
| 80 to 84 Years | 10 (40.0%) | 1 (2.7%) |
| 85 Years and over | 0 (0.0%) | 2 (5.4%) |
| Total | 25 (100.0%) | 37 (100.0%) |
Families and Households in Pleasanton
Median Family Size in Pleasanton
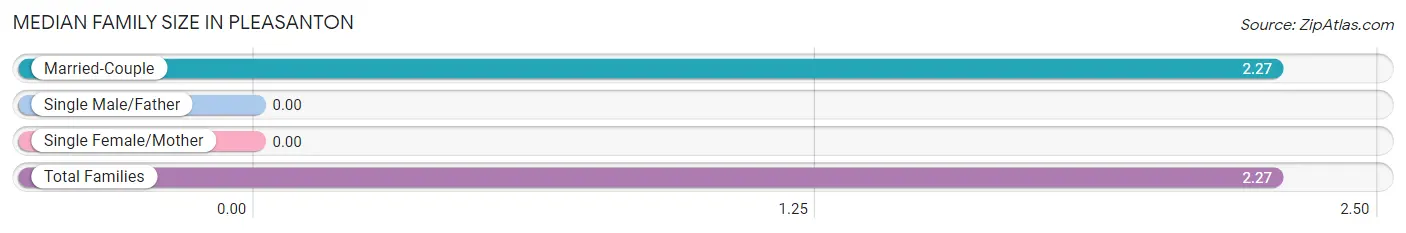
| Family Type | # Families | Family Size |
| Married-Couple | 26 (100.0%) | 2.27 |
| Single Male/Father | 0 (0.0%) | - |
| Single Female/Mother | 0 (0.0%) | - |
| Total Families | 26 (100.0%) | 2.27 |
Median Household Size in Pleasanton
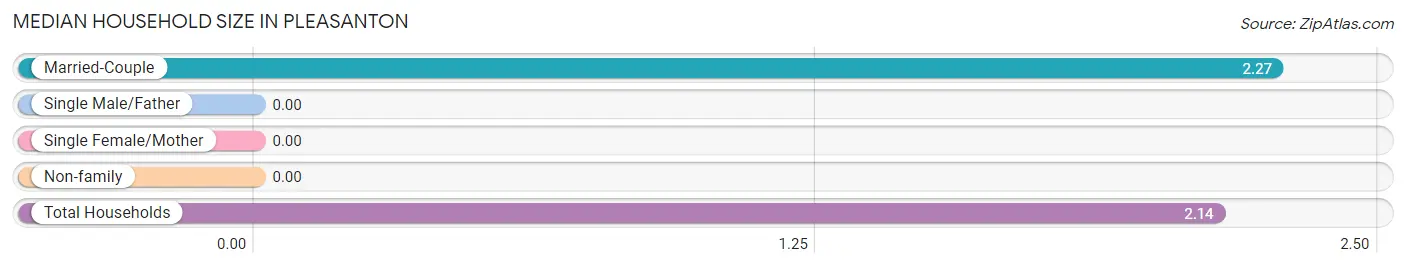
| Household Type | # Households | Household Size |
| Married-Couple | 26 (89.7%) | 2.27 |
| Single Male/Father | 0 (0.0%) | - |
| Single Female/Mother | 0 (0.0%) | - |
| Non-family | 3 (10.3%) | - |
| Total Households | 29 (100.0%) | 2.14 |
Household Size by Marriage Status in Pleasanton
Out of a total of 29 households in Pleasanton, 26 (89.7%) are family households, while 3 (10.3%) are nonfamily households. The most numerous type of family households are 2-person households, comprising 19, and the most common type of nonfamily households are 1-person households, comprising 3.
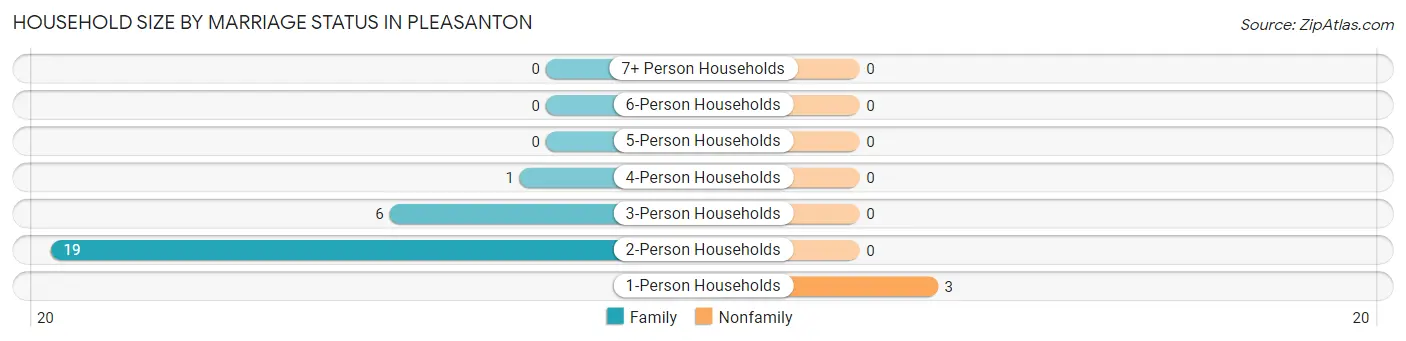
| Household Size | Family Households | Nonfamily Households |
| 1-Person Households | - | 3 (10.3%) |
| 2-Person Households | 19 (65.5%) | 0 (0.0%) |
| 3-Person Households | 6 (20.7%) | 0 (0.0%) |
| 4-Person Households | 1 (3.5%) | 0 (0.0%) |
| 5-Person Households | 0 (0.0%) | 0 (0.0%) |
| 6-Person Households | 0 (0.0%) | 0 (0.0%) |
| 7+ Person Households | 0 (0.0%) | 0 (0.0%) |
| Total | 26 (89.7%) | 3 (10.3%) |
Female Fertility in Pleasanton
Fertility by Age in Pleasanton
| Age Bracket | Women with Births | Births / 1,000 Women |
| 15 to 19 years | 0 (0.0%) | 0.0 |
| 20 to 34 years | 0 (0.0%) | 0.0 |
| 35 to 50 years | 0 (0.0%) | 0.0 |
| Total | 0 (0.0%) | 0.0 |
Fertility by Age by Marriage Status in Pleasanton
| Age Bracket | Married | Unmarried |
| 15 to 19 years | 0 (0.0%) | 0 (0.0%) |
| 20 to 34 years | 0 (0.0%) | 0 (0.0%) |
| 35 to 50 years | 0 (0.0%) | 0 (0.0%) |
| Total | 0 (0.0%) | 0 (0.0%) |
Fertility by Education in Pleasanton
| Educational Attainment | Women with Births | Births / 1,000 Women |
| Less than High School | 0 (0.0%) | 0.0 |
| High School Diploma | 0 (0.0%) | 0.0 |
| College or Associate's Degree | 0 (0.0%) | 0.0 |
| Bachelor's Degree | 0 (0.0%) | 0.0 |
| Graduate Degree | 0 (0.0%) | 0.0 |
| Total | 0 (0.0%) | 0.0 |
Fertility by Education by Marriage Status in Pleasanton
| Educational Attainment | Married | Unmarried |
| Less than High School | 0 (0.0%) | 0 (0.0%) |
| High School Diploma | 0 (0.0%) | 0 (0.0%) |
| College or Associate's Degree | 0 (0.0%) | 0 (0.0%) |
| Bachelor's Degree | 0 (0.0%) | 0 (0.0%) |
| Graduate Degree | 0 (0.0%) | 0 (0.0%) |
| Total | 0 (0.0%) | 0 (0.0%) |
Employment Characteristics in Pleasanton
Employment by Class of Employer in Pleasanton
Among the 24 employed individuals in Pleasanton, private company employees (17 | 70.8%), and federal government employees (7 | 29.2%) make up the most common classes of employment.
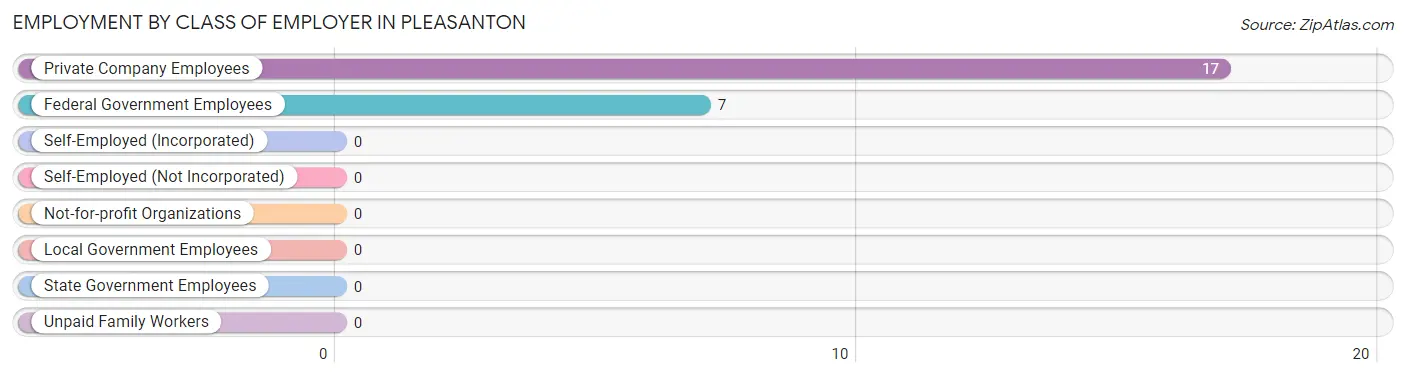
| Employer Class | # Employees | % Employees |
| Private Company Employees | 17 | 70.8% |
| Self-Employed (Incorporated) | 0 | 0.0% |
| Self-Employed (Not Incorporated) | 0 | 0.0% |
| Not-for-profit Organizations | 0 | 0.0% |
| Local Government Employees | 0 | 0.0% |
| State Government Employees | 0 | 0.0% |
| Federal Government Employees | 7 | 29.2% |
| Unpaid Family Workers | 0 | 0.0% |
| Total | 24 | 100.0% |
Employment Status by Age in Pleasanton
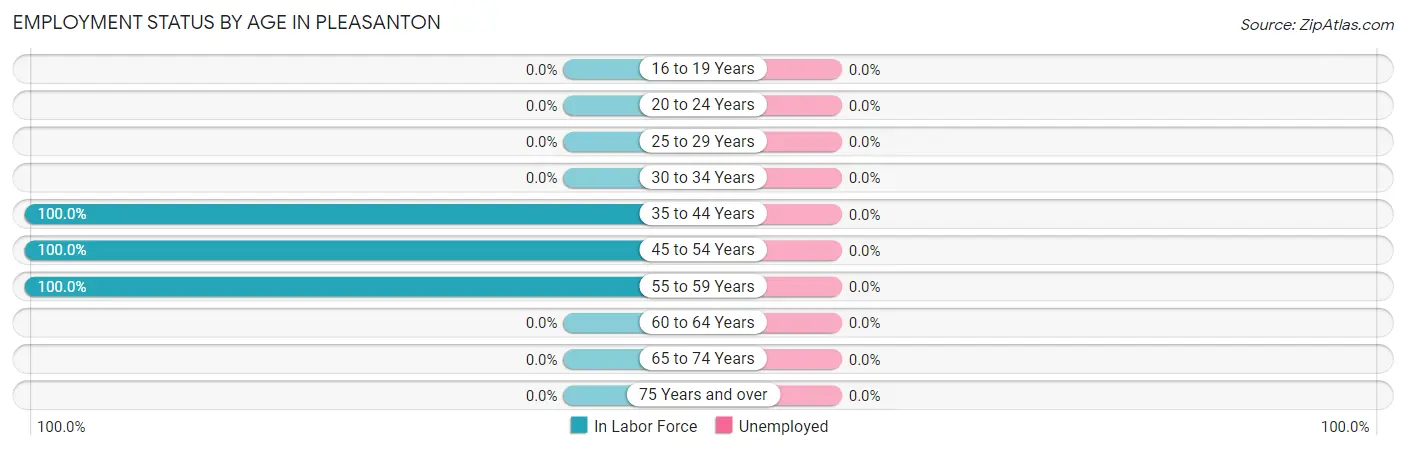
| Age Bracket | In Labor Force | Unemployed |
| 16 to 19 Years | 0 (0.0%) | 0 (0.0%) |
| 20 to 24 Years | 0 (0.0%) | 0 (0.0%) |
| 25 to 29 Years | 0 (0.0%) | 0 (0.0%) |
| 30 to 34 Years | 0 (0.0%) | 0 (0.0%) |
| 35 to 44 Years | 9 (100.0%) | 0 (0.0%) |
| 45 to 54 Years | 13 (100.0%) | 0 (0.0%) |
| 55 to 59 Years | 2 (100.0%) | 0 (0.0%) |
| 60 to 64 Years | 0 (0.0%) | 0 (0.0%) |
| 65 to 74 Years | 0 (0.0%) | 0 (0.0%) |
| 75 Years and over | 0 (0.0%) | 0 (0.0%) |
| Total | 24 (44.4%) | 0 (0.0%) |
Employment Status by Educational Attainment in Pleasanton
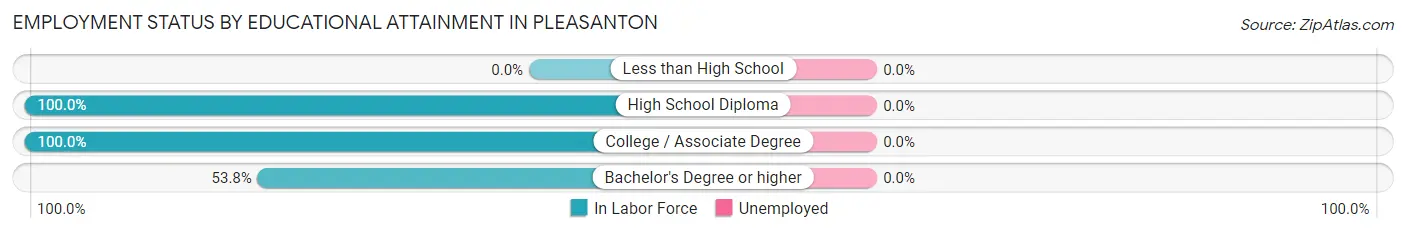
| Educational Attainment | In Labor Force | Unemployed |
| Less than High School | 0 (0.0%) | 0 (0.0%) |
| High School Diploma | 8 (100.0%) | 0 (0.0%) |
| College / Associate Degree | 9 (100.0%) | 0 (0.0%) |
| Bachelor's Degree or higher | 7 (53.8%) | 0 (0.0%) |
| Total | 24 (80.0%) | 0 (0.0%) |
Employment Occupations by Sex in Pleasanton
Management, Business, Science and Arts Occupations
The most common Management, Business, Science and Arts occupations in Pleasanton are Business & Financial (9 | 37.5%), and Management (7 | 29.2%).
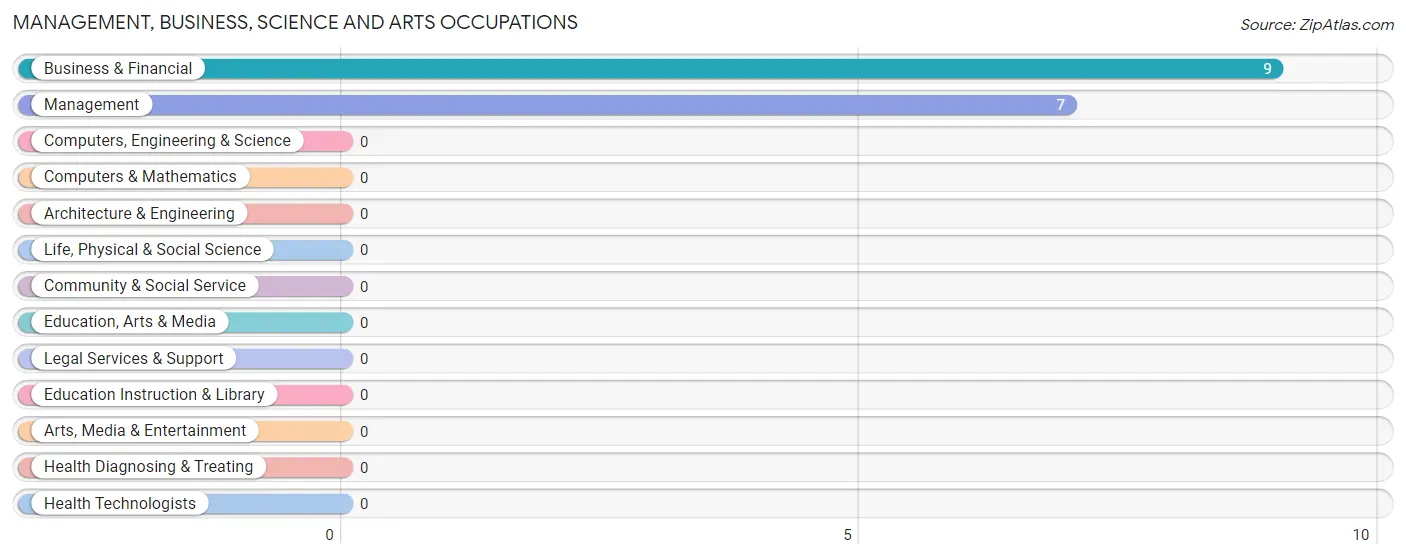
Management, Business, Science and Arts Occupations by Sex
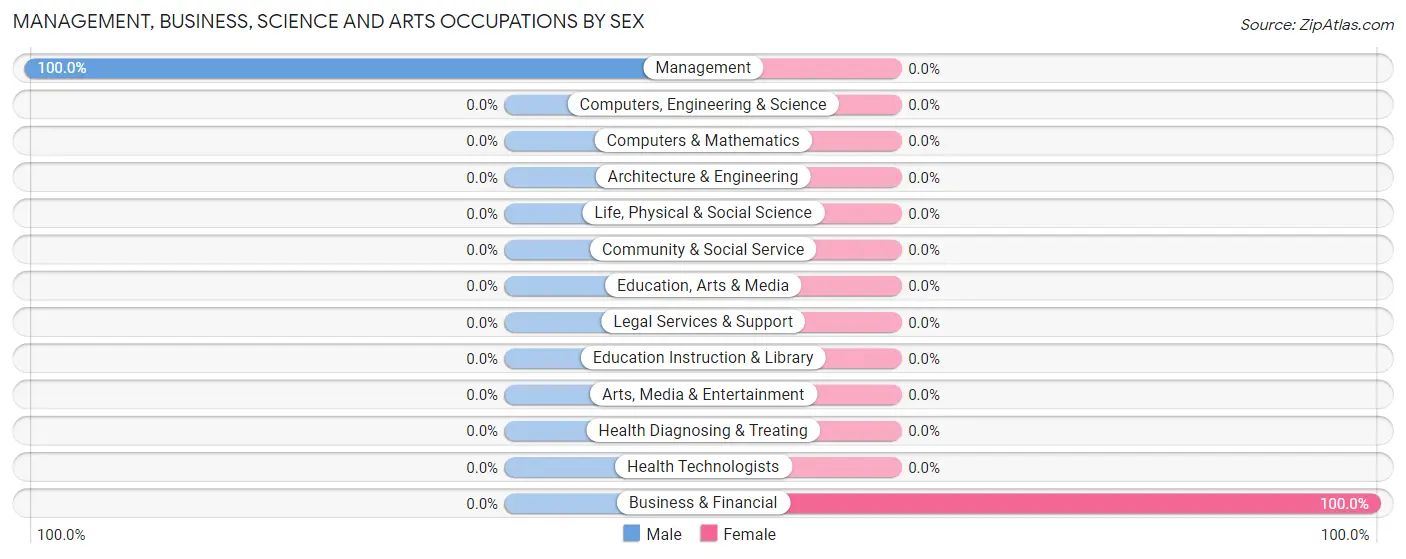
| Occupation | Male | Female |
| Management | 7 (100.0%) | 0 (0.0%) |
| Business & Financial | 0 (0.0%) | 9 (100.0%) |
| Computers, Engineering & Science | 0 (0.0%) | 0 (0.0%) |
| Computers & Mathematics | 0 (0.0%) | 0 (0.0%) |
| Architecture & Engineering | 0 (0.0%) | 0 (0.0%) |
| Life, Physical & Social Science | 0 (0.0%) | 0 (0.0%) |
| Community & Social Service | 0 (0.0%) | 0 (0.0%) |
| Education, Arts & Media | 0 (0.0%) | 0 (0.0%) |
| Legal Services & Support | 0 (0.0%) | 0 (0.0%) |
| Education Instruction & Library | 0 (0.0%) | 0 (0.0%) |
| Arts, Media & Entertainment | 0 (0.0%) | 0 (0.0%) |
| Health Diagnosing & Treating | 0 (0.0%) | 0 (0.0%) |
| Health Technologists | 0 (0.0%) | 0 (0.0%) |
| Total (Category) | 7 (43.8%) | 9 (56.2%) |
| Total (Overall) | 12 (50.0%) | 12 (50.0%) |
Services Occupations
Services Occupations by Sex
| Occupation | Male | Female |
| Healthcare Support | 0 (0.0%) | 0 (0.0%) |
| Security & Protection | 0 (0.0%) | 0 (0.0%) |
| Firefighting & Prevention | 0 (0.0%) | 0 (0.0%) |
| Law Enforcement | 0 (0.0%) | 0 (0.0%) |
| Food Preparation & Serving | 0 (0.0%) | 0 (0.0%) |
| Cleaning & Maintenance | 0 (0.0%) | 0 (0.0%) |
| Personal Care & Service | 0 (0.0%) | 0 (0.0%) |
| Total (Category) | 0 (0.0%) | 0 (0.0%) |
| Total (Overall) | 12 (50.0%) | 12 (50.0%) |
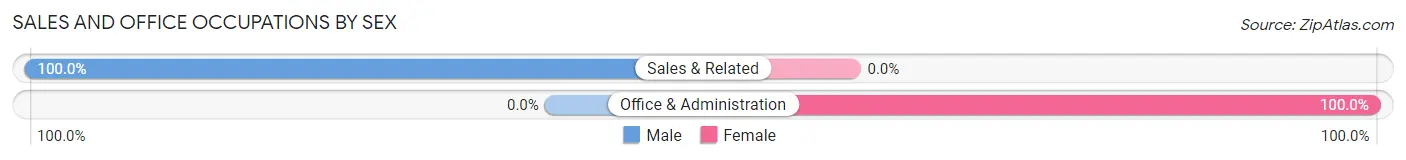
Sales and Office Occupations
The most common Sales and Office occupations in Pleasanton are Sales & Related (4 | 16.7%), and Office & Administration (3 | 12.5%).
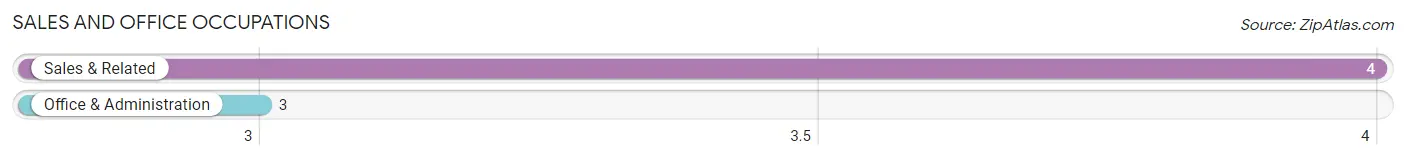
Sales and Office Occupations by Sex
| Occupation | Male | Female |
| Sales & Related | 4 (100.0%) | 0 (0.0%) |
| Office & Administration | 0 (0.0%) | 3 (100.0%) |
| Total (Category) | 4 (57.1%) | 3 (42.9%) |
| Total (Overall) | 12 (50.0%) | 12 (50.0%) |
Natural Resources, Construction and Maintenance Occupations
Natural Resources, Construction and Maintenance Occupations by Sex
| Occupation | Male | Female |
| Farming, Fishing & Forestry | 0 (0.0%) | 0 (0.0%) |
| Construction & Extraction | 0 (0.0%) | 0 (0.0%) |
| Installation, Maintenance & Repair | 0 (0.0%) | 0 (0.0%) |
| Total (Category) | 0 (0.0%) | 0 (0.0%) |
| Total (Overall) | 12 (50.0%) | 12 (50.0%) |
Production, Transportation and Moving Occupations
The most common Production, Transportation and Moving occupations in Pleasanton are , and Material Moving (1 | 4.2%).
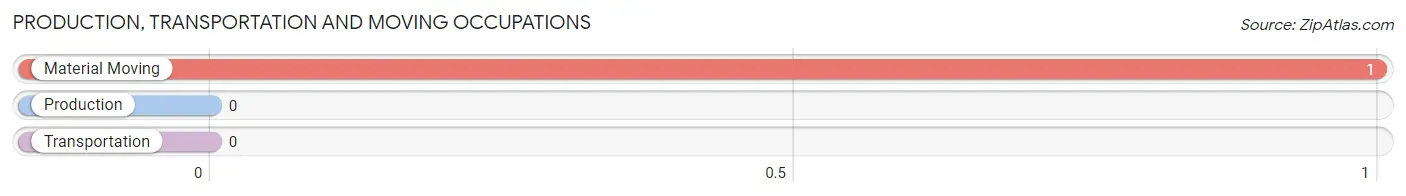
Production, Transportation and Moving Occupations by Sex
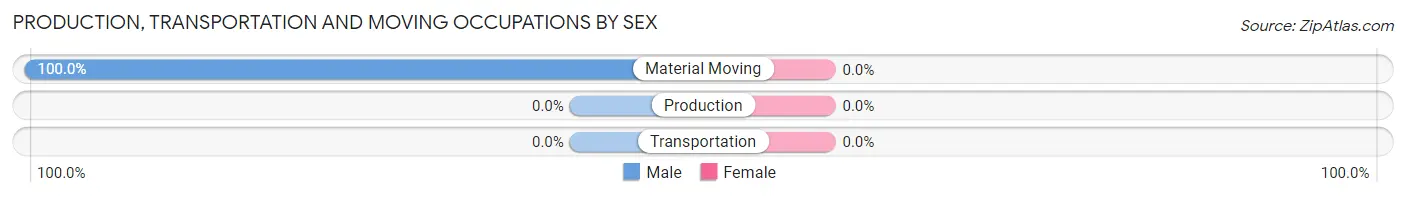
| Occupation | Male | Female |
| Production | 0 (0.0%) | 0 (0.0%) |
| Transportation | 0 (0.0%) | 0 (0.0%) |
| Material Moving | 1 (100.0%) | 0 (0.0%) |
| Total (Category) | 1 (100.0%) | 0 (0.0%) |
| Total (Overall) | 12 (50.0%) | 12 (50.0%) |
Employment Industries by Sex in Pleasanton
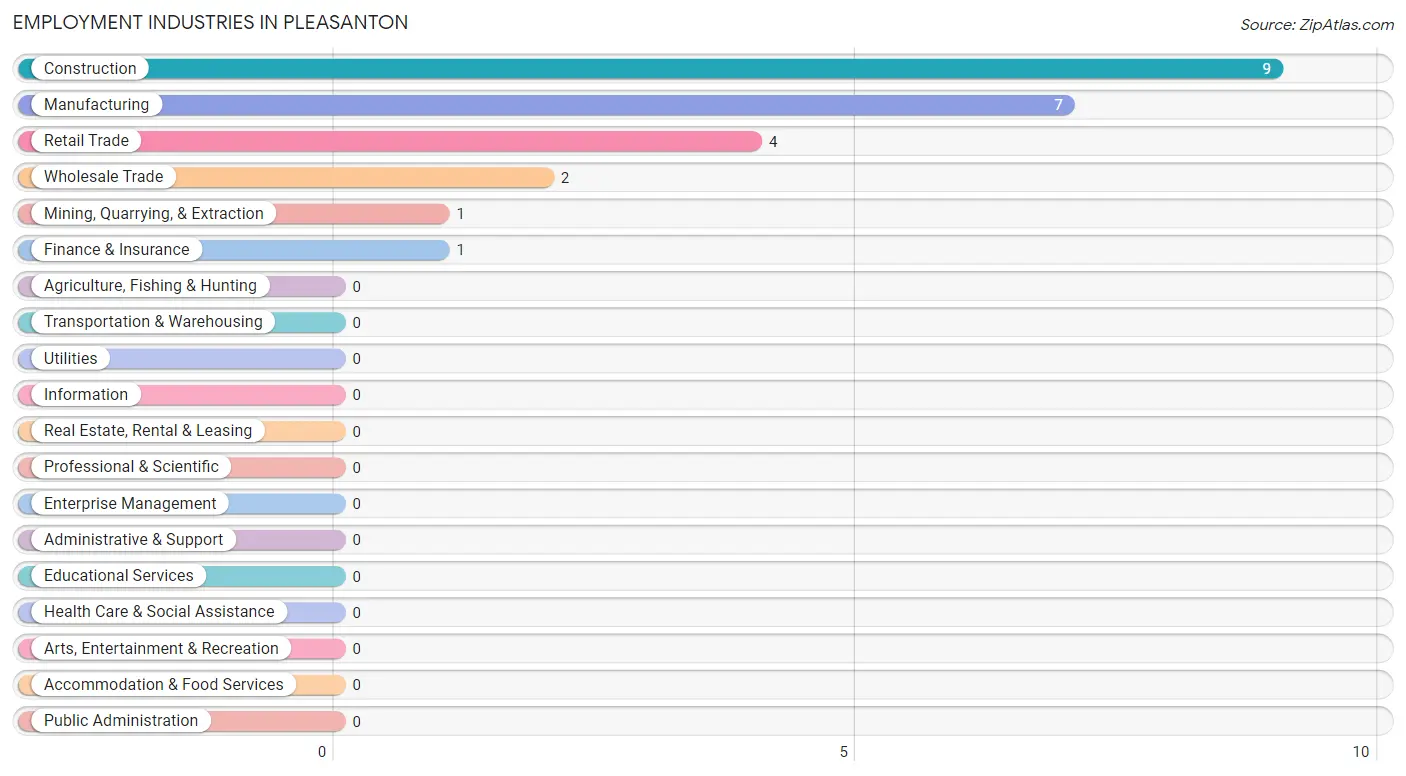
Employment Industries in Pleasanton
The major employment industries in Pleasanton include Construction (9 | 37.5%), Manufacturing (7 | 29.2%), Retail Trade (4 | 16.7%), Wholesale Trade (2 | 8.3%), and Mining, Quarrying, & Extraction (1 | 4.2%).
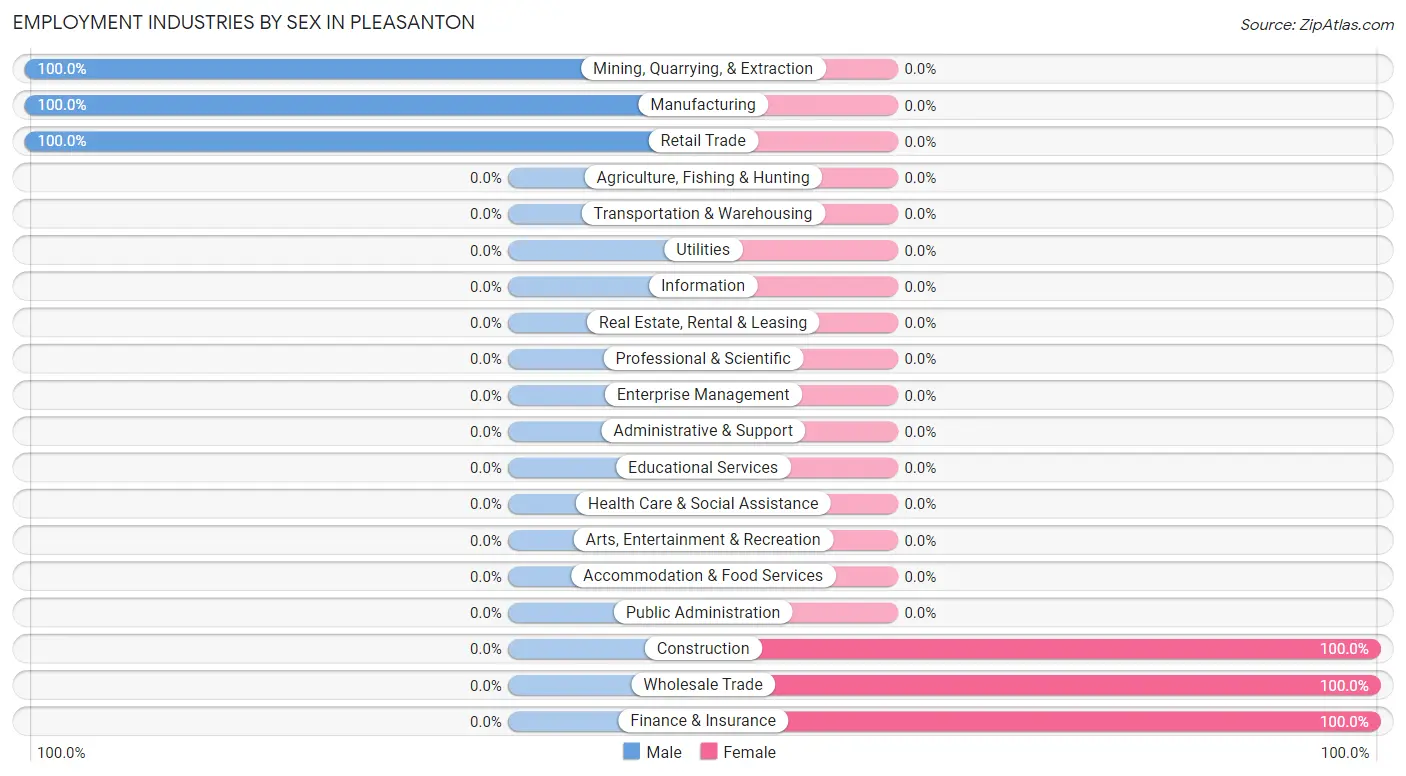
Employment Industries by Sex in Pleasanton
The Pleasanton industries that see more men than women are Mining, Quarrying, & Extraction (100.0%), Manufacturing (100.0%), and Retail Trade (100.0%), whereas the industries that tend to have a higher number of women are Construction (100.0%), Wholesale Trade (100.0%), and Finance & Insurance (100.0%).
| Industry | Male | Female |
| Agriculture, Fishing & Hunting | 0 (0.0%) | 0 (0.0%) |
| Mining, Quarrying, & Extraction | 1 (100.0%) | 0 (0.0%) |
| Construction | 0 (0.0%) | 9 (100.0%) |
| Manufacturing | 7 (100.0%) | 0 (0.0%) |
| Wholesale Trade | 0 (0.0%) | 2 (100.0%) |
| Retail Trade | 4 (100.0%) | 0 (0.0%) |
| Transportation & Warehousing | 0 (0.0%) | 0 (0.0%) |
| Utilities | 0 (0.0%) | 0 (0.0%) |
| Information | 0 (0.0%) | 0 (0.0%) |
| Finance & Insurance | 0 (0.0%) | 1 (100.0%) |
| Real Estate, Rental & Leasing | 0 (0.0%) | 0 (0.0%) |
| Professional & Scientific | 0 (0.0%) | 0 (0.0%) |
| Enterprise Management | 0 (0.0%) | 0 (0.0%) |
| Administrative & Support | 0 (0.0%) | 0 (0.0%) |
| Educational Services | 0 (0.0%) | 0 (0.0%) |
| Health Care & Social Assistance | 0 (0.0%) | 0 (0.0%) |
| Arts, Entertainment & Recreation | 0 (0.0%) | 0 (0.0%) |
| Accommodation & Food Services | 0 (0.0%) | 0 (0.0%) |
| Public Administration | 0 (0.0%) | 0 (0.0%) |
| Total | 12 (50.0%) | 12 (50.0%) |
Education in Pleasanton
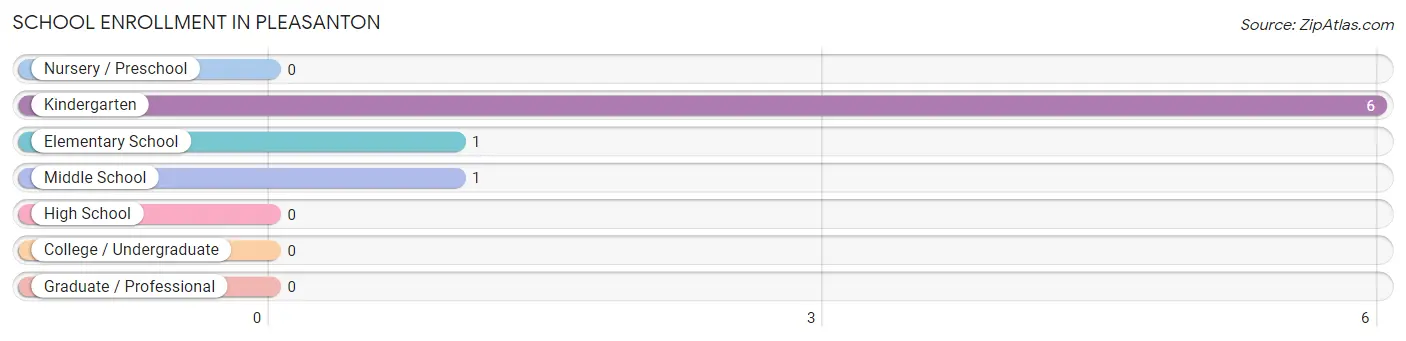
School Enrollment in Pleasanton
The most common levels of schooling among the 8 students in Pleasanton are kindergarten (6 | 75.0%), elementary school (1 | 12.5%), and middle school (1 | 12.5%).
| School Level | # Students | % Students |
| Nursery / Preschool | 0 | 0.0% |
| Kindergarten | 6 | 75.0% |
| Elementary School | 1 | 12.5% |
| Middle School | 1 | 12.5% |
| High School | 0 | 0.0% |
| College / Undergraduate | 0 | 0.0% |
| Graduate / Professional | 0 | 0.0% |
| Total | 8 | 100.0% |
School Enrollment by Age by Funding Source in Pleasanton
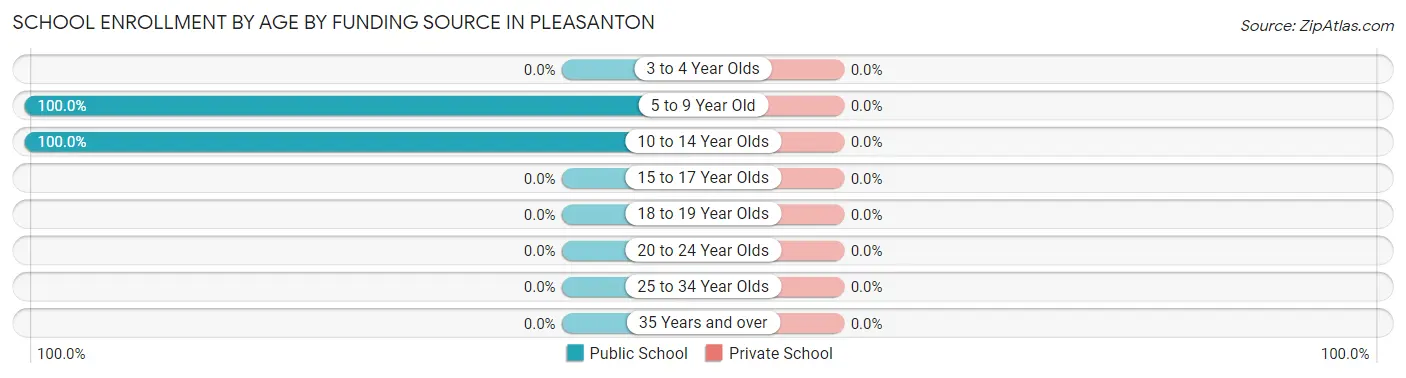
| Age Bracket | Public School | Private School |
| 3 to 4 Year Olds | 0 (0.0%) | 0 (0.0%) |
| 5 to 9 Year Old | 7 (100.0%) | 0 (0.0%) |
| 10 to 14 Year Olds | 1 (100.0%) | 0 (0.0%) |
| 15 to 17 Year Olds | 0 (0.0%) | 0 (0.0%) |
| 18 to 19 Year Olds | 0 (0.0%) | 0 (0.0%) |
| 20 to 24 Year Olds | 0 (0.0%) | 0 (0.0%) |
| 25 to 34 Year Olds | 0 (0.0%) | 0 (0.0%) |
| 35 Years and over | 0 (0.0%) | 0 (0.0%) |
| Total | 8 (100.0%) | 0 (0.0%) |
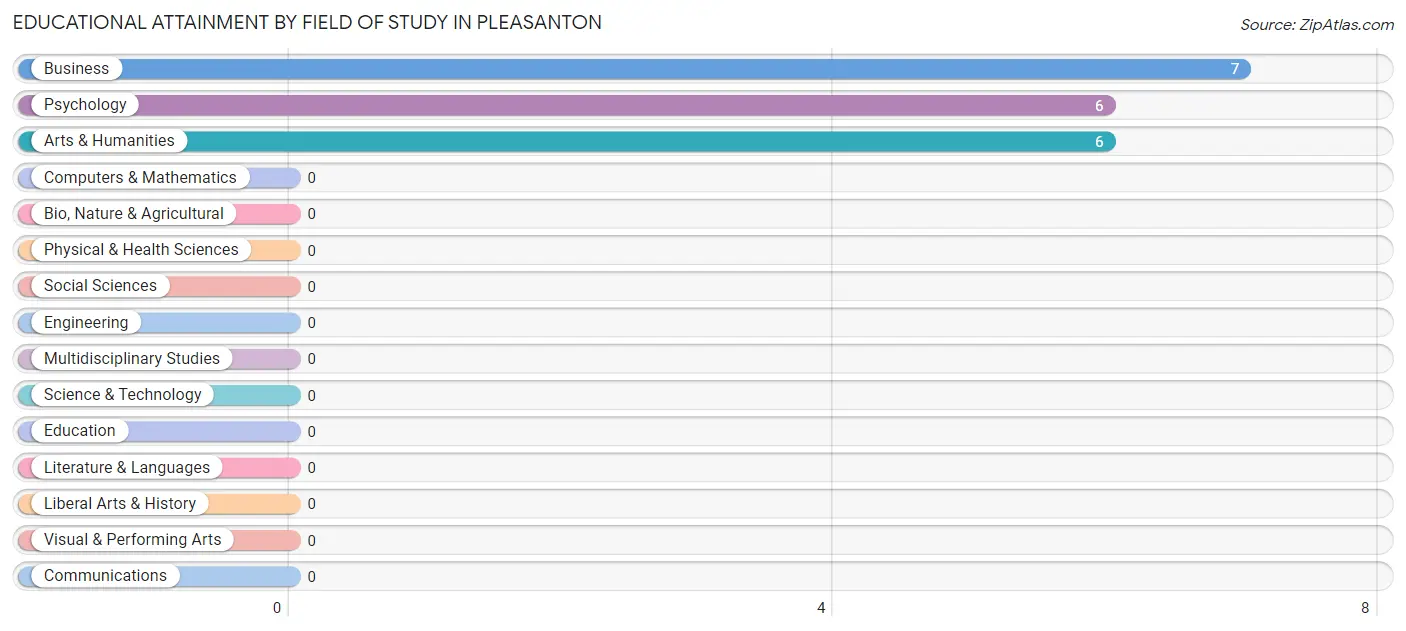
Educational Attainment by Field of Study in Pleasanton
Business (7 | 36.8%), psychology (6 | 31.6%), and arts & humanities (6 | 31.6%) are the most common fields of study among 19 individuals in Pleasanton who have obtained a bachelor's degree or higher.
| Field of Study | # Graduates | % Graduates |
| Computers & Mathematics | 0 | 0.0% |
| Bio, Nature & Agricultural | 0 | 0.0% |
| Physical & Health Sciences | 0 | 0.0% |
| Psychology | 6 | 31.6% |
| Social Sciences | 0 | 0.0% |
| Engineering | 0 | 0.0% |
| Multidisciplinary Studies | 0 | 0.0% |
| Science & Technology | 0 | 0.0% |
| Business | 7 | 36.8% |
| Education | 0 | 0.0% |
| Literature & Languages | 0 | 0.0% |
| Liberal Arts & History | 0 | 0.0% |
| Visual & Performing Arts | 0 | 0.0% |
| Communications | 0 | 0.0% |
| Arts & Humanities | 6 | 31.6% |
| Total | 19 | 100.0% |
Transportation & Commute in Pleasanton
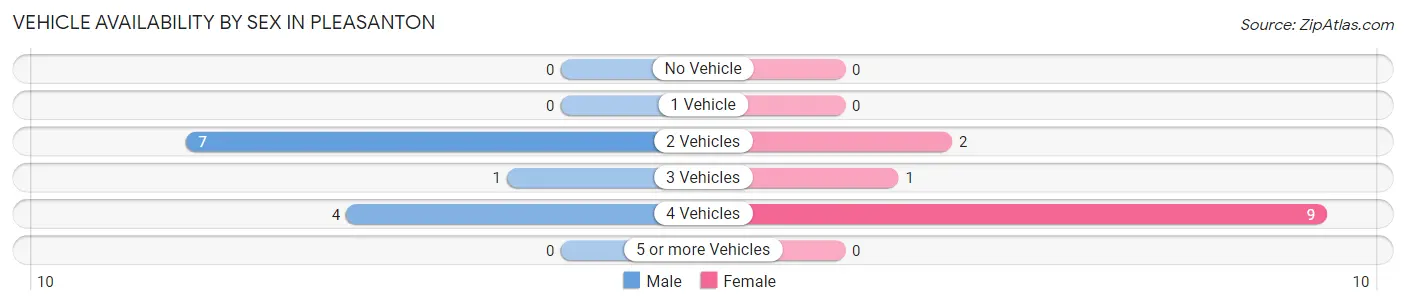
Vehicle Availability by Sex in Pleasanton
The most prevalent vehicle ownership categories in Pleasanton are males with 2 vehicles (7, accounting for 58.3%) and females with 2 vehicles (2, making up 58.3%).
| Vehicles Available | Male | Female |
| No Vehicle | 0 (0.0%) | 0 (0.0%) |
| 1 Vehicle | 0 (0.0%) | 0 (0.0%) |
| 2 Vehicles | 7 (58.3%) | 2 (16.7%) |
| 3 Vehicles | 1 (8.3%) | 1 (8.3%) |
| 4 Vehicles | 4 (33.3%) | 9 (75.0%) |
| 5 or more Vehicles | 0 (0.0%) | 0 (0.0%) |
| Total | 12 (100.0%) | 12 (100.0%) |
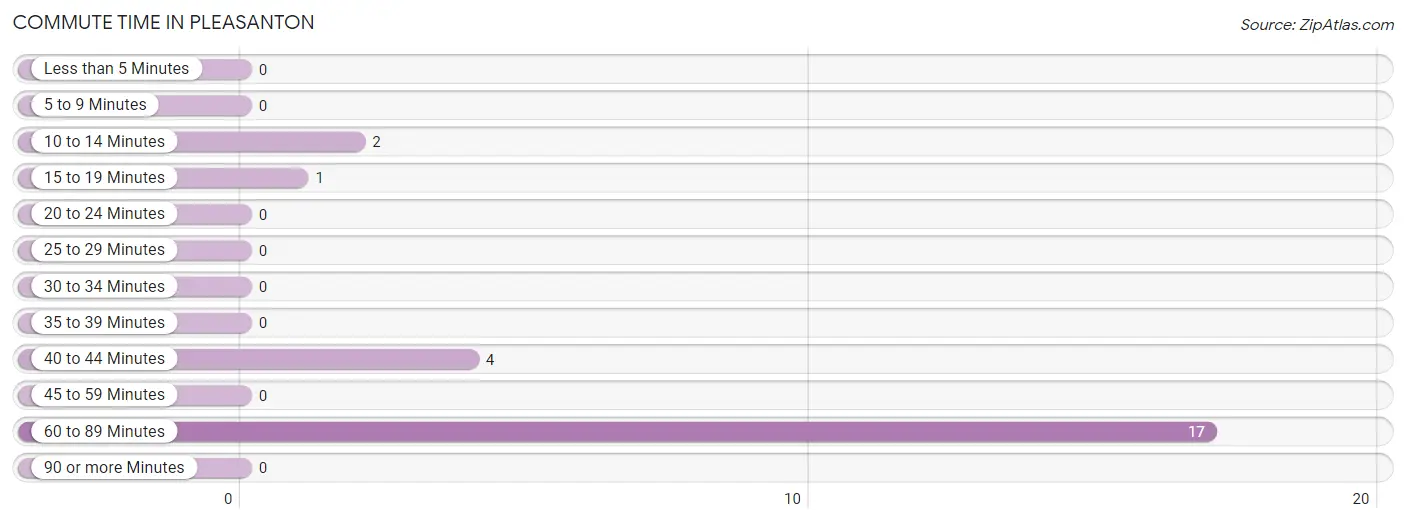
Commute Time in Pleasanton
The most frequently occuring commute durations in Pleasanton are 60 to 89 minutes (17 commuters, 70.8%), 40 to 44 minutes (4 commuters, 16.7%), and 10 to 14 minutes (2 commuters, 8.3%).
| Commute Time | # Commuters | % Commuters |
| Less than 5 Minutes | 0 | 0.0% |
| 5 to 9 Minutes | 0 | 0.0% |
| 10 to 14 Minutes | 2 | 8.3% |
| 15 to 19 Minutes | 1 | 4.2% |
| 20 to 24 Minutes | 0 | 0.0% |
| 25 to 29 Minutes | 0 | 0.0% |
| 30 to 34 Minutes | 0 | 0.0% |
| 35 to 39 Minutes | 0 | 0.0% |
| 40 to 44 Minutes | 4 | 16.7% |
| 45 to 59 Minutes | 0 | 0.0% |
| 60 to 89 Minutes | 17 | 70.8% |
| 90 or more Minutes | 0 | 0.0% |
Commute Time by Sex in Pleasanton
The most common commute times in Pleasanton are 60 to 89 minutes (8 commuters, 66.7%) for males and 60 to 89 minutes (9 commuters, 75.0%) for females.
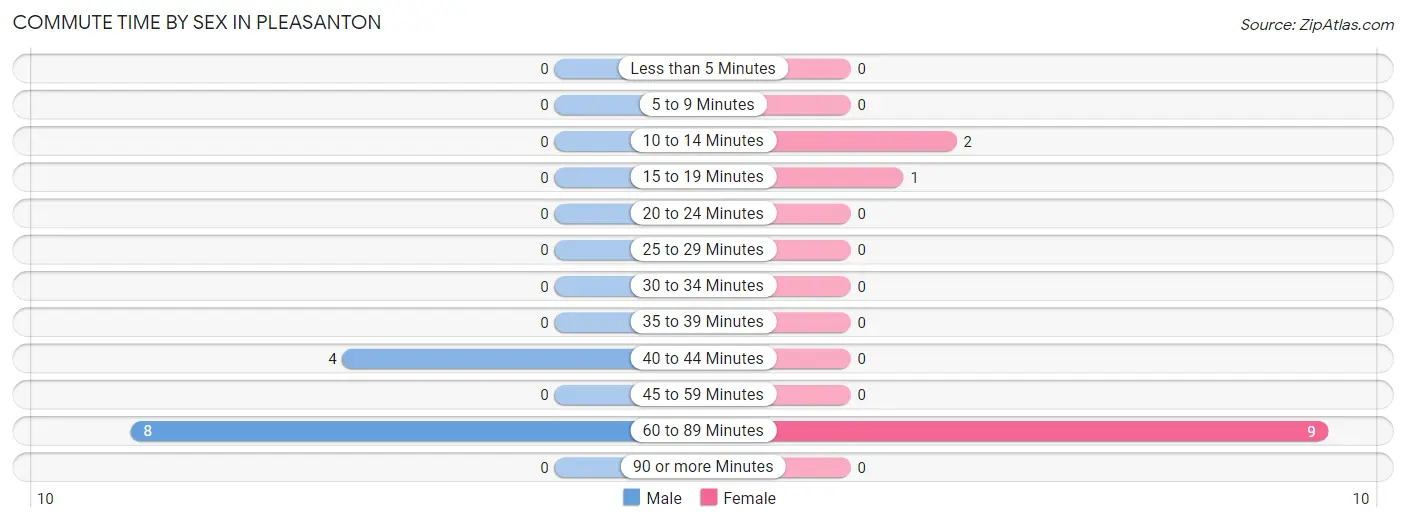
| Commute Time | Male | Female |
| Less than 5 Minutes | 0 (0.0%) | 0 (0.0%) |
| 5 to 9 Minutes | 0 (0.0%) | 0 (0.0%) |
| 10 to 14 Minutes | 0 (0.0%) | 2 (16.7%) |
| 15 to 19 Minutes | 0 (0.0%) | 1 (8.3%) |
| 20 to 24 Minutes | 0 (0.0%) | 0 (0.0%) |
| 25 to 29 Minutes | 0 (0.0%) | 0 (0.0%) |
| 30 to 34 Minutes | 0 (0.0%) | 0 (0.0%) |
| 35 to 39 Minutes | 0 (0.0%) | 0 (0.0%) |
| 40 to 44 Minutes | 4 (33.3%) | 0 (0.0%) |
| 45 to 59 Minutes | 0 (0.0%) | 0 (0.0%) |
| 60 to 89 Minutes | 8 (66.7%) | 9 (75.0%) |
| 90 or more Minutes | 0 (0.0%) | 0 (0.0%) |
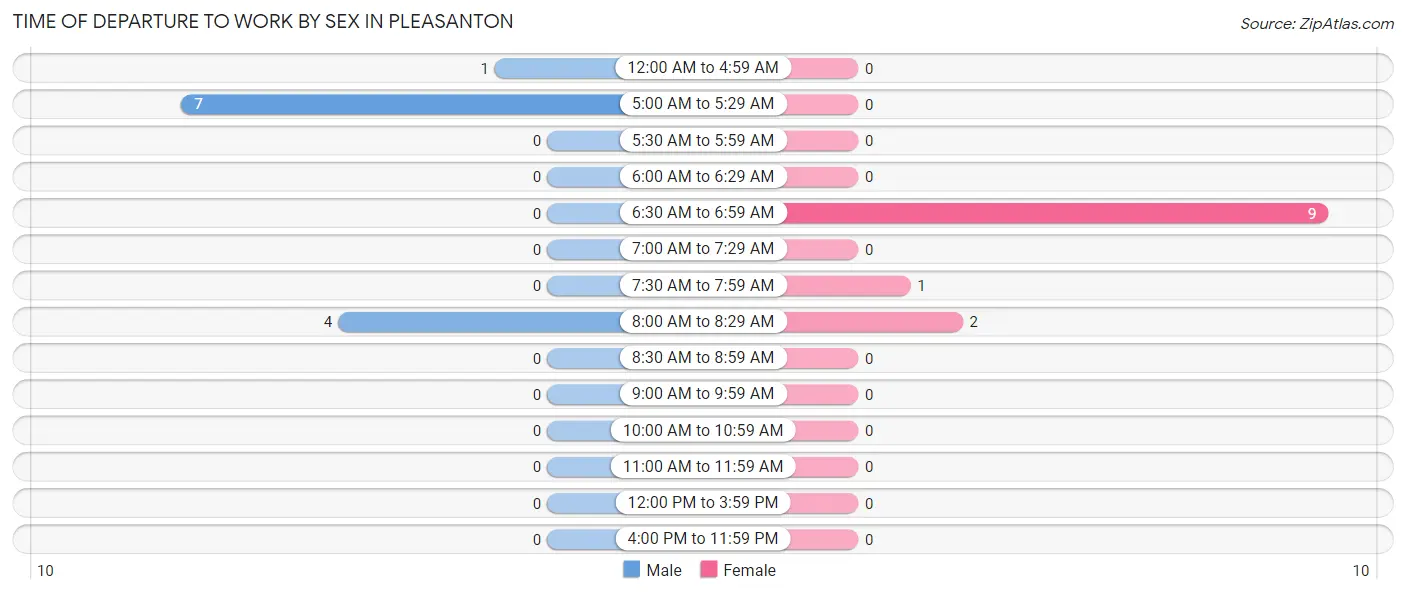
Time of Departure to Work by Sex in Pleasanton
The most frequent times of departure to work in Pleasanton are 5:00 AM to 5:29 AM (7, 58.3%) for males and 6:30 AM to 6:59 AM (9, 75.0%) for females.
| Time of Departure | Male | Female |
| 12:00 AM to 4:59 AM | 1 (8.3%) | 0 (0.0%) |
| 5:00 AM to 5:29 AM | 7 (58.3%) | 0 (0.0%) |
| 5:30 AM to 5:59 AM | 0 (0.0%) | 0 (0.0%) |
| 6:00 AM to 6:29 AM | 0 (0.0%) | 0 (0.0%) |
| 6:30 AM to 6:59 AM | 0 (0.0%) | 9 (75.0%) |
| 7:00 AM to 7:29 AM | 0 (0.0%) | 0 (0.0%) |
| 7:30 AM to 7:59 AM | 0 (0.0%) | 1 (8.3%) |
| 8:00 AM to 8:29 AM | 4 (33.3%) | 2 (16.7%) |
| 8:30 AM to 8:59 AM | 0 (0.0%) | 0 (0.0%) |
| 9:00 AM to 9:59 AM | 0 (0.0%) | 0 (0.0%) |
| 10:00 AM to 10:59 AM | 0 (0.0%) | 0 (0.0%) |
| 11:00 AM to 11:59 AM | 0 (0.0%) | 0 (0.0%) |
| 12:00 PM to 3:59 PM | 0 (0.0%) | 0 (0.0%) |
| 4:00 PM to 11:59 PM | 0 (0.0%) | 0 (0.0%) |
| Total | 12 (100.0%) | 12 (100.0%) |
Housing Occupancy in Pleasanton
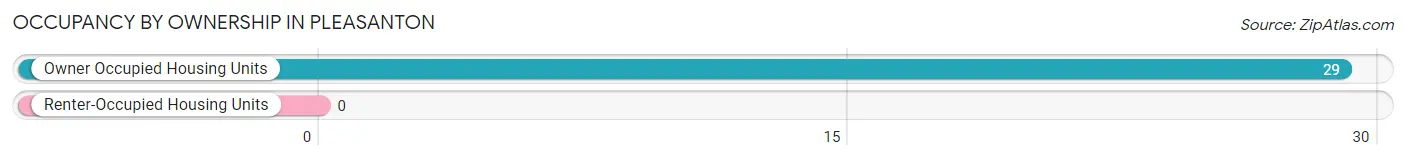
Occupancy by Ownership in Pleasanton
Of the total 29 dwellings in Pleasanton, owner-occupied units account for 29 (100.0%), while renter-occupied units make up 0 (0.0%).
| Occupancy | # Housing Units | % Housing Units |
| Owner Occupied Housing Units | 29 | 100.0% |
| Renter-Occupied Housing Units | 0 | 0.0% |
| Total Occupied Housing Units | 29 | 100.0% |
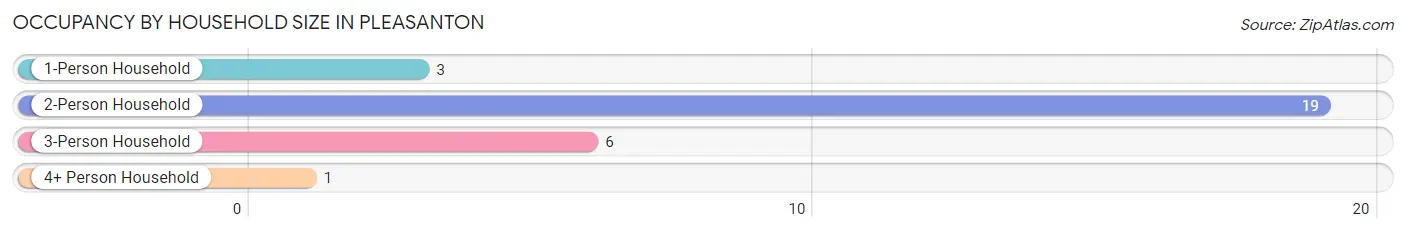
Occupancy by Household Size in Pleasanton
| Household Size | # Housing Units | % Housing Units |
| 1-Person Household | 3 | 10.3% |
| 2-Person Household | 19 | 65.5% |
| 3-Person Household | 6 | 20.7% |
| 4+ Person Household | 1 | 3.5% |
| Total Housing Units | 29 | 100.0% |
Occupancy by Ownership by Household Size in Pleasanton
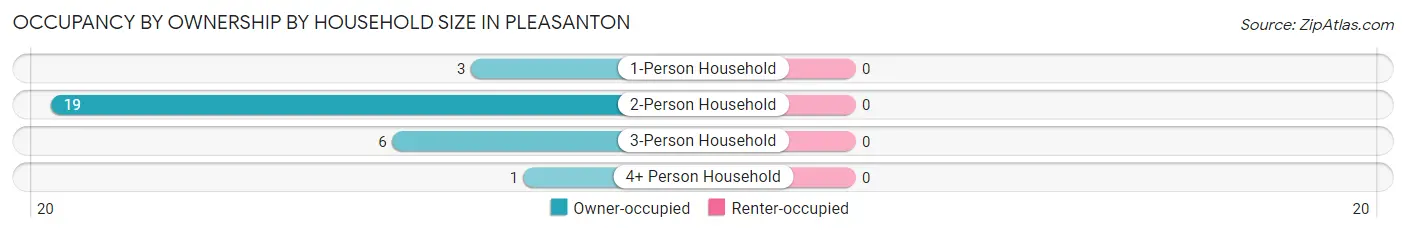
| Household Size | Owner-occupied | Renter-occupied |
| 1-Person Household | 3 (100.0%) | 0 (0.0%) |
| 2-Person Household | 19 (100.0%) | 0 (0.0%) |
| 3-Person Household | 6 (100.0%) | 0 (0.0%) |
| 4+ Person Household | 1 (100.0%) | 0 (0.0%) |
| Total Housing Units | 29 (100.0%) | 0 (0.0%) |
Occupancy by Educational Attainment in Pleasanton
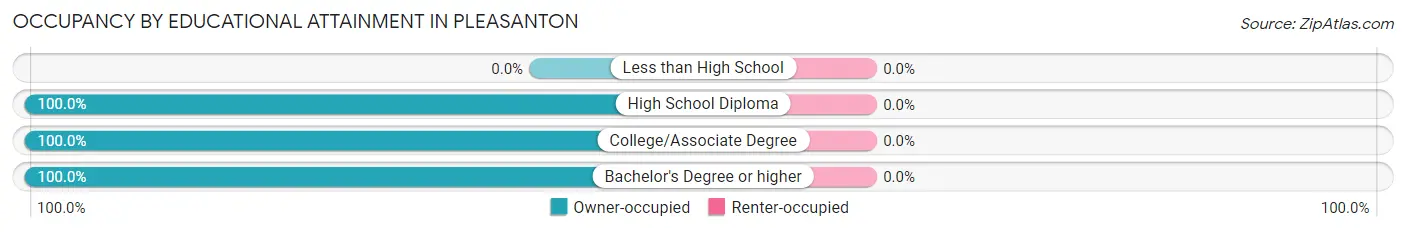
| Household Size | Owner-occupied | Renter-occupied |
| Less than High School | 0 (0.0%) | 0 (0.0%) |
| High School Diploma | 5 (100.0%) | 0 (0.0%) |
| College/Associate Degree | 18 (100.0%) | 0 (0.0%) |
| Bachelor's Degree or higher | 6 (100.0%) | 0 (0.0%) |
Occupancy by Age of Householder in Pleasanton
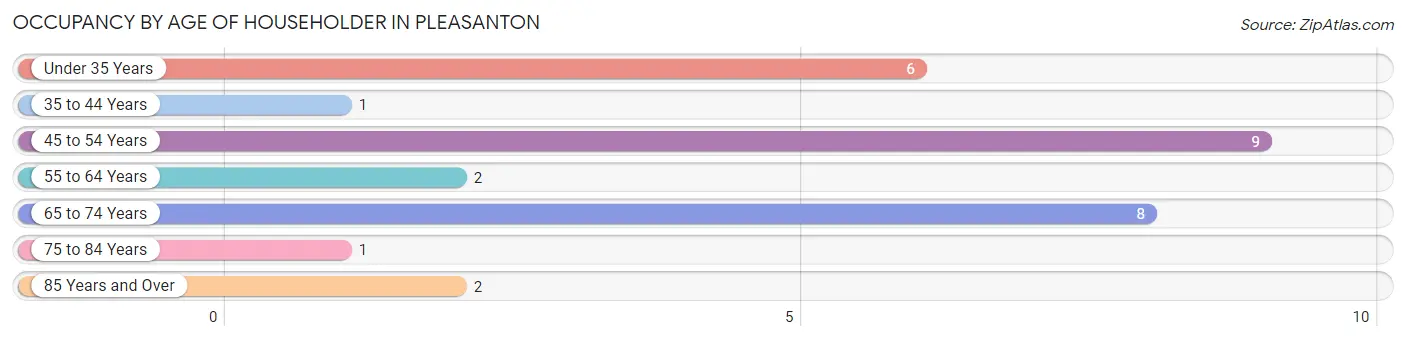
| Age Bracket | # Households | % Households |
| Under 35 Years | 6 | 20.7% |
| 35 to 44 Years | 1 | 3.5% |
| 45 to 54 Years | 9 | 31.0% |
| 55 to 64 Years | 2 | 6.9% |
| 65 to 74 Years | 8 | 27.6% |
| 75 to 84 Years | 1 | 3.5% |
| 85 Years and Over | 2 | 6.9% |
| Total | 29 | 100.0% |
Housing Finances in Pleasanton
Median Income by Occupancy in Pleasanton
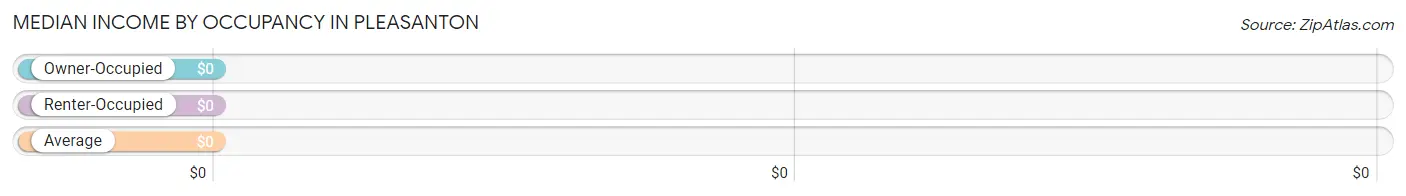
| Occupancy Type | # Households | Median Income |
| Owner-Occupied | 29 (100.0%) | $0 |
| Renter-Occupied | 0 (0.0%) | $0 |
| Average | 29 (100.0%) | $0 |
Occupancy by Householder Income Bracket in Pleasanton
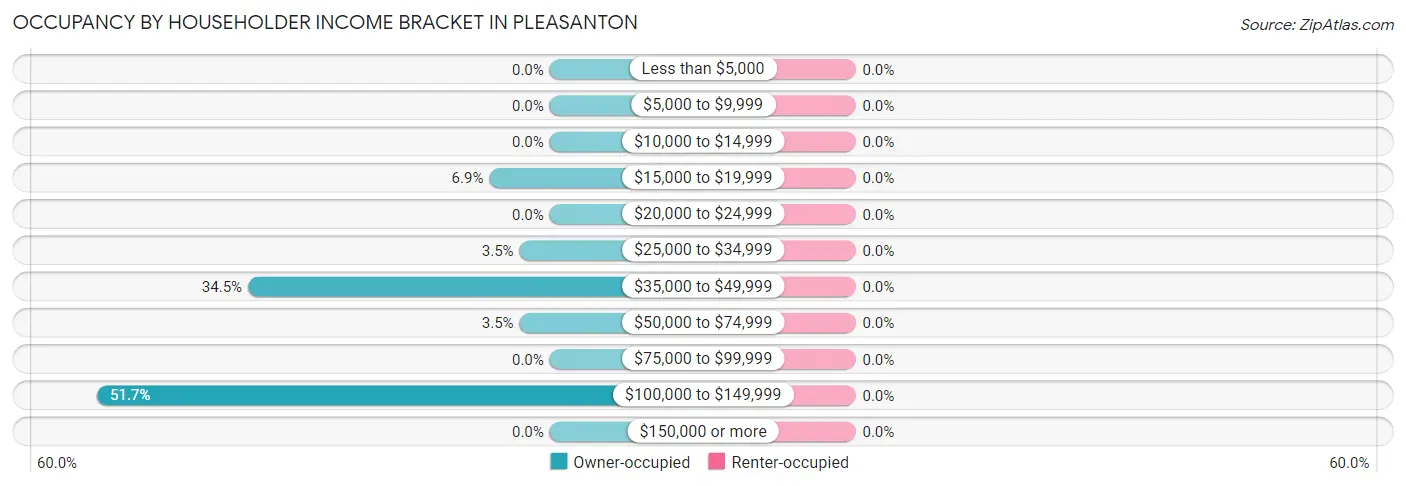
| Income Bracket | Owner-occupied | Renter-occupied |
| Less than $5,000 | 0 (0.0%) | 0 (0.0%) |
| $5,000 to $9,999 | 0 (0.0%) | 0 (0.0%) |
| $10,000 to $14,999 | 0 (0.0%) | 0 (0.0%) |
| $15,000 to $19,999 | 2 (6.9%) | 0 (0.0%) |
| $20,000 to $24,999 | 0 (0.0%) | 0 (0.0%) |
| $25,000 to $34,999 | 1 (3.5%) | 0 (0.0%) |
| $35,000 to $49,999 | 10 (34.5%) | 0 (0.0%) |
| $50,000 to $74,999 | 1 (3.5%) | 0 (0.0%) |
| $75,000 to $99,999 | 0 (0.0%) | 0 (0.0%) |
| $100,000 to $149,999 | 15 (51.7%) | 0 (0.0%) |
| $150,000 or more | 0 (0.0%) | 0 (0.0%) |
| Total | 29 (100.0%) | 0 (0.0%) |
Monthly Housing Cost Tiers in Pleasanton
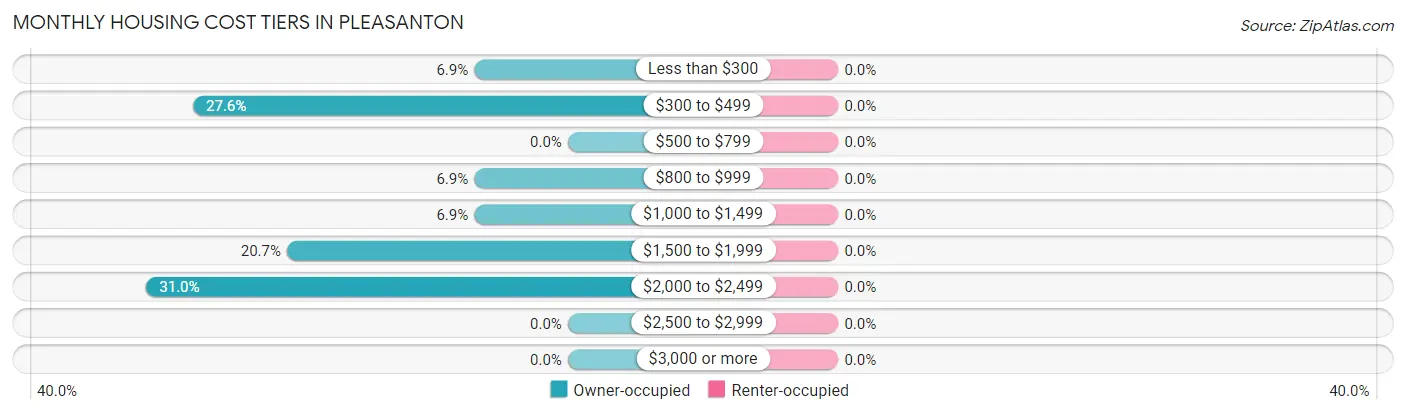
| Monthly Cost | Owner-occupied | Renter-occupied |
| Less than $300 | 2 (6.9%) | 0 (0.0%) |
| $300 to $499 | 8 (27.6%) | 0 (0.0%) |
| $500 to $799 | 0 (0.0%) | 0 (0.0%) |
| $800 to $999 | 2 (6.9%) | 0 (0.0%) |
| $1,000 to $1,499 | 2 (6.9%) | 0 (0.0%) |
| $1,500 to $1,999 | 6 (20.7%) | 0 (0.0%) |
| $2,000 to $2,499 | 9 (31.0%) | 0 (0.0%) |
| $2,500 to $2,999 | 0 (0.0%) | 0 (0.0%) |
| $3,000 or more | 0 (0.0%) | 0 (0.0%) |
| Total | 29 (100.0%) | 0 (0.0%) |
Physical Housing Characteristics in Pleasanton
Housing Structures in Pleasanton
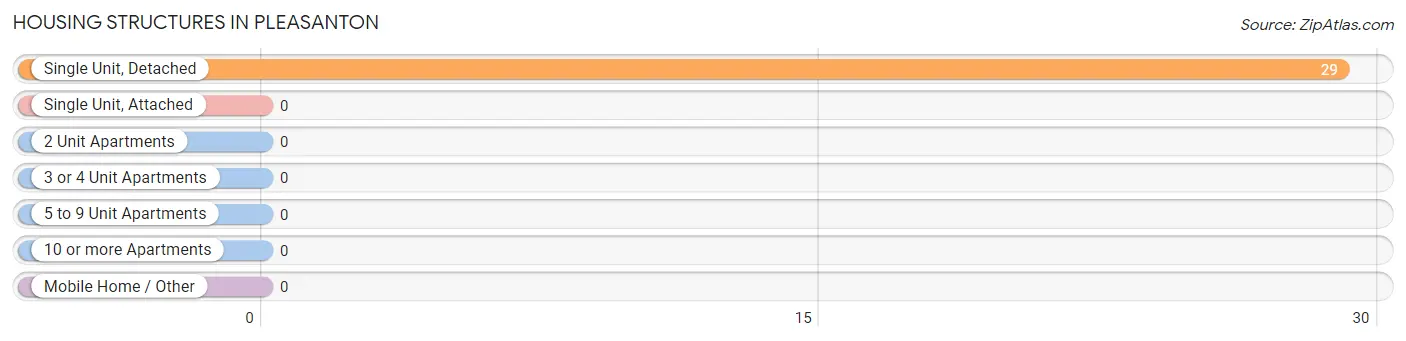
| Structure Type | # Housing Units | % Housing Units |
| Single Unit, Detached | 29 | 100.0% |
| Single Unit, Attached | 0 | 0.0% |
| 2 Unit Apartments | 0 | 0.0% |
| 3 or 4 Unit Apartments | 0 | 0.0% |
| 5 to 9 Unit Apartments | 0 | 0.0% |
| 10 or more Apartments | 0 | 0.0% |
| Mobile Home / Other | 0 | 0.0% |
| Total | 29 | 100.0% |
Housing Structures by Occupancy in Pleasanton
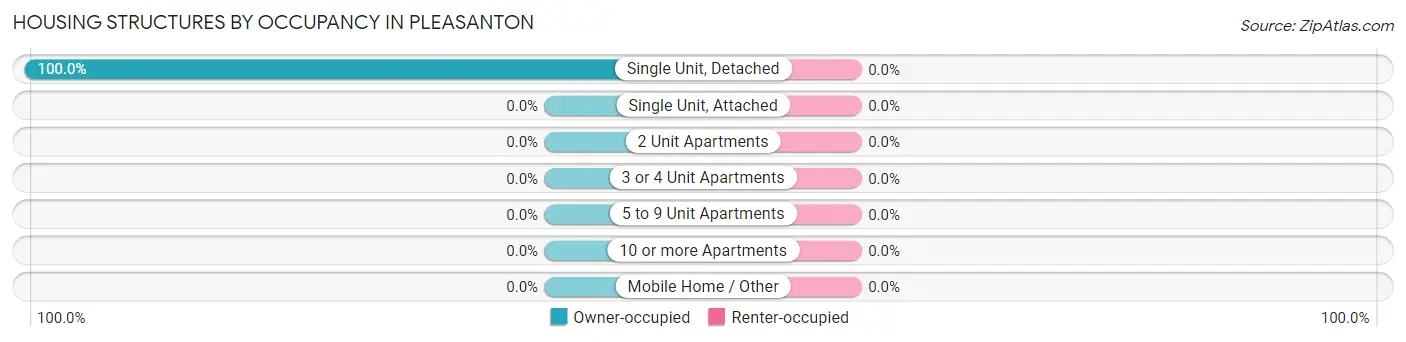
| Structure Type | Owner-occupied | Renter-occupied |
| Single Unit, Detached | 29 (100.0%) | 0 (0.0%) |
| Single Unit, Attached | 0 (0.0%) | 0 (0.0%) |
| 2 Unit Apartments | 0 (0.0%) | 0 (0.0%) |
| 3 or 4 Unit Apartments | 0 (0.0%) | 0 (0.0%) |
| 5 to 9 Unit Apartments | 0 (0.0%) | 0 (0.0%) |
| 10 or more Apartments | 0 (0.0%) | 0 (0.0%) |
| Mobile Home / Other | 0 (0.0%) | 0 (0.0%) |
| Total | 29 (100.0%) | 0 (0.0%) |
Housing Structures by Number of Rooms in Pleasanton
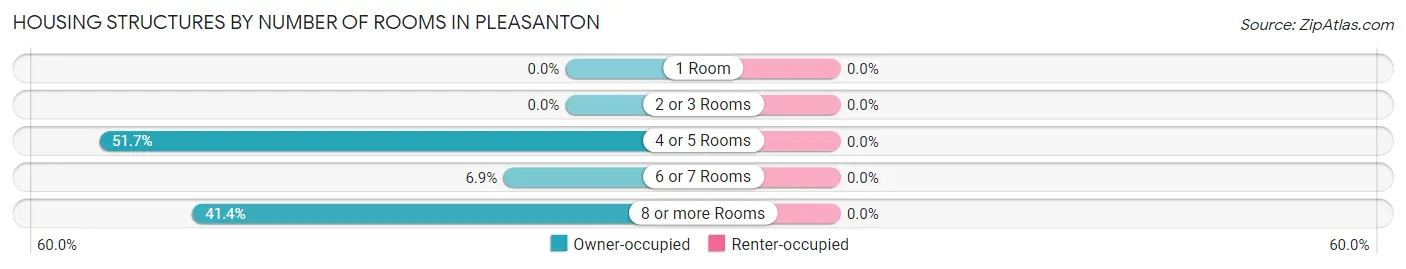
| Number of Rooms | Owner-occupied | Renter-occupied |
| 1 Room | 0 (0.0%) | 0 (0.0%) |
| 2 or 3 Rooms | 0 (0.0%) | 0 (0.0%) |
| 4 or 5 Rooms | 15 (51.7%) | 0 (0.0%) |
| 6 or 7 Rooms | 2 (6.9%) | 0 (0.0%) |
| 8 or more Rooms | 12 (41.4%) | 0 (0.0%) |
| Total | 29 (100.0%) | 0 (0.0%) |
Housing Structure by Heating Type in Pleasanton
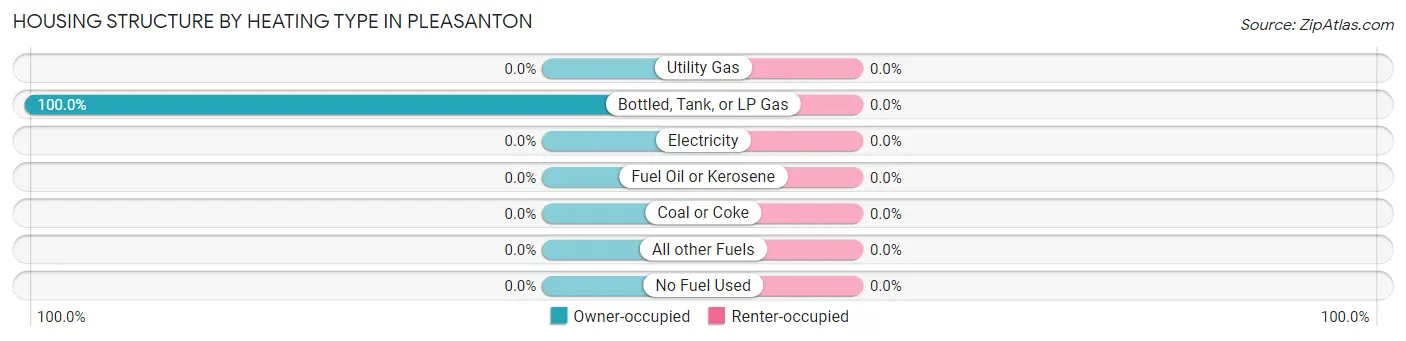
| Heating Type | Owner-occupied | Renter-occupied |
| Utility Gas | 0 (0.0%) | 0 (0.0%) |
| Bottled, Tank, or LP Gas | 29 (100.0%) | 0 (0.0%) |
| Electricity | 0 (0.0%) | 0 (0.0%) |
| Fuel Oil or Kerosene | 0 (0.0%) | 0 (0.0%) |
| Coal or Coke | 0 (0.0%) | 0 (0.0%) |
| All other Fuels | 0 (0.0%) | 0 (0.0%) |
| No Fuel Used | 0 (0.0%) | 0 (0.0%) |
| Total | 29 (100.0%) | 0 (0.0%) |
Household Vehicle Usage in Pleasanton
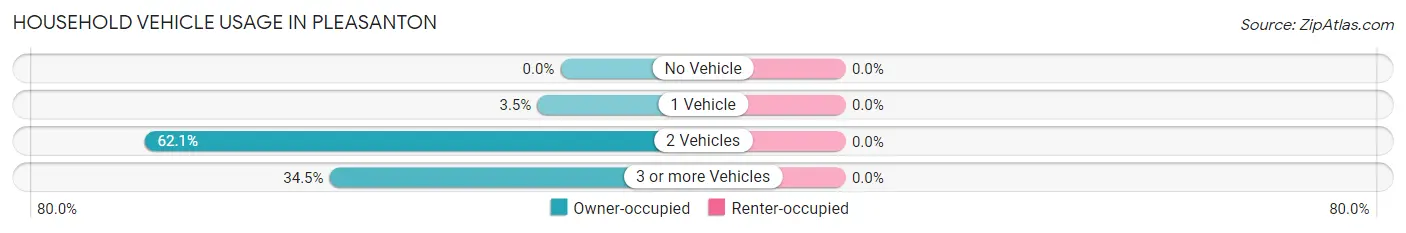
| Vehicles per Household | Owner-occupied | Renter-occupied |
| No Vehicle | 0 (0.0%) | 0 (0.0%) |
| 1 Vehicle | 1 (3.5%) | 0 (0.0%) |
| 2 Vehicles | 18 (62.1%) | 0 (0.0%) |
| 3 or more Vehicles | 10 (34.5%) | 0 (0.0%) |
| Total | 29 (100.0%) | 0 (0.0%) |
Real Estate & Mortgages in Pleasanton
Real Estate and Mortgage Overview in Pleasanton
| Characteristic | Without Mortgage | With Mortgage |
| Housing Units | 10 | 19 |
| Median Property Value | - | - |
| Median Household Income | - | - |
| Monthly Housing Costs | - | - |
| Real Estate Taxes | - | - |
Property Value by Mortgage Status in Pleasanton
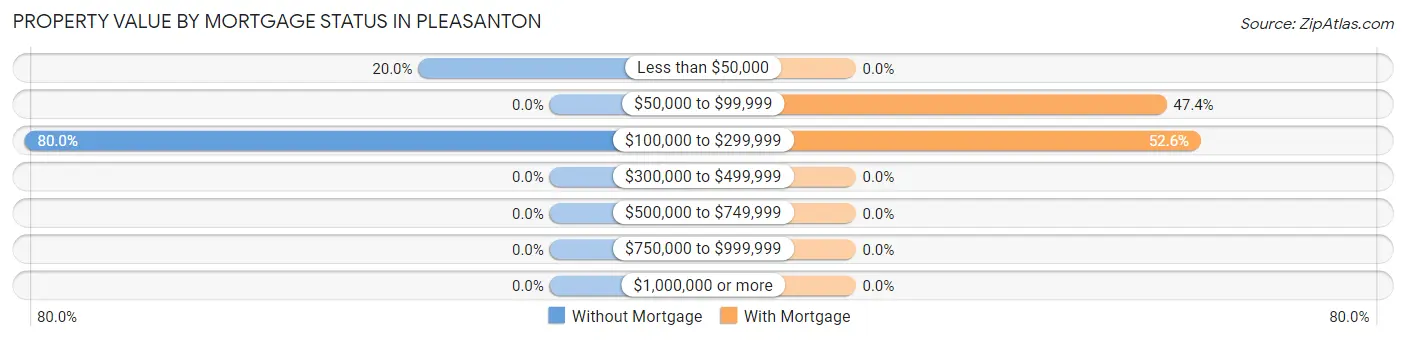
| Property Value | Without Mortgage | With Mortgage |
| Less than $50,000 | 2 (20.0%) | 0 (0.0%) |
| $50,000 to $99,999 | 0 (0.0%) | 9 (47.4%) |
| $100,000 to $299,999 | 8 (80.0%) | 10 (52.6%) |
| $300,000 to $499,999 | 0 (0.0%) | 0 (0.0%) |
| $500,000 to $749,999 | 0 (0.0%) | 0 (0.0%) |
| $750,000 to $999,999 | 0 (0.0%) | 0 (0.0%) |
| $1,000,000 or more | 0 (0.0%) | 0 (0.0%) |
| Total | 10 (100.0%) | 19 (100.0%) |
Household Income by Mortgage Status in Pleasanton
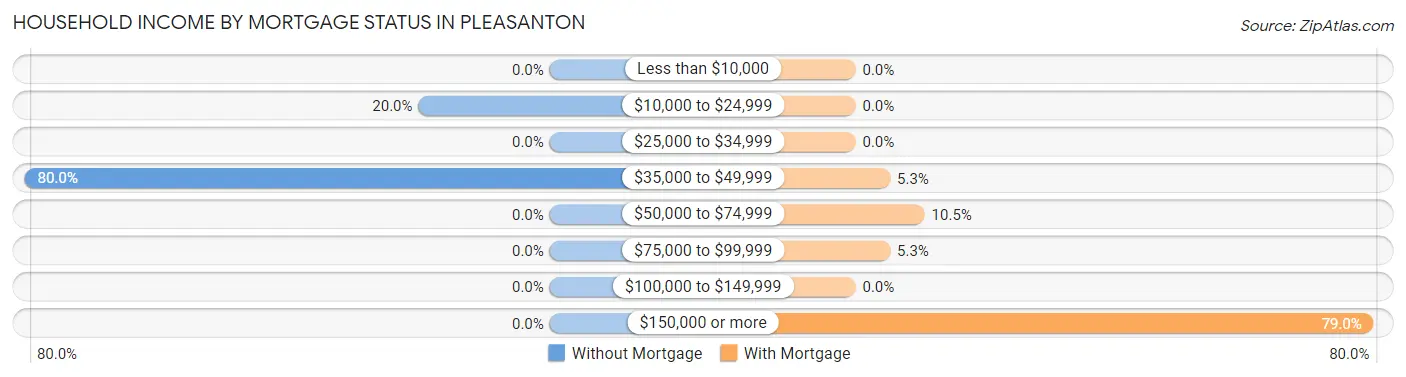
| Household Income | Without Mortgage | With Mortgage |
| Less than $10,000 | 0 (0.0%) | 0 (0.0%) |
| $10,000 to $24,999 | 2 (20.0%) | 0 (0.0%) |
| $25,000 to $34,999 | 0 (0.0%) | 0 (0.0%) |
| $35,000 to $49,999 | 8 (80.0%) | 1 (5.3%) |
| $50,000 to $74,999 | 0 (0.0%) | 2 (10.5%) |
| $75,000 to $99,999 | 0 (0.0%) | 1 (5.3%) |
| $100,000 to $149,999 | 0 (0.0%) | 0 (0.0%) |
| $150,000 or more | 0 (0.0%) | 15 (78.9%) |
| Total | 10 (100.0%) | 19 (100.0%) |
Property Value to Household Income Ratio in Pleasanton
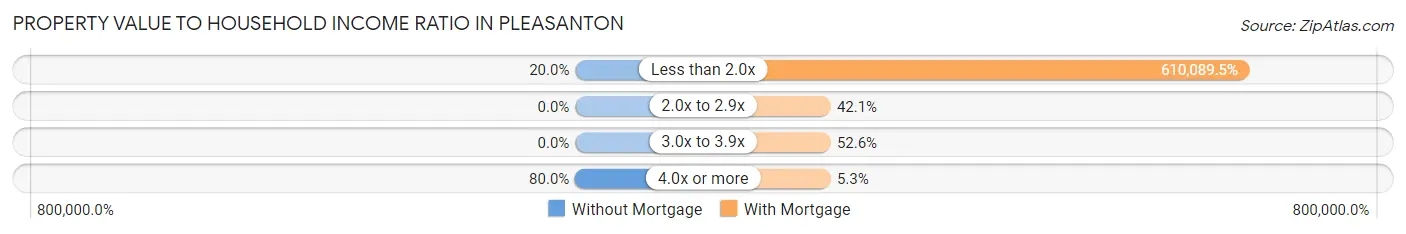
| Value-to-Income Ratio | Without Mortgage | With Mortgage |
| Less than 2.0x | 2 (20.0%) | 115,917 (610,089.5%) |
| 2.0x to 2.9x | 0 (0.0%) | 8 (42.1%) |
| 3.0x to 3.9x | 0 (0.0%) | 10 (52.6%) |
| 4.0x or more | 8 (80.0%) | 1 (5.3%) |
| Total | 10 (100.0%) | 19 (100.0%) |
Real Estate Taxes by Mortgage Status in Pleasanton
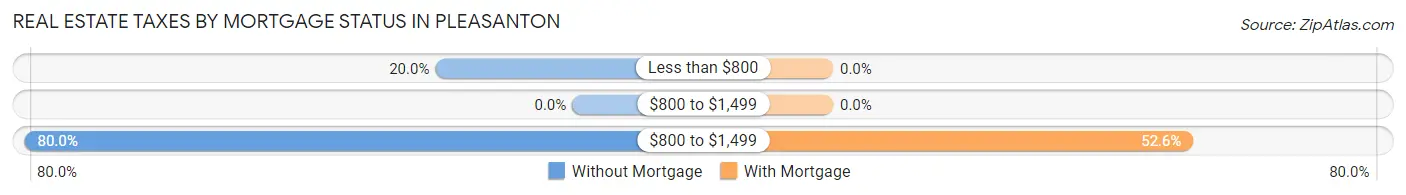
| Property Taxes | Without Mortgage | With Mortgage |
| Less than $800 | 2 (20.0%) | 0 (0.0%) |
| $800 to $1,499 | 0 (0.0%) | 0 (0.0%) |
| $800 to $1,499 | 8 (80.0%) | 10 (52.6%) |
| Total | 10 (100.0%) | 19 (100.0%) |
Health & Disability in Pleasanton
Health Insurance Coverage by Age in Pleasanton
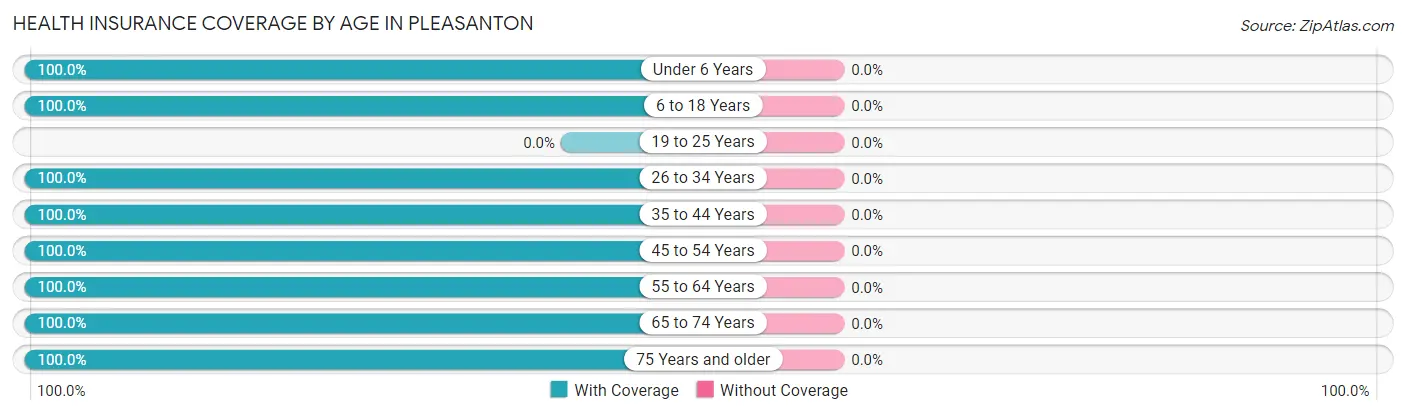
| Age Bracket | With Coverage | Without Coverage |
| Under 6 Years | 6 (100.0%) | 0 (0.0%) |
| 6 to 18 Years | 2 (100.0%) | 0 (0.0%) |
| 19 to 25 Years | 0 (0.0%) | 0 (0.0%) |
| 26 to 34 Years | 6 (100.0%) | 0 (0.0%) |
| 35 to 44 Years | 9 (100.0%) | 0 (0.0%) |
| 45 to 54 Years | 13 (100.0%) | 0 (0.0%) |
| 55 to 64 Years | 2 (100.0%) | 0 (0.0%) |
| 65 to 74 Years | 11 (100.0%) | 0 (0.0%) |
| 75 Years and older | 13 (100.0%) | 0 (0.0%) |
| Total | 62 (100.0%) | 0 (0.0%) |
Health Insurance Coverage by Citizenship Status in Pleasanton
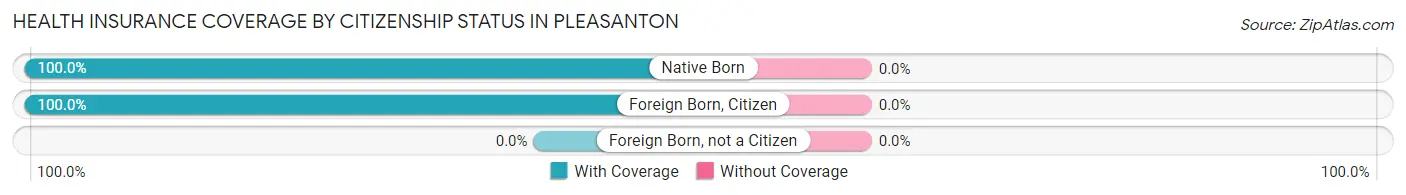
| Citizenship Status | With Coverage | Without Coverage |
| Native Born | 6 (100.0%) | 0 (0.0%) |
| Foreign Born, Citizen | 2 (100.0%) | 0 (0.0%) |
| Foreign Born, not a Citizen | 0 (0.0%) | 0 (0.0%) |
Health Insurance Coverage by Household Income in Pleasanton
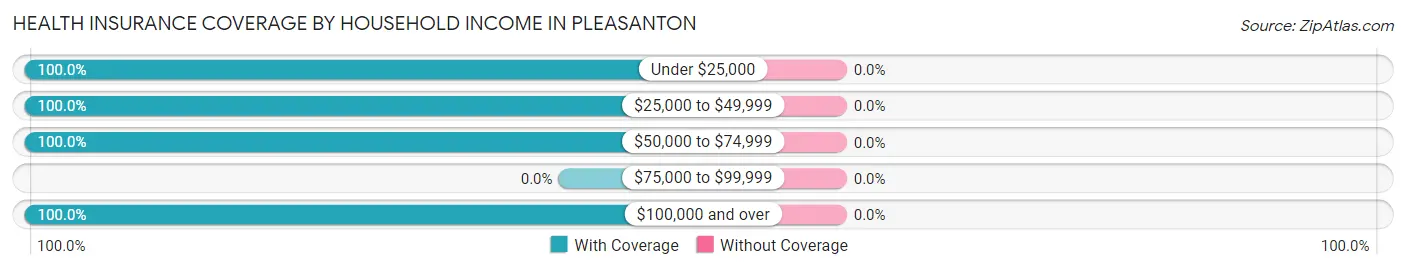
| Household Income | With Coverage | Without Coverage |
| Under $25,000 | 2 (100.0%) | 0 (0.0%) |
| $25,000 to $49,999 | 24 (100.0%) | 0 (0.0%) |
| $50,000 to $74,999 | 4 (100.0%) | 0 (0.0%) |
| $75,000 to $99,999 | 0 (0.0%) | 0 (0.0%) |
| $100,000 and over | 32 (100.0%) | 0 (0.0%) |
Public vs Private Health Insurance Coverage by Age in Pleasanton
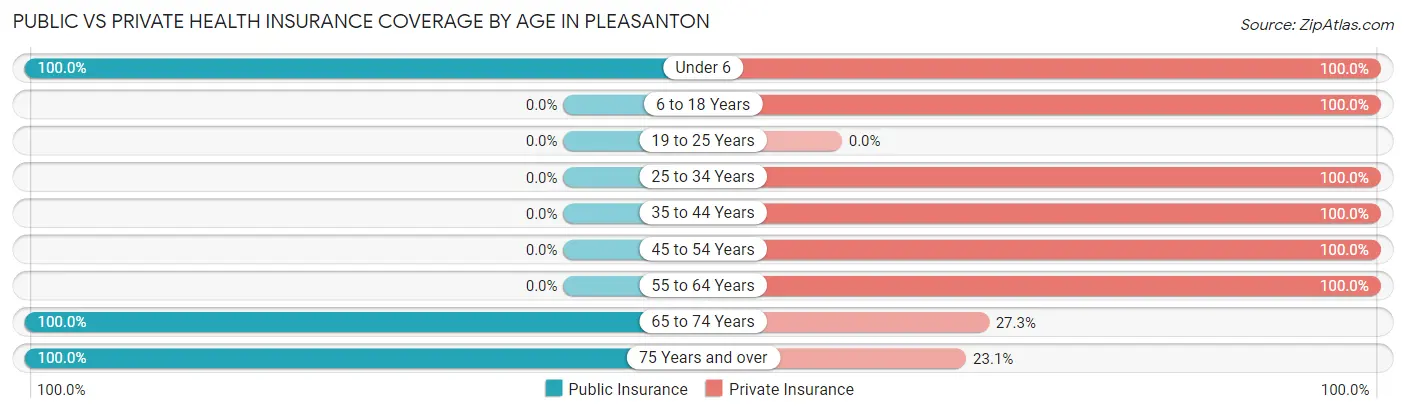
| Age Bracket | Public Insurance | Private Insurance |
| Under 6 | 6 (100.0%) | 6 (100.0%) |
| 6 to 18 Years | 0 (0.0%) | 2 (100.0%) |
| 19 to 25 Years | 0 (0.0%) | 0 (0.0%) |
| 25 to 34 Years | 0 (0.0%) | 6 (100.0%) |
| 35 to 44 Years | 0 (0.0%) | 9 (100.0%) |
| 45 to 54 Years | 0 (0.0%) | 13 (100.0%) |
| 55 to 64 Years | 0 (0.0%) | 2 (100.0%) |
| 65 to 74 Years | 11 (100.0%) | 3 (27.3%) |
| 75 Years and over | 13 (100.0%) | 3 (23.1%) |
| Total | 30 (48.4%) | 44 (71.0%) |
Disability Status by Sex by Age in Pleasanton
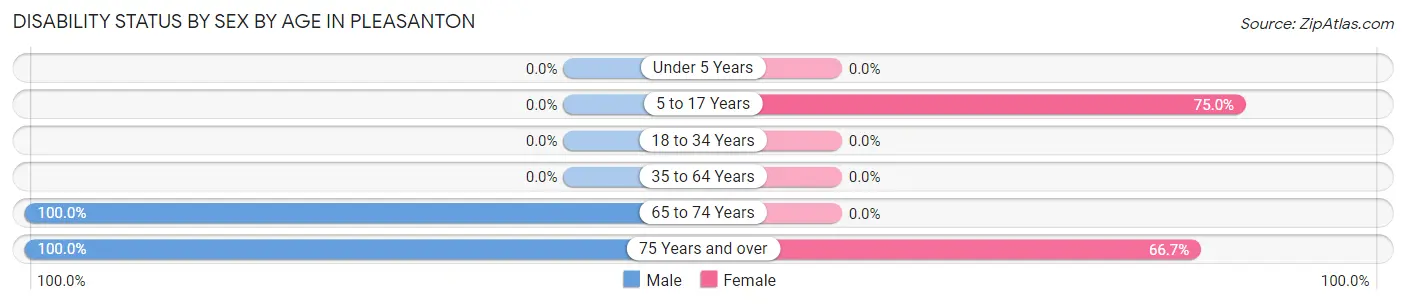
| Age Bracket | Male | Female |
| Under 5 Years | 0 (0.0%) | 0 (0.0%) |
| 5 to 17 Years | 0 (0.0%) | 6 (75.0%) |
| 18 to 34 Years | 0 (0.0%) | 0 (0.0%) |
| 35 to 64 Years | 0 (0.0%) | 0 (0.0%) |
| 65 to 74 Years | 3 (100.0%) | 0 (0.0%) |
| 75 Years and over | 10 (100.0%) | 2 (66.7%) |
Disability Class by Sex by Age in Pleasanton
Disability Class: Hearing Difficulty
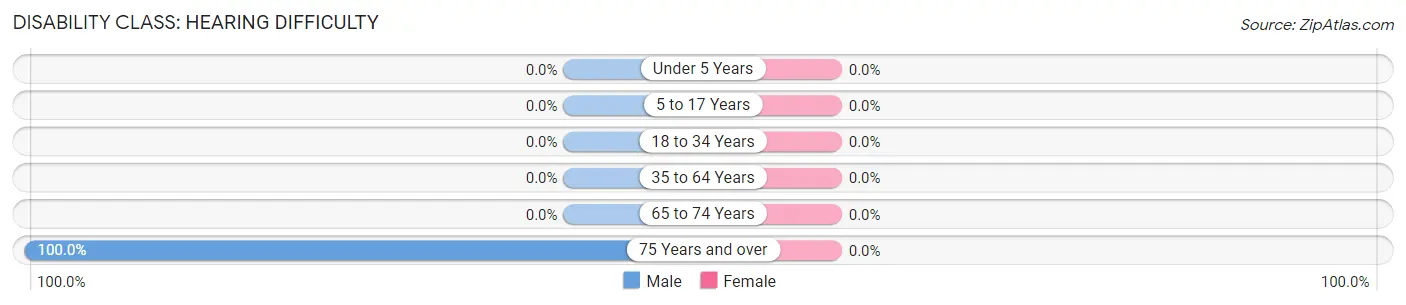
| Age Bracket | Male | Female |
| Under 5 Years | 0 (0.0%) | 0 (0.0%) |
| 5 to 17 Years | 0 (0.0%) | 0 (0.0%) |
| 18 to 34 Years | 0 (0.0%) | 0 (0.0%) |
| 35 to 64 Years | 0 (0.0%) | 0 (0.0%) |
| 65 to 74 Years | 0 (0.0%) | 0 (0.0%) |
| 75 Years and over | 10 (100.0%) | 0 (0.0%) |
Disability Class: Vision Difficulty
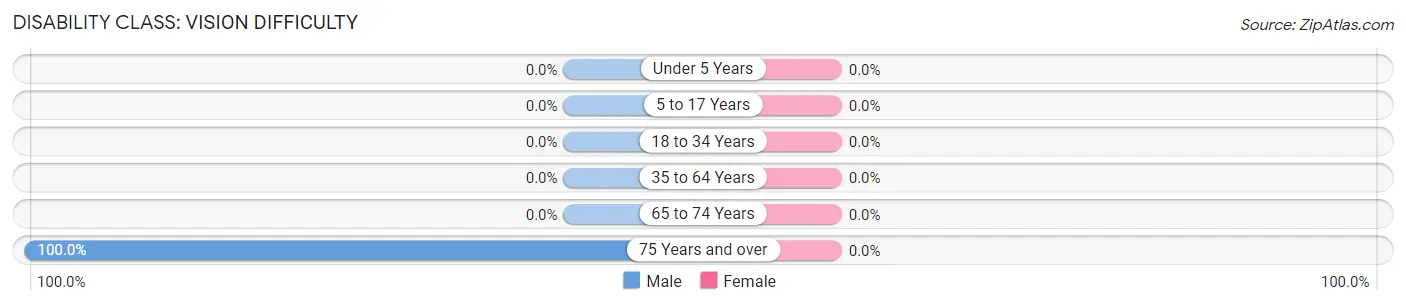
| Age Bracket | Male | Female |
| Under 5 Years | 0 (0.0%) | 0 (0.0%) |
| 5 to 17 Years | 0 (0.0%) | 0 (0.0%) |
| 18 to 34 Years | 0 (0.0%) | 0 (0.0%) |
| 35 to 64 Years | 0 (0.0%) | 0 (0.0%) |
| 65 to 74 Years | 0 (0.0%) | 0 (0.0%) |
| 75 Years and over | 10 (100.0%) | 0 (0.0%) |
Disability Class: Cognitive Difficulty
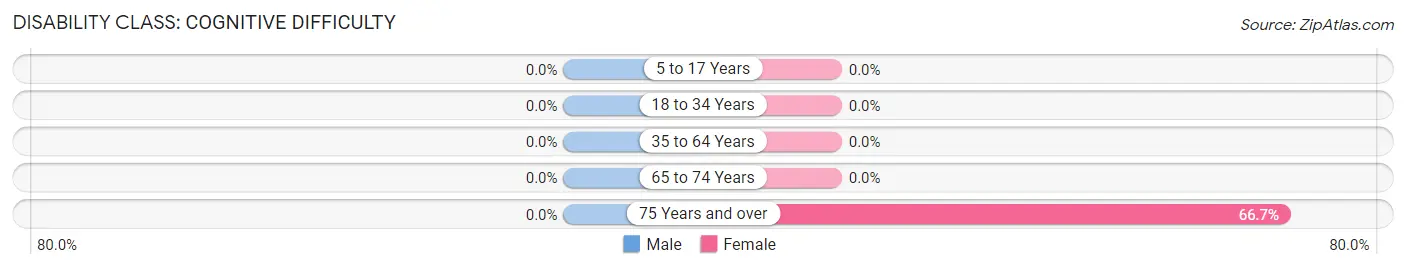
| Age Bracket | Male | Female |
| 5 to 17 Years | 0 (0.0%) | 0 (0.0%) |
| 18 to 34 Years | 0 (0.0%) | 0 (0.0%) |
| 35 to 64 Years | 0 (0.0%) | 0 (0.0%) |
| 65 to 74 Years | 0 (0.0%) | 0 (0.0%) |
| 75 Years and over | 0 (0.0%) | 2 (66.7%) |
Disability Class: Ambulatory Difficulty
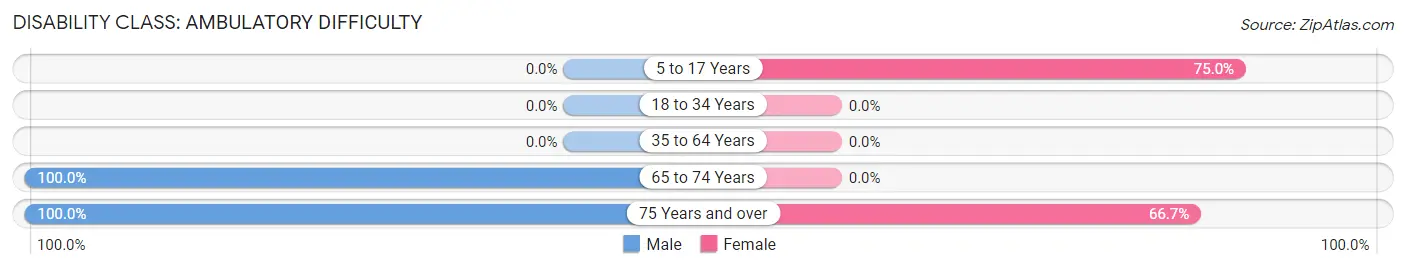
| Age Bracket | Male | Female |
| 5 to 17 Years | 0 (0.0%) | 6 (75.0%) |
| 18 to 34 Years | 0 (0.0%) | 0 (0.0%) |
| 35 to 64 Years | 0 (0.0%) | 0 (0.0%) |
| 65 to 74 Years | 3 (100.0%) | 0 (0.0%) |
| 75 Years and over | 10 (100.0%) | 2 (66.7%) |
Disability Class: Self-Care Difficulty
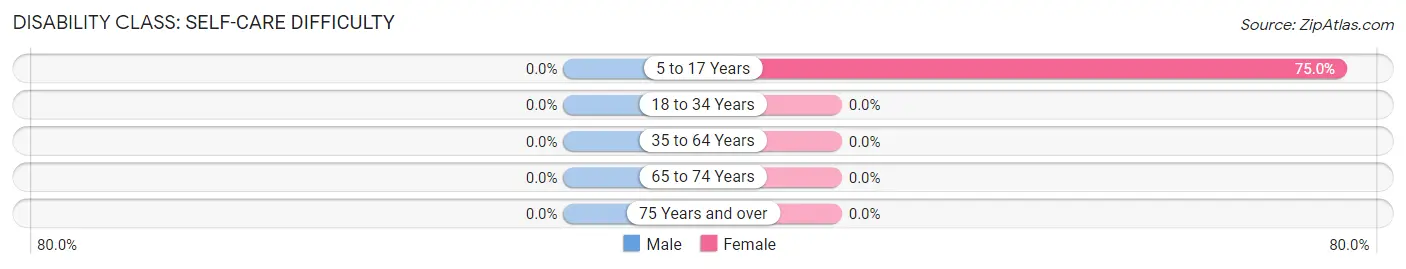
| Age Bracket | Male | Female |
| 5 to 17 Years | 0 (0.0%) | 6 (75.0%) |
| 18 to 34 Years | 0 (0.0%) | 0 (0.0%) |
| 35 to 64 Years | 0 (0.0%) | 0 (0.0%) |
| 65 to 74 Years | 0 (0.0%) | 0 (0.0%) |
| 75 Years and over | 0 (0.0%) | 0 (0.0%) |
Technology Access in Pleasanton
Computing Device Access in Pleasanton
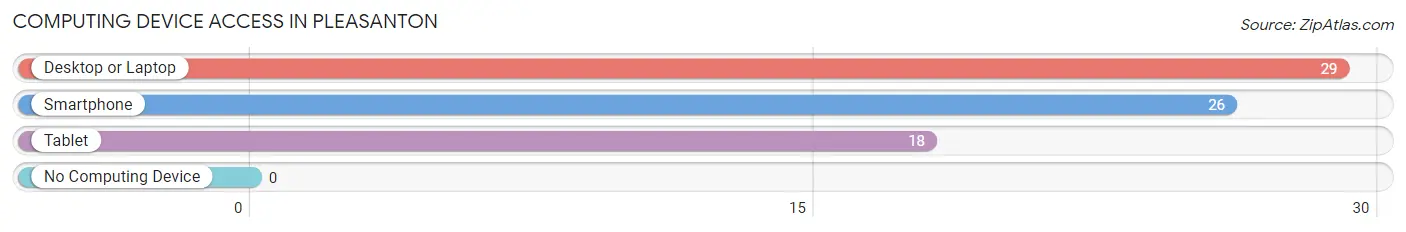
| Device Type | # Households | % Households |
| Desktop or Laptop | 29 | 100.0% |
| Smartphone | 26 | 89.7% |
| Tablet | 18 | 62.1% |
| No Computing Device | 0 | 0.0% |
| Total | 29 | 100.0% |
Internet Access in Pleasanton
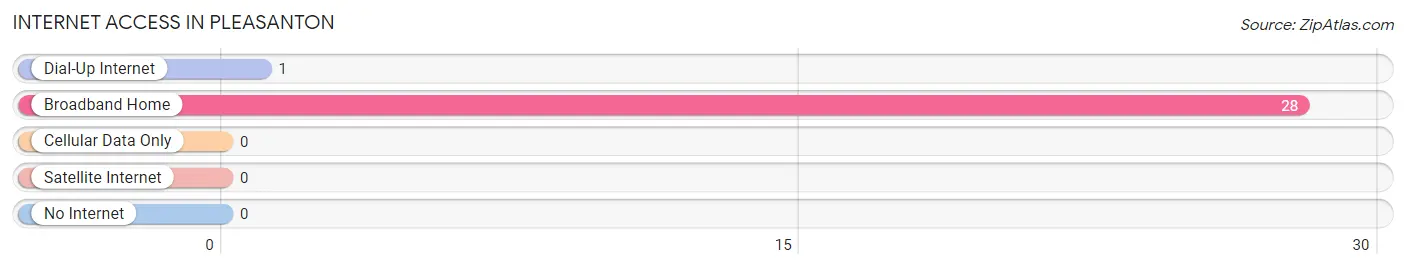
| Internet Type | # Households | % Households |
| Dial-Up Internet | 1 | 3.5% |
| Broadband Home | 28 | 96.6% |
| Cellular Data Only | 0 | 0.0% |
| Satellite Internet | 0 | 0.0% |
| No Internet | 0 | 0.0% |
| Total | 29 | 100.0% |
Pleasanton Summary
Pleasanton is a small city located in the state of Iowa, United States. It is situated in the southeastern part of the state, in the county of Decatur. The city has a population of approximately 1,000 people, according to the 2010 census.
Geography
Pleasanton is located in the southeastern part of Iowa, in Decatur County. It is situated at the intersection of two major highways, US Route 34 and Iowa Highway 2. The city is located on the banks of the Des Moines River, which flows through the city. The city is surrounded by rolling hills and farmland, and is located in the heart of the Midwest.
The climate in Pleasanton is typical of the Midwest, with hot summers and cold winters. The average temperature in the summer is around 80 degrees Fahrenheit, while the average temperature in the winter is around 20 degrees Fahrenheit. The city receives an average of 40 inches of precipitation per year.
History
Pleasanton was founded in 1856 by a group of settlers from Ohio. The city was named after Pleasanton, Ohio, the hometown of the settlers. The city was incorporated in 1868, and the first mayor was elected in 1869.
The city grew slowly in the late 19th century, and by the early 20th century, it had become a thriving agricultural center. The city was home to several large farms, and the local economy was largely based on agriculture.
In the mid-20th century, the city began to diversify its economy. Several manufacturing companies moved to the city, and the local economy began to shift away from agriculture. The city also began to attract more tourists, and the downtown area was revitalized.
Economy
The economy of Pleasanton is largely based on agriculture and manufacturing. The city is home to several large farms, and the local economy is largely based on the production of corn, soybeans, and other crops. The city is also home to several manufacturing companies, including a plastics manufacturer and a food processing plant.
The city also has a thriving tourism industry. The downtown area has been revitalized, and the city is home to several attractions, including a museum, a theater, and a golf course. The city also hosts several festivals throughout the year, including the Pleasanton County Fair and the Pleasanton Music Festival.
Demographics
According to the 2010 census, the population of Pleasanton was 1,000. The racial makeup of the city was 97.2% White, 0.7% African American, 0.3% Native American, 0.2% Asian, 0.1% Pacific Islander, and 1.5% from other races. The median household income was $41,250, and the median family income was $50,000.
Conclusion
Pleasanton is a small city located in the southeastern part of Iowa. The city has a population of approximately 1,000 people, and the local economy is largely based on agriculture and manufacturing. The city has a thriving tourism industry, and the downtown area has been revitalized. The city is home to several attractions, and hosts several festivals throughout the year.
Common Questions
What is Per Capita Income in Pleasanton?
Per Capita income in Pleasanton is $36,861.
What is Inequality or Gini Index in Pleasanton?
Inequality or Gini Index in Pleasanton is 0.26.
What is the Total Population of Pleasanton?
Total Population of Pleasanton is 62.
What is the Total Male Population of Pleasanton?
Total Male Population of Pleasanton is 25.
What is the Total Female Population of Pleasanton?
Total Female Population of Pleasanton is 37.
What is the Ratio of Males per 100 Females in Pleasanton?
There are 67.57 Males per 100 Females in Pleasanton.
What is the Ratio of Females per 100 Males in Pleasanton?
There are 148.00 Females per 100 Males in Pleasanton.
What is the Median Population Age in Pleasanton?
Median Population Age in Pleasanton is 50.9 Years.
What is the Average Family Size in Pleasanton
Average Family Size in Pleasanton is 2.3 People.
What is the Average Household Size in Pleasanton
Average Household Size in Pleasanton is 2.1 People.
How Large is the Labor Force in Pleasanton?
There are 24 People in the Labor Forcein in Pleasanton.
What is the Percentage of People in the Labor Force in Pleasanton?
44.4% of People are in the Labor Force in Pleasanton.