Treynor, IA Map & Demographics
Treynor Map
Treynor Overview
$41,204
PER CAPITA INCOME
$123,750
AVG FAMILY INCOME
$93,958
AVG HOUSEHOLD INCOME
15.7%
WAGE / INCOME GAP [ % ]
84.3¢/ $1
WAGE / INCOME GAP [ $ ]
0.38
INEQUALITY / GINI INDEX
1,071
TOTAL POPULATION
522
MALE POPULATION
549
FEMALE POPULATION
95.08
MALES / 100 FEMALES
105.17
FEMALES / 100 MALES
37.5
MEDIAN AGE
3.0
AVG FAMILY SIZE
2.5
AVG HOUSEHOLD SIZE
585
LABOR FORCE [ PEOPLE ]
74.2%
PERCENT IN LABOR FORCE
3.6%
UNEMPLOYMENT RATE
Treynor Zip Codes
Treynor Area Codes
Income in Treynor
Income Overview in Treynor
Per Capita Income in Treynor is $41,204, while median incomes of families and households are $123,750 and $93,958 respectively.
| Characteristic | Number | Measure |
| Per Capita Income | 1,071 | $41,204 |
| Median Family Income | 312 | $123,750 |
| Mean Family Income | 312 | $124,889 |
| Median Household Income | 429 | $93,958 |
| Mean Household Income | 429 | $104,531 |
| Income Deficit | 312 | $0 |
| Wage / Income Gap (%) | 1,071 | 15.65% |
| Wage / Income Gap ($) | 1,071 | 84.35¢ per $1 |
| Gini / Inequality Index | 1,071 | 0.38 |
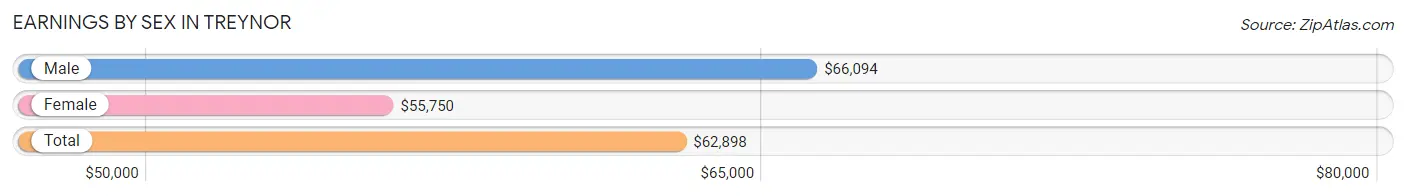
Earnings by Sex in Treynor
Average Earnings in Treynor are $62,898, $66,094 for men and $55,750 for women, a difference of 15.7%.
| Sex | Number | Average Earnings |
| Male | 298 (49.6%) | $66,094 |
| Female | 303 (50.4%) | $55,750 |
| Total | 601 (100.0%) | $62,898 |
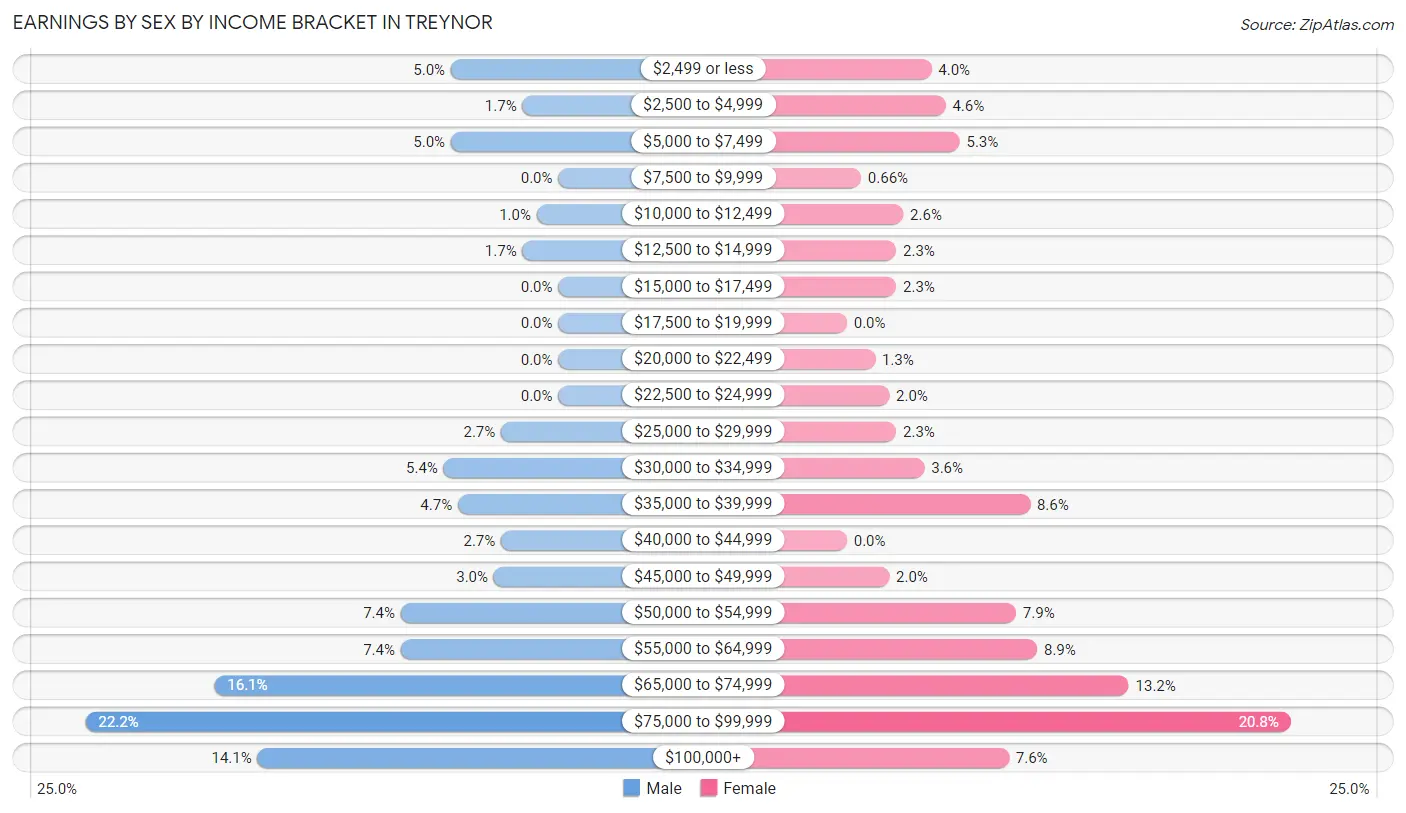
Earnings by Sex by Income Bracket in Treynor
The most common earnings brackets in Treynor are $75,000 to $99,999 for men (66 | 22.2%) and $75,000 to $99,999 for women (63 | 20.8%).
| Income | Male | Female |
| $2,499 or less | 15 (5.0%) | 12 (4.0%) |
| $2,500 to $4,999 | 5 (1.7%) | 14 (4.6%) |
| $5,000 to $7,499 | 15 (5.0%) | 16 (5.3%) |
| $7,500 to $9,999 | 0 (0.0%) | 2 (0.7%) |
| $10,000 to $12,499 | 3 (1.0%) | 8 (2.6%) |
| $12,500 to $14,999 | 5 (1.7%) | 7 (2.3%) |
| $15,000 to $17,499 | 0 (0.0%) | 7 (2.3%) |
| $17,500 to $19,999 | 0 (0.0%) | 0 (0.0%) |
| $20,000 to $22,499 | 0 (0.0%) | 4 (1.3%) |
| $22,500 to $24,999 | 0 (0.0%) | 6 (2.0%) |
| $25,000 to $29,999 | 8 (2.7%) | 7 (2.3%) |
| $30,000 to $34,999 | 16 (5.4%) | 11 (3.6%) |
| $35,000 to $39,999 | 14 (4.7%) | 26 (8.6%) |
| $40,000 to $44,999 | 8 (2.7%) | 0 (0.0%) |
| $45,000 to $49,999 | 9 (3.0%) | 6 (2.0%) |
| $50,000 to $54,999 | 22 (7.4%) | 24 (7.9%) |
| $55,000 to $64,999 | 22 (7.4%) | 27 (8.9%) |
| $65,000 to $74,999 | 48 (16.1%) | 40 (13.2%) |
| $75,000 to $99,999 | 66 (22.2%) | 63 (20.8%) |
| $100,000+ | 42 (14.1%) | 23 (7.6%) |
| Total | 298 (100.0%) | 303 (100.0%) |
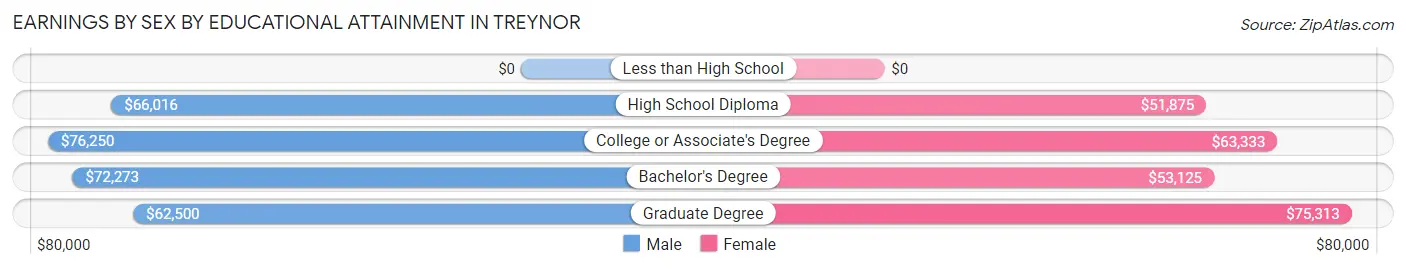
Earnings by Sex by Educational Attainment in Treynor
Average earnings in Treynor are $67,738 for men and $64,333 for women, a difference of 5.0%. Men with an educational attainment of college or associate's degree enjoy the highest average annual earnings of $76,250, while those with graduate degree education earn the least with $62,500. Women with an educational attainment of graduate degree earn the most with the average annual earnings of $75,313, while those with high school diploma education have the smallest earnings of $51,875.
| Educational Attainment | Male Income | Female Income |
| Less than High School | - | - |
| High School Diploma | $66,016 | $51,875 |
| College or Associate's Degree | $76,250 | $63,333 |
| Bachelor's Degree | $72,273 | $53,125 |
| Graduate Degree | $62,500 | $75,313 |
| Total | $67,738 | $64,333 |
Family Income in Treynor
Family Income Brackets in Treynor
According to the Treynor family income data, there are 98 families falling into the $100,000 to $149,999 income range, which is the most common income bracket and makes up 31.4% of all families.
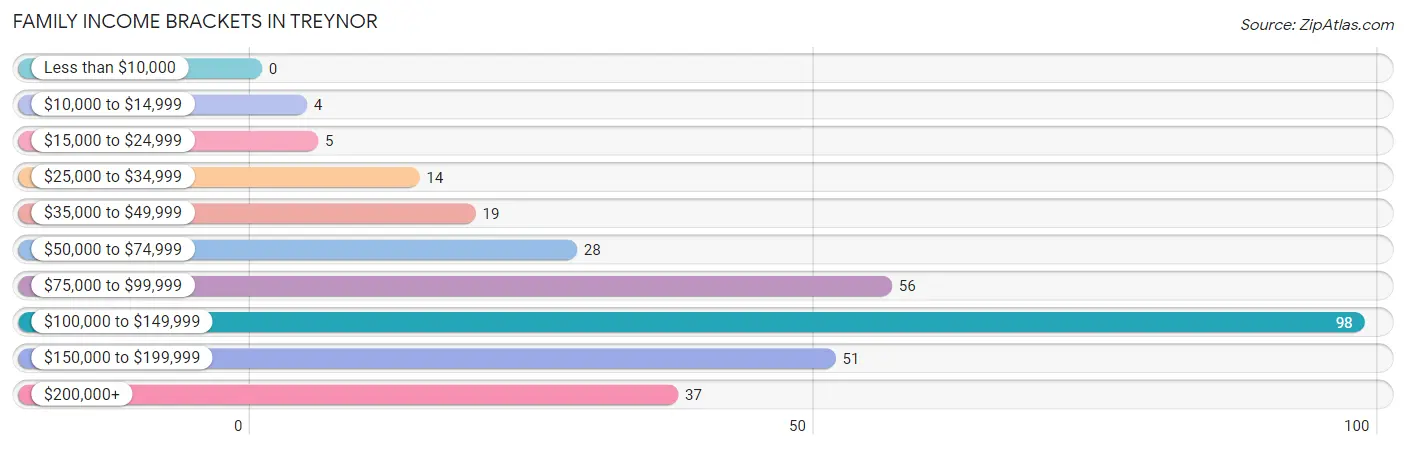
| Income Bracket | # Families | % Families |
| Less than $10,000 | 0 | 0.0% |
| $10,000 to $14,999 | 4 | 1.3% |
| $15,000 to $24,999 | 5 | 1.6% |
| $25,000 to $34,999 | 14 | 4.5% |
| $35,000 to $49,999 | 19 | 6.1% |
| $50,000 to $74,999 | 28 | 9.0% |
| $75,000 to $99,999 | 56 | 17.9% |
| $100,000 to $149,999 | 98 | 31.4% |
| $150,000 to $199,999 | 51 | 16.3% |
| $200,000+ | 37 | 11.9% |
Family Income by Famaliy Size in Treynor
4-person families (65 | 20.8%) account for the highest median family income in Treynor with $180,739 per family, while 2-person families (170 | 54.5%) have the highest median income of $52,500 per family member.
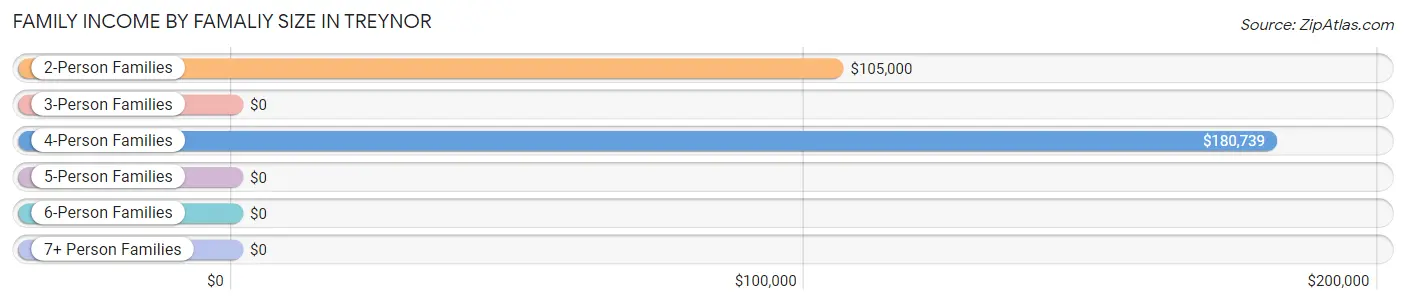
| Income Bracket | # Families | Median Income |
| 2-Person Families | 170 (54.5%) | $105,000 |
| 3-Person Families | 37 (11.9%) | $0 |
| 4-Person Families | 65 (20.8%) | $180,739 |
| 5-Person Families | 24 (7.7%) | $0 |
| 6-Person Families | 16 (5.1%) | $0 |
| 7+ Person Families | 0 (0.0%) | $0 |
| Total | 312 (100.0%) | $123,750 |
Family Income by Number of Earners in Treynor
The median family income in Treynor is $123,750, with families comprising 3+ earners (35) having the highest median family income of $192,969, while families with no earners (43) have the lowest median family income of $41,875, accounting for 11.2% and 13.8% of families, respectively.
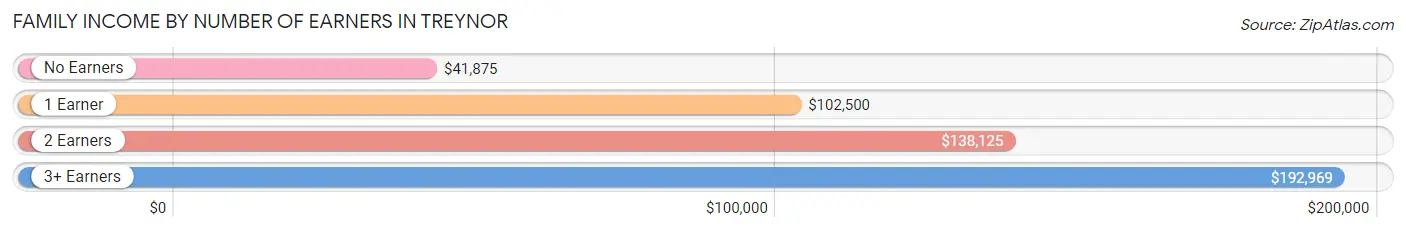
| Number of Earners | # Families | Median Income |
| No Earners | 43 (13.8%) | $41,875 |
| 1 Earner | 72 (23.1%) | $102,500 |
| 2 Earners | 162 (51.9%) | $138,125 |
| 3+ Earners | 35 (11.2%) | $192,969 |
| Total | 312 (100.0%) | $123,750 |
Household Income in Treynor
Household Income Brackets in Treynor
With 107 households falling in the category, the $100,000 to $149,999 income range is the most frequent in Treynor, accounting for 24.9% of all households. In contrast, only 6 households (1.4%) fall into the $10,000 to $14,999 income bracket, making it the least populous group.
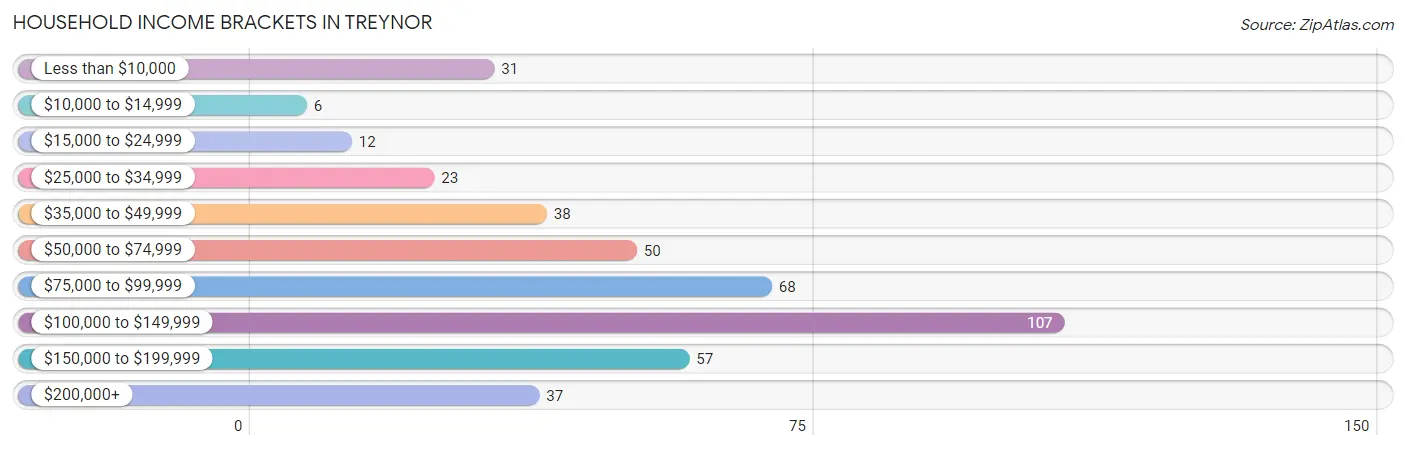
| Income Bracket | # Households | % Households |
| Less than $10,000 | 31 | 7.2% |
| $10,000 to $14,999 | 6 | 1.4% |
| $15,000 to $24,999 | 12 | 2.8% |
| $25,000 to $34,999 | 23 | 5.4% |
| $35,000 to $49,999 | 38 | 8.9% |
| $50,000 to $74,999 | 50 | 11.7% |
| $75,000 to $99,999 | 68 | 15.9% |
| $100,000 to $149,999 | 107 | 24.9% |
| $150,000 to $199,999 | 57 | 13.3% |
| $200,000+ | 37 | 8.6% |
Household Income by Householder Age in Treynor
The median household income in Treynor is $93,958, with the highest median household income of $113,875 found in the 25 to 44 years age bracket for the primary householder. A total of 165 households (38.5%) fall into this category. Meanwhile, the 15 to 24 years age bracket for the primary householder has the lowest median household income of $0, with 8 households (1.9%) in this group.
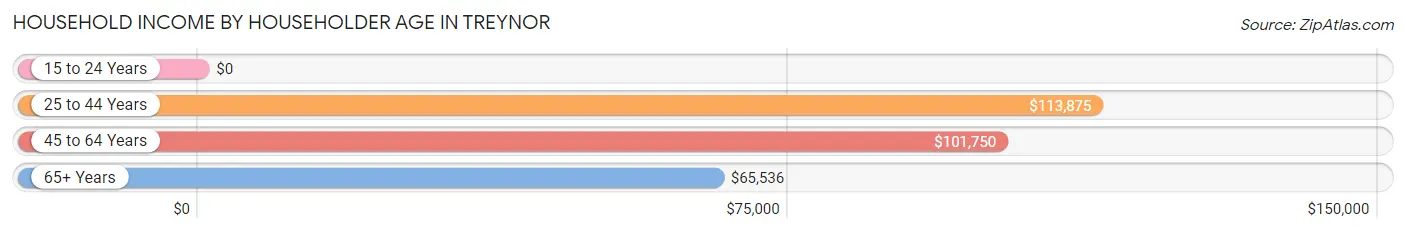
| Income Bracket | # Households | Median Income |
| 15 to 24 Years | 8 (1.9%) | $0 |
| 25 to 44 Years | 165 (38.5%) | $113,875 |
| 45 to 64 Years | 163 (38.0%) | $101,750 |
| 65+ Years | 93 (21.7%) | $65,536 |
| Total | 429 (100.0%) | $93,958 |
Poverty in Treynor
Income Below Poverty by Sex and Age in Treynor
With 2.3% poverty level for males and 6.8% for females among the residents of Treynor, under 5 year old males and 55 to 64 year old females are the most vulnerable to poverty, with 4 males (6.6%) and 24 females (26.1%) in their respective age groups living below the poverty level.
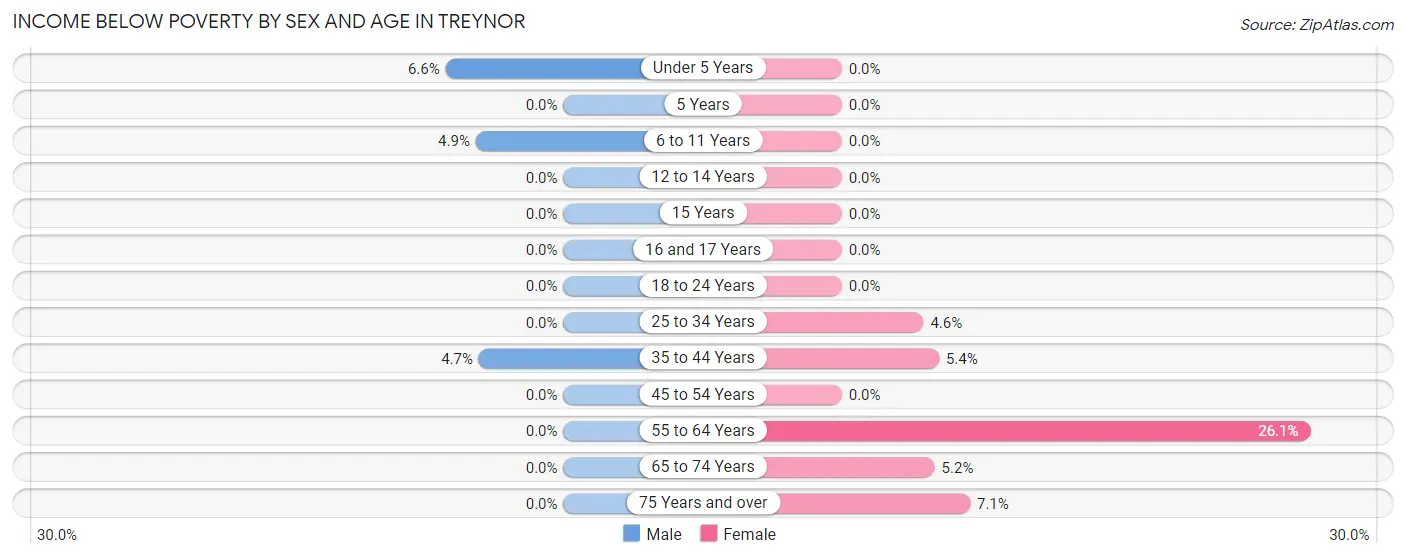
| Age Bracket | Male | Female |
| Under 5 Years | 4 (6.6%) | 0 (0.0%) |
| 5 Years | 0 (0.0%) | 0 (0.0%) |
| 6 to 11 Years | 4 (4.9%) | 0 (0.0%) |
| 12 to 14 Years | 0 (0.0%) | 0 (0.0%) |
| 15 Years | 0 (0.0%) | 0 (0.0%) |
| 16 and 17 Years | 0 (0.0%) | 0 (0.0%) |
| 18 to 24 Years | 0 (0.0%) | 0 (0.0%) |
| 25 to 34 Years | 0 (0.0%) | 4 (4.5%) |
| 35 to 44 Years | 4 (4.7%) | 4 (5.4%) |
| 45 to 54 Years | 0 (0.0%) | 0 (0.0%) |
| 55 to 64 Years | 0 (0.0%) | 24 (26.1%) |
| 65 to 74 Years | 0 (0.0%) | 3 (5.2%) |
| 75 Years and over | 0 (0.0%) | 2 (7.1%) |
| Total | 12 (2.3%) | 37 (6.8%) |
Income Above Poverty by Sex and Age in Treynor
According to the poverty statistics in Treynor, males aged 12 to 14 years and females aged under 5 years are the age groups that are most secure financially, with 100.0% of males and 100.0% of females in these age groups living above the poverty line.
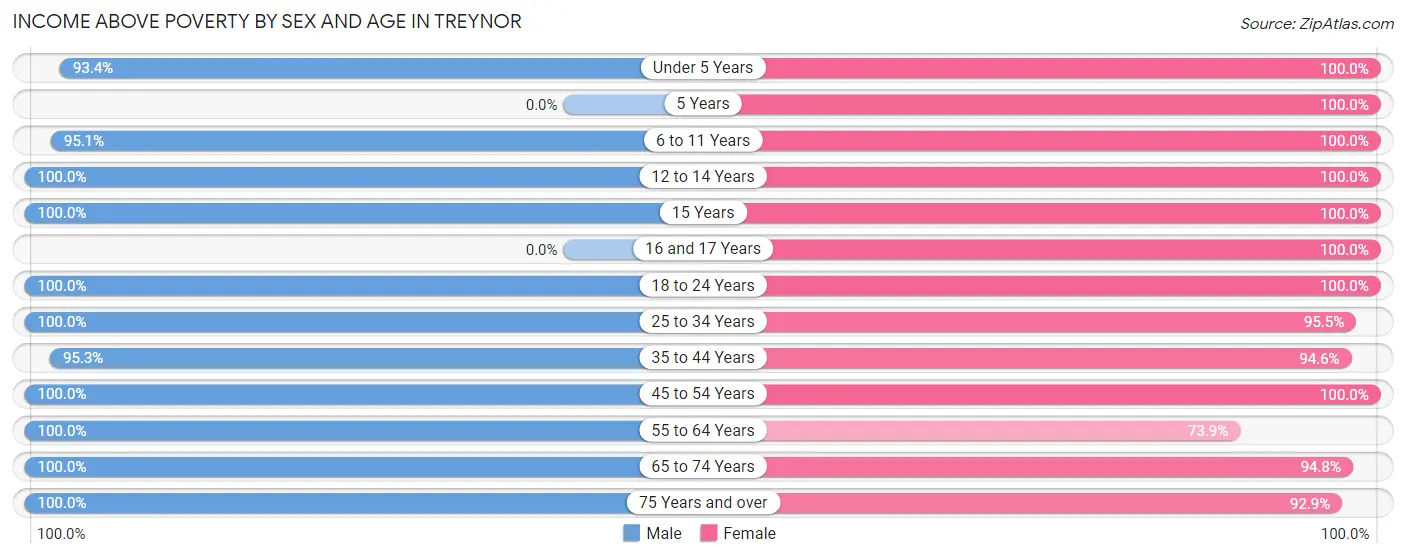
| Age Bracket | Male | Female |
| Under 5 Years | 57 (93.4%) | 22 (100.0%) |
| 5 Years | 0 (0.0%) | 20 (100.0%) |
| 6 to 11 Years | 78 (95.1%) | 57 (100.0%) |
| 12 to 14 Years | 13 (100.0%) | 17 (100.0%) |
| 15 Years | 5 (100.0%) | 3 (100.0%) |
| 16 and 17 Years | 0 (0.0%) | 14 (100.0%) |
| 18 to 24 Years | 22 (100.0%) | 31 (100.0%) |
| 25 to 34 Years | 52 (100.0%) | 84 (95.5%) |
| 35 to 44 Years | 81 (95.3%) | 70 (94.6%) |
| 45 to 54 Years | 53 (100.0%) | 42 (100.0%) |
| 55 to 64 Years | 70 (100.0%) | 68 (73.9%) |
| 65 to 74 Years | 42 (100.0%) | 55 (94.8%) |
| 75 Years and over | 37 (100.0%) | 26 (92.9%) |
| Total | 510 (97.7%) | 509 (93.2%) |
Income Below Poverty Among Married-Couple Families in Treynor
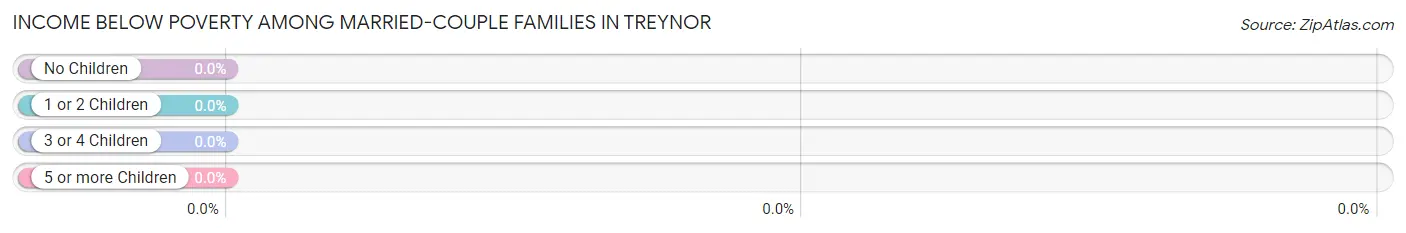
| Children | Above Poverty | Below Poverty |
| No Children | 179 (100.0%) | 0 (0.0%) |
| 1 or 2 Children | 70 (100.0%) | 0 (0.0%) |
| 3 or 4 Children | 40 (100.0%) | 0 (0.0%) |
| 5 or more Children | 0 (0.0%) | 0 (0.0%) |
| Total | 289 (100.0%) | 0 (0.0%) |
Income Below Poverty Among Single-Parent Households in Treynor
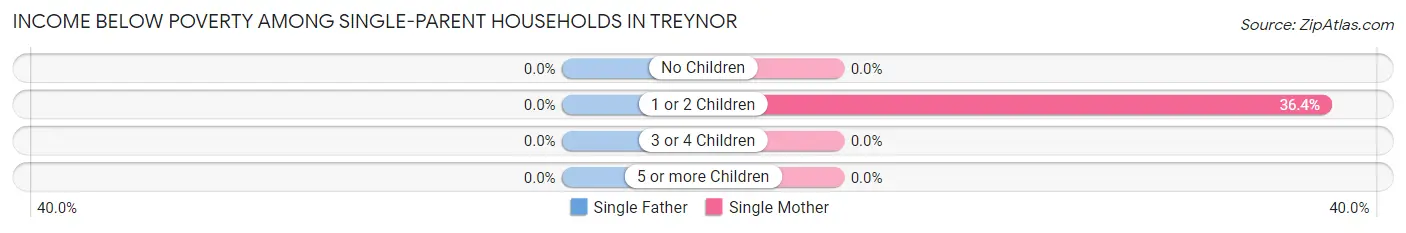
| Children | Single Father | Single Mother |
| No Children | 0 (0.0%) | 0 (0.0%) |
| 1 or 2 Children | 0 (0.0%) | 4 (36.4%) |
| 3 or 4 Children | 0 (0.0%) | 0 (0.0%) |
| 5 or more Children | 0 (0.0%) | 0 (0.0%) |
| Total | 0 (0.0%) | 4 (18.2%) |
Income Below Poverty Among Married-Couple vs Single-Parent Households in Treynor
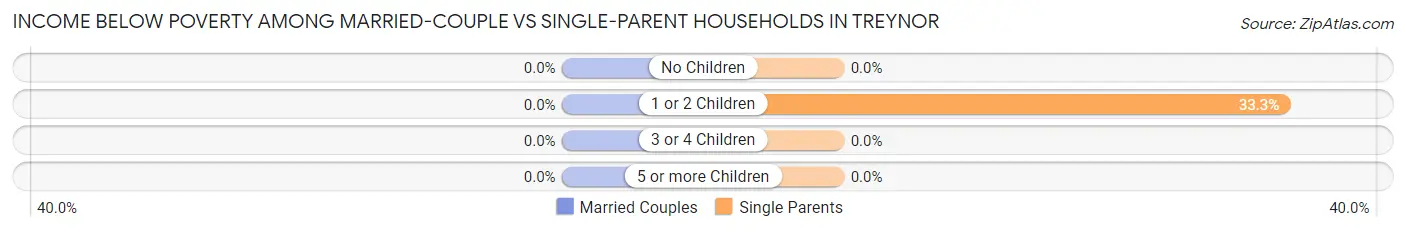
| Children | Married-Couple Families | Single-Parent Households |
| No Children | 0 (0.0%) | 0 (0.0%) |
| 1 or 2 Children | 0 (0.0%) | 4 (33.3%) |
| 3 or 4 Children | 0 (0.0%) | 0 (0.0%) |
| 5 or more Children | 0 (0.0%) | 0 (0.0%) |
| Total | 0 (0.0%) | 4 (17.4%) |
Race in Treynor
The most populous races in Treynor are White / Caucasian (1,026 | 95.8%), Hispanic or Latino (47 | 4.4%), and Two or more Races (45 | 4.2%).
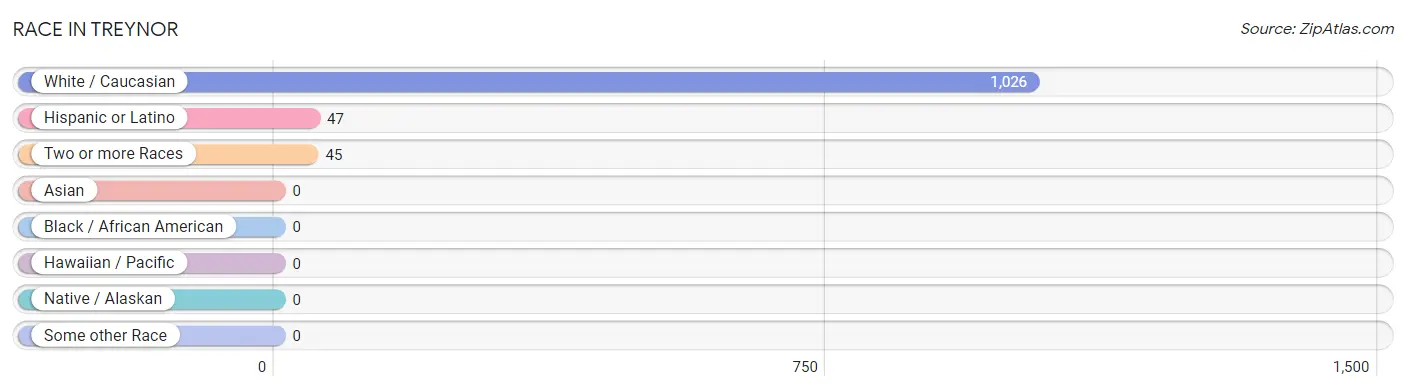
| Race | # Population | % Population |
| Asian | 0 | 0.0% |
| Black / African American | 0 | 0.0% |
| Hawaiian / Pacific | 0 | 0.0% |
| Hispanic or Latino | 47 | 4.4% |
| Native / Alaskan | 0 | 0.0% |
| White / Caucasian | 1,026 | 95.8% |
| Two or more Races | 45 | 4.2% |
| Some other Race | 0 | 0.0% |
| Total | 1,071 | 100.0% |
Ancestry in Treynor
The most populous ancestries reported in Treynor are German (308 | 28.8%), American (134 | 12.5%), English (131 | 12.2%), Irish (55 | 5.1%), and Danish (54 | 5.0%), together accounting for 63.7% of all Treynor residents.
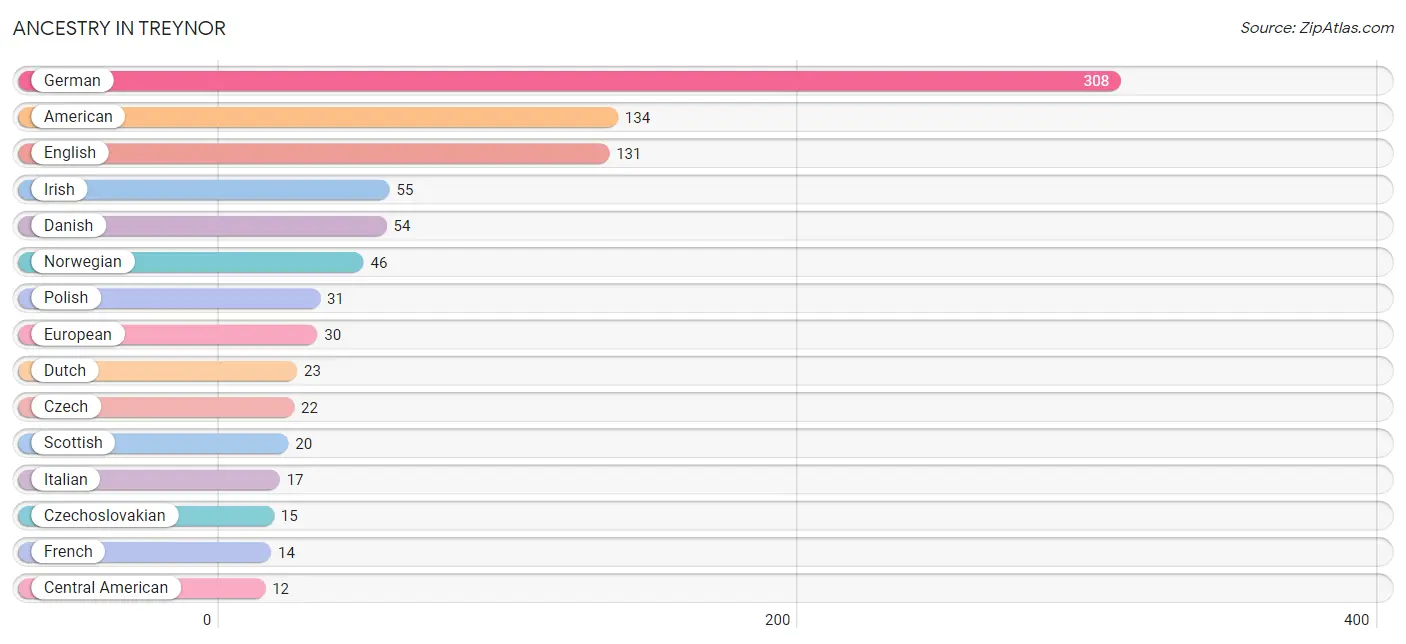
| Ancestry | # Population | % Population |
| American | 134 | 12.5% |
| Austrian | 3 | 0.3% |
| British | 8 | 0.7% |
| Central American | 12 | 1.1% |
| Czech | 22 | 2.1% |
| Czechoslovakian | 15 | 1.4% |
| Danish | 54 | 5.0% |
| Dutch | 23 | 2.1% |
| English | 131 | 12.2% |
| European | 30 | 2.8% |
| French | 14 | 1.3% |
| French Canadian | 2 | 0.2% |
| German | 308 | 28.8% |
| Honduran | 12 | 1.1% |
| Irish | 55 | 5.1% |
| Italian | 17 | 1.6% |
| Lithuanian | 3 | 0.3% |
| Mexican | 8 | 0.7% |
| Norwegian | 46 | 4.3% |
| Polish | 31 | 2.9% |
| Puerto Rican | 6 | 0.6% |
| Scandinavian | 7 | 0.6% |
| Scotch-Irish | 2 | 0.2% |
| Scottish | 20 | 1.9% |
| Swedish | 12 | 1.1% |
| Welsh | 3 | 0.3% | View All 26 Rows |
Immigrants in Treynor

| Immigration Origin | # Population | % Population | View All 0 Rows |
Sex and Age in Treynor
Sex and Age in Treynor
The most populous age groups in Treynor are 5 to 9 Years (67 | 12.8%) for men and 30 to 34 Years (83 | 15.1%) for women.
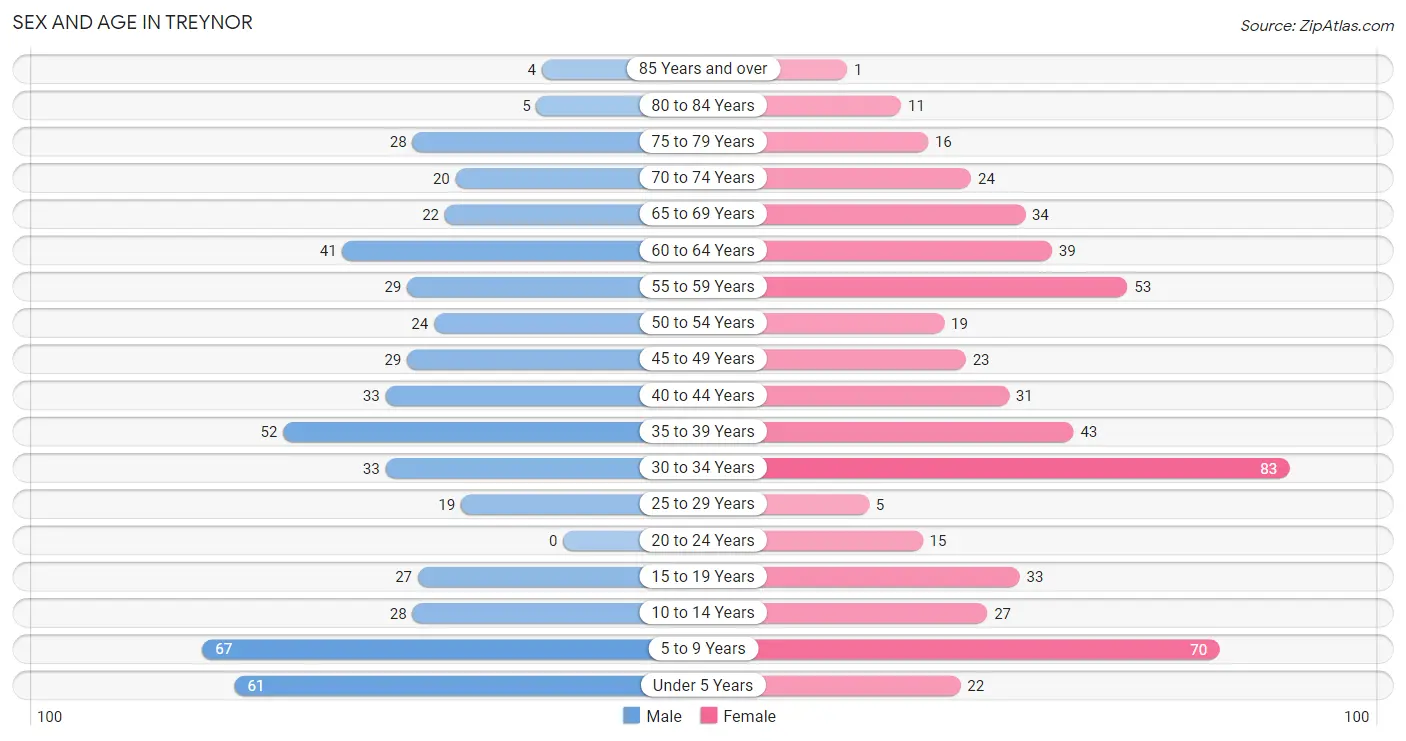
| Age Bracket | Male | Female |
| Under 5 Years | 61 (11.7%) | 22 (4.0%) |
| 5 to 9 Years | 67 (12.8%) | 70 (12.8%) |
| 10 to 14 Years | 28 (5.4%) | 27 (4.9%) |
| 15 to 19 Years | 27 (5.2%) | 33 (6.0%) |
| 20 to 24 Years | 0 (0.0%) | 15 (2.7%) |
| 25 to 29 Years | 19 (3.6%) | 5 (0.9%) |
| 30 to 34 Years | 33 (6.3%) | 83 (15.1%) |
| 35 to 39 Years | 52 (10.0%) | 43 (7.8%) |
| 40 to 44 Years | 33 (6.3%) | 31 (5.7%) |
| 45 to 49 Years | 29 (5.6%) | 23 (4.2%) |
| 50 to 54 Years | 24 (4.6%) | 19 (3.5%) |
| 55 to 59 Years | 29 (5.6%) | 53 (9.7%) |
| 60 to 64 Years | 41 (7.9%) | 39 (7.1%) |
| 65 to 69 Years | 22 (4.2%) | 34 (6.2%) |
| 70 to 74 Years | 20 (3.8%) | 24 (4.4%) |
| 75 to 79 Years | 28 (5.4%) | 16 (2.9%) |
| 80 to 84 Years | 5 (1.0%) | 11 (2.0%) |
| 85 Years and over | 4 (0.8%) | 1 (0.2%) |
| Total | 522 (100.0%) | 549 (100.0%) |
Families and Households in Treynor
Median Family Size in Treynor
The median family size in Treynor is 3.00 persons per family, with single male/father families (1 | 0.3%) accounting for the largest median family size of 7 persons per family. On the other hand, married-couple families (289 | 92.6%) represent the smallest median family size with 2.98 persons per family.
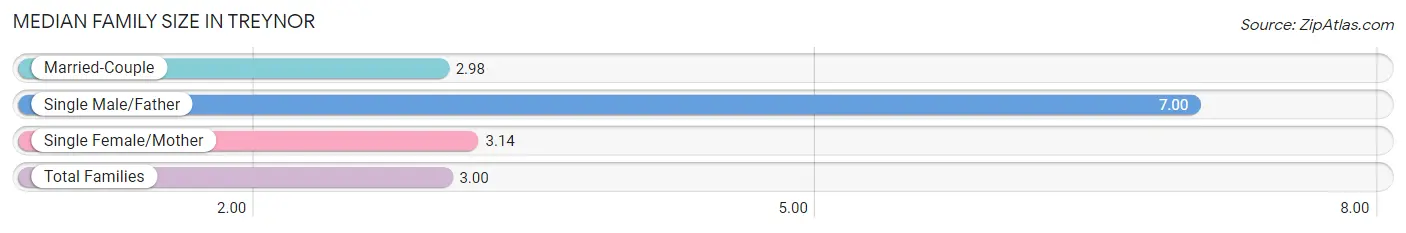
| Family Type | # Families | Family Size |
| Married-Couple | 289 (92.6%) | 2.98 |
| Single Male/Father | 1 (0.3%) | 7.00 |
| Single Female/Mother | 22 (7.0%) | 3.14 |
| Total Families | 312 (100.0%) | 3.00 |
Median Household Size in Treynor
The median household size in Treynor is 2.50 persons per household, with single male/father households (1 | 0.2%) accounting for the largest median household size of 12 persons per household. non-family households (117 | 27.3%) represent the smallest median household size with 1.08 persons per household.
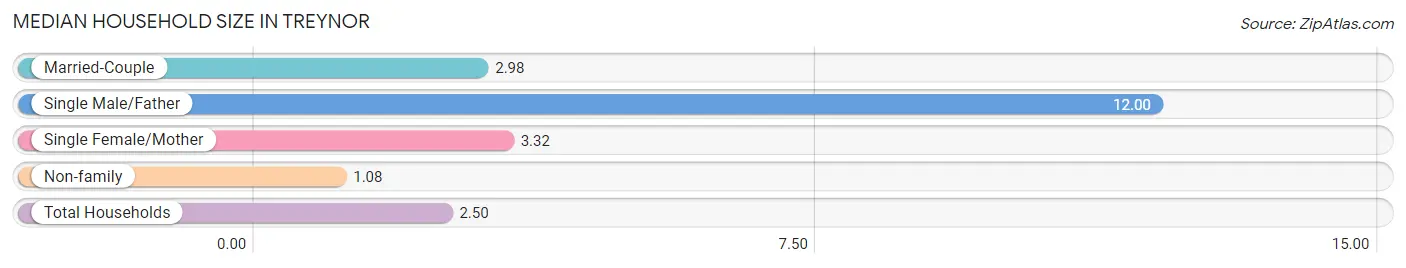
| Household Type | # Households | Household Size |
| Married-Couple | 289 (67.4%) | 2.98 |
| Single Male/Father | 1 (0.2%) | 12.00 |
| Single Female/Mother | 22 (5.1%) | 3.32 |
| Non-family | 117 (27.3%) | 1.08 |
| Total Households | 429 (100.0%) | 2.50 |
Household Size by Marriage Status in Treynor
Out of a total of 429 households in Treynor, 312 (72.7%) are family households, while 117 (27.3%) are nonfamily households. The most numerous type of family households are 2-person households, comprising 170, and the most common type of nonfamily households are 1-person households, comprising 109.
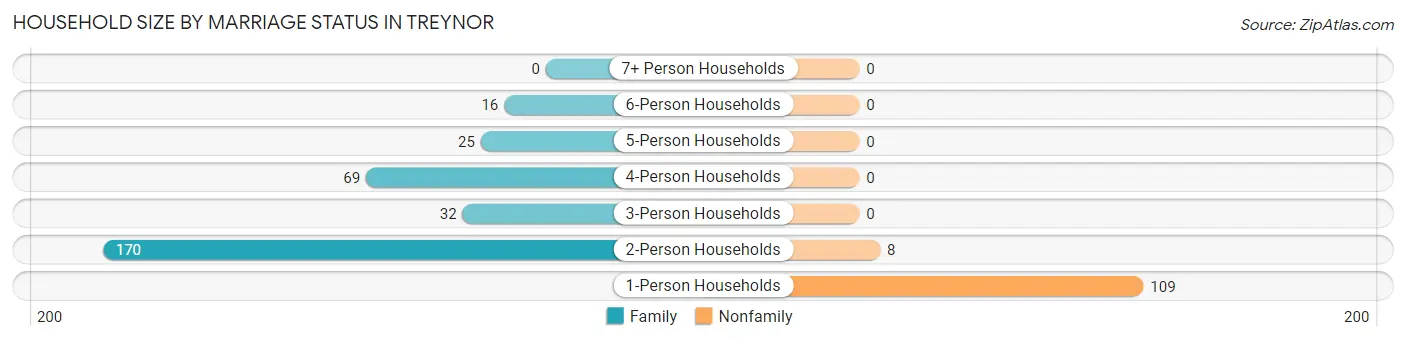
| Household Size | Family Households | Nonfamily Households |
| 1-Person Households | - | 109 (25.4%) |
| 2-Person Households | 170 (39.6%) | 8 (1.9%) |
| 3-Person Households | 32 (7.5%) | 0 (0.0%) |
| 4-Person Households | 69 (16.1%) | 0 (0.0%) |
| 5-Person Households | 25 (5.8%) | 0 (0.0%) |
| 6-Person Households | 16 (3.7%) | 0 (0.0%) |
| 7+ Person Households | 0 (0.0%) | 0 (0.0%) |
| Total | 312 (72.7%) | 117 (27.3%) |
Female Fertility in Treynor
Fertility by Age in Treynor
Average fertility rate in Treynor is 17.0 births per 1,000 women. Women in the age bracket of 20 to 34 years have the highest fertility rate with 39.0 births per 1,000 women. Women in the age bracket of 20 to 34 years acount for 100.0% of all women with births.
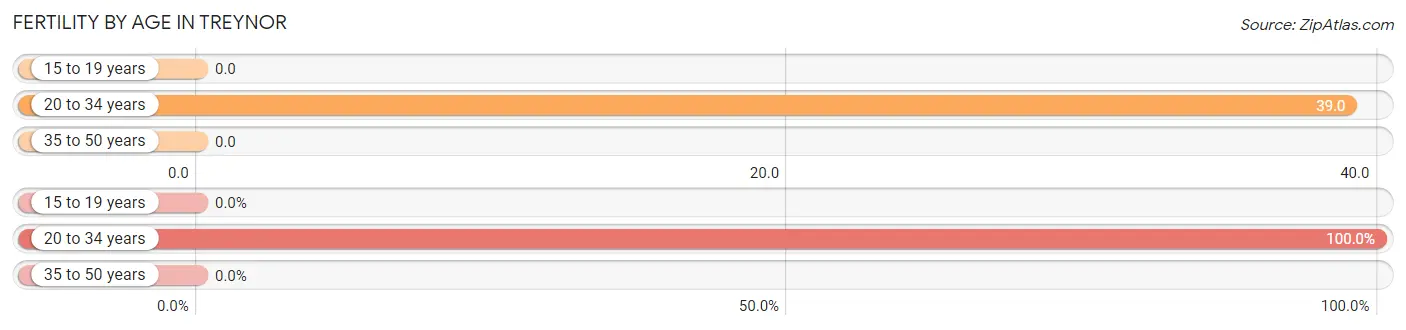
| Age Bracket | Women with Births | Births / 1,000 Women |
| 15 to 19 years | 0 (0.0%) | 0.0 |
| 20 to 34 years | 4 (100.0%) | 39.0 |
| 35 to 50 years | 0 (0.0%) | 0.0 |
| Total | 4 (100.0%) | 17.0 |
Fertility by Age by Marriage Status in Treynor
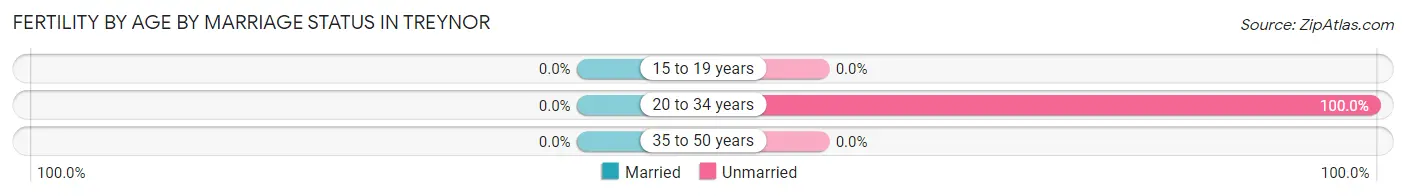
| Age Bracket | Married | Unmarried |
| 15 to 19 years | 0 (0.0%) | 0 (0.0%) |
| 20 to 34 years | 0 (0.0%) | 4 (100.0%) |
| 35 to 50 years | 0 (0.0%) | 0 (0.0%) |
| Total | 0 (0.0%) | 4 (100.0%) |
Fertility by Education in Treynor
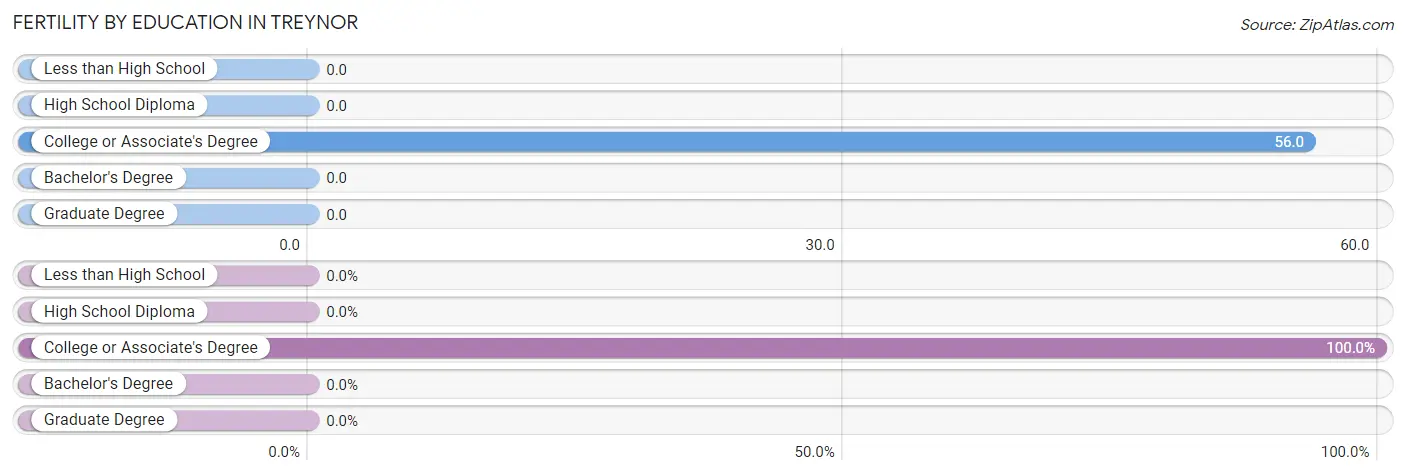
| Educational Attainment | Women with Births | Births / 1,000 Women |
| Less than High School | 0 (0.0%) | 0.0 |
| High School Diploma | 0 (0.0%) | 0.0 |
| College or Associate's Degree | 4 (100.0%) | 56.0 |
| Bachelor's Degree | 0 (0.0%) | 0.0 |
| Graduate Degree | 0 (0.0%) | 0.0 |
| Total | 4 (100.0%) | 17.0 |
Fertility by Education by Marriage Status in Treynor
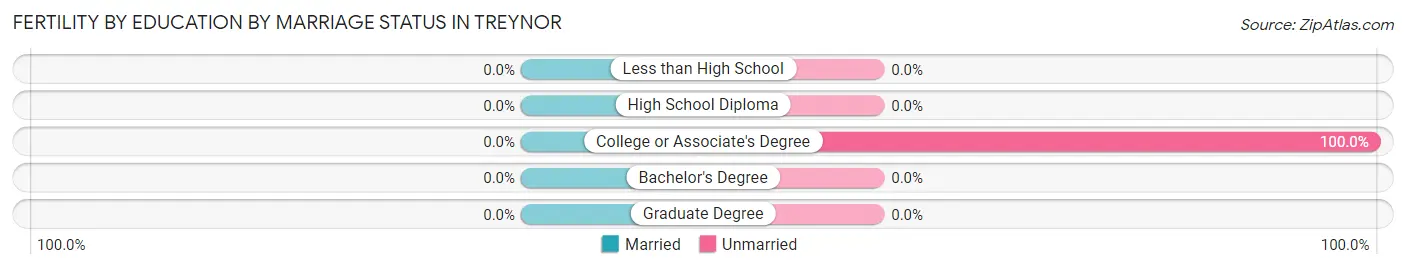
| Educational Attainment | Married | Unmarried |
| Less than High School | 0 (0.0%) | 0 (0.0%) |
| High School Diploma | 0 (0.0%) | 0 (0.0%) |
| College or Associate's Degree | 0 (0.0%) | 4 (100.0%) |
| Bachelor's Degree | 0 (0.0%) | 0 (0.0%) |
| Graduate Degree | 0 (0.0%) | 0 (0.0%) |
| Total | 0 (0.0%) | 4 (100.0%) |
Employment Characteristics in Treynor
Employment by Class of Employer in Treynor
Among the 552 employed individuals in Treynor, private company employees (339 | 61.4%), local government employees (73 | 13.2%), and not-for-profit organizations (70 | 12.7%) make up the most common classes of employment.
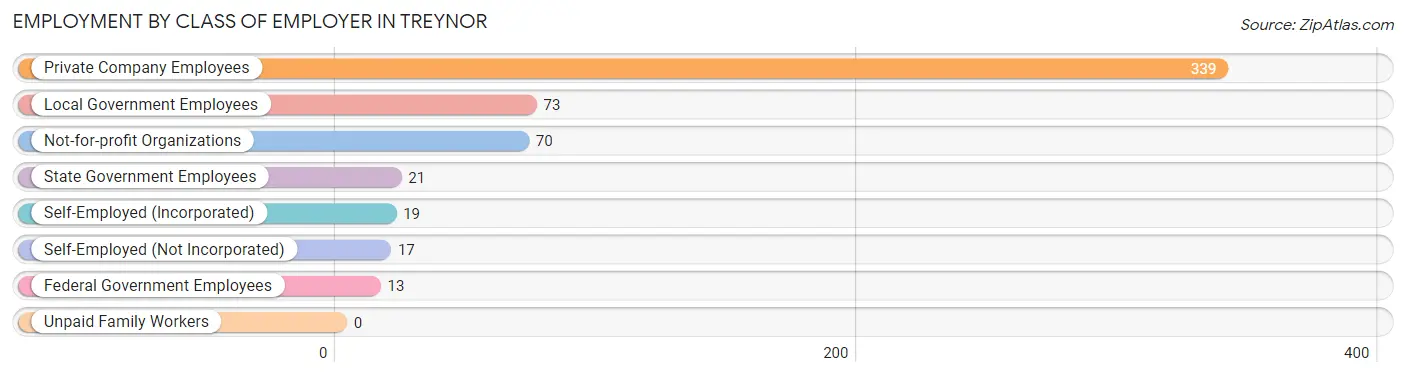
| Employer Class | # Employees | % Employees |
| Private Company Employees | 339 | 61.4% |
| Self-Employed (Incorporated) | 19 | 3.4% |
| Self-Employed (Not Incorporated) | 17 | 3.1% |
| Not-for-profit Organizations | 70 | 12.7% |
| Local Government Employees | 73 | 13.2% |
| State Government Employees | 21 | 3.8% |
| Federal Government Employees | 13 | 2.4% |
| Unpaid Family Workers | 0 | 0.0% |
| Total | 552 | 100.0% |
Employment Status by Age in Treynor
According to the labor force statistics for Treynor, out of the total population over 16 years of age (788), 74.2% or 585 individuals are in the labor force, with 3.6% or 21 of them unemployed. The age group with the highest labor force participation rate is 20 to 24 years, with 100.0% or 15 individuals in the labor force. Within the labor force, the 55 to 59 years age range has the highest percentage of unemployed individuals, with 27.6% or 21 of them being unemployed.
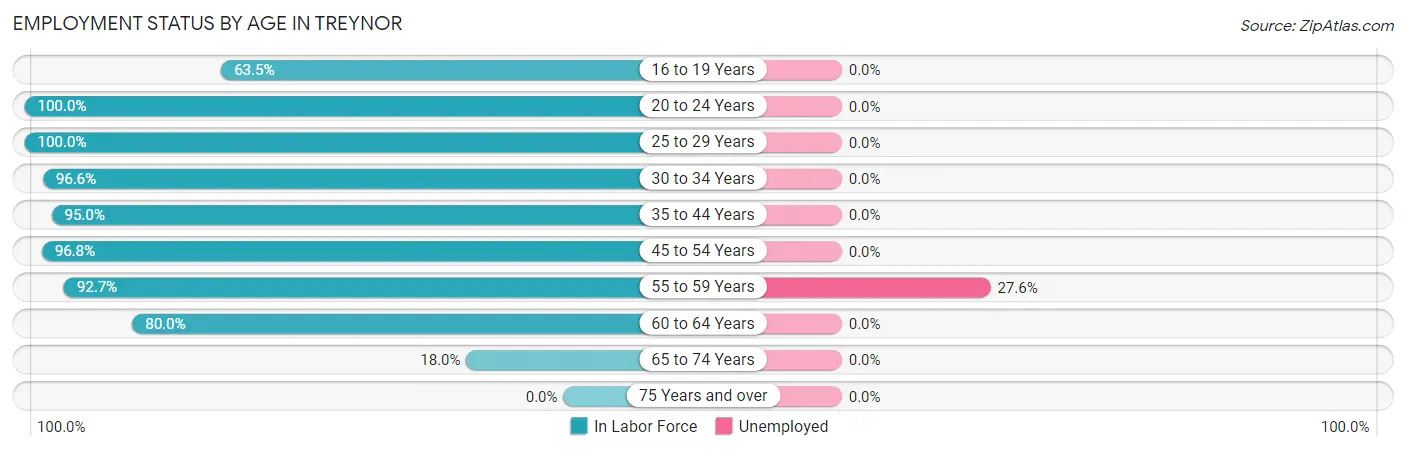
| Age Bracket | In Labor Force | Unemployed |
| 16 to 19 Years | 33 (63.5%) | 0 (0.0%) |
| 20 to 24 Years | 15 (100.0%) | 0 (0.0%) |
| 25 to 29 Years | 24 (100.0%) | 0 (0.0%) |
| 30 to 34 Years | 112 (96.6%) | 0 (0.0%) |
| 35 to 44 Years | 151 (95.0%) | 0 (0.0%) |
| 45 to 54 Years | 92 (96.8%) | 0 (0.0%) |
| 55 to 59 Years | 76 (92.7%) | 21 (27.6%) |
| 60 to 64 Years | 64 (80.0%) | 0 (0.0%) |
| 65 to 74 Years | 18 (18.0%) | 0 (0.0%) |
| 75 Years and over | 0 (0.0%) | 0 (0.0%) |
| Total | 585 (74.2%) | 21 (3.6%) |
Employment Status by Educational Attainment in Treynor
According to labor force statistics for Treynor, 93.3% of individuals (519) out of the total population between 25 and 64 years of age (556) are in the labor force, with 4.1% or 21 of them being unemployed. The group with the highest labor force participation rate are those with the educational attainment of bachelor's degree or higher, with 95.3% or 222 individuals in the labor force. Within the labor force, individuals with high school diploma education have the highest percentage of unemployment, with 30.9% or 23 of them being unemployed.
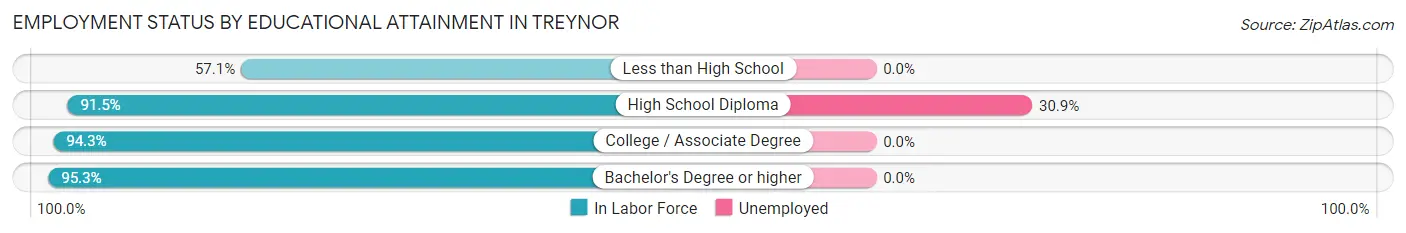
| Educational Attainment | In Labor Force | Unemployed |
| Less than High School | 8 (57.1%) | 0 (0.0%) |
| High School Diploma | 75 (91.5%) | 25 (30.9%) |
| College / Associate Degree | 214 (94.3%) | 0 (0.0%) |
| Bachelor's Degree or higher | 222 (95.3%) | 0 (0.0%) |
| Total | 519 (93.3%) | 23 (4.1%) |
Employment Occupations by Sex in Treynor
Management, Business, Science and Arts Occupations
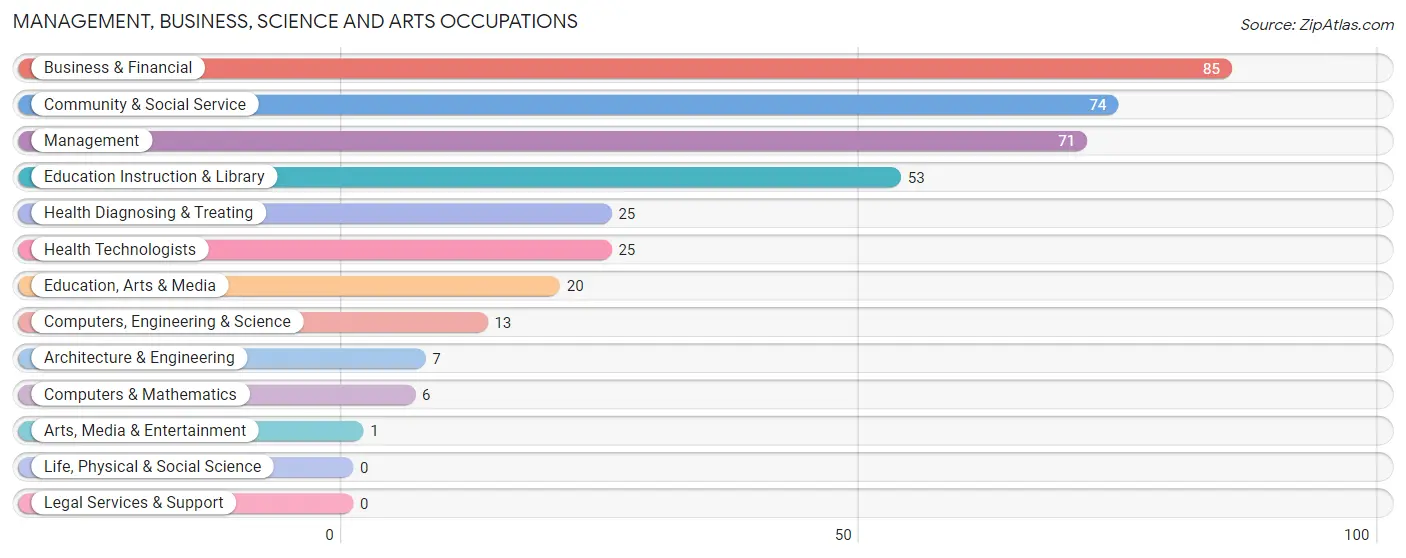
The most common Management, Business, Science and Arts occupations in Treynor are Business & Financial (85 | 15.3%), Community & Social Service (74 | 13.3%), Management (71 | 12.8%), Education Instruction & Library (53 | 9.5%), and Health Diagnosing & Treating (25 | 4.5%).
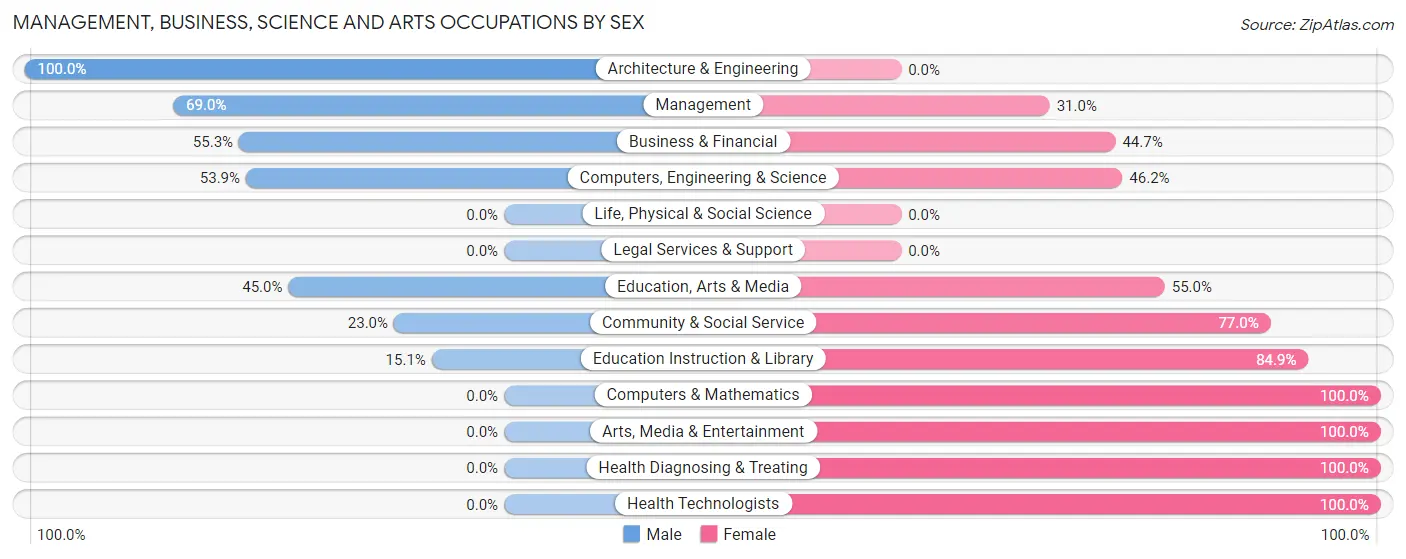
Management, Business, Science and Arts Occupations by Sex
Within the Management, Business, Science and Arts occupations in Treynor, the most male-oriented occupations are Architecture & Engineering (100.0%), Management (69.0%), and Business & Financial (55.3%), while the most female-oriented occupations are Computers & Mathematics (100.0%), Arts, Media & Entertainment (100.0%), and Health Diagnosing & Treating (100.0%).
| Occupation | Male | Female |
| Management | 49 (69.0%) | 22 (31.0%) |
| Business & Financial | 47 (55.3%) | 38 (44.7%) |
| Computers, Engineering & Science | 7 (53.8%) | 6 (46.2%) |
| Computers & Mathematics | 0 (0.0%) | 6 (100.0%) |
| Architecture & Engineering | 7 (100.0%) | 0 (0.0%) |
| Life, Physical & Social Science | 0 (0.0%) | 0 (0.0%) |
| Community & Social Service | 17 (23.0%) | 57 (77.0%) |
| Education, Arts & Media | 9 (45.0%) | 11 (55.0%) |
| Legal Services & Support | 0 (0.0%) | 0 (0.0%) |
| Education Instruction & Library | 8 (15.1%) | 45 (84.9%) |
| Arts, Media & Entertainment | 0 (0.0%) | 1 (100.0%) |
| Health Diagnosing & Treating | 0 (0.0%) | 25 (100.0%) |
| Health Technologists | 0 (0.0%) | 25 (100.0%) |
| Total (Category) | 120 (44.8%) | 148 (55.2%) |
| Total (Overall) | 269 (48.3%) | 288 (51.7%) |
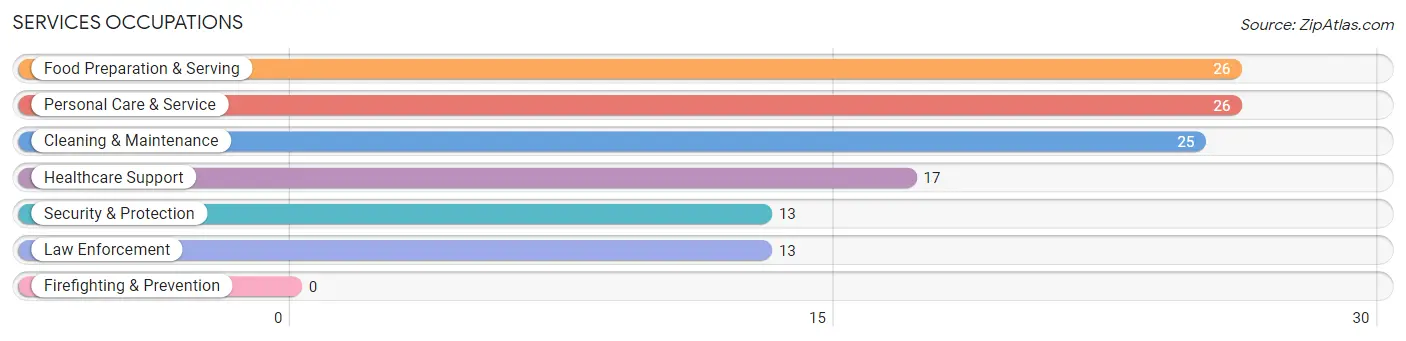
Services Occupations
The most common Services occupations in Treynor are Food Preparation & Serving (26 | 4.7%), Personal Care & Service (26 | 4.7%), Cleaning & Maintenance (25 | 4.5%), Healthcare Support (17 | 3.0%), and Security & Protection (13 | 2.3%).
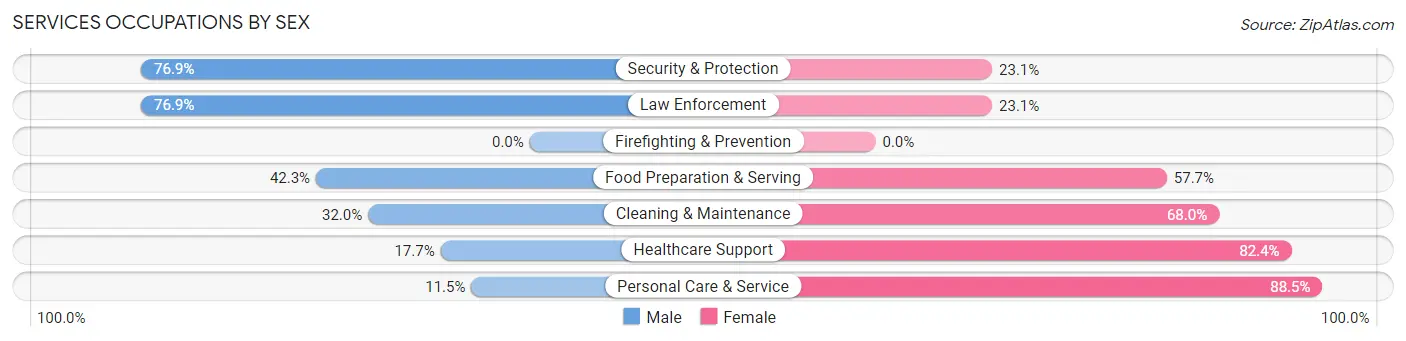
Services Occupations by Sex
Within the Services occupations in Treynor, the most male-oriented occupations are Security & Protection (76.9%), Law Enforcement (76.9%), and Food Preparation & Serving (42.3%), while the most female-oriented occupations are Personal Care & Service (88.5%), Healthcare Support (82.4%), and Cleaning & Maintenance (68.0%).
| Occupation | Male | Female |
| Healthcare Support | 3 (17.6%) | 14 (82.4%) |
| Security & Protection | 10 (76.9%) | 3 (23.1%) |
| Firefighting & Prevention | 0 (0.0%) | 0 (0.0%) |
| Law Enforcement | 10 (76.9%) | 3 (23.1%) |
| Food Preparation & Serving | 11 (42.3%) | 15 (57.7%) |
| Cleaning & Maintenance | 8 (32.0%) | 17 (68.0%) |
| Personal Care & Service | 3 (11.5%) | 23 (88.5%) |
| Total (Category) | 35 (32.7%) | 72 (67.3%) |
| Total (Overall) | 269 (48.3%) | 288 (51.7%) |
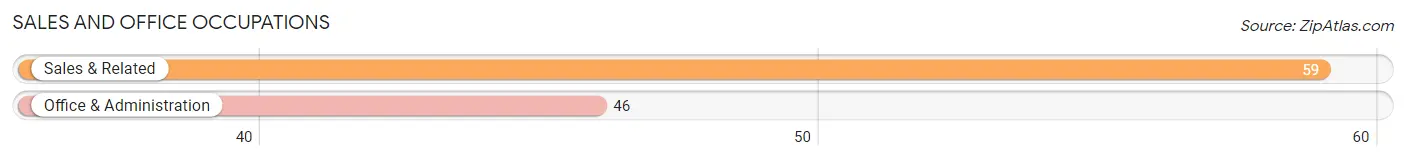
Sales and Office Occupations
The most common Sales and Office occupations in Treynor are Sales & Related (59 | 10.6%), and Office & Administration (46 | 8.3%).
Sales and Office Occupations by Sex
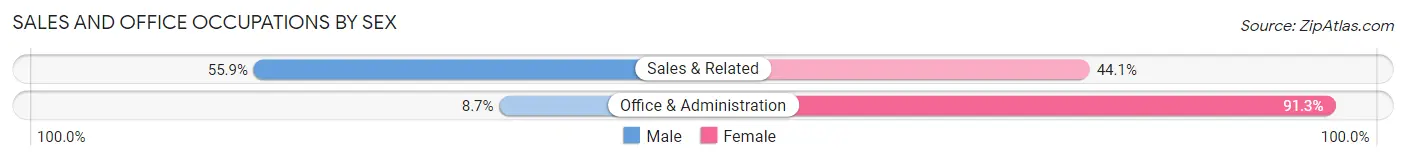
| Occupation | Male | Female |
| Sales & Related | 33 (55.9%) | 26 (44.1%) |
| Office & Administration | 4 (8.7%) | 42 (91.3%) |
| Total (Category) | 37 (35.2%) | 68 (64.8%) |
| Total (Overall) | 269 (48.3%) | 288 (51.7%) |
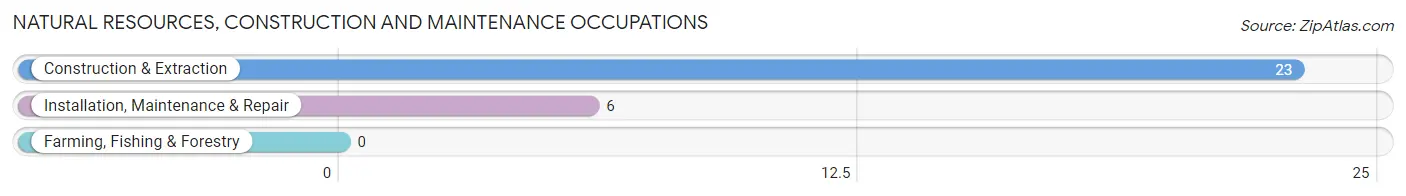
Natural Resources, Construction and Maintenance Occupations
The most common Natural Resources, Construction and Maintenance occupations in Treynor are Construction & Extraction (23 | 4.1%), and Installation, Maintenance & Repair (6 | 1.1%).
Natural Resources, Construction and Maintenance Occupations by Sex
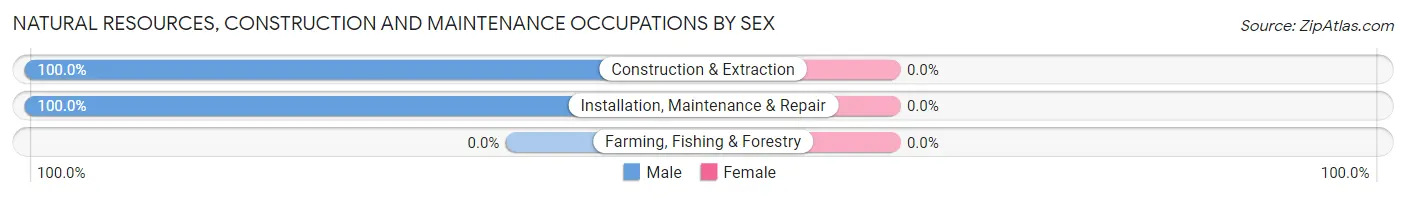
| Occupation | Male | Female |
| Farming, Fishing & Forestry | 0 (0.0%) | 0 (0.0%) |
| Construction & Extraction | 23 (100.0%) | 0 (0.0%) |
| Installation, Maintenance & Repair | 6 (100.0%) | 0 (0.0%) |
| Total (Category) | 29 (100.0%) | 0 (0.0%) |
| Total (Overall) | 269 (48.3%) | 288 (51.7%) |
Production, Transportation and Moving Occupations
The most common Production, Transportation and Moving occupations in Treynor are Transportation (18 | 3.2%), Production (15 | 2.7%), and Material Moving (15 | 2.7%).
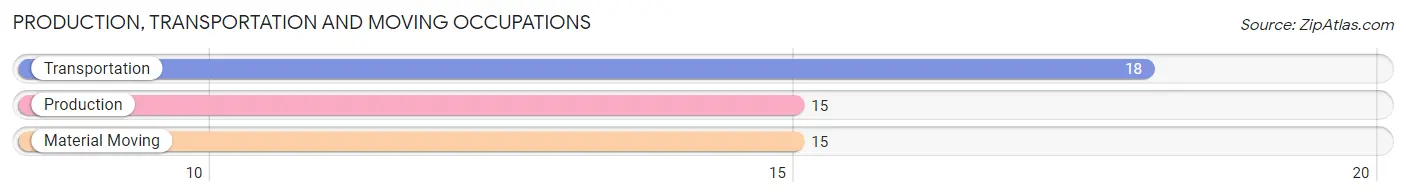
Production, Transportation and Moving Occupations by Sex
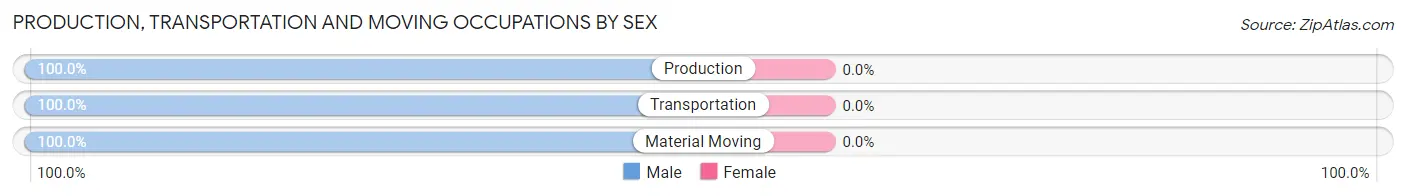
| Occupation | Male | Female |
| Production | 15 (100.0%) | 0 (0.0%) |
| Transportation | 18 (100.0%) | 0 (0.0%) |
| Material Moving | 15 (100.0%) | 0 (0.0%) |
| Total (Category) | 48 (100.0%) | 0 (0.0%) |
| Total (Overall) | 269 (48.3%) | 288 (51.7%) |
Employment Industries by Sex in Treynor
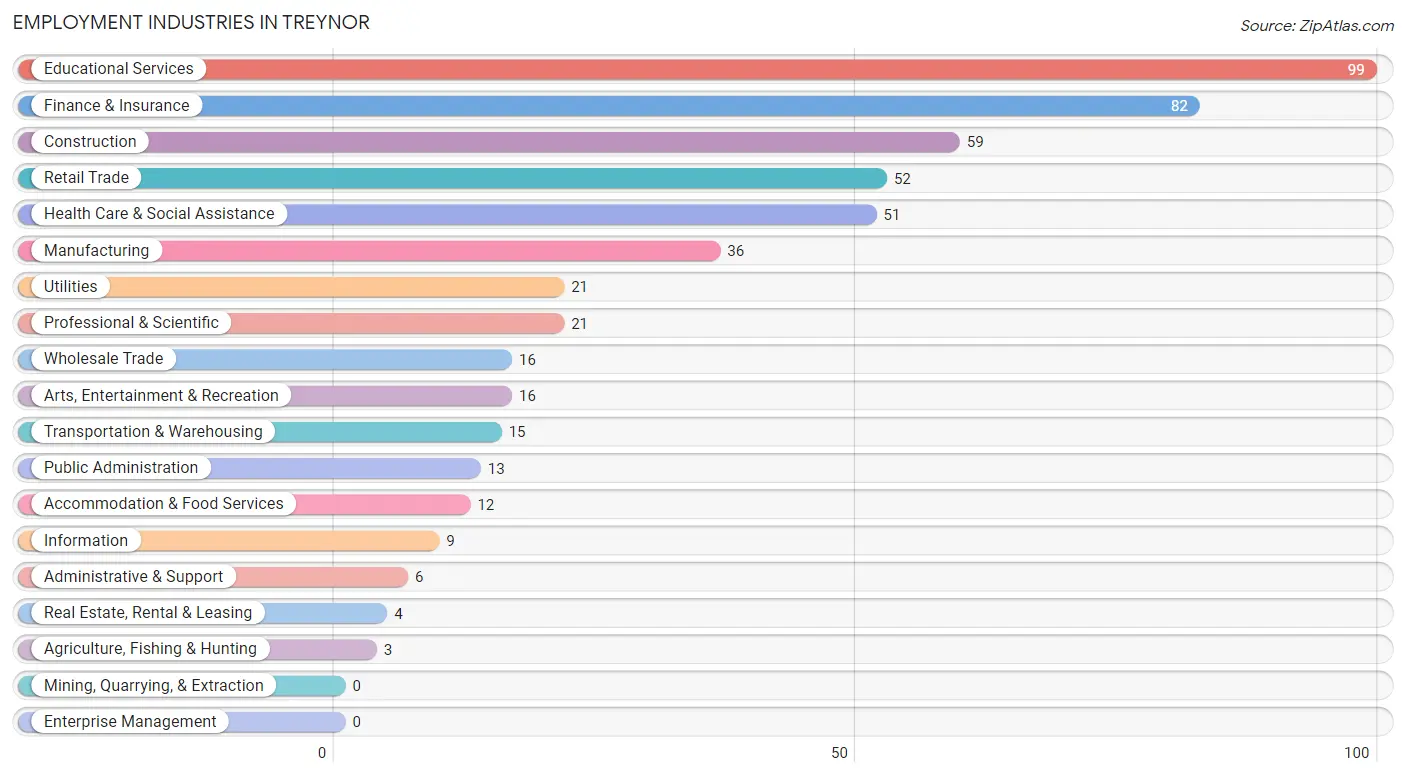
Employment Industries in Treynor
The major employment industries in Treynor include Educational Services (99 | 17.8%), Finance & Insurance (82 | 14.7%), Construction (59 | 10.6%), Retail Trade (52 | 9.3%), and Health Care & Social Assistance (51 | 9.2%).
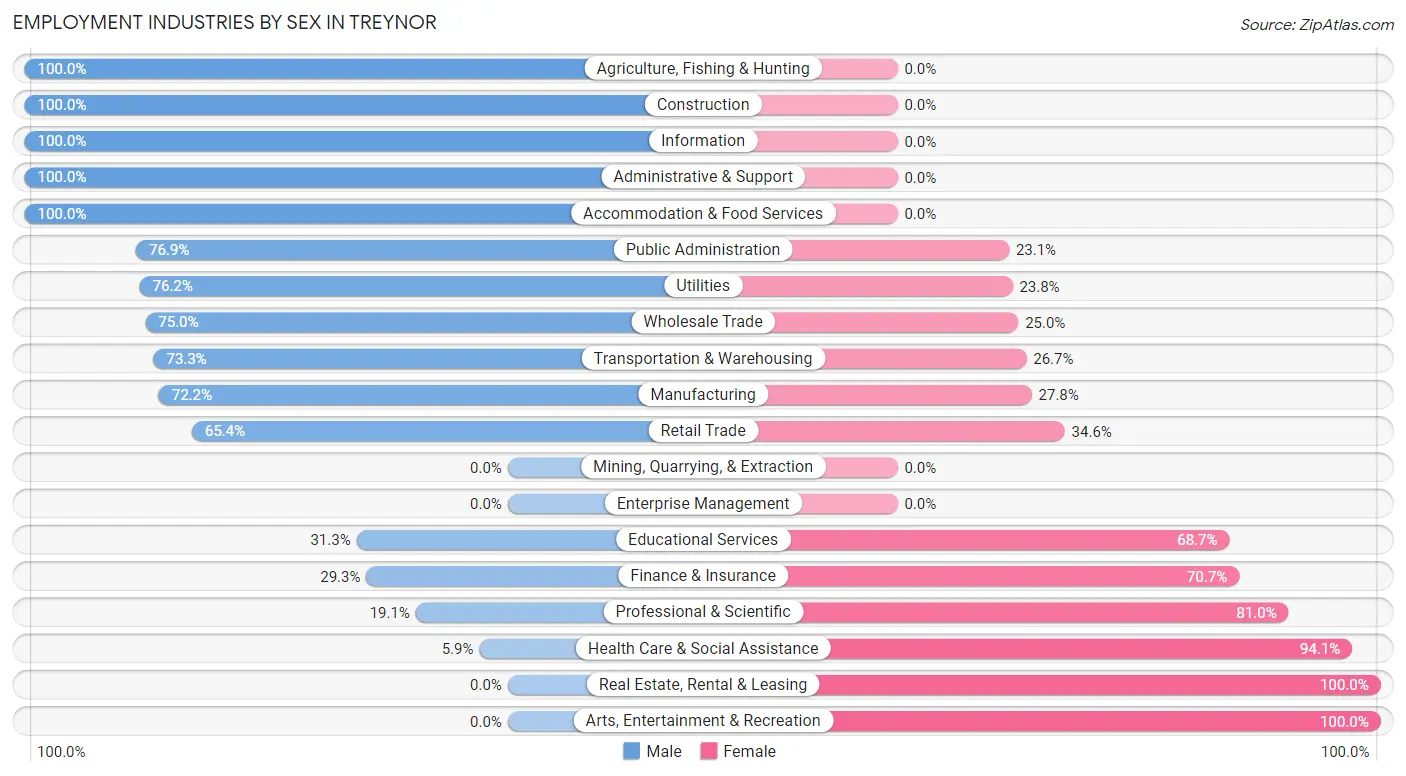
Employment Industries by Sex in Treynor
The Treynor industries that see more men than women are Agriculture, Fishing & Hunting (100.0%), Construction (100.0%), and Information (100.0%), whereas the industries that tend to have a higher number of women are Real Estate, Rental & Leasing (100.0%), Arts, Entertainment & Recreation (100.0%), and Health Care & Social Assistance (94.1%).
| Industry | Male | Female |
| Agriculture, Fishing & Hunting | 3 (100.0%) | 0 (0.0%) |
| Mining, Quarrying, & Extraction | 0 (0.0%) | 0 (0.0%) |
| Construction | 59 (100.0%) | 0 (0.0%) |
| Manufacturing | 26 (72.2%) | 10 (27.8%) |
| Wholesale Trade | 12 (75.0%) | 4 (25.0%) |
| Retail Trade | 34 (65.4%) | 18 (34.6%) |
| Transportation & Warehousing | 11 (73.3%) | 4 (26.7%) |
| Utilities | 16 (76.2%) | 5 (23.8%) |
| Information | 9 (100.0%) | 0 (0.0%) |
| Finance & Insurance | 24 (29.3%) | 58 (70.7%) |
| Real Estate, Rental & Leasing | 0 (0.0%) | 4 (100.0%) |
| Professional & Scientific | 4 (19.1%) | 17 (80.9%) |
| Enterprise Management | 0 (0.0%) | 0 (0.0%) |
| Administrative & Support | 6 (100.0%) | 0 (0.0%) |
| Educational Services | 31 (31.3%) | 68 (68.7%) |
| Health Care & Social Assistance | 3 (5.9%) | 48 (94.1%) |
| Arts, Entertainment & Recreation | 0 (0.0%) | 16 (100.0%) |
| Accommodation & Food Services | 12 (100.0%) | 0 (0.0%) |
| Public Administration | 10 (76.9%) | 3 (23.1%) |
| Total | 269 (48.3%) | 288 (51.7%) |
Education in Treynor
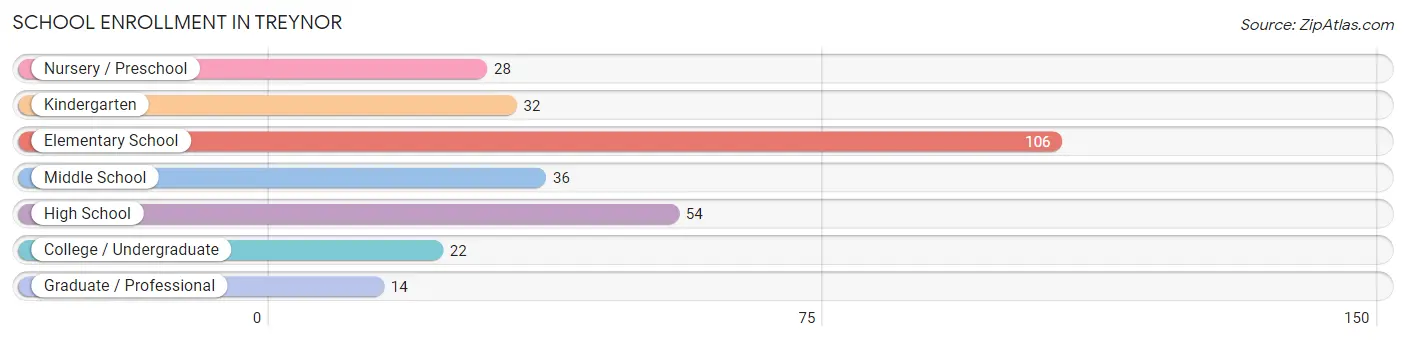
School Enrollment in Treynor
The most common levels of schooling among the 292 students in Treynor are elementary school (106 | 36.3%), high school (54 | 18.5%), and middle school (36 | 12.3%).
| School Level | # Students | % Students |
| Nursery / Preschool | 28 | 9.6% |
| Kindergarten | 32 | 11.0% |
| Elementary School | 106 | 36.3% |
| Middle School | 36 | 12.3% |
| High School | 54 | 18.5% |
| College / Undergraduate | 22 | 7.5% |
| Graduate / Professional | 14 | 4.8% |
| Total | 292 | 100.0% |
School Enrollment by Age by Funding Source in Treynor
Out of a total of 292 students who are enrolled in schools in Treynor, 45 (15.4%) attend a private institution, while the remaining 247 (84.6%) are enrolled in public schools. The age group of 3 to 4 year olds has the highest likelihood of being enrolled in private schools, with 24 (100.0% in the age bracket) enrolled. Conversely, the age group of 18 to 19 year olds has the lowest likelihood of being enrolled in a private school, with 33 (100.0% in the age bracket) attending a public institution.
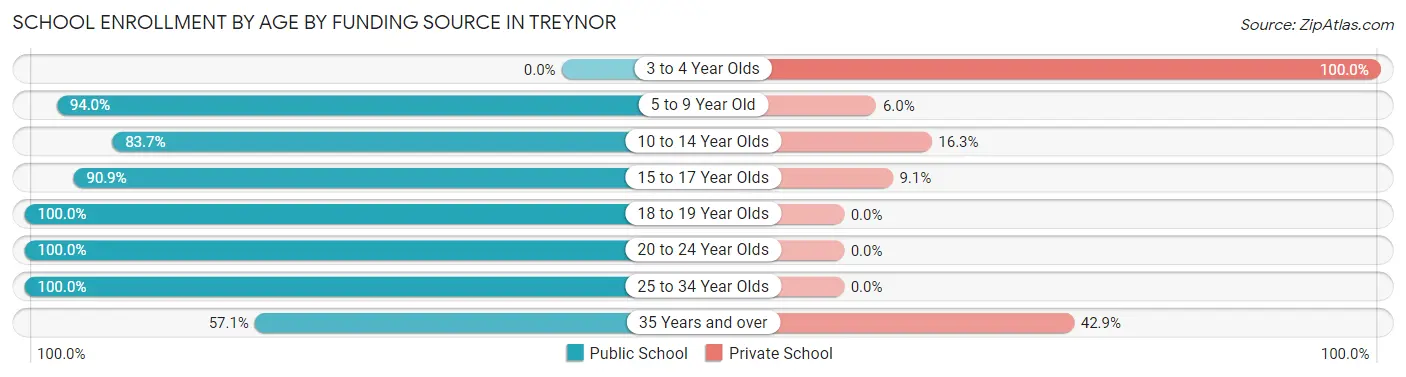
| Age Bracket | Public School | Private School |
| 3 to 4 Year Olds | 0 (0.0%) | 24 (100.0%) |
| 5 to 9 Year Old | 125 (94.0%) | 8 (6.0%) |
| 10 to 14 Year Olds | 41 (83.7%) | 8 (16.3%) |
| 15 to 17 Year Olds | 20 (90.9%) | 2 (9.1%) |
| 18 to 19 Year Olds | 33 (100.0%) | 0 (0.0%) |
| 20 to 24 Year Olds | 8 (100.0%) | 0 (0.0%) |
| 25 to 34 Year Olds | 16 (100.0%) | 0 (0.0%) |
| 35 Years and over | 4 (57.1%) | 3 (42.9%) |
| Total | 247 (84.6%) | 45 (15.4%) |
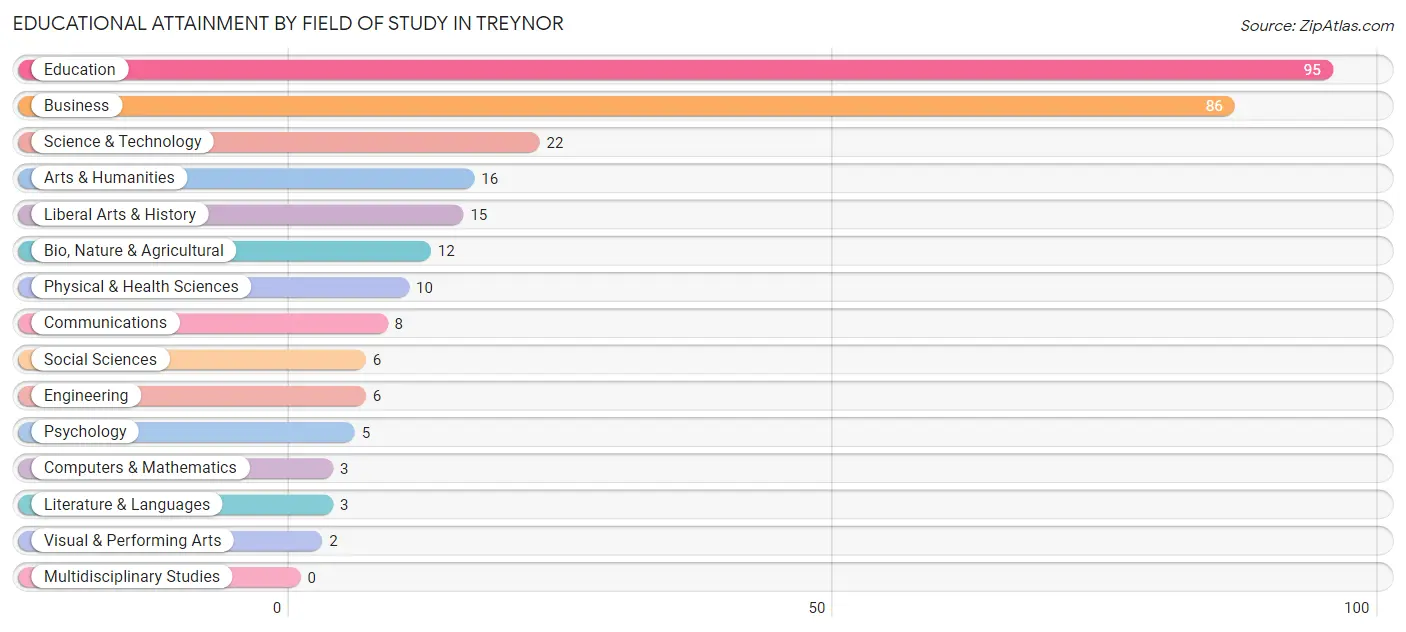
Educational Attainment by Field of Study in Treynor
Education (95 | 32.9%), business (86 | 29.8%), science & technology (22 | 7.6%), arts & humanities (16 | 5.5%), and liberal arts & history (15 | 5.2%) are the most common fields of study among 289 individuals in Treynor who have obtained a bachelor's degree or higher.
| Field of Study | # Graduates | % Graduates |
| Computers & Mathematics | 3 | 1.0% |
| Bio, Nature & Agricultural | 12 | 4.2% |
| Physical & Health Sciences | 10 | 3.5% |
| Psychology | 5 | 1.7% |
| Social Sciences | 6 | 2.1% |
| Engineering | 6 | 2.1% |
| Multidisciplinary Studies | 0 | 0.0% |
| Science & Technology | 22 | 7.6% |
| Business | 86 | 29.8% |
| Education | 95 | 32.9% |
| Literature & Languages | 3 | 1.0% |
| Liberal Arts & History | 15 | 5.2% |
| Visual & Performing Arts | 2 | 0.7% |
| Communications | 8 | 2.8% |
| Arts & Humanities | 16 | 5.5% |
| Total | 289 | 100.0% |
Transportation & Commute in Treynor
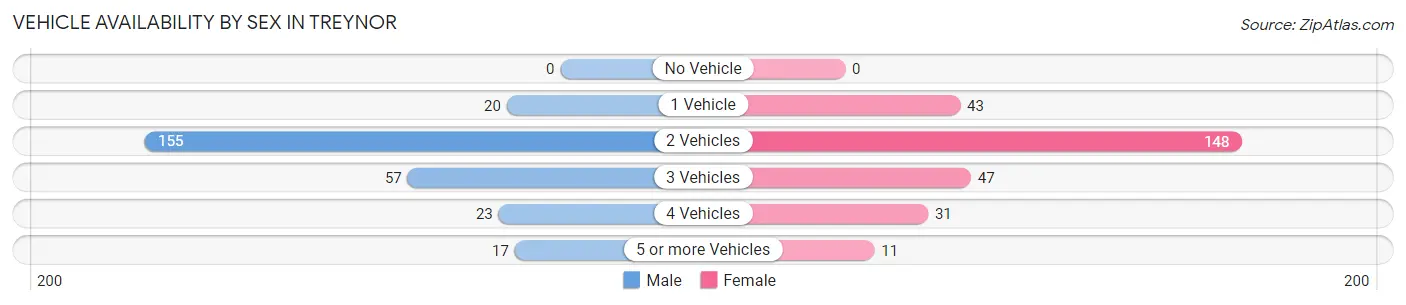
Vehicle Availability by Sex in Treynor
The most prevalent vehicle ownership categories in Treynor are males with 2 vehicles (155, accounting for 57.0%) and females with 2 vehicles (148, making up 55.4%).
| Vehicles Available | Male | Female |
| No Vehicle | 0 (0.0%) | 0 (0.0%) |
| 1 Vehicle | 20 (7.3%) | 43 (15.4%) |
| 2 Vehicles | 155 (57.0%) | 148 (52.9%) |
| 3 Vehicles | 57 (21.0%) | 47 (16.8%) |
| 4 Vehicles | 23 (8.5%) | 31 (11.1%) |
| 5 or more Vehicles | 17 (6.2%) | 11 (3.9%) |
| Total | 272 (100.0%) | 280 (100.0%) |
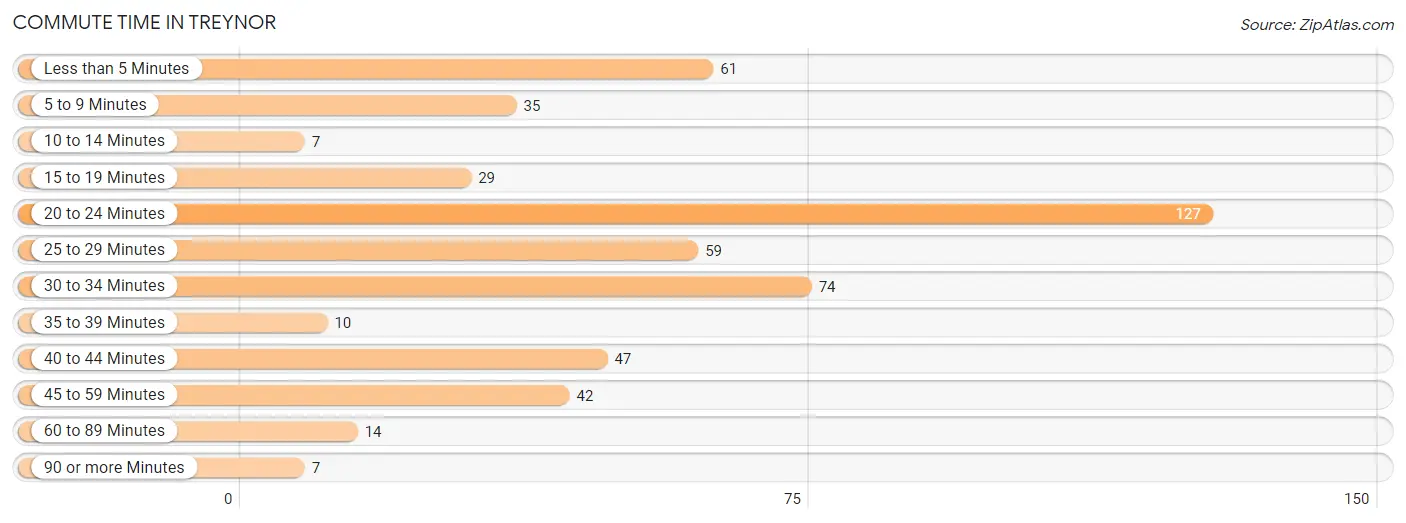
Commute Time in Treynor
The most frequently occuring commute durations in Treynor are 20 to 24 minutes (127 commuters, 24.8%), 30 to 34 minutes (74 commuters, 14.4%), and less than 5 minutes (61 commuters, 11.9%).
| Commute Time | # Commuters | % Commuters |
| Less than 5 Minutes | 61 | 11.9% |
| 5 to 9 Minutes | 35 | 6.8% |
| 10 to 14 Minutes | 7 | 1.4% |
| 15 to 19 Minutes | 29 | 5.7% |
| 20 to 24 Minutes | 127 | 24.8% |
| 25 to 29 Minutes | 59 | 11.5% |
| 30 to 34 Minutes | 74 | 14.4% |
| 35 to 39 Minutes | 10 | 1.9% |
| 40 to 44 Minutes | 47 | 9.2% |
| 45 to 59 Minutes | 42 | 8.2% |
| 60 to 89 Minutes | 14 | 2.7% |
| 90 or more Minutes | 7 | 1.4% |
Commute Time by Sex in Treynor
The most common commute times in Treynor are 20 to 24 minutes (48 commuters, 18.2%) for males and 20 to 24 minutes (79 commuters, 31.9%) for females.
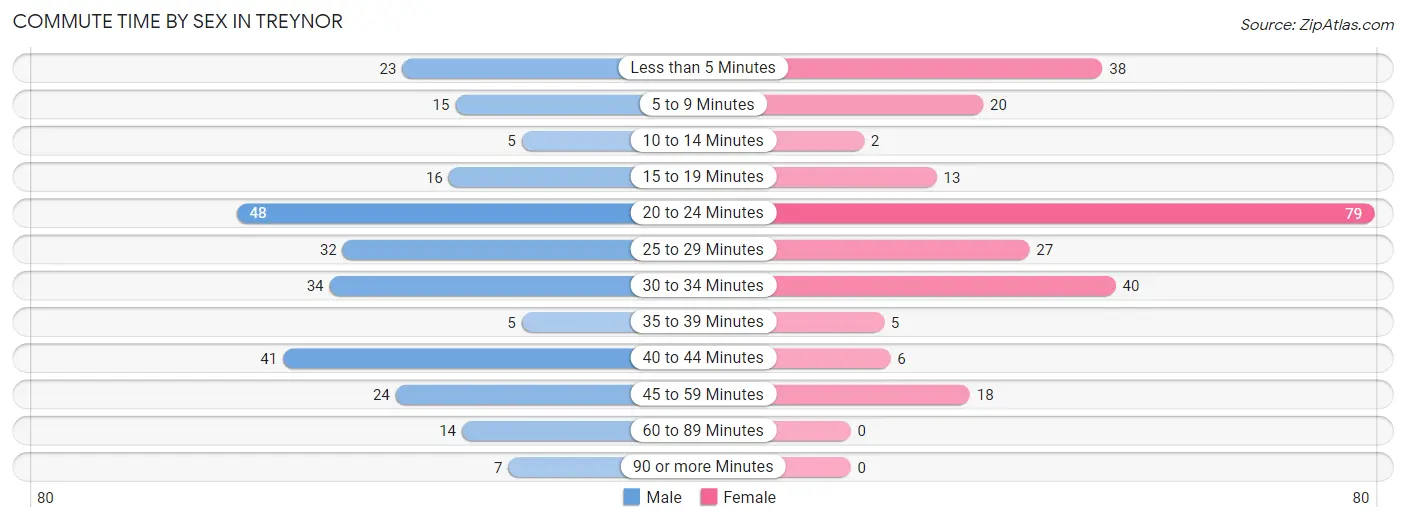
| Commute Time | Male | Female |
| Less than 5 Minutes | 23 (8.7%) | 38 (15.3%) |
| 5 to 9 Minutes | 15 (5.7%) | 20 (8.1%) |
| 10 to 14 Minutes | 5 (1.9%) | 2 (0.8%) |
| 15 to 19 Minutes | 16 (6.1%) | 13 (5.2%) |
| 20 to 24 Minutes | 48 (18.2%) | 79 (31.9%) |
| 25 to 29 Minutes | 32 (12.1%) | 27 (10.9%) |
| 30 to 34 Minutes | 34 (12.9%) | 40 (16.1%) |
| 35 to 39 Minutes | 5 (1.9%) | 5 (2.0%) |
| 40 to 44 Minutes | 41 (15.5%) | 6 (2.4%) |
| 45 to 59 Minutes | 24 (9.1%) | 18 (7.3%) |
| 60 to 89 Minutes | 14 (5.3%) | 0 (0.0%) |
| 90 or more Minutes | 7 (2.6%) | 0 (0.0%) |
Time of Departure to Work by Sex in Treynor
The most frequent times of departure to work in Treynor are 7:00 AM to 7:29 AM (83, 31.4%) for males and 7:00 AM to 7:29 AM (61, 24.6%) for females.
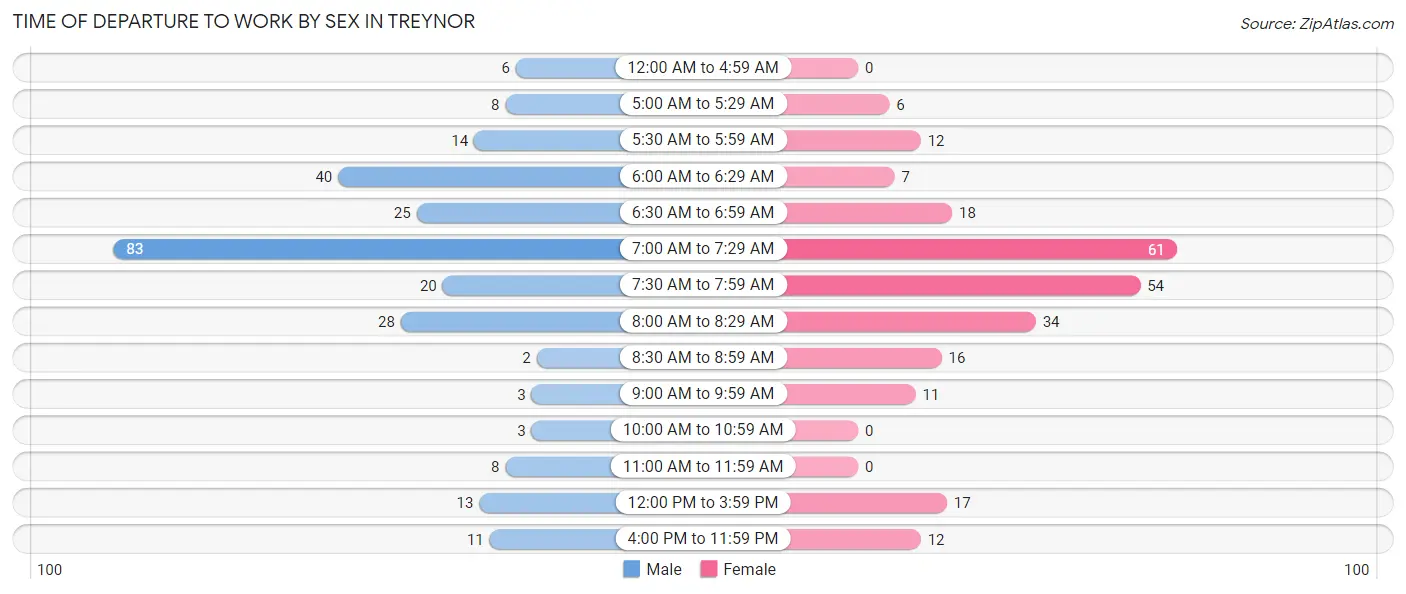
| Time of Departure | Male | Female |
| 12:00 AM to 4:59 AM | 6 (2.3%) | 0 (0.0%) |
| 5:00 AM to 5:29 AM | 8 (3.0%) | 6 (2.4%) |
| 5:30 AM to 5:59 AM | 14 (5.3%) | 12 (4.8%) |
| 6:00 AM to 6:29 AM | 40 (15.1%) | 7 (2.8%) |
| 6:30 AM to 6:59 AM | 25 (9.5%) | 18 (7.3%) |
| 7:00 AM to 7:29 AM | 83 (31.4%) | 61 (24.6%) |
| 7:30 AM to 7:59 AM | 20 (7.6%) | 54 (21.8%) |
| 8:00 AM to 8:29 AM | 28 (10.6%) | 34 (13.7%) |
| 8:30 AM to 8:59 AM | 2 (0.8%) | 16 (6.5%) |
| 9:00 AM to 9:59 AM | 3 (1.1%) | 11 (4.4%) |
| 10:00 AM to 10:59 AM | 3 (1.1%) | 0 (0.0%) |
| 11:00 AM to 11:59 AM | 8 (3.0%) | 0 (0.0%) |
| 12:00 PM to 3:59 PM | 13 (4.9%) | 17 (6.9%) |
| 4:00 PM to 11:59 PM | 11 (4.2%) | 12 (4.8%) |
| Total | 264 (100.0%) | 248 (100.0%) |
Housing Occupancy in Treynor
Occupancy by Ownership in Treynor
Of the total 429 dwellings in Treynor, owner-occupied units account for 325 (75.8%), while renter-occupied units make up 104 (24.2%).
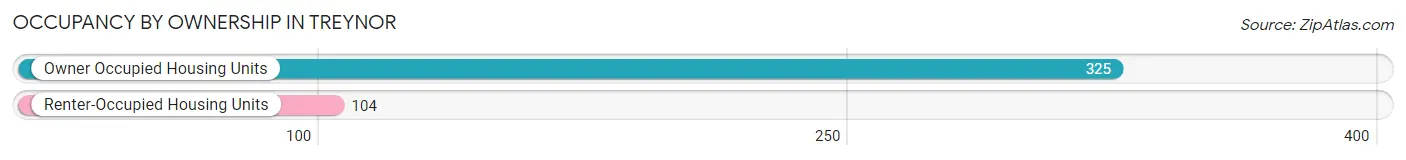
| Occupancy | # Housing Units | % Housing Units |
| Owner Occupied Housing Units | 325 | 75.8% |
| Renter-Occupied Housing Units | 104 | 24.2% |
| Total Occupied Housing Units | 429 | 100.0% |
Occupancy by Household Size in Treynor
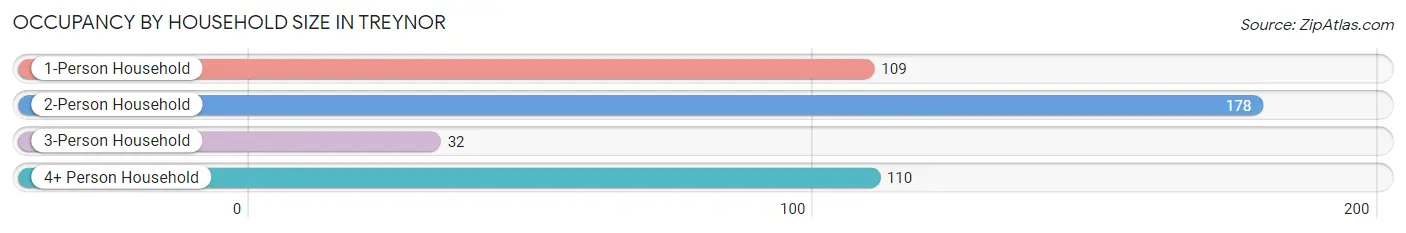
| Household Size | # Housing Units | % Housing Units |
| 1-Person Household | 109 | 25.4% |
| 2-Person Household | 178 | 41.5% |
| 3-Person Household | 32 | 7.5% |
| 4+ Person Household | 110 | 25.6% |
| Total Housing Units | 429 | 100.0% |
Occupancy by Ownership by Household Size in Treynor
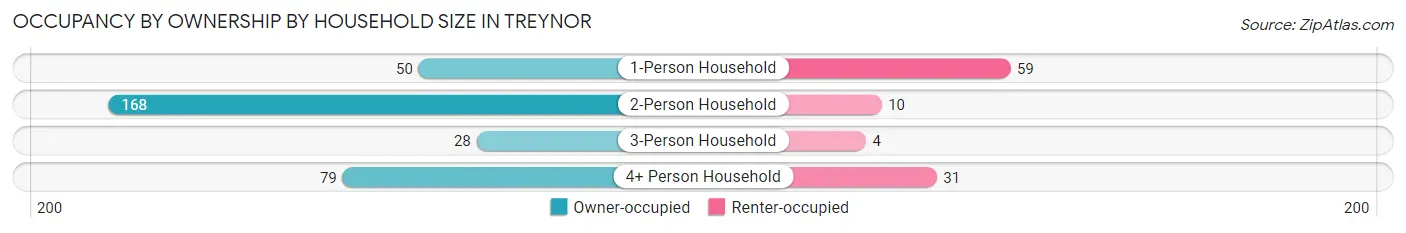
| Household Size | Owner-occupied | Renter-occupied |
| 1-Person Household | 50 (45.9%) | 59 (54.1%) |
| 2-Person Household | 168 (94.4%) | 10 (5.6%) |
| 3-Person Household | 28 (87.5%) | 4 (12.5%) |
| 4+ Person Household | 79 (71.8%) | 31 (28.2%) |
| Total Housing Units | 325 (75.8%) | 104 (24.2%) |
Occupancy by Educational Attainment in Treynor
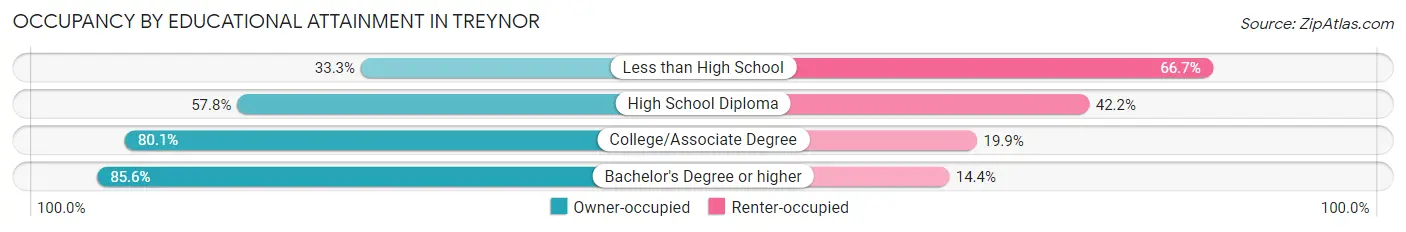
| Household Size | Owner-occupied | Renter-occupied |
| Less than High School | 2 (33.3%) | 4 (66.7%) |
| High School Diploma | 59 (57.8%) | 43 (42.2%) |
| College/Associate Degree | 157 (80.1%) | 39 (19.9%) |
| Bachelor's Degree or higher | 107 (85.6%) | 18 (14.4%) |
Occupancy by Age of Householder in Treynor
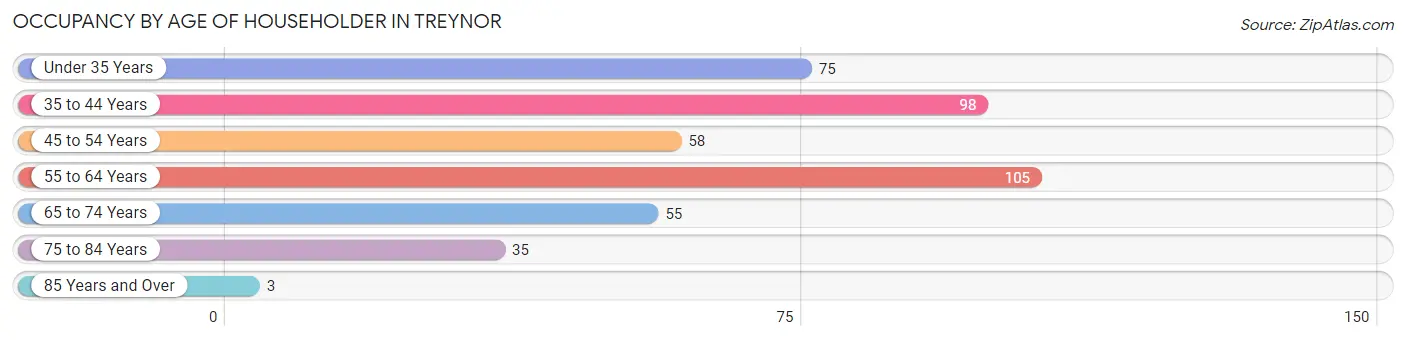
| Age Bracket | # Households | % Households |
| Under 35 Years | 75 | 17.5% |
| 35 to 44 Years | 98 | 22.8% |
| 45 to 54 Years | 58 | 13.5% |
| 55 to 64 Years | 105 | 24.5% |
| 65 to 74 Years | 55 | 12.8% |
| 75 to 84 Years | 35 | 8.2% |
| 85 Years and Over | 3 | 0.7% |
| Total | 429 | 100.0% |
Housing Finances in Treynor
Median Income by Occupancy in Treynor
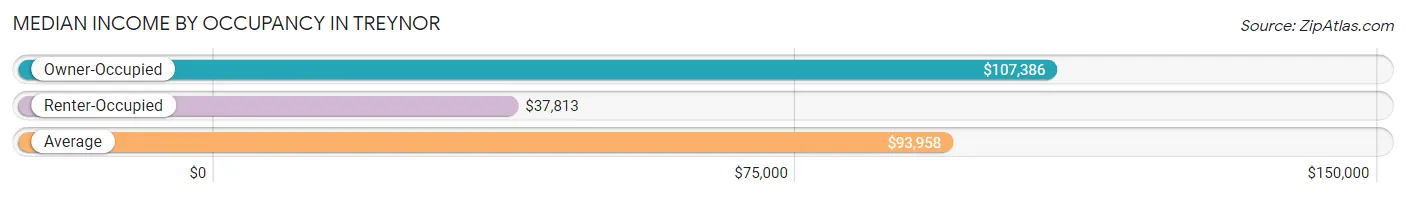
| Occupancy Type | # Households | Median Income |
| Owner-Occupied | 325 (75.8%) | $107,386 |
| Renter-Occupied | 104 (24.2%) | $37,813 |
| Average | 429 (100.0%) | $93,958 |
Occupancy by Householder Income Bracket in Treynor
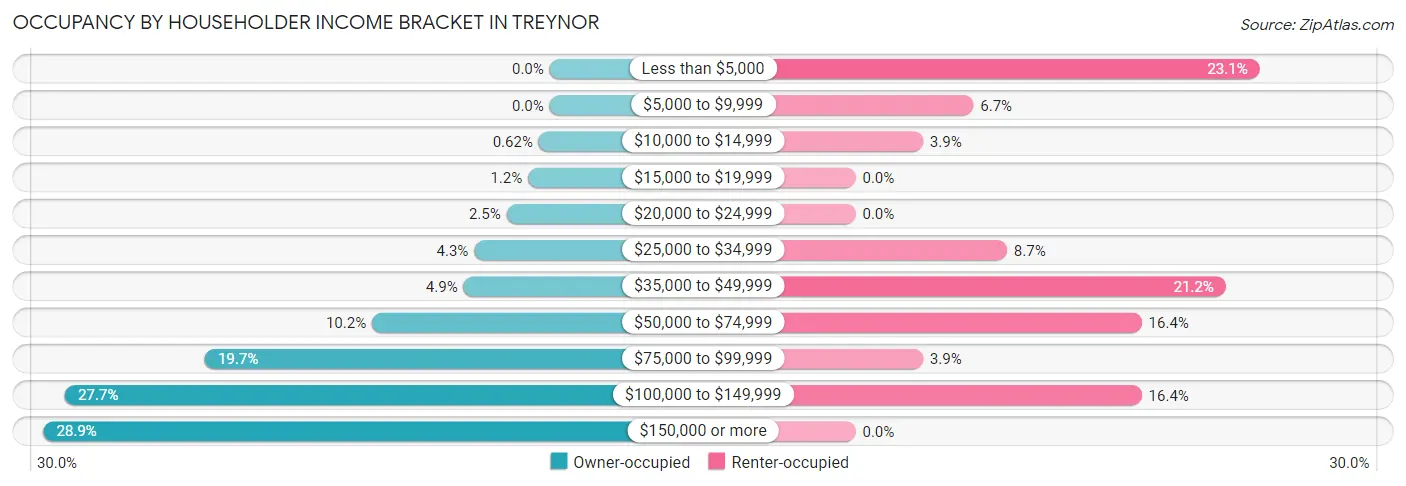
| Income Bracket | Owner-occupied | Renter-occupied |
| Less than $5,000 | 0 (0.0%) | 24 (23.1%) |
| $5,000 to $9,999 | 0 (0.0%) | 7 (6.7%) |
| $10,000 to $14,999 | 2 (0.6%) | 4 (3.8%) |
| $15,000 to $19,999 | 4 (1.2%) | 0 (0.0%) |
| $20,000 to $24,999 | 8 (2.5%) | 0 (0.0%) |
| $25,000 to $34,999 | 14 (4.3%) | 9 (8.6%) |
| $35,000 to $49,999 | 16 (4.9%) | 22 (21.1%) |
| $50,000 to $74,999 | 33 (10.2%) | 17 (16.4%) |
| $75,000 to $99,999 | 64 (19.7%) | 4 (3.8%) |
| $100,000 to $149,999 | 90 (27.7%) | 17 (16.4%) |
| $150,000 or more | 94 (28.9%) | 0 (0.0%) |
| Total | 325 (100.0%) | 104 (100.0%) |
Monthly Housing Cost Tiers in Treynor
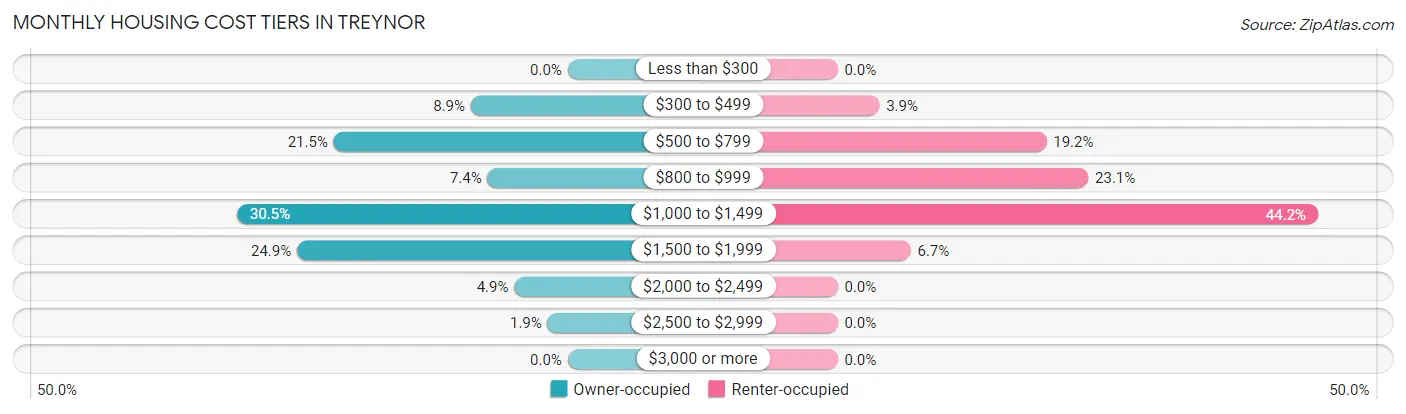
| Monthly Cost | Owner-occupied | Renter-occupied |
| Less than $300 | 0 (0.0%) | 0 (0.0%) |
| $300 to $499 | 29 (8.9%) | 4 (3.8%) |
| $500 to $799 | 70 (21.5%) | 20 (19.2%) |
| $800 to $999 | 24 (7.4%) | 24 (23.1%) |
| $1,000 to $1,499 | 99 (30.5%) | 46 (44.2%) |
| $1,500 to $1,999 | 81 (24.9%) | 7 (6.7%) |
| $2,000 to $2,499 | 16 (4.9%) | 0 (0.0%) |
| $2,500 to $2,999 | 6 (1.8%) | 0 (0.0%) |
| $3,000 or more | 0 (0.0%) | 0 (0.0%) |
| Total | 325 (100.0%) | 104 (100.0%) |
Physical Housing Characteristics in Treynor
Housing Structures in Treynor
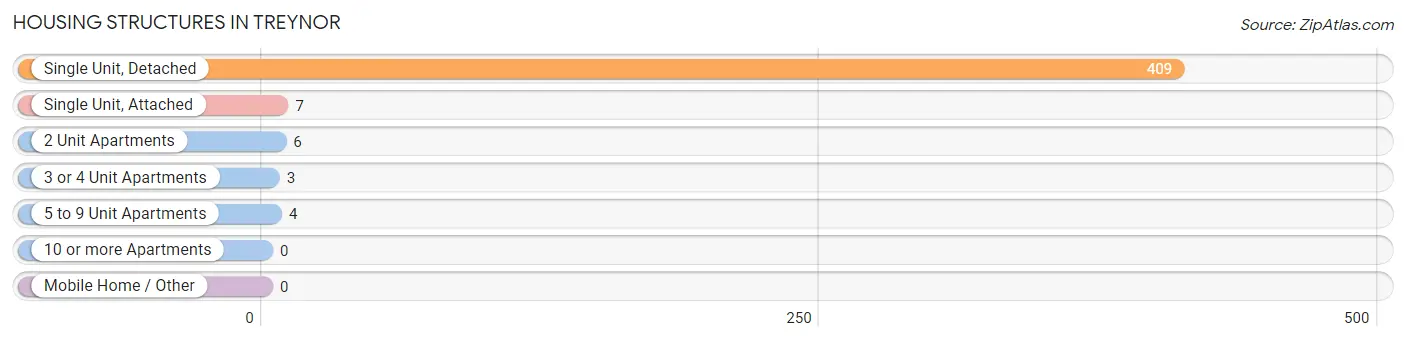
| Structure Type | # Housing Units | % Housing Units |
| Single Unit, Detached | 409 | 95.3% |
| Single Unit, Attached | 7 | 1.6% |
| 2 Unit Apartments | 6 | 1.4% |
| 3 or 4 Unit Apartments | 3 | 0.7% |
| 5 to 9 Unit Apartments | 4 | 0.9% |
| 10 or more Apartments | 0 | 0.0% |
| Mobile Home / Other | 0 | 0.0% |
| Total | 429 | 100.0% |
Housing Structures by Occupancy in Treynor
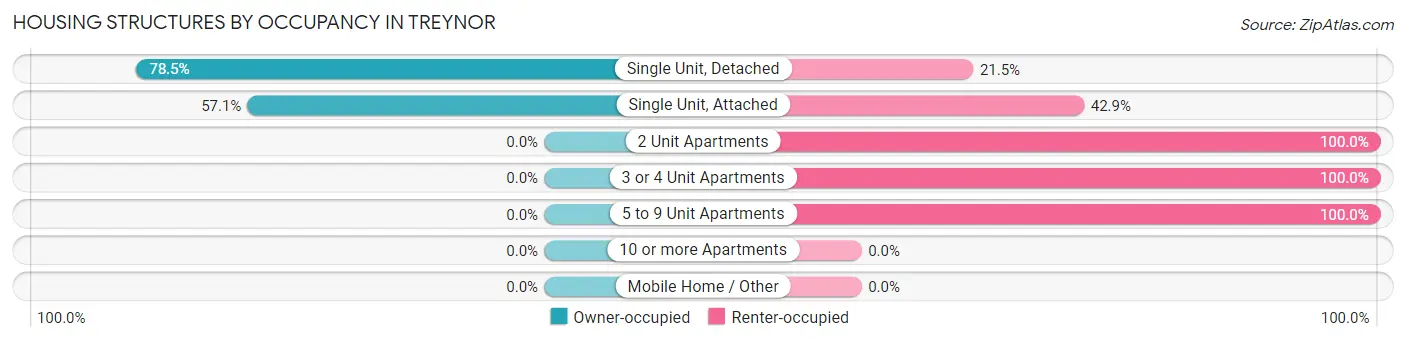
| Structure Type | Owner-occupied | Renter-occupied |
| Single Unit, Detached | 321 (78.5%) | 88 (21.5%) |
| Single Unit, Attached | 4 (57.1%) | 3 (42.9%) |
| 2 Unit Apartments | 0 (0.0%) | 6 (100.0%) |
| 3 or 4 Unit Apartments | 0 (0.0%) | 3 (100.0%) |
| 5 to 9 Unit Apartments | 0 (0.0%) | 4 (100.0%) |
| 10 or more Apartments | 0 (0.0%) | 0 (0.0%) |
| Mobile Home / Other | 0 (0.0%) | 0 (0.0%) |
| Total | 325 (75.8%) | 104 (24.2%) |
Housing Structures by Number of Rooms in Treynor
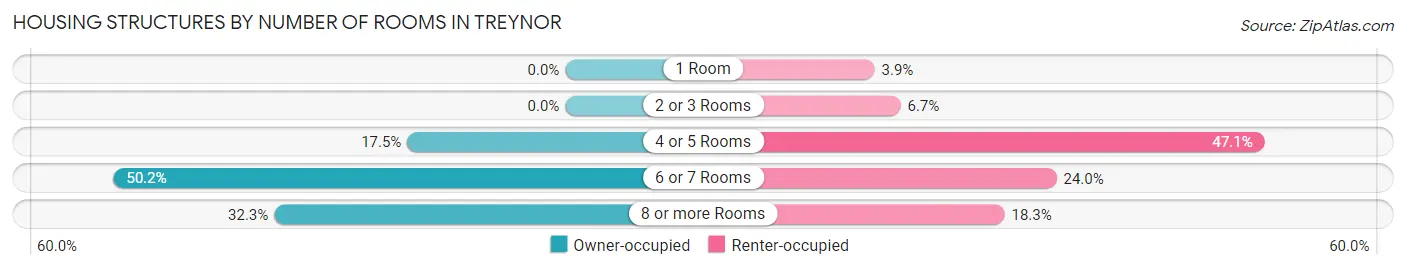
| Number of Rooms | Owner-occupied | Renter-occupied |
| 1 Room | 0 (0.0%) | 4 (3.8%) |
| 2 or 3 Rooms | 0 (0.0%) | 7 (6.7%) |
| 4 or 5 Rooms | 57 (17.5%) | 49 (47.1%) |
| 6 or 7 Rooms | 163 (50.1%) | 25 (24.0%) |
| 8 or more Rooms | 105 (32.3%) | 19 (18.3%) |
| Total | 325 (100.0%) | 104 (100.0%) |
Housing Structure by Heating Type in Treynor
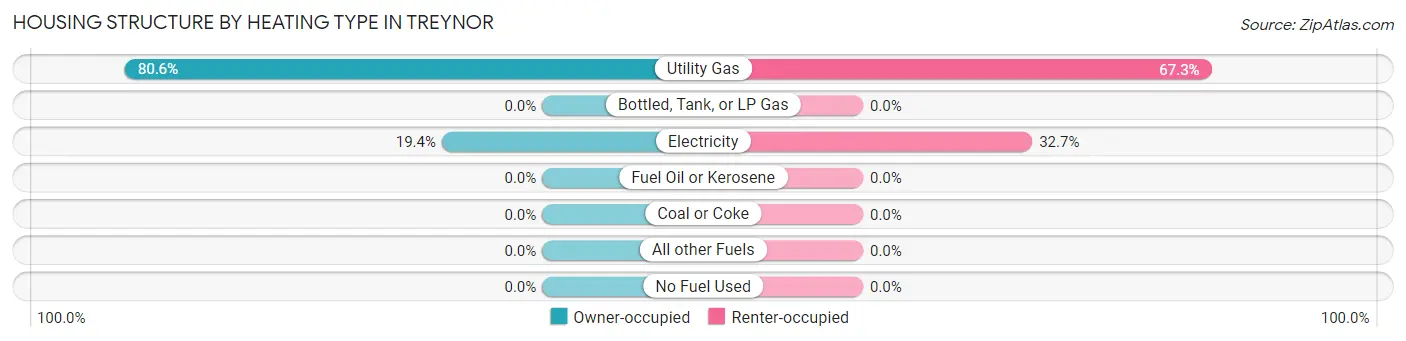
| Heating Type | Owner-occupied | Renter-occupied |
| Utility Gas | 262 (80.6%) | 70 (67.3%) |
| Bottled, Tank, or LP Gas | 0 (0.0%) | 0 (0.0%) |
| Electricity | 63 (19.4%) | 34 (32.7%) |
| Fuel Oil or Kerosene | 0 (0.0%) | 0 (0.0%) |
| Coal or Coke | 0 (0.0%) | 0 (0.0%) |
| All other Fuels | 0 (0.0%) | 0 (0.0%) |
| No Fuel Used | 0 (0.0%) | 0 (0.0%) |
| Total | 325 (100.0%) | 104 (100.0%) |
Household Vehicle Usage in Treynor
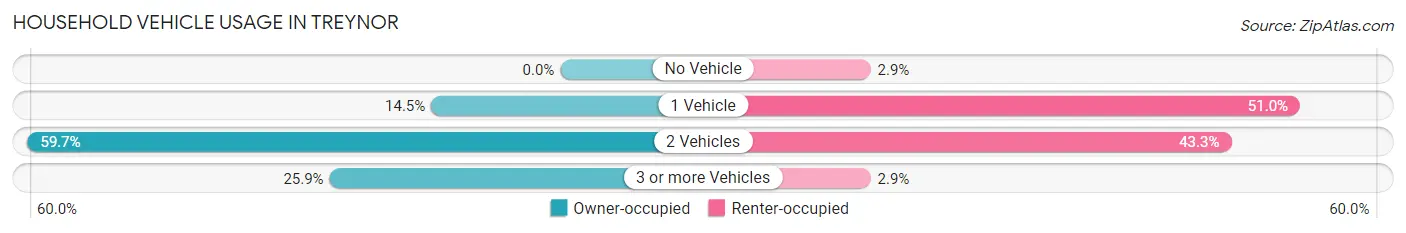
| Vehicles per Household | Owner-occupied | Renter-occupied |
| No Vehicle | 0 (0.0%) | 3 (2.9%) |
| 1 Vehicle | 47 (14.5%) | 53 (51.0%) |
| 2 Vehicles | 194 (59.7%) | 45 (43.3%) |
| 3 or more Vehicles | 84 (25.9%) | 3 (2.9%) |
| Total | 325 (100.0%) | 104 (100.0%) |
Real Estate & Mortgages in Treynor
Real Estate and Mortgage Overview in Treynor
| Characteristic | Without Mortgage | With Mortgage |
| Housing Units | 108 | 217 |
| Median Property Value | $211,100 | $193,900 |
| Median Household Income | $96,250 | $80 |
| Monthly Housing Costs | $596 | $0 |
| Real Estate Taxes | $3,071 | $0 |
Property Value by Mortgage Status in Treynor
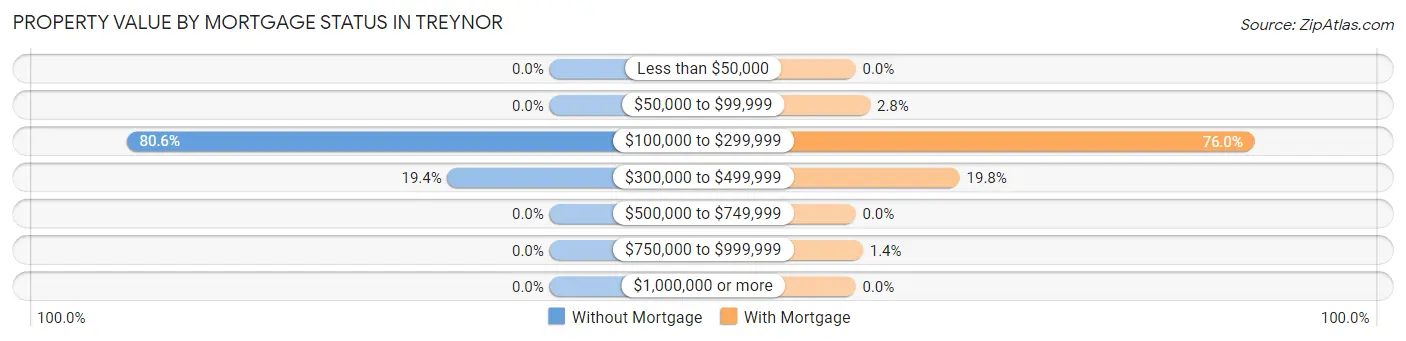
| Property Value | Without Mortgage | With Mortgage |
| Less than $50,000 | 0 (0.0%) | 0 (0.0%) |
| $50,000 to $99,999 | 0 (0.0%) | 6 (2.8%) |
| $100,000 to $299,999 | 87 (80.6%) | 165 (76.0%) |
| $300,000 to $499,999 | 21 (19.4%) | 43 (19.8%) |
| $500,000 to $749,999 | 0 (0.0%) | 0 (0.0%) |
| $750,000 to $999,999 | 0 (0.0%) | 3 (1.4%) |
| $1,000,000 or more | 0 (0.0%) | 0 (0.0%) |
| Total | 108 (100.0%) | 217 (100.0%) |
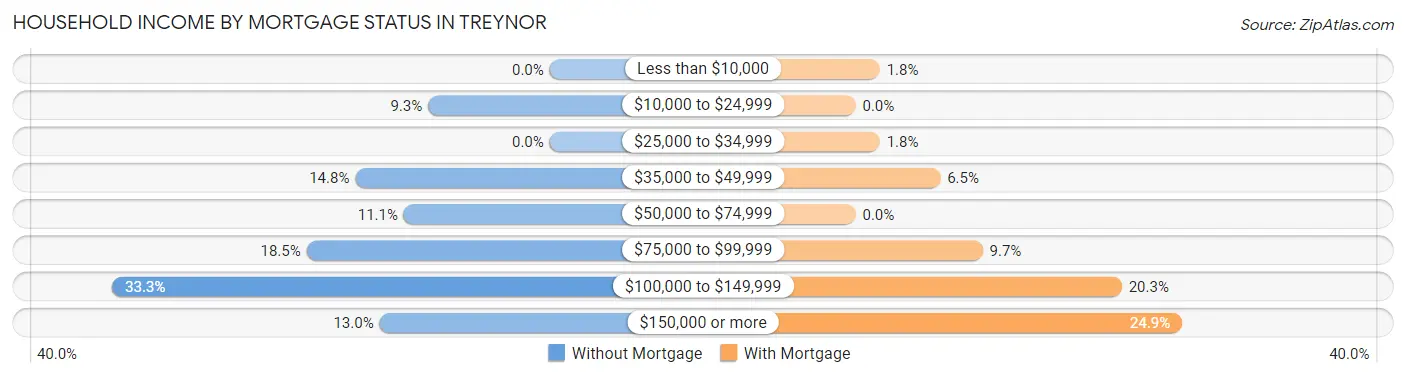
Household Income by Mortgage Status in Treynor
| Household Income | Without Mortgage | With Mortgage |
| Less than $10,000 | 0 (0.0%) | 4 (1.8%) |
| $10,000 to $24,999 | 10 (9.3%) | 0 (0.0%) |
| $25,000 to $34,999 | 0 (0.0%) | 4 (1.8%) |
| $35,000 to $49,999 | 16 (14.8%) | 14 (6.5%) |
| $50,000 to $74,999 | 12 (11.1%) | 0 (0.0%) |
| $75,000 to $99,999 | 20 (18.5%) | 21 (9.7%) |
| $100,000 to $149,999 | 36 (33.3%) | 44 (20.3%) |
| $150,000 or more | 14 (13.0%) | 54 (24.9%) |
| Total | 108 (100.0%) | 217 (100.0%) |
Property Value to Household Income Ratio in Treynor
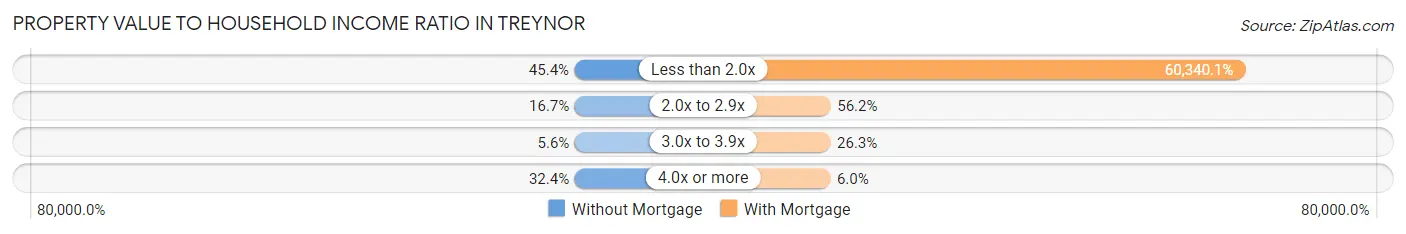
| Value-to-Income Ratio | Without Mortgage | With Mortgage |
| Less than 2.0x | 49 (45.4%) | 130,938 (60,340.1%) |
| 2.0x to 2.9x | 18 (16.7%) | 122 (56.2%) |
| 3.0x to 3.9x | 6 (5.6%) | 57 (26.3%) |
| 4.0x or more | 35 (32.4%) | 13 (6.0%) |
| Total | 108 (100.0%) | 217 (100.0%) |
Real Estate Taxes by Mortgage Status in Treynor
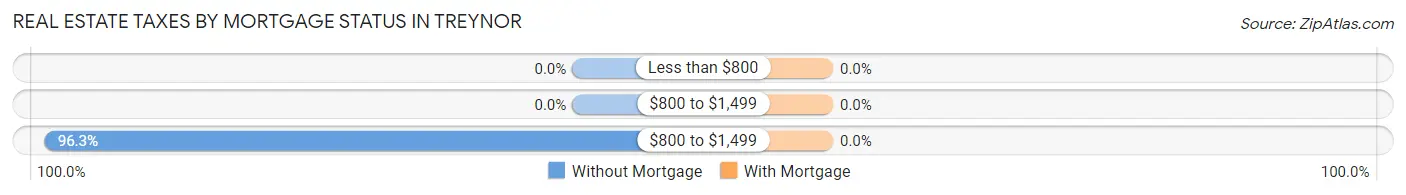
| Property Taxes | Without Mortgage | With Mortgage |
| Less than $800 | 0 (0.0%) | 0 (0.0%) |
| $800 to $1,499 | 0 (0.0%) | 0 (0.0%) |
| $800 to $1,499 | 104 (96.3%) | 0 (0.0%) |
| Total | 108 (100.0%) | 217 (100.0%) |
Health & Disability in Treynor
Health Insurance Coverage by Age in Treynor
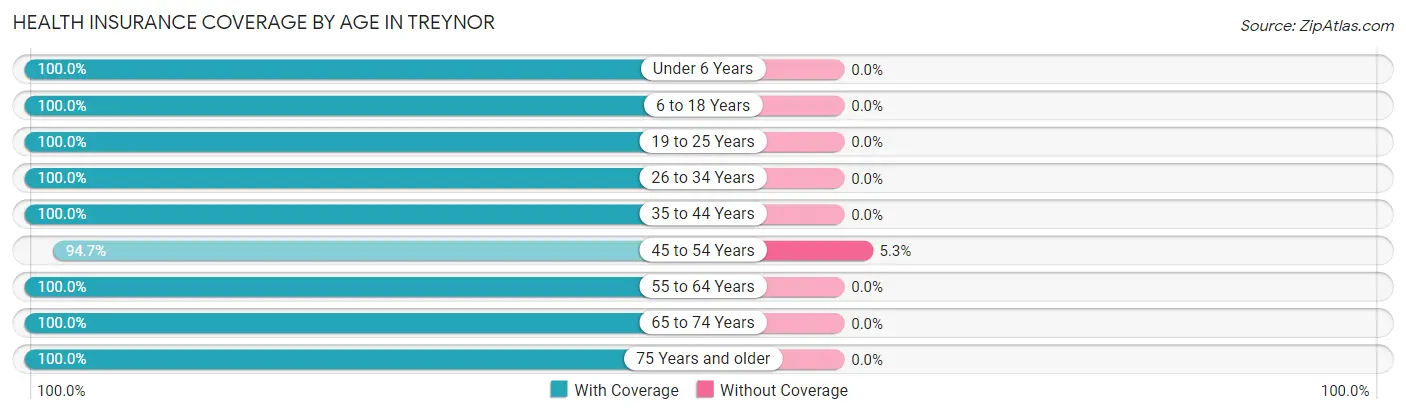
| Age Bracket | With Coverage | Without Coverage |
| Under 6 Years | 103 (100.0%) | 0 (0.0%) |
| 6 to 18 Years | 223 (100.0%) | 0 (0.0%) |
| 19 to 25 Years | 24 (100.0%) | 0 (0.0%) |
| 26 to 34 Years | 133 (100.0%) | 0 (0.0%) |
| 35 to 44 Years | 159 (100.0%) | 0 (0.0%) |
| 45 to 54 Years | 90 (94.7%) | 5 (5.3%) |
| 55 to 64 Years | 162 (100.0%) | 0 (0.0%) |
| 65 to 74 Years | 100 (100.0%) | 0 (0.0%) |
| 75 Years and older | 65 (100.0%) | 0 (0.0%) |
| Total | 1,059 (99.5%) | 5 (0.5%) |
Health Insurance Coverage by Citizenship Status in Treynor
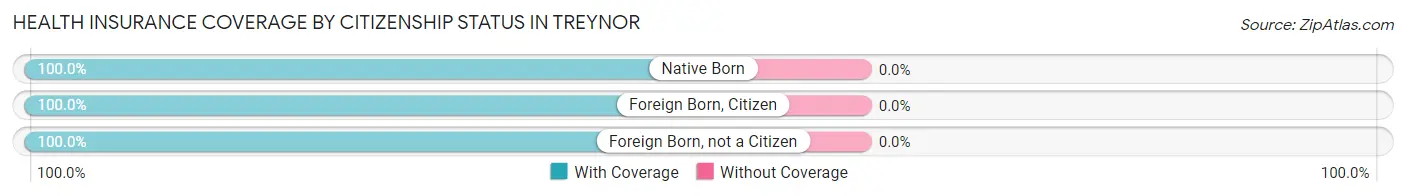
| Citizenship Status | With Coverage | Without Coverage |
| Native Born | 103 (100.0%) | 0 (0.0%) |
| Foreign Born, Citizen | 223 (100.0%) | 0 (0.0%) |
| Foreign Born, not a Citizen | 24 (100.0%) | 0 (0.0%) |
Health Insurance Coverage by Household Income in Treynor
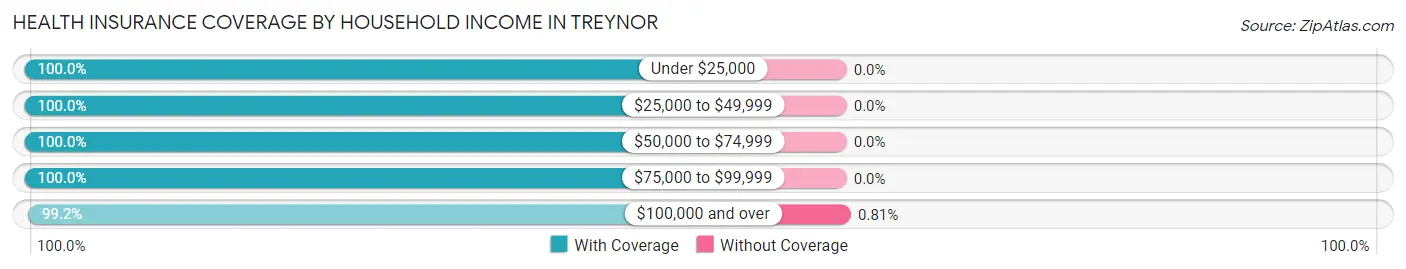
| Household Income | With Coverage | Without Coverage |
| Under $25,000 | 66 (100.0%) | 0 (0.0%) |
| $25,000 to $49,999 | 113 (100.0%) | 0 (0.0%) |
| $50,000 to $74,999 | 118 (100.0%) | 0 (0.0%) |
| $75,000 to $99,999 | 150 (100.0%) | 0 (0.0%) |
| $100,000 and over | 612 (99.2%) | 5 (0.8%) |
Public vs Private Health Insurance Coverage by Age in Treynor
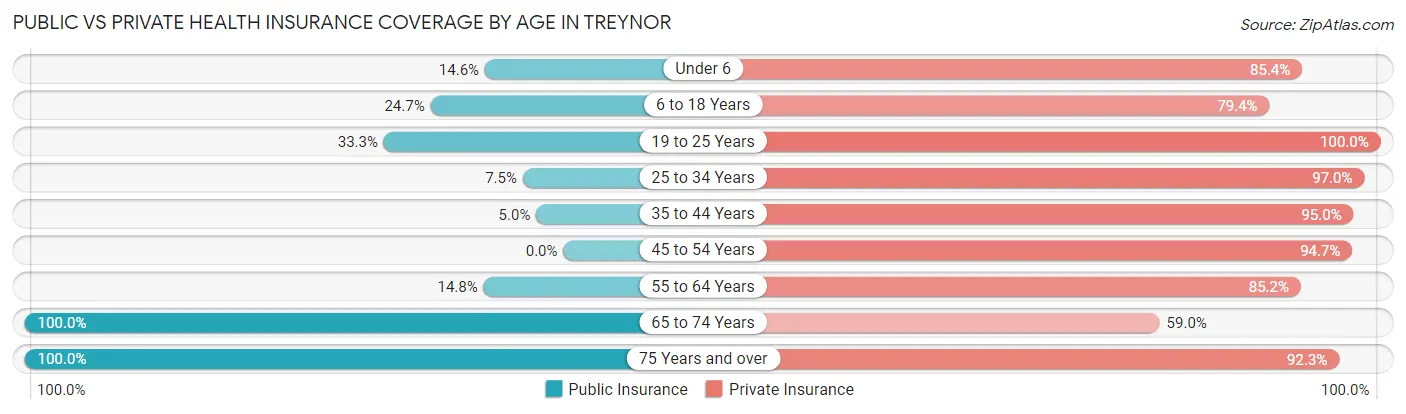
| Age Bracket | Public Insurance | Private Insurance |
| Under 6 | 15 (14.6%) | 88 (85.4%) |
| 6 to 18 Years | 55 (24.7%) | 177 (79.4%) |
| 19 to 25 Years | 8 (33.3%) | 24 (100.0%) |
| 25 to 34 Years | 10 (7.5%) | 129 (97.0%) |
| 35 to 44 Years | 8 (5.0%) | 151 (95.0%) |
| 45 to 54 Years | 0 (0.0%) | 90 (94.7%) |
| 55 to 64 Years | 24 (14.8%) | 138 (85.2%) |
| 65 to 74 Years | 100 (100.0%) | 59 (59.0%) |
| 75 Years and over | 65 (100.0%) | 60 (92.3%) |
| Total | 285 (26.8%) | 916 (86.1%) |
Disability Status by Sex by Age in Treynor
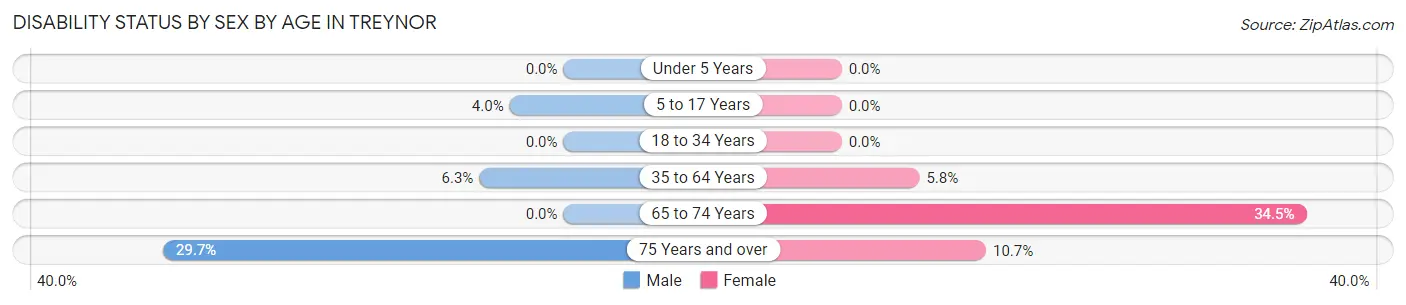
| Age Bracket | Male | Female |
| Under 5 Years | 0 (0.0%) | 0 (0.0%) |
| 5 to 17 Years | 4 (4.0%) | 0 (0.0%) |
| 18 to 34 Years | 0 (0.0%) | 0 (0.0%) |
| 35 to 64 Years | 13 (6.2%) | 12 (5.8%) |
| 65 to 74 Years | 0 (0.0%) | 20 (34.5%) |
| 75 Years and over | 11 (29.7%) | 3 (10.7%) |
Disability Class by Sex by Age in Treynor
Disability Class: Hearing Difficulty
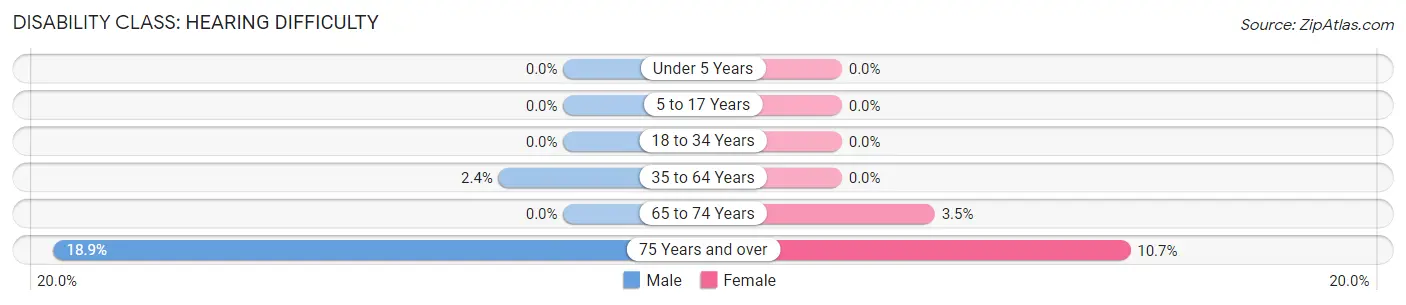
| Age Bracket | Male | Female |
| Under 5 Years | 0 (0.0%) | 0 (0.0%) |
| 5 to 17 Years | 0 (0.0%) | 0 (0.0%) |
| 18 to 34 Years | 0 (0.0%) | 0 (0.0%) |
| 35 to 64 Years | 5 (2.4%) | 0 (0.0%) |
| 65 to 74 Years | 0 (0.0%) | 2 (3.5%) |
| 75 Years and over | 7 (18.9%) | 3 (10.7%) |
Disability Class: Vision Difficulty
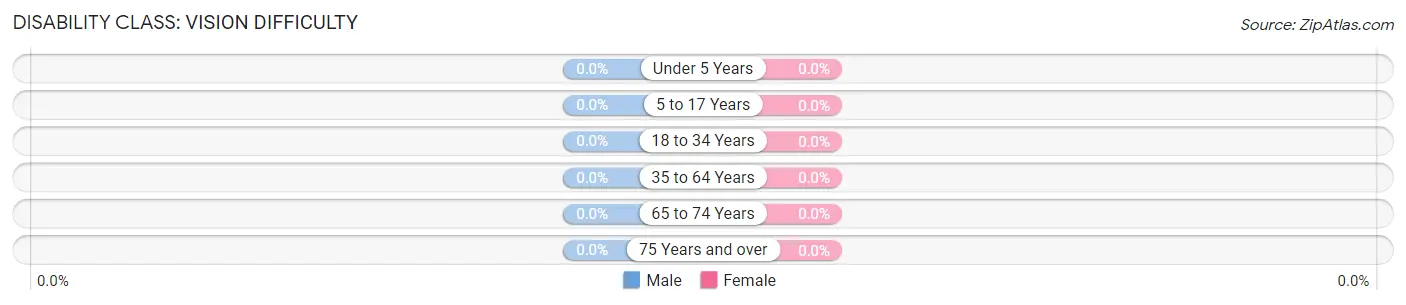
| Age Bracket | Male | Female |
| Under 5 Years | 0 (0.0%) | 0 (0.0%) |
| 5 to 17 Years | 0 (0.0%) | 0 (0.0%) |
| 18 to 34 Years | 0 (0.0%) | 0 (0.0%) |
| 35 to 64 Years | 0 (0.0%) | 0 (0.0%) |
| 65 to 74 Years | 0 (0.0%) | 0 (0.0%) |
| 75 Years and over | 0 (0.0%) | 0 (0.0%) |
Disability Class: Cognitive Difficulty
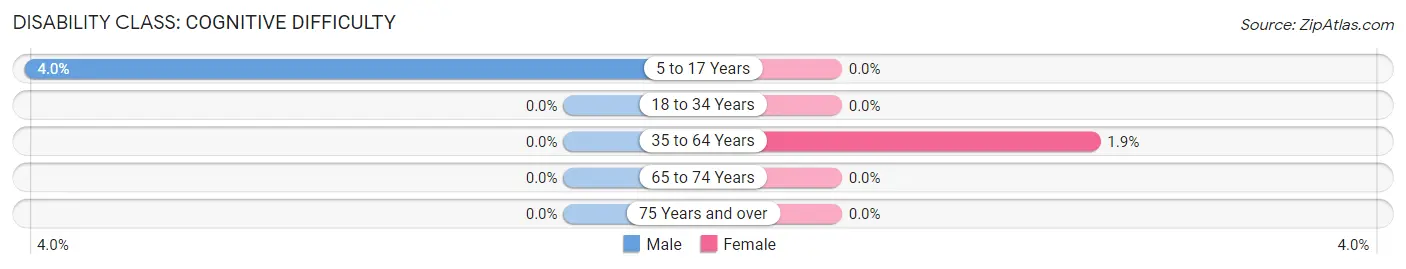
| Age Bracket | Male | Female |
| 5 to 17 Years | 4 (4.0%) | 0 (0.0%) |
| 18 to 34 Years | 0 (0.0%) | 0 (0.0%) |
| 35 to 64 Years | 0 (0.0%) | 4 (1.9%) |
| 65 to 74 Years | 0 (0.0%) | 0 (0.0%) |
| 75 Years and over | 0 (0.0%) | 0 (0.0%) |
Disability Class: Ambulatory Difficulty
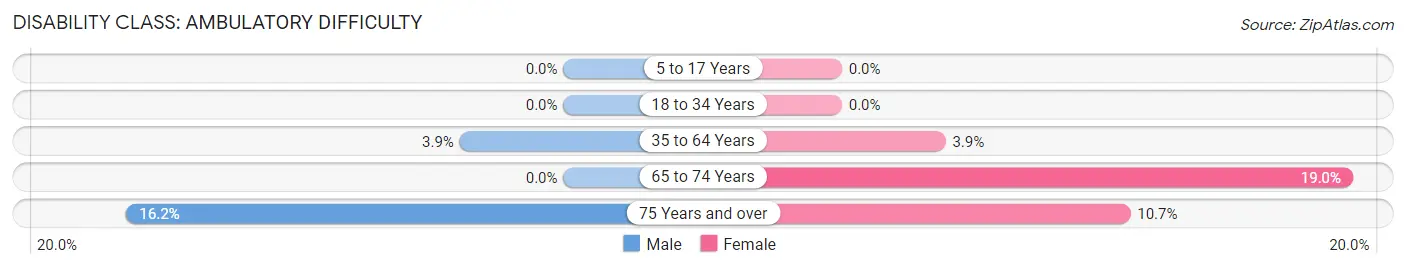
| Age Bracket | Male | Female |
| 5 to 17 Years | 0 (0.0%) | 0 (0.0%) |
| 18 to 34 Years | 0 (0.0%) | 0 (0.0%) |
| 35 to 64 Years | 8 (3.8%) | 8 (3.8%) |
| 65 to 74 Years | 0 (0.0%) | 11 (19.0%) |
| 75 Years and over | 6 (16.2%) | 3 (10.7%) |
Disability Class: Self-Care Difficulty
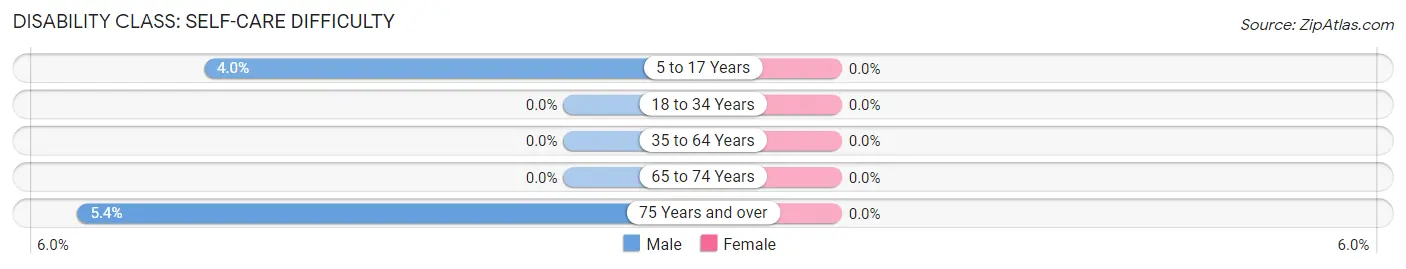
| Age Bracket | Male | Female |
| 5 to 17 Years | 4 (4.0%) | 0 (0.0%) |
| 18 to 34 Years | 0 (0.0%) | 0 (0.0%) |
| 35 to 64 Years | 0 (0.0%) | 0 (0.0%) |
| 65 to 74 Years | 0 (0.0%) | 0 (0.0%) |
| 75 Years and over | 2 (5.4%) | 0 (0.0%) |
Technology Access in Treynor
Computing Device Access in Treynor
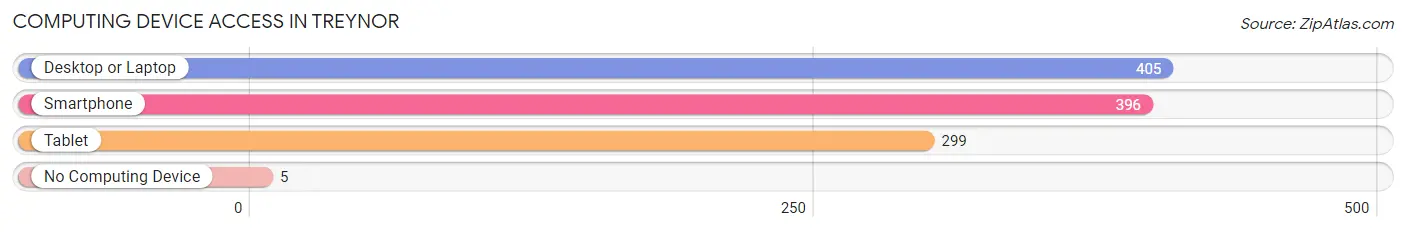
| Device Type | # Households | % Households |
| Desktop or Laptop | 405 | 94.4% |
| Smartphone | 396 | 92.3% |
| Tablet | 299 | 69.7% |
| No Computing Device | 5 | 1.2% |
| Total | 429 | 100.0% |
Internet Access in Treynor
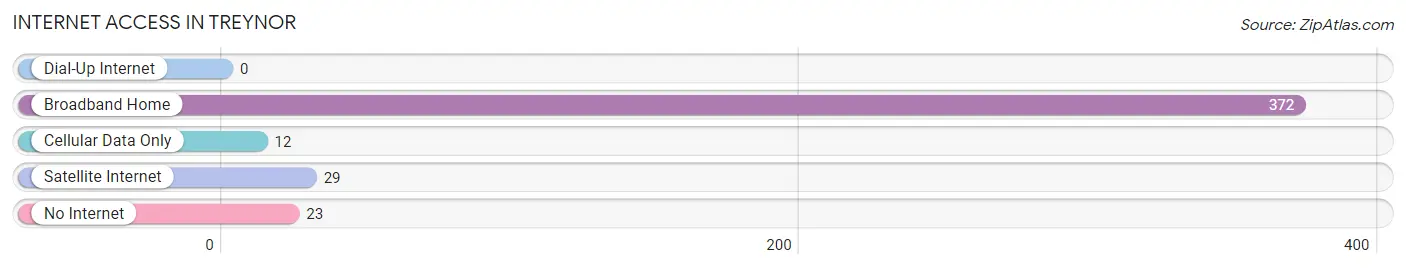
| Internet Type | # Households | % Households |
| Dial-Up Internet | 0 | 0.0% |
| Broadband Home | 372 | 86.7% |
| Cellular Data Only | 12 | 2.8% |
| Satellite Internet | 29 | 6.8% |
| No Internet | 23 | 5.4% |
| Total | 429 | 100.0% |
Treynor Summary
Treynor is a small city located in Pottawattamie County, Iowa. It is situated along the Missouri River, approximately 25 miles south of Omaha, Nebraska. The city has a population of 1,092, according to the 2010 census.
History
Treynor was founded in 1856 by a group of settlers from Ohio. The city was named after William Treynor, a prominent local businessman. The city was incorporated in 1875 and has remained a small, rural community ever since.
The city was a major stop on the Missouri Pacific Railroad, which ran through the city until the late 1960s. The railroad was a major source of employment for the city, and it also served as a major transportation hub for the region.
Geography
Treynor is located in the Loess Hills region of Iowa. The city is situated along the Missouri River, and is surrounded by rolling hills and farmland. The city is located approximately 25 miles south of Omaha, Nebraska, and is part of the Omaha-Council Bluffs metropolitan area.
The climate in Treynor is typical of the Midwest, with hot summers and cold winters. The average temperature in the summer is around 80 degrees Fahrenheit, and the average temperature in the winter is around 20 degrees Fahrenheit.
Economy
Treynor’s economy is largely based on agriculture. The city is home to several large farms, and the surrounding area is known for its production of corn, soybeans, and other crops.
The city is also home to several small businesses, including a grocery store, a hardware store, and a few restaurants. The city is also home to a few manufacturing companies, including a plastics manufacturer and a metal fabrication company.
Demographics
According to the 2010 census, the population of Treynor was 1,092. The population is predominantly white, with a small minority population. The median household income is $50,000, and the median home value is $125,000.
Treynor is a small, rural community with a strong sense of community. The city is home to several churches, and the local school district is highly rated. The city is also home to several parks and recreational facilities, including a golf course and a swimming pool.
Treynor is a small city with a rich history and a strong sense of community. The city is home to several businesses and farms, and the local economy is largely based on agriculture. The city is also home to several parks and recreational facilities, and the local school district is highly rated. The city is a great place to live and work, and it is a great place to raise a family.
Common Questions
What is Per Capita Income in Treynor?
Per Capita income in Treynor is $41,204.
What is the Median Family Income in Treynor?
Median Family Income in Treynor is $123,750.
What is the Median Household income in Treynor?
Median Household Income in Treynor is $93,958.
What is Income or Wage Gap in Treynor?
Income or Wage Gap in Treynor is 15.7%.
Women in Treynor earn 84.3 cents for every dollar earned by a man.
What is Inequality or Gini Index in Treynor?
Inequality or Gini Index in Treynor is 0.38.
What is the Total Population of Treynor?
Total Population of Treynor is 1,071.
What is the Total Male Population of Treynor?
Total Male Population of Treynor is 522.
What is the Total Female Population of Treynor?
Total Female Population of Treynor is 549.
What is the Ratio of Males per 100 Females in Treynor?
There are 95.08 Males per 100 Females in Treynor.
What is the Ratio of Females per 100 Males in Treynor?
There are 105.17 Females per 100 Males in Treynor.
What is the Median Population Age in Treynor?
Median Population Age in Treynor is 37.5 Years.
What is the Average Family Size in Treynor
Average Family Size in Treynor is 3.0 People.
What is the Average Household Size in Treynor
Average Household Size in Treynor is 2.5 People.
How Large is the Labor Force in Treynor?
There are 585 People in the Labor Forcein in Treynor.
What is the Percentage of People in the Labor Force in Treynor?
74.2% of People are in the Labor Force in Treynor.
What is the Unemployment Rate in Treynor?
Unemployment Rate in Treynor is 3.6%.