Janesville, IA Map & Demographics
Janesville Map
Janesville Overview
$36,260
PER CAPITA INCOME
$113,375
AVG FAMILY INCOME
$88,625
AVG HOUSEHOLD INCOME
33.1%
WAGE / INCOME GAP [ % ]
66.9¢/ $1
WAGE / INCOME GAP [ $ ]
0.32
INEQUALITY / GINI INDEX
1,063
TOTAL POPULATION
515
MALE POPULATION
548
FEMALE POPULATION
93.98
MALES / 100 FEMALES
106.41
FEMALES / 100 MALES
38.1
MEDIAN AGE
3.2
AVG FAMILY SIZE
2.6
AVG HOUSEHOLD SIZE
578
LABOR FORCE [ PEOPLE ]
72.7%
PERCENT IN LABOR FORCE
1.6%
UNEMPLOYMENT RATE
Janesville Zip Codes
Janesville Area Codes
Income in Janesville
Income Overview in Janesville
Per Capita Income in Janesville is $36,260, while median incomes of families and households are $113,375 and $88,625 respectively.
| Characteristic | Number | Measure |
| Per Capita Income | 1,063 | $36,260 |
| Median Family Income | 290 | $113,375 |
| Mean Family Income | 290 | $113,797 |
| Median Household Income | 403 | $88,625 |
| Mean Household Income | 403 | $94,647 |
| Income Deficit | 290 | $0 |
| Wage / Income Gap (%) | 1,063 | 33.10% |
| Wage / Income Gap ($) | 1,063 | 66.90¢ per $1 |
| Gini / Inequality Index | 1,063 | 0.32 |
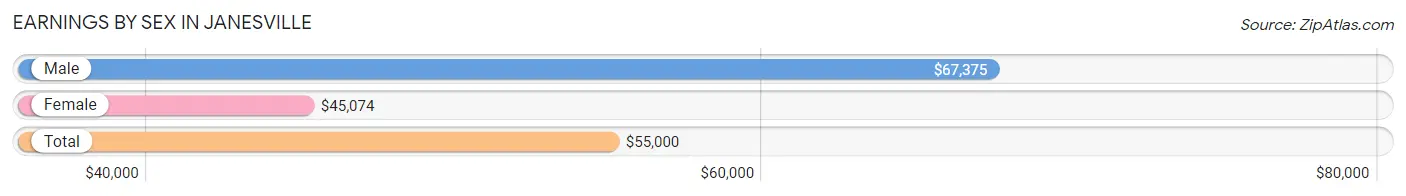
Earnings by Sex in Janesville
Average Earnings in Janesville are $55,000, $67,375 for men and $45,074 for women, a difference of 33.1%.
| Sex | Number | Average Earnings |
| Male | 305 (51.2%) | $67,375 |
| Female | 291 (48.8%) | $45,074 |
| Total | 596 (100.0%) | $55,000 |
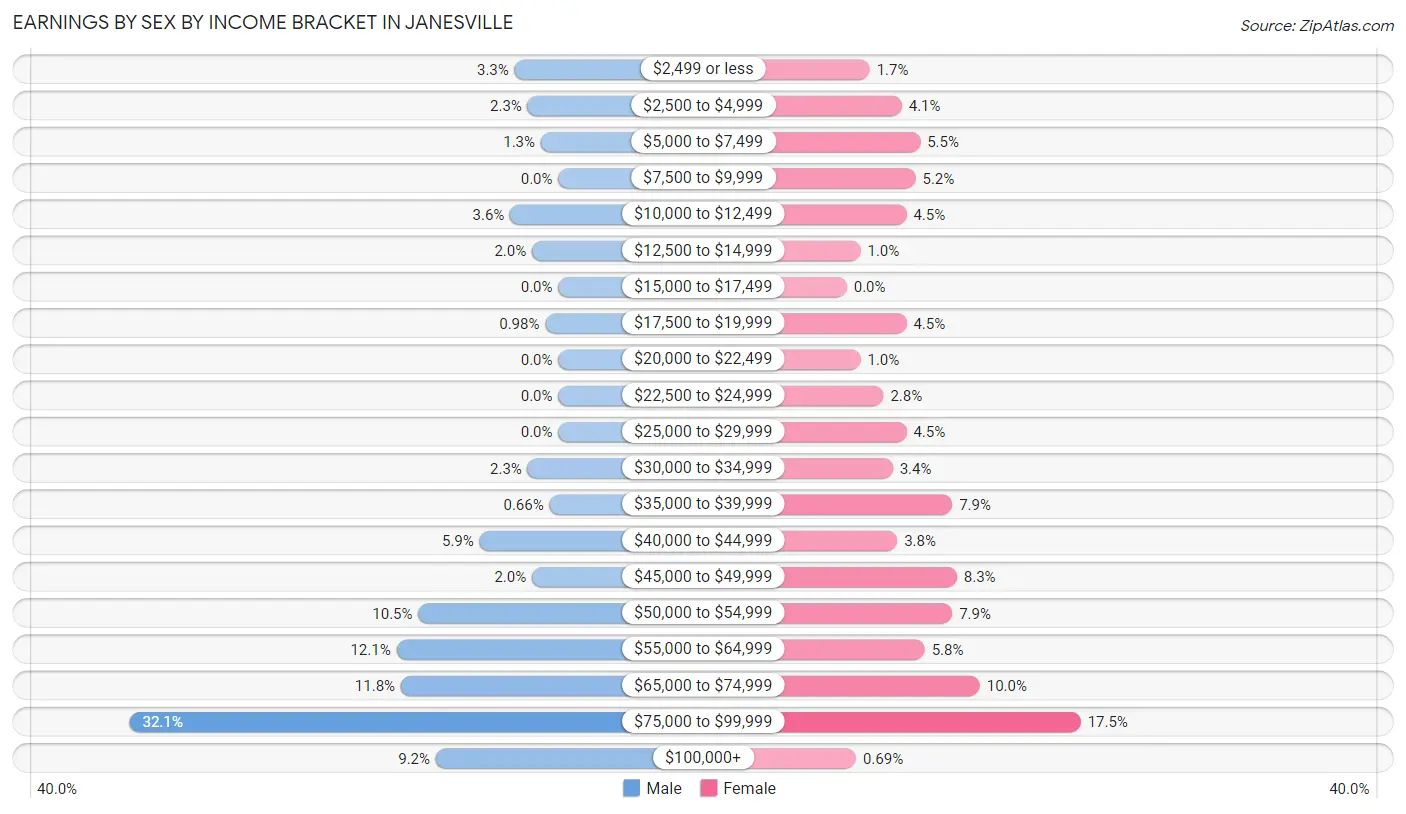
Earnings by Sex by Income Bracket in Janesville
The most common earnings brackets in Janesville are $75,000 to $99,999 for men (98 | 32.1%) and $75,000 to $99,999 for women (51 | 17.5%).
| Income | Male | Female |
| $2,499 or less | 10 (3.3%) | 5 (1.7%) |
| $2,500 to $4,999 | 7 (2.3%) | 12 (4.1%) |
| $5,000 to $7,499 | 4 (1.3%) | 16 (5.5%) |
| $7,500 to $9,999 | 0 (0.0%) | 15 (5.1%) |
| $10,000 to $12,499 | 11 (3.6%) | 13 (4.5%) |
| $12,500 to $14,999 | 6 (2.0%) | 3 (1.0%) |
| $15,000 to $17,499 | 0 (0.0%) | 0 (0.0%) |
| $17,500 to $19,999 | 3 (1.0%) | 13 (4.5%) |
| $20,000 to $22,499 | 0 (0.0%) | 3 (1.0%) |
| $22,500 to $24,999 | 0 (0.0%) | 8 (2.8%) |
| $25,000 to $29,999 | 0 (0.0%) | 13 (4.5%) |
| $30,000 to $34,999 | 7 (2.3%) | 10 (3.4%) |
| $35,000 to $39,999 | 2 (0.7%) | 23 (7.9%) |
| $40,000 to $44,999 | 18 (5.9%) | 11 (3.8%) |
| $45,000 to $49,999 | 6 (2.0%) | 24 (8.3%) |
| $50,000 to $54,999 | 32 (10.5%) | 23 (7.9%) |
| $55,000 to $64,999 | 37 (12.1%) | 17 (5.8%) |
| $65,000 to $74,999 | 36 (11.8%) | 29 (10.0%) |
| $75,000 to $99,999 | 98 (32.1%) | 51 (17.5%) |
| $100,000+ | 28 (9.2%) | 2 (0.7%) |
| Total | 305 (100.0%) | 291 (100.0%) |
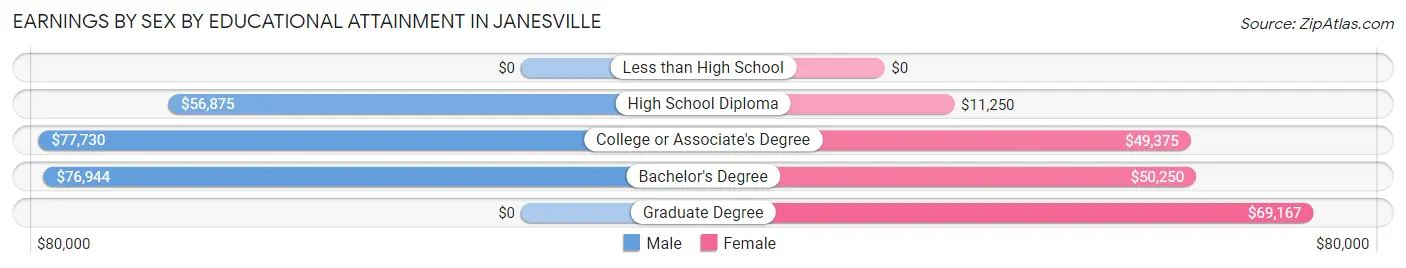
Earnings by Sex by Educational Attainment in Janesville
Average earnings in Janesville are $70,455 for men and $46,324 for women, a difference of 34.3%. Men with an educational attainment of college or associate's degree enjoy the highest average annual earnings of $77,730, while those with high school diploma education earn the least with $56,875. Women with an educational attainment of graduate degree earn the most with the average annual earnings of $69,167, while those with high school diploma education have the smallest earnings of $11,250.
| Educational Attainment | Male Income | Female Income |
| Less than High School | - | - |
| High School Diploma | $56,875 | $11,250 |
| College or Associate's Degree | $77,730 | $49,375 |
| Bachelor's Degree | $76,944 | $50,250 |
| Graduate Degree | - | - |
| Total | $70,455 | $46,324 |
Family Income in Janesville
Family Income Brackets in Janesville
According to the Janesville family income data, there are 95 families falling into the $100,000 to $149,999 income range, which is the most common income bracket and makes up 32.8% of all families.
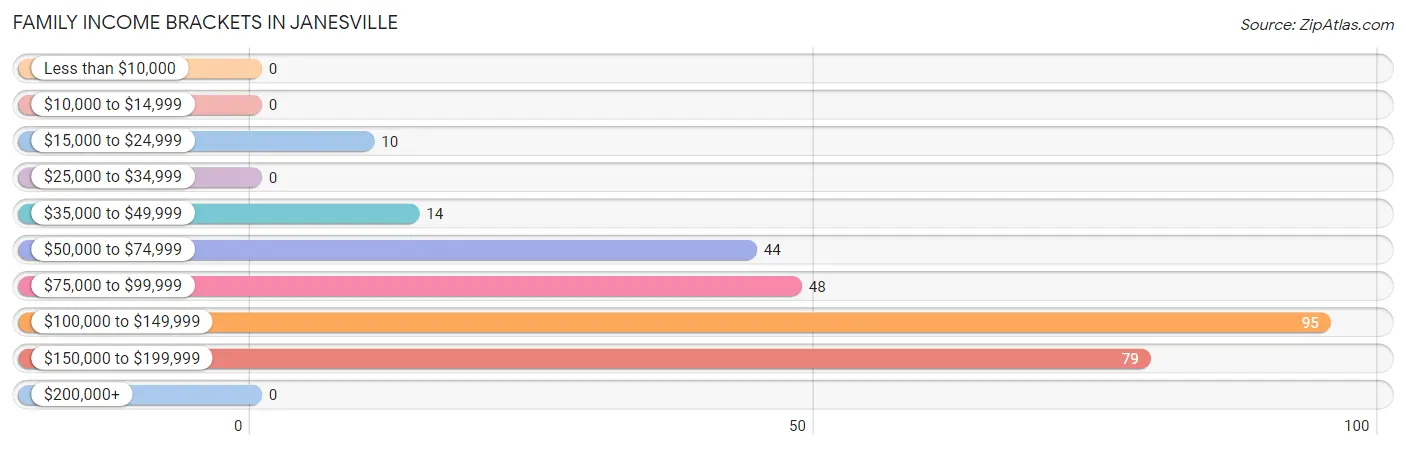
| Income Bracket | # Families | % Families |
| Less than $10,000 | 0 | 0.0% |
| $10,000 to $14,999 | 0 | 0.0% |
| $15,000 to $24,999 | 10 | 3.4% |
| $25,000 to $34,999 | 0 | 0.0% |
| $35,000 to $49,999 | 14 | 4.8% |
| $50,000 to $74,999 | 44 | 15.2% |
| $75,000 to $99,999 | 48 | 16.6% |
| $100,000 to $149,999 | 95 | 32.8% |
| $150,000 to $199,999 | 79 | 27.2% |
| $200,000+ | 0 | 0.0% |
Family Income by Famaliy Size in Janesville
5-person families (37 | 12.8%) account for the highest median family income in Janesville with $131,964 per family, while 2-person families (144 | 49.7%) have the highest median income of $55,416 per family member.
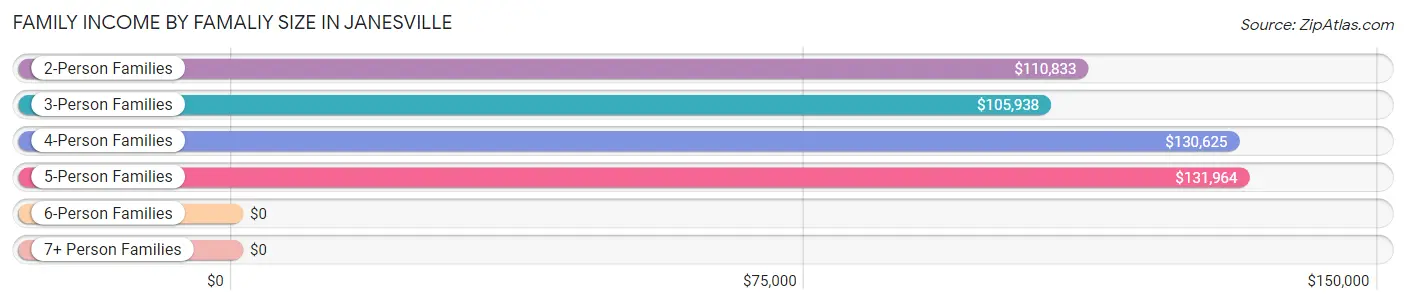
| Income Bracket | # Families | Median Income |
| 2-Person Families | 144 (49.7%) | $110,833 |
| 3-Person Families | 35 (12.1%) | $105,938 |
| 4-Person Families | 68 (23.4%) | $130,625 |
| 5-Person Families | 37 (12.8%) | $131,964 |
| 6-Person Families | 6 (2.1%) | $0 |
| 7+ Person Families | 0 (0.0%) | $0 |
| Total | 290 (100.0%) | $113,375 |
Family Income by Number of Earners in Janesville
The median family income in Janesville is $113,375, with families comprising 3+ earners (27) having the highest median family income of $145,417, while families with no earners (28) have the lowest median family income of $51,250, accounting for 9.3% and 9.7% of families, respectively.
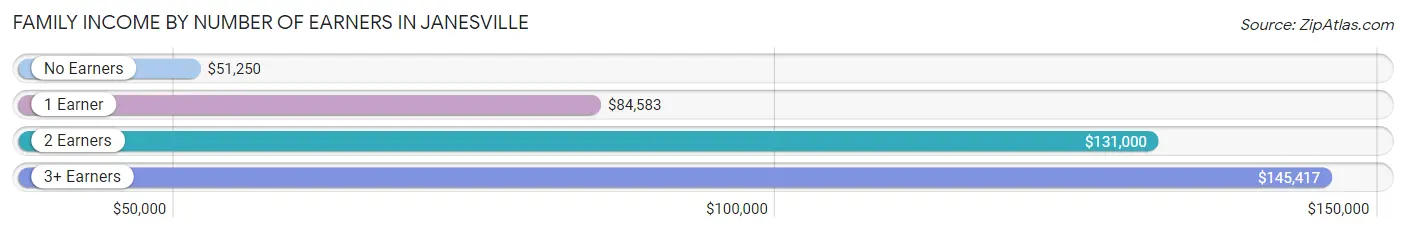
| Number of Earners | # Families | Median Income |
| No Earners | 28 (9.7%) | $51,250 |
| 1 Earner | 37 (12.8%) | $84,583 |
| 2 Earners | 198 (68.3%) | $131,000 |
| 3+ Earners | 27 (9.3%) | $145,417 |
| Total | 290 (100.0%) | $113,375 |
Household Income in Janesville
Household Income Brackets in Janesville
With 106 households falling in the category, the $100,000 to $149,999 income range is the most frequent in Janesville, accounting for 26.3% of all households.
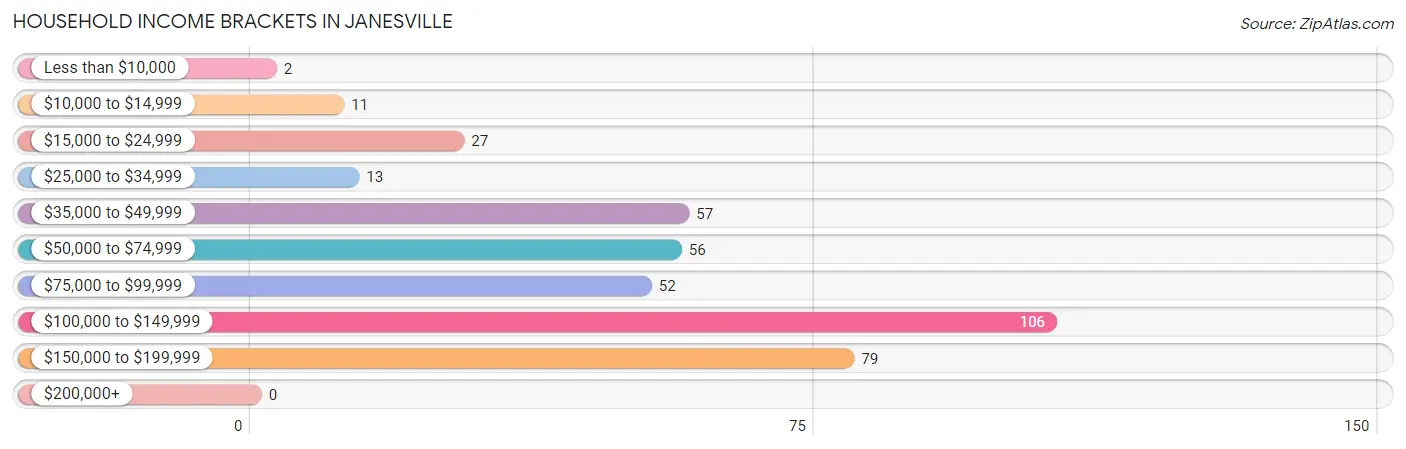
| Income Bracket | # Households | % Households |
| Less than $10,000 | 2 | 0.5% |
| $10,000 to $14,999 | 11 | 2.7% |
| $15,000 to $24,999 | 27 | 6.7% |
| $25,000 to $34,999 | 13 | 3.2% |
| $35,000 to $49,999 | 57 | 14.1% |
| $50,000 to $74,999 | 56 | 13.9% |
| $75,000 to $99,999 | 52 | 12.9% |
| $100,000 to $149,999 | 106 | 26.3% |
| $150,000 to $199,999 | 79 | 19.6% |
| $200,000+ | 0 | 0.0% |
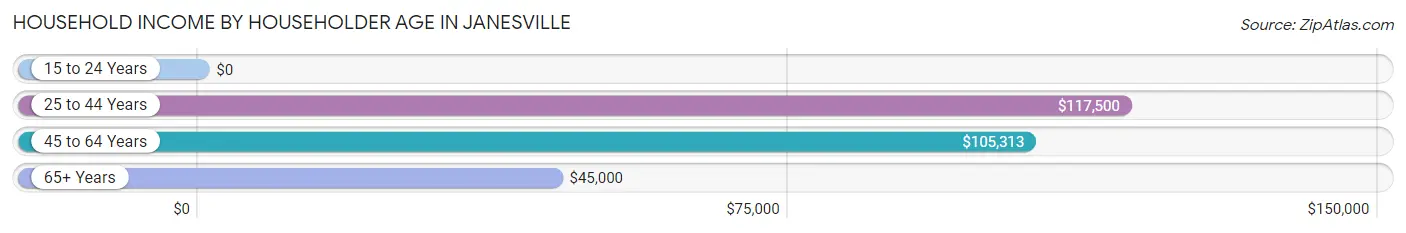
Household Income by Householder Age in Janesville
The median household income in Janesville is $88,625, with the highest median household income of $117,500 found in the 25 to 44 years age bracket for the primary householder. A total of 144 households (35.7%) fall into this category.
| Income Bracket | # Households | Median Income |
| 15 to 24 Years | 0 (0.0%) | $0 |
| 25 to 44 Years | 144 (35.7%) | $117,500 |
| 45 to 64 Years | 155 (38.5%) | $105,313 |
| 65+ Years | 104 (25.8%) | $45,000 |
| Total | 403 (100.0%) | $88,625 |
Poverty in Janesville
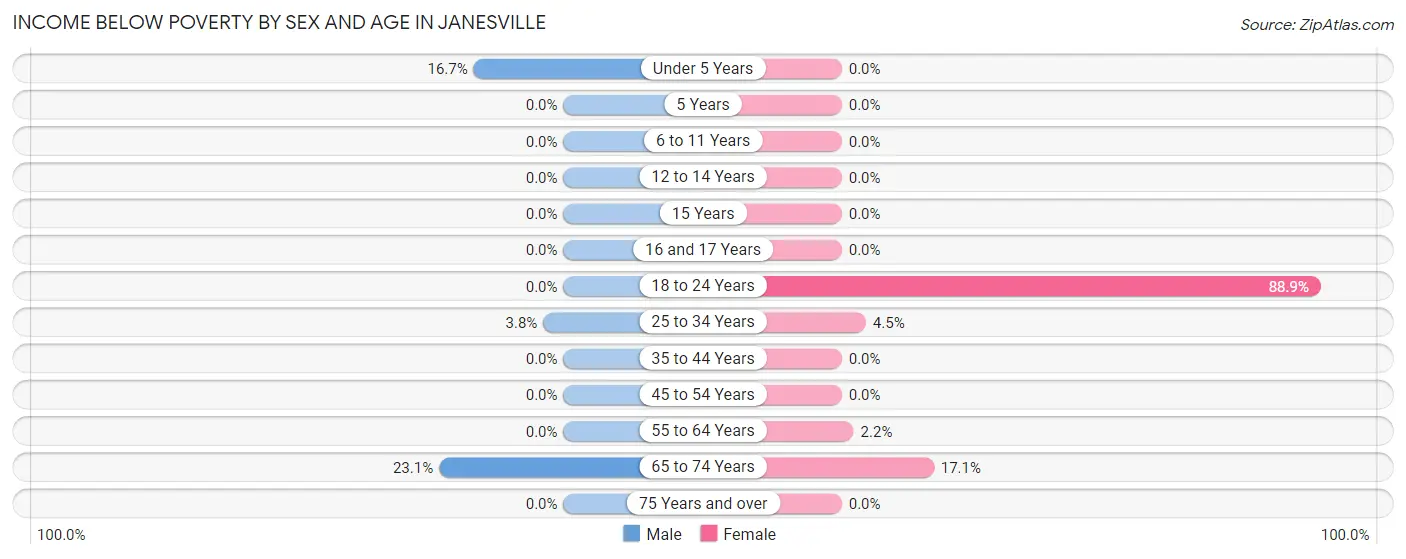
Income Below Poverty by Sex and Age in Janesville
With 4.1% poverty level for males and 3.7% for females among the residents of Janesville, 65 to 74 year old males and 18 to 24 year old females are the most vulnerable to poverty, with 15 males (23.1%) and 8 females (88.9%) in their respective age groups living below the poverty level.
| Age Bracket | Male | Female |
| Under 5 Years | 3 (16.7%) | 0 (0.0%) |
| 5 Years | 0 (0.0%) | 0 (0.0%) |
| 6 to 11 Years | 0 (0.0%) | 0 (0.0%) |
| 12 to 14 Years | 0 (0.0%) | 0 (0.0%) |
| 15 Years | 0 (0.0%) | 0 (0.0%) |
| 16 and 17 Years | 0 (0.0%) | 0 (0.0%) |
| 18 to 24 Years | 0 (0.0%) | 8 (88.9%) |
| 25 to 34 Years | 3 (3.7%) | 3 (4.5%) |
| 35 to 44 Years | 0 (0.0%) | 0 (0.0%) |
| 45 to 54 Years | 0 (0.0%) | 0 (0.0%) |
| 55 to 64 Years | 0 (0.0%) | 2 (2.2%) |
| 65 to 74 Years | 15 (23.1%) | 7 (17.1%) |
| 75 Years and over | 0 (0.0%) | 0 (0.0%) |
| Total | 21 (4.1%) | 20 (3.7%) |
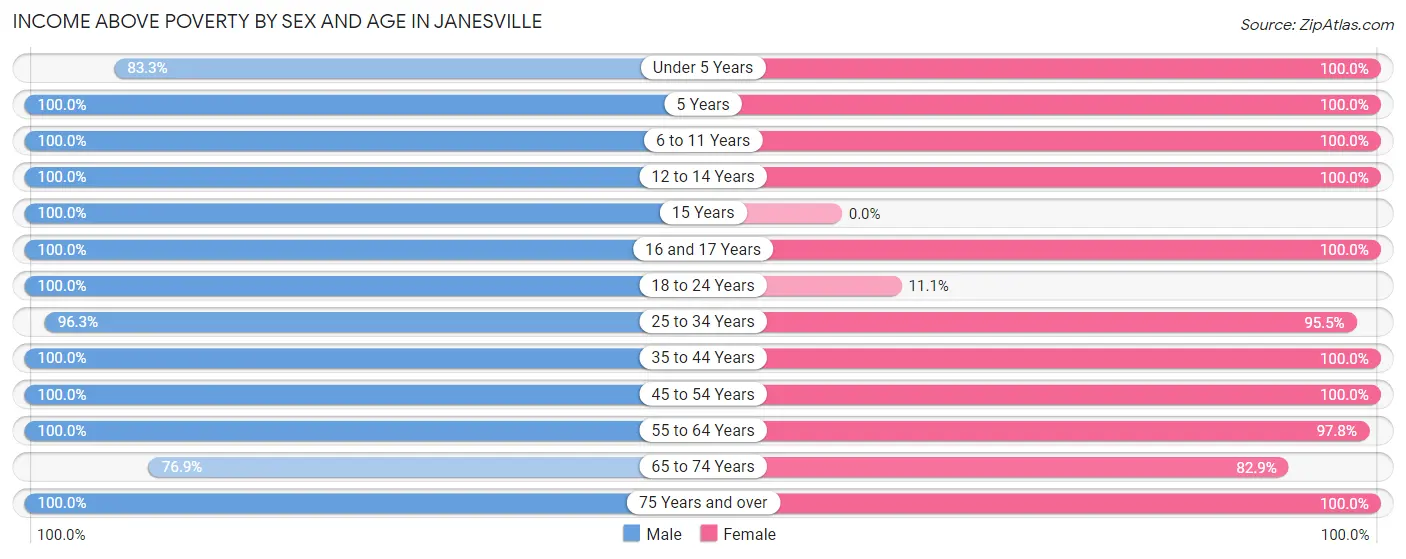
Income Above Poverty by Sex and Age in Janesville
According to the poverty statistics in Janesville, males aged 5 years and females aged under 5 years are the age groups that are most secure financially, with 100.0% of males and 100.0% of females in these age groups living above the poverty line.
| Age Bracket | Male | Female |
| Under 5 Years | 15 (83.3%) | 63 (100.0%) |
| 5 Years | 18 (100.0%) | 9 (100.0%) |
| 6 to 11 Years | 33 (100.0%) | 66 (100.0%) |
| 12 to 14 Years | 26 (100.0%) | 14 (100.0%) |
| 15 Years | 16 (100.0%) | 0 (0.0%) |
| 16 and 17 Years | 27 (100.0%) | 21 (100.0%) |
| 18 to 24 Years | 13 (100.0%) | 1 (11.1%) |
| 25 to 34 Years | 77 (96.3%) | 64 (95.5%) |
| 35 to 44 Years | 72 (100.0%) | 73 (100.0%) |
| 45 to 54 Years | 52 (100.0%) | 50 (100.0%) |
| 55 to 64 Years | 85 (100.0%) | 89 (97.8%) |
| 65 to 74 Years | 50 (76.9%) | 34 (82.9%) |
| 75 Years and over | 10 (100.0%) | 39 (100.0%) |
| Total | 494 (95.9%) | 523 (96.3%) |
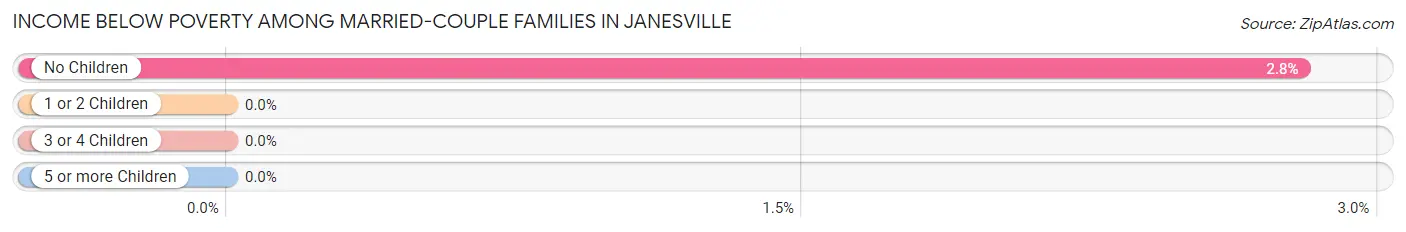
Income Below Poverty Among Married-Couple Families in Janesville
The poverty statistics for married-couple families in Janesville show that 1.5% or 4 of the total 269 families live below the poverty line. Families with no children have the highest poverty rate of 2.8%, comprising of 4 families. On the other hand, families with 1 or 2 children have the lowest poverty rate of 0.0%, which includes 0 families.
| Children | Above Poverty | Below Poverty |
| No Children | 139 (97.2%) | 4 (2.8%) |
| 1 or 2 Children | 91 (100.0%) | 0 (0.0%) |
| 3 or 4 Children | 35 (100.0%) | 0 (0.0%) |
| 5 or more Children | 0 (0.0%) | 0 (0.0%) |
| Total | 265 (98.5%) | 4 (1.5%) |
Income Below Poverty Among Single-Parent Households in Janesville
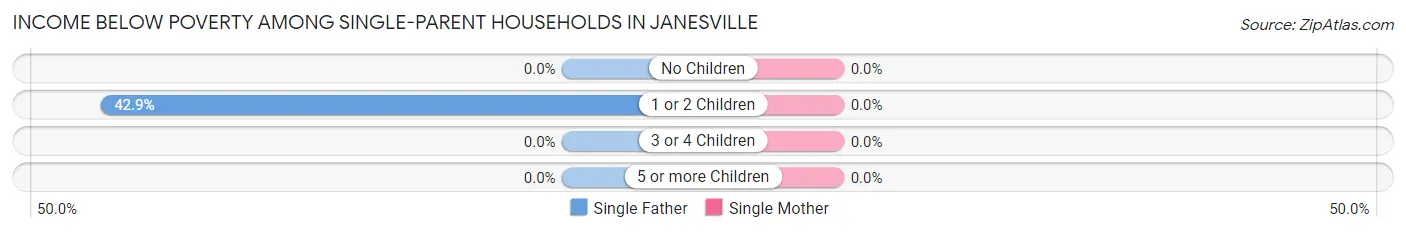
| Children | Single Father | Single Mother |
| No Children | 0 (0.0%) | 0 (0.0%) |
| 1 or 2 Children | 3 (42.9%) | 0 (0.0%) |
| 3 or 4 Children | 0 (0.0%) | 0 (0.0%) |
| 5 or more Children | 0 (0.0%) | 0 (0.0%) |
| Total | 3 (42.9%) | 0 (0.0%) |
Income Below Poverty Among Married-Couple vs Single-Parent Households in Janesville
The poverty data for Janesville shows that 4 of the married-couple family households (1.5%) and 3 of the single-parent households (14.3%) are living below the poverty level. Within the married-couple family households, those with no children have the highest poverty rate, with 4 households (2.8%) falling below the poverty line. Among the single-parent households, those with 1 or 2 children have the highest poverty rate, with 3 household (42.9%) living below poverty.
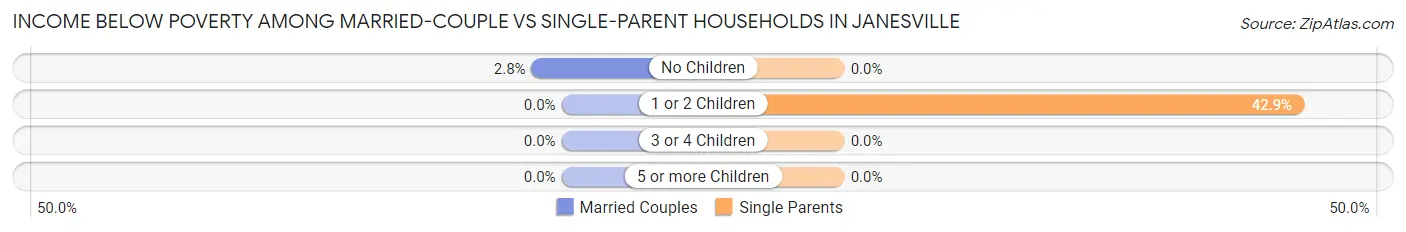
| Children | Married-Couple Families | Single-Parent Households |
| No Children | 4 (2.8%) | 0 (0.0%) |
| 1 or 2 Children | 0 (0.0%) | 3 (42.9%) |
| 3 or 4 Children | 0 (0.0%) | 0 (0.0%) |
| 5 or more Children | 0 (0.0%) | 0 (0.0%) |
| Total | 4 (1.5%) | 3 (14.3%) |
Race in Janesville
The most populous races in Janesville are White / Caucasian (1,057 | 99.4%), Hispanic or Latino (15 | 1.4%), and Two or more Races (5 | 0.5%).
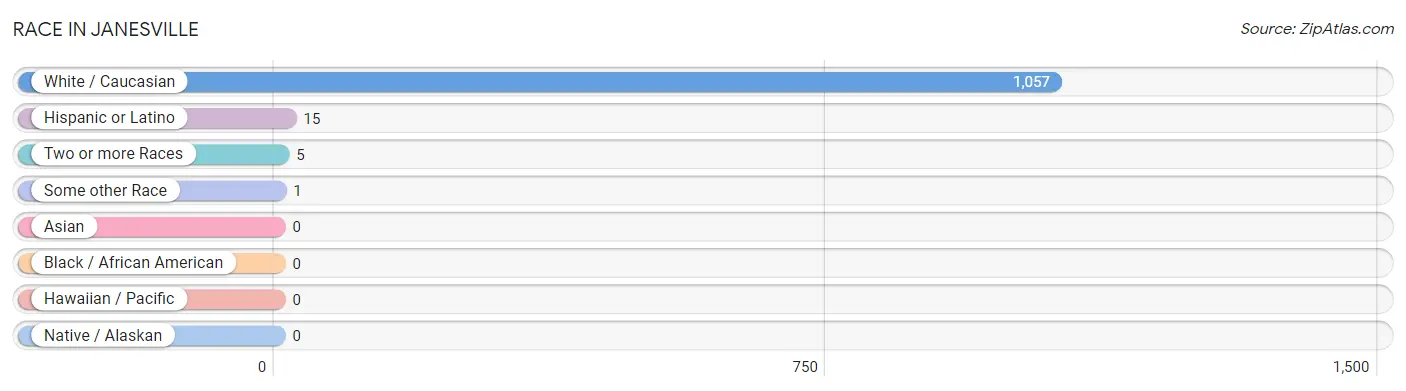
| Race | # Population | % Population |
| Asian | 0 | 0.0% |
| Black / African American | 0 | 0.0% |
| Hawaiian / Pacific | 0 | 0.0% |
| Hispanic or Latino | 15 | 1.4% |
| Native / Alaskan | 0 | 0.0% |
| White / Caucasian | 1,057 | 99.4% |
| Two or more Races | 5 | 0.5% |
| Some other Race | 1 | 0.1% |
| Total | 1,063 | 100.0% |
Ancestry in Janesville
The most populous ancestries reported in Janesville are German (463 | 43.6%), American (148 | 13.9%), Irish (90 | 8.5%), English (72 | 6.8%), and Norwegian (53 | 5.0%), together accounting for 77.7% of all Janesville residents.
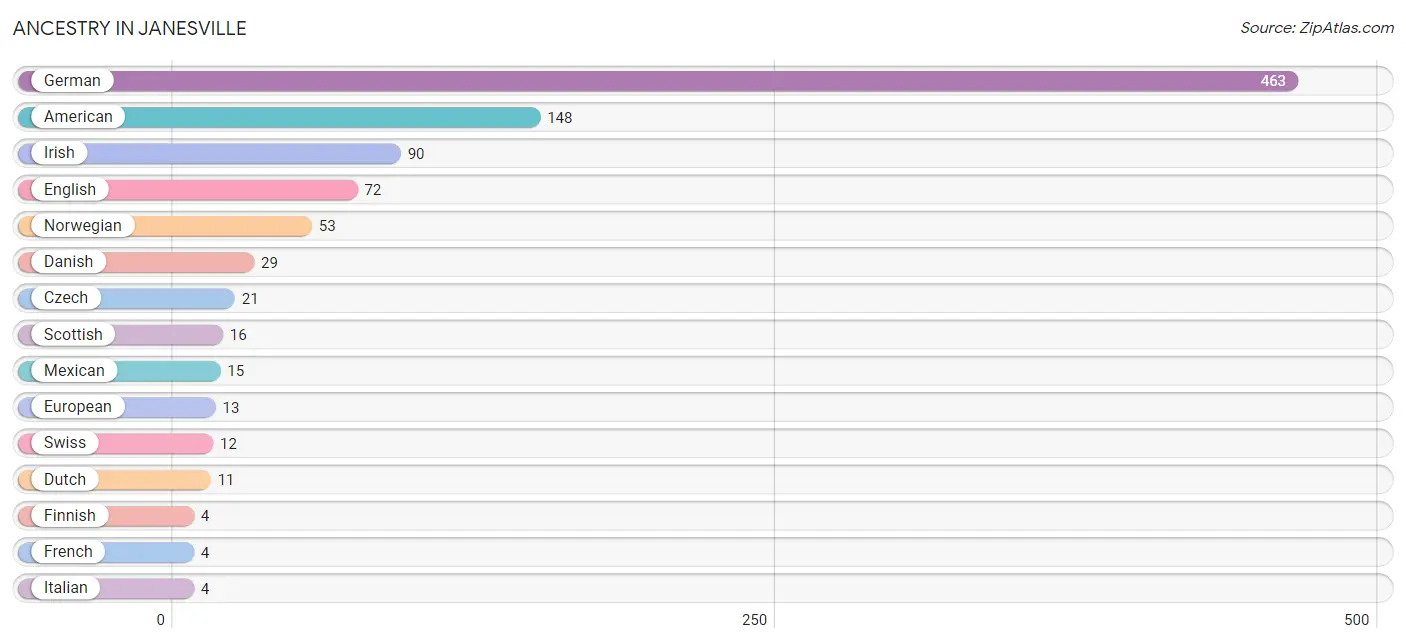
| Ancestry | # Population | % Population |
| American | 148 | 13.9% |
| Czech | 21 | 2.0% |
| Danish | 29 | 2.7% |
| Dutch | 11 | 1.0% |
| Eastern European | 3 | 0.3% |
| English | 72 | 6.8% |
| European | 13 | 1.2% |
| Finnish | 4 | 0.4% |
| French | 4 | 0.4% |
| German | 463 | 43.6% |
| Irish | 90 | 8.5% |
| Italian | 4 | 0.4% |
| Mexican | 15 | 1.4% |
| Northern European | 3 | 0.3% |
| Norwegian | 53 | 5.0% |
| Polish | 4 | 0.4% |
| Scottish | 16 | 1.5% |
| Swedish | 4 | 0.4% |
| Swiss | 12 | 1.1% | View All 19 Rows |
Immigrants in Janesville
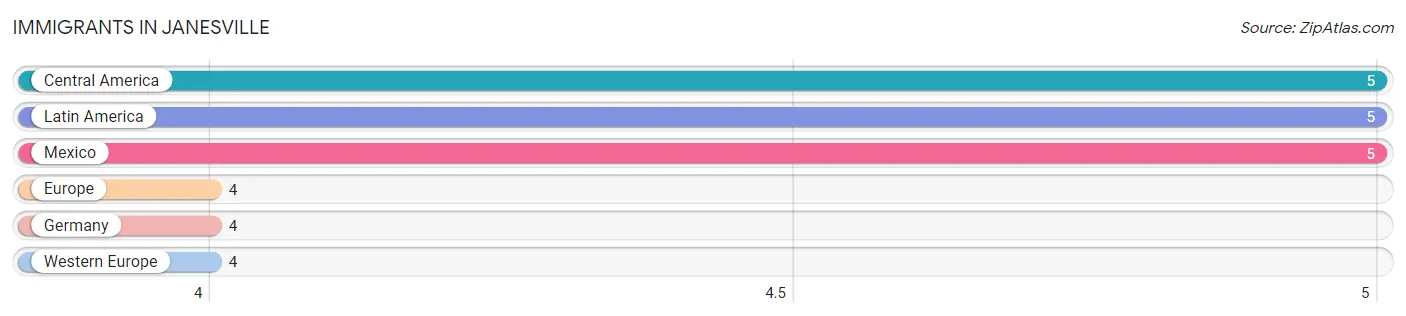
The most numerous immigrant groups reported in Janesville came from Central America (5 | 0.5%), Latin America (5 | 0.5%), Mexico (5 | 0.5%), Europe (4 | 0.4%), and Germany (4 | 0.4%), together accounting for 2.2% of all Janesville residents.
| Immigration Origin | # Population | % Population |
| Central America | 5 | 0.5% |
| Europe | 4 | 0.4% |
| Germany | 4 | 0.4% |
| Latin America | 5 | 0.5% |
| Mexico | 5 | 0.5% |
| Western Europe | 4 | 0.4% | View All 6 Rows |
Sex and Age in Janesville
Sex and Age in Janesville
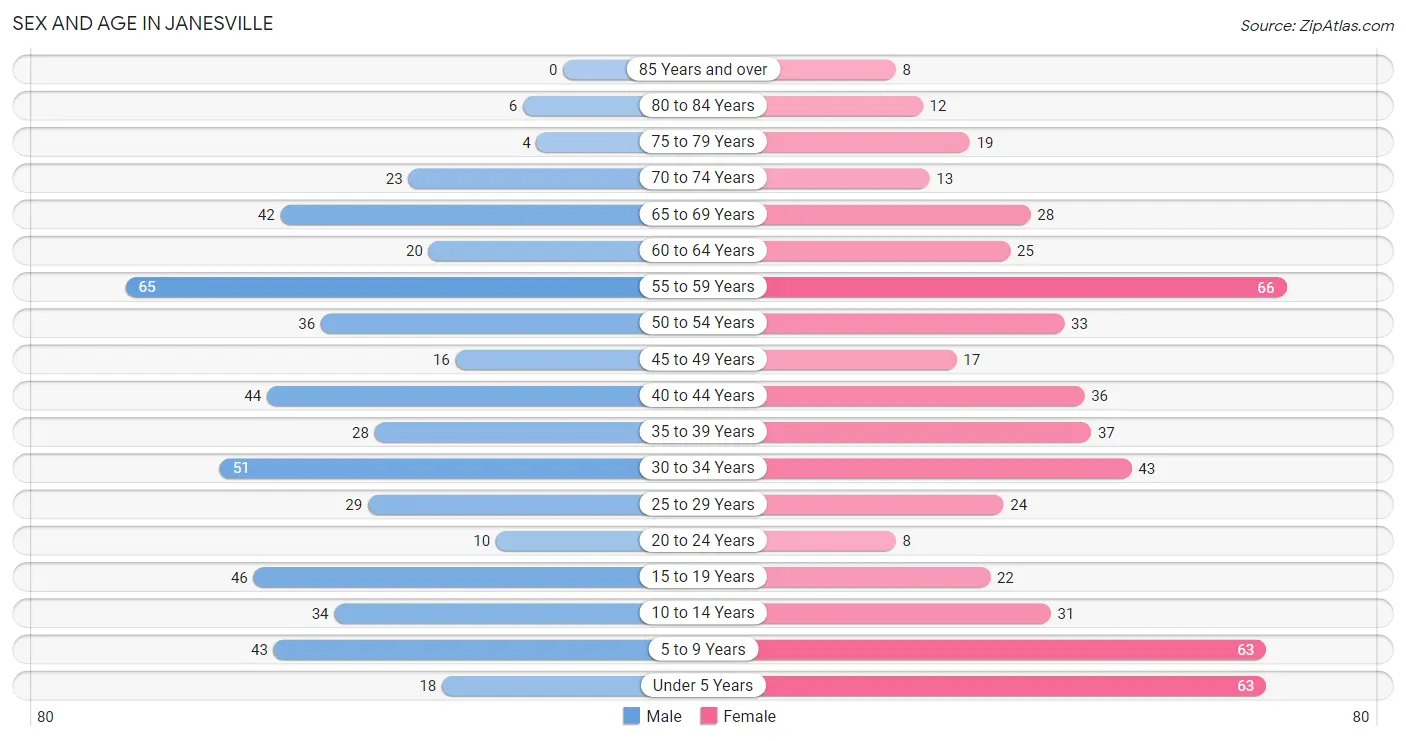
The most populous age groups in Janesville are 55 to 59 Years (65 | 12.6%) for men and 55 to 59 Years (66 | 12.0%) for women.
| Age Bracket | Male | Female |
| Under 5 Years | 18 (3.5%) | 63 (11.5%) |
| 5 to 9 Years | 43 (8.4%) | 63 (11.5%) |
| 10 to 14 Years | 34 (6.6%) | 31 (5.7%) |
| 15 to 19 Years | 46 (8.9%) | 22 (4.0%) |
| 20 to 24 Years | 10 (1.9%) | 8 (1.5%) |
| 25 to 29 Years | 29 (5.6%) | 24 (4.4%) |
| 30 to 34 Years | 51 (9.9%) | 43 (7.9%) |
| 35 to 39 Years | 28 (5.4%) | 37 (6.8%) |
| 40 to 44 Years | 44 (8.5%) | 36 (6.6%) |
| 45 to 49 Years | 16 (3.1%) | 17 (3.1%) |
| 50 to 54 Years | 36 (7.0%) | 33 (6.0%) |
| 55 to 59 Years | 65 (12.6%) | 66 (12.0%) |
| 60 to 64 Years | 20 (3.9%) | 25 (4.6%) |
| 65 to 69 Years | 42 (8.2%) | 28 (5.1%) |
| 70 to 74 Years | 23 (4.5%) | 13 (2.4%) |
| 75 to 79 Years | 4 (0.8%) | 19 (3.5%) |
| 80 to 84 Years | 6 (1.2%) | 12 (2.2%) |
| 85 Years and over | 0 (0.0%) | 8 (1.5%) |
| Total | 515 (100.0%) | 548 (100.0%) |
Families and Households in Janesville
Median Family Size in Janesville
The median family size in Janesville is 3.21 persons per family, with single male/father families (7 | 2.4%) accounting for the largest median family size of 3.86 persons per family. On the other hand, single female/mother families (14 | 4.8%) represent the smallest median family size with 2.07 persons per family.
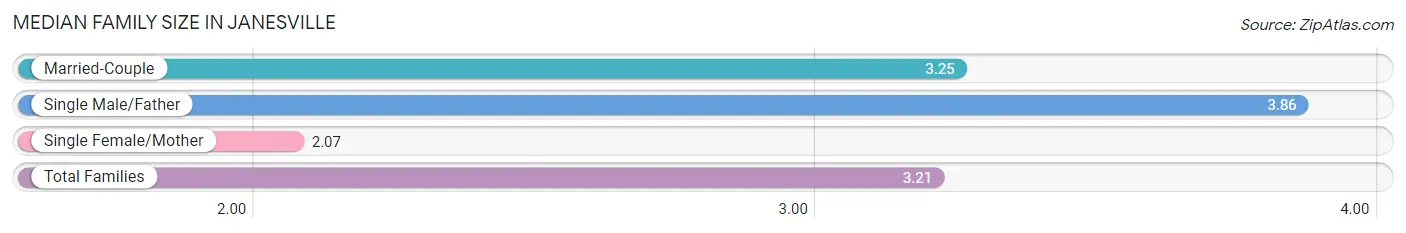
| Family Type | # Families | Family Size |
| Married-Couple | 269 (92.8%) | 3.25 |
| Single Male/Father | 7 (2.4%) | 3.86 |
| Single Female/Mother | 14 (4.8%) | 2.07 |
| Total Families | 290 (100.0%) | 3.21 |
Median Household Size in Janesville
The median household size in Janesville is 2.64 persons per household, with single male/father households (7 | 1.7%) accounting for the largest median household size of 4.29 persons per household. non-family households (113 | 28.0%) represent the smallest median household size with 1.15 persons per household.
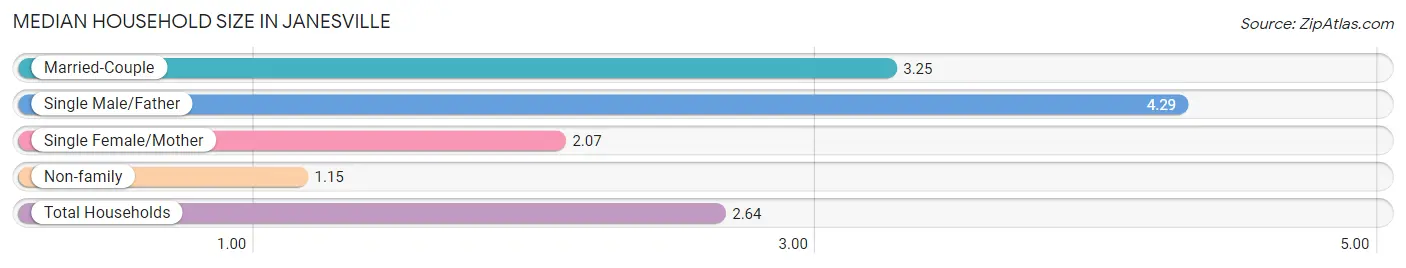
| Household Type | # Households | Household Size |
| Married-Couple | 269 (66.7%) | 3.25 |
| Single Male/Father | 7 (1.7%) | 4.29 |
| Single Female/Mother | 14 (3.5%) | 2.07 |
| Non-family | 113 (28.0%) | 1.15 |
| Total Households | 403 (100.0%) | 2.64 |
Household Size by Marriage Status in Janesville
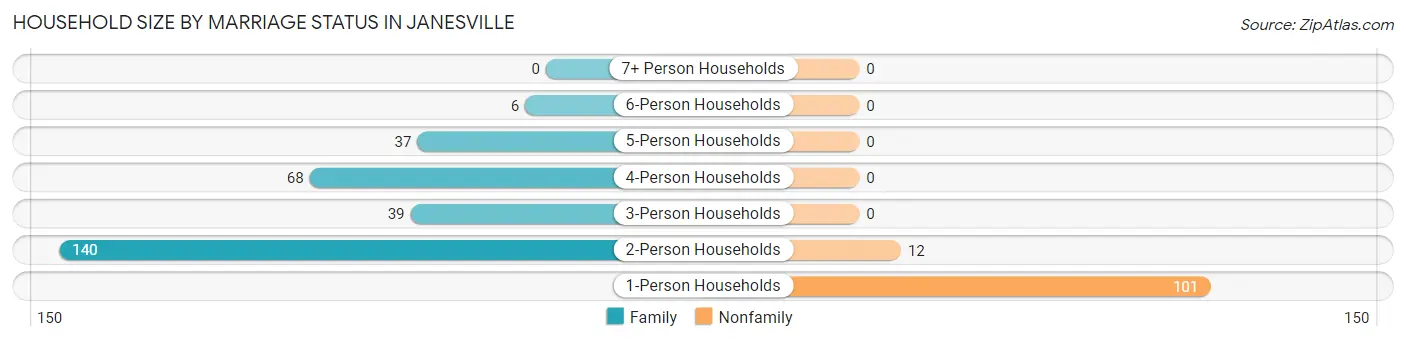
Out of a total of 403 households in Janesville, 290 (72.0%) are family households, while 113 (28.0%) are nonfamily households. The most numerous type of family households are 2-person households, comprising 140, and the most common type of nonfamily households are 1-person households, comprising 101.
| Household Size | Family Households | Nonfamily Households |
| 1-Person Households | - | 101 (25.1%) |
| 2-Person Households | 140 (34.7%) | 12 (3.0%) |
| 3-Person Households | 39 (9.7%) | 0 (0.0%) |
| 4-Person Households | 68 (16.9%) | 0 (0.0%) |
| 5-Person Households | 37 (9.2%) | 0 (0.0%) |
| 6-Person Households | 6 (1.5%) | 0 (0.0%) |
| 7+ Person Households | 0 (0.0%) | 0 (0.0%) |
| Total | 290 (72.0%) | 113 (28.0%) |
Female Fertility in Janesville
Fertility by Age in Janesville
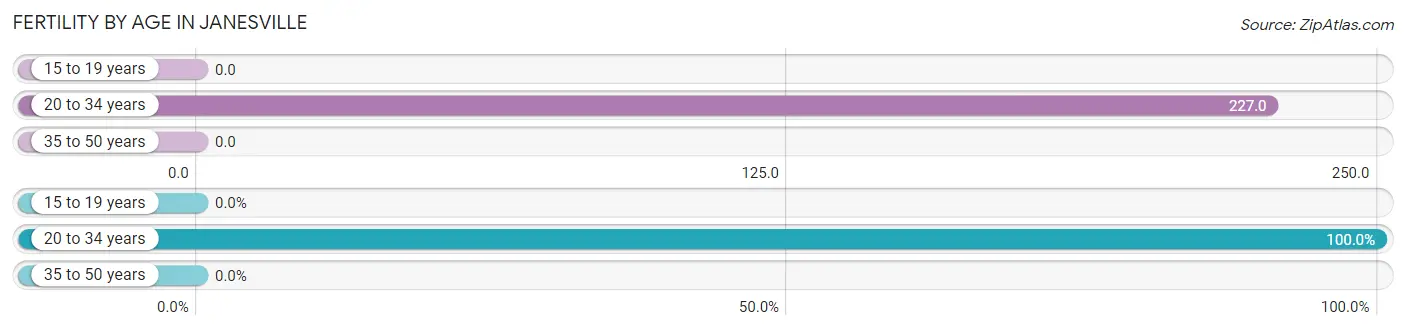
Average fertility rate in Janesville is 85.0 births per 1,000 women. Women in the age bracket of 20 to 34 years have the highest fertility rate with 227.0 births per 1,000 women. Women in the age bracket of 20 to 34 years acount for 100.0% of all women with births.
| Age Bracket | Women with Births | Births / 1,000 Women |
| 15 to 19 years | 0 (0.0%) | 0.0 |
| 20 to 34 years | 17 (100.0%) | 227.0 |
| 35 to 50 years | 0 (0.0%) | 0.0 |
| Total | 17 (100.0%) | 85.0 |
Fertility by Age by Marriage Status in Janesville
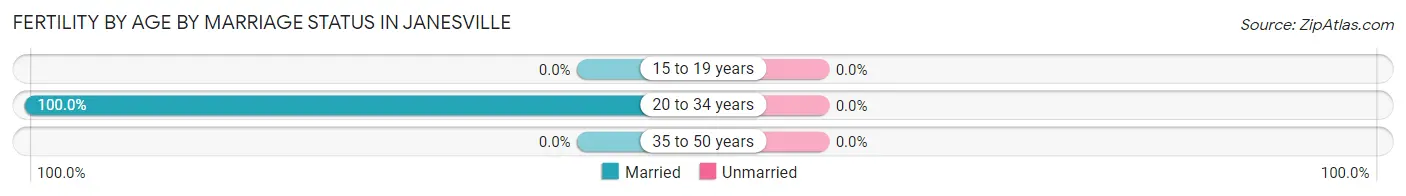
| Age Bracket | Married | Unmarried |
| 15 to 19 years | 0 (0.0%) | 0 (0.0%) |
| 20 to 34 years | 17 (100.0%) | 0 (0.0%) |
| 35 to 50 years | 0 (0.0%) | 0 (0.0%) |
| Total | 17 (100.0%) | 0 (0.0%) |
Fertility by Education in Janesville
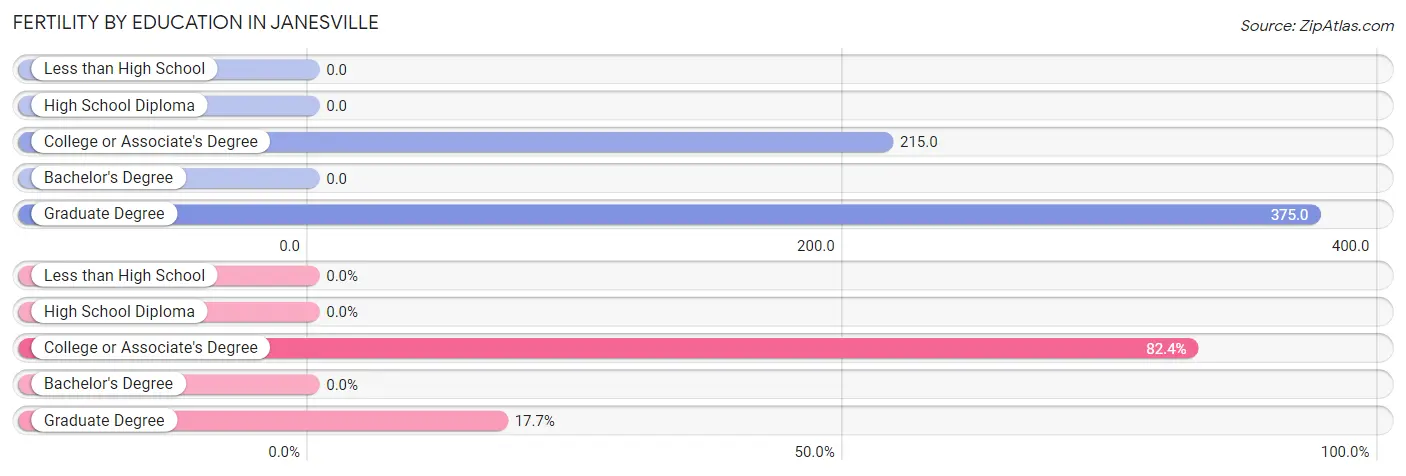
| Educational Attainment | Women with Births | Births / 1,000 Women |
| Less than High School | 0 (0.0%) | 0.0 |
| High School Diploma | 0 (0.0%) | 0.0 |
| College or Associate's Degree | 14 (82.4%) | 215.0 |
| Bachelor's Degree | 0 (0.0%) | 0.0 |
| Graduate Degree | 3 (17.6%) | 375.0 |
| Total | 17 (100.0%) | 85.0 |
Fertility by Education by Marriage Status in Janesville
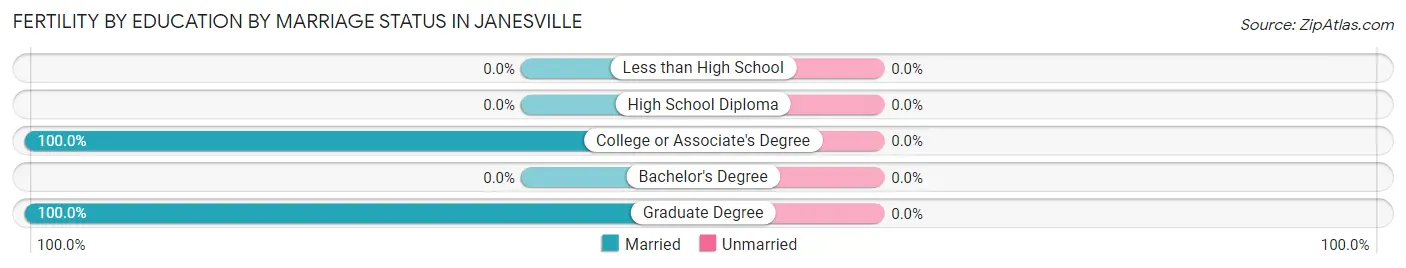
| Educational Attainment | Married | Unmarried |
| Less than High School | 0 (0.0%) | 0 (0.0%) |
| High School Diploma | 0 (0.0%) | 0 (0.0%) |
| College or Associate's Degree | 14 (100.0%) | 0 (0.0%) |
| Bachelor's Degree | 0 (0.0%) | 0 (0.0%) |
| Graduate Degree | 3 (100.0%) | 0 (0.0%) |
| Total | 17 (100.0%) | 0 (0.0%) |
Employment Characteristics in Janesville
Employment by Class of Employer in Janesville
Among the 549 employed individuals in Janesville, private company employees (446 | 81.2%), local government employees (39 | 7.1%), and state government employees (22 | 4.0%) make up the most common classes of employment.
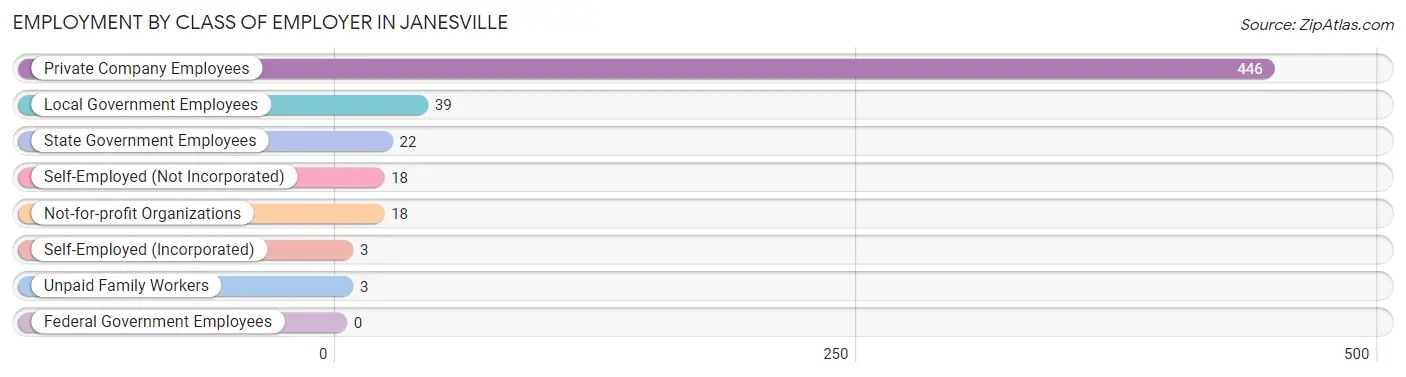
| Employer Class | # Employees | % Employees |
| Private Company Employees | 446 | 81.2% |
| Self-Employed (Incorporated) | 3 | 0.5% |
| Self-Employed (Not Incorporated) | 18 | 3.3% |
| Not-for-profit Organizations | 18 | 3.3% |
| Local Government Employees | 39 | 7.1% |
| State Government Employees | 22 | 4.0% |
| Federal Government Employees | 0 | 0.0% |
| Unpaid Family Workers | 3 | 0.5% |
| Total | 549 | 100.0% |
Employment Status by Age in Janesville
According to the labor force statistics for Janesville, out of the total population over 16 years of age (795), 72.7% or 578 individuals are in the labor force, with 1.6% or 9 of them unemployed. The age group with the highest labor force participation rate is 30 to 34 years, with 100.0% or 94 individuals in the labor force. Within the labor force, the 65 to 74 years age range has the highest percentage of unemployed individuals, with 18.8% or 3 of them being unemployed.
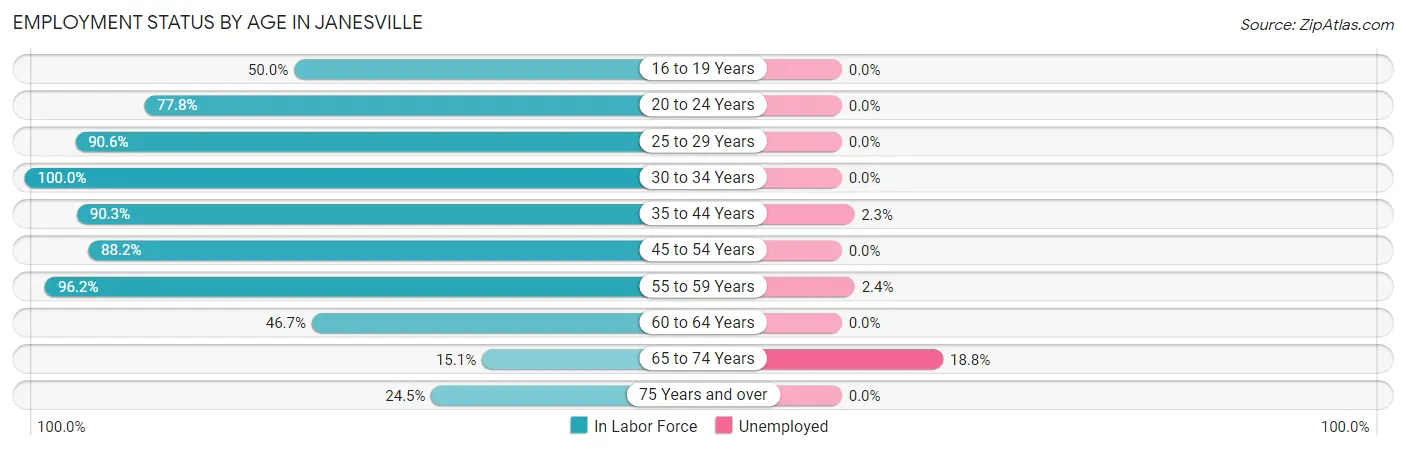
| Age Bracket | In Labor Force | Unemployed |
| 16 to 19 Years | 26 (50.0%) | 0 (0.0%) |
| 20 to 24 Years | 14 (77.8%) | 0 (0.0%) |
| 25 to 29 Years | 48 (90.6%) | 0 (0.0%) |
| 30 to 34 Years | 94 (100.0%) | 0 (0.0%) |
| 35 to 44 Years | 131 (90.3%) | 3 (2.3%) |
| 45 to 54 Years | 90 (88.2%) | 0 (0.0%) |
| 55 to 59 Years | 126 (96.2%) | 3 (2.4%) |
| 60 to 64 Years | 21 (46.7%) | 0 (0.0%) |
| 65 to 74 Years | 16 (15.1%) | 3 (18.8%) |
| 75 Years and over | 12 (24.5%) | 0 (0.0%) |
| Total | 578 (72.7%) | 9 (1.6%) |
Employment Status by Educational Attainment in Janesville
According to labor force statistics for Janesville, 89.5% of individuals (510) out of the total population between 25 and 64 years of age (570) are in the labor force, with 1.2% or 6 of them being unemployed. The group with the highest labor force participation rate are those with the educational attainment of college / associate degree, with 92.8% or 257 individuals in the labor force. Within the labor force, individuals with high school diploma education have the highest percentage of unemployment, with 3.5% or 3 of them being unemployed.
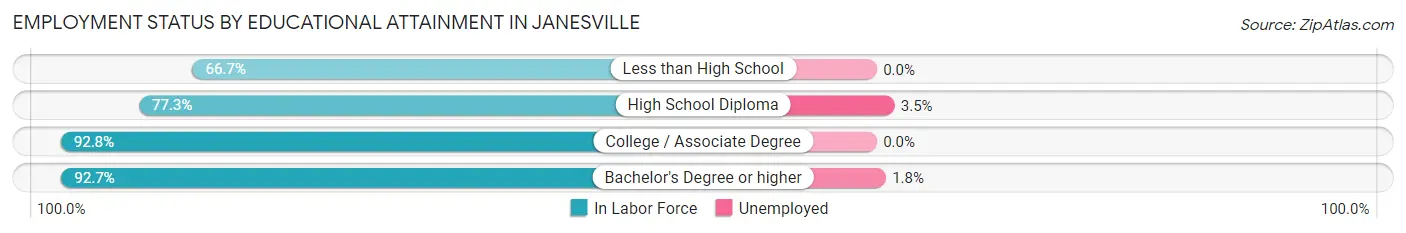
| Educational Attainment | In Labor Force | Unemployed |
| Less than High School | 4 (66.7%) | 0 (0.0%) |
| High School Diploma | 85 (77.3%) | 4 (3.5%) |
| College / Associate Degree | 257 (92.8%) | 0 (0.0%) |
| Bachelor's Degree or higher | 164 (92.7%) | 3 (1.8%) |
| Total | 510 (89.5%) | 7 (1.2%) |
Employment Occupations by Sex in Janesville
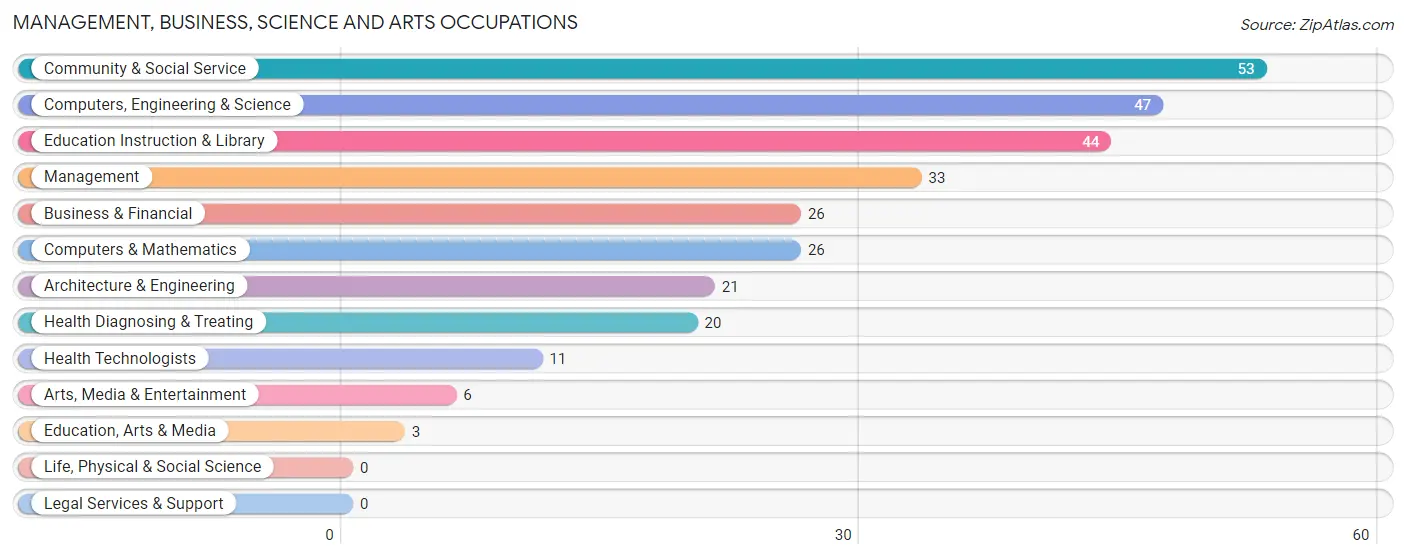
Management, Business, Science and Arts Occupations
The most common Management, Business, Science and Arts occupations in Janesville are Community & Social Service (53 | 9.3%), Computers, Engineering & Science (47 | 8.3%), Education Instruction & Library (44 | 7.7%), Management (33 | 5.8%), and Business & Financial (26 | 4.6%).
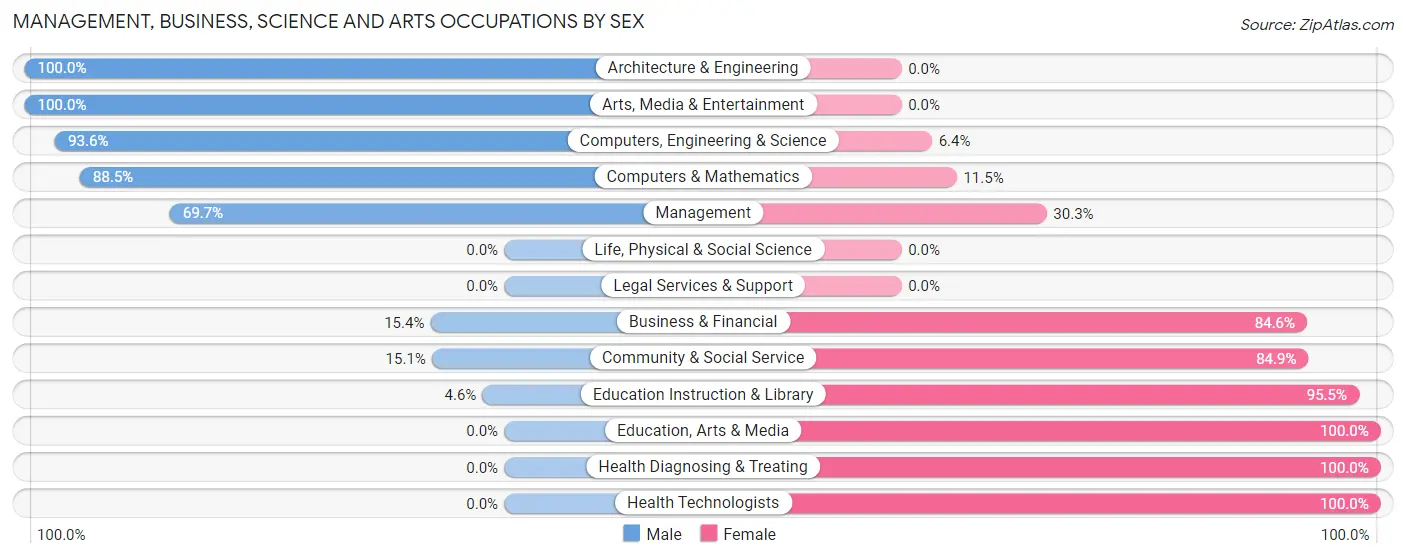
Management, Business, Science and Arts Occupations by Sex
Within the Management, Business, Science and Arts occupations in Janesville, the most male-oriented occupations are Architecture & Engineering (100.0%), Arts, Media & Entertainment (100.0%), and Computers, Engineering & Science (93.6%), while the most female-oriented occupations are Education, Arts & Media (100.0%), Health Diagnosing & Treating (100.0%), and Health Technologists (100.0%).
| Occupation | Male | Female |
| Management | 23 (69.7%) | 10 (30.3%) |
| Business & Financial | 4 (15.4%) | 22 (84.6%) |
| Computers, Engineering & Science | 44 (93.6%) | 3 (6.4%) |
| Computers & Mathematics | 23 (88.5%) | 3 (11.5%) |
| Architecture & Engineering | 21 (100.0%) | 0 (0.0%) |
| Life, Physical & Social Science | 0 (0.0%) | 0 (0.0%) |
| Community & Social Service | 8 (15.1%) | 45 (84.9%) |
| Education, Arts & Media | 0 (0.0%) | 3 (100.0%) |
| Legal Services & Support | 0 (0.0%) | 0 (0.0%) |
| Education Instruction & Library | 2 (4.5%) | 42 (95.5%) |
| Arts, Media & Entertainment | 6 (100.0%) | 0 (0.0%) |
| Health Diagnosing & Treating | 0 (0.0%) | 20 (100.0%) |
| Health Technologists | 0 (0.0%) | 11 (100.0%) |
| Total (Category) | 79 (44.1%) | 100 (55.9%) |
| Total (Overall) | 299 (52.5%) | 270 (47.4%) |
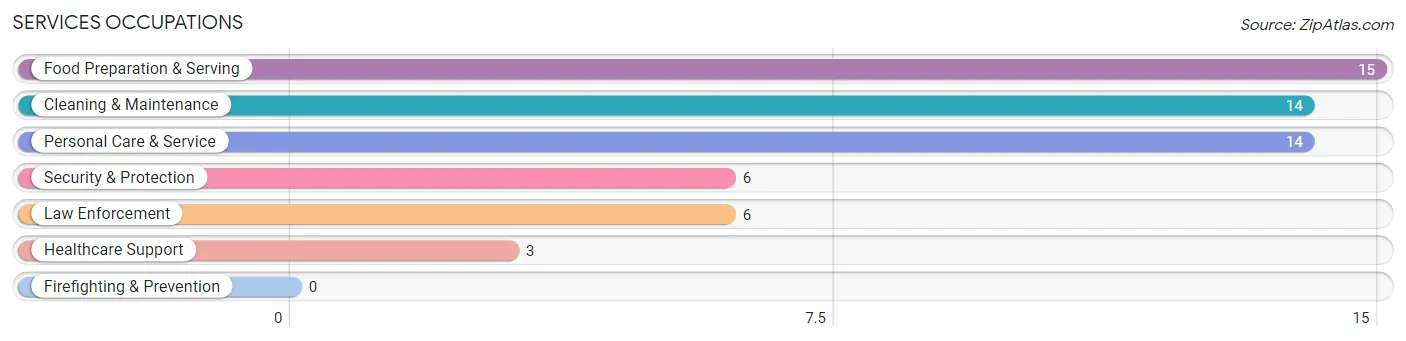
Services Occupations
The most common Services occupations in Janesville are Food Preparation & Serving (15 | 2.6%), Cleaning & Maintenance (14 | 2.5%), Personal Care & Service (14 | 2.5%), Security & Protection (6 | 1.1%), and Law Enforcement (6 | 1.1%).
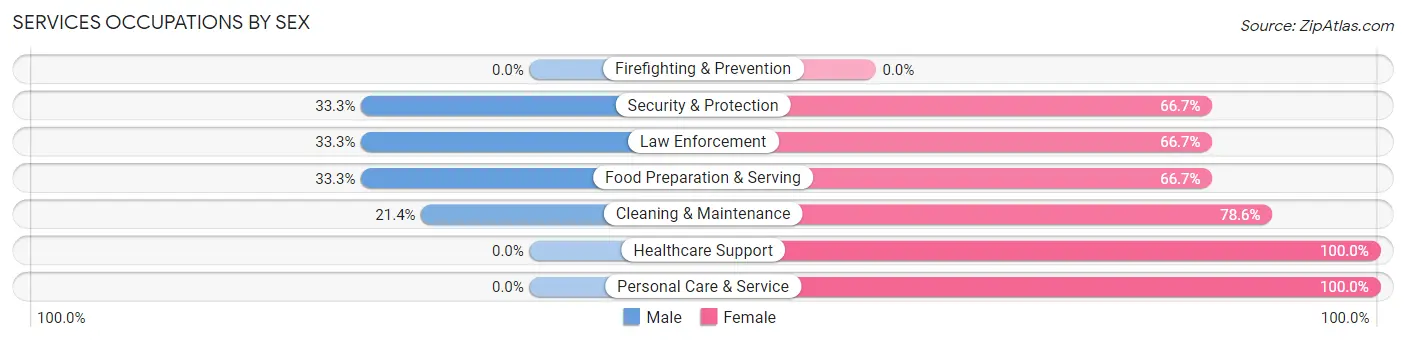
Services Occupations by Sex
Within the Services occupations in Janesville, the most male-oriented occupations are Security & Protection (33.3%), Law Enforcement (33.3%), and Food Preparation & Serving (33.3%), while the most female-oriented occupations are Healthcare Support (100.0%), Personal Care & Service (100.0%), and Cleaning & Maintenance (78.6%).
| Occupation | Male | Female |
| Healthcare Support | 0 (0.0%) | 3 (100.0%) |
| Security & Protection | 2 (33.3%) | 4 (66.7%) |
| Firefighting & Prevention | 0 (0.0%) | 0 (0.0%) |
| Law Enforcement | 2 (33.3%) | 4 (66.7%) |
| Food Preparation & Serving | 5 (33.3%) | 10 (66.7%) |
| Cleaning & Maintenance | 3 (21.4%) | 11 (78.6%) |
| Personal Care & Service | 0 (0.0%) | 14 (100.0%) |
| Total (Category) | 10 (19.2%) | 42 (80.8%) |
| Total (Overall) | 299 (52.5%) | 270 (47.4%) |
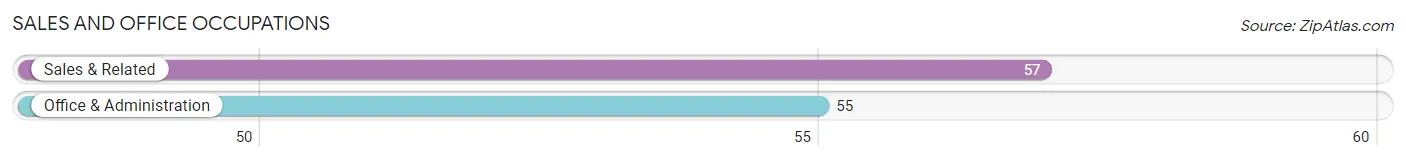
Sales and Office Occupations
The most common Sales and Office occupations in Janesville are Sales & Related (57 | 10.0%), and Office & Administration (55 | 9.7%).
Sales and Office Occupations by Sex
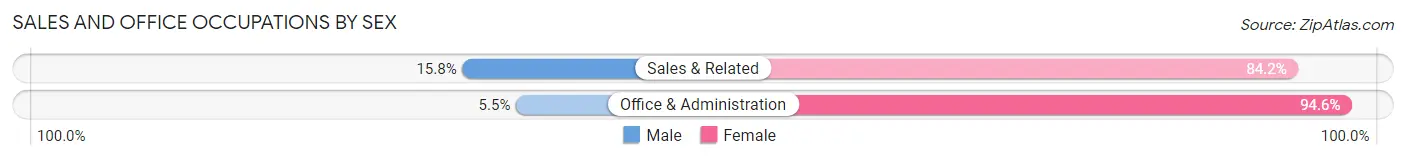
| Occupation | Male | Female |
| Sales & Related | 9 (15.8%) | 48 (84.2%) |
| Office & Administration | 3 (5.4%) | 52 (94.6%) |
| Total (Category) | 12 (10.7%) | 100 (89.3%) |
| Total (Overall) | 299 (52.5%) | 270 (47.4%) |
Natural Resources, Construction and Maintenance Occupations
The most common Natural Resources, Construction and Maintenance occupations in Janesville are Installation, Maintenance & Repair (39 | 6.9%), and Construction & Extraction (18 | 3.2%).

Natural Resources, Construction and Maintenance Occupations by Sex

| Occupation | Male | Female |
| Farming, Fishing & Forestry | 0 (0.0%) | 0 (0.0%) |
| Construction & Extraction | 15 (83.3%) | 3 (16.7%) |
| Installation, Maintenance & Repair | 39 (100.0%) | 0 (0.0%) |
| Total (Category) | 54 (94.7%) | 3 (5.3%) |
| Total (Overall) | 299 (52.5%) | 270 (47.4%) |
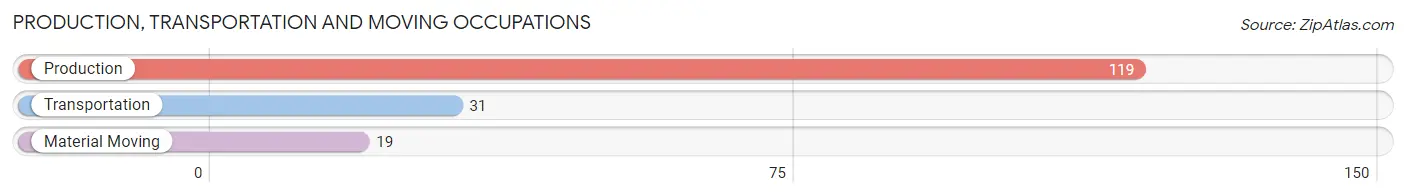
Production, Transportation and Moving Occupations
The most common Production, Transportation and Moving occupations in Janesville are Production (119 | 20.9%), Transportation (31 | 5.4%), and Material Moving (19 | 3.3%).
Production, Transportation and Moving Occupations by Sex
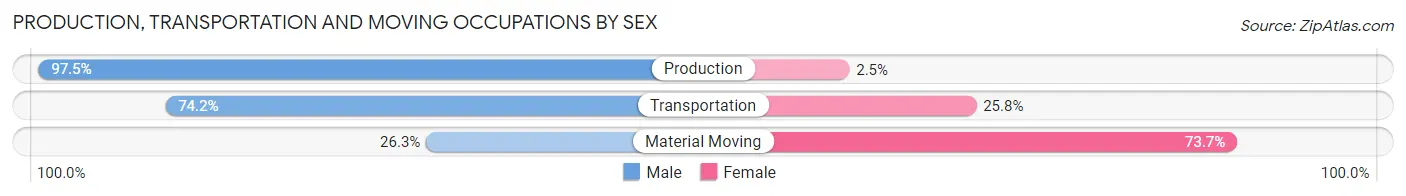
| Occupation | Male | Female |
| Production | 116 (97.5%) | 3 (2.5%) |
| Transportation | 23 (74.2%) | 8 (25.8%) |
| Material Moving | 5 (26.3%) | 14 (73.7%) |
| Total (Category) | 144 (85.2%) | 25 (14.8%) |
| Total (Overall) | 299 (52.5%) | 270 (47.4%) |
Employment Industries by Sex in Janesville
Employment Industries in Janesville
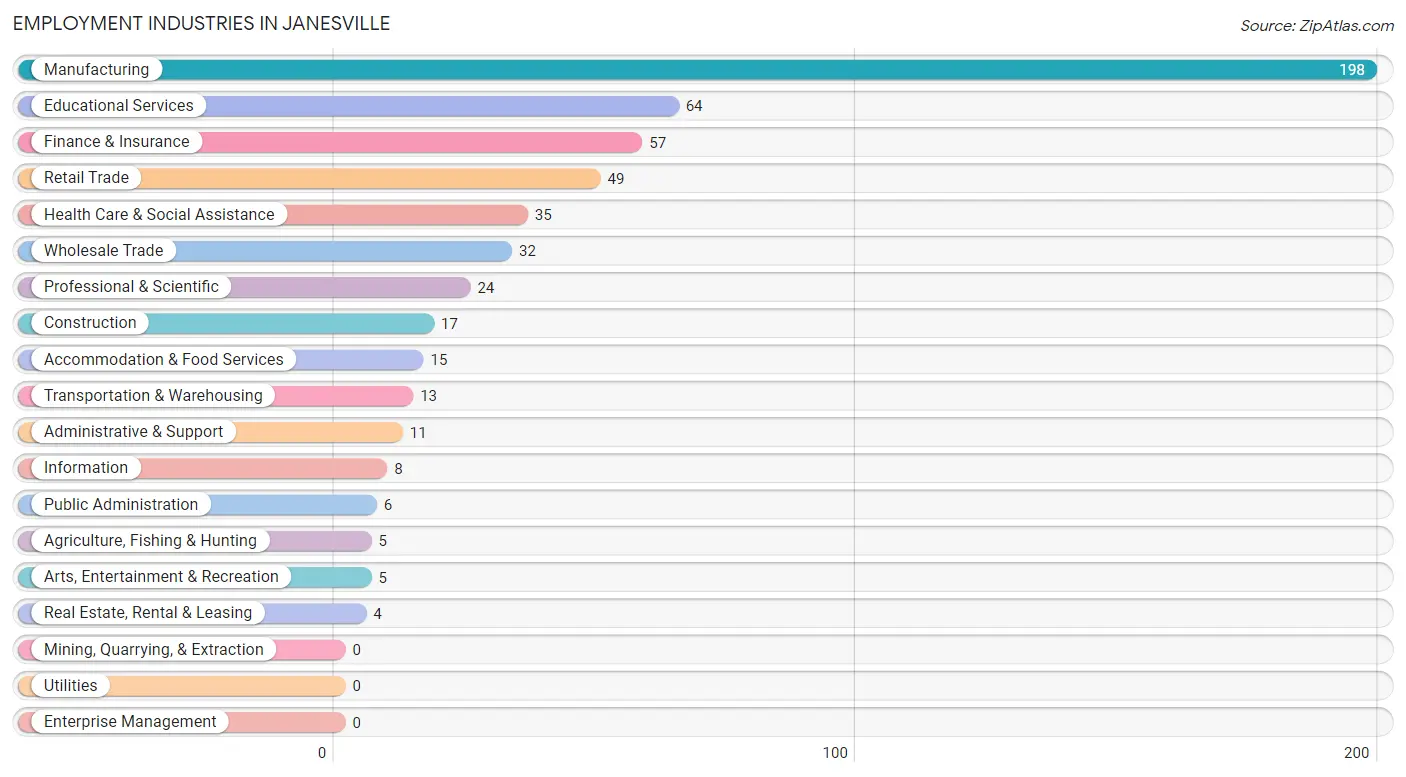
The major employment industries in Janesville include Manufacturing (198 | 34.8%), Educational Services (64 | 11.3%), Finance & Insurance (57 | 10.0%), Retail Trade (49 | 8.6%), and Health Care & Social Assistance (35 | 6.1%).
Employment Industries by Sex in Janesville
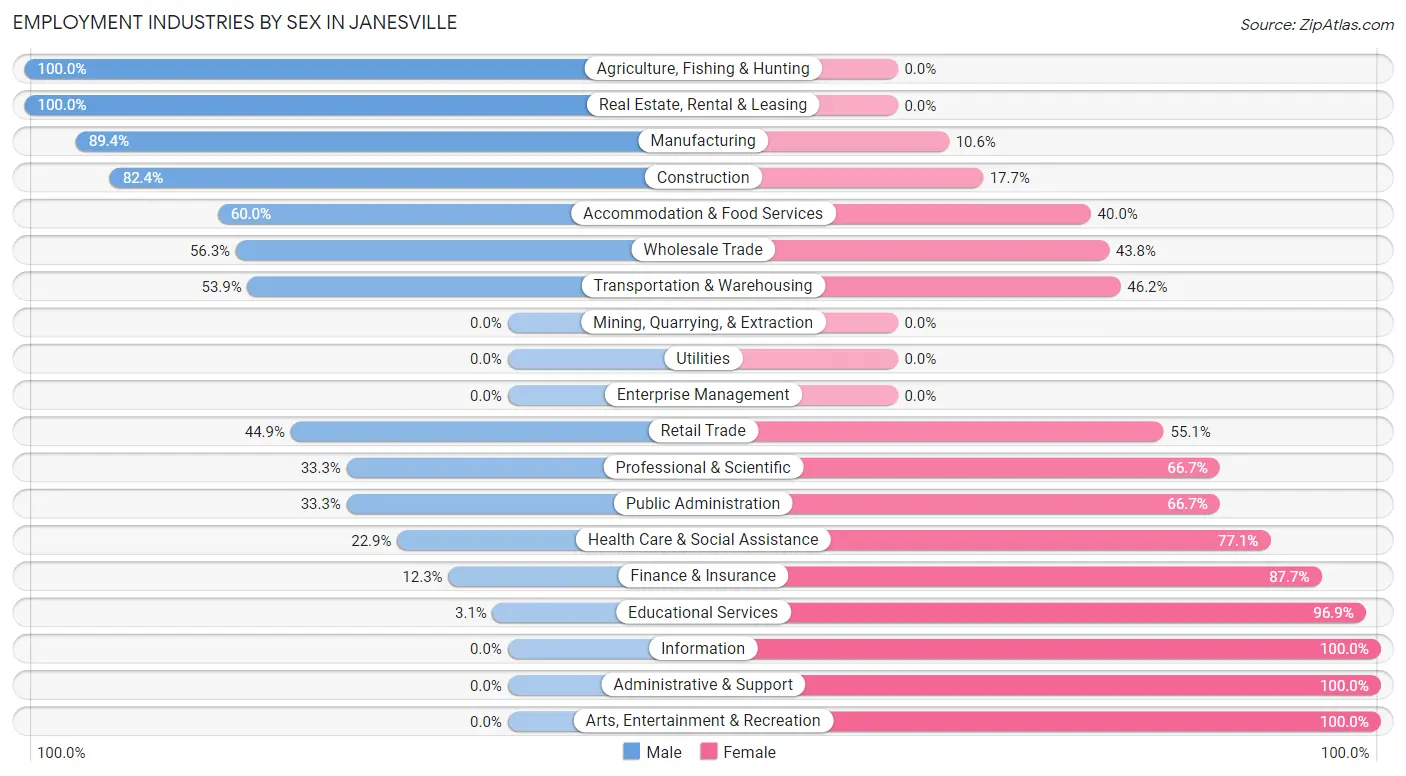
The Janesville industries that see more men than women are Agriculture, Fishing & Hunting (100.0%), Real Estate, Rental & Leasing (100.0%), and Manufacturing (89.4%), whereas the industries that tend to have a higher number of women are Information (100.0%), Administrative & Support (100.0%), and Arts, Entertainment & Recreation (100.0%).
| Industry | Male | Female |
| Agriculture, Fishing & Hunting | 5 (100.0%) | 0 (0.0%) |
| Mining, Quarrying, & Extraction | 0 (0.0%) | 0 (0.0%) |
| Construction | 14 (82.4%) | 3 (17.6%) |
| Manufacturing | 177 (89.4%) | 21 (10.6%) |
| Wholesale Trade | 18 (56.2%) | 14 (43.8%) |
| Retail Trade | 22 (44.9%) | 27 (55.1%) |
| Transportation & Warehousing | 7 (53.8%) | 6 (46.2%) |
| Utilities | 0 (0.0%) | 0 (0.0%) |
| Information | 0 (0.0%) | 8 (100.0%) |
| Finance & Insurance | 7 (12.3%) | 50 (87.7%) |
| Real Estate, Rental & Leasing | 4 (100.0%) | 0 (0.0%) |
| Professional & Scientific | 8 (33.3%) | 16 (66.7%) |
| Enterprise Management | 0 (0.0%) | 0 (0.0%) |
| Administrative & Support | 0 (0.0%) | 11 (100.0%) |
| Educational Services | 2 (3.1%) | 62 (96.9%) |
| Health Care & Social Assistance | 8 (22.9%) | 27 (77.1%) |
| Arts, Entertainment & Recreation | 0 (0.0%) | 5 (100.0%) |
| Accommodation & Food Services | 9 (60.0%) | 6 (40.0%) |
| Public Administration | 2 (33.3%) | 4 (66.7%) |
| Total | 299 (52.5%) | 270 (47.4%) |
Education in Janesville
School Enrollment in Janesville
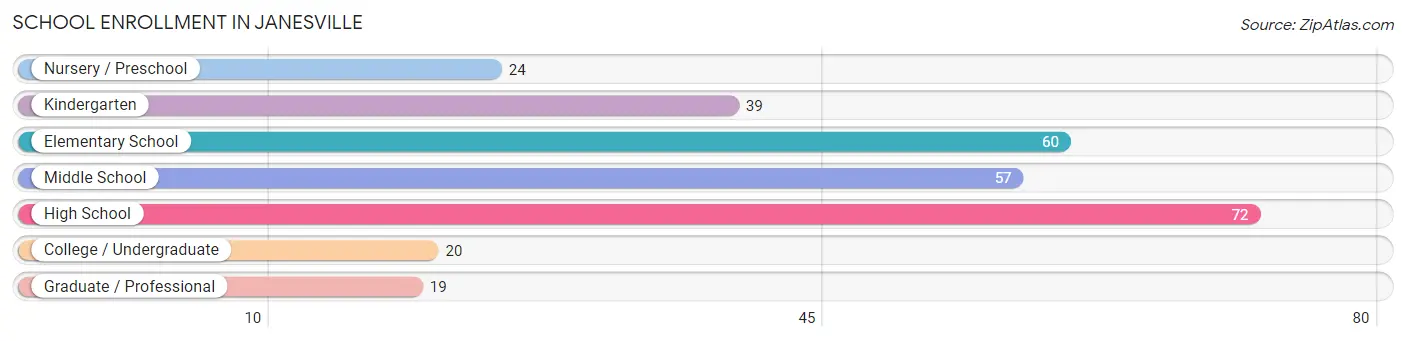
The most common levels of schooling among the 291 students in Janesville are high school (72 | 24.7%), elementary school (60 | 20.6%), and middle school (57 | 19.6%).
| School Level | # Students | % Students |
| Nursery / Preschool | 24 | 8.3% |
| Kindergarten | 39 | 13.4% |
| Elementary School | 60 | 20.6% |
| Middle School | 57 | 19.6% |
| High School | 72 | 24.7% |
| College / Undergraduate | 20 | 6.9% |
| Graduate / Professional | 19 | 6.5% |
| Total | 291 | 100.0% |
School Enrollment by Age by Funding Source in Janesville
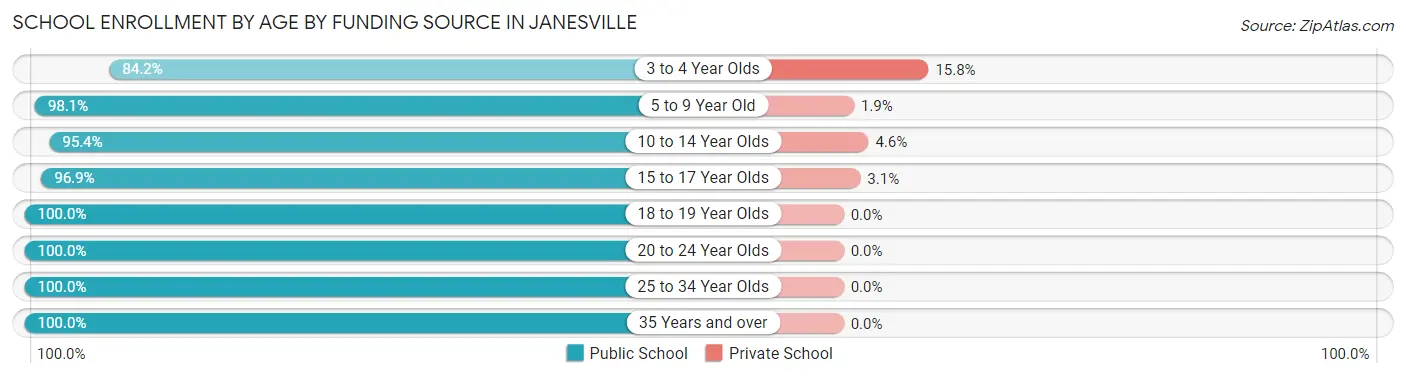
Out of a total of 291 students who are enrolled in schools in Janesville, 10 (3.4%) attend a private institution, while the remaining 281 (96.6%) are enrolled in public schools. The age group of 3 to 4 year olds has the highest likelihood of being enrolled in private schools, with 3 (15.8% in the age bracket) enrolled. Conversely, the age group of 18 to 19 year olds has the lowest likelihood of being enrolled in a private school, with 1 (100.0% in the age bracket) attending a public institution.
| Age Bracket | Public School | Private School |
| 3 to 4 Year Olds | 16 (84.2%) | 3 (15.8%) |
| 5 to 9 Year Old | 102 (98.1%) | 2 (1.9%) |
| 10 to 14 Year Olds | 62 (95.4%) | 3 (4.6%) |
| 15 to 17 Year Olds | 62 (96.9%) | 2 (3.1%) |
| 18 to 19 Year Olds | 1 (100.0%) | 0 (0.0%) |
| 20 to 24 Year Olds | 8 (100.0%) | 0 (0.0%) |
| 25 to 34 Year Olds | 15 (100.0%) | 0 (0.0%) |
| 35 Years and over | 15 (100.0%) | 0 (0.0%) |
| Total | 281 (96.6%) | 10 (3.4%) |
Educational Attainment by Field of Study in Janesville
Business (44 | 21.8%), education (35 | 17.3%), engineering (27 | 13.4%), science & technology (16 | 7.9%), and liberal arts & history (15 | 7.4%) are the most common fields of study among 202 individuals in Janesville who have obtained a bachelor's degree or higher.
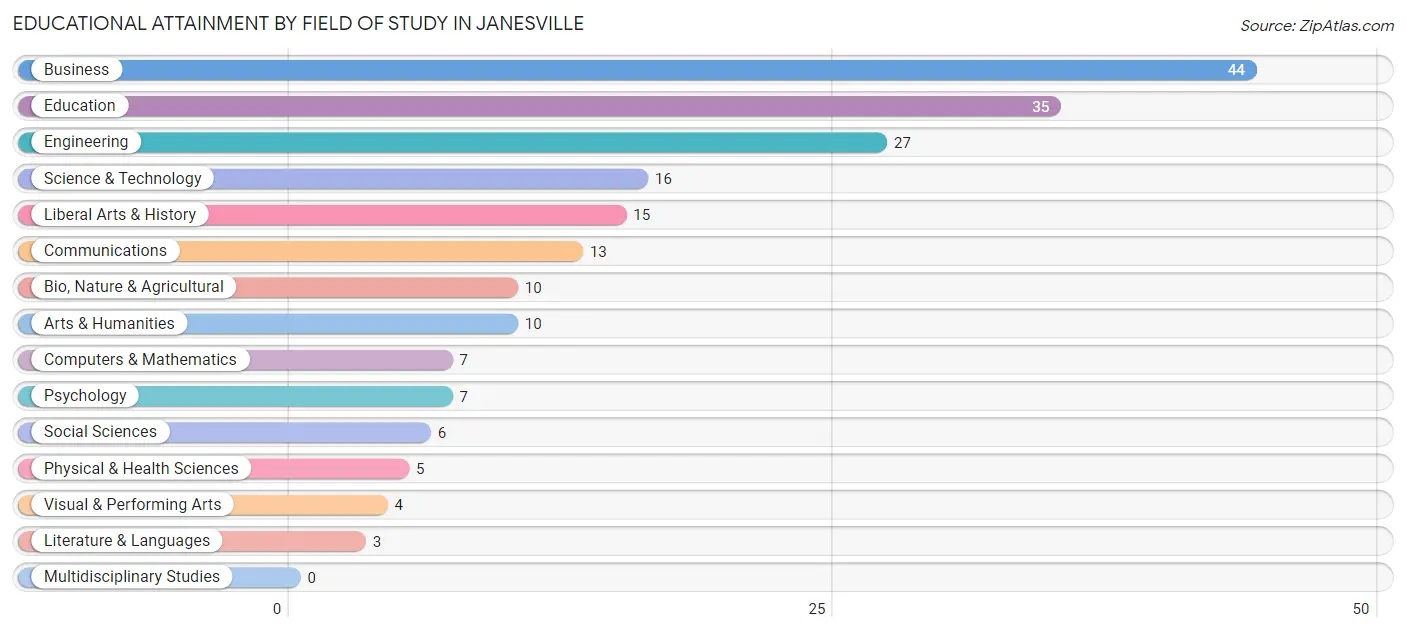
| Field of Study | # Graduates | % Graduates |
| Computers & Mathematics | 7 | 3.5% |
| Bio, Nature & Agricultural | 10 | 5.0% |
| Physical & Health Sciences | 5 | 2.5% |
| Psychology | 7 | 3.5% |
| Social Sciences | 6 | 3.0% |
| Engineering | 27 | 13.4% |
| Multidisciplinary Studies | 0 | 0.0% |
| Science & Technology | 16 | 7.9% |
| Business | 44 | 21.8% |
| Education | 35 | 17.3% |
| Literature & Languages | 3 | 1.5% |
| Liberal Arts & History | 15 | 7.4% |
| Visual & Performing Arts | 4 | 2.0% |
| Communications | 13 | 6.4% |
| Arts & Humanities | 10 | 5.0% |
| Total | 202 | 100.0% |
Transportation & Commute in Janesville
Vehicle Availability by Sex in Janesville
The most prevalent vehicle ownership categories in Janesville are males with 2 vehicles (147, accounting for 50.7%) and females with 2 vehicles (128, making up 56.8%).
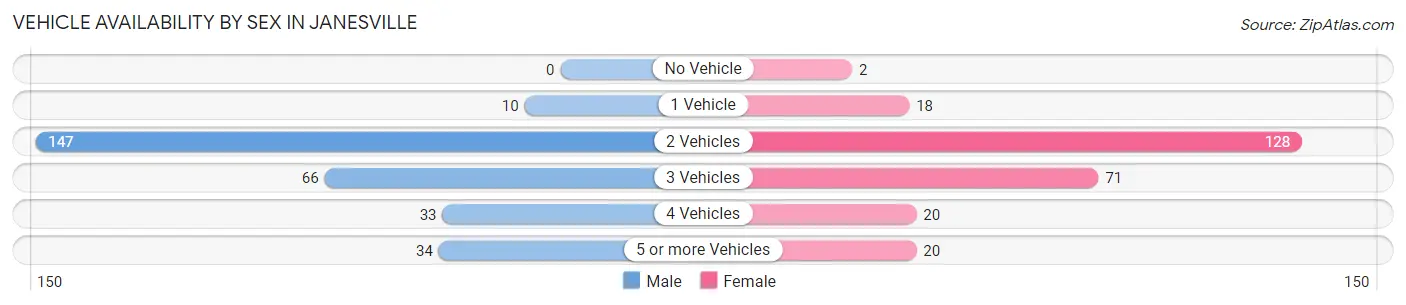
| Vehicles Available | Male | Female |
| No Vehicle | 0 (0.0%) | 2 (0.8%) |
| 1 Vehicle | 10 (3.5%) | 18 (7.0%) |
| 2 Vehicles | 147 (50.7%) | 128 (49.4%) |
| 3 Vehicles | 66 (22.8%) | 71 (27.4%) |
| 4 Vehicles | 33 (11.4%) | 20 (7.7%) |
| 5 or more Vehicles | 34 (11.7%) | 20 (7.7%) |
| Total | 290 (100.0%) | 259 (100.0%) |
Commute Time in Janesville
The most frequently occuring commute durations in Janesville are 15 to 19 minutes (153 commuters, 29.2%), 20 to 24 minutes (106 commuters, 20.3%), and 25 to 29 minutes (66 commuters, 12.6%).
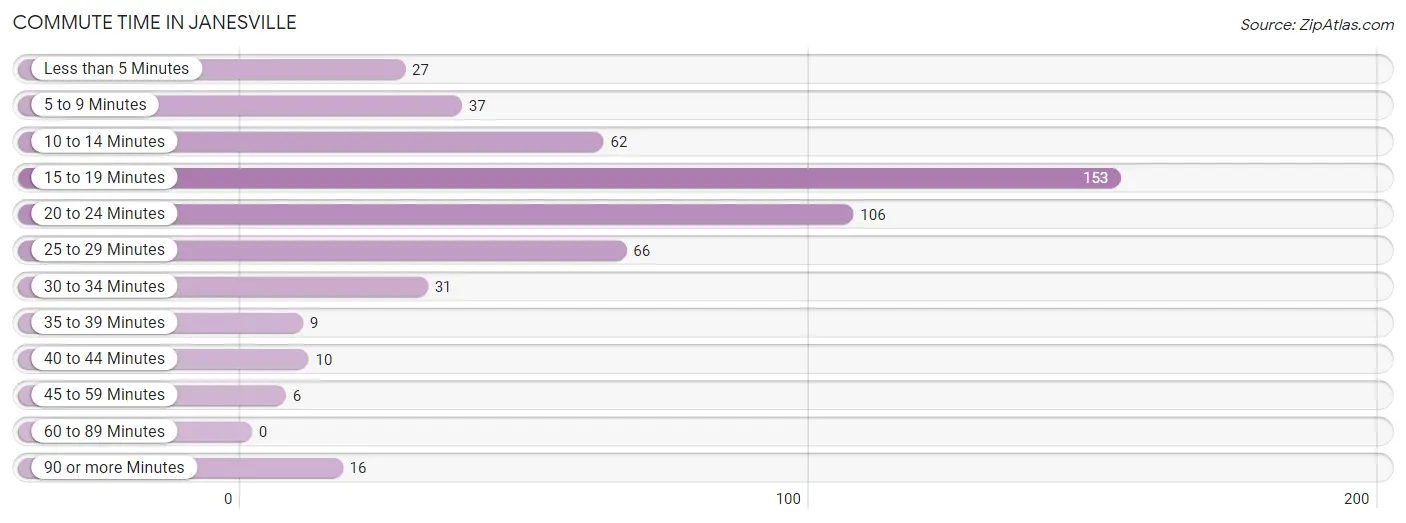
| Commute Time | # Commuters | % Commuters |
| Less than 5 Minutes | 27 | 5.2% |
| 5 to 9 Minutes | 37 | 7.1% |
| 10 to 14 Minutes | 62 | 11.8% |
| 15 to 19 Minutes | 153 | 29.2% |
| 20 to 24 Minutes | 106 | 20.3% |
| 25 to 29 Minutes | 66 | 12.6% |
| 30 to 34 Minutes | 31 | 5.9% |
| 35 to 39 Minutes | 9 | 1.7% |
| 40 to 44 Minutes | 10 | 1.9% |
| 45 to 59 Minutes | 6 | 1.1% |
| 60 to 89 Minutes | 0 | 0.0% |
| 90 or more Minutes | 16 | 3.1% |
Commute Time by Sex in Janesville
The most common commute times in Janesville are 20 to 24 minutes (75 commuters, 26.6%) for males and 15 to 19 minutes (83 commuters, 34.4%) for females.
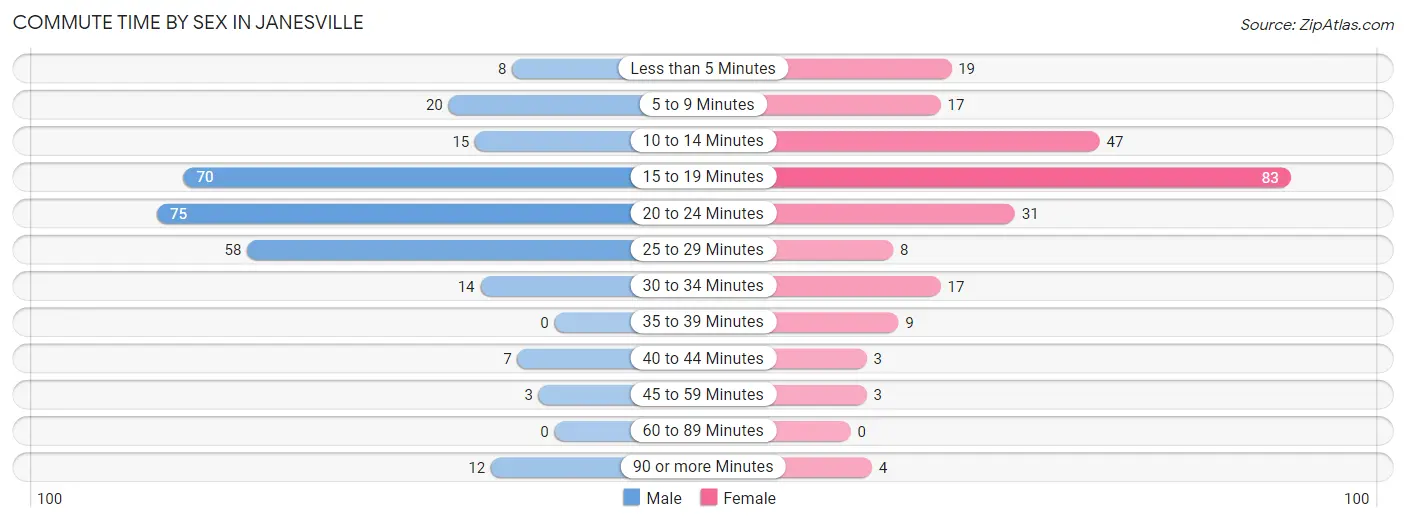
| Commute Time | Male | Female |
| Less than 5 Minutes | 8 (2.8%) | 19 (7.9%) |
| 5 to 9 Minutes | 20 (7.1%) | 17 (7.0%) |
| 10 to 14 Minutes | 15 (5.3%) | 47 (19.5%) |
| 15 to 19 Minutes | 70 (24.8%) | 83 (34.4%) |
| 20 to 24 Minutes | 75 (26.6%) | 31 (12.9%) |
| 25 to 29 Minutes | 58 (20.6%) | 8 (3.3%) |
| 30 to 34 Minutes | 14 (5.0%) | 17 (7.0%) |
| 35 to 39 Minutes | 0 (0.0%) | 9 (3.7%) |
| 40 to 44 Minutes | 7 (2.5%) | 3 (1.2%) |
| 45 to 59 Minutes | 3 (1.1%) | 3 (1.2%) |
| 60 to 89 Minutes | 0 (0.0%) | 0 (0.0%) |
| 90 or more Minutes | 12 (4.3%) | 4 (1.7%) |
Time of Departure to Work by Sex in Janesville
The most frequent times of departure to work in Janesville are 5:30 AM to 5:59 AM (77, 27.3%) for males and 7:30 AM to 7:59 AM (82, 34.0%) for females.
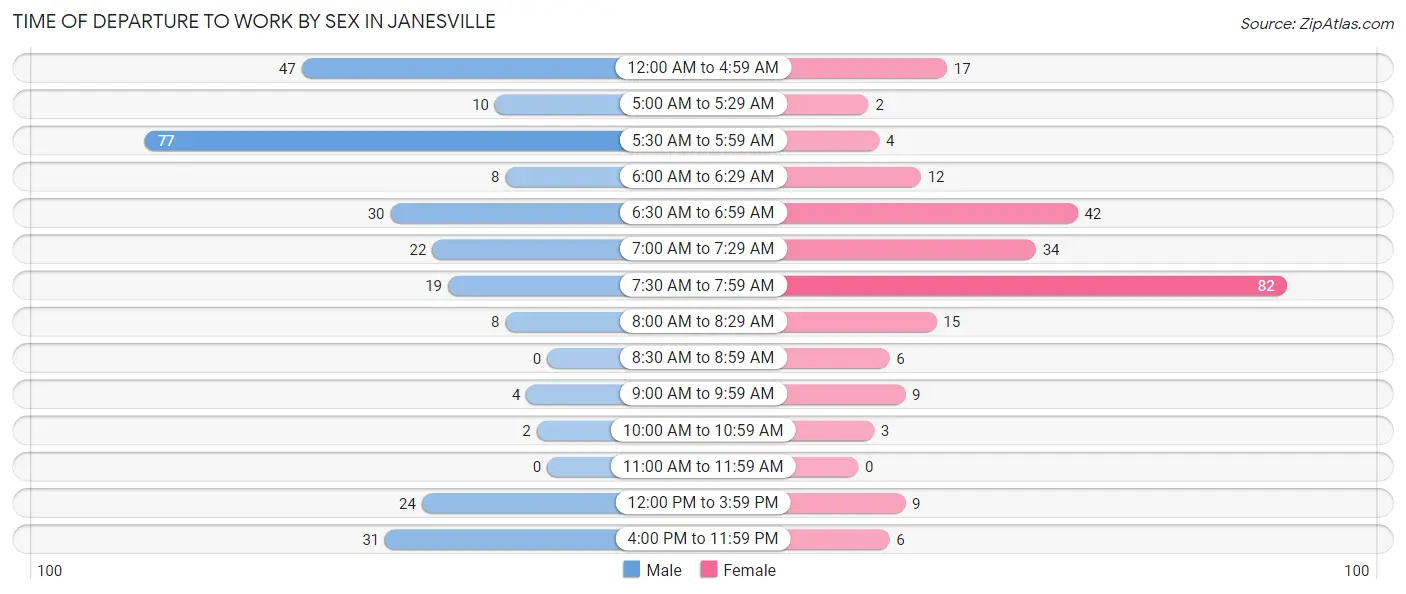
| Time of Departure | Male | Female |
| 12:00 AM to 4:59 AM | 47 (16.7%) | 17 (7.0%) |
| 5:00 AM to 5:29 AM | 10 (3.5%) | 2 (0.8%) |
| 5:30 AM to 5:59 AM | 77 (27.3%) | 4 (1.7%) |
| 6:00 AM to 6:29 AM | 8 (2.8%) | 12 (5.0%) |
| 6:30 AM to 6:59 AM | 30 (10.6%) | 42 (17.4%) |
| 7:00 AM to 7:29 AM | 22 (7.8%) | 34 (14.1%) |
| 7:30 AM to 7:59 AM | 19 (6.7%) | 82 (34.0%) |
| 8:00 AM to 8:29 AM | 8 (2.8%) | 15 (6.2%) |
| 8:30 AM to 8:59 AM | 0 (0.0%) | 6 (2.5%) |
| 9:00 AM to 9:59 AM | 4 (1.4%) | 9 (3.7%) |
| 10:00 AM to 10:59 AM | 2 (0.7%) | 3 (1.2%) |
| 11:00 AM to 11:59 AM | 0 (0.0%) | 0 (0.0%) |
| 12:00 PM to 3:59 PM | 24 (8.5%) | 9 (3.7%) |
| 4:00 PM to 11:59 PM | 31 (11.0%) | 6 (2.5%) |
| Total | 282 (100.0%) | 241 (100.0%) |
Housing Occupancy in Janesville
Occupancy by Ownership in Janesville
Of the total 403 dwellings in Janesville, owner-occupied units account for 369 (91.6%), while renter-occupied units make up 34 (8.4%).
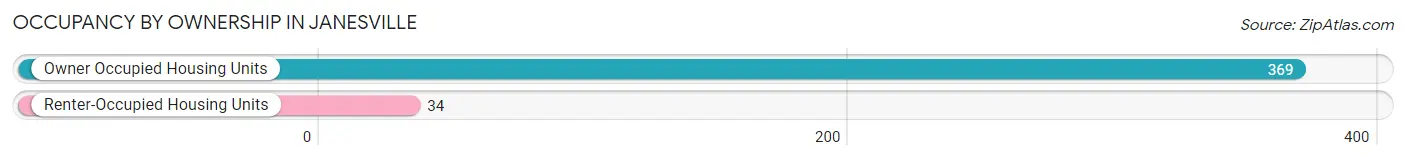
| Occupancy | # Housing Units | % Housing Units |
| Owner Occupied Housing Units | 369 | 91.6% |
| Renter-Occupied Housing Units | 34 | 8.4% |
| Total Occupied Housing Units | 403 | 100.0% |
Occupancy by Household Size in Janesville
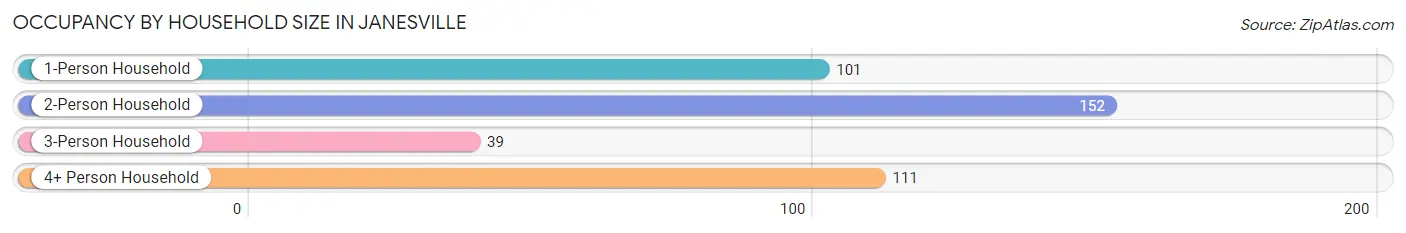
| Household Size | # Housing Units | % Housing Units |
| 1-Person Household | 101 | 25.1% |
| 2-Person Household | 152 | 37.7% |
| 3-Person Household | 39 | 9.7% |
| 4+ Person Household | 111 | 27.5% |
| Total Housing Units | 403 | 100.0% |
Occupancy by Ownership by Household Size in Janesville
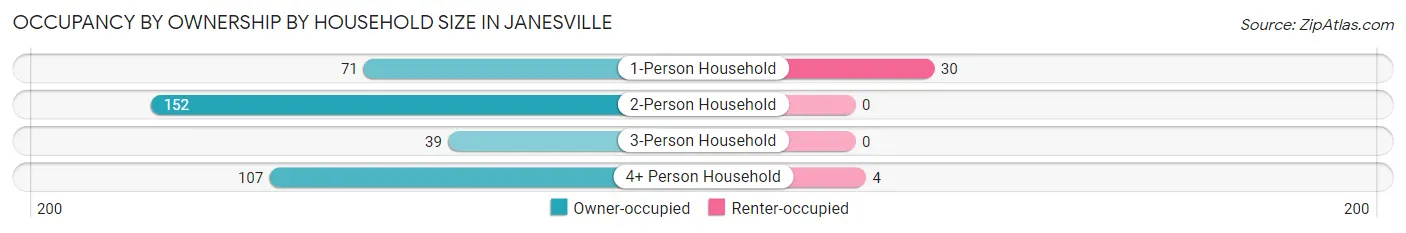
| Household Size | Owner-occupied | Renter-occupied |
| 1-Person Household | 71 (70.3%) | 30 (29.7%) |
| 2-Person Household | 152 (100.0%) | 0 (0.0%) |
| 3-Person Household | 39 (100.0%) | 0 (0.0%) |
| 4+ Person Household | 107 (96.4%) | 4 (3.6%) |
| Total Housing Units | 369 (91.6%) | 34 (8.4%) |
Occupancy by Educational Attainment in Janesville
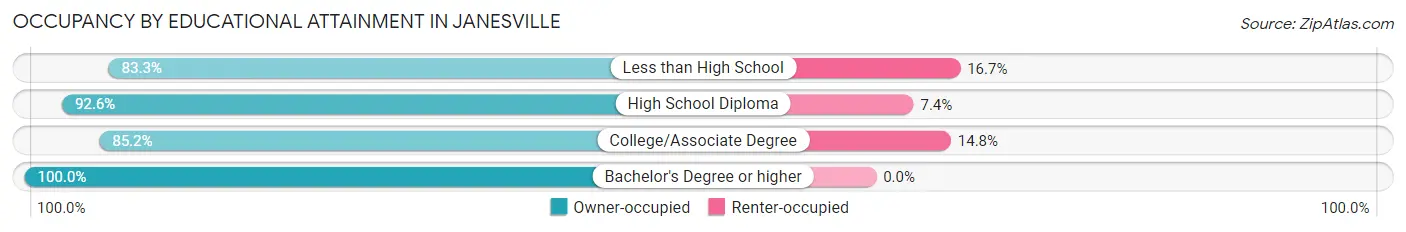
| Household Size | Owner-occupied | Renter-occupied |
| Less than High School | 10 (83.3%) | 2 (16.7%) |
| High School Diploma | 100 (92.6%) | 8 (7.4%) |
| College/Associate Degree | 138 (85.2%) | 24 (14.8%) |
| Bachelor's Degree or higher | 121 (100.0%) | 0 (0.0%) |
Occupancy by Age of Householder in Janesville
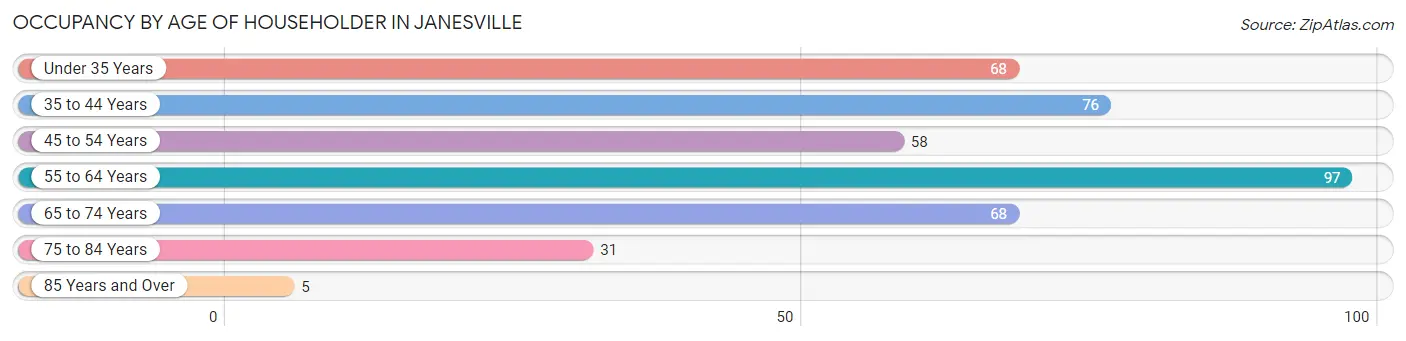
| Age Bracket | # Households | % Households |
| Under 35 Years | 68 | 16.9% |
| 35 to 44 Years | 76 | 18.9% |
| 45 to 54 Years | 58 | 14.4% |
| 55 to 64 Years | 97 | 24.1% |
| 65 to 74 Years | 68 | 16.9% |
| 75 to 84 Years | 31 | 7.7% |
| 85 Years and Over | 5 | 1.2% |
| Total | 403 | 100.0% |
Housing Finances in Janesville
Median Income by Occupancy in Janesville
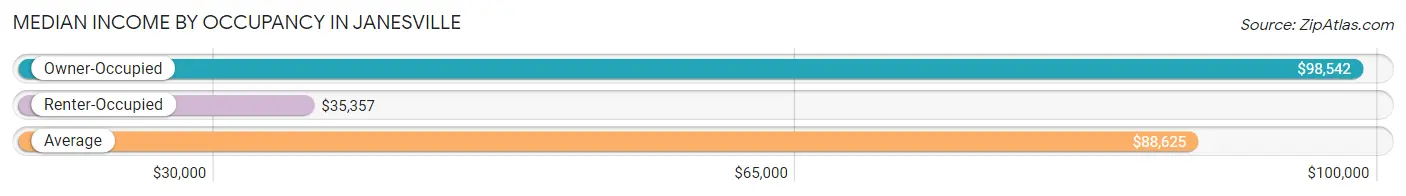
| Occupancy Type | # Households | Median Income |
| Owner-Occupied | 369 (91.6%) | $98,542 |
| Renter-Occupied | 34 (8.4%) | $35,357 |
| Average | 403 (100.0%) | $88,625 |
Occupancy by Householder Income Bracket in Janesville
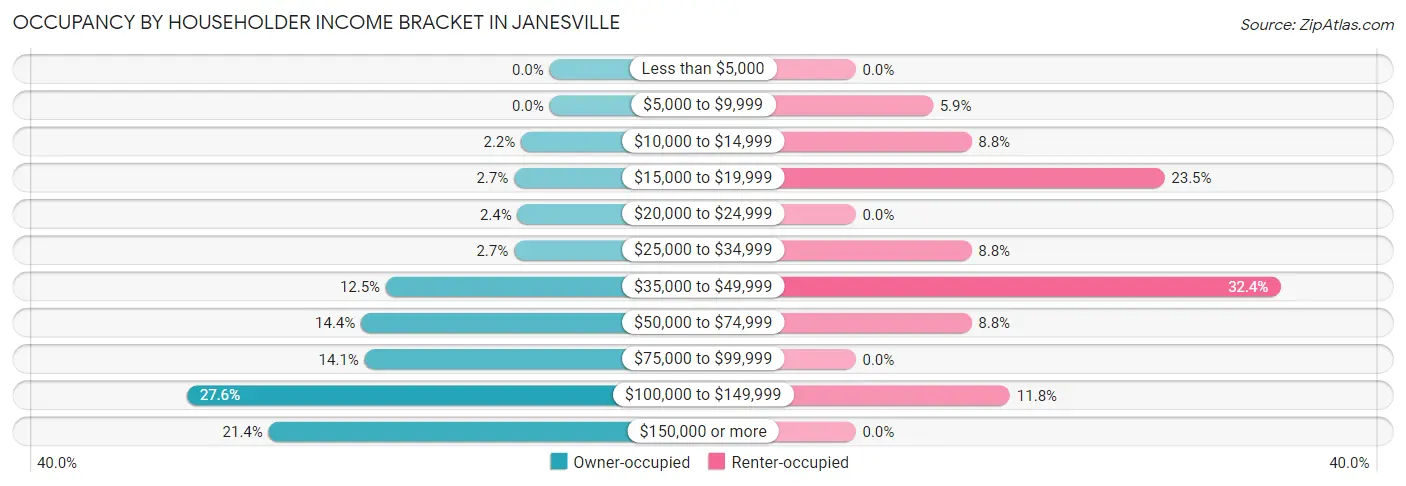
| Income Bracket | Owner-occupied | Renter-occupied |
| Less than $5,000 | 0 (0.0%) | 0 (0.0%) |
| $5,000 to $9,999 | 0 (0.0%) | 2 (5.9%) |
| $10,000 to $14,999 | 8 (2.2%) | 3 (8.8%) |
| $15,000 to $19,999 | 10 (2.7%) | 8 (23.5%) |
| $20,000 to $24,999 | 9 (2.4%) | 0 (0.0%) |
| $25,000 to $34,999 | 10 (2.7%) | 3 (8.8%) |
| $35,000 to $49,999 | 46 (12.5%) | 11 (32.4%) |
| $50,000 to $74,999 | 53 (14.4%) | 3 (8.8%) |
| $75,000 to $99,999 | 52 (14.1%) | 0 (0.0%) |
| $100,000 to $149,999 | 102 (27.6%) | 4 (11.8%) |
| $150,000 or more | 79 (21.4%) | 0 (0.0%) |
| Total | 369 (100.0%) | 34 (100.0%) |
Monthly Housing Cost Tiers in Janesville
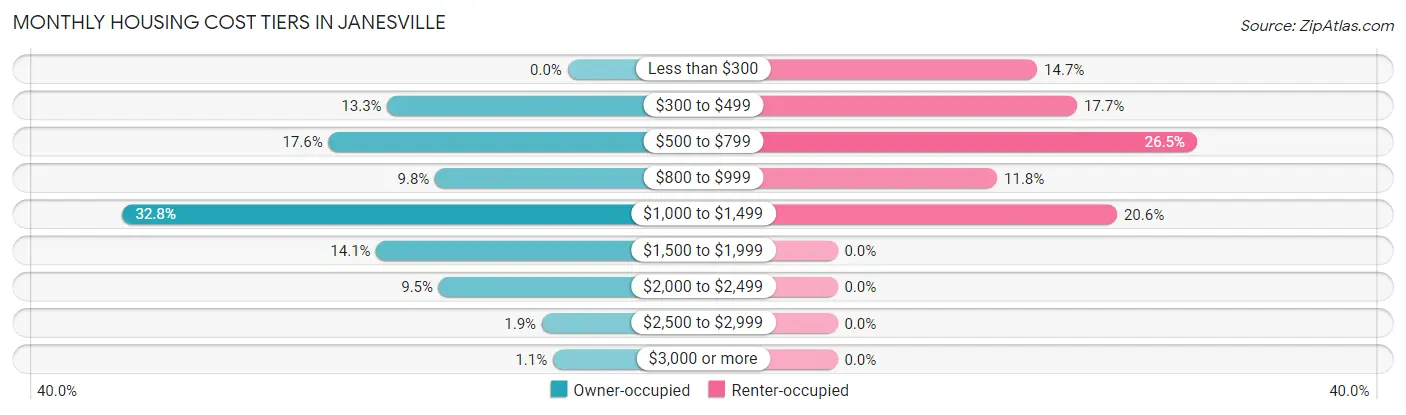
| Monthly Cost | Owner-occupied | Renter-occupied |
| Less than $300 | 0 (0.0%) | 5 (14.7%) |
| $300 to $499 | 49 (13.3%) | 6 (17.6%) |
| $500 to $799 | 65 (17.6%) | 9 (26.5%) |
| $800 to $999 | 36 (9.8%) | 4 (11.8%) |
| $1,000 to $1,499 | 121 (32.8%) | 7 (20.6%) |
| $1,500 to $1,999 | 52 (14.1%) | 0 (0.0%) |
| $2,000 to $2,499 | 35 (9.5%) | 0 (0.0%) |
| $2,500 to $2,999 | 7 (1.9%) | 0 (0.0%) |
| $3,000 or more | 4 (1.1%) | 0 (0.0%) |
| Total | 369 (100.0%) | 34 (100.0%) |
Physical Housing Characteristics in Janesville
Housing Structures in Janesville
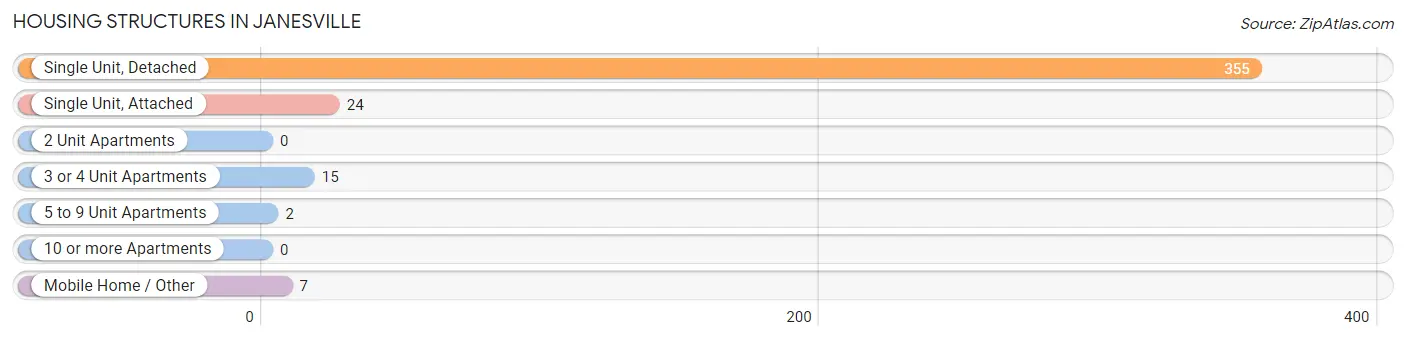
| Structure Type | # Housing Units | % Housing Units |
| Single Unit, Detached | 355 | 88.1% |
| Single Unit, Attached | 24 | 6.0% |
| 2 Unit Apartments | 0 | 0.0% |
| 3 or 4 Unit Apartments | 15 | 3.7% |
| 5 to 9 Unit Apartments | 2 | 0.5% |
| 10 or more Apartments | 0 | 0.0% |
| Mobile Home / Other | 7 | 1.7% |
| Total | 403 | 100.0% |
Housing Structures by Occupancy in Janesville
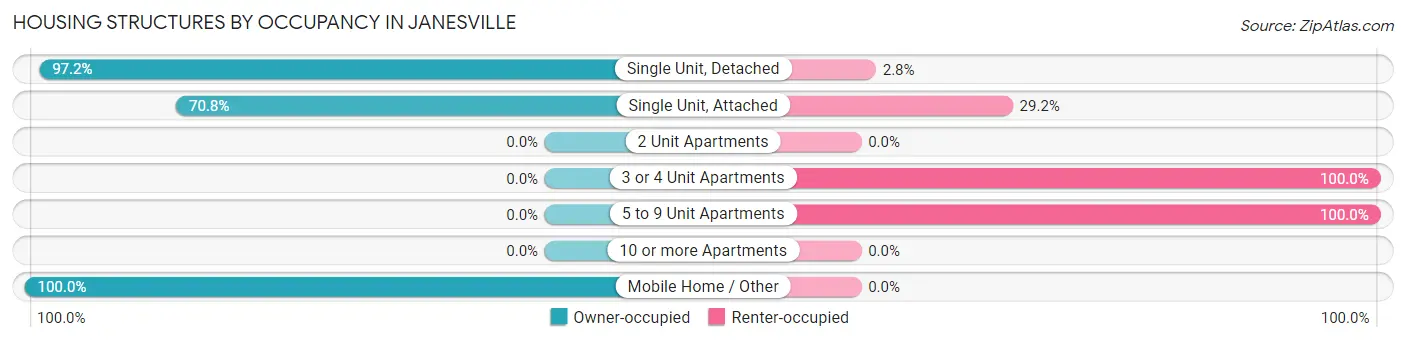
| Structure Type | Owner-occupied | Renter-occupied |
| Single Unit, Detached | 345 (97.2%) | 10 (2.8%) |
| Single Unit, Attached | 17 (70.8%) | 7 (29.2%) |
| 2 Unit Apartments | 0 (0.0%) | 0 (0.0%) |
| 3 or 4 Unit Apartments | 0 (0.0%) | 15 (100.0%) |
| 5 to 9 Unit Apartments | 0 (0.0%) | 2 (100.0%) |
| 10 or more Apartments | 0 (0.0%) | 0 (0.0%) |
| Mobile Home / Other | 7 (100.0%) | 0 (0.0%) |
| Total | 369 (91.6%) | 34 (8.4%) |
Housing Structures by Number of Rooms in Janesville
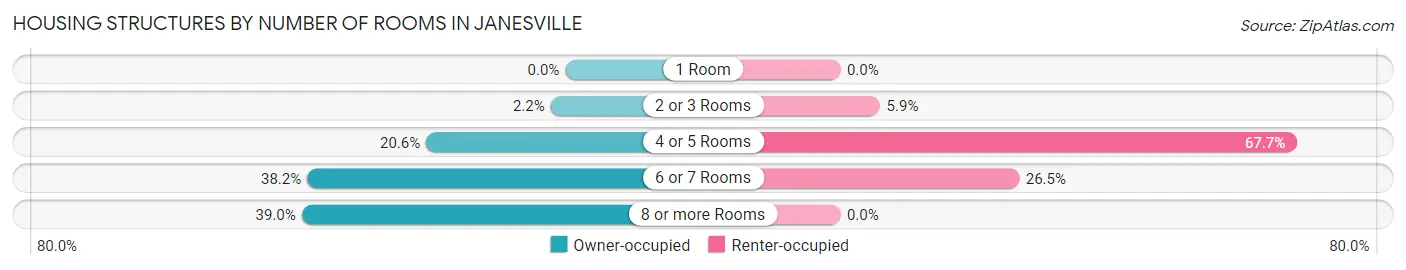
| Number of Rooms | Owner-occupied | Renter-occupied |
| 1 Room | 0 (0.0%) | 0 (0.0%) |
| 2 or 3 Rooms | 8 (2.2%) | 2 (5.9%) |
| 4 or 5 Rooms | 76 (20.6%) | 23 (67.6%) |
| 6 or 7 Rooms | 141 (38.2%) | 9 (26.5%) |
| 8 or more Rooms | 144 (39.0%) | 0 (0.0%) |
| Total | 369 (100.0%) | 34 (100.0%) |
Housing Structure by Heating Type in Janesville
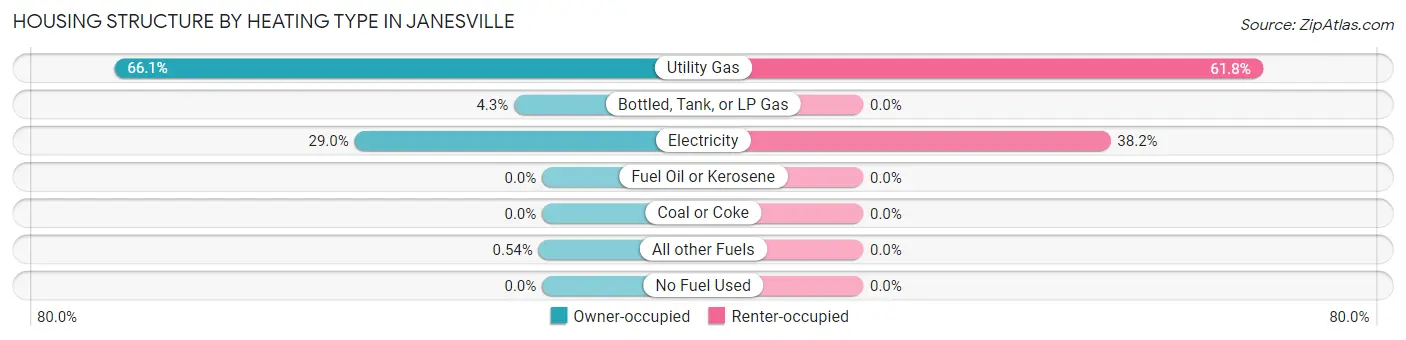
| Heating Type | Owner-occupied | Renter-occupied |
| Utility Gas | 244 (66.1%) | 21 (61.8%) |
| Bottled, Tank, or LP Gas | 16 (4.3%) | 0 (0.0%) |
| Electricity | 107 (29.0%) | 13 (38.2%) |
| Fuel Oil or Kerosene | 0 (0.0%) | 0 (0.0%) |
| Coal or Coke | 0 (0.0%) | 0 (0.0%) |
| All other Fuels | 2 (0.5%) | 0 (0.0%) |
| No Fuel Used | 0 (0.0%) | 0 (0.0%) |
| Total | 369 (100.0%) | 34 (100.0%) |
Household Vehicle Usage in Janesville
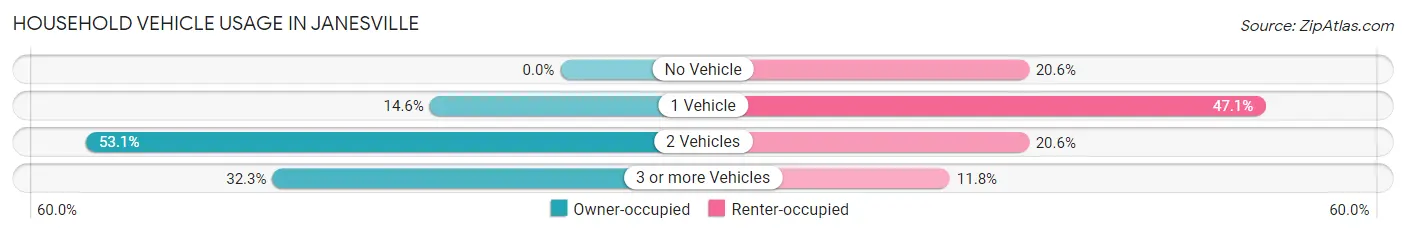
| Vehicles per Household | Owner-occupied | Renter-occupied |
| No Vehicle | 0 (0.0%) | 7 (20.6%) |
| 1 Vehicle | 54 (14.6%) | 16 (47.1%) |
| 2 Vehicles | 196 (53.1%) | 7 (20.6%) |
| 3 or more Vehicles | 119 (32.3%) | 4 (11.8%) |
| Total | 369 (100.0%) | 34 (100.0%) |
Real Estate & Mortgages in Janesville
Real Estate and Mortgage Overview in Janesville
| Characteristic | Without Mortgage | With Mortgage |
| Housing Units | 126 | 243 |
| Median Property Value | $195,800 | $226,700 |
| Median Household Income | $62,955 | $66 |
| Monthly Housing Costs | $595 | $4 |
| Real Estate Taxes | $2,788 | $3 |
Property Value by Mortgage Status in Janesville
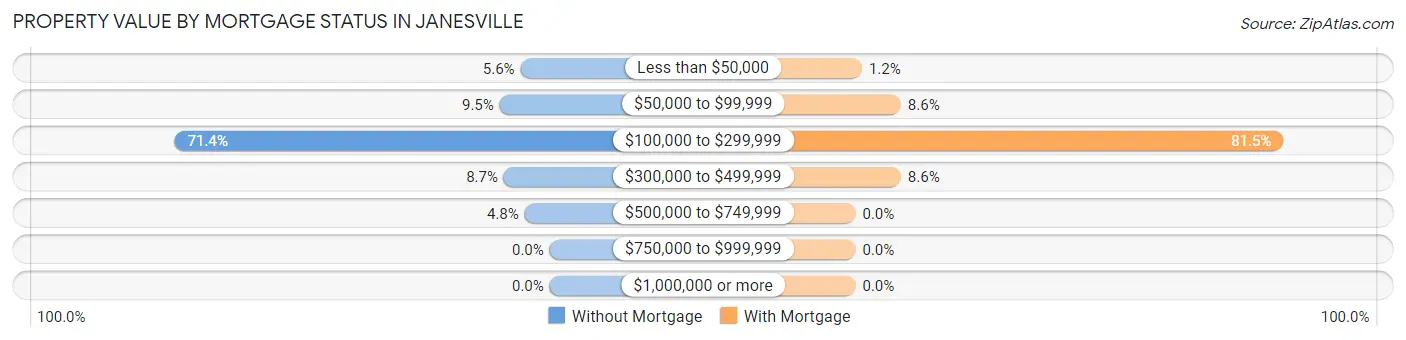
| Property Value | Without Mortgage | With Mortgage |
| Less than $50,000 | 7 (5.6%) | 3 (1.2%) |
| $50,000 to $99,999 | 12 (9.5%) | 21 (8.6%) |
| $100,000 to $299,999 | 90 (71.4%) | 198 (81.5%) |
| $300,000 to $499,999 | 11 (8.7%) | 21 (8.6%) |
| $500,000 to $749,999 | 6 (4.8%) | 0 (0.0%) |
| $750,000 to $999,999 | 0 (0.0%) | 0 (0.0%) |
| $1,000,000 or more | 0 (0.0%) | 0 (0.0%) |
| Total | 126 (100.0%) | 243 (100.0%) |
Household Income by Mortgage Status in Janesville
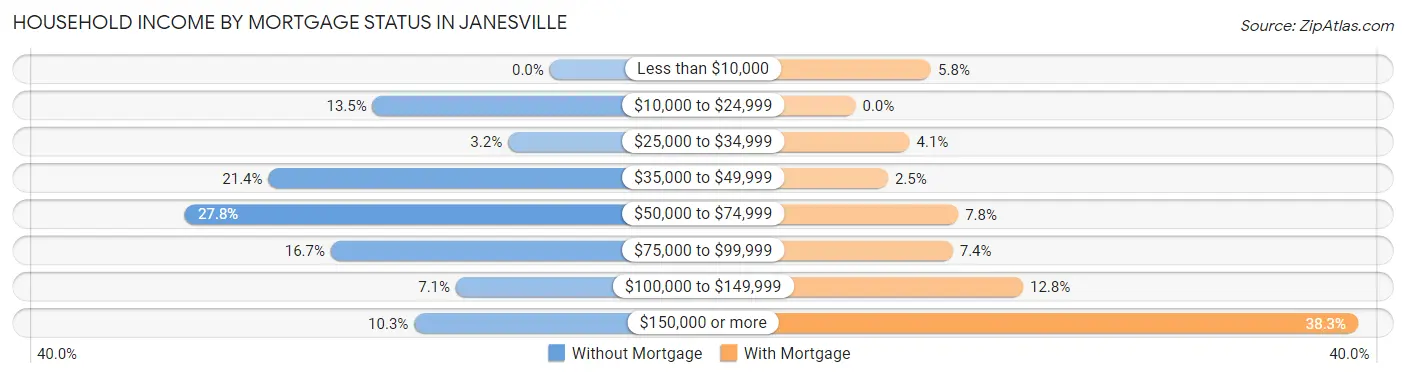
| Household Income | Without Mortgage | With Mortgage |
| Less than $10,000 | 0 (0.0%) | 14 (5.8%) |
| $10,000 to $24,999 | 17 (13.5%) | 0 (0.0%) |
| $25,000 to $34,999 | 4 (3.2%) | 10 (4.1%) |
| $35,000 to $49,999 | 27 (21.4%) | 6 (2.5%) |
| $50,000 to $74,999 | 35 (27.8%) | 19 (7.8%) |
| $75,000 to $99,999 | 21 (16.7%) | 18 (7.4%) |
| $100,000 to $149,999 | 9 (7.1%) | 31 (12.8%) |
| $150,000 or more | 13 (10.3%) | 93 (38.3%) |
| Total | 126 (100.0%) | 243 (100.0%) |
Property Value to Household Income Ratio in Janesville
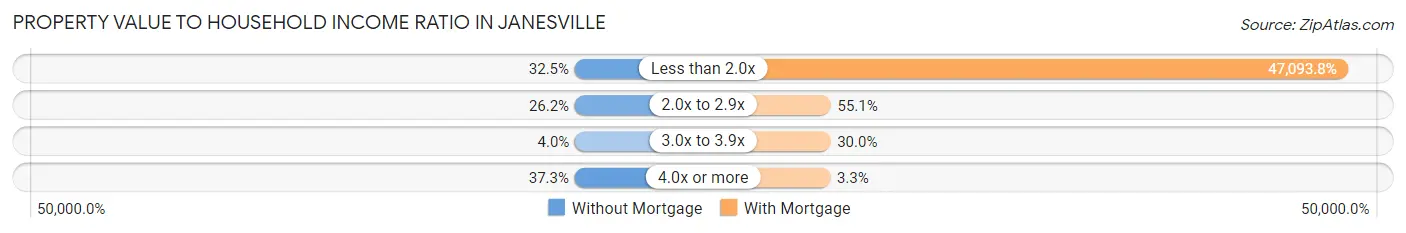
| Value-to-Income Ratio | Without Mortgage | With Mortgage |
| Less than 2.0x | 41 (32.5%) | 114,438 (47,093.8%) |
| 2.0x to 2.9x | 33 (26.2%) | 134 (55.1%) |
| 3.0x to 3.9x | 5 (4.0%) | 73 (30.0%) |
| 4.0x or more | 47 (37.3%) | 8 (3.3%) |
| Total | 126 (100.0%) | 243 (100.0%) |
Real Estate Taxes by Mortgage Status in Janesville
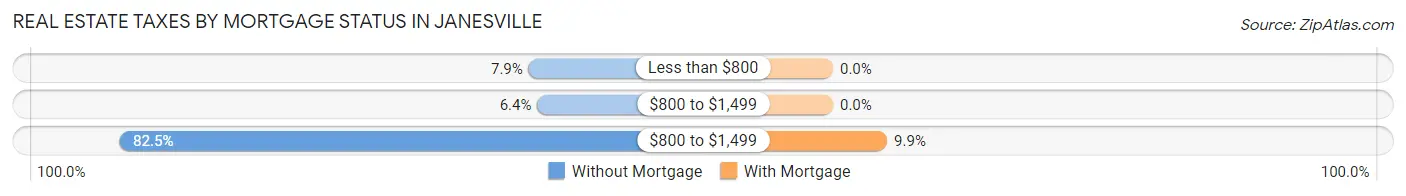
| Property Taxes | Without Mortgage | With Mortgage |
| Less than $800 | 10 (7.9%) | 0 (0.0%) |
| $800 to $1,499 | 8 (6.4%) | 0 (0.0%) |
| $800 to $1,499 | 104 (82.5%) | 24 (9.9%) |
| Total | 126 (100.0%) | 243 (100.0%) |
Health & Disability in Janesville
Health Insurance Coverage by Age in Janesville
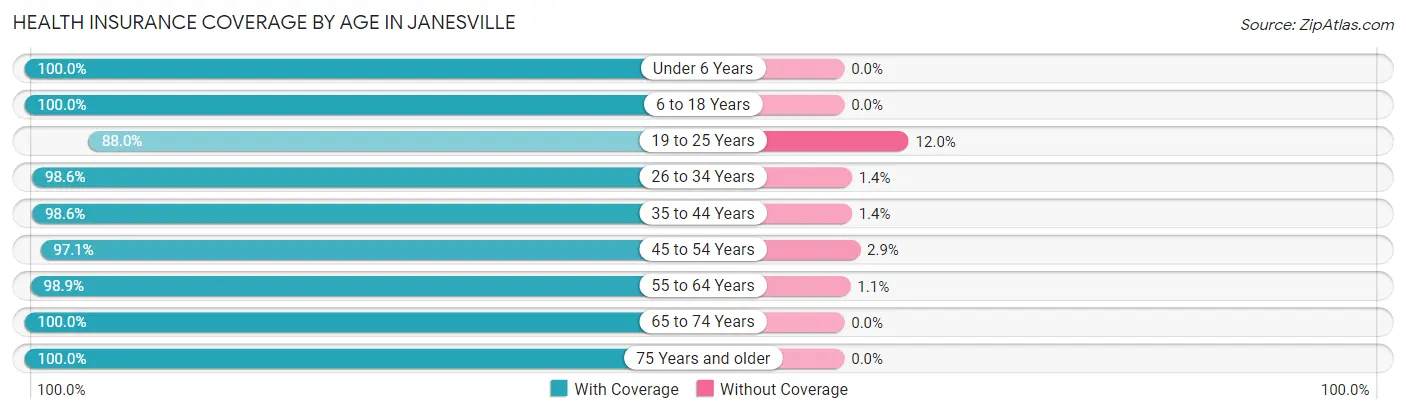
| Age Bracket | With Coverage | Without Coverage |
| Under 6 Years | 108 (100.0%) | 0 (0.0%) |
| 6 to 18 Years | 209 (100.0%) | 0 (0.0%) |
| 19 to 25 Years | 22 (88.0%) | 3 (12.0%) |
| 26 to 34 Years | 141 (98.6%) | 2 (1.4%) |
| 35 to 44 Years | 143 (98.6%) | 2 (1.4%) |
| 45 to 54 Years | 99 (97.1%) | 3 (2.9%) |
| 55 to 64 Years | 174 (98.9%) | 2 (1.1%) |
| 65 to 74 Years | 106 (100.0%) | 0 (0.0%) |
| 75 Years and older | 49 (100.0%) | 0 (0.0%) |
| Total | 1,051 (98.9%) | 12 (1.1%) |
Health Insurance Coverage by Citizenship Status in Janesville

| Citizenship Status | With Coverage | Without Coverage |
| Native Born | 108 (100.0%) | 0 (0.0%) |
| Foreign Born, Citizen | 209 (100.0%) | 0 (0.0%) |
| Foreign Born, not a Citizen | 22 (88.0%) | 3 (12.0%) |
Health Insurance Coverage by Household Income in Janesville
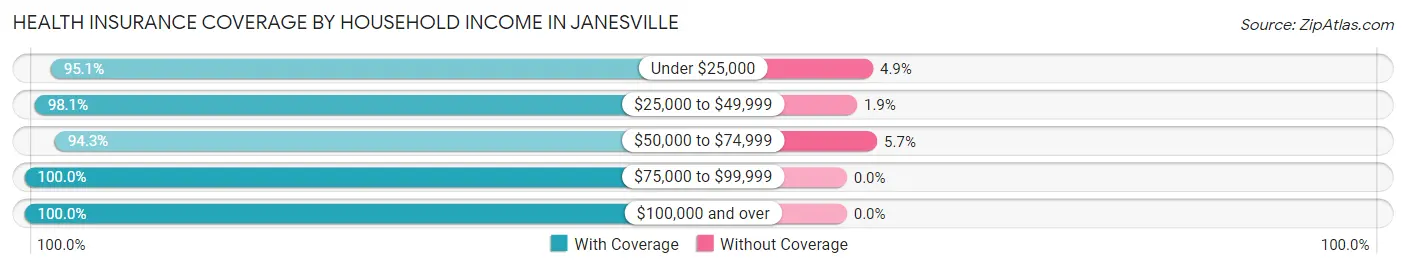
| Household Income | With Coverage | Without Coverage |
| Under $25,000 | 58 (95.1%) | 3 (4.9%) |
| $25,000 to $49,999 | 102 (98.1%) | 2 (1.9%) |
| $50,000 to $74,999 | 116 (94.3%) | 7 (5.7%) |
| $75,000 to $99,999 | 163 (100.0%) | 0 (0.0%) |
| $100,000 and over | 612 (100.0%) | 0 (0.0%) |
Public vs Private Health Insurance Coverage by Age in Janesville
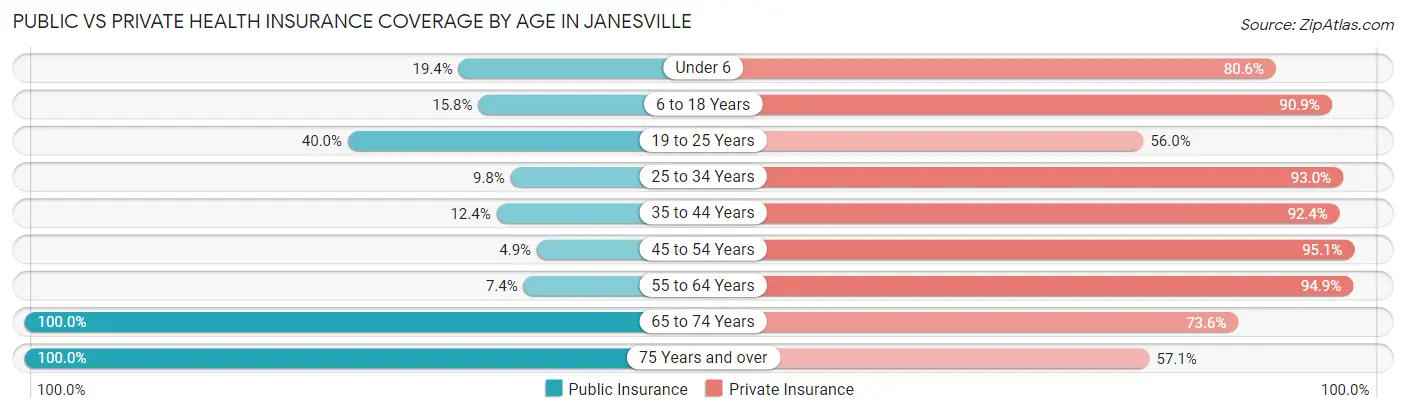
| Age Bracket | Public Insurance | Private Insurance |
| Under 6 | 21 (19.4%) | 87 (80.6%) |
| 6 to 18 Years | 33 (15.8%) | 190 (90.9%) |
| 19 to 25 Years | 10 (40.0%) | 14 (56.0%) |
| 25 to 34 Years | 14 (9.8%) | 133 (93.0%) |
| 35 to 44 Years | 18 (12.4%) | 134 (92.4%) |
| 45 to 54 Years | 5 (4.9%) | 97 (95.1%) |
| 55 to 64 Years | 13 (7.4%) | 167 (94.9%) |
| 65 to 74 Years | 106 (100.0%) | 78 (73.6%) |
| 75 Years and over | 49 (100.0%) | 28 (57.1%) |
| Total | 269 (25.3%) | 928 (87.3%) |
Disability Status by Sex by Age in Janesville
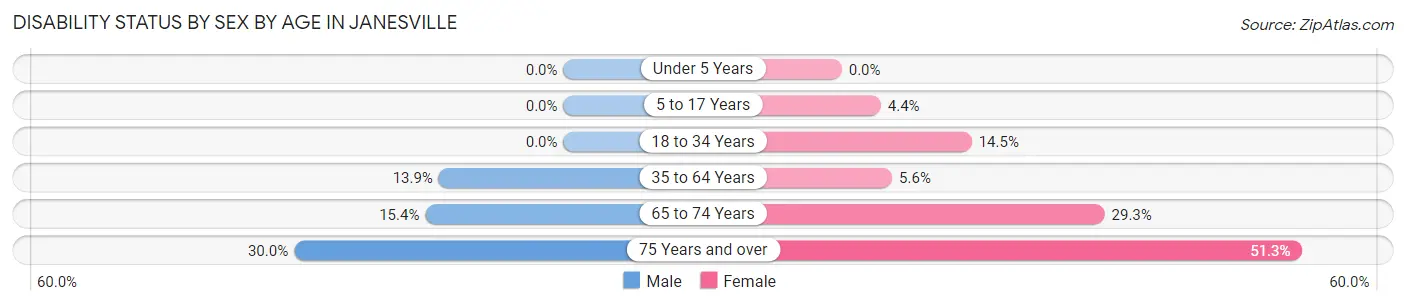
| Age Bracket | Male | Female |
| Under 5 Years | 0 (0.0%) | 0 (0.0%) |
| 5 to 17 Years | 0 (0.0%) | 5 (4.3%) |
| 18 to 34 Years | 0 (0.0%) | 11 (14.5%) |
| 35 to 64 Years | 29 (13.9%) | 12 (5.6%) |
| 65 to 74 Years | 10 (15.4%) | 12 (29.3%) |
| 75 Years and over | 3 (30.0%) | 20 (51.3%) |
Disability Class by Sex by Age in Janesville
Disability Class: Hearing Difficulty
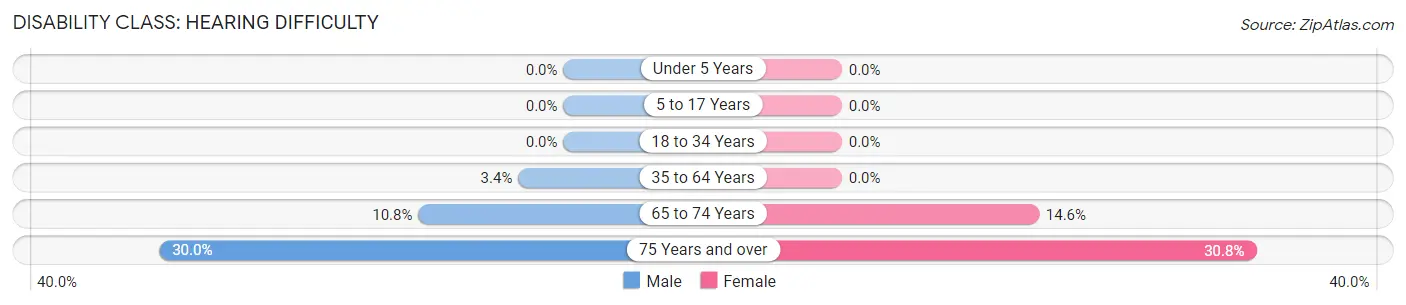
| Age Bracket | Male | Female |
| Under 5 Years | 0 (0.0%) | 0 (0.0%) |
| 5 to 17 Years | 0 (0.0%) | 0 (0.0%) |
| 18 to 34 Years | 0 (0.0%) | 0 (0.0%) |
| 35 to 64 Years | 7 (3.4%) | 0 (0.0%) |
| 65 to 74 Years | 7 (10.8%) | 6 (14.6%) |
| 75 Years and over | 3 (30.0%) | 12 (30.8%) |
Disability Class: Vision Difficulty
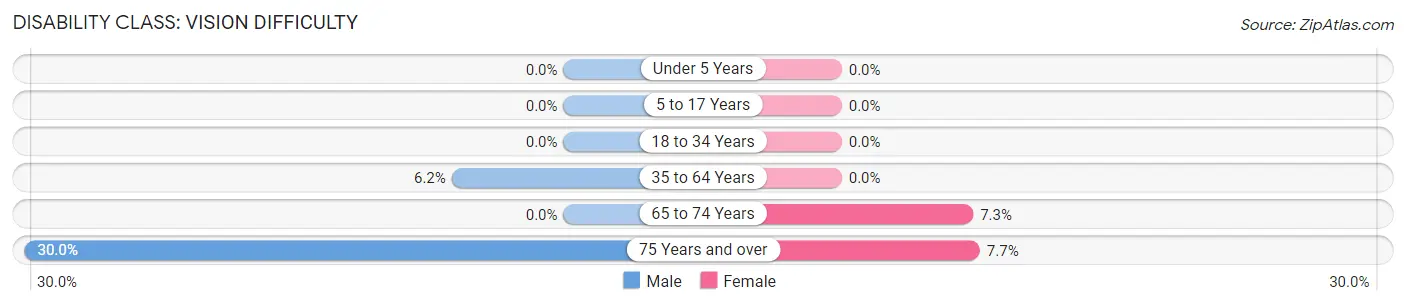
| Age Bracket | Male | Female |
| Under 5 Years | 0 (0.0%) | 0 (0.0%) |
| 5 to 17 Years | 0 (0.0%) | 0 (0.0%) |
| 18 to 34 Years | 0 (0.0%) | 0 (0.0%) |
| 35 to 64 Years | 13 (6.2%) | 0 (0.0%) |
| 65 to 74 Years | 0 (0.0%) | 3 (7.3%) |
| 75 Years and over | 3 (30.0%) | 3 (7.7%) |
Disability Class: Cognitive Difficulty
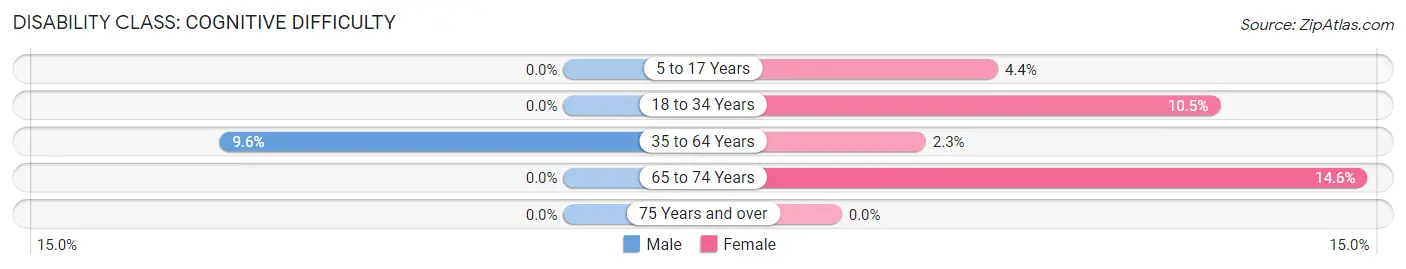
| Age Bracket | Male | Female |
| 5 to 17 Years | 0 (0.0%) | 5 (4.3%) |
| 18 to 34 Years | 0 (0.0%) | 8 (10.5%) |
| 35 to 64 Years | 20 (9.6%) | 5 (2.3%) |
| 65 to 74 Years | 0 (0.0%) | 6 (14.6%) |
| 75 Years and over | 0 (0.0%) | 0 (0.0%) |
Disability Class: Ambulatory Difficulty
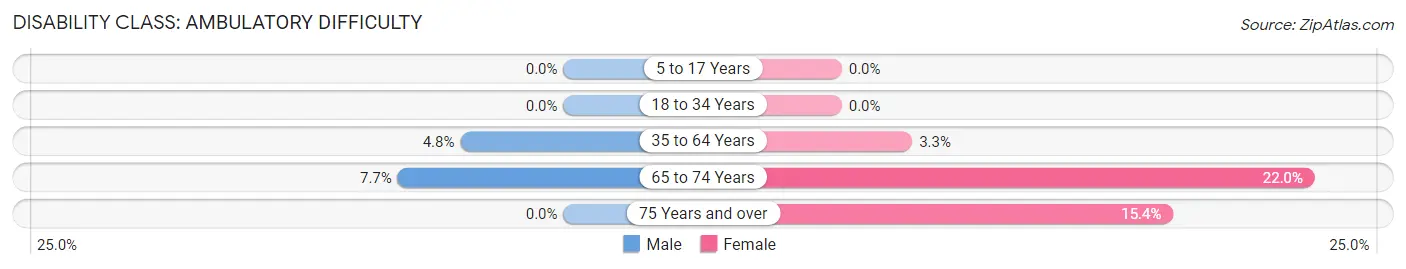
| Age Bracket | Male | Female |
| 5 to 17 Years | 0 (0.0%) | 0 (0.0%) |
| 18 to 34 Years | 0 (0.0%) | 0 (0.0%) |
| 35 to 64 Years | 10 (4.8%) | 7 (3.3%) |
| 65 to 74 Years | 5 (7.7%) | 9 (22.0%) |
| 75 Years and over | 0 (0.0%) | 6 (15.4%) |
Disability Class: Self-Care Difficulty
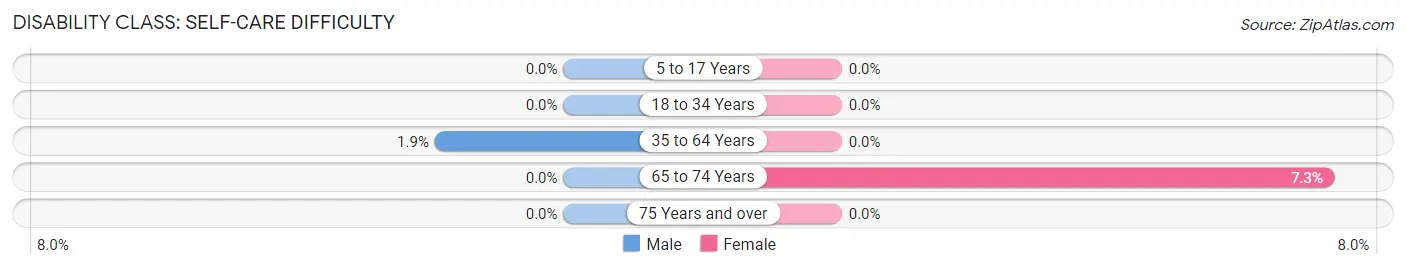
| Age Bracket | Male | Female |
| 5 to 17 Years | 0 (0.0%) | 0 (0.0%) |
| 18 to 34 Years | 0 (0.0%) | 0 (0.0%) |
| 35 to 64 Years | 4 (1.9%) | 0 (0.0%) |
| 65 to 74 Years | 0 (0.0%) | 3 (7.3%) |
| 75 Years and over | 0 (0.0%) | 0 (0.0%) |
Technology Access in Janesville
Computing Device Access in Janesville
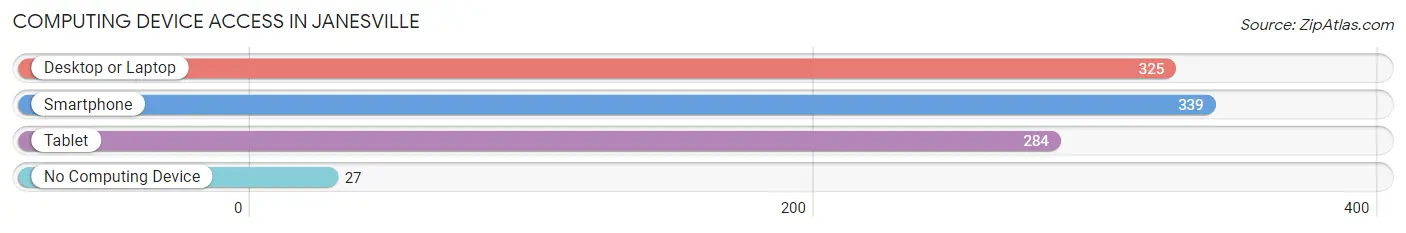
| Device Type | # Households | % Households |
| Desktop or Laptop | 325 | 80.6% |
| Smartphone | 339 | 84.1% |
| Tablet | 284 | 70.5% |
| No Computing Device | 27 | 6.7% |
| Total | 403 | 100.0% |
Internet Access in Janesville
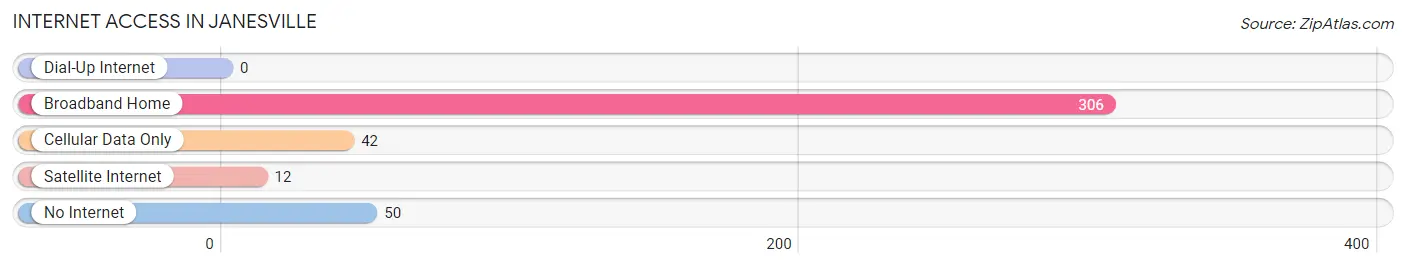
| Internet Type | # Households | % Households |
| Dial-Up Internet | 0 | 0.0% |
| Broadband Home | 306 | 75.9% |
| Cellular Data Only | 42 | 10.4% |
| Satellite Internet | 12 | 3.0% |
| No Internet | 50 | 12.4% |
| Total | 403 | 100.0% |
Janesville Summary
Janesville, Iowa is a small town located in Black Hawk County, Iowa. It is situated on the banks of the Cedar River, and is home to a population of just over 1,000 people. The town was founded in 1854, and has a rich history of farming, industry, and small-town life.
Geography
Janesville is located in the northeast corner of Black Hawk County, Iowa. It is situated on the banks of the Cedar River, and is surrounded by rolling hills and farmland. The town is located approximately 20 miles from Waterloo, Iowa, and is about an hour and a half drive from Des Moines, Iowa.
The town is situated on a flat plain, and is surrounded by a number of small hills. The town is located at an elevation of 890 feet above sea level. The climate in Janesville is generally mild, with temperatures ranging from the mid-30s in the winter to the mid-80s in the summer.
Economy
Janesville’s economy is largely based on agriculture and small businesses. The town is home to a number of small businesses, including a grocery store, a hardware store, a restaurant, and a few other small shops. The town also has a number of farms, which produce a variety of crops, including corn, soybeans, and hay.
The town is also home to a number of manufacturing companies, including a plastics factory, a metal fabrication plant, and a printing company. These companies provide employment for many of the town’s residents.
Demographics
As of the 2010 census, the population of Janesville was 1,072. The town is predominantly white, with a population that is 97.2% white. The town also has a small Hispanic population, which makes up 1.2% of the population. The median household income in Janesville is $45,000, and the median home value is $117,000.
History
Janesville was founded in 1854 by a group of settlers from New York. The town was named after the wife of one of the settlers, Jane Smith. The town quickly grew, and by the late 1800s, it had become a thriving agricultural community.
In the early 1900s, the town began to industrialize, and a number of factories were built in the area. These factories provided employment for many of the town’s residents, and helped to fuel the town’s growth.
In the 1950s, the town began to decline, as many of the factories closed and the population began to decline. However, in recent years, the town has seen a resurgence, as new businesses have opened and the population has begun to grow again.
Today, Janesville is a small, but vibrant town. It is home to a number of small businesses, and is a popular destination for tourists who are looking to experience small-town life. The town is also home to a number of historic sites, including the Janesville Historical Museum, which is dedicated to preserving the town’s history.
Common Questions
What is Per Capita Income in Janesville?
Per Capita income in Janesville is $36,260.
What is the Median Family Income in Janesville?
Median Family Income in Janesville is $113,375.
What is the Median Household income in Janesville?
Median Household Income in Janesville is $88,625.
What is Income or Wage Gap in Janesville?
Income or Wage Gap in Janesville is 33.1%.
Women in Janesville earn 66.9 cents for every dollar earned by a man.
What is Inequality or Gini Index in Janesville?
Inequality or Gini Index in Janesville is 0.32.
What is the Total Population of Janesville?
Total Population of Janesville is 1,063.
What is the Total Male Population of Janesville?
Total Male Population of Janesville is 515.
What is the Total Female Population of Janesville?
Total Female Population of Janesville is 548.
What is the Ratio of Males per 100 Females in Janesville?
There are 93.98 Males per 100 Females in Janesville.
What is the Ratio of Females per 100 Males in Janesville?
There are 106.41 Females per 100 Males in Janesville.
What is the Median Population Age in Janesville?
Median Population Age in Janesville is 38.1 Years.
What is the Average Family Size in Janesville
Average Family Size in Janesville is 3.2 People.
What is the Average Household Size in Janesville
Average Household Size in Janesville is 2.6 People.
How Large is the Labor Force in Janesville?
There are 578 People in the Labor Forcein in Janesville.
What is the Percentage of People in the Labor Force in Janesville?
72.7% of People are in the Labor Force in Janesville.
What is the Unemployment Rate in Janesville?
Unemployment Rate in Janesville is 1.6%.