Amana, IA Map & Demographics
Amana Map
Amana Overview
$48,544
PER CAPITA INCOME
$139,130
AVG FAMILY INCOME
0.36
INEQUALITY / GINI INDEX
556
TOTAL POPULATION
242
MALE POPULATION
314
FEMALE POPULATION
77.07
MALES / 100 FEMALES
129.75
FEMALES / 100 MALES
48.4
MEDIAN AGE
2.8
AVG FAMILY SIZE
2.3
AVG HOUSEHOLD SIZE
376
LABOR FORCE [ PEOPLE ]
78.0%
PERCENT IN LABOR FORCE
Amana Zip Codes
Amana Area Codes
Income in Amana
Income Overview in Amana
| Characteristic | Number | Measure |
| Per Capita Income | 556 | $48,544 |
| Median Family Income | 176 | $139,130 |
| Mean Family Income | 176 | $136,256 |
| Median Household Income | 244 | $0 |
| Mean Household Income | 244 | $108,788 |
| Income Deficit | 176 | $0 |
| Wage / Income Gap (%) | 556 | 0.00% |
| Wage / Income Gap ($) | 556 | 100.00¢ per $1 |
| Gini / Inequality Index | 556 | 0.36 |
Earnings by Sex in Amana
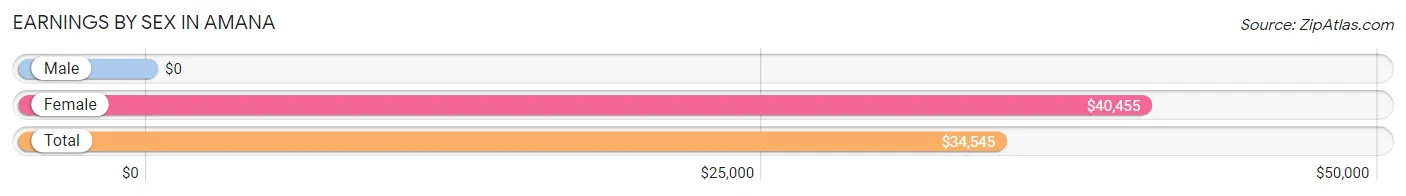
| Sex | Number | Average Earnings |
| Male | 156 (41.5%) | $0 |
| Female | 220 (58.5%) | $40,455 |
| Total | 376 (100.0%) | $34,545 |
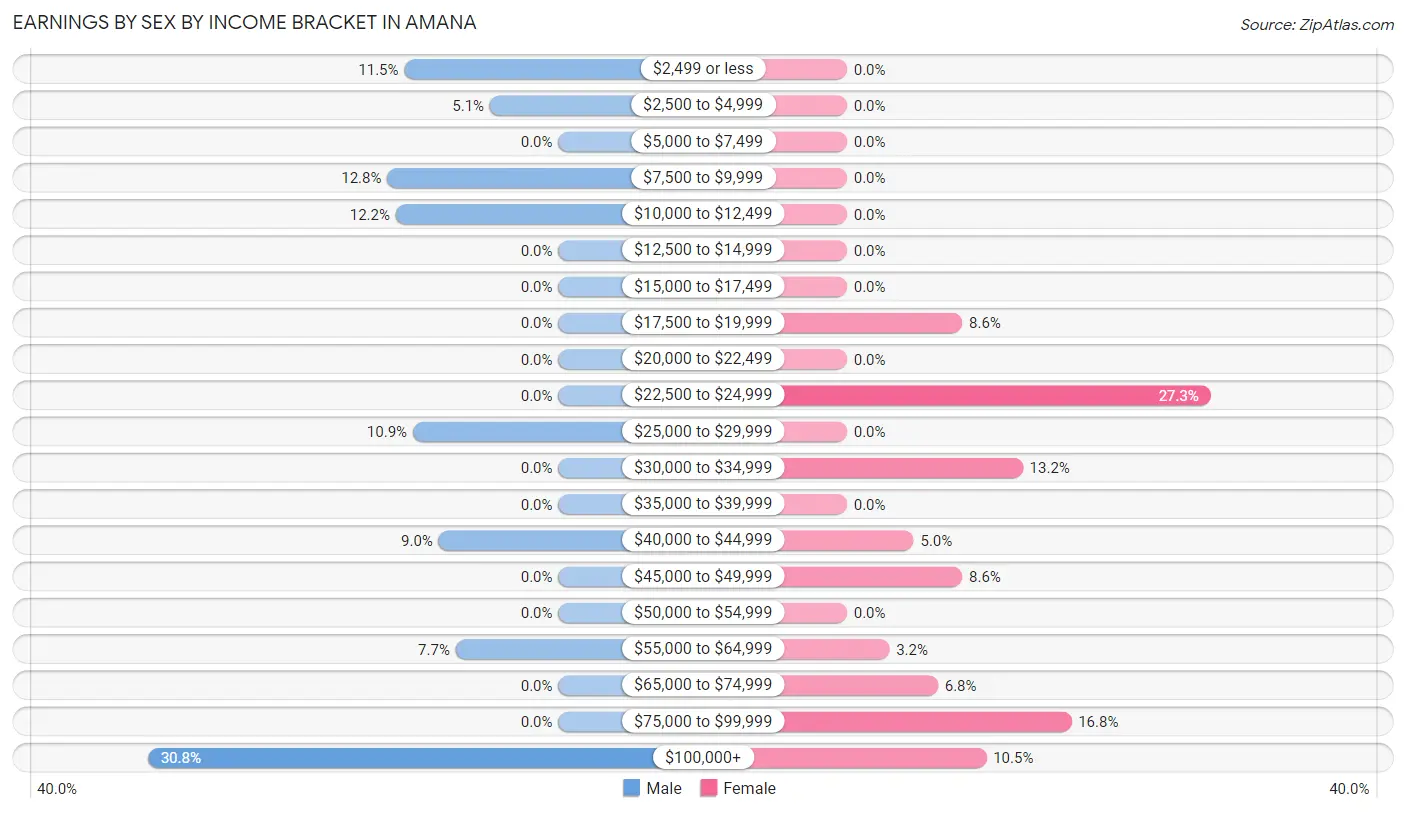
Earnings by Sex by Income Bracket in Amana
The most common earnings brackets in Amana are $100,000+ for men (48 | 30.8%) and $22,500 to $24,999 for women (60 | 27.3%).
| Income | Male | Female |
| $2,499 or less | 18 (11.5%) | 0 (0.0%) |
| $2,500 to $4,999 | 8 (5.1%) | 0 (0.0%) |
| $5,000 to $7,499 | 0 (0.0%) | 0 (0.0%) |
| $7,500 to $9,999 | 20 (12.8%) | 0 (0.0%) |
| $10,000 to $12,499 | 19 (12.2%) | 0 (0.0%) |
| $12,500 to $14,999 | 0 (0.0%) | 0 (0.0%) |
| $15,000 to $17,499 | 0 (0.0%) | 0 (0.0%) |
| $17,500 to $19,999 | 0 (0.0%) | 19 (8.6%) |
| $20,000 to $22,499 | 0 (0.0%) | 0 (0.0%) |
| $22,500 to $24,999 | 0 (0.0%) | 60 (27.3%) |
| $25,000 to $29,999 | 17 (10.9%) | 0 (0.0%) |
| $30,000 to $34,999 | 0 (0.0%) | 29 (13.2%) |
| $35,000 to $39,999 | 0 (0.0%) | 0 (0.0%) |
| $40,000 to $44,999 | 14 (9.0%) | 11 (5.0%) |
| $45,000 to $49,999 | 0 (0.0%) | 19 (8.6%) |
| $50,000 to $54,999 | 0 (0.0%) | 0 (0.0%) |
| $55,000 to $64,999 | 12 (7.7%) | 7 (3.2%) |
| $65,000 to $74,999 | 0 (0.0%) | 15 (6.8%) |
| $75,000 to $99,999 | 0 (0.0%) | 37 (16.8%) |
| $100,000+ | 48 (30.8%) | 23 (10.4%) |
| Total | 156 (100.0%) | 220 (100.0%) |
Earnings by Sex by Educational Attainment in Amana
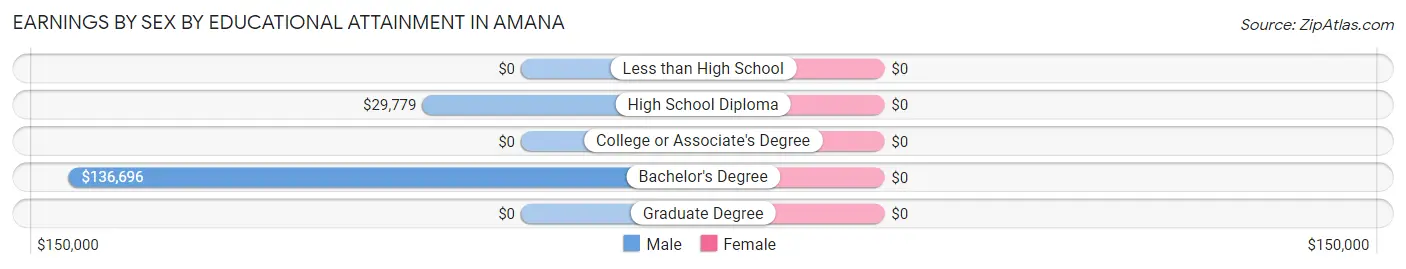
| Educational Attainment | Male Income | Female Income |
| Less than High School | - | - |
| High School Diploma | $29,779 | $0 |
| College or Associate's Degree | - | - |
| Bachelor's Degree | $136,696 | $0 |
| Graduate Degree | - | - |
| Total | - | - |
Family Income in Amana
Family Income Brackets in Amana
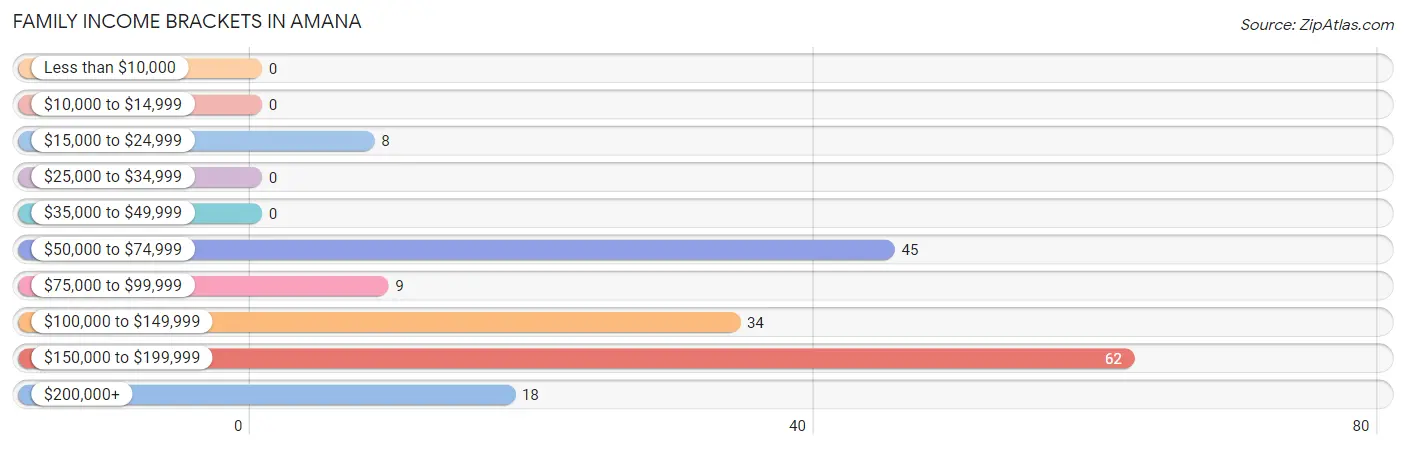
According to the Amana family income data, there are 62 families falling into the $150,000 to $199,999 income range, which is the most common income bracket and makes up 35.2% of all families.
| Income Bracket | # Families | % Families |
| Less than $10,000 | 0 | 0.0% |
| $10,000 to $14,999 | 0 | 0.0% |
| $15,000 to $24,999 | 8 | 4.5% |
| $25,000 to $34,999 | 0 | 0.0% |
| $35,000 to $49,999 | 0 | 0.0% |
| $50,000 to $74,999 | 45 | 25.6% |
| $75,000 to $99,999 | 9 | 5.1% |
| $100,000 to $149,999 | 34 | 19.3% |
| $150,000 to $199,999 | 62 | 35.2% |
| $200,000+ | 18 | 10.2% |
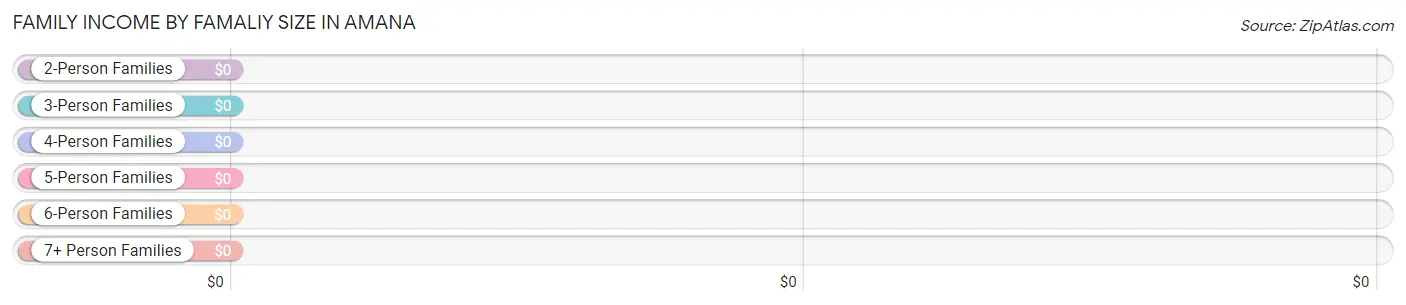
Family Income by Famaliy Size in Amana
| Income Bracket | # Families | Median Income |
| 2-Person Families | 109 (61.9%) | $0 |
| 3-Person Families | 26 (14.8%) | $0 |
| 4-Person Families | 41 (23.3%) | $0 |
| 5-Person Families | 0 (0.0%) | $0 |
| 6-Person Families | 0 (0.0%) | $0 |
| 7+ Person Families | 0 (0.0%) | $0 |
| Total | 176 (100.0%) | $139,130 |
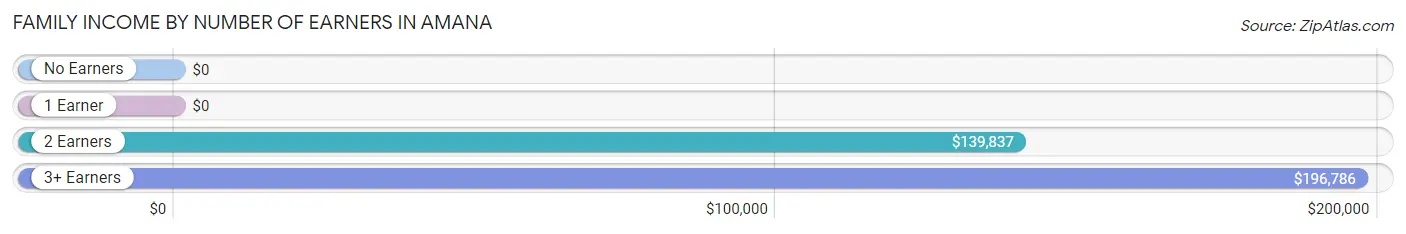
Family Income by Number of Earners in Amana
| Number of Earners | # Families | Median Income |
| No Earners | 49 (27.8%) | $0 |
| 1 Earner | 8 (4.5%) | $0 |
| 2 Earners | 75 (42.6%) | $139,837 |
| 3+ Earners | 44 (25.0%) | $196,786 |
| Total | 176 (100.0%) | $139,130 |
Household Income in Amana
Household Income Brackets in Amana
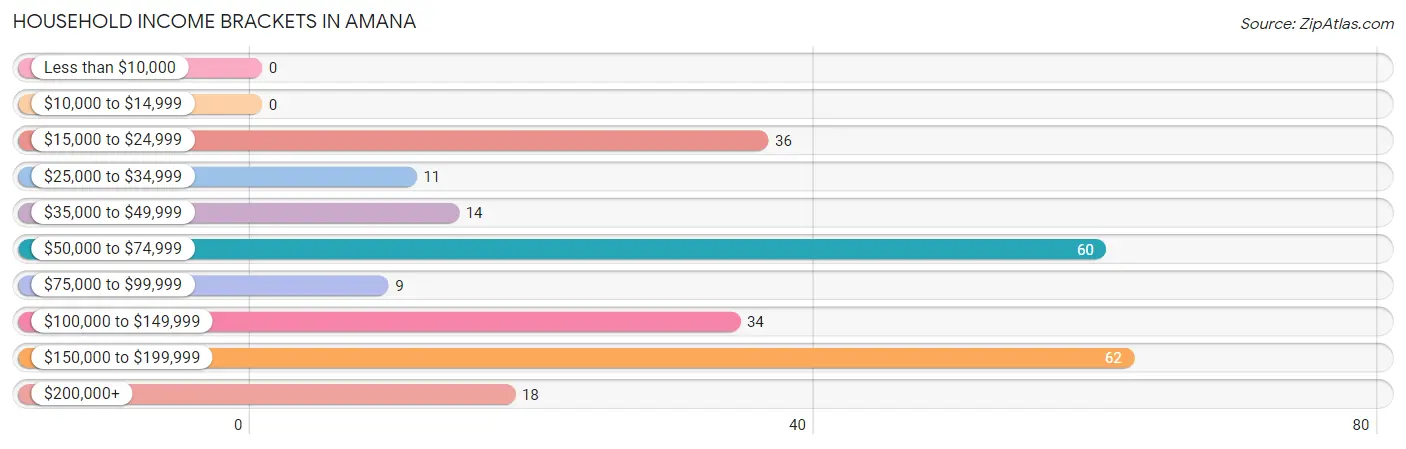
With 62 households falling in the category, the $150,000 to $199,999 income range is the most frequent in Amana, accounting for 25.4% of all households.
| Income Bracket | # Households | % Households |
| Less than $10,000 | 0 | 0.0% |
| $10,000 to $14,999 | 0 | 0.0% |
| $15,000 to $24,999 | 36 | 14.8% |
| $25,000 to $34,999 | 11 | 4.5% |
| $35,000 to $49,999 | 14 | 5.7% |
| $50,000 to $74,999 | 60 | 24.6% |
| $75,000 to $99,999 | 9 | 3.7% |
| $100,000 to $149,999 | 34 | 13.9% |
| $150,000 to $199,999 | 62 | 25.4% |
| $200,000+ | 18 | 7.4% |
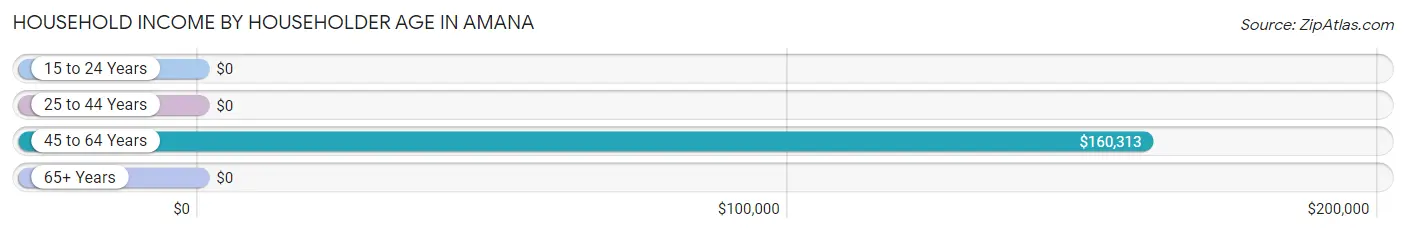
Household Income by Householder Age in Amana
The median household income in Amana is $0, with the highest median household income of $160,313 found in the 45 to 64 years age bracket for the primary householder. A total of 119 households (48.8%) fall into this category.
| Income Bracket | # Households | Median Income |
| 15 to 24 Years | 0 (0.0%) | $0 |
| 25 to 44 Years | 57 (23.4%) | $0 |
| 45 to 64 Years | 119 (48.8%) | $160,313 |
| 65+ Years | 68 (27.9%) | $0 |
| Total | 244 (100.0%) | $0 |
Poverty in Amana
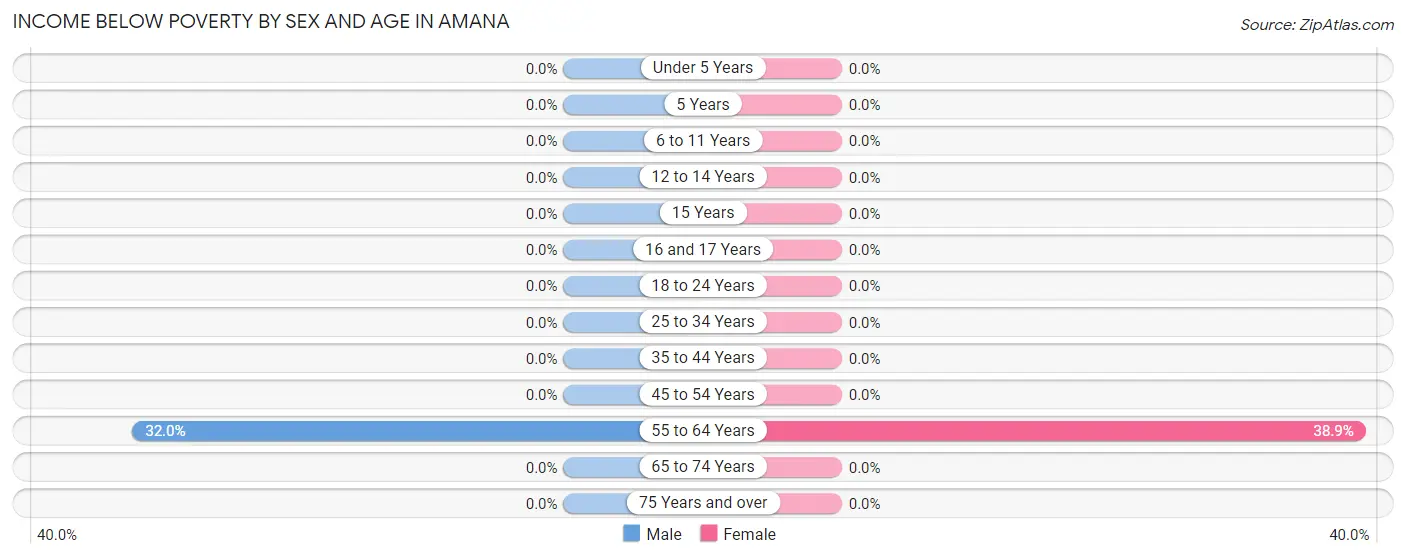
Income Below Poverty by Sex and Age in Amana
With 3.3% poverty level for males and 2.2% for females among the residents of Amana, 55 to 64 year old males and 55 to 64 year old females are the most vulnerable to poverty, with 8 males (32.0%) and 7 females (38.9%) in their respective age groups living below the poverty level.
| Age Bracket | Male | Female |
| Under 5 Years | 0 (0.0%) | 0 (0.0%) |
| 5 Years | 0 (0.0%) | 0 (0.0%) |
| 6 to 11 Years | 0 (0.0%) | 0 (0.0%) |
| 12 to 14 Years | 0 (0.0%) | 0 (0.0%) |
| 15 Years | 0 (0.0%) | 0 (0.0%) |
| 16 and 17 Years | 0 (0.0%) | 0 (0.0%) |
| 18 to 24 Years | 0 (0.0%) | 0 (0.0%) |
| 25 to 34 Years | 0 (0.0%) | 0 (0.0%) |
| 35 to 44 Years | 0 (0.0%) | 0 (0.0%) |
| 45 to 54 Years | 0 (0.0%) | 0 (0.0%) |
| 55 to 64 Years | 8 (32.0%) | 7 (38.9%) |
| 65 to 74 Years | 0 (0.0%) | 0 (0.0%) |
| 75 Years and over | 0 (0.0%) | 0 (0.0%) |
| Total | 8 (3.3%) | 7 (2.2%) |
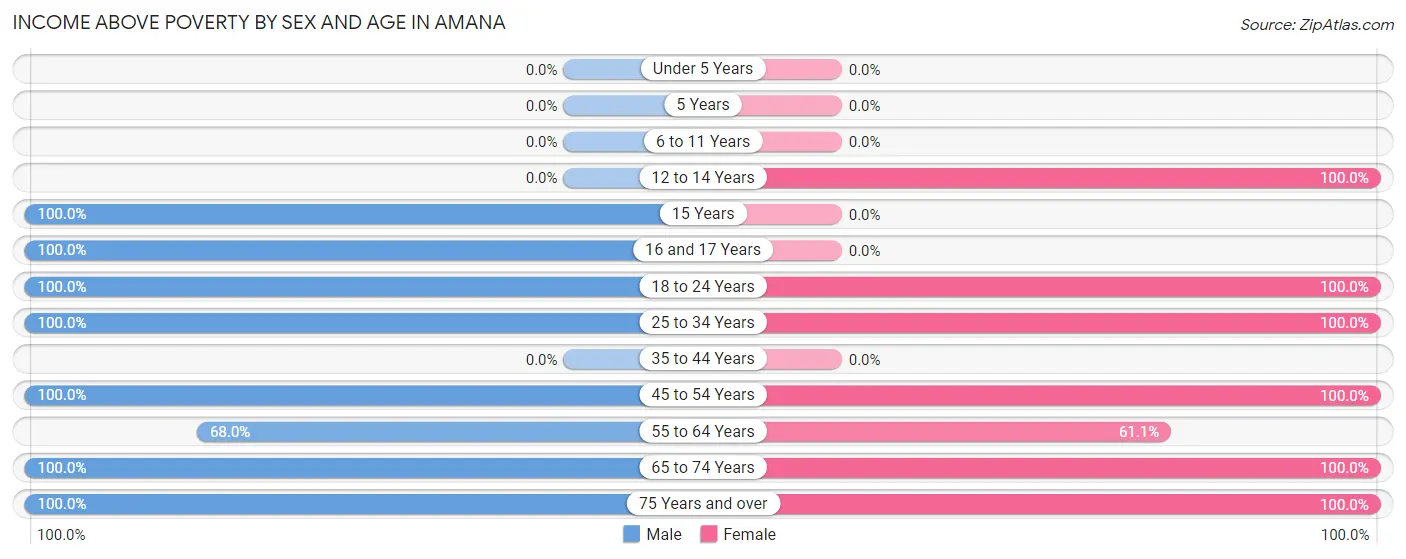
Income Above Poverty by Sex and Age in Amana
According to the poverty statistics in Amana, males aged 15 years and females aged 12 to 14 years are the age groups that are most secure financially, with 100.0% of males and 100.0% of females in these age groups living above the poverty line.
| Age Bracket | Male | Female |
| Under 5 Years | 0 (0.0%) | 0 (0.0%) |
| 5 Years | 0 (0.0%) | 0 (0.0%) |
| 6 to 11 Years | 0 (0.0%) | 0 (0.0%) |
| 12 to 14 Years | 0 (0.0%) | 40 (100.0%) |
| 15 Years | 34 (100.0%) | 0 (0.0%) |
| 16 and 17 Years | 30 (100.0%) | 0 (0.0%) |
| 18 to 24 Years | 8 (100.0%) | 44 (100.0%) |
| 25 to 34 Years | 14 (100.0%) | 43 (100.0%) |
| 35 to 44 Years | 0 (0.0%) | 0 (0.0%) |
| 45 to 54 Years | 60 (100.0%) | 103 (100.0%) |
| 55 to 64 Years | 17 (68.0%) | 11 (61.1%) |
| 65 to 74 Years | 19 (100.0%) | 19 (100.0%) |
| 75 Years and over | 52 (100.0%) | 47 (100.0%) |
| Total | 234 (96.7%) | 307 (97.8%) |
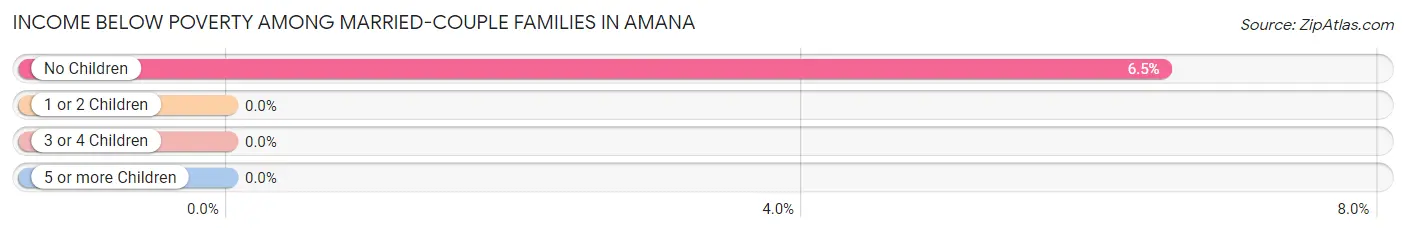
Income Below Poverty Among Married-Couple Families in Amana
The poverty statistics for married-couple families in Amana show that 5.2% or 8 of the total 153 families live below the poverty line. Families with no children have the highest poverty rate of 6.5%, comprising of 8 families. On the other hand, families with 1 or 2 children have the lowest poverty rate of 0.0%, which includes 0 families.
| Children | Above Poverty | Below Poverty |
| No Children | 115 (93.5%) | 8 (6.5%) |
| 1 or 2 Children | 30 (100.0%) | 0 (0.0%) |
| 3 or 4 Children | 0 (0.0%) | 0 (0.0%) |
| 5 or more Children | 0 (0.0%) | 0 (0.0%) |
| Total | 145 (94.8%) | 8 (5.2%) |
Income Below Poverty Among Single-Parent Households in Amana
| Children | Single Father | Single Mother |
| No Children | 0 (0.0%) | 0 (0.0%) |
| 1 or 2 Children | 0 (0.0%) | 0 (0.0%) |
| 3 or 4 Children | 0 (0.0%) | 0 (0.0%) |
| 5 or more Children | 0 (0.0%) | 0 (0.0%) |
| Total | 0 (0.0%) | 0 (0.0%) |
Income Below Poverty Among Married-Couple vs Single-Parent Households in Amana
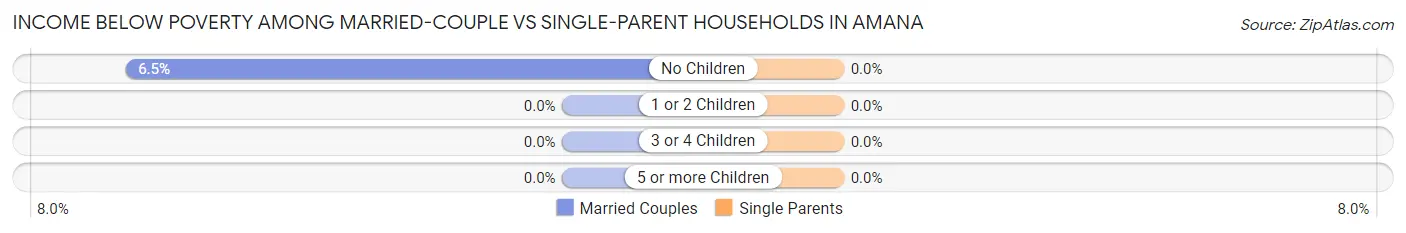
| Children | Married-Couple Families | Single-Parent Households |
| No Children | 8 (6.5%) | 0 (0.0%) |
| 1 or 2 Children | 0 (0.0%) | 0 (0.0%) |
| 3 or 4 Children | 0 (0.0%) | 0 (0.0%) |
| 5 or more Children | 0 (0.0%) | 0 (0.0%) |
| Total | 8 (5.2%) | 0 (0.0%) |
Race in Amana
The most populous races in Amana are White / Caucasian (434 | 78.1%), and Two or more Races (122 | 21.9%).
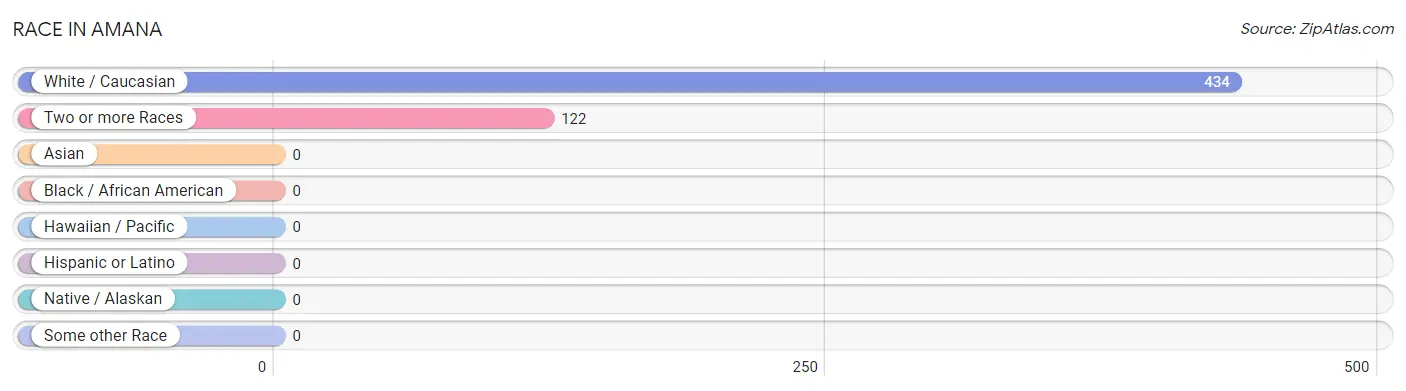
| Race | # Population | % Population |
| Asian | 0 | 0.0% |
| Black / African American | 0 | 0.0% |
| Hawaiian / Pacific | 0 | 0.0% |
| Hispanic or Latino | 0 | 0.0% |
| Native / Alaskan | 0 | 0.0% |
| White / Caucasian | 434 | 78.1% |
| Two or more Races | 122 | 21.9% |
| Some other Race | 0 | 0.0% |
| Total | 556 | 100.0% |
Ancestry in Amana
The most populous ancestries reported in Amana are German (140 | 25.2%), Irish (101 | 18.2%), Welsh (79 | 14.2%), Czech (36 | 6.5%), and English (30 | 5.4%), together accounting for 69.4% of all Amana residents.
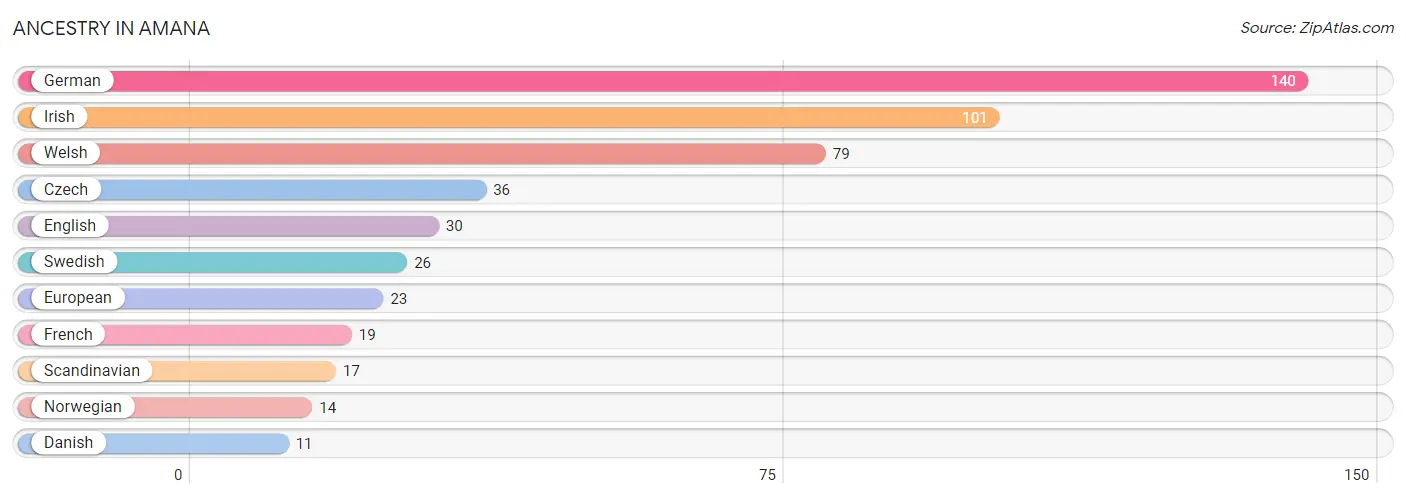
| Ancestry | # Population | % Population |
| Czech | 36 | 6.5% |
| Danish | 11 | 2.0% |
| English | 30 | 5.4% |
| European | 23 | 4.1% |
| French | 19 | 3.4% |
| German | 140 | 25.2% |
| Irish | 101 | 18.2% |
| Norwegian | 14 | 2.5% |
| Scandinavian | 17 | 3.1% |
| Swedish | 26 | 4.7% |
| Welsh | 79 | 14.2% | View All 11 Rows |
Immigrants in Amana

| Immigration Origin | # Population | % Population | View All 0 Rows |
Sex and Age in Amana
Sex and Age in Amana
The most populous age groups in Amana are 15 to 19 Years (72 | 29.7%) for men and 45 to 49 Years (55 | 17.5%) for women.
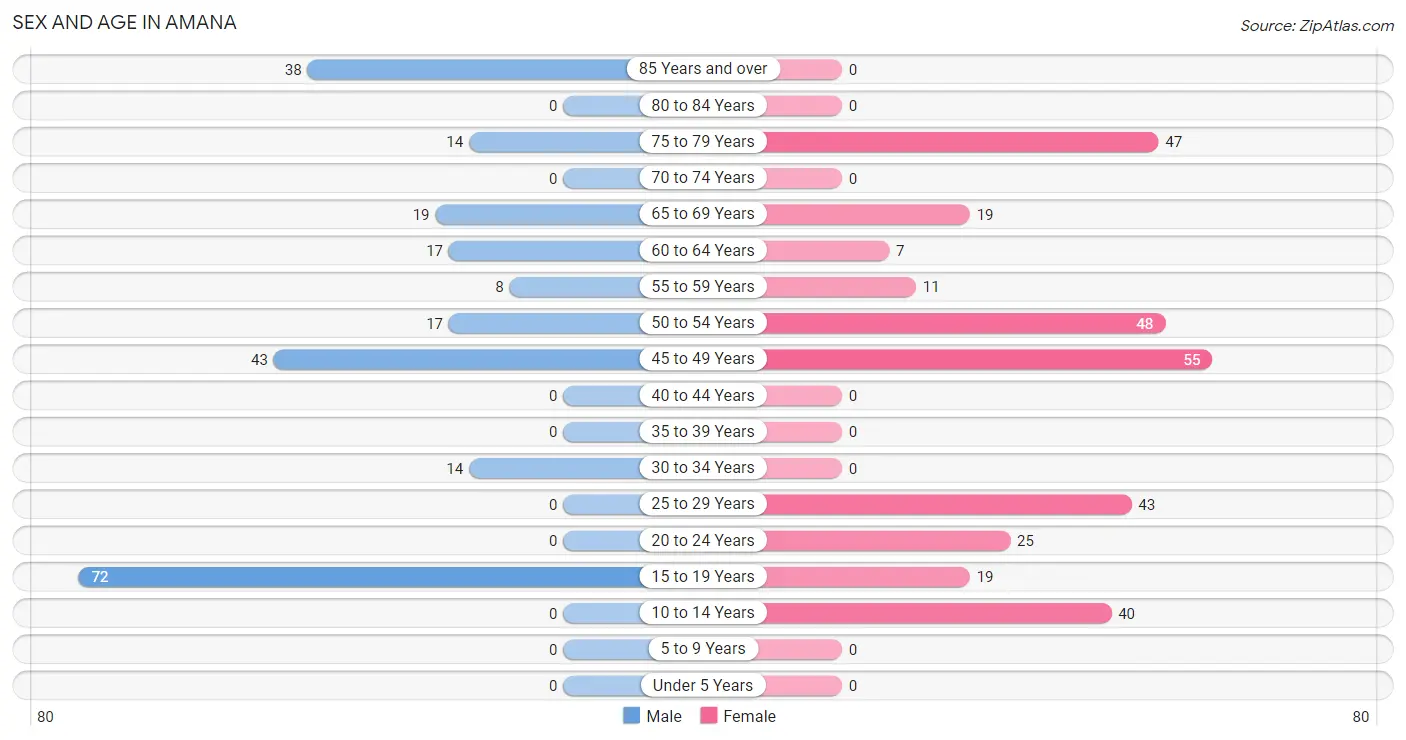
| Age Bracket | Male | Female |
| Under 5 Years | 0 (0.0%) | 0 (0.0%) |
| 5 to 9 Years | 0 (0.0%) | 0 (0.0%) |
| 10 to 14 Years | 0 (0.0%) | 40 (12.7%) |
| 15 to 19 Years | 72 (29.7%) | 19 (6.0%) |
| 20 to 24 Years | 0 (0.0%) | 25 (8.0%) |
| 25 to 29 Years | 0 (0.0%) | 43 (13.7%) |
| 30 to 34 Years | 14 (5.8%) | 0 (0.0%) |
| 35 to 39 Years | 0 (0.0%) | 0 (0.0%) |
| 40 to 44 Years | 0 (0.0%) | 0 (0.0%) |
| 45 to 49 Years | 43 (17.8%) | 55 (17.5%) |
| 50 to 54 Years | 17 (7.0%) | 48 (15.3%) |
| 55 to 59 Years | 8 (3.3%) | 11 (3.5%) |
| 60 to 64 Years | 17 (7.0%) | 7 (2.2%) |
| 65 to 69 Years | 19 (7.9%) | 19 (6.0%) |
| 70 to 74 Years | 0 (0.0%) | 0 (0.0%) |
| 75 to 79 Years | 14 (5.8%) | 47 (15.0%) |
| 80 to 84 Years | 0 (0.0%) | 0 (0.0%) |
| 85 Years and over | 38 (15.7%) | 0 (0.0%) |
| Total | 242 (100.0%) | 314 (100.0%) |
Families and Households in Amana
Median Family Size in Amana
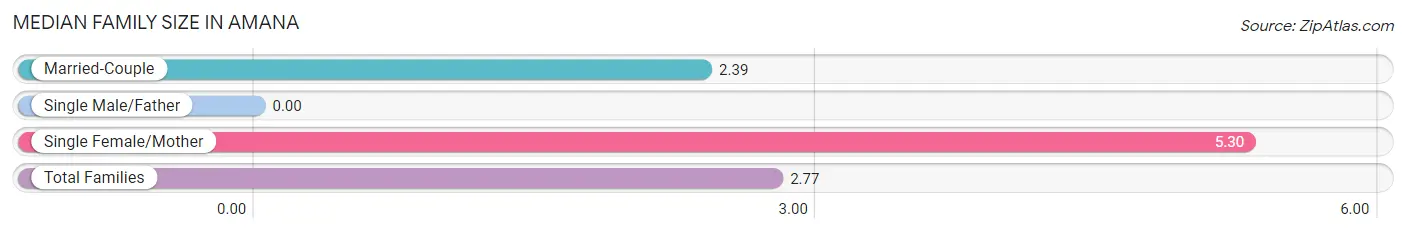
| Family Type | # Families | Family Size |
| Married-Couple | 153 (86.9%) | 2.39 |
| Single Male/Father | 0 (0.0%) | - |
| Single Female/Mother | 23 (13.1%) | 5.30 |
| Total Families | 176 (100.0%) | 2.77 |
Median Household Size in Amana
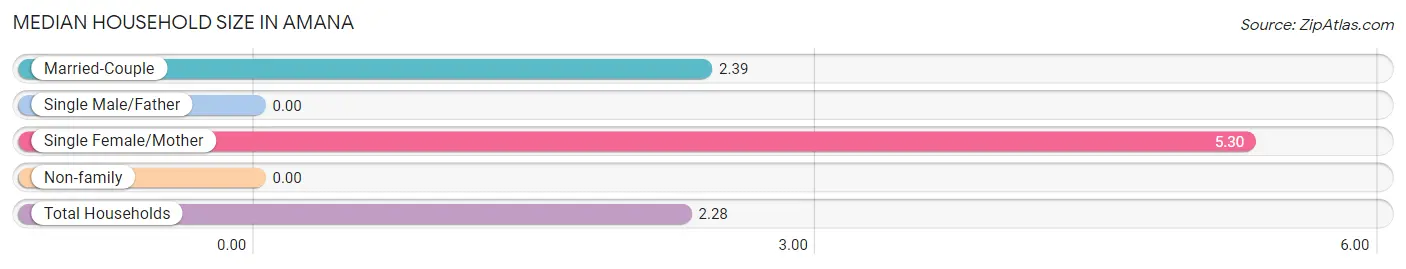
| Household Type | # Households | Household Size |
| Married-Couple | 153 (62.7%) | 2.39 |
| Single Male/Father | 0 (0.0%) | - |
| Single Female/Mother | 23 (9.4%) | 5.30 |
| Non-family | 68 (27.9%) | - |
| Total Households | 244 (100.0%) | 2.28 |
Household Size by Marriage Status in Amana
Out of a total of 244 households in Amana, 176 (72.1%) are family households, while 68 (27.9%) are nonfamily households. The most numerous type of family households are 2-person households, comprising 109, and the most common type of nonfamily households are 1-person households, comprising 68.
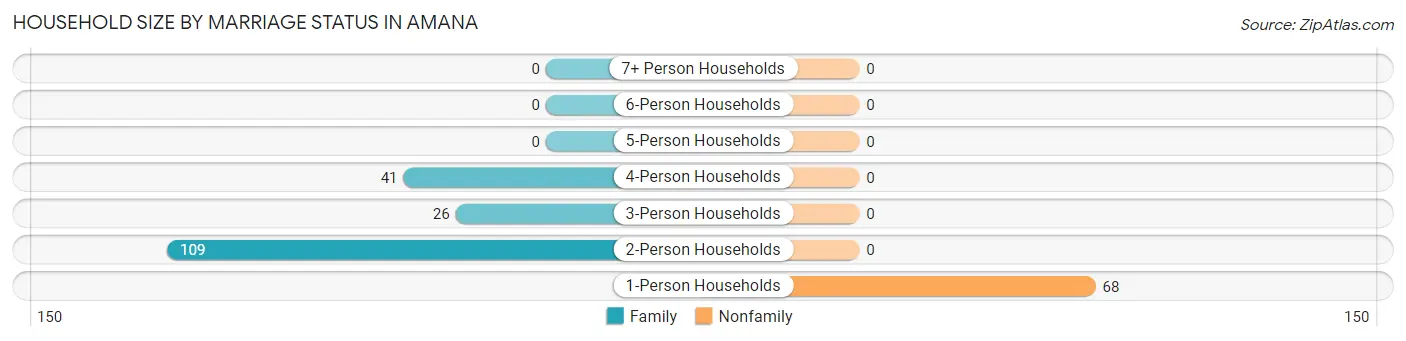
| Household Size | Family Households | Nonfamily Households |
| 1-Person Households | - | 68 (27.9%) |
| 2-Person Households | 109 (44.7%) | 0 (0.0%) |
| 3-Person Households | 26 (10.7%) | 0 (0.0%) |
| 4-Person Households | 41 (16.8%) | 0 (0.0%) |
| 5-Person Households | 0 (0.0%) | 0 (0.0%) |
| 6-Person Households | 0 (0.0%) | 0 (0.0%) |
| 7+ Person Households | 0 (0.0%) | 0 (0.0%) |
| Total | 176 (72.1%) | 68 (27.9%) |
Female Fertility in Amana
Fertility by Age in Amana
| Age Bracket | Women with Births | Births / 1,000 Women |
| 15 to 19 years | 0 (0.0%) | 0.0 |
| 20 to 34 years | 0 (0.0%) | 0.0 |
| 35 to 50 years | 0 (0.0%) | 0.0 |
| Total | 0 (0.0%) | 0.0 |
Fertility by Age by Marriage Status in Amana
| Age Bracket | Married | Unmarried |
| 15 to 19 years | 0 (0.0%) | 0 (0.0%) |
| 20 to 34 years | 0 (0.0%) | 0 (0.0%) |
| 35 to 50 years | 0 (0.0%) | 0 (0.0%) |
| Total | 0 (0.0%) | 0 (0.0%) |
Fertility by Education in Amana
| Educational Attainment | Women with Births | Births / 1,000 Women |
| Less than High School | 0 (0.0%) | 0.0 |
| High School Diploma | 0 (0.0%) | 0.0 |
| College or Associate's Degree | 0 (0.0%) | 0.0 |
| Bachelor's Degree | 0 (0.0%) | 0.0 |
| Graduate Degree | 0 (0.0%) | 0.0 |
| Total | 0 (0.0%) | 0.0 |
Fertility by Education by Marriage Status in Amana
| Educational Attainment | Married | Unmarried |
| Less than High School | 0 (0.0%) | 0 (0.0%) |
| High School Diploma | 0 (0.0%) | 0 (0.0%) |
| College or Associate's Degree | 0 (0.0%) | 0 (0.0%) |
| Bachelor's Degree | 0 (0.0%) | 0 (0.0%) |
| Graduate Degree | 0 (0.0%) | 0 (0.0%) |
| Total | 0 (0.0%) | 0 (0.0%) |
Employment Characteristics in Amana
Employment by Class of Employer in Amana
Among the 351 employed individuals in Amana, private company employees (254 | 72.4%), self-employed (incorporated) (46 | 13.1%), and local government employees (18 | 5.1%) make up the most common classes of employment.
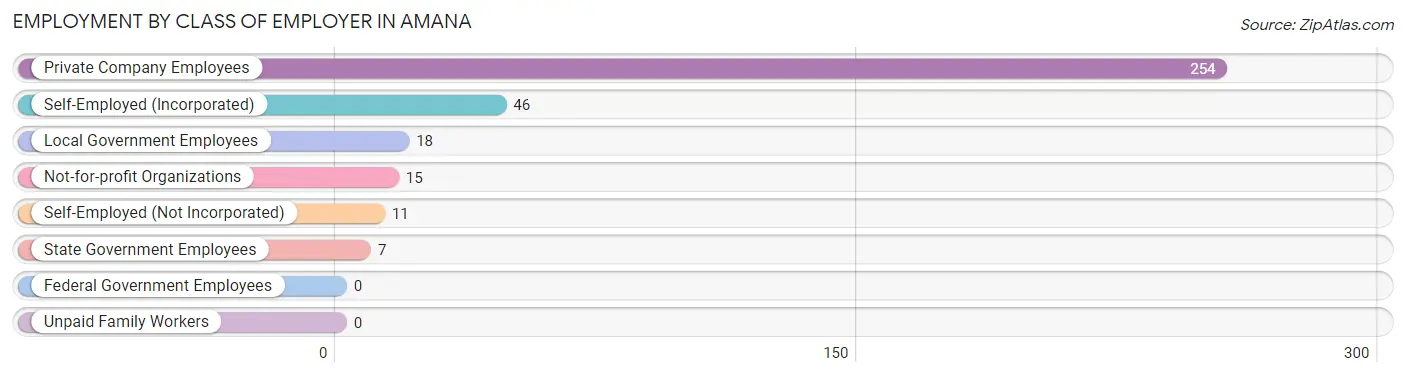
| Employer Class | # Employees | % Employees |
| Private Company Employees | 254 | 72.4% |
| Self-Employed (Incorporated) | 46 | 13.1% |
| Self-Employed (Not Incorporated) | 11 | 3.1% |
| Not-for-profit Organizations | 15 | 4.3% |
| Local Government Employees | 18 | 5.1% |
| State Government Employees | 7 | 2.0% |
| Federal Government Employees | 0 | 0.0% |
| Unpaid Family Workers | 0 | 0.0% |
| Total | 351 | 100.0% |
Employment Status by Age in Amana
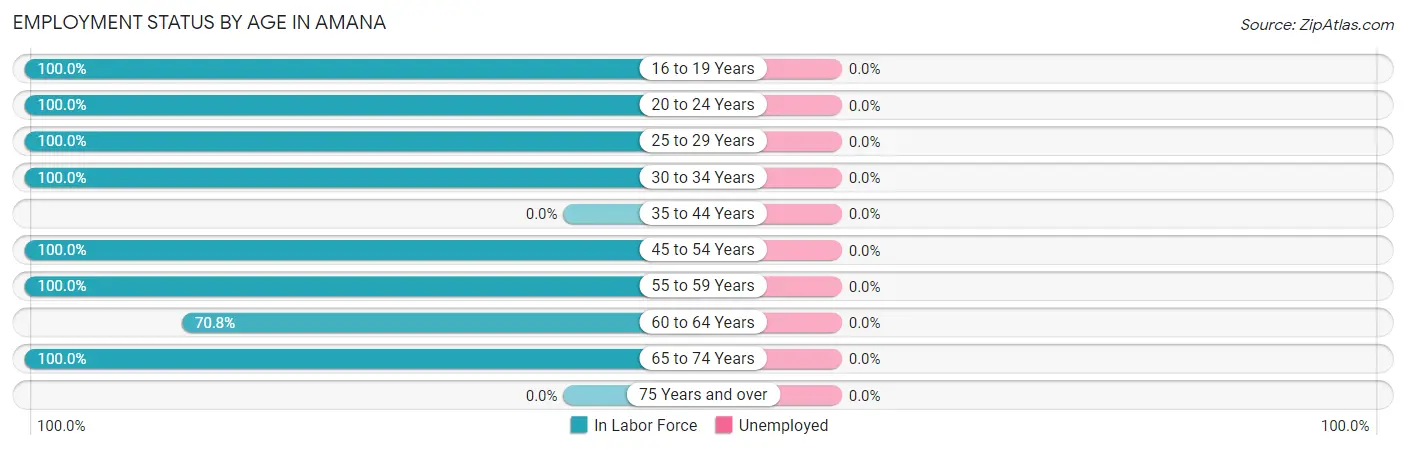
| Age Bracket | In Labor Force | Unemployed |
| 16 to 19 Years | 57 (100.0%) | 0 (0.0%) |
| 20 to 24 Years | 25 (100.0%) | 0 (0.0%) |
| 25 to 29 Years | 43 (100.0%) | 0 (0.0%) |
| 30 to 34 Years | 14 (100.0%) | 0 (0.0%) |
| 35 to 44 Years | 0 (0.0%) | 0 (0.0%) |
| 45 to 54 Years | 163 (100.0%) | 0 (0.0%) |
| 55 to 59 Years | 19 (100.0%) | 0 (0.0%) |
| 60 to 64 Years | 17 (70.8%) | 0 (0.0%) |
| 65 to 74 Years | 38 (100.0%) | 0 (0.0%) |
| 75 Years and over | 0 (0.0%) | 0 (0.0%) |
| Total | 376 (78.0%) | 0 (0.0%) |
Employment Status by Educational Attainment in Amana
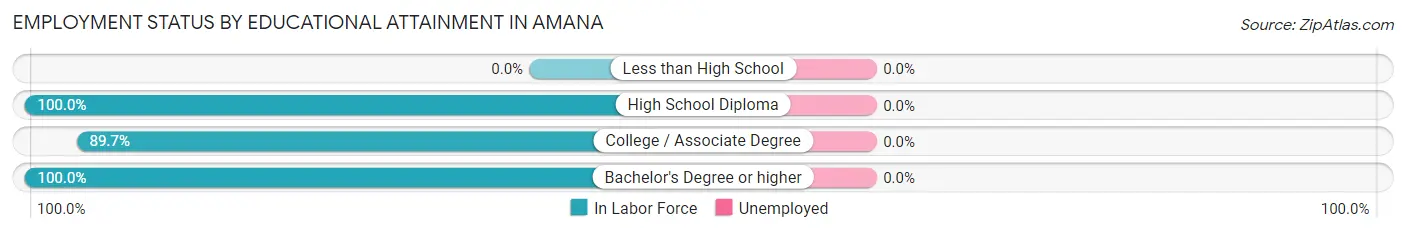
| Educational Attainment | In Labor Force | Unemployed |
| Less than High School | 0 (0.0%) | 0 (0.0%) |
| High School Diploma | 61 (100.0%) | 0 (0.0%) |
| College / Associate Degree | 61 (89.7%) | 0 (0.0%) |
| Bachelor's Degree or higher | 134 (100.0%) | 0 (0.0%) |
| Total | 256 (97.3%) | 0 (0.0%) |
Employment Occupations by Sex in Amana
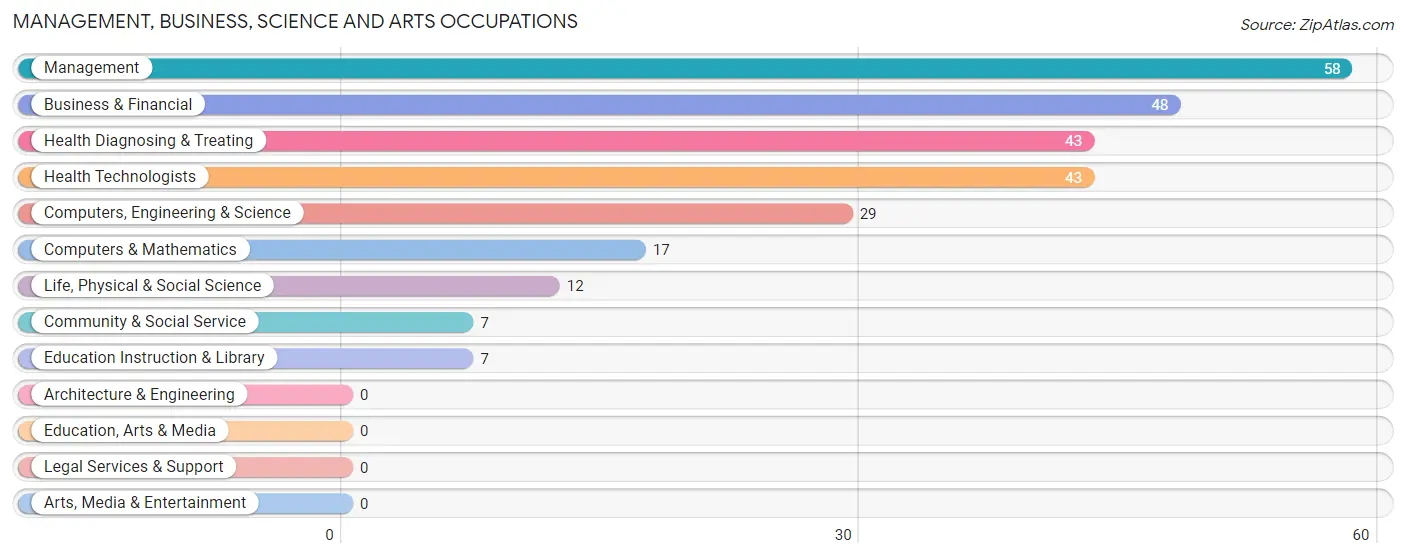
Management, Business, Science and Arts Occupations
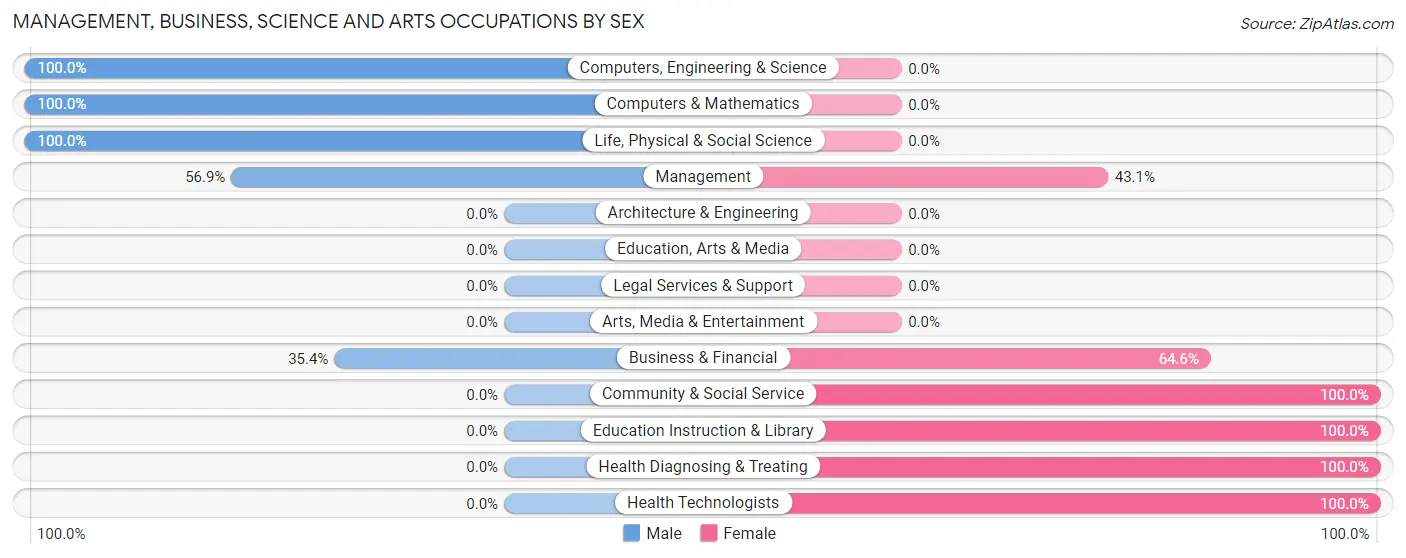
The most common Management, Business, Science and Arts occupations in Amana are Management (58 | 15.4%), Business & Financial (48 | 12.8%), Health Diagnosing & Treating (43 | 11.4%), Health Technologists (43 | 11.4%), and Computers, Engineering & Science (29 | 7.7%).
Management, Business, Science and Arts Occupations by Sex
Within the Management, Business, Science and Arts occupations in Amana, the most male-oriented occupations are Computers, Engineering & Science (100.0%), Computers & Mathematics (100.0%), and Life, Physical & Social Science (100.0%), while the most female-oriented occupations are Community & Social Service (100.0%), Education Instruction & Library (100.0%), and Health Diagnosing & Treating (100.0%).
| Occupation | Male | Female |
| Management | 33 (56.9%) | 25 (43.1%) |
| Business & Financial | 17 (35.4%) | 31 (64.6%) |
| Computers, Engineering & Science | 29 (100.0%) | 0 (0.0%) |
| Computers & Mathematics | 17 (100.0%) | 0 (0.0%) |
| Architecture & Engineering | 0 (0.0%) | 0 (0.0%) |
| Life, Physical & Social Science | 12 (100.0%) | 0 (0.0%) |
| Community & Social Service | 0 (0.0%) | 7 (100.0%) |
| Education, Arts & Media | 0 (0.0%) | 0 (0.0%) |
| Legal Services & Support | 0 (0.0%) | 0 (0.0%) |
| Education Instruction & Library | 0 (0.0%) | 7 (100.0%) |
| Arts, Media & Entertainment | 0 (0.0%) | 0 (0.0%) |
| Health Diagnosing & Treating | 0 (0.0%) | 43 (100.0%) |
| Health Technologists | 0 (0.0%) | 43 (100.0%) |
| Total (Category) | 79 (42.7%) | 106 (57.3%) |
| Total (Overall) | 156 (41.5%) | 220 (58.5%) |
Services Occupations
The most common Services occupations in Amana are Healthcare Support (25 | 6.7%), Food Preparation & Serving (19 | 5.1%), and Personal Care & Service (11 | 2.9%).
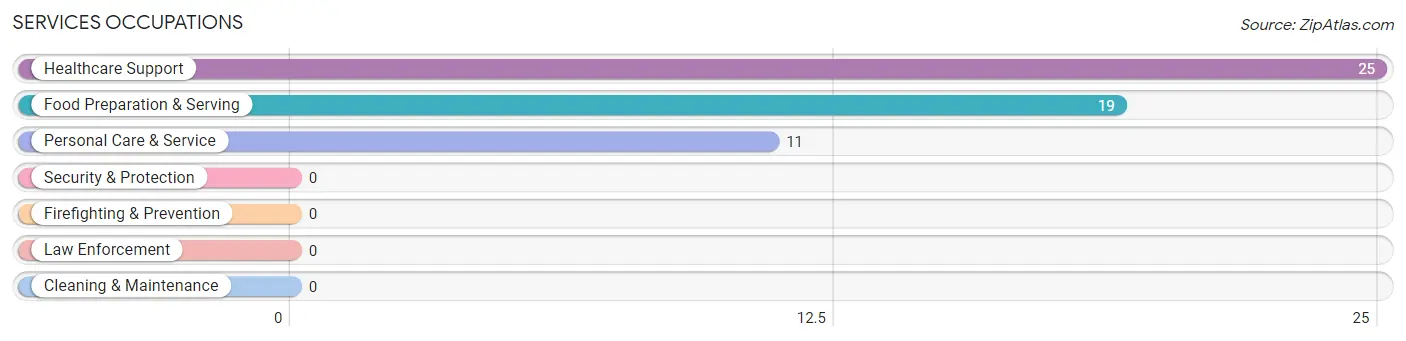
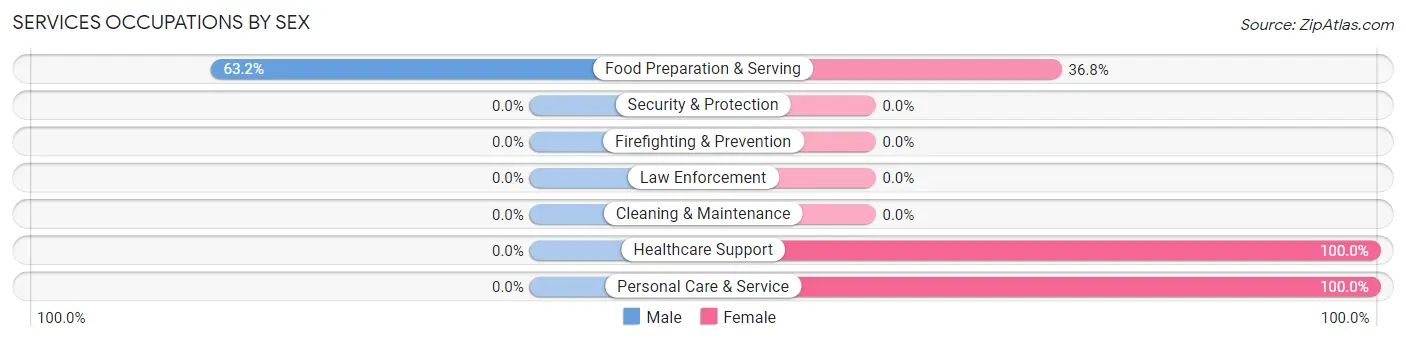
Services Occupations by Sex
| Occupation | Male | Female |
| Healthcare Support | 0 (0.0%) | 25 (100.0%) |
| Security & Protection | 0 (0.0%) | 0 (0.0%) |
| Firefighting & Prevention | 0 (0.0%) | 0 (0.0%) |
| Law Enforcement | 0 (0.0%) | 0 (0.0%) |
| Food Preparation & Serving | 12 (63.2%) | 7 (36.8%) |
| Cleaning & Maintenance | 0 (0.0%) | 0 (0.0%) |
| Personal Care & Service | 0 (0.0%) | 11 (100.0%) |
| Total (Category) | 12 (21.8%) | 43 (78.2%) |
| Total (Overall) | 156 (41.5%) | 220 (58.5%) |
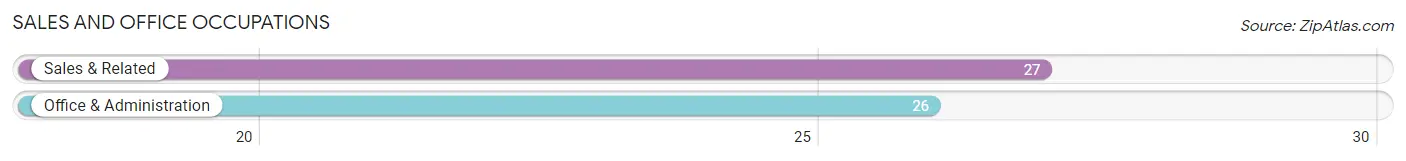
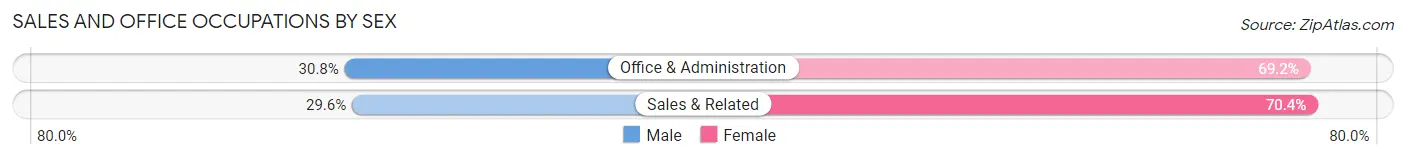
Sales and Office Occupations
The most common Sales and Office occupations in Amana are Sales & Related (27 | 7.2%), and Office & Administration (26 | 6.9%).
Sales and Office Occupations by Sex
| Occupation | Male | Female |
| Sales & Related | 8 (29.6%) | 19 (70.4%) |
| Office & Administration | 8 (30.8%) | 18 (69.2%) |
| Total (Category) | 16 (30.2%) | 37 (69.8%) |
| Total (Overall) | 156 (41.5%) | 220 (58.5%) |
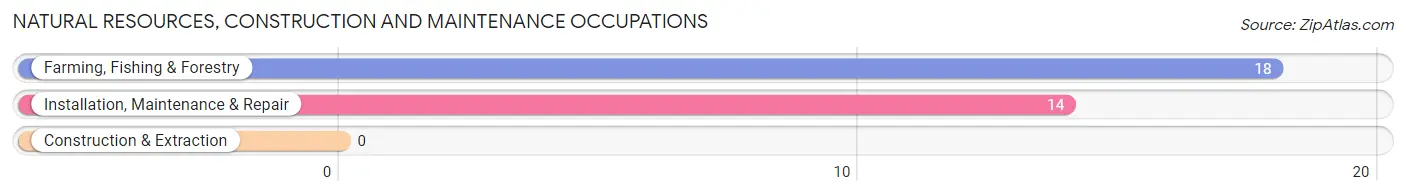
Natural Resources, Construction and Maintenance Occupations
The most common Natural Resources, Construction and Maintenance occupations in Amana are Farming, Fishing & Forestry (18 | 4.8%), and Installation, Maintenance & Repair (14 | 3.7%).
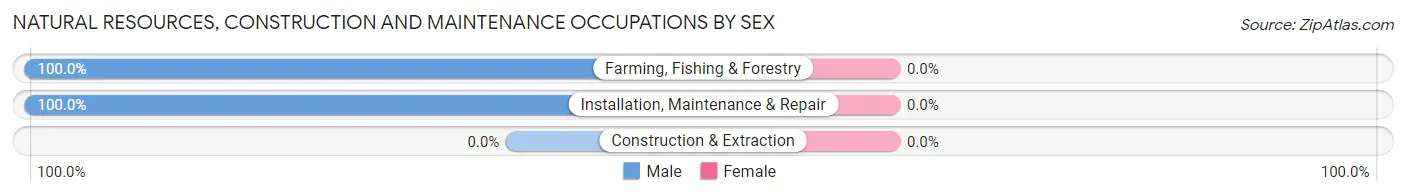
Natural Resources, Construction and Maintenance Occupations by Sex
| Occupation | Male | Female |
| Farming, Fishing & Forestry | 18 (100.0%) | 0 (0.0%) |
| Construction & Extraction | 0 (0.0%) | 0 (0.0%) |
| Installation, Maintenance & Repair | 14 (100.0%) | 0 (0.0%) |
| Total (Category) | 32 (100.0%) | 0 (0.0%) |
| Total (Overall) | 156 (41.5%) | 220 (58.5%) |
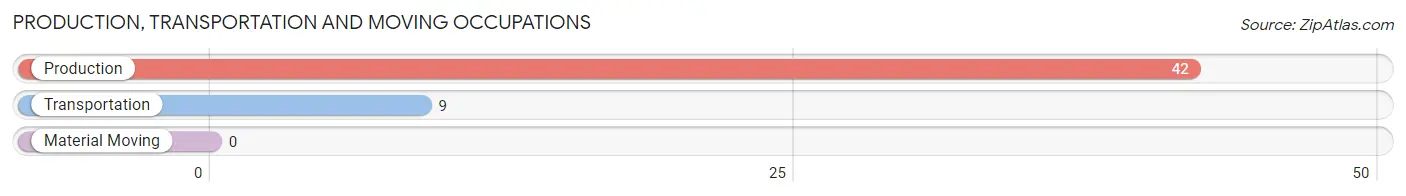
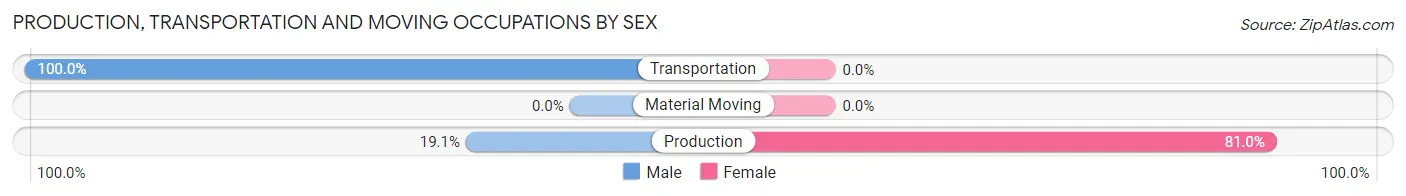
Production, Transportation and Moving Occupations
The most common Production, Transportation and Moving occupations in Amana are Production (42 | 11.2%), and Transportation (9 | 2.4%).
Production, Transportation and Moving Occupations by Sex
| Occupation | Male | Female |
| Production | 8 (19.1%) | 34 (80.9%) |
| Transportation | 9 (100.0%) | 0 (0.0%) |
| Material Moving | 0 (0.0%) | 0 (0.0%) |
| Total (Category) | 17 (33.3%) | 34 (66.7%) |
| Total (Overall) | 156 (41.5%) | 220 (58.5%) |
Employment Industries by Sex in Amana
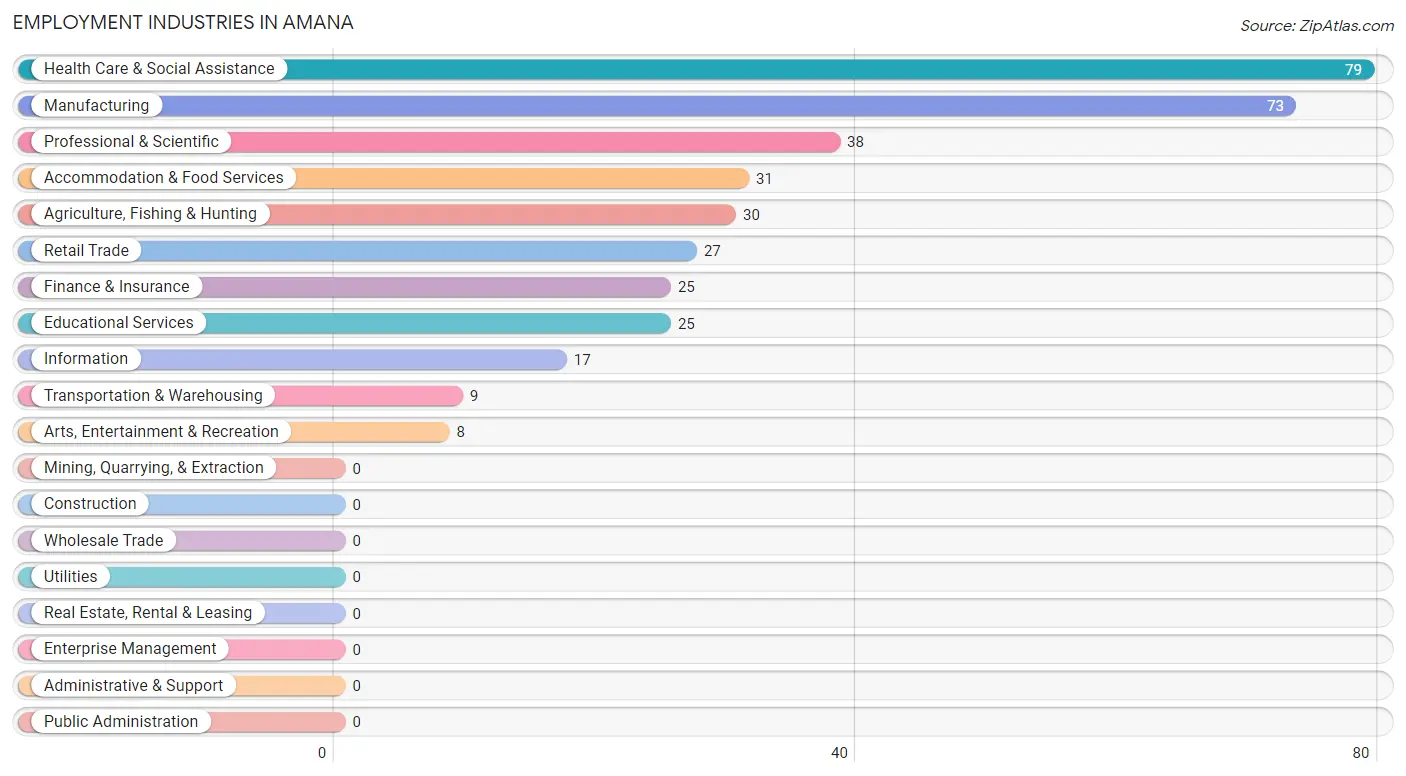
Employment Industries in Amana
The major employment industries in Amana include Health Care & Social Assistance (79 | 21.0%), Manufacturing (73 | 19.4%), Professional & Scientific (38 | 10.1%), Accommodation & Food Services (31 | 8.2%), and Agriculture, Fishing & Hunting (30 | 8.0%).
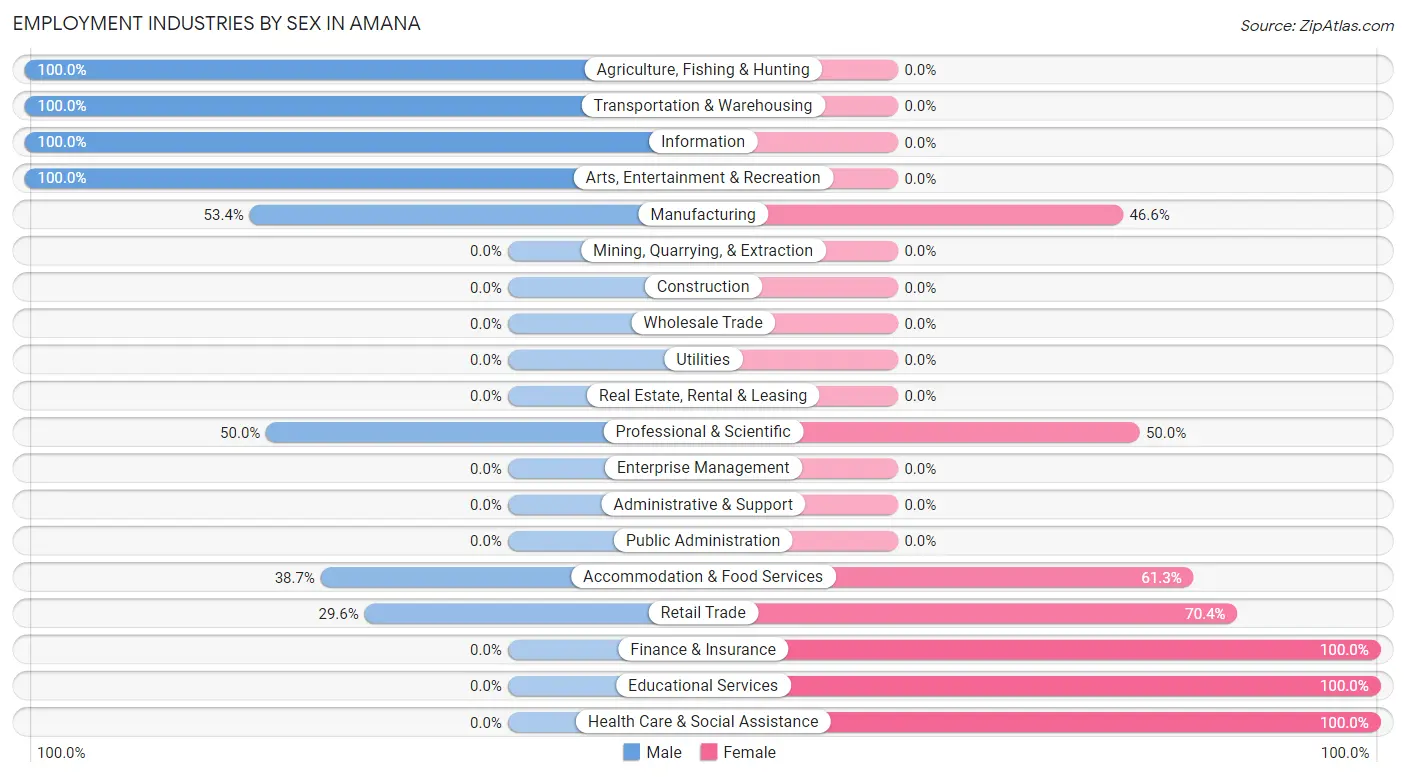
Employment Industries by Sex in Amana
The Amana industries that see more men than women are Agriculture, Fishing & Hunting (100.0%), Transportation & Warehousing (100.0%), and Information (100.0%), whereas the industries that tend to have a higher number of women are Finance & Insurance (100.0%), Educational Services (100.0%), and Health Care & Social Assistance (100.0%).
| Industry | Male | Female |
| Agriculture, Fishing & Hunting | 30 (100.0%) | 0 (0.0%) |
| Mining, Quarrying, & Extraction | 0 (0.0%) | 0 (0.0%) |
| Construction | 0 (0.0%) | 0 (0.0%) |
| Manufacturing | 39 (53.4%) | 34 (46.6%) |
| Wholesale Trade | 0 (0.0%) | 0 (0.0%) |
| Retail Trade | 8 (29.6%) | 19 (70.4%) |
| Transportation & Warehousing | 9 (100.0%) | 0 (0.0%) |
| Utilities | 0 (0.0%) | 0 (0.0%) |
| Information | 17 (100.0%) | 0 (0.0%) |
| Finance & Insurance | 0 (0.0%) | 25 (100.0%) |
| Real Estate, Rental & Leasing | 0 (0.0%) | 0 (0.0%) |
| Professional & Scientific | 19 (50.0%) | 19 (50.0%) |
| Enterprise Management | 0 (0.0%) | 0 (0.0%) |
| Administrative & Support | 0 (0.0%) | 0 (0.0%) |
| Educational Services | 0 (0.0%) | 25 (100.0%) |
| Health Care & Social Assistance | 0 (0.0%) | 79 (100.0%) |
| Arts, Entertainment & Recreation | 8 (100.0%) | 0 (0.0%) |
| Accommodation & Food Services | 12 (38.7%) | 19 (61.3%) |
| Public Administration | 0 (0.0%) | 0 (0.0%) |
| Total | 156 (41.5%) | 220 (58.5%) |
Education in Amana
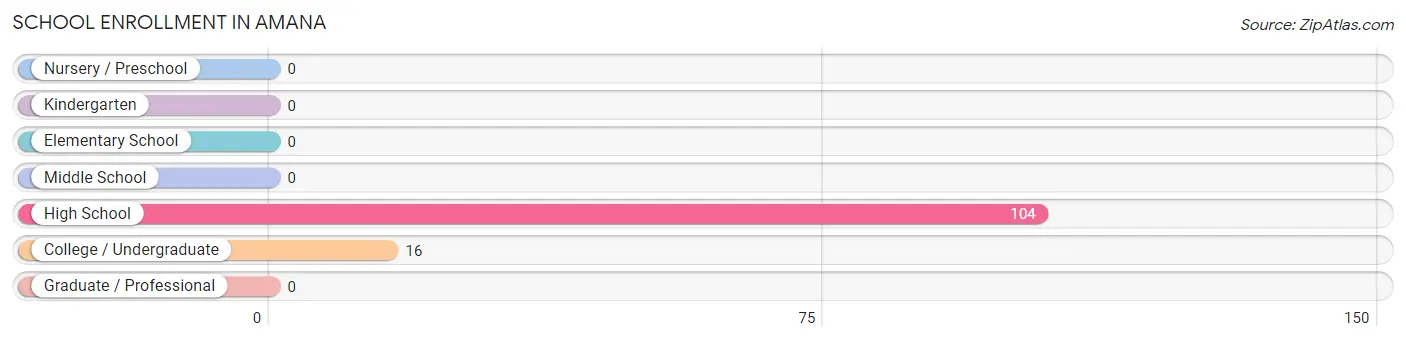
School Enrollment in Amana
The most common levels of schooling among the 120 students in Amana are high school (104 | 86.7%), and college / undergraduate (16 | 13.3%).
| School Level | # Students | % Students |
| Nursery / Preschool | 0 | 0.0% |
| Kindergarten | 0 | 0.0% |
| Elementary School | 0 | 0.0% |
| Middle School | 0 | 0.0% |
| High School | 104 | 86.7% |
| College / Undergraduate | 16 | 13.3% |
| Graduate / Professional | 0 | 0.0% |
| Total | 120 | 100.0% |
School Enrollment by Age by Funding Source in Amana
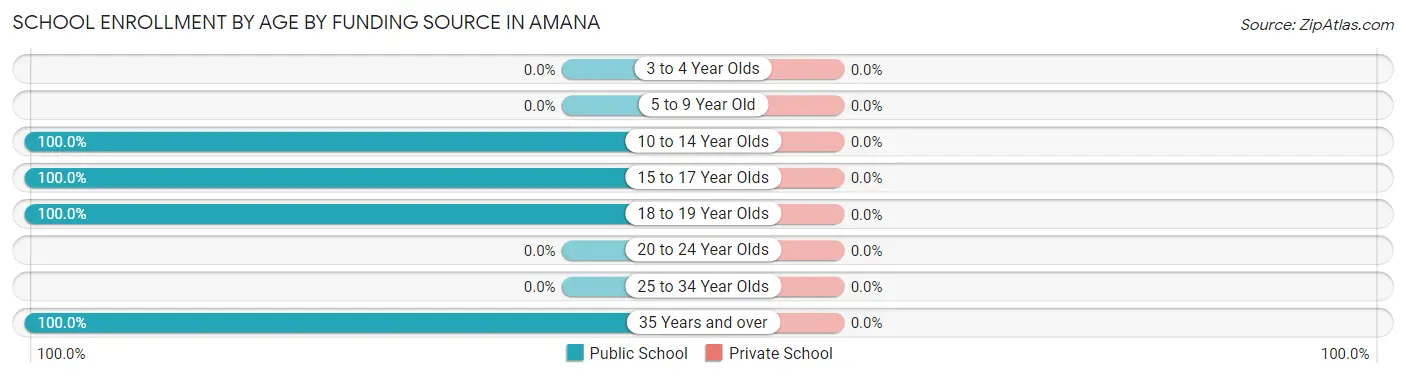
| Age Bracket | Public School | Private School |
| 3 to 4 Year Olds | 0 (0.0%) | 0 (0.0%) |
| 5 to 9 Year Old | 0 (0.0%) | 0 (0.0%) |
| 10 to 14 Year Olds | 40 (100.0%) | 0 (0.0%) |
| 15 to 17 Year Olds | 64 (100.0%) | 0 (0.0%) |
| 18 to 19 Year Olds | 8 (100.0%) | 0 (0.0%) |
| 20 to 24 Year Olds | 0 (0.0%) | 0 (0.0%) |
| 25 to 34 Year Olds | 0 (0.0%) | 0 (0.0%) |
| 35 Years and over | 8 (100.0%) | 0 (0.0%) |
| Total | 120 (100.0%) | 0 (0.0%) |
Educational Attainment by Field of Study in Amana
Business (66 | 25.7%), bio, nature & agricultural (57 | 22.2%), arts & humanities (43 | 16.7%), computers & mathematics (31 | 12.1%), and science & technology (19 | 7.4%) are the most common fields of study among 257 individuals in Amana who have obtained a bachelor's degree or higher.
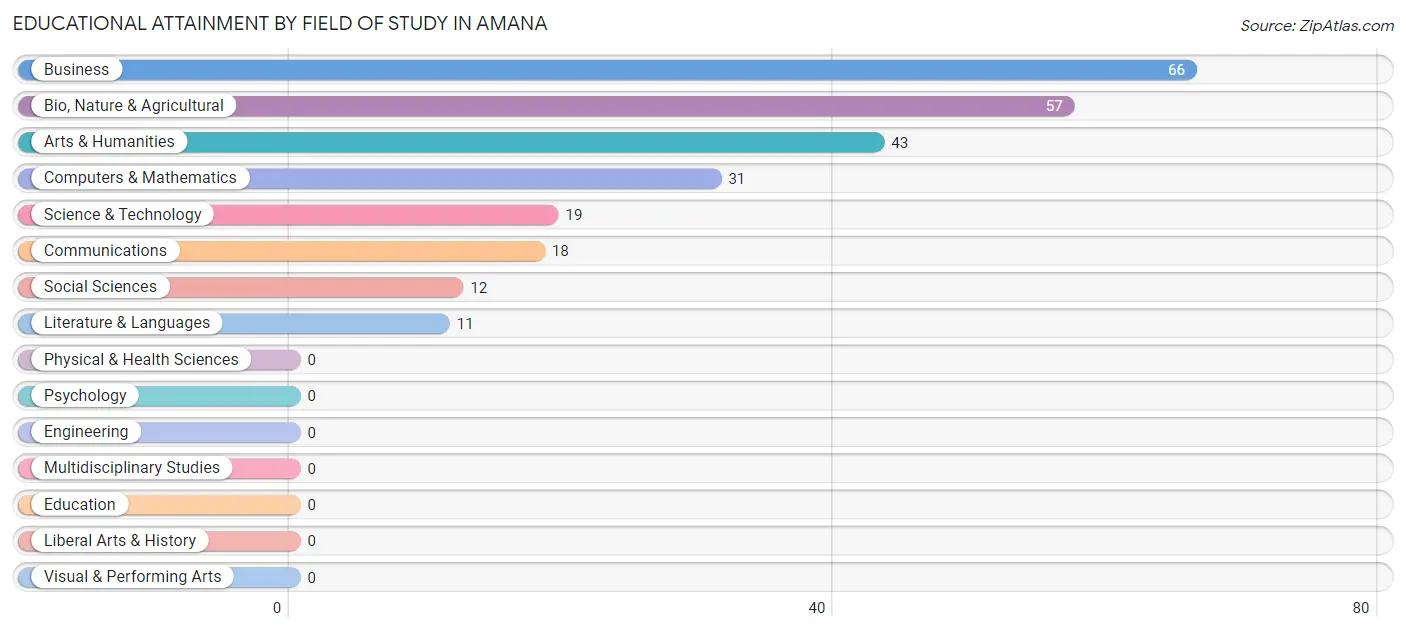
| Field of Study | # Graduates | % Graduates |
| Computers & Mathematics | 31 | 12.1% |
| Bio, Nature & Agricultural | 57 | 22.2% |
| Physical & Health Sciences | 0 | 0.0% |
| Psychology | 0 | 0.0% |
| Social Sciences | 12 | 4.7% |
| Engineering | 0 | 0.0% |
| Multidisciplinary Studies | 0 | 0.0% |
| Science & Technology | 19 | 7.4% |
| Business | 66 | 25.7% |
| Education | 0 | 0.0% |
| Literature & Languages | 11 | 4.3% |
| Liberal Arts & History | 0 | 0.0% |
| Visual & Performing Arts | 0 | 0.0% |
| Communications | 18 | 7.0% |
| Arts & Humanities | 43 | 16.7% |
| Total | 257 | 100.0% |
Transportation & Commute in Amana
Vehicle Availability by Sex in Amana
The most prevalent vehicle ownership categories in Amana are males with 4 vehicles (62, accounting for 39.7%) and females with 4 vehicles (60, making up 31.8%).
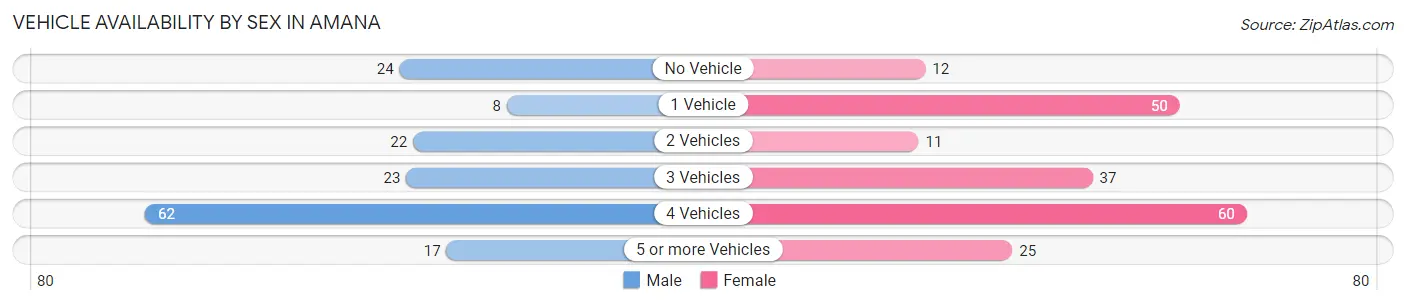
| Vehicles Available | Male | Female |
| No Vehicle | 24 (15.4%) | 12 (6.1%) |
| 1 Vehicle | 8 (5.1%) | 50 (25.6%) |
| 2 Vehicles | 22 (14.1%) | 11 (5.6%) |
| 3 Vehicles | 23 (14.7%) | 37 (19.0%) |
| 4 Vehicles | 62 (39.7%) | 60 (30.8%) |
| 5 or more Vehicles | 17 (10.9%) | 25 (12.8%) |
| Total | 156 (100.0%) | 195 (100.0%) |
Commute Time in Amana
The most frequently occuring commute durations in Amana are 5 to 9 minutes (81 commuters, 29.9%), 30 to 34 minutes (50 commuters, 18.4%), and less than 5 minutes (37 commuters, 13.7%).
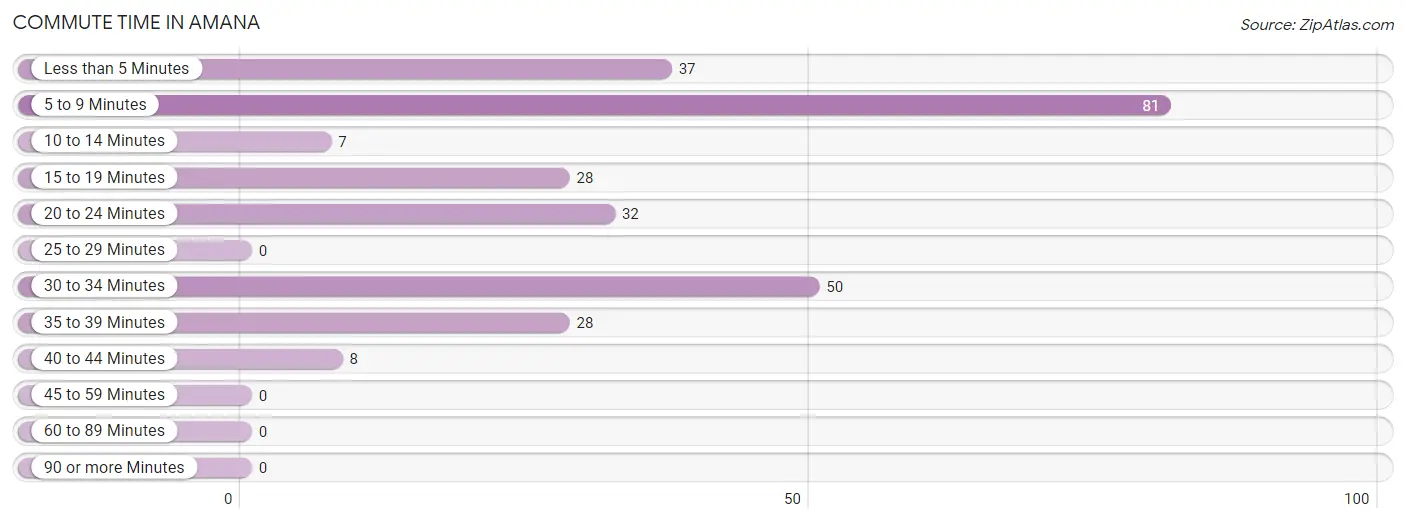
| Commute Time | # Commuters | % Commuters |
| Less than 5 Minutes | 37 | 13.7% |
| 5 to 9 Minutes | 81 | 29.9% |
| 10 to 14 Minutes | 7 | 2.6% |
| 15 to 19 Minutes | 28 | 10.3% |
| 20 to 24 Minutes | 32 | 11.8% |
| 25 to 29 Minutes | 0 | 0.0% |
| 30 to 34 Minutes | 50 | 18.4% |
| 35 to 39 Minutes | 28 | 10.3% |
| 40 to 44 Minutes | 8 | 2.9% |
| 45 to 59 Minutes | 0 | 0.0% |
| 60 to 89 Minutes | 0 | 0.0% |
| 90 or more Minutes | 0 | 0.0% |
Commute Time by Sex in Amana
The most common commute times in Amana are 5 to 9 minutes (58 commuters, 48.3%) for males and less than 5 minutes (37 commuters, 24.5%) for females.
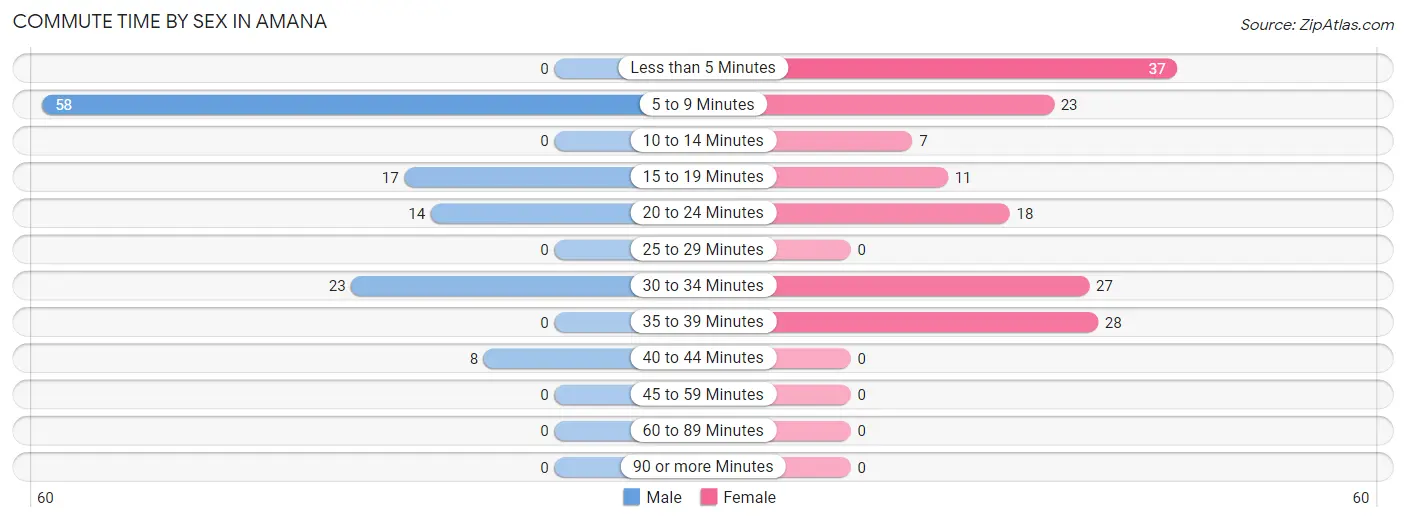
| Commute Time | Male | Female |
| Less than 5 Minutes | 0 (0.0%) | 37 (24.5%) |
| 5 to 9 Minutes | 58 (48.3%) | 23 (15.2%) |
| 10 to 14 Minutes | 0 (0.0%) | 7 (4.6%) |
| 15 to 19 Minutes | 17 (14.2%) | 11 (7.3%) |
| 20 to 24 Minutes | 14 (11.7%) | 18 (11.9%) |
| 25 to 29 Minutes | 0 (0.0%) | 0 (0.0%) |
| 30 to 34 Minutes | 23 (19.2%) | 27 (17.9%) |
| 35 to 39 Minutes | 0 (0.0%) | 28 (18.5%) |
| 40 to 44 Minutes | 8 (6.7%) | 0 (0.0%) |
| 45 to 59 Minutes | 0 (0.0%) | 0 (0.0%) |
| 60 to 89 Minutes | 0 (0.0%) | 0 (0.0%) |
| 90 or more Minutes | 0 (0.0%) | 0 (0.0%) |
Time of Departure to Work by Sex in Amana
The most frequent times of departure to work in Amana are 6:00 AM to 6:29 AM (35, 29.2%) for males and 6:30 AM to 6:59 AM (29, 19.2%) for females.
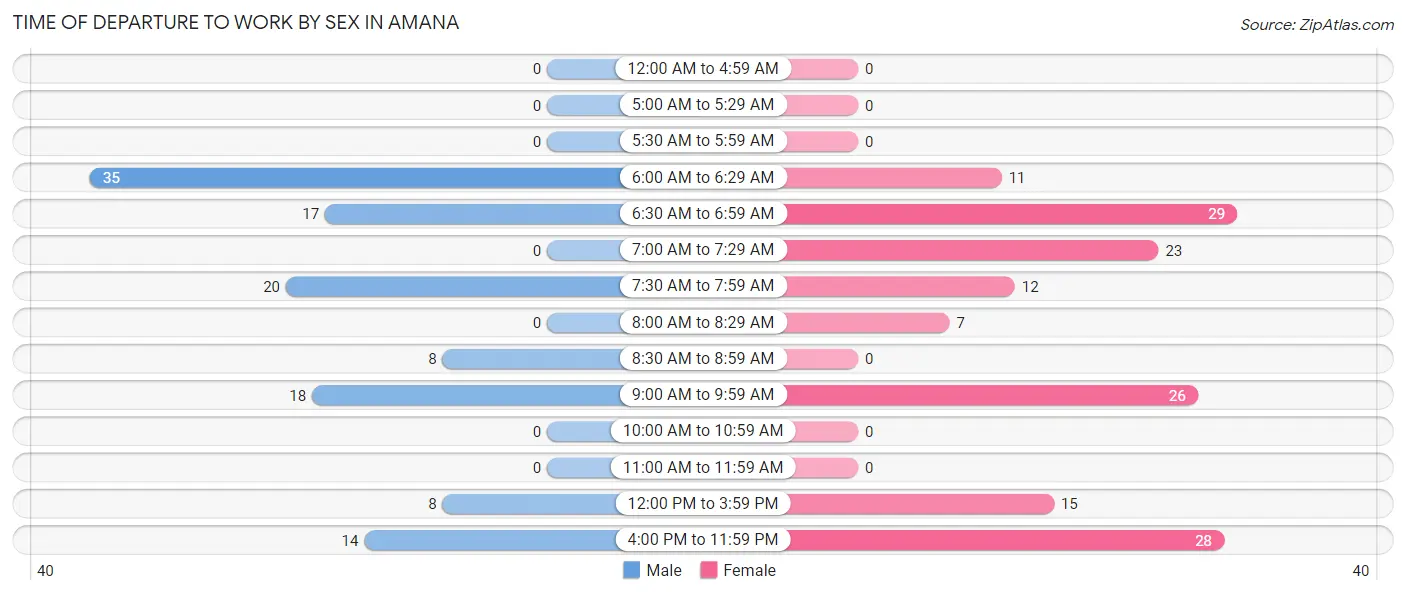
| Time of Departure | Male | Female |
| 12:00 AM to 4:59 AM | 0 (0.0%) | 0 (0.0%) |
| 5:00 AM to 5:29 AM | 0 (0.0%) | 0 (0.0%) |
| 5:30 AM to 5:59 AM | 0 (0.0%) | 0 (0.0%) |
| 6:00 AM to 6:29 AM | 35 (29.2%) | 11 (7.3%) |
| 6:30 AM to 6:59 AM | 17 (14.2%) | 29 (19.2%) |
| 7:00 AM to 7:29 AM | 0 (0.0%) | 23 (15.2%) |
| 7:30 AM to 7:59 AM | 20 (16.7%) | 12 (8.0%) |
| 8:00 AM to 8:29 AM | 0 (0.0%) | 7 (4.6%) |
| 8:30 AM to 8:59 AM | 8 (6.7%) | 0 (0.0%) |
| 9:00 AM to 9:59 AM | 18 (15.0%) | 26 (17.2%) |
| 10:00 AM to 10:59 AM | 0 (0.0%) | 0 (0.0%) |
| 11:00 AM to 11:59 AM | 0 (0.0%) | 0 (0.0%) |
| 12:00 PM to 3:59 PM | 8 (6.7%) | 15 (9.9%) |
| 4:00 PM to 11:59 PM | 14 (11.7%) | 28 (18.5%) |
| Total | 120 (100.0%) | 151 (100.0%) |
Housing Occupancy in Amana
Occupancy by Ownership in Amana
Of the total 244 dwellings in Amana, owner-occupied units account for 201 (82.4%), while renter-occupied units make up 43 (17.6%).
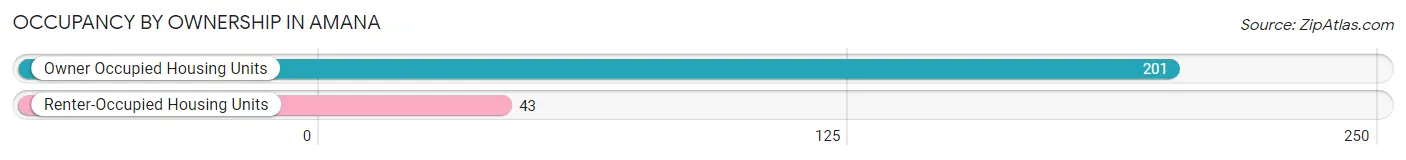
| Occupancy | # Housing Units | % Housing Units |
| Owner Occupied Housing Units | 201 | 82.4% |
| Renter-Occupied Housing Units | 43 | 17.6% |
| Total Occupied Housing Units | 244 | 100.0% |
Occupancy by Household Size in Amana
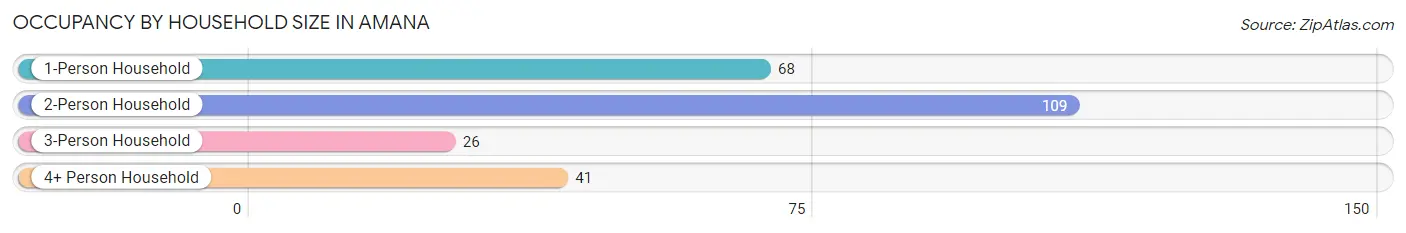
| Household Size | # Housing Units | % Housing Units |
| 1-Person Household | 68 | 27.9% |
| 2-Person Household | 109 | 44.7% |
| 3-Person Household | 26 | 10.7% |
| 4+ Person Household | 41 | 16.8% |
| Total Housing Units | 244 | 100.0% |
Occupancy by Ownership by Household Size in Amana
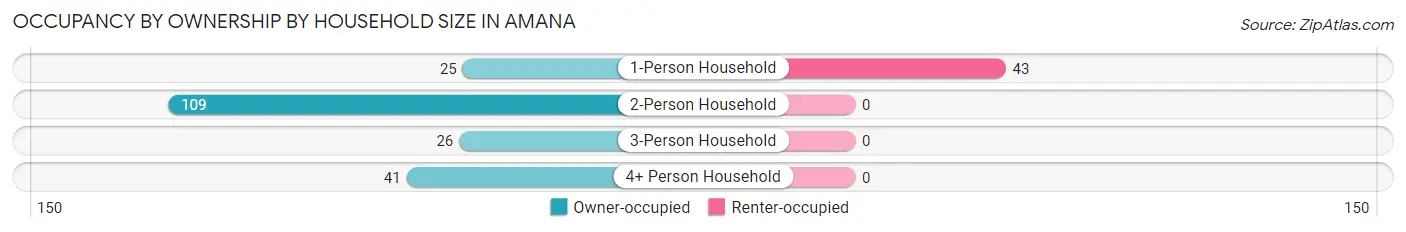
| Household Size | Owner-occupied | Renter-occupied |
| 1-Person Household | 25 (36.8%) | 43 (63.2%) |
| 2-Person Household | 109 (100.0%) | 0 (0.0%) |
| 3-Person Household | 26 (100.0%) | 0 (0.0%) |
| 4+ Person Household | 41 (100.0%) | 0 (0.0%) |
| Total Housing Units | 201 (82.4%) | 43 (17.6%) |
Occupancy by Educational Attainment in Amana
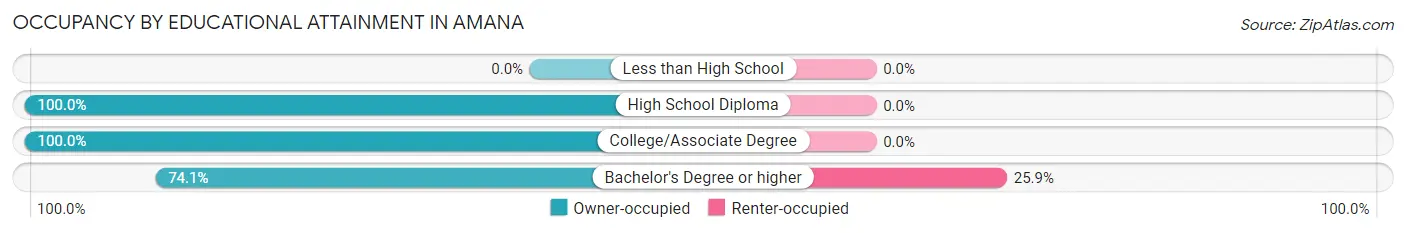
| Household Size | Owner-occupied | Renter-occupied |
| Less than High School | 0 (0.0%) | 0 (0.0%) |
| High School Diploma | 53 (100.0%) | 0 (0.0%) |
| College/Associate Degree | 25 (100.0%) | 0 (0.0%) |
| Bachelor's Degree or higher | 123 (74.1%) | 43 (25.9%) |
Occupancy by Age of Householder in Amana
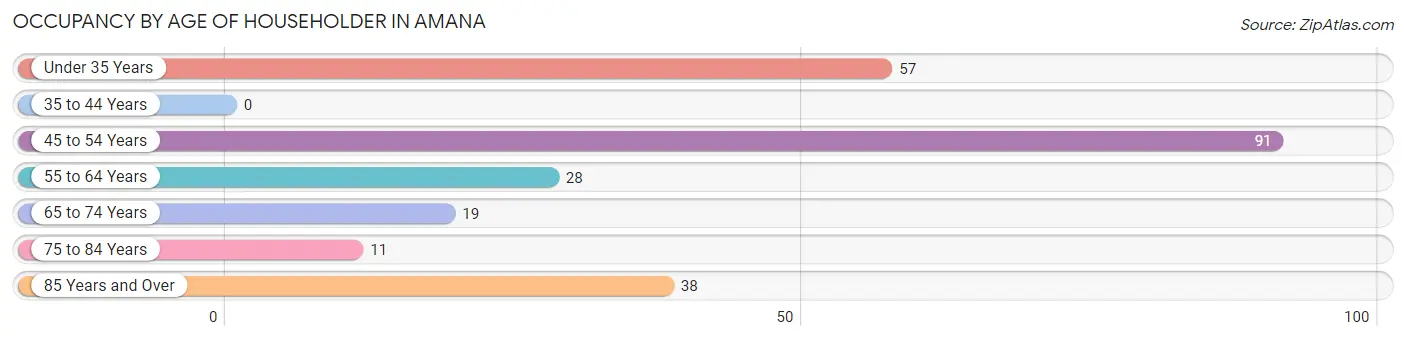
| Age Bracket | # Households | % Households |
| Under 35 Years | 57 | 23.4% |
| 35 to 44 Years | 0 | 0.0% |
| 45 to 54 Years | 91 | 37.3% |
| 55 to 64 Years | 28 | 11.5% |
| 65 to 74 Years | 19 | 7.8% |
| 75 to 84 Years | 11 | 4.5% |
| 85 Years and Over | 38 | 15.6% |
| Total | 244 | 100.0% |
Housing Finances in Amana
Median Income by Occupancy in Amana
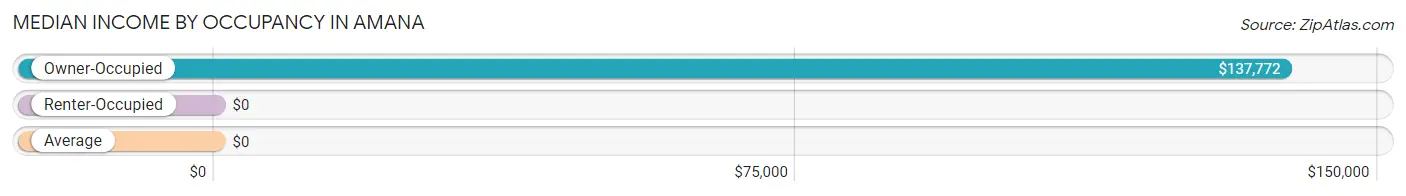
| Occupancy Type | # Households | Median Income |
| Owner-Occupied | 201 (82.4%) | $137,772 |
| Renter-Occupied | 43 (17.6%) | $0 |
| Average | 244 (100.0%) | $0 |
Occupancy by Householder Income Bracket in Amana
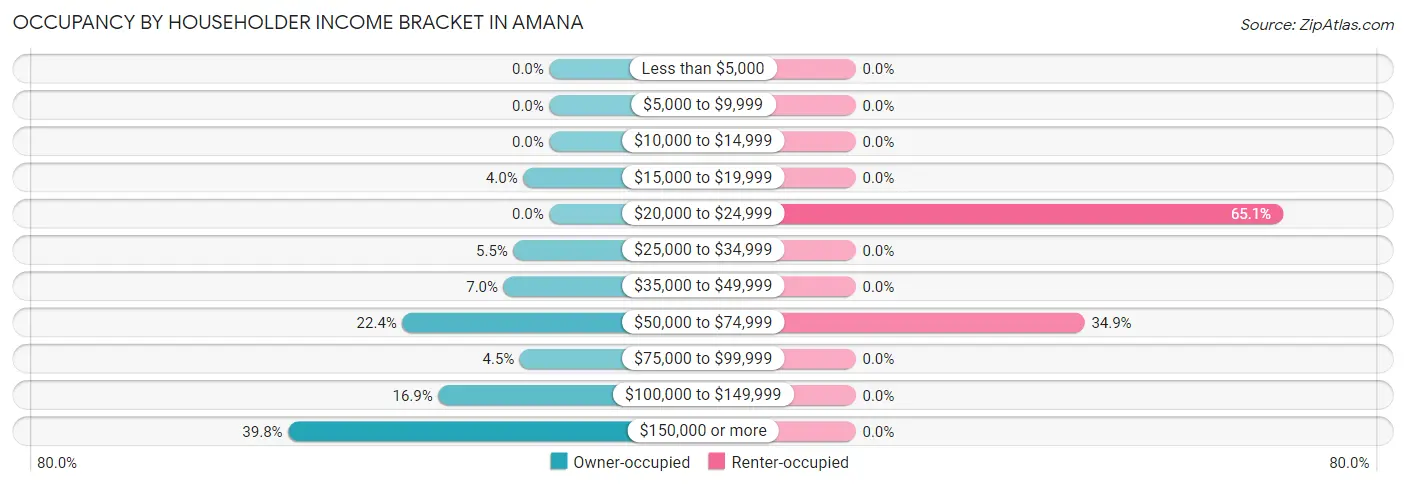
| Income Bracket | Owner-occupied | Renter-occupied |
| Less than $5,000 | 0 (0.0%) | 0 (0.0%) |
| $5,000 to $9,999 | 0 (0.0%) | 0 (0.0%) |
| $10,000 to $14,999 | 0 (0.0%) | 0 (0.0%) |
| $15,000 to $19,999 | 8 (4.0%) | 0 (0.0%) |
| $20,000 to $24,999 | 0 (0.0%) | 28 (65.1%) |
| $25,000 to $34,999 | 11 (5.5%) | 0 (0.0%) |
| $35,000 to $49,999 | 14 (7.0%) | 0 (0.0%) |
| $50,000 to $74,999 | 45 (22.4%) | 15 (34.9%) |
| $75,000 to $99,999 | 9 (4.5%) | 0 (0.0%) |
| $100,000 to $149,999 | 34 (16.9%) | 0 (0.0%) |
| $150,000 or more | 80 (39.8%) | 0 (0.0%) |
| Total | 201 (100.0%) | 43 (100.0%) |
Monthly Housing Cost Tiers in Amana
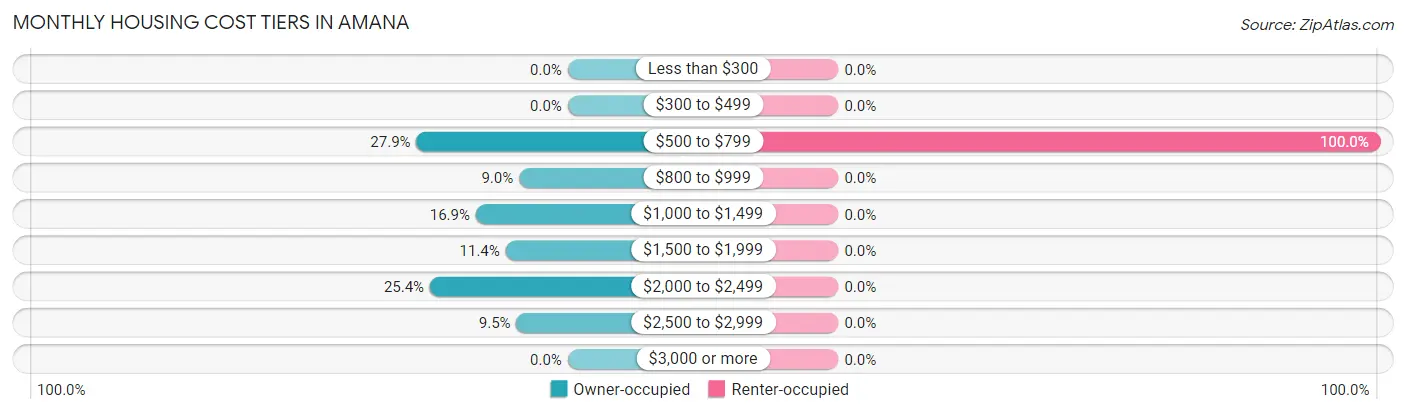
| Monthly Cost | Owner-occupied | Renter-occupied |
| Less than $300 | 0 (0.0%) | 0 (0.0%) |
| $300 to $499 | 0 (0.0%) | 0 (0.0%) |
| $500 to $799 | 56 (27.9%) | 43 (100.0%) |
| $800 to $999 | 18 (9.0%) | 0 (0.0%) |
| $1,000 to $1,499 | 34 (16.9%) | 0 (0.0%) |
| $1,500 to $1,999 | 23 (11.4%) | 0 (0.0%) |
| $2,000 to $2,499 | 51 (25.4%) | 0 (0.0%) |
| $2,500 to $2,999 | 19 (9.5%) | 0 (0.0%) |
| $3,000 or more | 0 (0.0%) | 0 (0.0%) |
| Total | 201 (100.0%) | 43 (100.0%) |
Physical Housing Characteristics in Amana
Housing Structures in Amana
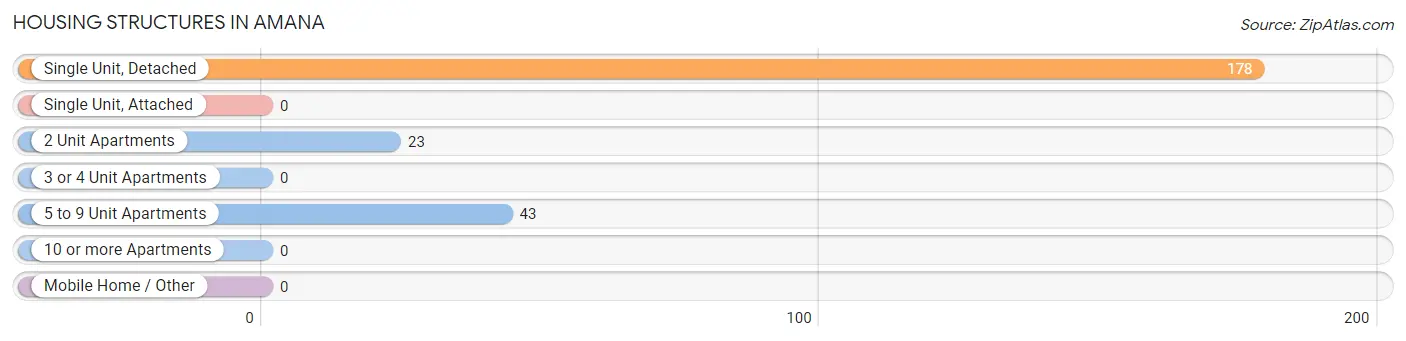
| Structure Type | # Housing Units | % Housing Units |
| Single Unit, Detached | 178 | 73.0% |
| Single Unit, Attached | 0 | 0.0% |
| 2 Unit Apartments | 23 | 9.4% |
| 3 or 4 Unit Apartments | 0 | 0.0% |
| 5 to 9 Unit Apartments | 43 | 17.6% |
| 10 or more Apartments | 0 | 0.0% |
| Mobile Home / Other | 0 | 0.0% |
| Total | 244 | 100.0% |
Housing Structures by Occupancy in Amana
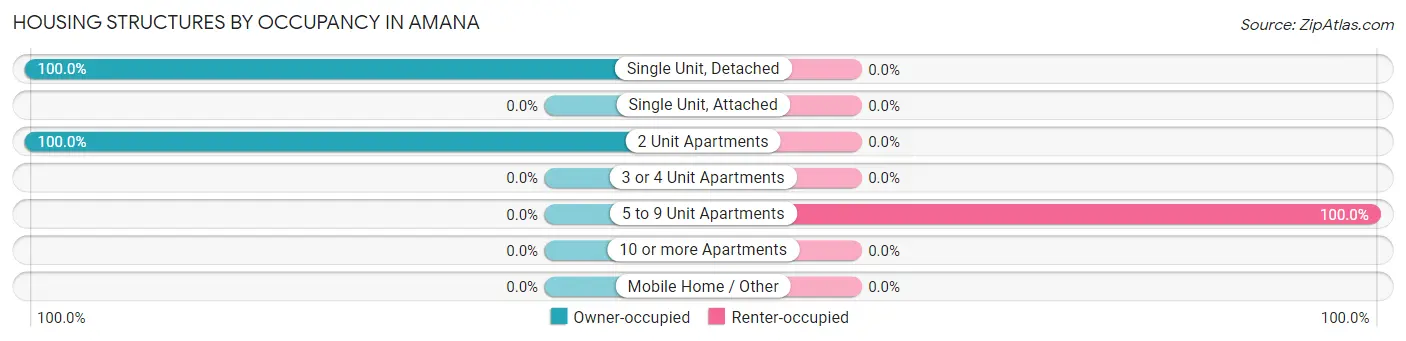
| Structure Type | Owner-occupied | Renter-occupied |
| Single Unit, Detached | 178 (100.0%) | 0 (0.0%) |
| Single Unit, Attached | 0 (0.0%) | 0 (0.0%) |
| 2 Unit Apartments | 23 (100.0%) | 0 (0.0%) |
| 3 or 4 Unit Apartments | 0 (0.0%) | 0 (0.0%) |
| 5 to 9 Unit Apartments | 0 (0.0%) | 43 (100.0%) |
| 10 or more Apartments | 0 (0.0%) | 0 (0.0%) |
| Mobile Home / Other | 0 (0.0%) | 0 (0.0%) |
| Total | 201 (82.4%) | 43 (17.6%) |
Housing Structures by Number of Rooms in Amana
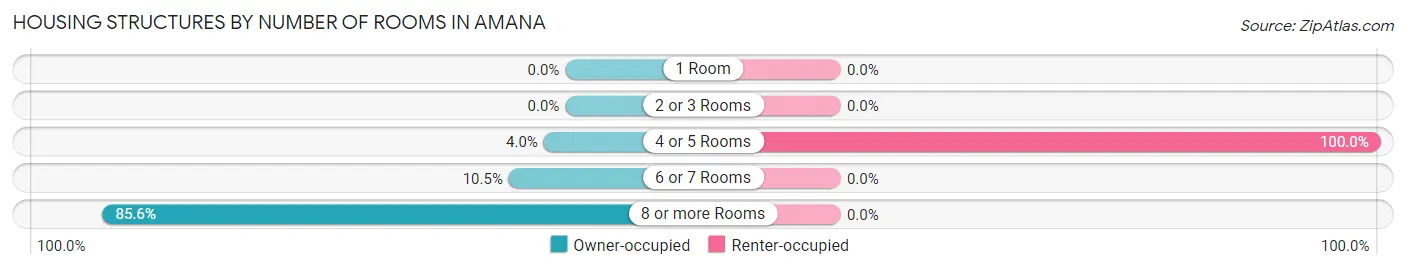
| Number of Rooms | Owner-occupied | Renter-occupied |
| 1 Room | 0 (0.0%) | 0 (0.0%) |
| 2 or 3 Rooms | 0 (0.0%) | 0 (0.0%) |
| 4 or 5 Rooms | 8 (4.0%) | 43 (100.0%) |
| 6 or 7 Rooms | 21 (10.4%) | 0 (0.0%) |
| 8 or more Rooms | 172 (85.6%) | 0 (0.0%) |
| Total | 201 (100.0%) | 43 (100.0%) |
Housing Structure by Heating Type in Amana
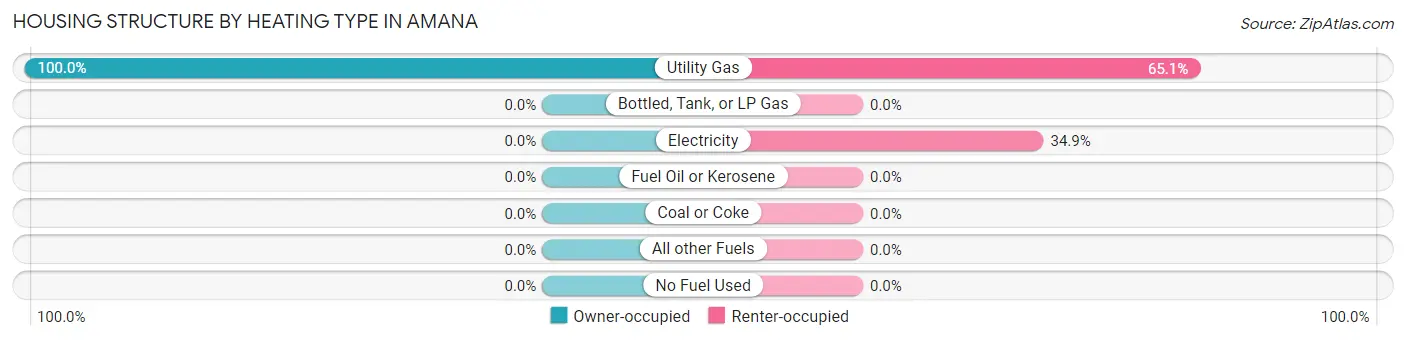
| Heating Type | Owner-occupied | Renter-occupied |
| Utility Gas | 201 (100.0%) | 28 (65.1%) |
| Bottled, Tank, or LP Gas | 0 (0.0%) | 0 (0.0%) |
| Electricity | 0 (0.0%) | 15 (34.9%) |
| Fuel Oil or Kerosene | 0 (0.0%) | 0 (0.0%) |
| Coal or Coke | 0 (0.0%) | 0 (0.0%) |
| All other Fuels | 0 (0.0%) | 0 (0.0%) |
| No Fuel Used | 0 (0.0%) | 0 (0.0%) |
| Total | 201 (100.0%) | 43 (100.0%) |
Household Vehicle Usage in Amana
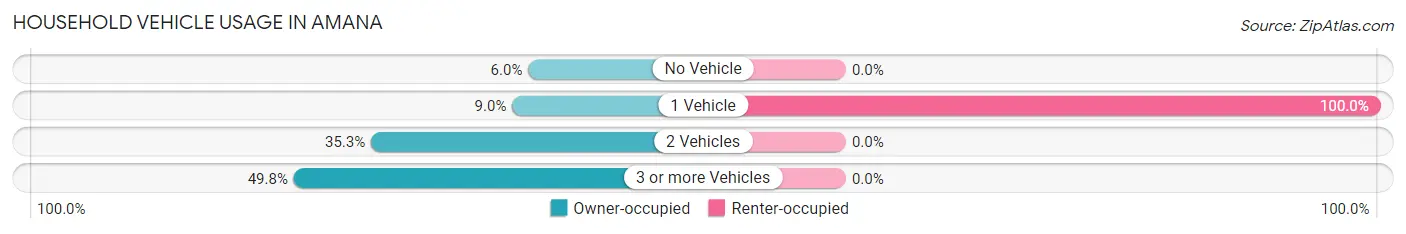
| Vehicles per Household | Owner-occupied | Renter-occupied |
| No Vehicle | 12 (6.0%) | 0 (0.0%) |
| 1 Vehicle | 18 (9.0%) | 43 (100.0%) |
| 2 Vehicles | 71 (35.3%) | 0 (0.0%) |
| 3 or more Vehicles | 100 (49.7%) | 0 (0.0%) |
| Total | 201 (100.0%) | 43 (100.0%) |
Real Estate & Mortgages in Amana
Real Estate and Mortgage Overview in Amana
| Characteristic | Without Mortgage | With Mortgage |
| Housing Units | 74 | 127 |
| Median Property Value | $191,500 | $227,200 |
| Median Household Income | $63,750 | $62 |
| Monthly Housing Costs | $576 | $0 |
| Real Estate Taxes | $2,552 | $0 |
Property Value by Mortgage Status in Amana
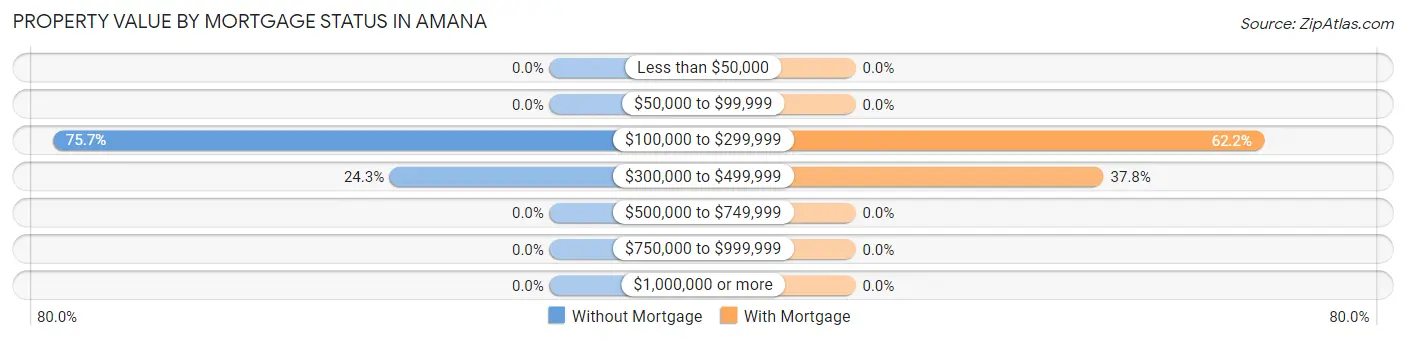
| Property Value | Without Mortgage | With Mortgage |
| Less than $50,000 | 0 (0.0%) | 0 (0.0%) |
| $50,000 to $99,999 | 0 (0.0%) | 0 (0.0%) |
| $100,000 to $299,999 | 56 (75.7%) | 79 (62.2%) |
| $300,000 to $499,999 | 18 (24.3%) | 48 (37.8%) |
| $500,000 to $749,999 | 0 (0.0%) | 0 (0.0%) |
| $750,000 to $999,999 | 0 (0.0%) | 0 (0.0%) |
| $1,000,000 or more | 0 (0.0%) | 0 (0.0%) |
| Total | 74 (100.0%) | 127 (100.0%) |
Household Income by Mortgage Status in Amana
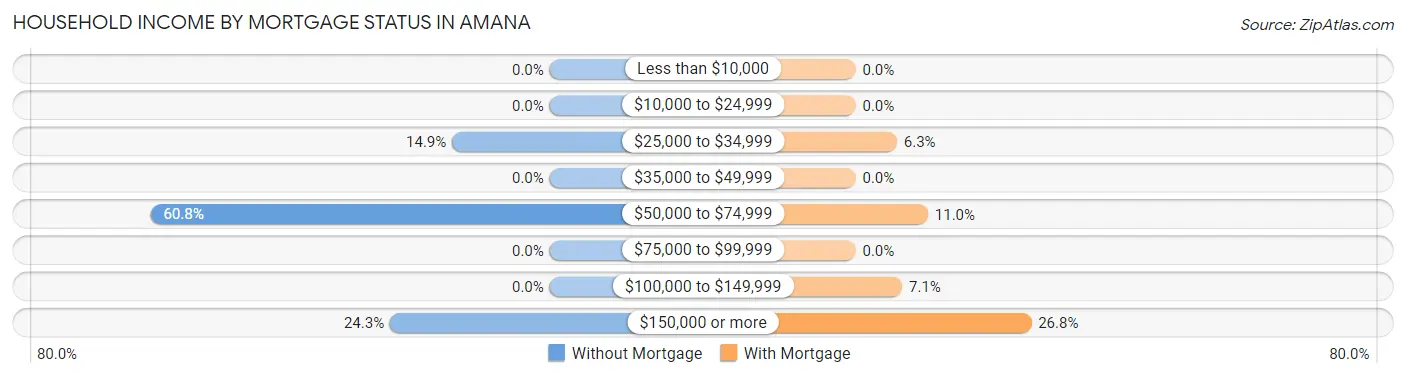
| Household Income | Without Mortgage | With Mortgage |
| Less than $10,000 | 0 (0.0%) | 0 (0.0%) |
| $10,000 to $24,999 | 0 (0.0%) | 0 (0.0%) |
| $25,000 to $34,999 | 11 (14.9%) | 8 (6.3%) |
| $35,000 to $49,999 | 0 (0.0%) | 0 (0.0%) |
| $50,000 to $74,999 | 45 (60.8%) | 14 (11.0%) |
| $75,000 to $99,999 | 0 (0.0%) | 0 (0.0%) |
| $100,000 to $149,999 | 0 (0.0%) | 9 (7.1%) |
| $150,000 or more | 18 (24.3%) | 34 (26.8%) |
| Total | 74 (100.0%) | 127 (100.0%) |
Property Value to Household Income Ratio in Amana
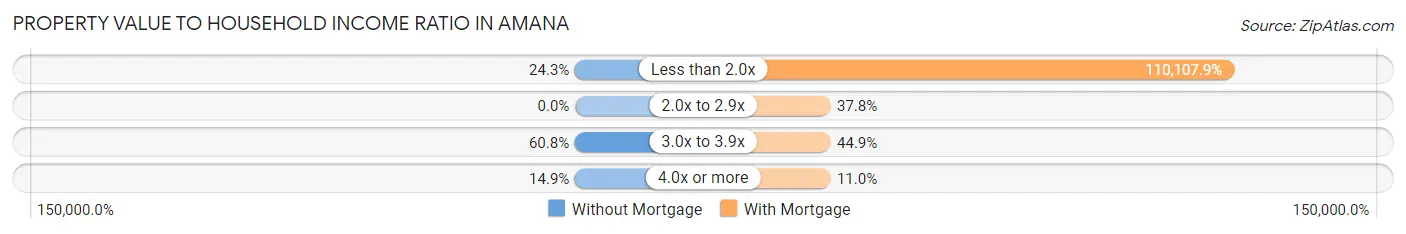
| Value-to-Income Ratio | Without Mortgage | With Mortgage |
| Less than 2.0x | 18 (24.3%) | 139,837 (110,107.9%) |
| 2.0x to 2.9x | 0 (0.0%) | 48 (37.8%) |
| 3.0x to 3.9x | 45 (60.8%) | 57 (44.9%) |
| 4.0x or more | 11 (14.9%) | 14 (11.0%) |
| Total | 74 (100.0%) | 127 (100.0%) |
Real Estate Taxes by Mortgage Status in Amana
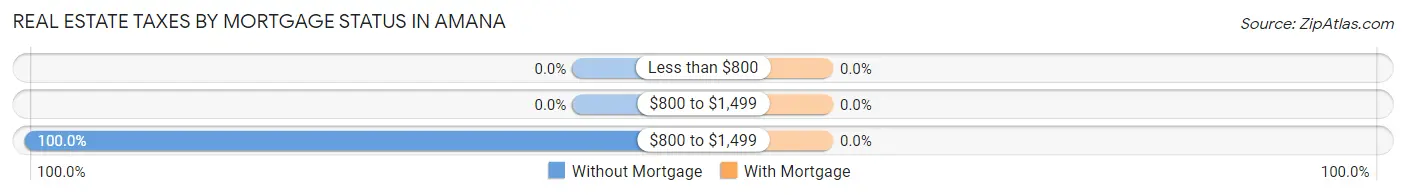
| Property Taxes | Without Mortgage | With Mortgage |
| Less than $800 | 0 (0.0%) | 0 (0.0%) |
| $800 to $1,499 | 0 (0.0%) | 0 (0.0%) |
| $800 to $1,499 | 74 (100.0%) | 0 (0.0%) |
| Total | 74 (100.0%) | 127 (100.0%) |
Health & Disability in Amana
Health Insurance Coverage by Age in Amana
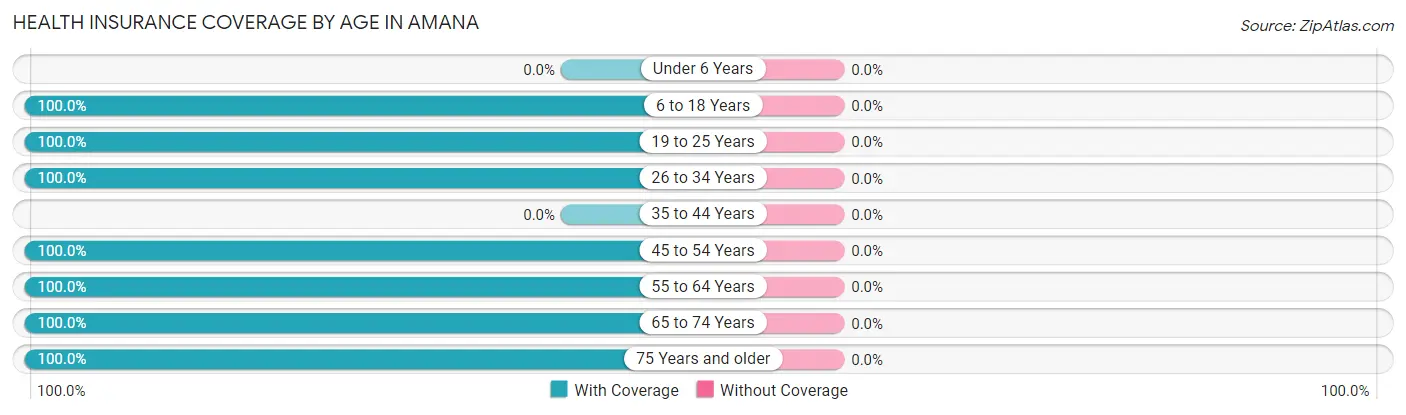
| Age Bracket | With Coverage | Without Coverage |
| Under 6 Years | 0 (0.0%) | 0 (0.0%) |
| 6 to 18 Years | 104 (100.0%) | 0 (0.0%) |
| 19 to 25 Years | 52 (100.0%) | 0 (0.0%) |
| 26 to 34 Years | 57 (100.0%) | 0 (0.0%) |
| 35 to 44 Years | 0 (0.0%) | 0 (0.0%) |
| 45 to 54 Years | 163 (100.0%) | 0 (0.0%) |
| 55 to 64 Years | 43 (100.0%) | 0 (0.0%) |
| 65 to 74 Years | 38 (100.0%) | 0 (0.0%) |
| 75 Years and older | 99 (100.0%) | 0 (0.0%) |
| Total | 556 (100.0%) | 0 (0.0%) |
Health Insurance Coverage by Citizenship Status in Amana
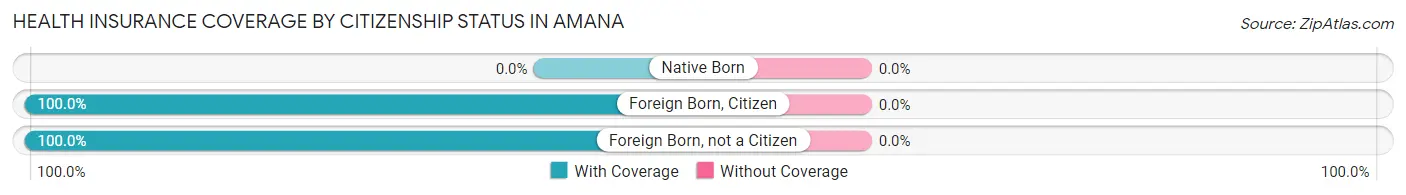
| Citizenship Status | With Coverage | Without Coverage |
| Native Born | 0 (0.0%) | 0 (0.0%) |
| Foreign Born, Citizen | 104 (100.0%) | 0 (0.0%) |
| Foreign Born, not a Citizen | 52 (100.0%) | 0 (0.0%) |
Health Insurance Coverage by Household Income in Amana
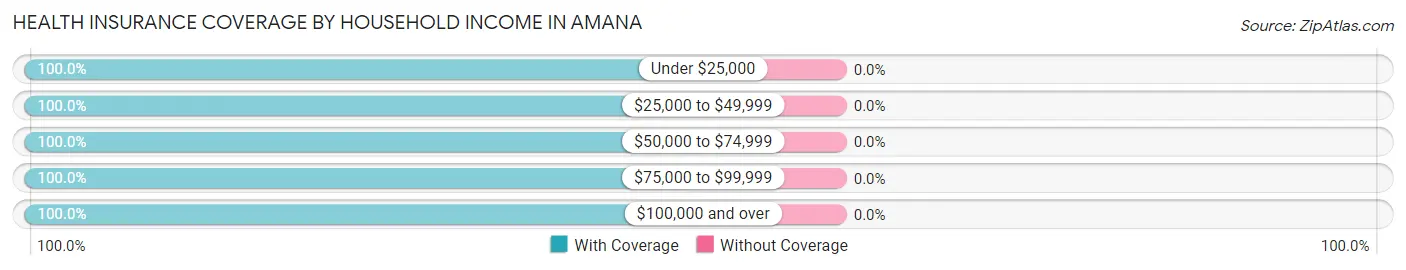
| Household Income | With Coverage | Without Coverage |
| Under $25,000 | 43 (100.0%) | 0 (0.0%) |
| $25,000 to $49,999 | 25 (100.0%) | 0 (0.0%) |
| $50,000 to $74,999 | 104 (100.0%) | 0 (0.0%) |
| $75,000 to $99,999 | 16 (100.0%) | 0 (0.0%) |
| $100,000 and over | 368 (100.0%) | 0 (0.0%) |
Public vs Private Health Insurance Coverage by Age in Amana
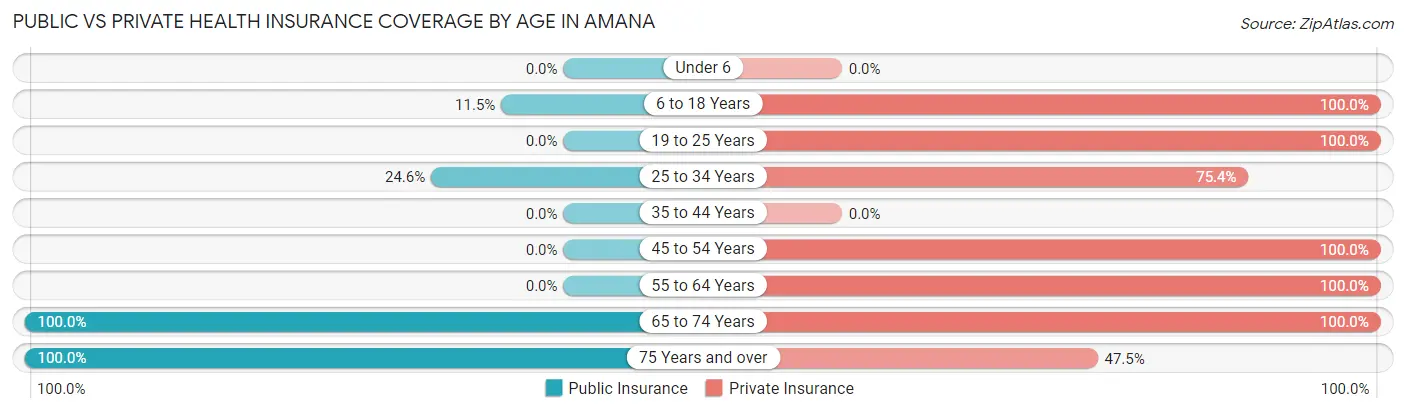
| Age Bracket | Public Insurance | Private Insurance |
| Under 6 | 0 (0.0%) | 0 (0.0%) |
| 6 to 18 Years | 12 (11.5%) | 104 (100.0%) |
| 19 to 25 Years | 0 (0.0%) | 52 (100.0%) |
| 25 to 34 Years | 14 (24.6%) | 43 (75.4%) |
| 35 to 44 Years | 0 (0.0%) | 0 (0.0%) |
| 45 to 54 Years | 0 (0.0%) | 163 (100.0%) |
| 55 to 64 Years | 0 (0.0%) | 43 (100.0%) |
| 65 to 74 Years | 38 (100.0%) | 38 (100.0%) |
| 75 Years and over | 99 (100.0%) | 47 (47.5%) |
| Total | 163 (29.3%) | 490 (88.1%) |
Disability Status by Sex by Age in Amana
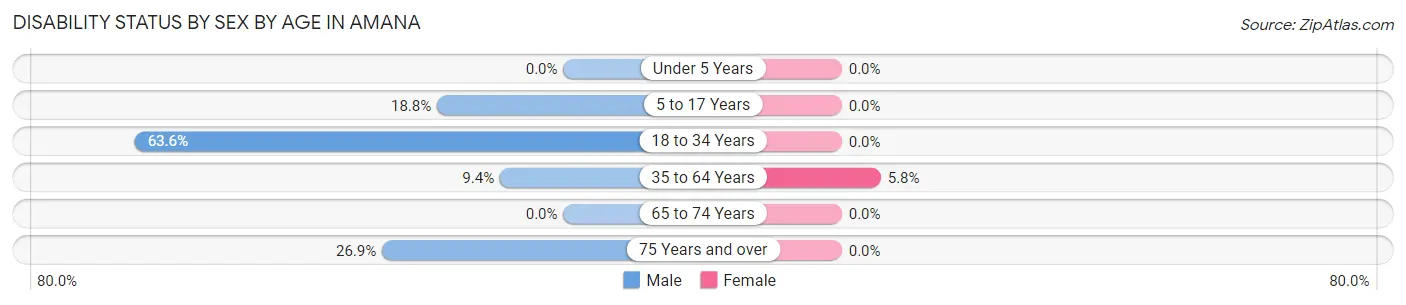
| Age Bracket | Male | Female |
| Under 5 Years | 0 (0.0%) | 0 (0.0%) |
| 5 to 17 Years | 12 (18.8%) | 0 (0.0%) |
| 18 to 34 Years | 14 (63.6%) | 0 (0.0%) |
| 35 to 64 Years | 8 (9.4%) | 7 (5.8%) |
| 65 to 74 Years | 0 (0.0%) | 0 (0.0%) |
| 75 Years and over | 14 (26.9%) | 0 (0.0%) |
Disability Class by Sex by Age in Amana
Disability Class: Hearing Difficulty
| Age Bracket | Male | Female |
| Under 5 Years | 0 (0.0%) | 0 (0.0%) |
| 5 to 17 Years | 0 (0.0%) | 0 (0.0%) |
| 18 to 34 Years | 0 (0.0%) | 0 (0.0%) |
| 35 to 64 Years | 0 (0.0%) | 0 (0.0%) |
| 65 to 74 Years | 0 (0.0%) | 0 (0.0%) |
| 75 Years and over | 0 (0.0%) | 0 (0.0%) |
Disability Class: Vision Difficulty
| Age Bracket | Male | Female |
| Under 5 Years | 0 (0.0%) | 0 (0.0%) |
| 5 to 17 Years | 0 (0.0%) | 0 (0.0%) |
| 18 to 34 Years | 0 (0.0%) | 0 (0.0%) |
| 35 to 64 Years | 0 (0.0%) | 0 (0.0%) |
| 65 to 74 Years | 0 (0.0%) | 0 (0.0%) |
| 75 Years and over | 0 (0.0%) | 0 (0.0%) |
Disability Class: Cognitive Difficulty
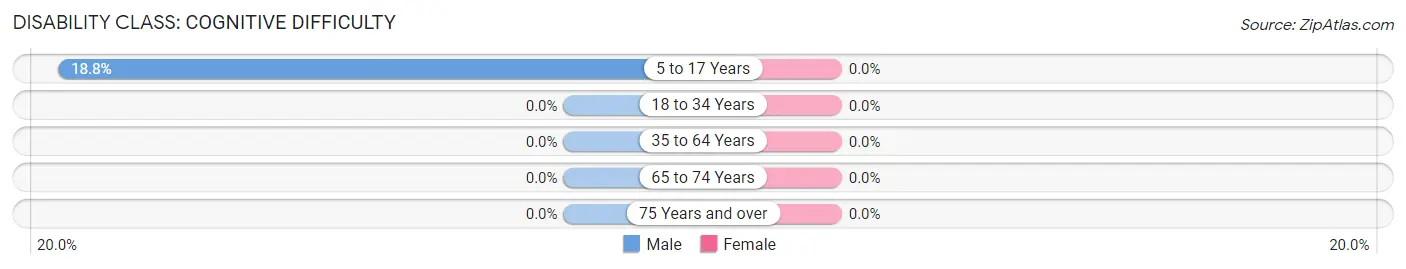
| Age Bracket | Male | Female |
| 5 to 17 Years | 12 (18.8%) | 0 (0.0%) |
| 18 to 34 Years | 0 (0.0%) | 0 (0.0%) |
| 35 to 64 Years | 0 (0.0%) | 0 (0.0%) |
| 65 to 74 Years | 0 (0.0%) | 0 (0.0%) |
| 75 Years and over | 0 (0.0%) | 0 (0.0%) |
Disability Class: Ambulatory Difficulty
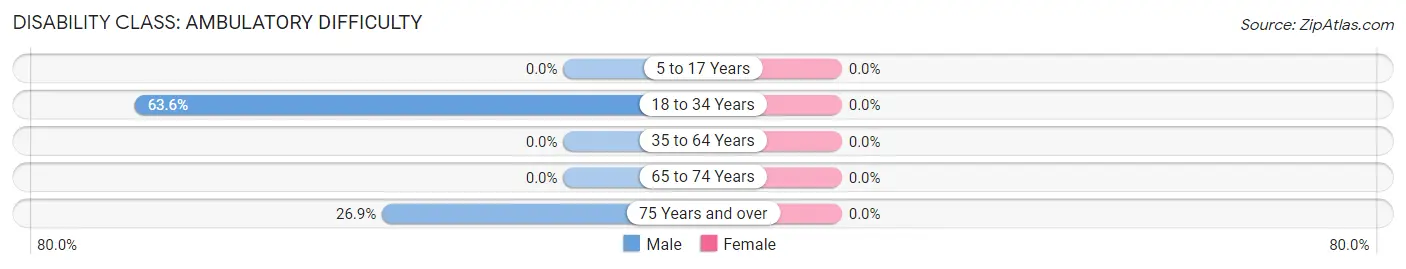
| Age Bracket | Male | Female |
| 5 to 17 Years | 0 (0.0%) | 0 (0.0%) |
| 18 to 34 Years | 14 (63.6%) | 0 (0.0%) |
| 35 to 64 Years | 0 (0.0%) | 0 (0.0%) |
| 65 to 74 Years | 0 (0.0%) | 0 (0.0%) |
| 75 Years and over | 14 (26.9%) | 0 (0.0%) |
Disability Class: Self-Care Difficulty
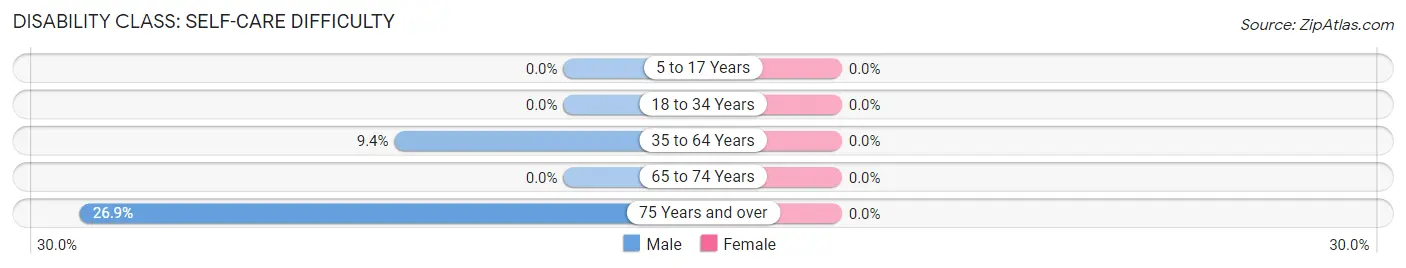
| Age Bracket | Male | Female |
| 5 to 17 Years | 0 (0.0%) | 0 (0.0%) |
| 18 to 34 Years | 0 (0.0%) | 0 (0.0%) |
| 35 to 64 Years | 8 (9.4%) | 0 (0.0%) |
| 65 to 74 Years | 0 (0.0%) | 0 (0.0%) |
| 75 Years and over | 14 (26.9%) | 0 (0.0%) |
Technology Access in Amana
Computing Device Access in Amana
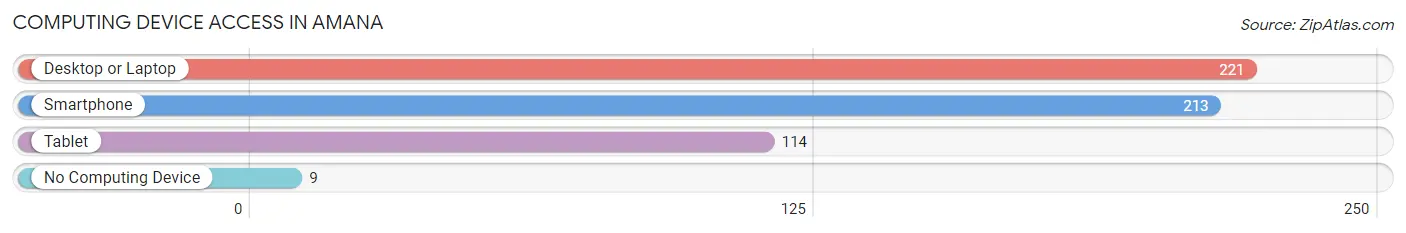
| Device Type | # Households | % Households |
| Desktop or Laptop | 221 | 90.6% |
| Smartphone | 213 | 87.3% |
| Tablet | 114 | 46.7% |
| No Computing Device | 9 | 3.7% |
| Total | 244 | 100.0% |
Internet Access in Amana
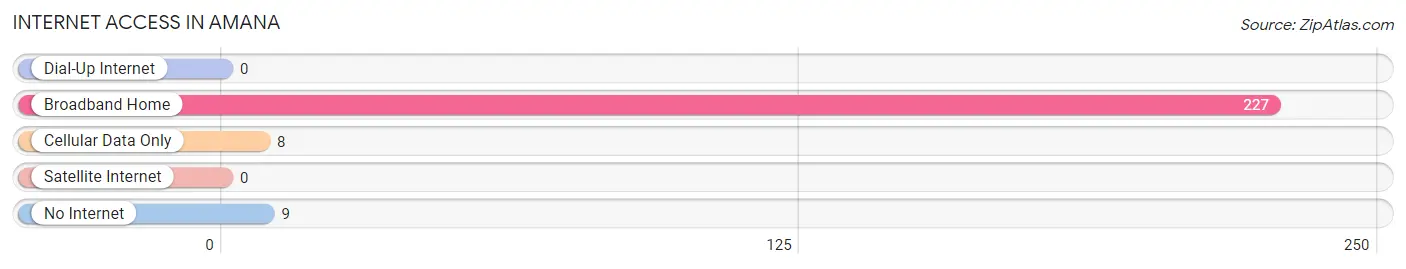
| Internet Type | # Households | % Households |
| Dial-Up Internet | 0 | 0.0% |
| Broadband Home | 227 | 93.0% |
| Cellular Data Only | 8 | 3.3% |
| Satellite Internet | 0 | 0.0% |
| No Internet | 9 | 3.7% |
| Total | 244 | 100.0% |
Amana Summary
Amana, Iowa is a small town located in Iowa County, Iowa, United States. It is part of the Iowa City, Iowa Metropolitan Statistical Area. The population was 645 at the 2010 census.
History
Amana was founded in 1855 by a group of German Pietists who had emigrated from Germany in the early 19th century. The group, known as the Community of True Inspiration, had been living in New York and Pennsylvania before settling in Iowa. The group was led by Christian Metz, who had been inspired by the teachings of Johann Friedrich Rock, a German religious leader. The group purchased 6,000 acres of land in Iowa and established seven villages, which they named Amana, East Amana, High Amana, Middle Amana, South Amana, West Amana, and Homestead.
The Amana Colonies were established as a communal society, with all members living and working together. The group practiced a form of communal living, in which all members shared in the work and the profits. The group also practiced a form of religious worship, which included singing hymns and praying together.
The Amana Colonies were self-sufficient, with members growing their own food, making their own clothing, and building their own homes. The group also operated a number of businesses, including a woolen mill, a sawmill, a furniture factory, a bakery, and a general store.
The Amana Colonies were a successful and prosperous community for many years. However, in 1932, the group decided to dissolve the communal system and adopt a more modern form of living. The group divided the land among the members and allowed them to own their own homes and businesses.
Geography
Amana is located at 41°45'17" North, 91°45'45" West (41.754722, -91.762500). According to the United States Census Bureau, the town has a total area of 0.6 square miles (1.6 km2), all of it land.
Economy
Amana is a small town with a population of 645 people. The town is home to a number of small businesses, including a grocery store, a hardware store, a restaurant, and a few other small shops. The town is also home to a number of tourist attractions, including the Amana Colonies, a historic district that includes seven villages that were founded by German Pietists in the mid-19th century.
The town is also home to a number of manufacturing companies, including Amana Refrigeration, which produces refrigerators and other appliances, and Amana Tool, which produces cutting tools.
Demographics
As of the 2010 census, there were 645 people, 256 households, and 175 families living in Amana. The population density was 1,072.2 people per square mile (414.7/km2). There were 266 housing units at an average density of 441.7 per square mile (170.3/km2). The racial makeup of the town was 97.7% White, 0.2% African American, 0.2% Native American, 0.2% Asian, 0.2% from other races, and 1.6% from two or more races. Hispanic or Latino of any race were 1.2% of the population.
There were 256 households, out of which 28.9% had children under the age of 18 living with them, 54.3% were married couples living together, 8.2% had a female householder with no husband present, and 33.2% were non-families. 28.9% of all households were made up of individuals, and 11.7% had someone living alone who was 65 years of age or older. The average household size was 2.51 and the average family size was 3.09.
In the town, the population was spread out, with 25.2% under the age of 18, 6.2% from 18 to 24, 25.2% from 25 to 44, 28.2% from 45 to 64, and 15.2% who were 65 years of age or older. The median age was 40 years. For every 100 females, there were 97.2 males. For every 100 females age 18 and over, there were 94.3 males.
The median income for a household in the town was $45,000, and the median income for a family was $50,000. Males had a median income of $31,250 versus $25,000 for females. The per capita income for the town was $20,945. About 4.2% of families and 5.2% of the population were below the poverty line, including 6.3% of those under age 18 and 4.2% of those age 65 or over.
Common Questions
What is Per Capita Income in Amana?
Per Capita income in Amana is $48,544.
What is the Median Family Income in Amana?
Median Family Income in Amana is $139,130.
What is Inequality or Gini Index in Amana?
Inequality or Gini Index in Amana is 0.36.
What is the Total Population of Amana?
Total Population of Amana is 556.
What is the Total Male Population of Amana?
Total Male Population of Amana is 242.
What is the Total Female Population of Amana?
Total Female Population of Amana is 314.
What is the Ratio of Males per 100 Females in Amana?
There are 77.07 Males per 100 Females in Amana.
What is the Ratio of Females per 100 Males in Amana?
There are 129.75 Females per 100 Males in Amana.
What is the Median Population Age in Amana?
Median Population Age in Amana is 48.4 Years.
What is the Average Family Size in Amana
Average Family Size in Amana is 2.8 People.
What is the Average Household Size in Amana
Average Household Size in Amana is 2.3 People.
How Large is the Labor Force in Amana?
There are 376 People in the Labor Forcein in Amana.
What is the Percentage of People in the Labor Force in Amana?
78.0% of People are in the Labor Force in Amana.