Arnolds Park, IA Map & Demographics
Arnolds Park Map
Arnolds Park Overview
$59,353
PER CAPITA INCOME
$115,109
AVG FAMILY INCOME
$82,500
AVG HOUSEHOLD INCOME
22.9%
WAGE / INCOME GAP [ % ]
77.1¢/ $1
WAGE / INCOME GAP [ $ ]
0.43
INEQUALITY / GINI INDEX
989
TOTAL POPULATION
458
MALE POPULATION
531
FEMALE POPULATION
86.25
MALES / 100 FEMALES
115.94
FEMALES / 100 MALES
62.1
MEDIAN AGE
2.1
AVG FAMILY SIZE
1.7
AVG HOUSEHOLD SIZE
504
LABOR FORCE [ PEOPLE ]
53.6%
PERCENT IN LABOR FORCE
0.4%
UNEMPLOYMENT RATE
Arnolds Park Zip Codes
Arnolds Park Area Codes
Income in Arnolds Park
Income Overview in Arnolds Park
Per Capita Income in Arnolds Park is $59,353, while median incomes of families and households are $115,109 and $82,500 respectively.
| Characteristic | Number | Measure |
| Per Capita Income | 989 | $59,353 |
| Median Family Income | 316 | $115,109 |
| Mean Family Income | 316 | $130,227 |
| Median Household Income | 572 | $82,500 |
| Mean Household Income | 572 | $104,197 |
| Income Deficit | 316 | $0 |
| Wage / Income Gap (%) | 989 | 22.93% |
| Wage / Income Gap ($) | 989 | 77.07¢ per $1 |
| Gini / Inequality Index | 989 | 0.43 |
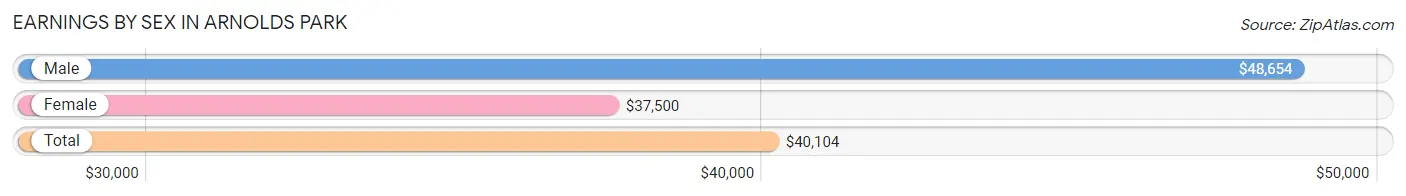
Earnings by Sex in Arnolds Park
Average Earnings in Arnolds Park are $40,104, $48,654 for men and $37,500 for women, a difference of 22.9%.
| Sex | Number | Average Earnings |
| Male | 296 (52.1%) | $48,654 |
| Female | 272 (47.9%) | $37,500 |
| Total | 568 (100.0%) | $40,104 |
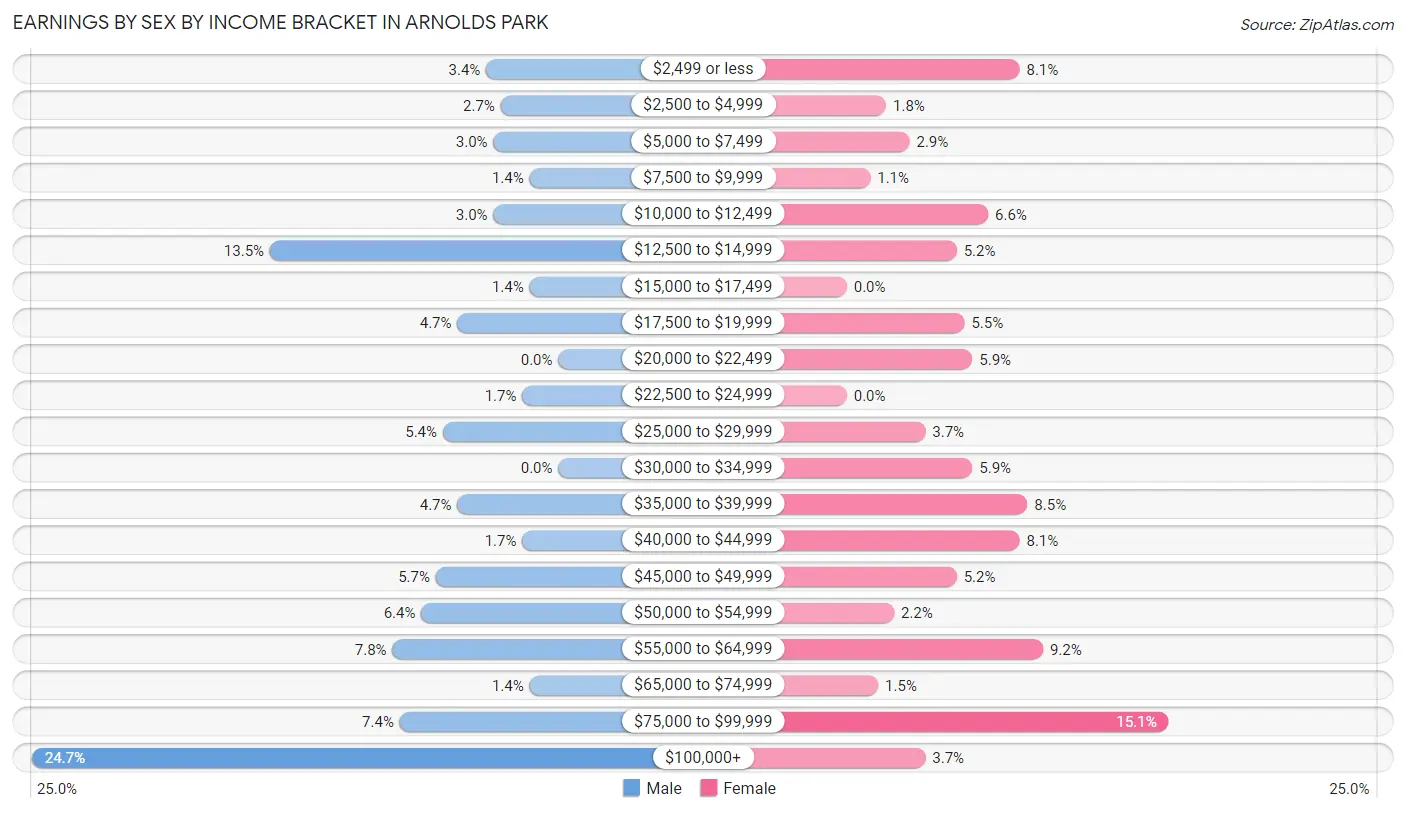
Earnings by Sex by Income Bracket in Arnolds Park
The most common earnings brackets in Arnolds Park are $100,000+ for men (73 | 24.7%) and $75,000 to $99,999 for women (41 | 15.1%).
| Income | Male | Female |
| $2,499 or less | 10 (3.4%) | 22 (8.1%) |
| $2,500 to $4,999 | 8 (2.7%) | 5 (1.8%) |
| $5,000 to $7,499 | 9 (3.0%) | 8 (2.9%) |
| $7,500 to $9,999 | 4 (1.3%) | 3 (1.1%) |
| $10,000 to $12,499 | 9 (3.0%) | 18 (6.6%) |
| $12,500 to $14,999 | 40 (13.5%) | 14 (5.1%) |
| $15,000 to $17,499 | 4 (1.3%) | 0 (0.0%) |
| $17,500 to $19,999 | 14 (4.7%) | 15 (5.5%) |
| $20,000 to $22,499 | 0 (0.0%) | 16 (5.9%) |
| $22,500 to $24,999 | 5 (1.7%) | 0 (0.0%) |
| $25,000 to $29,999 | 16 (5.4%) | 10 (3.7%) |
| $30,000 to $34,999 | 0 (0.0%) | 16 (5.9%) |
| $35,000 to $39,999 | 14 (4.7%) | 23 (8.5%) |
| $40,000 to $44,999 | 5 (1.7%) | 22 (8.1%) |
| $45,000 to $49,999 | 17 (5.7%) | 14 (5.1%) |
| $50,000 to $54,999 | 19 (6.4%) | 6 (2.2%) |
| $55,000 to $64,999 | 23 (7.8%) | 25 (9.2%) |
| $65,000 to $74,999 | 4 (1.3%) | 4 (1.5%) |
| $75,000 to $99,999 | 22 (7.4%) | 41 (15.1%) |
| $100,000+ | 73 (24.7%) | 10 (3.7%) |
| Total | 296 (100.0%) | 272 (100.0%) |
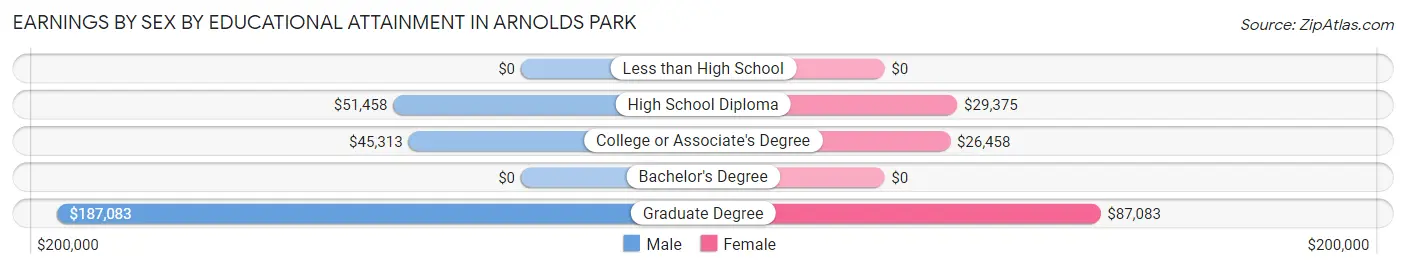
Earnings by Sex by Educational Attainment in Arnolds Park
Average earnings in Arnolds Park are $49,519 for men and $38,636 for women, a difference of 22.0%. Men with an educational attainment of graduate degree enjoy the highest average annual earnings of $187,083, while those with college or associate's degree education earn the least with $45,313. Women with an educational attainment of graduate degree earn the most with the average annual earnings of $87,083, while those with college or associate's degree education have the smallest earnings of $26,458.
| Educational Attainment | Male Income | Female Income |
| Less than High School | - | - |
| High School Diploma | $51,458 | $29,375 |
| College or Associate's Degree | $45,313 | $26,458 |
| Bachelor's Degree | - | - |
| Graduate Degree | $187,083 | $87,083 |
| Total | $49,519 | $38,636 |
Family Income in Arnolds Park
Family Income Brackets in Arnolds Park
According to the Arnolds Park family income data, there are 105 families falling into the $100,000 to $149,999 income range, which is the most common income bracket and makes up 33.2% of all families.
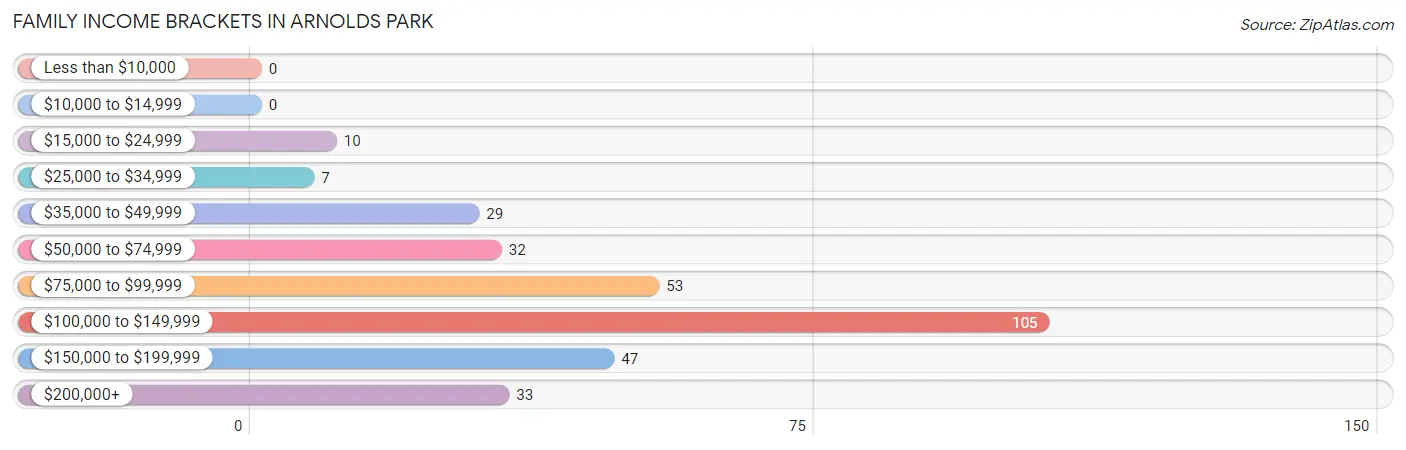
| Income Bracket | # Families | % Families |
| Less than $10,000 | 0 | 0.0% |
| $10,000 to $14,999 | 0 | 0.0% |
| $15,000 to $24,999 | 10 | 3.2% |
| $25,000 to $34,999 | 7 | 2.2% |
| $35,000 to $49,999 | 29 | 9.2% |
| $50,000 to $74,999 | 32 | 10.1% |
| $75,000 to $99,999 | 53 | 16.8% |
| $100,000 to $149,999 | 105 | 33.2% |
| $150,000 to $199,999 | 47 | 14.9% |
| $200,000+ | 33 | 10.4% |
Family Income by Famaliy Size in Arnolds Park
4-person families (17 | 5.4%) account for the highest median family income in Arnolds Park with $200,313 per family, while 2-person families (281 | 88.9%) have the highest median income of $57,636 per family member.
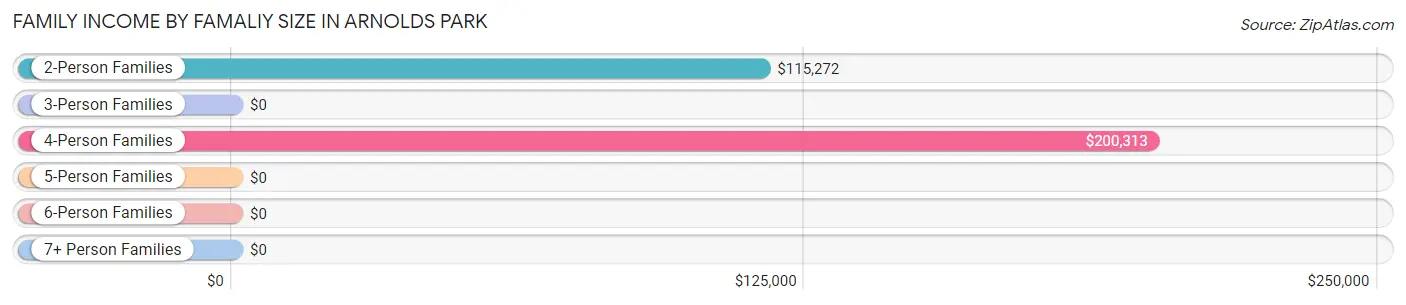
| Income Bracket | # Families | Median Income |
| 2-Person Families | 281 (88.9%) | $115,272 |
| 3-Person Families | 13 (4.1%) | $0 |
| 4-Person Families | 17 (5.4%) | $200,313 |
| 5-Person Families | 5 (1.6%) | $0 |
| 6-Person Families | 0 (0.0%) | $0 |
| 7+ Person Families | 0 (0.0%) | $0 |
| Total | 316 (100.0%) | $115,109 |
Family Income by Number of Earners in Arnolds Park
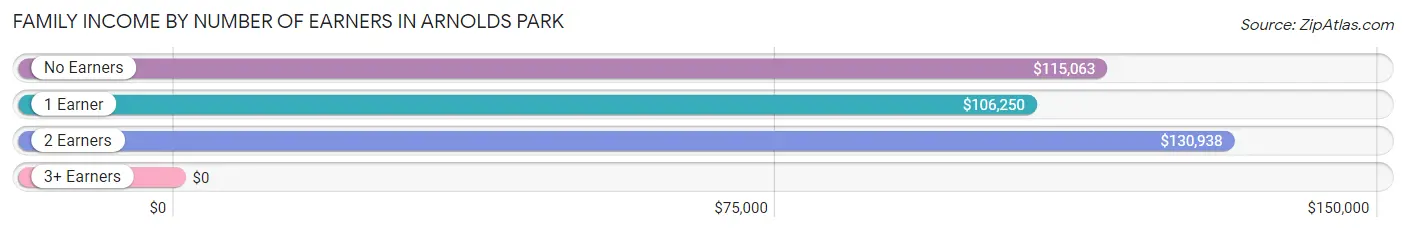
| Number of Earners | # Families | Median Income |
| No Earners | 93 (29.4%) | $115,063 |
| 1 Earner | 58 (18.3%) | $106,250 |
| 2 Earners | 163 (51.6%) | $130,938 |
| 3+ Earners | 2 (0.6%) | $0 |
| Total | 316 (100.0%) | $115,109 |
Household Income in Arnolds Park
Household Income Brackets in Arnolds Park
With 157 households falling in the category, the $100,000 to $149,999 income range is the most frequent in Arnolds Park, accounting for 27.5% of all households. In contrast, only 13 households (2.3%) fall into the less than $10,000 income bracket, making it the least populous group.
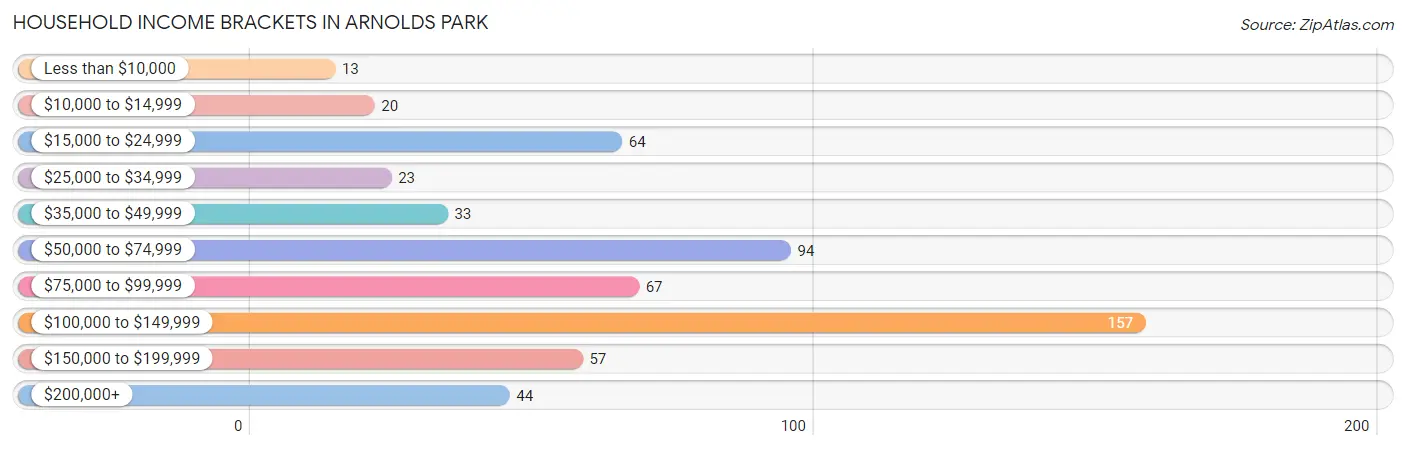
| Income Bracket | # Households | % Households |
| Less than $10,000 | 13 | 2.3% |
| $10,000 to $14,999 | 20 | 3.5% |
| $15,000 to $24,999 | 64 | 11.2% |
| $25,000 to $34,999 | 23 | 4.0% |
| $35,000 to $49,999 | 33 | 5.8% |
| $50,000 to $74,999 | 94 | 16.4% |
| $75,000 to $99,999 | 67 | 11.7% |
| $100,000 to $149,999 | 157 | 27.4% |
| $150,000 to $199,999 | 57 | 10.0% |
| $200,000+ | 44 | 7.7% |
Household Income by Householder Age in Arnolds Park
The median household income in Arnolds Park is $82,500, with the highest median household income of $112,778 found in the 45 to 64 years age bracket for the primary householder. A total of 214 households (37.4%) fall into this category. Meanwhile, the 15 to 24 years age bracket for the primary householder has the lowest median household income of $0, with 3 households (0.5%) in this group.
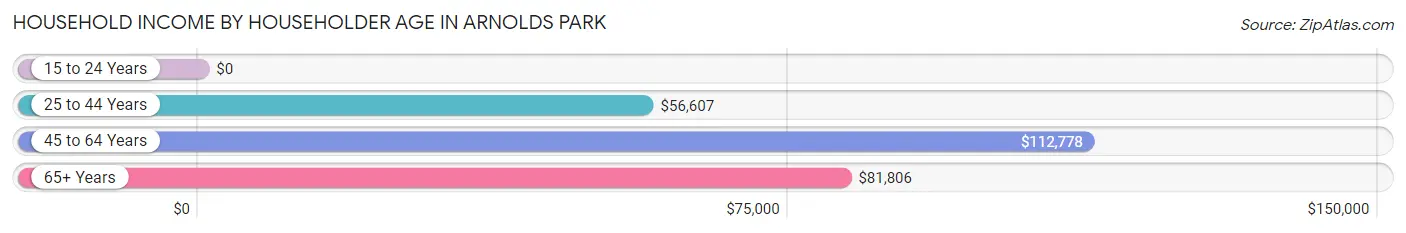
| Income Bracket | # Households | Median Income |
| 15 to 24 Years | 3 (0.5%) | $0 |
| 25 to 44 Years | 106 (18.5%) | $56,607 |
| 45 to 64 Years | 214 (37.4%) | $112,778 |
| 65+ Years | 249 (43.5%) | $81,806 |
| Total | 572 (100.0%) | $82,500 |
Poverty in Arnolds Park
Income Below Poverty by Sex and Age in Arnolds Park
With 7.4% poverty level for males and 6.0% for females among the residents of Arnolds Park, 25 to 34 year old males and 55 to 64 year old females are the most vulnerable to poverty, with 18 males (37.5%) and 21 females (12.3%) in their respective age groups living below the poverty level.
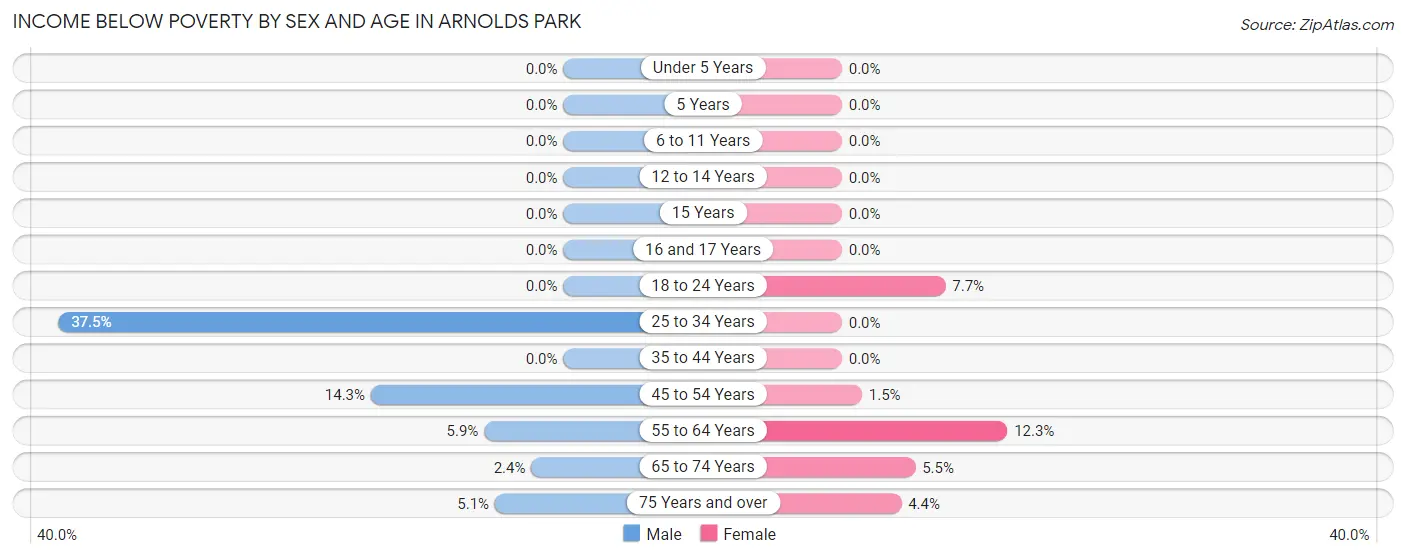
| Age Bracket | Male | Female |
| Under 5 Years | 0 (0.0%) | 0 (0.0%) |
| 5 Years | 0 (0.0%) | 0 (0.0%) |
| 6 to 11 Years | 0 (0.0%) | 0 (0.0%) |
| 12 to 14 Years | 0 (0.0%) | 0 (0.0%) |
| 15 Years | 0 (0.0%) | 0 (0.0%) |
| 16 and 17 Years | 0 (0.0%) | 0 (0.0%) |
| 18 to 24 Years | 0 (0.0%) | 1 (7.7%) |
| 25 to 34 Years | 18 (37.5%) | 0 (0.0%) |
| 35 to 44 Years | 0 (0.0%) | 0 (0.0%) |
| 45 to 54 Years | 4 (14.3%) | 1 (1.5%) |
| 55 to 64 Years | 6 (5.9%) | 21 (12.3%) |
| 65 to 74 Years | 3 (2.4%) | 6 (5.4%) |
| 75 Years and over | 3 (5.1%) | 3 (4.4%) |
| Total | 34 (7.4%) | 32 (6.0%) |
Income Above Poverty by Sex and Age in Arnolds Park
According to the poverty statistics in Arnolds Park, males aged under 5 years and females aged under 5 years are the age groups that are most secure financially, with 100.0% of males and 100.0% of females in these age groups living above the poverty line.
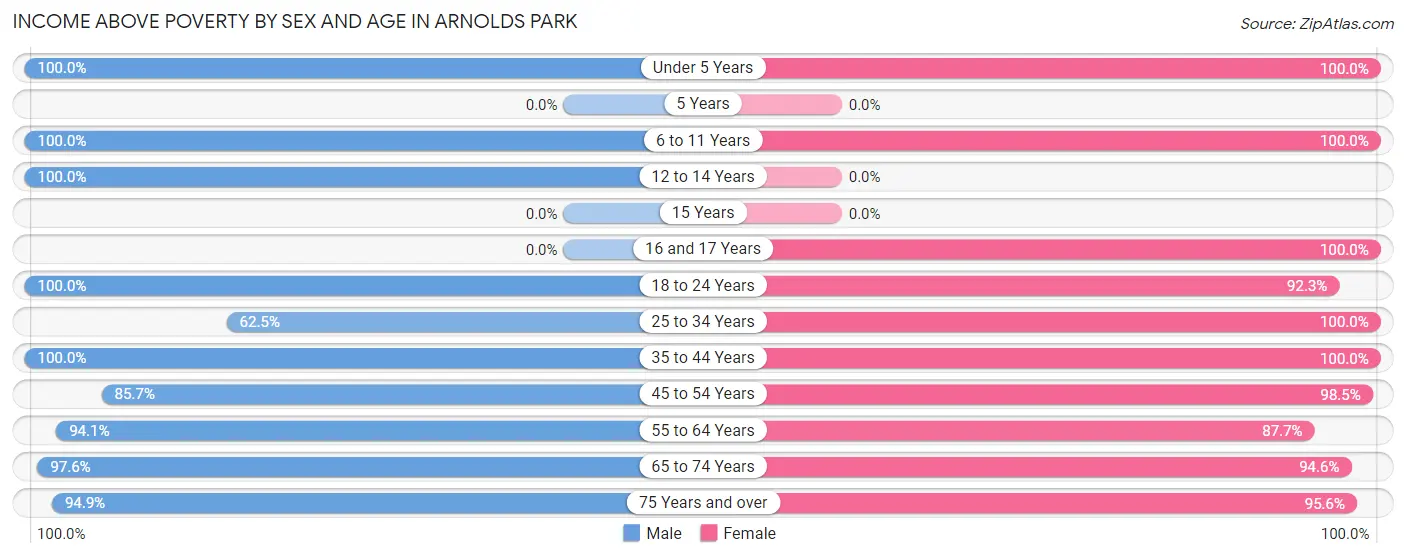
| Age Bracket | Male | Female |
| Under 5 Years | 4 (100.0%) | 31 (100.0%) |
| 5 Years | 0 (0.0%) | 0 (0.0%) |
| 6 to 11 Years | 4 (100.0%) | 3 (100.0%) |
| 12 to 14 Years | 7 (100.0%) | 0 (0.0%) |
| 15 Years | 0 (0.0%) | 0 (0.0%) |
| 16 and 17 Years | 0 (0.0%) | 12 (100.0%) |
| 18 to 24 Years | 9 (100.0%) | 12 (92.3%) |
| 25 to 34 Years | 30 (62.5%) | 31 (100.0%) |
| 35 to 44 Years | 71 (100.0%) | 25 (100.0%) |
| 45 to 54 Years | 24 (85.7%) | 66 (98.5%) |
| 55 to 64 Years | 96 (94.1%) | 150 (87.7%) |
| 65 to 74 Years | 123 (97.6%) | 104 (94.6%) |
| 75 Years and over | 56 (94.9%) | 65 (95.6%) |
| Total | 424 (92.6%) | 499 (94.0%) |
Income Below Poverty Among Married-Couple Families in Arnolds Park
The poverty statistics for married-couple families in Arnolds Park show that 2.5% or 7 of the total 286 families live below the poverty line. Families with no children have the highest poverty rate of 2.7%, comprising of 7 families. On the other hand, families with 1 or 2 children have the lowest poverty rate of 0.0%, which includes 0 families.
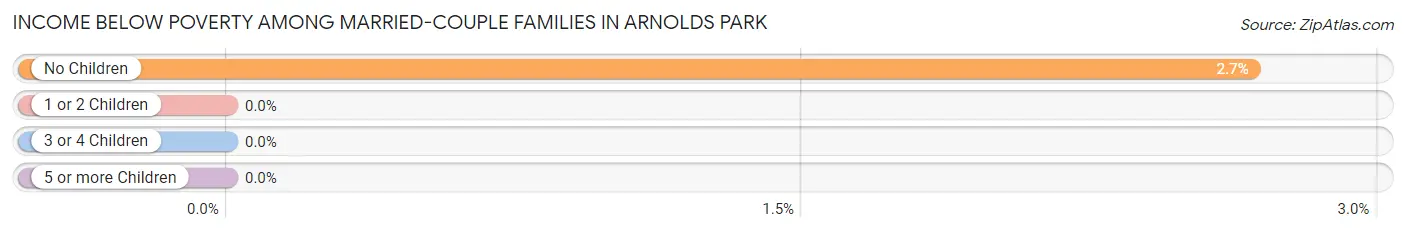
| Children | Above Poverty | Below Poverty |
| No Children | 255 (97.3%) | 7 (2.7%) |
| 1 or 2 Children | 19 (100.0%) | 0 (0.0%) |
| 3 or 4 Children | 5 (100.0%) | 0 (0.0%) |
| 5 or more Children | 0 (0.0%) | 0 (0.0%) |
| Total | 279 (97.6%) | 7 (2.5%) |
Income Below Poverty Among Single-Parent Households in Arnolds Park
| Children | Single Father | Single Mother |
| No Children | 0 (0.0%) | 0 (0.0%) |
| 1 or 2 Children | 0 (0.0%) | 0 (0.0%) |
| 3 or 4 Children | 0 (0.0%) | 0 (0.0%) |
| 5 or more Children | 0 (0.0%) | 0 (0.0%) |
| Total | 0 (0.0%) | 0 (0.0%) |
Income Below Poverty Among Married-Couple vs Single-Parent Households in Arnolds Park
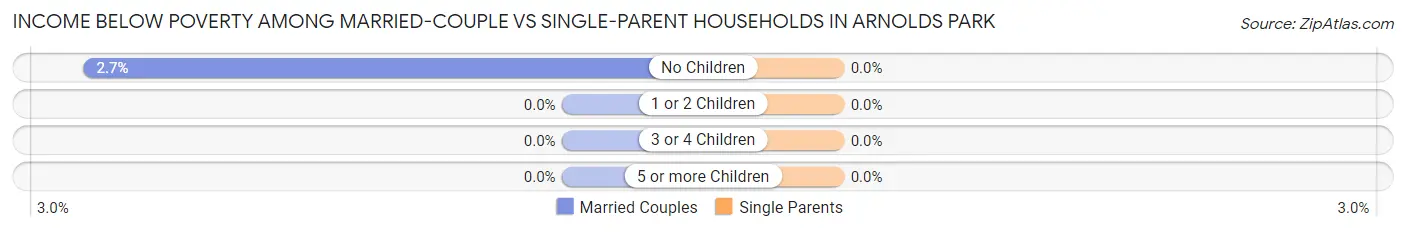
| Children | Married-Couple Families | Single-Parent Households |
| No Children | 7 (2.7%) | 0 (0.0%) |
| 1 or 2 Children | 0 (0.0%) | 0 (0.0%) |
| 3 or 4 Children | 0 (0.0%) | 0 (0.0%) |
| 5 or more Children | 0 (0.0%) | 0 (0.0%) |
| Total | 7 (2.5%) | 0 (0.0%) |
Race in Arnolds Park
The most populous races in Arnolds Park are White / Caucasian (988 | 99.9%), Hispanic or Latino (3 | 0.3%), and Two or more Races (1 | 0.1%).
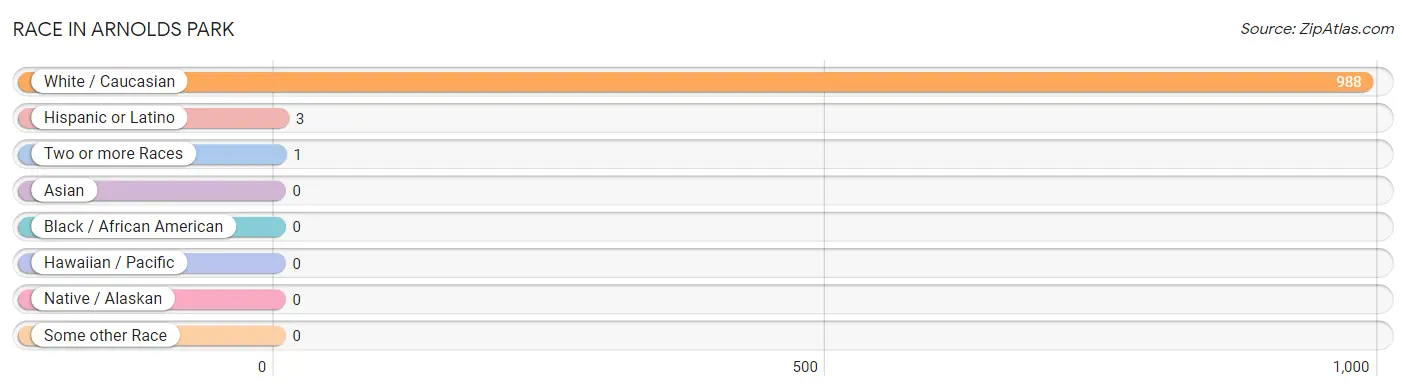
| Race | # Population | % Population |
| Asian | 0 | 0.0% |
| Black / African American | 0 | 0.0% |
| Hawaiian / Pacific | 0 | 0.0% |
| Hispanic or Latino | 3 | 0.3% |
| Native / Alaskan | 0 | 0.0% |
| White / Caucasian | 988 | 99.9% |
| Two or more Races | 1 | 0.1% |
| Some other Race | 0 | 0.0% |
| Total | 989 | 100.0% |
Ancestry in Arnolds Park
The most populous ancestries reported in Arnolds Park are German (412 | 41.7%), Irish (161 | 16.3%), English (151 | 15.3%), Swedish (94 | 9.5%), and Norwegian (80 | 8.1%), together accounting for 90.8% of all Arnolds Park residents.
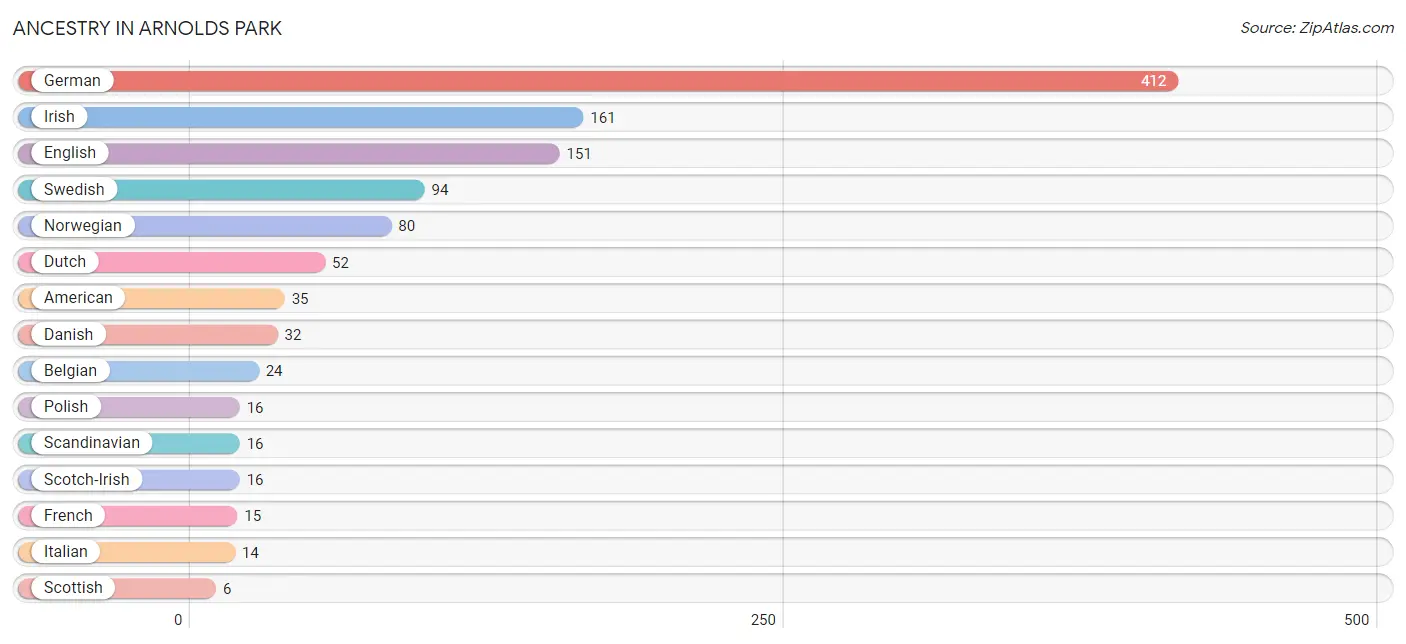
| Ancestry | # Population | % Population |
| Albanian | 2 | 0.2% |
| American | 35 | 3.5% |
| Belgian | 24 | 2.4% |
| Colombian | 3 | 0.3% |
| Danish | 32 | 3.2% |
| Dutch | 52 | 5.3% |
| Eastern European | 3 | 0.3% |
| English | 151 | 15.3% |
| French | 15 | 1.5% |
| German | 412 | 41.7% |
| Irish | 161 | 16.3% |
| Italian | 14 | 1.4% |
| Northern European | 3 | 0.3% |
| Norwegian | 80 | 8.1% |
| Pennsylvania German | 2 | 0.2% |
| Polish | 16 | 1.6% |
| Russian | 4 | 0.4% |
| Scandinavian | 16 | 1.6% |
| Scotch-Irish | 16 | 1.6% |
| Scottish | 6 | 0.6% |
| Slovak | 4 | 0.4% |
| South American | 3 | 0.3% |
| Swedish | 94 | 9.5% |
| Welsh | 2 | 0.2% | View All 24 Rows |
Immigrants in Arnolds Park
The most numerous immigrant groups reported in Arnolds Park came from Europe (7 | 0.7%), Germany (4 | 0.4%), Western Europe (4 | 0.4%), Colombia (3 | 0.3%), and Latin America (3 | 0.3%), together accounting for 2.1% of all Arnolds Park residents.
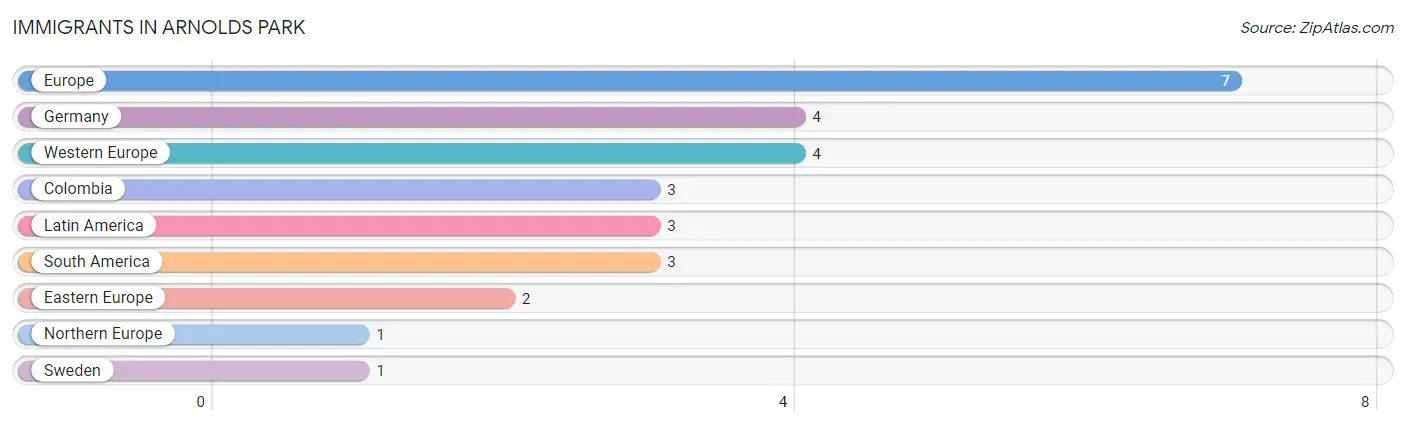
| Immigration Origin | # Population | % Population |
| Colombia | 3 | 0.3% |
| Eastern Europe | 2 | 0.2% |
| Europe | 7 | 0.7% |
| Germany | 4 | 0.4% |
| Latin America | 3 | 0.3% |
| Northern Europe | 1 | 0.1% |
| South America | 3 | 0.3% |
| Sweden | 1 | 0.1% |
| Western Europe | 4 | 0.4% | View All 9 Rows |
Sex and Age in Arnolds Park
Sex and Age in Arnolds Park
The most populous age groups in Arnolds Park are 70 to 74 Years (75 | 16.4%) for men and 60 to 64 Years (112 | 21.1%) for women.
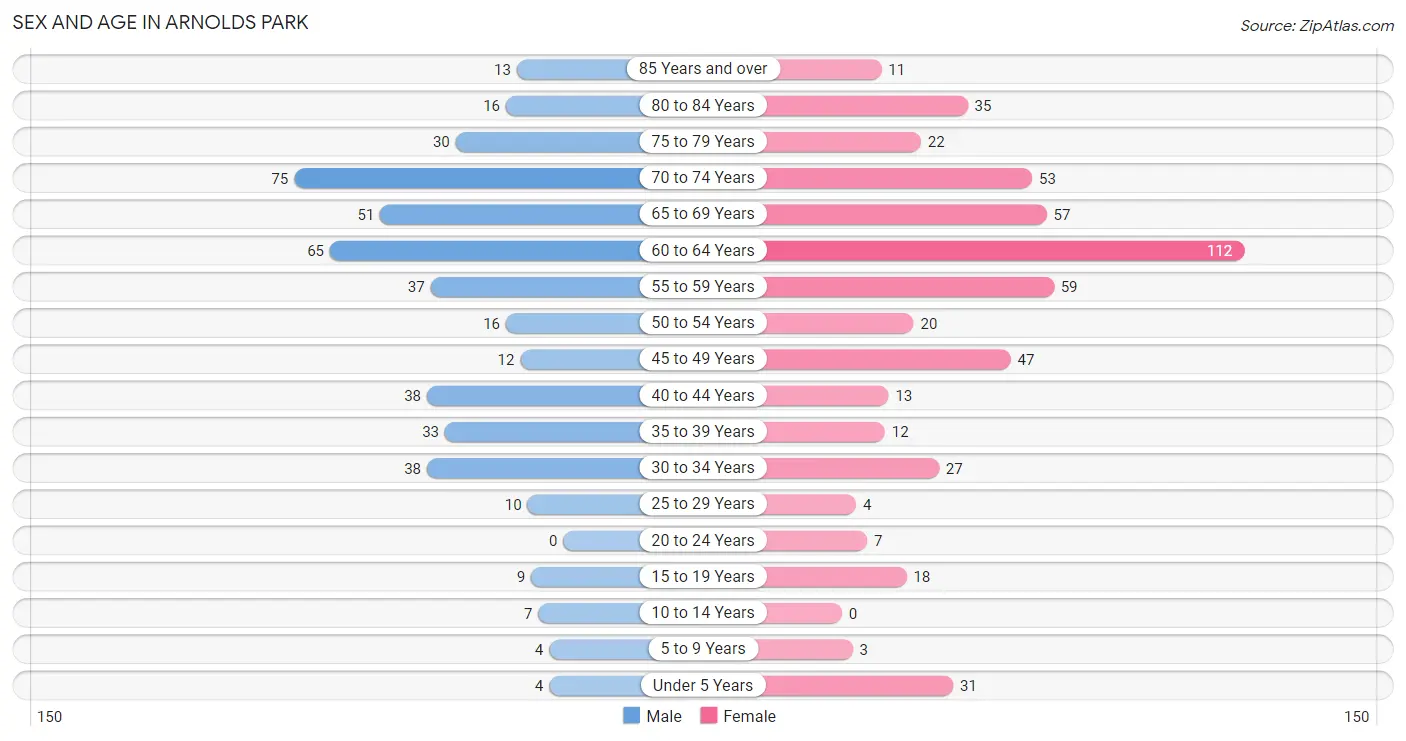
| Age Bracket | Male | Female |
| Under 5 Years | 4 (0.9%) | 31 (5.8%) |
| 5 to 9 Years | 4 (0.9%) | 3 (0.6%) |
| 10 to 14 Years | 7 (1.5%) | 0 (0.0%) |
| 15 to 19 Years | 9 (2.0%) | 18 (3.4%) |
| 20 to 24 Years | 0 (0.0%) | 7 (1.3%) |
| 25 to 29 Years | 10 (2.2%) | 4 (0.7%) |
| 30 to 34 Years | 38 (8.3%) | 27 (5.1%) |
| 35 to 39 Years | 33 (7.2%) | 12 (2.3%) |
| 40 to 44 Years | 38 (8.3%) | 13 (2.5%) |
| 45 to 49 Years | 12 (2.6%) | 47 (8.8%) |
| 50 to 54 Years | 16 (3.5%) | 20 (3.8%) |
| 55 to 59 Years | 37 (8.1%) | 59 (11.1%) |
| 60 to 64 Years | 65 (14.2%) | 112 (21.1%) |
| 65 to 69 Years | 51 (11.1%) | 57 (10.7%) |
| 70 to 74 Years | 75 (16.4%) | 53 (10.0%) |
| 75 to 79 Years | 30 (6.6%) | 22 (4.1%) |
| 80 to 84 Years | 16 (3.5%) | 35 (6.6%) |
| 85 Years and over | 13 (2.8%) | 11 (2.1%) |
| Total | 458 (100.0%) | 531 (100.0%) |
Families and Households in Arnolds Park
Median Family Size in Arnolds Park
The median family size in Arnolds Park is 2.15 persons per family, with single male/father families (6 | 1.9%) accounting for the largest median family size of 2.83 persons per family. On the other hand, married-couple families (286 | 90.5%) represent the smallest median family size with 2.13 persons per family.
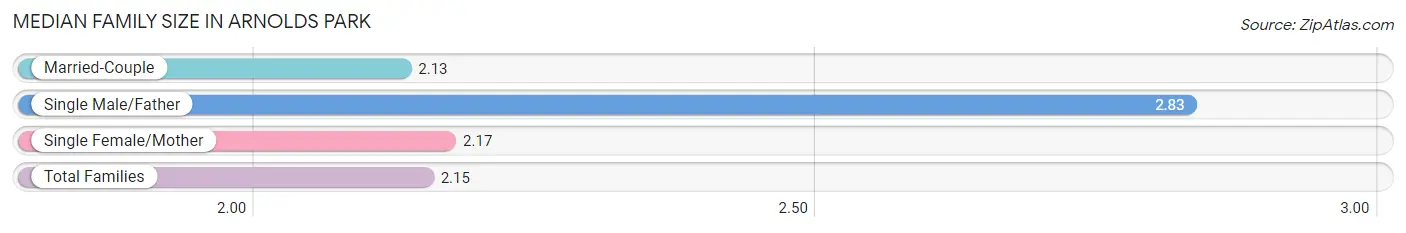
| Family Type | # Families | Family Size |
| Married-Couple | 286 (90.5%) | 2.13 |
| Single Male/Father | 6 (1.9%) | 2.83 |
| Single Female/Mother | 24 (7.6%) | 2.17 |
| Total Families | 316 (100.0%) | 2.15 |
Median Household Size in Arnolds Park
The median household size in Arnolds Park is 1.73 persons per household, with single male/father households (6 | 1.1%) accounting for the largest median household size of 2.83 persons per household. non-family households (256 | 44.8%) represent the smallest median household size with 1.21 persons per household.
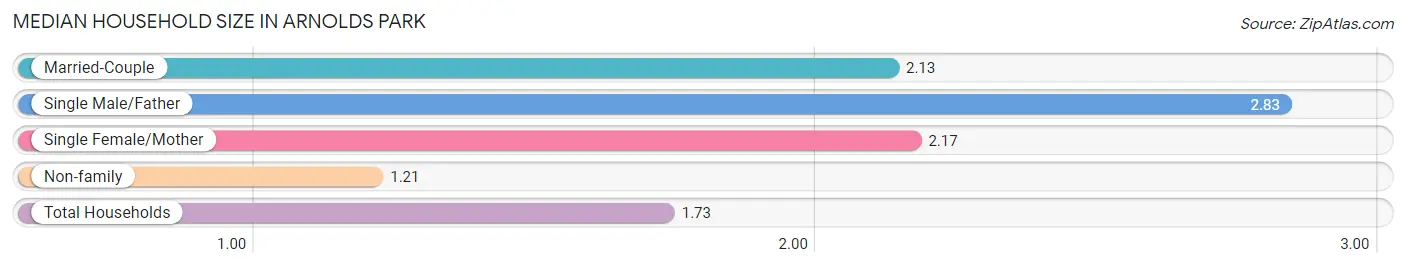
| Household Type | # Households | Household Size |
| Married-Couple | 286 (50.0%) | 2.13 |
| Single Male/Father | 6 (1.1%) | 2.83 |
| Single Female/Mother | 24 (4.2%) | 2.17 |
| Non-family | 256 (44.8%) | 1.21 |
| Total Households | 572 (100.0%) | 1.73 |
Household Size by Marriage Status in Arnolds Park
Out of a total of 572 households in Arnolds Park, 316 (55.2%) are family households, while 256 (44.8%) are nonfamily households. The most numerous type of family households are 2-person households, comprising 281, and the most common type of nonfamily households are 1-person households, comprising 223.
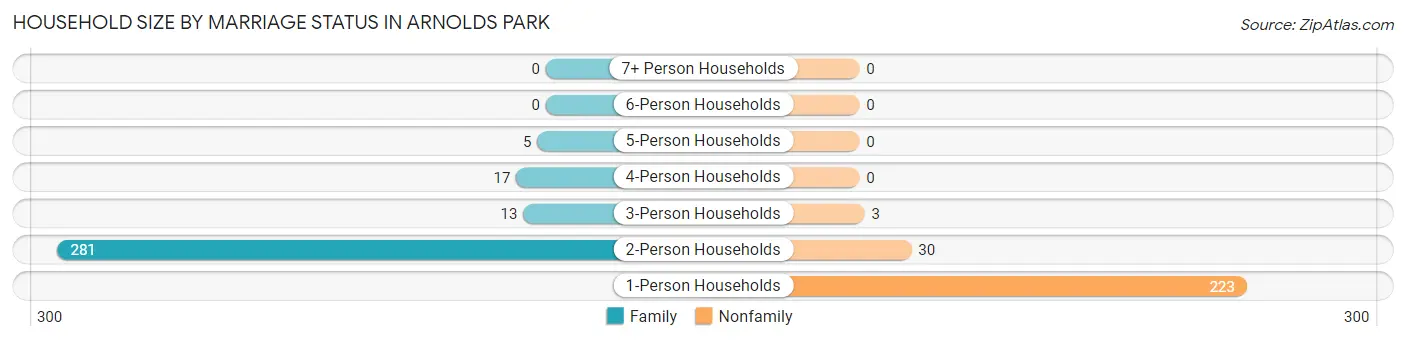
| Household Size | Family Households | Nonfamily Households |
| 1-Person Households | - | 223 (39.0%) |
| 2-Person Households | 281 (49.1%) | 30 (5.2%) |
| 3-Person Households | 13 (2.3%) | 3 (0.5%) |
| 4-Person Households | 17 (3.0%) | 0 (0.0%) |
| 5-Person Households | 5 (0.9%) | 0 (0.0%) |
| 6-Person Households | 0 (0.0%) | 0 (0.0%) |
| 7+ Person Households | 0 (0.0%) | 0 (0.0%) |
| Total | 316 (55.2%) | 256 (44.8%) |
Female Fertility in Arnolds Park
Fertility by Age in Arnolds Park
Average fertility rate in Arnolds Park is 30.0 births per 1,000 women. Women in the age bracket of 20 to 34 years have the highest fertility rate with 105.0 births per 1,000 women. Women in the age bracket of 20 to 34 years acount for 100.0% of all women with births.
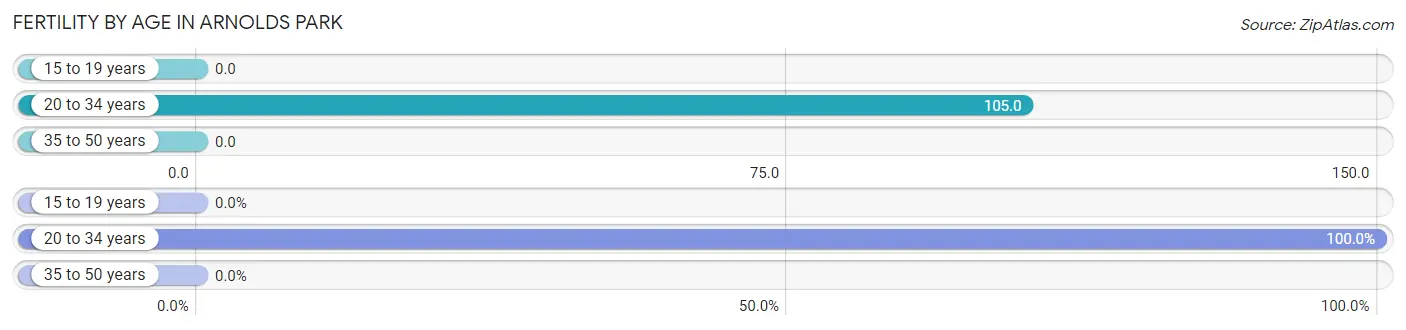
| Age Bracket | Women with Births | Births / 1,000 Women |
| 15 to 19 years | 0 (0.0%) | 0.0 |
| 20 to 34 years | 4 (100.0%) | 105.0 |
| 35 to 50 years | 0 (0.0%) | 0.0 |
| Total | 4 (100.0%) | 30.0 |
Fertility by Age by Marriage Status in Arnolds Park
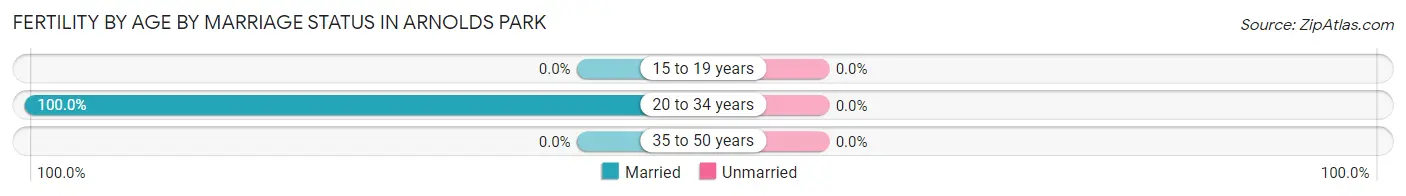
| Age Bracket | Married | Unmarried |
| 15 to 19 years | 0 (0.0%) | 0 (0.0%) |
| 20 to 34 years | 4 (100.0%) | 0 (0.0%) |
| 35 to 50 years | 0 (0.0%) | 0 (0.0%) |
| Total | 4 (100.0%) | 0 (0.0%) |
Fertility by Education in Arnolds Park
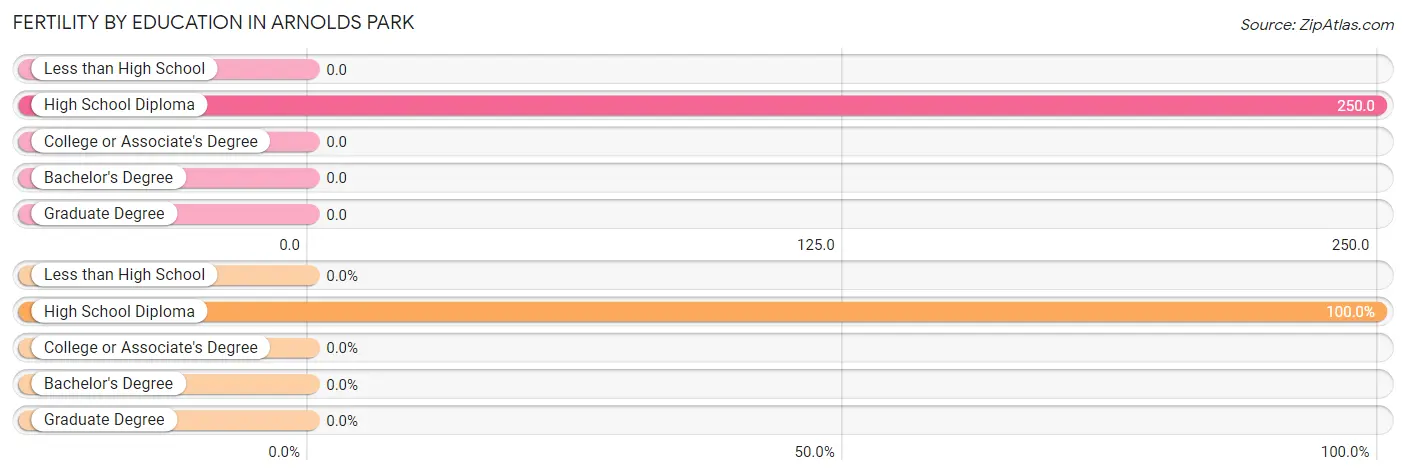
| Educational Attainment | Women with Births | Births / 1,000 Women |
| Less than High School | 0 (0.0%) | 0.0 |
| High School Diploma | 4 (100.0%) | 250.0 |
| College or Associate's Degree | 0 (0.0%) | 0.0 |
| Bachelor's Degree | 0 (0.0%) | 0.0 |
| Graduate Degree | 0 (0.0%) | 0.0 |
| Total | 4 (100.0%) | 30.0 |
Fertility by Education by Marriage Status in Arnolds Park
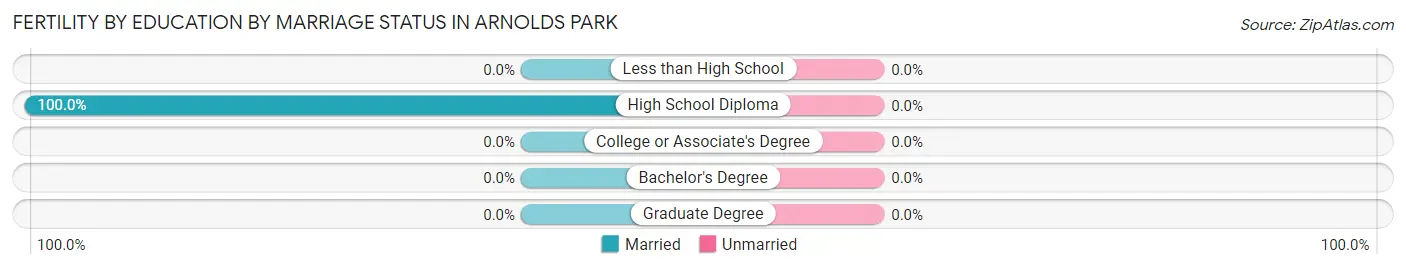
| Educational Attainment | Married | Unmarried |
| Less than High School | 0 (0.0%) | 0 (0.0%) |
| High School Diploma | 4 (100.0%) | 0 (0.0%) |
| College or Associate's Degree | 0 (0.0%) | 0 (0.0%) |
| Bachelor's Degree | 0 (0.0%) | 0 (0.0%) |
| Graduate Degree | 0 (0.0%) | 0 (0.0%) |
| Total | 4 (100.0%) | 0 (0.0%) |
Employment Characteristics in Arnolds Park
Employment by Class of Employer in Arnolds Park
Among the 502 employed individuals in Arnolds Park, private company employees (320 | 63.7%), not-for-profit organizations (62 | 12.3%), and self-employed (not incorporated) (47 | 9.4%) make up the most common classes of employment.
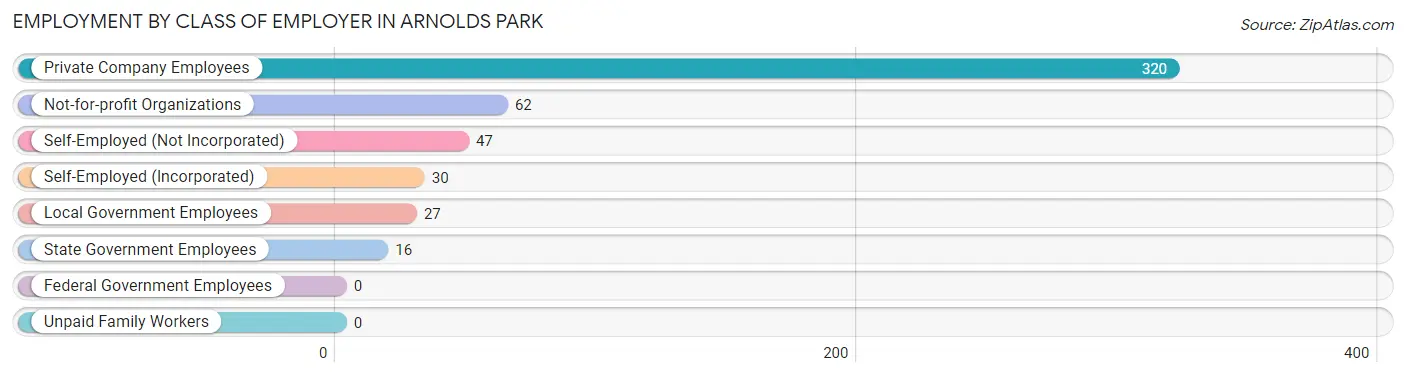
| Employer Class | # Employees | % Employees |
| Private Company Employees | 320 | 63.7% |
| Self-Employed (Incorporated) | 30 | 6.0% |
| Self-Employed (Not Incorporated) | 47 | 9.4% |
| Not-for-profit Organizations | 62 | 12.3% |
| Local Government Employees | 27 | 5.4% |
| State Government Employees | 16 | 3.2% |
| Federal Government Employees | 0 | 0.0% |
| Unpaid Family Workers | 0 | 0.0% |
| Total | 502 | 100.0% |
Employment Status by Age in Arnolds Park
According to the labor force statistics for Arnolds Park, out of the total population over 16 years of age (940), 53.6% or 504 individuals are in the labor force, with 0.4% or 2 of them unemployed. The age group with the highest labor force participation rate is 25 to 29 years, with 100.0% or 14 individuals in the labor force. Within the labor force, the 60 to 64 years age range has the highest percentage of unemployed individuals, with 2.4% or 2 of them being unemployed.
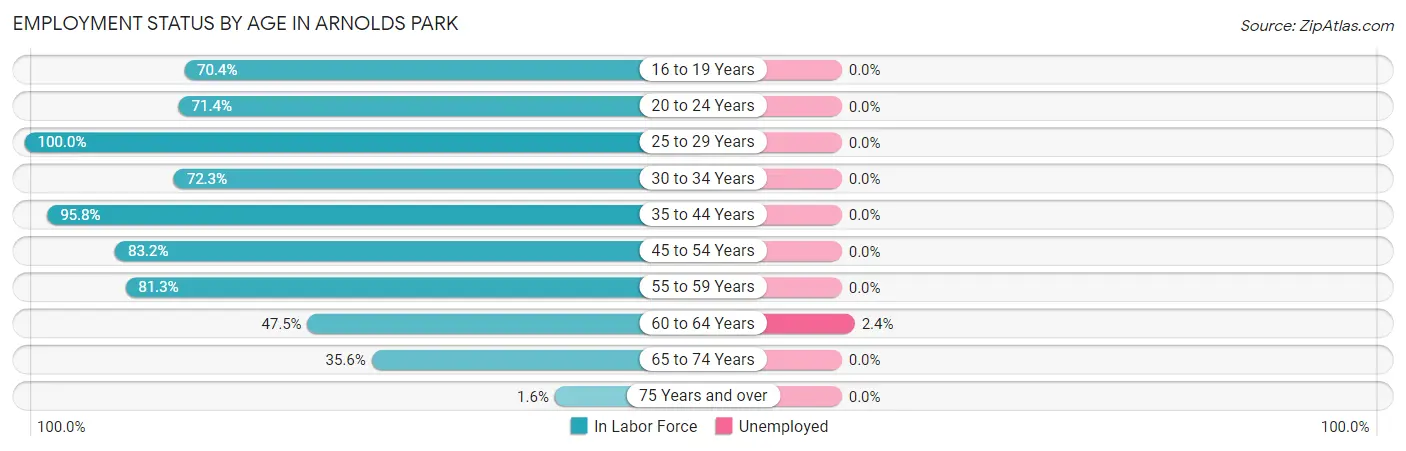
| Age Bracket | In Labor Force | Unemployed |
| 16 to 19 Years | 19 (70.4%) | 0 (0.0%) |
| 20 to 24 Years | 5 (71.4%) | 0 (0.0%) |
| 25 to 29 Years | 14 (100.0%) | 0 (0.0%) |
| 30 to 34 Years | 47 (72.3%) | 0 (0.0%) |
| 35 to 44 Years | 92 (95.8%) | 0 (0.0%) |
| 45 to 54 Years | 79 (83.2%) | 0 (0.0%) |
| 55 to 59 Years | 78 (81.3%) | 0 (0.0%) |
| 60 to 64 Years | 84 (47.5%) | 2 (2.4%) |
| 65 to 74 Years | 84 (35.6%) | 0 (0.0%) |
| 75 Years and over | 2 (1.6%) | 0 (0.0%) |
| Total | 504 (53.6%) | 2 (0.4%) |
Employment Status by Educational Attainment in Arnolds Park
According to labor force statistics for Arnolds Park, 72.6% of individuals (394) out of the total population between 25 and 64 years of age (543) are in the labor force, with 0.5% or 2 of them being unemployed. The group with the highest labor force participation rate are those with the educational attainment of high school diploma, with 84.7% or 72 individuals in the labor force. Within the labor force, individuals with high school diploma education have the highest percentage of unemployment, with 2.8% or 2 of them being unemployed.
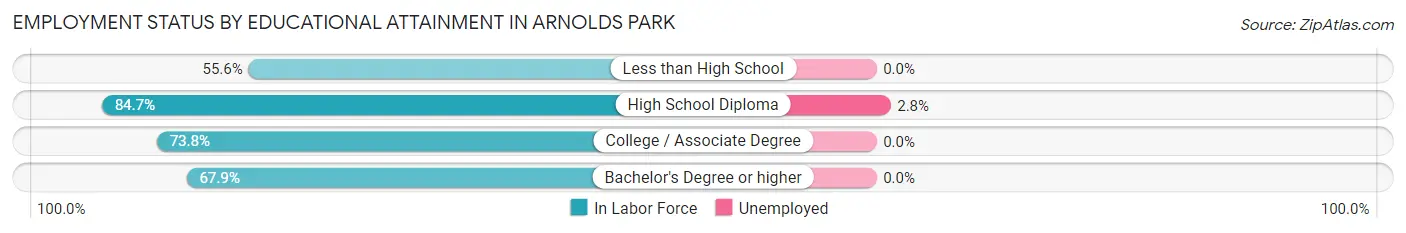
| Educational Attainment | In Labor Force | Unemployed |
| Less than High School | 5 (55.6%) | 0 (0.0%) |
| High School Diploma | 72 (84.7%) | 2 (2.8%) |
| College / Associate Degree | 152 (73.8%) | 0 (0.0%) |
| Bachelor's Degree or higher | 165 (67.9%) | 0 (0.0%) |
| Total | 394 (72.6%) | 3 (0.5%) |
Employment Occupations by Sex in Arnolds Park
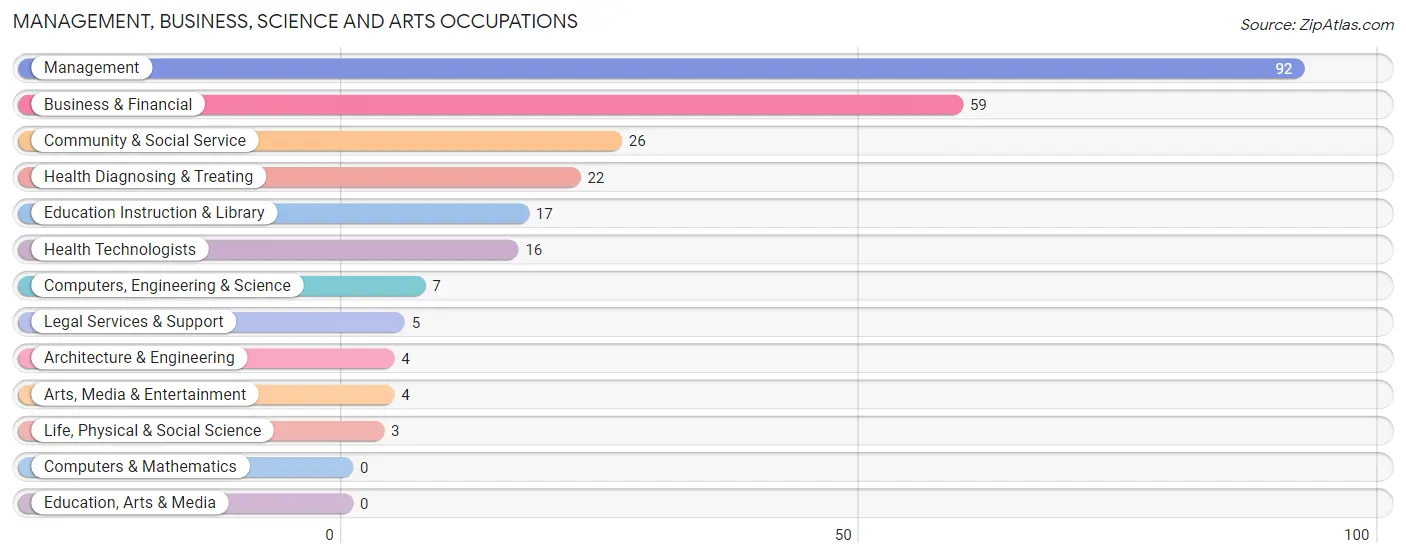
Management, Business, Science and Arts Occupations
The most common Management, Business, Science and Arts occupations in Arnolds Park are Management (92 | 18.3%), Business & Financial (59 | 11.7%), Community & Social Service (26 | 5.2%), Health Diagnosing & Treating (22 | 4.4%), and Education Instruction & Library (17 | 3.4%).
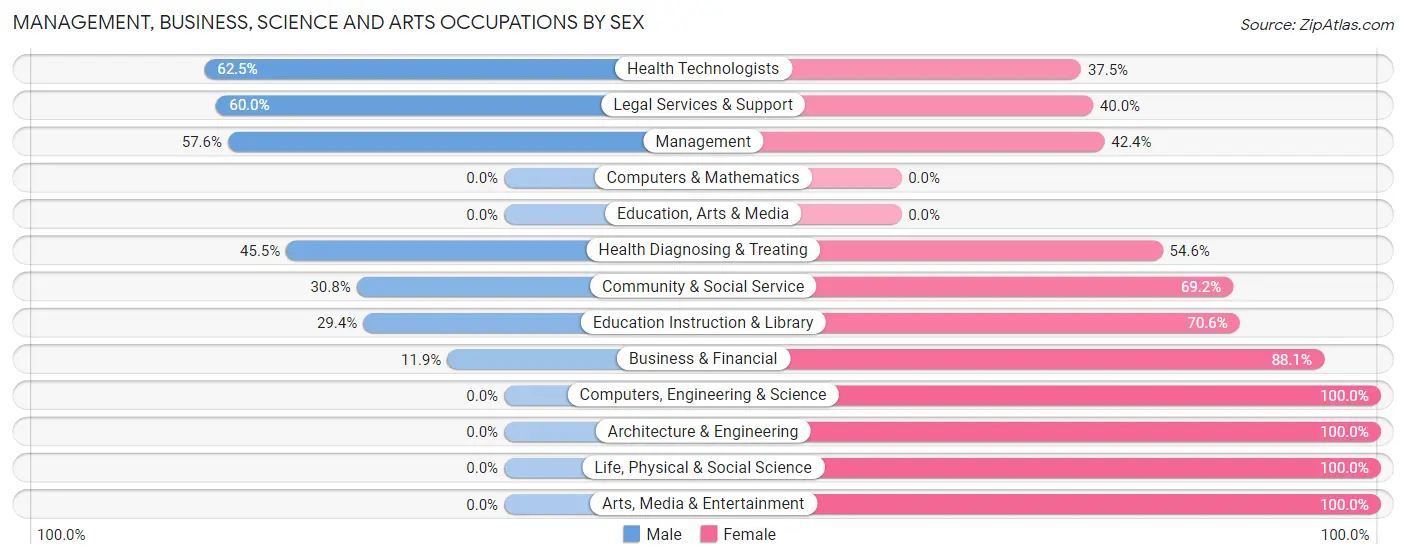
Management, Business, Science and Arts Occupations by Sex
Within the Management, Business, Science and Arts occupations in Arnolds Park, the most male-oriented occupations are Health Technologists (62.5%), Legal Services & Support (60.0%), and Management (57.6%), while the most female-oriented occupations are Computers, Engineering & Science (100.0%), Architecture & Engineering (100.0%), and Life, Physical & Social Science (100.0%).
| Occupation | Male | Female |
| Management | 53 (57.6%) | 39 (42.4%) |
| Business & Financial | 7 (11.9%) | 52 (88.1%) |
| Computers, Engineering & Science | 0 (0.0%) | 7 (100.0%) |
| Computers & Mathematics | 0 (0.0%) | 0 (0.0%) |
| Architecture & Engineering | 0 (0.0%) | 4 (100.0%) |
| Life, Physical & Social Science | 0 (0.0%) | 3 (100.0%) |
| Community & Social Service | 8 (30.8%) | 18 (69.2%) |
| Education, Arts & Media | 0 (0.0%) | 0 (0.0%) |
| Legal Services & Support | 3 (60.0%) | 2 (40.0%) |
| Education Instruction & Library | 5 (29.4%) | 12 (70.6%) |
| Arts, Media & Entertainment | 0 (0.0%) | 4 (100.0%) |
| Health Diagnosing & Treating | 10 (45.5%) | 12 (54.5%) |
| Health Technologists | 10 (62.5%) | 6 (37.5%) |
| Total (Category) | 78 (37.9%) | 128 (62.1%) |
| Total (Overall) | 251 (50.0%) | 251 (50.0%) |
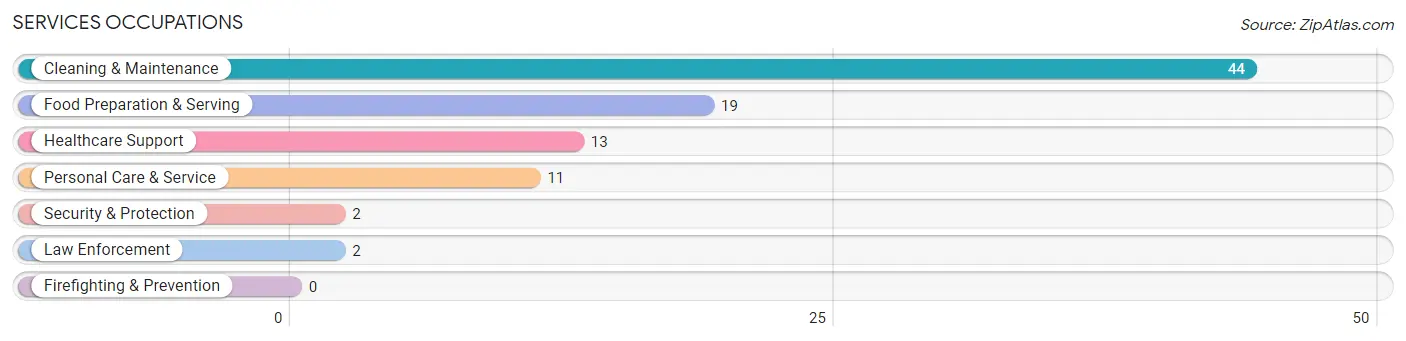
Services Occupations
The most common Services occupations in Arnolds Park are Cleaning & Maintenance (44 | 8.8%), Food Preparation & Serving (19 | 3.8%), Healthcare Support (13 | 2.6%), Personal Care & Service (11 | 2.2%), and Security & Protection (2 | 0.4%).
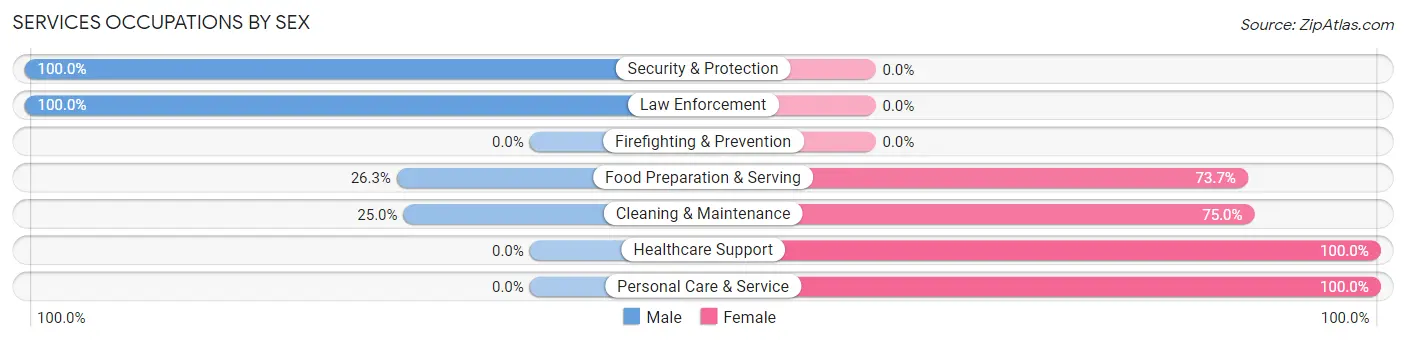
Services Occupations by Sex
Within the Services occupations in Arnolds Park, the most male-oriented occupations are Security & Protection (100.0%), Law Enforcement (100.0%), and Food Preparation & Serving (26.3%), while the most female-oriented occupations are Healthcare Support (100.0%), Personal Care & Service (100.0%), and Cleaning & Maintenance (75.0%).
| Occupation | Male | Female |
| Healthcare Support | 0 (0.0%) | 13 (100.0%) |
| Security & Protection | 2 (100.0%) | 0 (0.0%) |
| Firefighting & Prevention | 0 (0.0%) | 0 (0.0%) |
| Law Enforcement | 2 (100.0%) | 0 (0.0%) |
| Food Preparation & Serving | 5 (26.3%) | 14 (73.7%) |
| Cleaning & Maintenance | 11 (25.0%) | 33 (75.0%) |
| Personal Care & Service | 0 (0.0%) | 11 (100.0%) |
| Total (Category) | 18 (20.2%) | 71 (79.8%) |
| Total (Overall) | 251 (50.0%) | 251 (50.0%) |
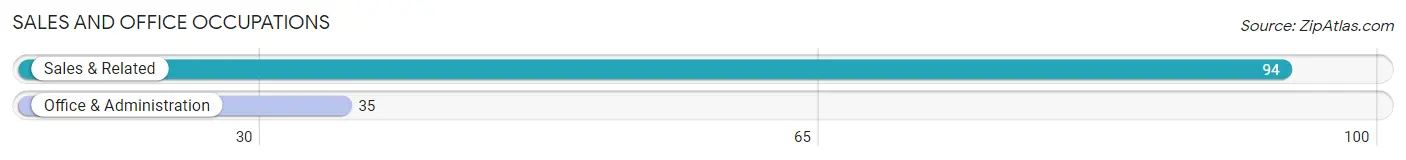
Sales and Office Occupations
The most common Sales and Office occupations in Arnolds Park are Sales & Related (94 | 18.7%), and Office & Administration (35 | 7.0%).
Sales and Office Occupations by Sex
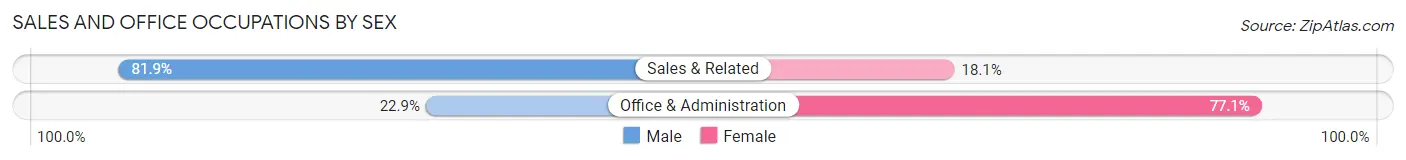
| Occupation | Male | Female |
| Sales & Related | 77 (81.9%) | 17 (18.1%) |
| Office & Administration | 8 (22.9%) | 27 (77.1%) |
| Total (Category) | 85 (65.9%) | 44 (34.1%) |
| Total (Overall) | 251 (50.0%) | 251 (50.0%) |
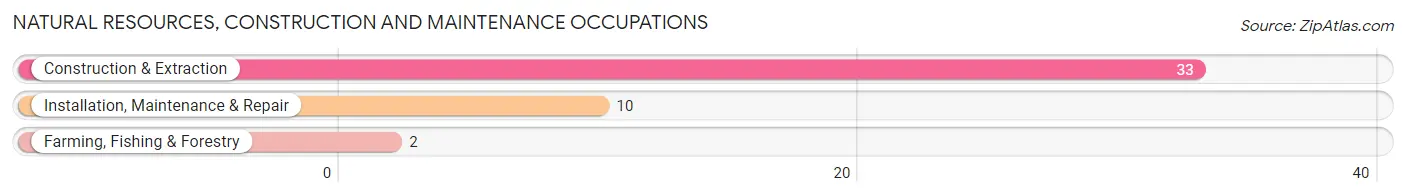
Natural Resources, Construction and Maintenance Occupations
The most common Natural Resources, Construction and Maintenance occupations in Arnolds Park are Construction & Extraction (33 | 6.6%), Installation, Maintenance & Repair (10 | 2.0%), and Farming, Fishing & Forestry (2 | 0.4%).
Natural Resources, Construction and Maintenance Occupations by Sex
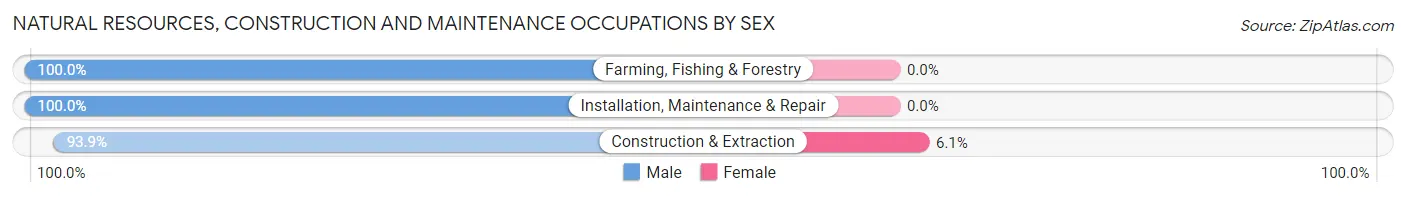
| Occupation | Male | Female |
| Farming, Fishing & Forestry | 2 (100.0%) | 0 (0.0%) |
| Construction & Extraction | 31 (93.9%) | 2 (6.1%) |
| Installation, Maintenance & Repair | 10 (100.0%) | 0 (0.0%) |
| Total (Category) | 43 (95.6%) | 2 (4.4%) |
| Total (Overall) | 251 (50.0%) | 251 (50.0%) |
Production, Transportation and Moving Occupations
The most common Production, Transportation and Moving occupations in Arnolds Park are Production (19 | 3.8%), Material Moving (12 | 2.4%), and Transportation (2 | 0.4%).
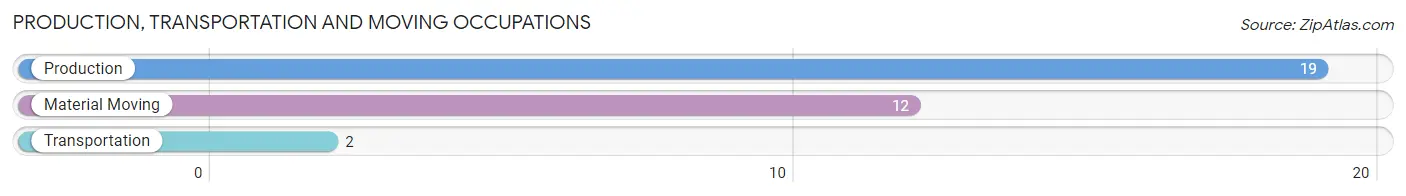
Production, Transportation and Moving Occupations by Sex
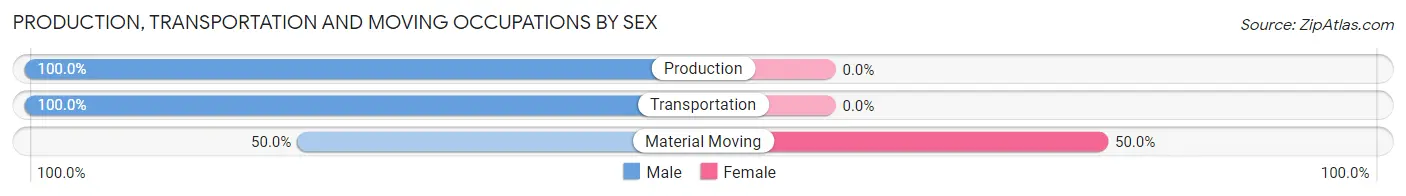
| Occupation | Male | Female |
| Production | 19 (100.0%) | 0 (0.0%) |
| Transportation | 2 (100.0%) | 0 (0.0%) |
| Material Moving | 6 (50.0%) | 6 (50.0%) |
| Total (Category) | 27 (81.8%) | 6 (18.2%) |
| Total (Overall) | 251 (50.0%) | 251 (50.0%) |
Employment Industries by Sex in Arnolds Park
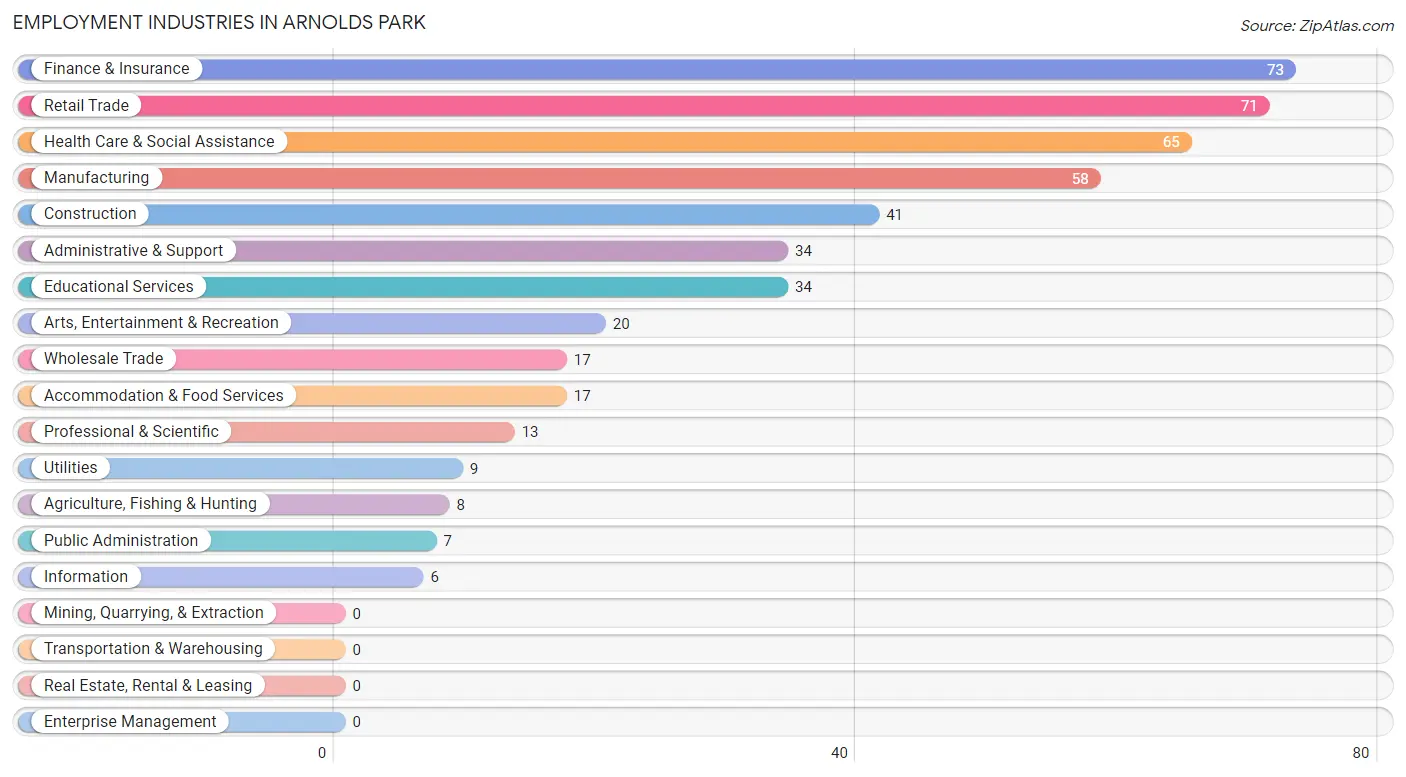
Employment Industries in Arnolds Park
The major employment industries in Arnolds Park include Finance & Insurance (73 | 14.5%), Retail Trade (71 | 14.1%), Health Care & Social Assistance (65 | 13.0%), Manufacturing (58 | 11.6%), and Construction (41 | 8.2%).
Employment Industries by Sex in Arnolds Park
The Arnolds Park industries that see more men than women are Information (100.0%), Construction (87.8%), and Utilities (77.8%), whereas the industries that tend to have a higher number of women are Administrative & Support (85.3%), Health Care & Social Assistance (84.6%), and Agriculture, Fishing & Hunting (75.0%).
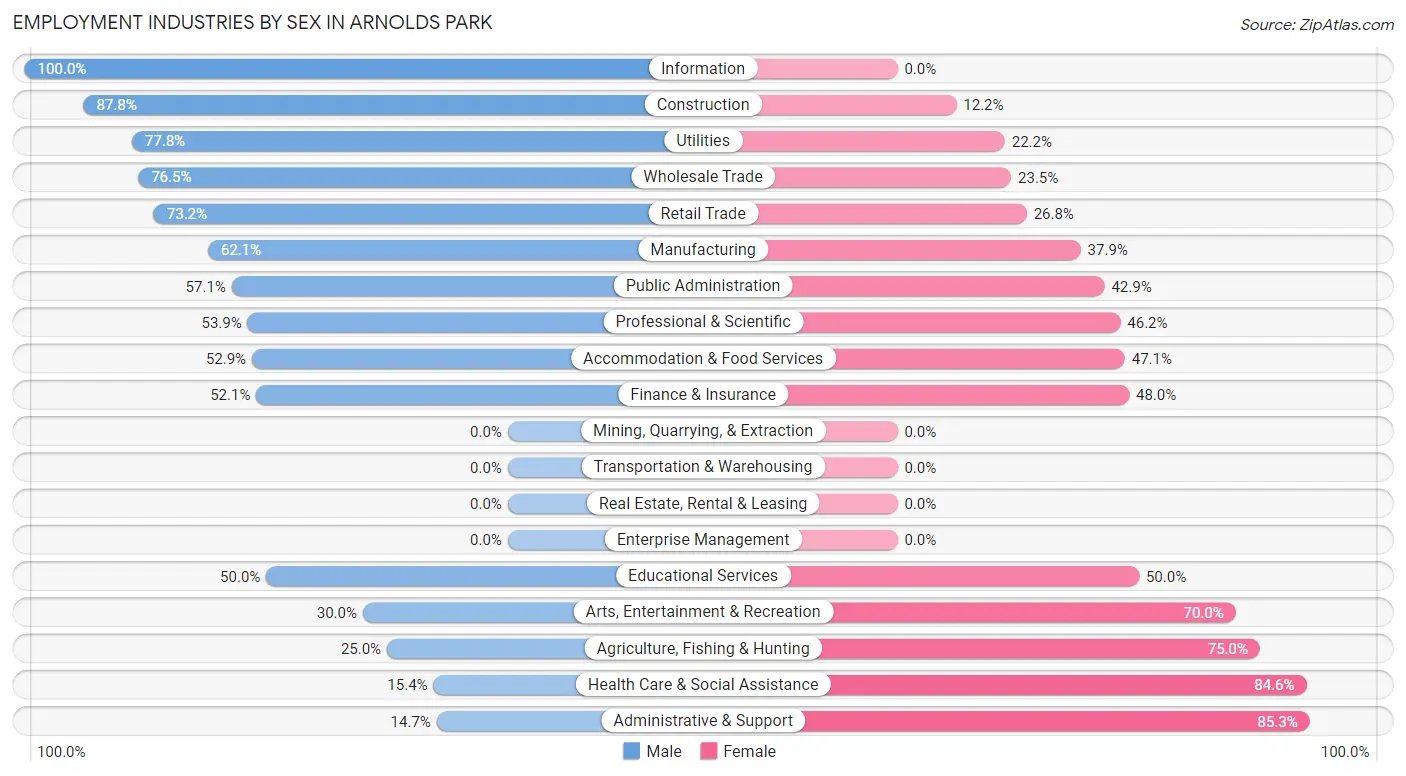
| Industry | Male | Female |
| Agriculture, Fishing & Hunting | 2 (25.0%) | 6 (75.0%) |
| Mining, Quarrying, & Extraction | 0 (0.0%) | 0 (0.0%) |
| Construction | 36 (87.8%) | 5 (12.2%) |
| Manufacturing | 36 (62.1%) | 22 (37.9%) |
| Wholesale Trade | 13 (76.5%) | 4 (23.5%) |
| Retail Trade | 52 (73.2%) | 19 (26.8%) |
| Transportation & Warehousing | 0 (0.0%) | 0 (0.0%) |
| Utilities | 7 (77.8%) | 2 (22.2%) |
| Information | 6 (100.0%) | 0 (0.0%) |
| Finance & Insurance | 38 (52.0%) | 35 (47.9%) |
| Real Estate, Rental & Leasing | 0 (0.0%) | 0 (0.0%) |
| Professional & Scientific | 7 (53.8%) | 6 (46.2%) |
| Enterprise Management | 0 (0.0%) | 0 (0.0%) |
| Administrative & Support | 5 (14.7%) | 29 (85.3%) |
| Educational Services | 17 (50.0%) | 17 (50.0%) |
| Health Care & Social Assistance | 10 (15.4%) | 55 (84.6%) |
| Arts, Entertainment & Recreation | 6 (30.0%) | 14 (70.0%) |
| Accommodation & Food Services | 9 (52.9%) | 8 (47.1%) |
| Public Administration | 4 (57.1%) | 3 (42.9%) |
| Total | 251 (50.0%) | 251 (50.0%) |
Education in Arnolds Park
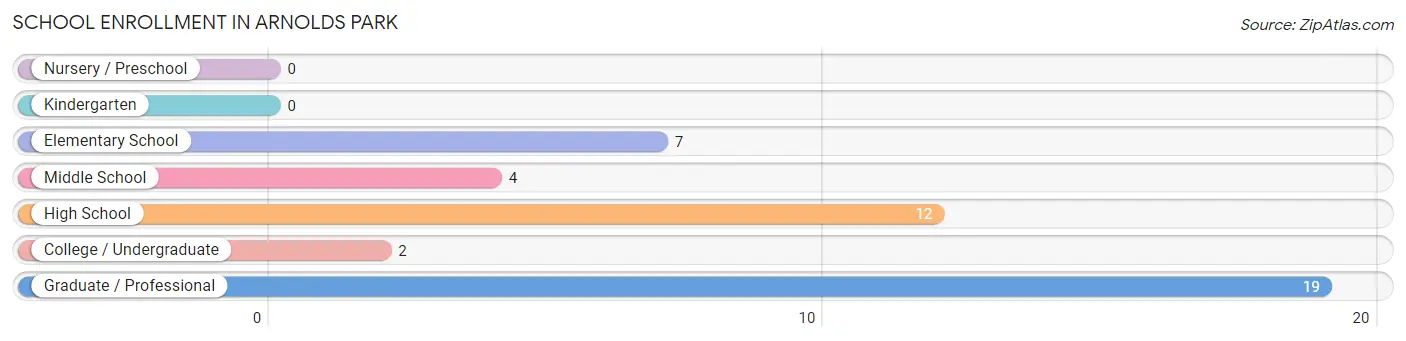
School Enrollment in Arnolds Park
The most common levels of schooling among the 44 students in Arnolds Park are graduate / professional (19 | 43.2%), high school (12 | 27.3%), and elementary school (7 | 15.9%).
| School Level | # Students | % Students |
| Nursery / Preschool | 0 | 0.0% |
| Kindergarten | 0 | 0.0% |
| Elementary School | 7 | 15.9% |
| Middle School | 4 | 9.1% |
| High School | 12 | 27.3% |
| College / Undergraduate | 2 | 4.5% |
| Graduate / Professional | 19 | 43.2% |
| Total | 44 | 100.0% |
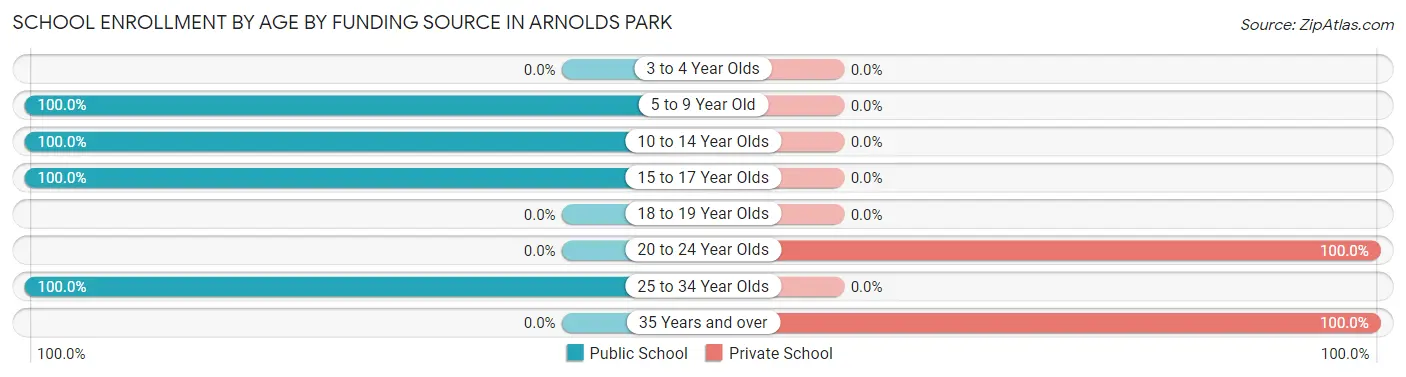
School Enrollment by Age by Funding Source in Arnolds Park
Out of a total of 44 students who are enrolled in schools in Arnolds Park, 3 (6.8%) attend a private institution, while the remaining 41 (93.2%) are enrolled in public schools. The age group of 20 to 24 year olds has the highest likelihood of being enrolled in private schools, with 1 (100.0% in the age bracket) enrolled. Conversely, the age group of 5 to 9 year old has the lowest likelihood of being enrolled in a private school, with 7 (100.0% in the age bracket) attending a public institution.
| Age Bracket | Public School | Private School |
| 3 to 4 Year Olds | 0 (0.0%) | 0 (0.0%) |
| 5 to 9 Year Old | 7 (100.0%) | 0 (0.0%) |
| 10 to 14 Year Olds | 4 (100.0%) | 0 (0.0%) |
| 15 to 17 Year Olds | 12 (100.0%) | 0 (0.0%) |
| 18 to 19 Year Olds | 0 (0.0%) | 0 (0.0%) |
| 20 to 24 Year Olds | 0 (0.0%) | 1 (100.0%) |
| 25 to 34 Year Olds | 18 (100.0%) | 0 (0.0%) |
| 35 Years and over | 0 (0.0%) | 2 (100.0%) |
| Total | 41 (93.2%) | 3 (6.8%) |
Educational Attainment by Field of Study in Arnolds Park
Education (58 | 15.5%), social sciences (53 | 14.2%), business (49 | 13.1%), communications (38 | 10.2%), and liberal arts & history (35 | 9.4%) are the most common fields of study among 374 individuals in Arnolds Park who have obtained a bachelor's degree or higher.
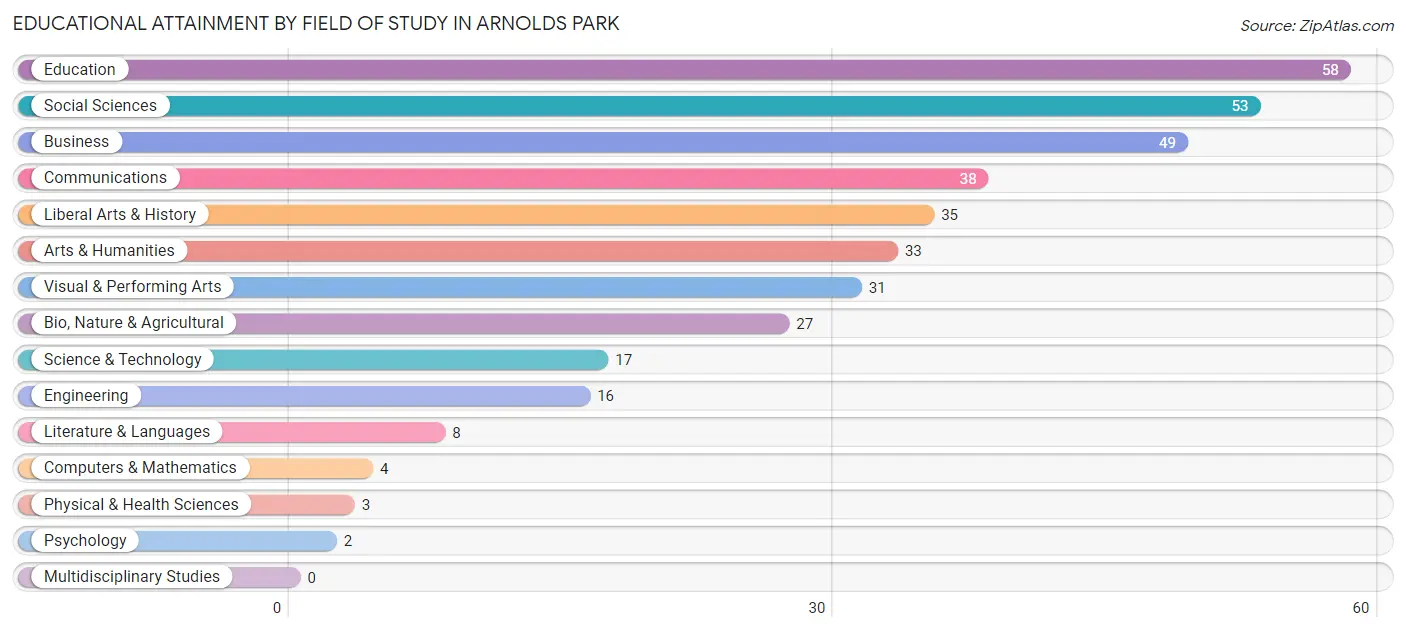
| Field of Study | # Graduates | % Graduates |
| Computers & Mathematics | 4 | 1.1% |
| Bio, Nature & Agricultural | 27 | 7.2% |
| Physical & Health Sciences | 3 | 0.8% |
| Psychology | 2 | 0.5% |
| Social Sciences | 53 | 14.2% |
| Engineering | 16 | 4.3% |
| Multidisciplinary Studies | 0 | 0.0% |
| Science & Technology | 17 | 4.5% |
| Business | 49 | 13.1% |
| Education | 58 | 15.5% |
| Literature & Languages | 8 | 2.1% |
| Liberal Arts & History | 35 | 9.4% |
| Visual & Performing Arts | 31 | 8.3% |
| Communications | 38 | 10.2% |
| Arts & Humanities | 33 | 8.8% |
| Total | 374 | 100.0% |
Transportation & Commute in Arnolds Park
Vehicle Availability by Sex in Arnolds Park
The most prevalent vehicle ownership categories in Arnolds Park are males with 2 vehicles (136, accounting for 54.2%) and females with 2 vehicles (133, making up 54.4%).
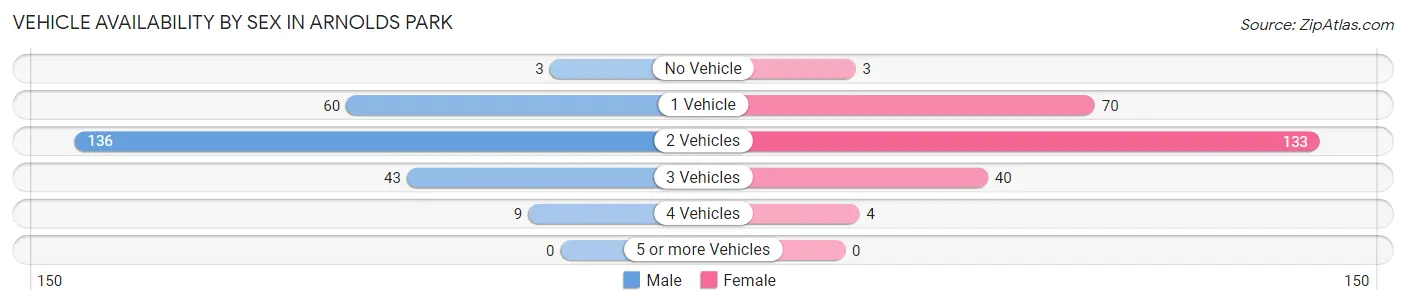
| Vehicles Available | Male | Female |
| No Vehicle | 3 (1.2%) | 3 (1.2%) |
| 1 Vehicle | 60 (23.9%) | 70 (28.0%) |
| 2 Vehicles | 136 (54.2%) | 133 (53.2%) |
| 3 Vehicles | 43 (17.1%) | 40 (16.0%) |
| 4 Vehicles | 9 (3.6%) | 4 (1.6%) |
| 5 or more Vehicles | 0 (0.0%) | 0 (0.0%) |
| Total | 251 (100.0%) | 250 (100.0%) |
Commute Time in Arnolds Park
The most frequently occuring commute durations in Arnolds Park are 10 to 14 minutes (165 commuters, 35.9%), 15 to 19 minutes (88 commuters, 19.1%), and 20 to 24 minutes (52 commuters, 11.3%).
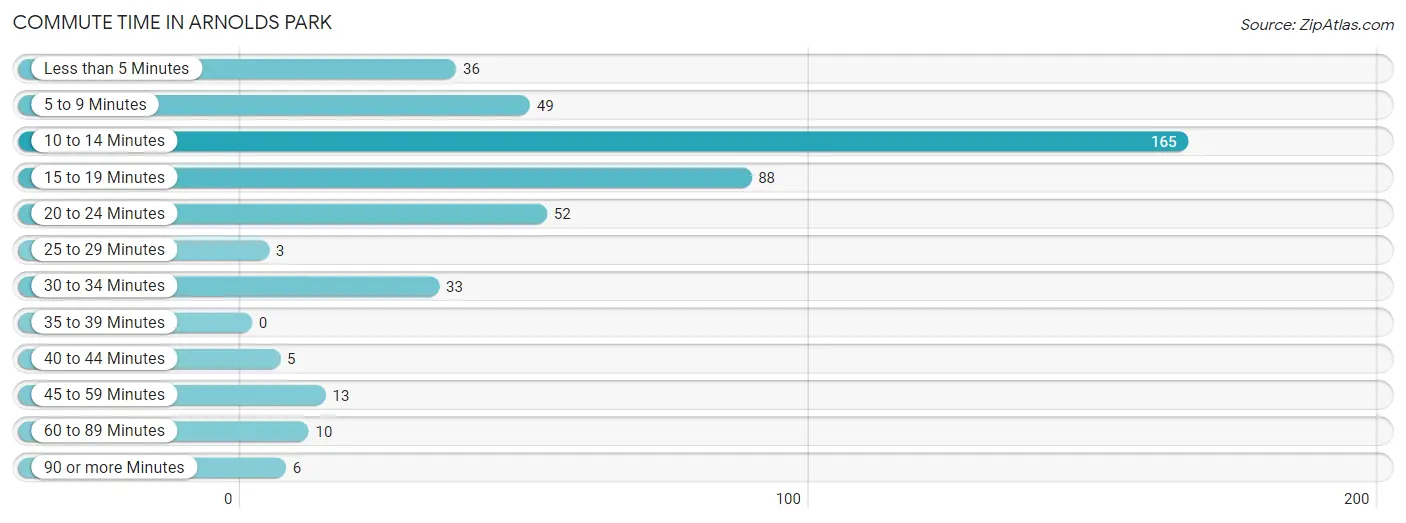
| Commute Time | # Commuters | % Commuters |
| Less than 5 Minutes | 36 | 7.8% |
| 5 to 9 Minutes | 49 | 10.6% |
| 10 to 14 Minutes | 165 | 35.9% |
| 15 to 19 Minutes | 88 | 19.1% |
| 20 to 24 Minutes | 52 | 11.3% |
| 25 to 29 Minutes | 3 | 0.6% |
| 30 to 34 Minutes | 33 | 7.2% |
| 35 to 39 Minutes | 0 | 0.0% |
| 40 to 44 Minutes | 5 | 1.1% |
| 45 to 59 Minutes | 13 | 2.8% |
| 60 to 89 Minutes | 10 | 2.2% |
| 90 or more Minutes | 6 | 1.3% |
Commute Time by Sex in Arnolds Park
The most common commute times in Arnolds Park are 10 to 14 minutes (108 commuters, 44.8%) for males and 15 to 19 minutes (59 commuters, 26.9%) for females.
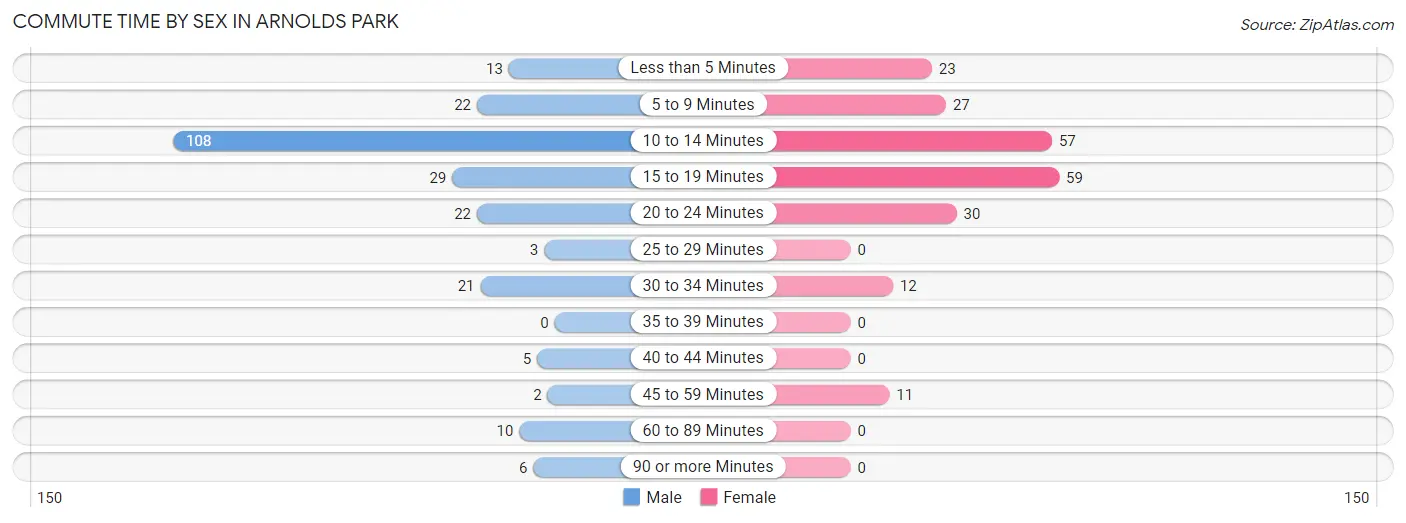
| Commute Time | Male | Female |
| Less than 5 Minutes | 13 (5.4%) | 23 (10.5%) |
| 5 to 9 Minutes | 22 (9.1%) | 27 (12.3%) |
| 10 to 14 Minutes | 108 (44.8%) | 57 (26.0%) |
| 15 to 19 Minutes | 29 (12.0%) | 59 (26.9%) |
| 20 to 24 Minutes | 22 (9.1%) | 30 (13.7%) |
| 25 to 29 Minutes | 3 (1.2%) | 0 (0.0%) |
| 30 to 34 Minutes | 21 (8.7%) | 12 (5.5%) |
| 35 to 39 Minutes | 0 (0.0%) | 0 (0.0%) |
| 40 to 44 Minutes | 5 (2.1%) | 0 (0.0%) |
| 45 to 59 Minutes | 2 (0.8%) | 11 (5.0%) |
| 60 to 89 Minutes | 10 (4.2%) | 0 (0.0%) |
| 90 or more Minutes | 6 (2.5%) | 0 (0.0%) |
Time of Departure to Work by Sex in Arnolds Park
The most frequent times of departure to work in Arnolds Park are 7:30 AM to 7:59 AM (42, 17.4%) for males and 7:30 AM to 7:59 AM (53, 24.2%) for females.
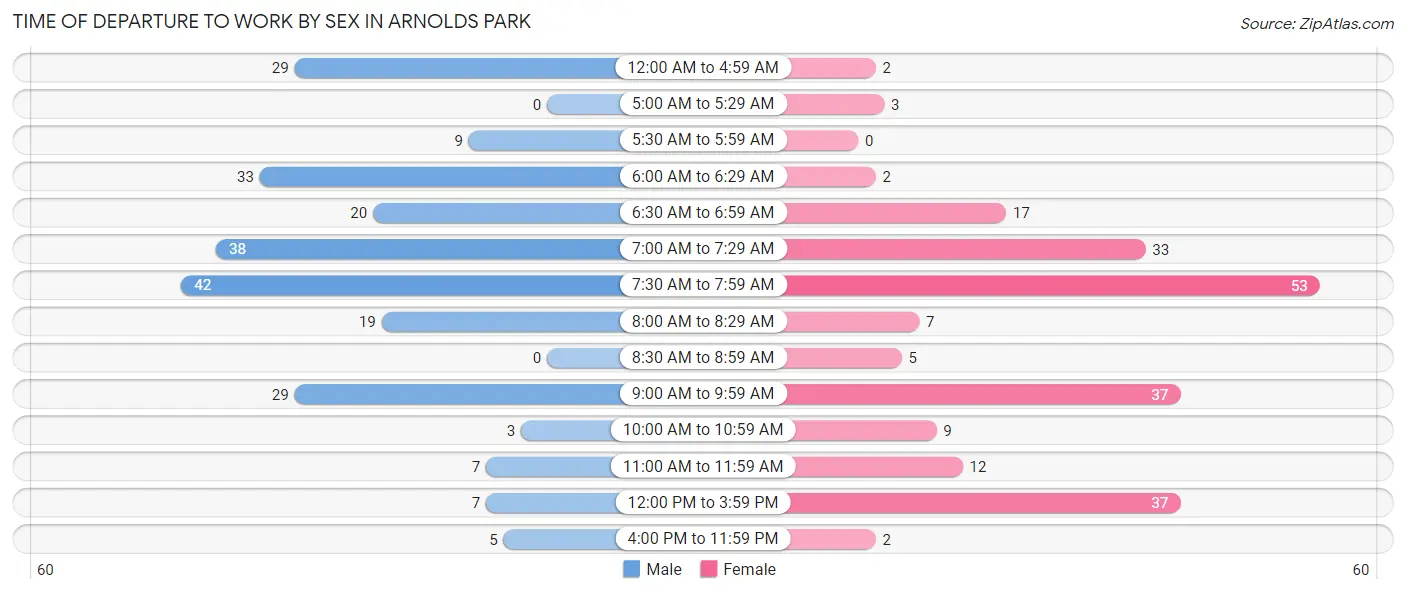
| Time of Departure | Male | Female |
| 12:00 AM to 4:59 AM | 29 (12.0%) | 2 (0.9%) |
| 5:00 AM to 5:29 AM | 0 (0.0%) | 3 (1.4%) |
| 5:30 AM to 5:59 AM | 9 (3.7%) | 0 (0.0%) |
| 6:00 AM to 6:29 AM | 33 (13.7%) | 2 (0.9%) |
| 6:30 AM to 6:59 AM | 20 (8.3%) | 17 (7.8%) |
| 7:00 AM to 7:29 AM | 38 (15.8%) | 33 (15.1%) |
| 7:30 AM to 7:59 AM | 42 (17.4%) | 53 (24.2%) |
| 8:00 AM to 8:29 AM | 19 (7.9%) | 7 (3.2%) |
| 8:30 AM to 8:59 AM | 0 (0.0%) | 5 (2.3%) |
| 9:00 AM to 9:59 AM | 29 (12.0%) | 37 (16.9%) |
| 10:00 AM to 10:59 AM | 3 (1.2%) | 9 (4.1%) |
| 11:00 AM to 11:59 AM | 7 (2.9%) | 12 (5.5%) |
| 12:00 PM to 3:59 PM | 7 (2.9%) | 37 (16.9%) |
| 4:00 PM to 11:59 PM | 5 (2.1%) | 2 (0.9%) |
| Total | 241 (100.0%) | 219 (100.0%) |
Housing Occupancy in Arnolds Park
Occupancy by Ownership in Arnolds Park
Of the total 572 dwellings in Arnolds Park, owner-occupied units account for 491 (85.8%), while renter-occupied units make up 81 (14.2%).
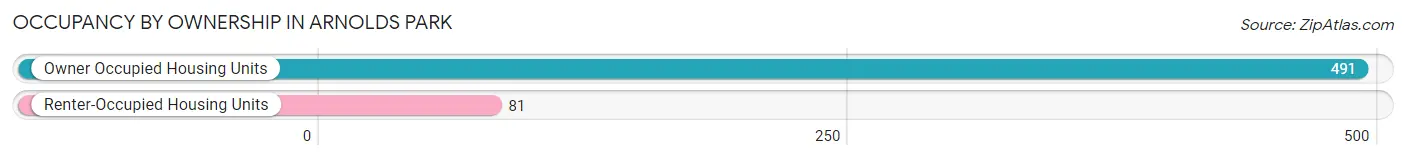
| Occupancy | # Housing Units | % Housing Units |
| Owner Occupied Housing Units | 491 | 85.8% |
| Renter-Occupied Housing Units | 81 | 14.2% |
| Total Occupied Housing Units | 572 | 100.0% |
Occupancy by Household Size in Arnolds Park
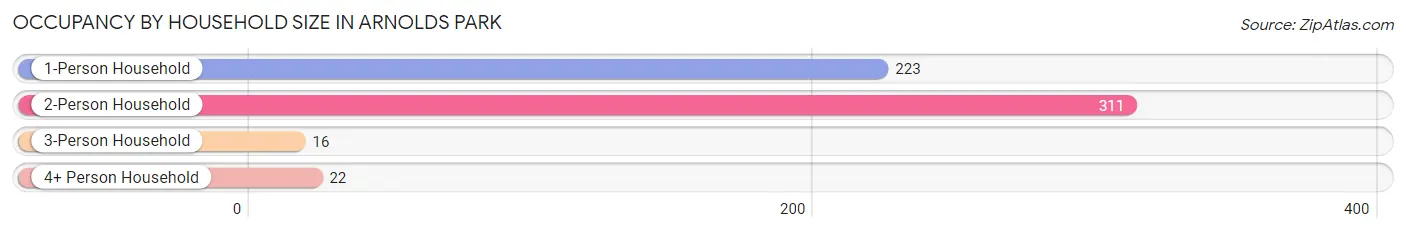
| Household Size | # Housing Units | % Housing Units |
| 1-Person Household | 223 | 39.0% |
| 2-Person Household | 311 | 54.4% |
| 3-Person Household | 16 | 2.8% |
| 4+ Person Household | 22 | 3.8% |
| Total Housing Units | 572 | 100.0% |
Occupancy by Ownership by Household Size in Arnolds Park
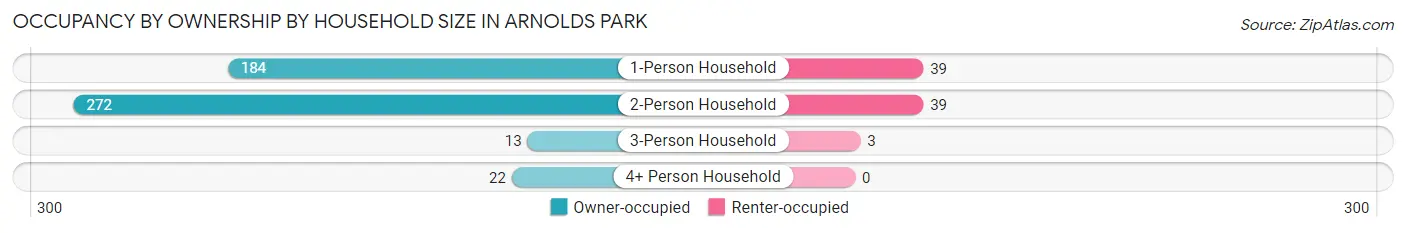
| Household Size | Owner-occupied | Renter-occupied |
| 1-Person Household | 184 (82.5%) | 39 (17.5%) |
| 2-Person Household | 272 (87.5%) | 39 (12.5%) |
| 3-Person Household | 13 (81.2%) | 3 (18.8%) |
| 4+ Person Household | 22 (100.0%) | 0 (0.0%) |
| Total Housing Units | 491 (85.8%) | 81 (14.2%) |
Occupancy by Educational Attainment in Arnolds Park
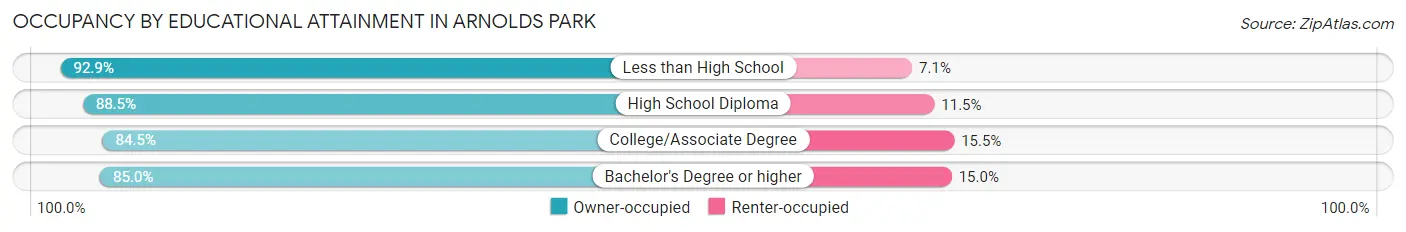
| Household Size | Owner-occupied | Renter-occupied |
| Less than High School | 13 (92.9%) | 1 (7.1%) |
| High School Diploma | 115 (88.5%) | 15 (11.5%) |
| College/Associate Degree | 153 (84.5%) | 28 (15.5%) |
| Bachelor's Degree or higher | 210 (85.0%) | 37 (15.0%) |
Occupancy by Age of Householder in Arnolds Park
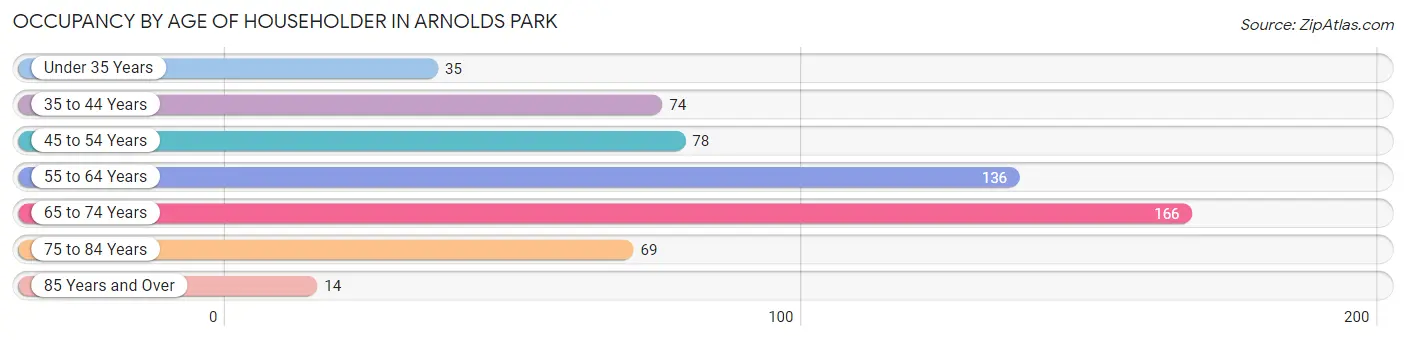
| Age Bracket | # Households | % Households |
| Under 35 Years | 35 | 6.1% |
| 35 to 44 Years | 74 | 12.9% |
| 45 to 54 Years | 78 | 13.6% |
| 55 to 64 Years | 136 | 23.8% |
| 65 to 74 Years | 166 | 29.0% |
| 75 to 84 Years | 69 | 12.1% |
| 85 Years and Over | 14 | 2.5% |
| Total | 572 | 100.0% |
Housing Finances in Arnolds Park
Median Income by Occupancy in Arnolds Park
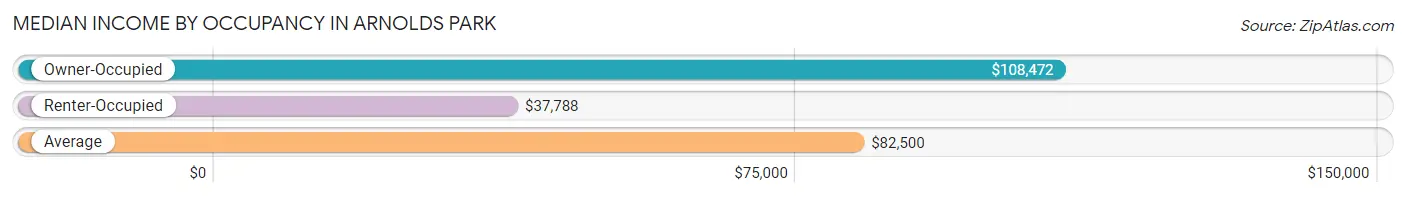
| Occupancy Type | # Households | Median Income |
| Owner-Occupied | 491 (85.8%) | $108,472 |
| Renter-Occupied | 81 (14.2%) | $37,788 |
| Average | 572 (100.0%) | $82,500 |
Occupancy by Householder Income Bracket in Arnolds Park
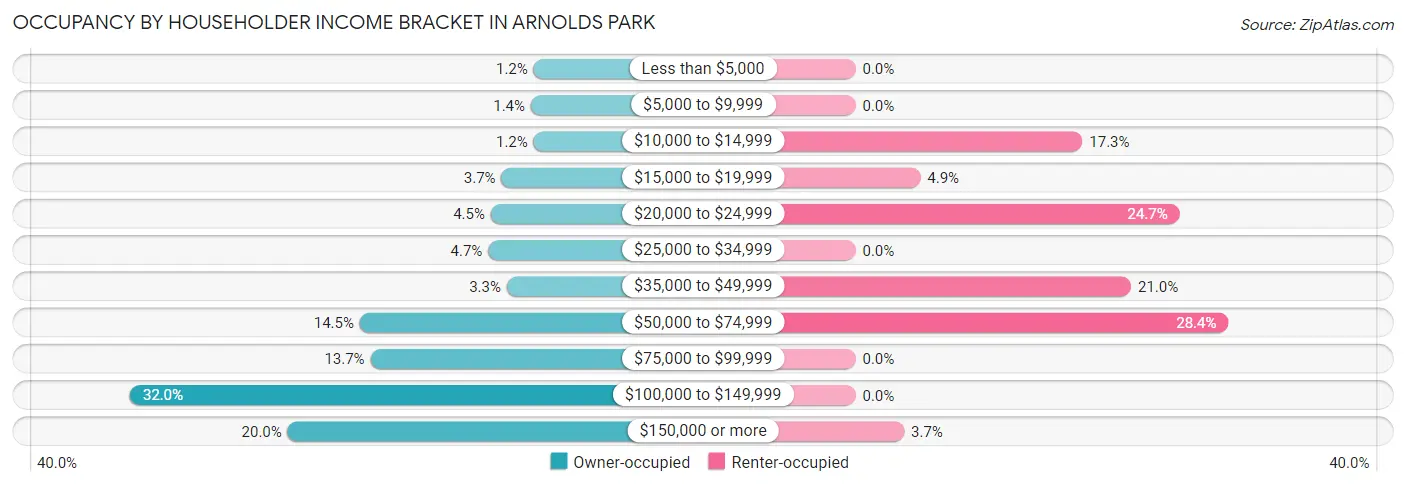
| Income Bracket | Owner-occupied | Renter-occupied |
| Less than $5,000 | 6 (1.2%) | 0 (0.0%) |
| $5,000 to $9,999 | 7 (1.4%) | 0 (0.0%) |
| $10,000 to $14,999 | 6 (1.2%) | 14 (17.3%) |
| $15,000 to $19,999 | 18 (3.7%) | 4 (4.9%) |
| $20,000 to $24,999 | 22 (4.5%) | 20 (24.7%) |
| $25,000 to $34,999 | 23 (4.7%) | 0 (0.0%) |
| $35,000 to $49,999 | 16 (3.3%) | 17 (21.0%) |
| $50,000 to $74,999 | 71 (14.5%) | 23 (28.4%) |
| $75,000 to $99,999 | 67 (13.7%) | 0 (0.0%) |
| $100,000 to $149,999 | 157 (32.0%) | 0 (0.0%) |
| $150,000 or more | 98 (20.0%) | 3 (3.7%) |
| Total | 491 (100.0%) | 81 (100.0%) |
Monthly Housing Cost Tiers in Arnolds Park
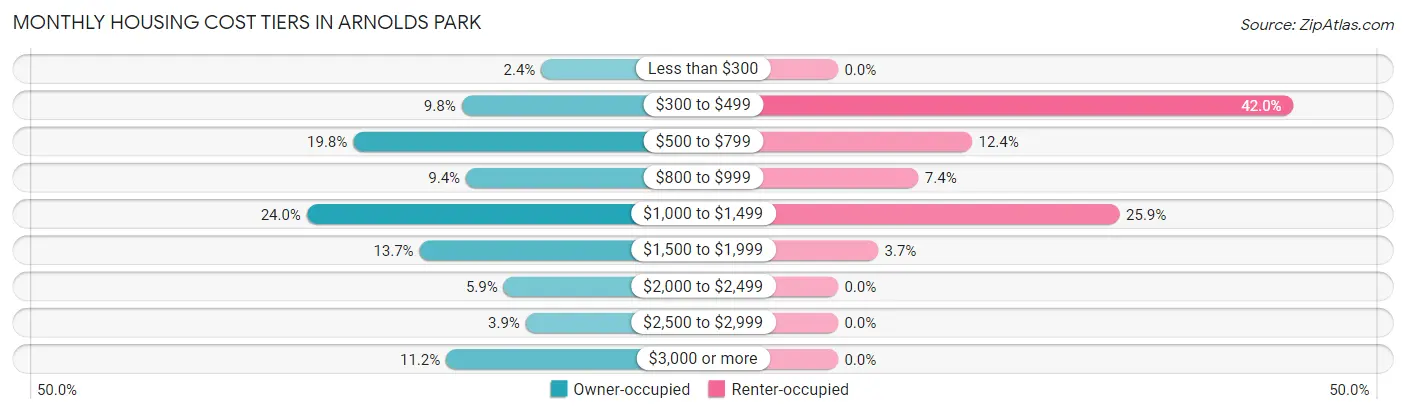
| Monthly Cost | Owner-occupied | Renter-occupied |
| Less than $300 | 12 (2.4%) | 0 (0.0%) |
| $300 to $499 | 48 (9.8%) | 34 (42.0%) |
| $500 to $799 | 97 (19.8%) | 10 (12.3%) |
| $800 to $999 | 46 (9.4%) | 6 (7.4%) |
| $1,000 to $1,499 | 118 (24.0%) | 21 (25.9%) |
| $1,500 to $1,999 | 67 (13.7%) | 3 (3.7%) |
| $2,000 to $2,499 | 29 (5.9%) | 0 (0.0%) |
| $2,500 to $2,999 | 19 (3.9%) | 0 (0.0%) |
| $3,000 or more | 55 (11.2%) | 0 (0.0%) |
| Total | 491 (100.0%) | 81 (100.0%) |
Physical Housing Characteristics in Arnolds Park
Housing Structures in Arnolds Park
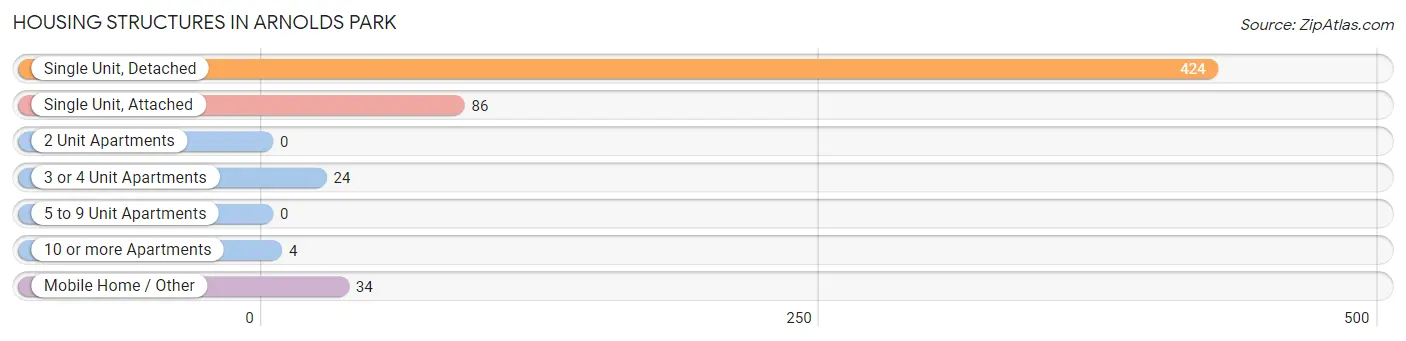
| Structure Type | # Housing Units | % Housing Units |
| Single Unit, Detached | 424 | 74.1% |
| Single Unit, Attached | 86 | 15.0% |
| 2 Unit Apartments | 0 | 0.0% |
| 3 or 4 Unit Apartments | 24 | 4.2% |
| 5 to 9 Unit Apartments | 0 | 0.0% |
| 10 or more Apartments | 4 | 0.7% |
| Mobile Home / Other | 34 | 5.9% |
| Total | 572 | 100.0% |
Housing Structures by Occupancy in Arnolds Park
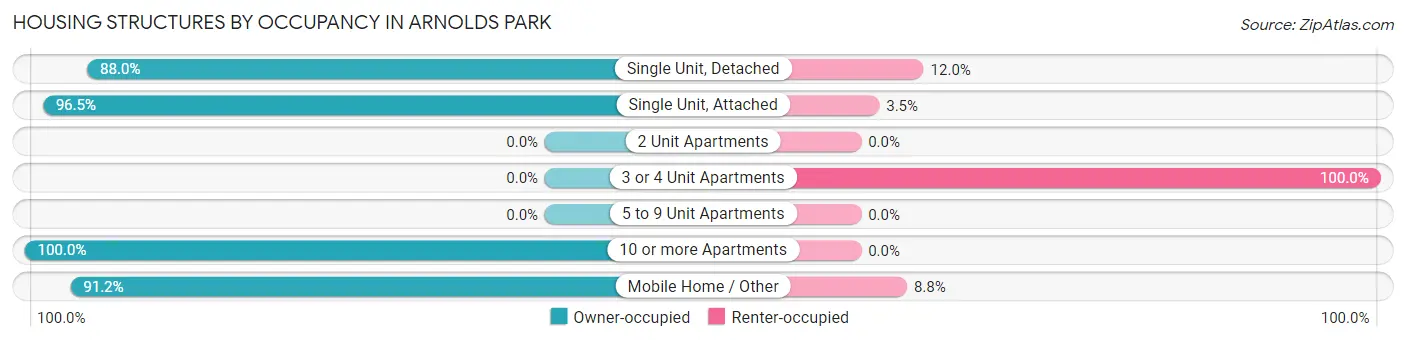
| Structure Type | Owner-occupied | Renter-occupied |
| Single Unit, Detached | 373 (88.0%) | 51 (12.0%) |
| Single Unit, Attached | 83 (96.5%) | 3 (3.5%) |
| 2 Unit Apartments | 0 (0.0%) | 0 (0.0%) |
| 3 or 4 Unit Apartments | 0 (0.0%) | 24 (100.0%) |
| 5 to 9 Unit Apartments | 0 (0.0%) | 0 (0.0%) |
| 10 or more Apartments | 4 (100.0%) | 0 (0.0%) |
| Mobile Home / Other | 31 (91.2%) | 3 (8.8%) |
| Total | 491 (85.8%) | 81 (14.2%) |
Housing Structures by Number of Rooms in Arnolds Park
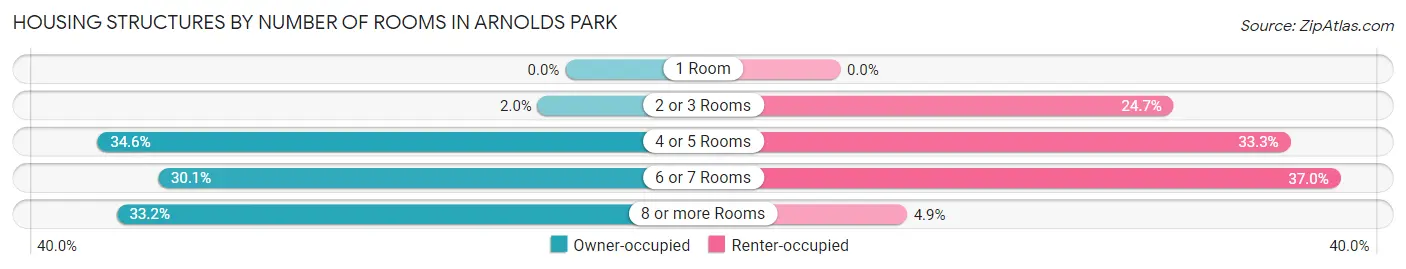
| Number of Rooms | Owner-occupied | Renter-occupied |
| 1 Room | 0 (0.0%) | 0 (0.0%) |
| 2 or 3 Rooms | 10 (2.0%) | 20 (24.7%) |
| 4 or 5 Rooms | 170 (34.6%) | 27 (33.3%) |
| 6 or 7 Rooms | 148 (30.1%) | 30 (37.0%) |
| 8 or more Rooms | 163 (33.2%) | 4 (4.9%) |
| Total | 491 (100.0%) | 81 (100.0%) |
Housing Structure by Heating Type in Arnolds Park
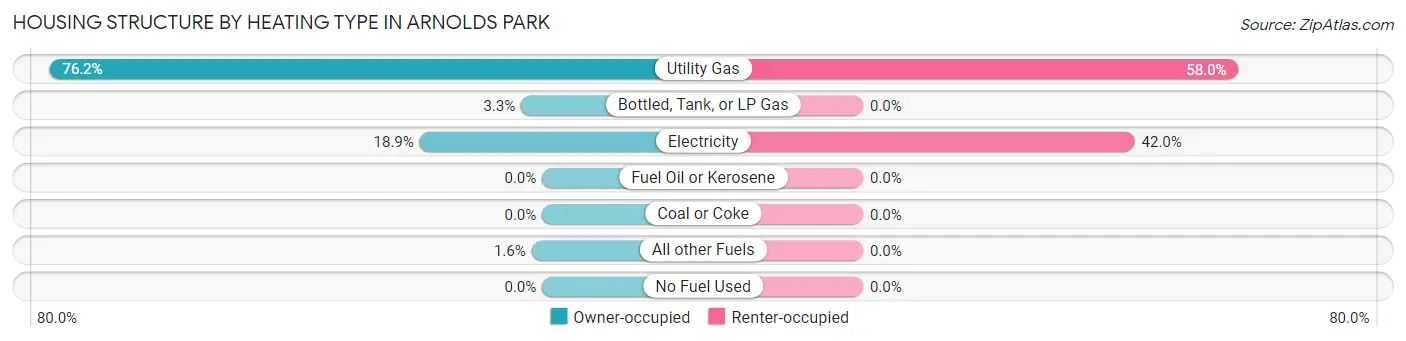
| Heating Type | Owner-occupied | Renter-occupied |
| Utility Gas | 374 (76.2%) | 47 (58.0%) |
| Bottled, Tank, or LP Gas | 16 (3.3%) | 0 (0.0%) |
| Electricity | 93 (18.9%) | 34 (42.0%) |
| Fuel Oil or Kerosene | 0 (0.0%) | 0 (0.0%) |
| Coal or Coke | 0 (0.0%) | 0 (0.0%) |
| All other Fuels | 8 (1.6%) | 0 (0.0%) |
| No Fuel Used | 0 (0.0%) | 0 (0.0%) |
| Total | 491 (100.0%) | 81 (100.0%) |
Household Vehicle Usage in Arnolds Park
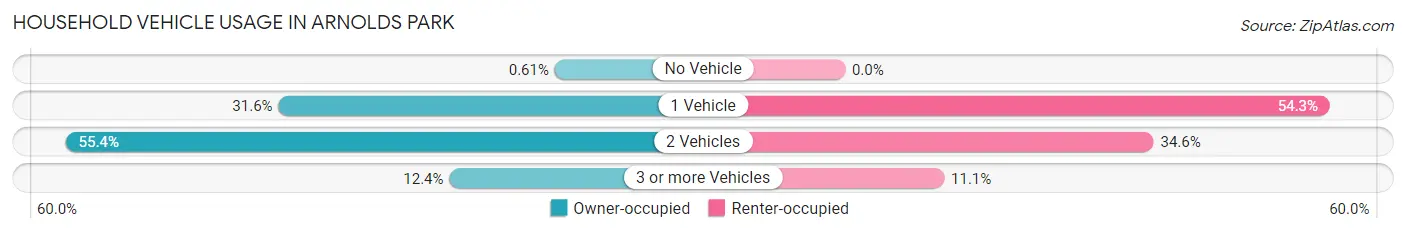
| Vehicles per Household | Owner-occupied | Renter-occupied |
| No Vehicle | 3 (0.6%) | 0 (0.0%) |
| 1 Vehicle | 155 (31.6%) | 44 (54.3%) |
| 2 Vehicles | 272 (55.4%) | 28 (34.6%) |
| 3 or more Vehicles | 61 (12.4%) | 9 (11.1%) |
| Total | 491 (100.0%) | 81 (100.0%) |
Real Estate & Mortgages in Arnolds Park
Real Estate and Mortgage Overview in Arnolds Park
| Characteristic | Without Mortgage | With Mortgage |
| Housing Units | 221 | 270 |
| Median Property Value | $380,300 | $281,500 |
| Median Household Income | $84,688 | $54 |
| Monthly Housing Costs | $679 | $55 |
| Real Estate Taxes | $3,643 | $0 |
Property Value by Mortgage Status in Arnolds Park
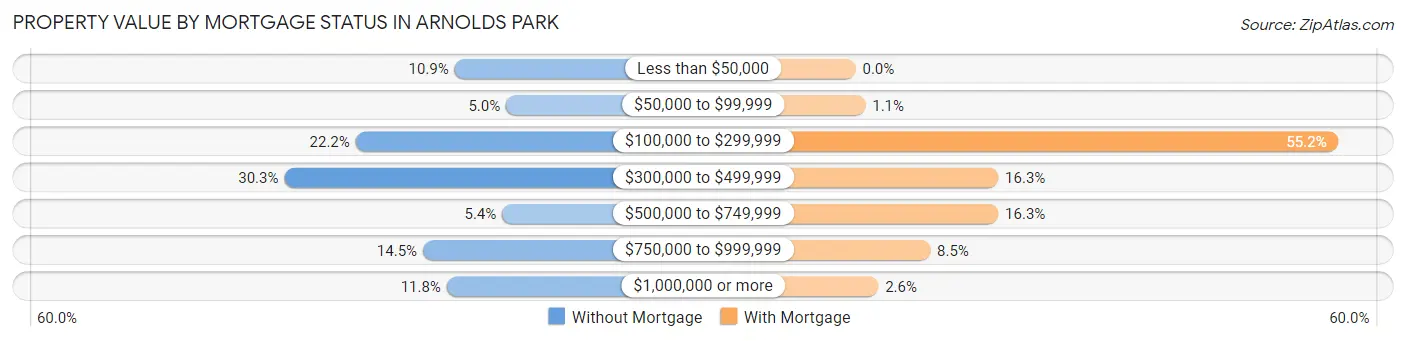
| Property Value | Without Mortgage | With Mortgage |
| Less than $50,000 | 24 (10.9%) | 0 (0.0%) |
| $50,000 to $99,999 | 11 (5.0%) | 3 (1.1%) |
| $100,000 to $299,999 | 49 (22.2%) | 149 (55.2%) |
| $300,000 to $499,999 | 67 (30.3%) | 44 (16.3%) |
| $500,000 to $749,999 | 12 (5.4%) | 44 (16.3%) |
| $750,000 to $999,999 | 32 (14.5%) | 23 (8.5%) |
| $1,000,000 or more | 26 (11.8%) | 7 (2.6%) |
| Total | 221 (100.0%) | 270 (100.0%) |
Household Income by Mortgage Status in Arnolds Park
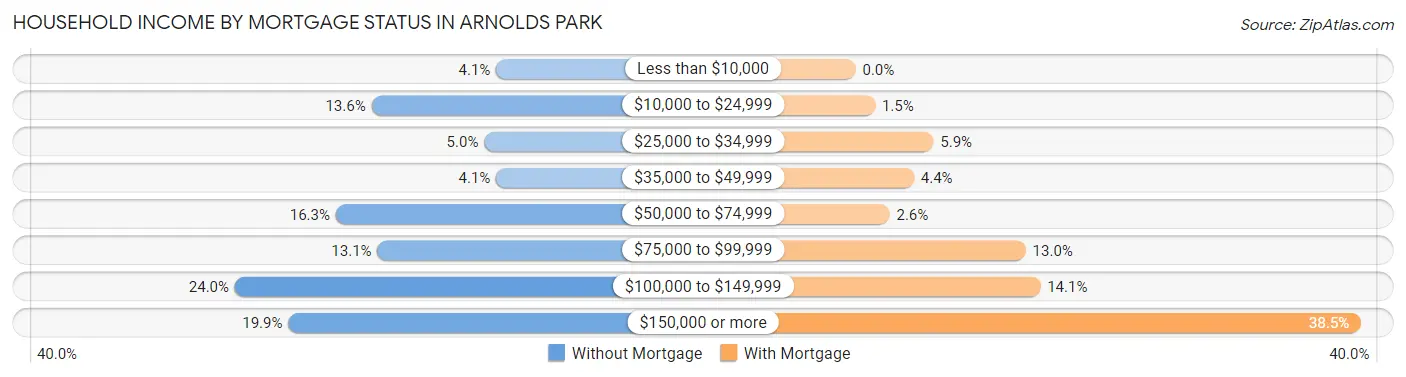
| Household Income | Without Mortgage | With Mortgage |
| Less than $10,000 | 9 (4.1%) | 0 (0.0%) |
| $10,000 to $24,999 | 30 (13.6%) | 4 (1.5%) |
| $25,000 to $34,999 | 11 (5.0%) | 16 (5.9%) |
| $35,000 to $49,999 | 9 (4.1%) | 12 (4.4%) |
| $50,000 to $74,999 | 36 (16.3%) | 7 (2.6%) |
| $75,000 to $99,999 | 29 (13.1%) | 35 (13.0%) |
| $100,000 to $149,999 | 53 (24.0%) | 38 (14.1%) |
| $150,000 or more | 44 (19.9%) | 104 (38.5%) |
| Total | 221 (100.0%) | 270 (100.0%) |
Property Value to Household Income Ratio in Arnolds Park
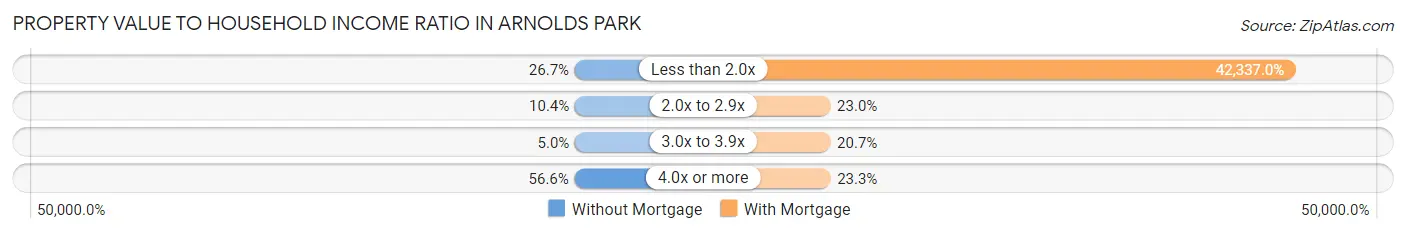
| Value-to-Income Ratio | Without Mortgage | With Mortgage |
| Less than 2.0x | 59 (26.7%) | 114,310 (42,337.0%) |
| 2.0x to 2.9x | 23 (10.4%) | 62 (23.0%) |
| 3.0x to 3.9x | 11 (5.0%) | 56 (20.7%) |
| 4.0x or more | 125 (56.6%) | 63 (23.3%) |
| Total | 221 (100.0%) | 270 (100.0%) |
Real Estate Taxes by Mortgage Status in Arnolds Park
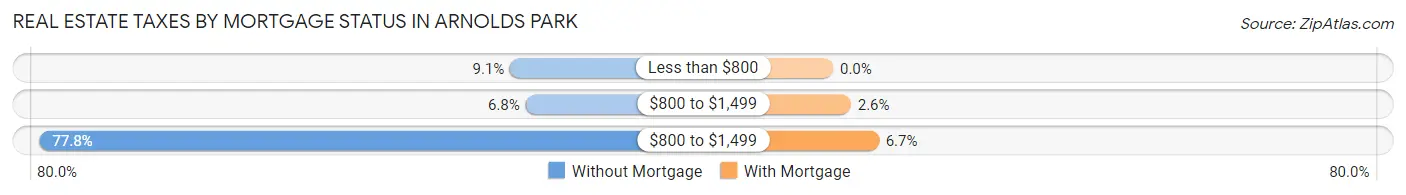
| Property Taxes | Without Mortgage | With Mortgage |
| Less than $800 | 20 (9.0%) | 0 (0.0%) |
| $800 to $1,499 | 15 (6.8%) | 7 (2.6%) |
| $800 to $1,499 | 172 (77.8%) | 18 (6.7%) |
| Total | 221 (100.0%) | 270 (100.0%) |
Health & Disability in Arnolds Park
Health Insurance Coverage by Age in Arnolds Park
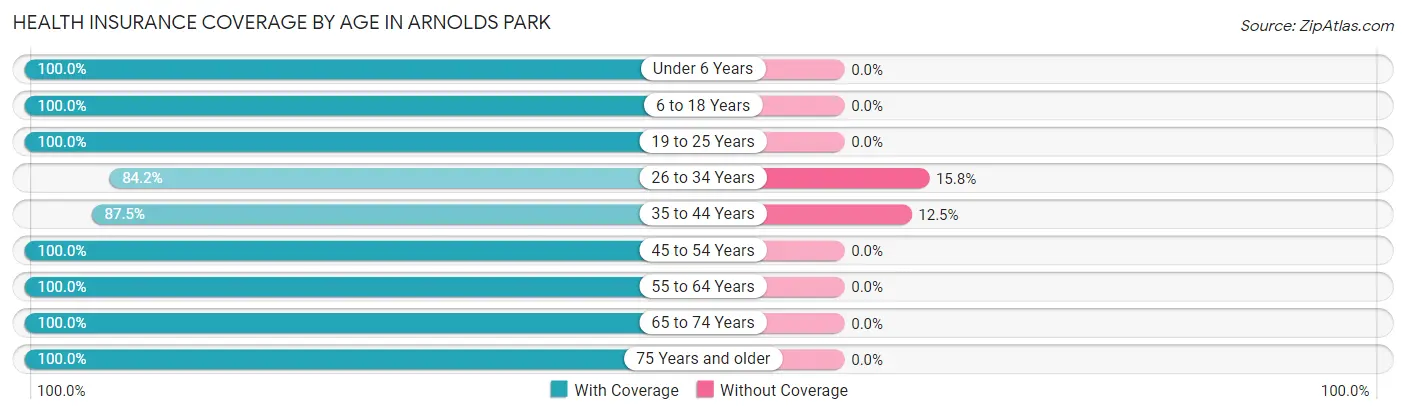
| Age Bracket | With Coverage | Without Coverage |
| Under 6 Years | 35 (100.0%) | 0 (0.0%) |
| 6 to 18 Years | 26 (100.0%) | 0 (0.0%) |
| 19 to 25 Years | 25 (100.0%) | 0 (0.0%) |
| 26 to 34 Years | 64 (84.2%) | 12 (15.8%) |
| 35 to 44 Years | 84 (87.5%) | 12 (12.5%) |
| 45 to 54 Years | 95 (100.0%) | 0 (0.0%) |
| 55 to 64 Years | 273 (100.0%) | 0 (0.0%) |
| 65 to 74 Years | 236 (100.0%) | 0 (0.0%) |
| 75 Years and older | 127 (100.0%) | 0 (0.0%) |
| Total | 965 (97.6%) | 24 (2.4%) |
Health Insurance Coverage by Citizenship Status in Arnolds Park
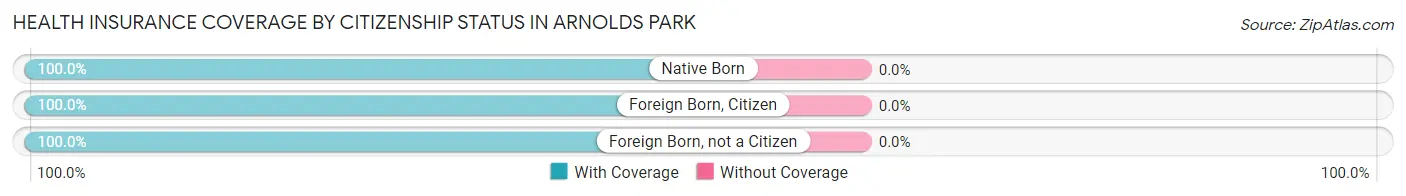
| Citizenship Status | With Coverage | Without Coverage |
| Native Born | 35 (100.0%) | 0 (0.0%) |
| Foreign Born, Citizen | 26 (100.0%) | 0 (0.0%) |
| Foreign Born, not a Citizen | 25 (100.0%) | 0 (0.0%) |
Health Insurance Coverage by Household Income in Arnolds Park
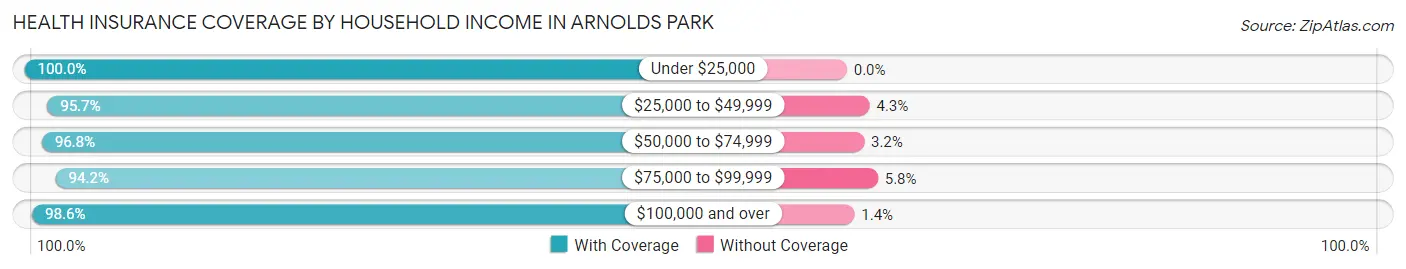
| Household Income | With Coverage | Without Coverage |
| Under $25,000 | 108 (100.0%) | 0 (0.0%) |
| $25,000 to $49,999 | 90 (95.7%) | 4 (4.3%) |
| $50,000 to $74,999 | 150 (96.8%) | 5 (3.2%) |
| $75,000 to $99,999 | 130 (94.2%) | 8 (5.8%) |
| $100,000 and over | 485 (98.6%) | 7 (1.4%) |
Public vs Private Health Insurance Coverage by Age in Arnolds Park
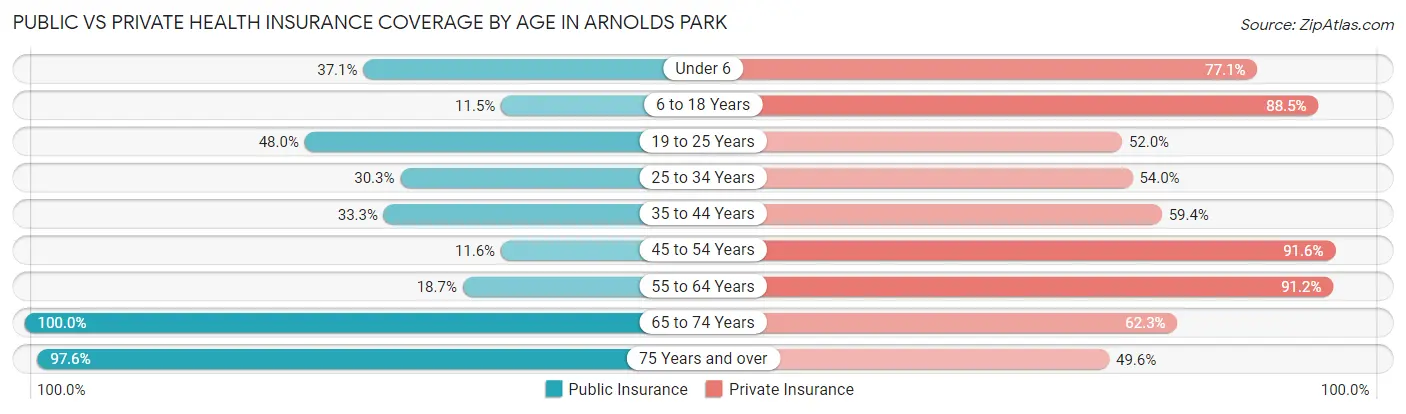
| Age Bracket | Public Insurance | Private Insurance |
| Under 6 | 13 (37.1%) | 27 (77.1%) |
| 6 to 18 Years | 3 (11.5%) | 23 (88.5%) |
| 19 to 25 Years | 12 (48.0%) | 13 (52.0%) |
| 25 to 34 Years | 23 (30.3%) | 41 (53.9%) |
| 35 to 44 Years | 32 (33.3%) | 57 (59.4%) |
| 45 to 54 Years | 11 (11.6%) | 87 (91.6%) |
| 55 to 64 Years | 51 (18.7%) | 249 (91.2%) |
| 65 to 74 Years | 236 (100.0%) | 147 (62.3%) |
| 75 Years and over | 124 (97.6%) | 63 (49.6%) |
| Total | 505 (51.1%) | 707 (71.5%) |
Disability Status by Sex by Age in Arnolds Park
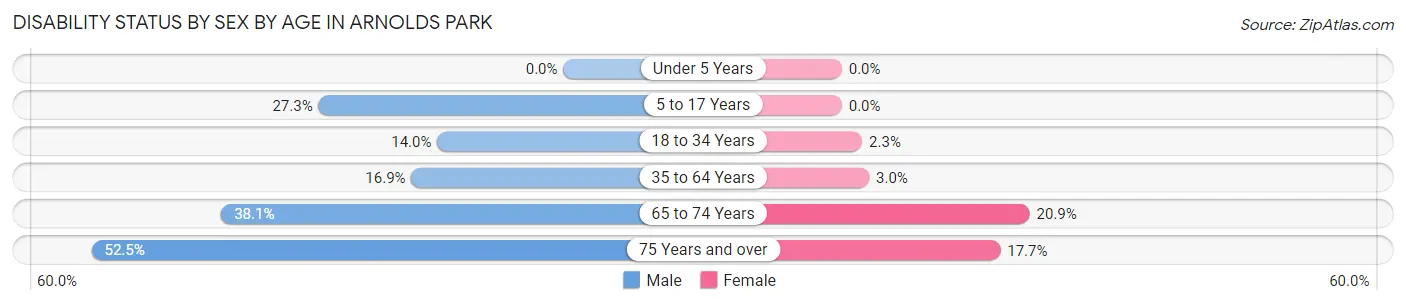
| Age Bracket | Male | Female |
| Under 5 Years | 0 (0.0%) | 0 (0.0%) |
| 5 to 17 Years | 3 (27.3%) | 0 (0.0%) |
| 18 to 34 Years | 8 (14.0%) | 1 (2.3%) |
| 35 to 64 Years | 34 (16.9%) | 8 (3.0%) |
| 65 to 74 Years | 48 (38.1%) | 23 (20.9%) |
| 75 Years and over | 31 (52.5%) | 12 (17.6%) |
Disability Class by Sex by Age in Arnolds Park
Disability Class: Hearing Difficulty
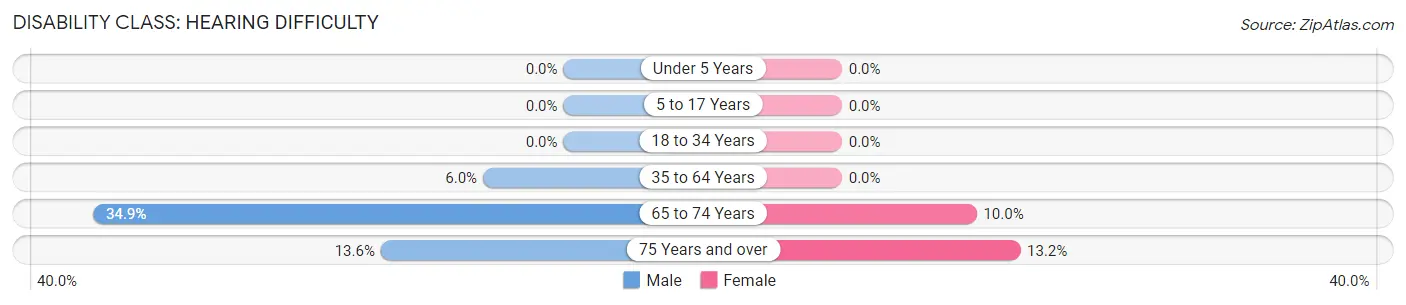
| Age Bracket | Male | Female |
| Under 5 Years | 0 (0.0%) | 0 (0.0%) |
| 5 to 17 Years | 0 (0.0%) | 0 (0.0%) |
| 18 to 34 Years | 0 (0.0%) | 0 (0.0%) |
| 35 to 64 Years | 12 (6.0%) | 0 (0.0%) |
| 65 to 74 Years | 44 (34.9%) | 11 (10.0%) |
| 75 Years and over | 8 (13.6%) | 9 (13.2%) |
Disability Class: Vision Difficulty
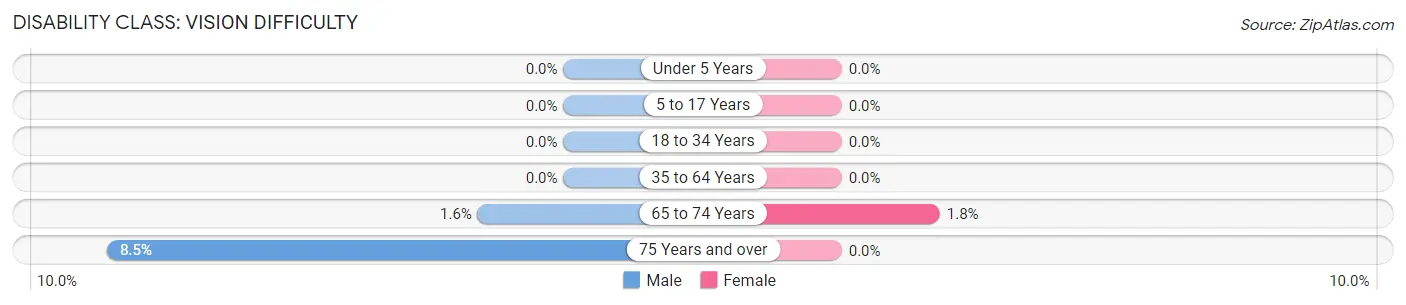
| Age Bracket | Male | Female |
| Under 5 Years | 0 (0.0%) | 0 (0.0%) |
| 5 to 17 Years | 0 (0.0%) | 0 (0.0%) |
| 18 to 34 Years | 0 (0.0%) | 0 (0.0%) |
| 35 to 64 Years | 0 (0.0%) | 0 (0.0%) |
| 65 to 74 Years | 2 (1.6%) | 2 (1.8%) |
| 75 Years and over | 5 (8.5%) | 0 (0.0%) |
Disability Class: Cognitive Difficulty
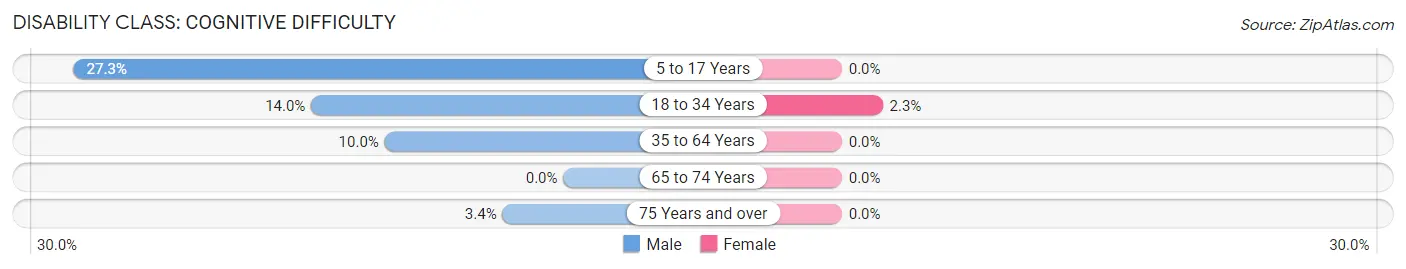
| Age Bracket | Male | Female |
| 5 to 17 Years | 3 (27.3%) | 0 (0.0%) |
| 18 to 34 Years | 8 (14.0%) | 1 (2.3%) |
| 35 to 64 Years | 20 (10.0%) | 0 (0.0%) |
| 65 to 74 Years | 0 (0.0%) | 0 (0.0%) |
| 75 Years and over | 2 (3.4%) | 0 (0.0%) |
Disability Class: Ambulatory Difficulty
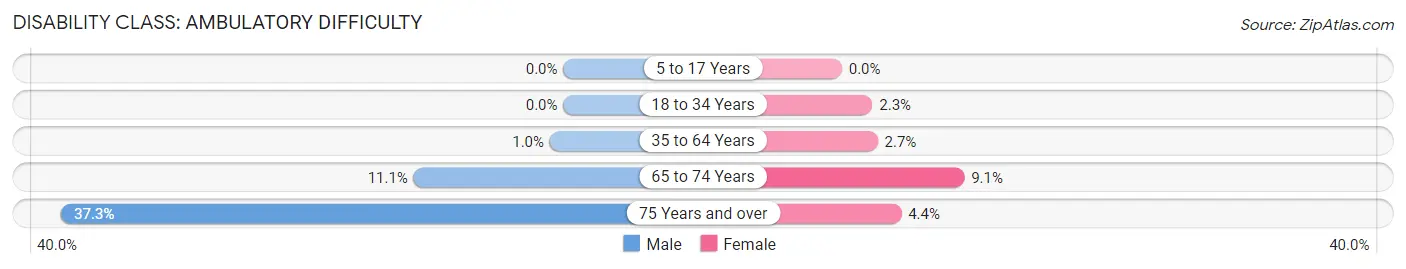
| Age Bracket | Male | Female |
| 5 to 17 Years | 0 (0.0%) | 0 (0.0%) |
| 18 to 34 Years | 0 (0.0%) | 1 (2.3%) |
| 35 to 64 Years | 2 (1.0%) | 7 (2.7%) |
| 65 to 74 Years | 14 (11.1%) | 10 (9.1%) |
| 75 Years and over | 22 (37.3%) | 3 (4.4%) |
Disability Class: Self-Care Difficulty
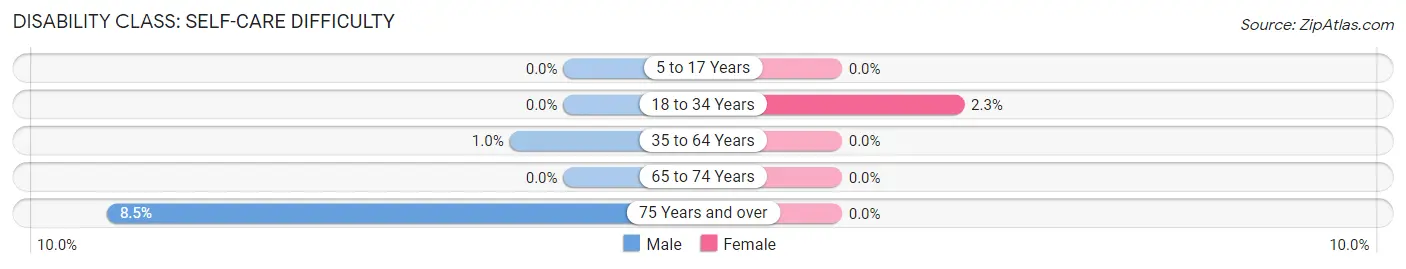
| Age Bracket | Male | Female |
| 5 to 17 Years | 0 (0.0%) | 0 (0.0%) |
| 18 to 34 Years | 0 (0.0%) | 1 (2.3%) |
| 35 to 64 Years | 2 (1.0%) | 0 (0.0%) |
| 65 to 74 Years | 0 (0.0%) | 0 (0.0%) |
| 75 Years and over | 5 (8.5%) | 0 (0.0%) |
Technology Access in Arnolds Park
Computing Device Access in Arnolds Park
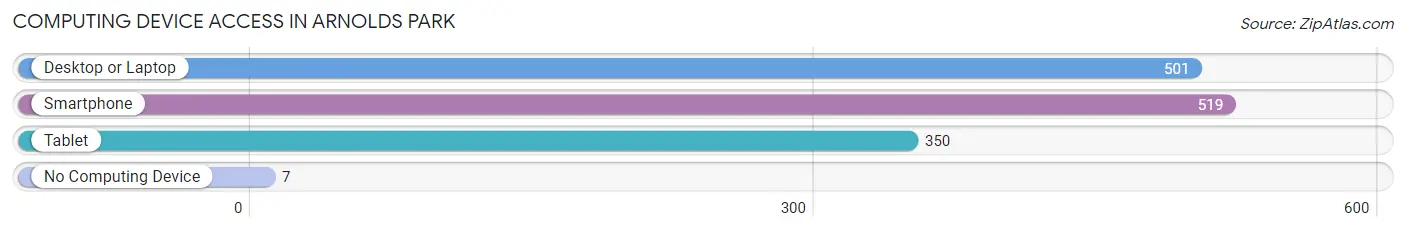
| Device Type | # Households | % Households |
| Desktop or Laptop | 501 | 87.6% |
| Smartphone | 519 | 90.7% |
| Tablet | 350 | 61.2% |
| No Computing Device | 7 | 1.2% |
| Total | 572 | 100.0% |
Internet Access in Arnolds Park
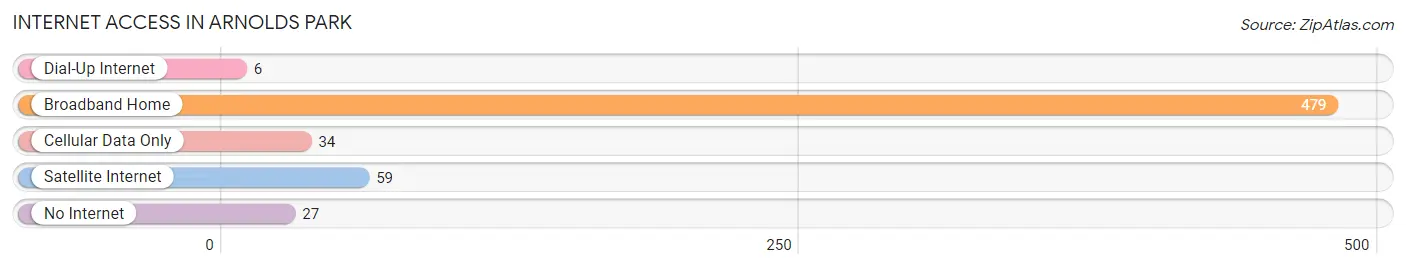
| Internet Type | # Households | % Households |
| Dial-Up Internet | 6 | 1.1% |
| Broadband Home | 479 | 83.7% |
| Cellular Data Only | 34 | 5.9% |
| Satellite Internet | 59 | 10.3% |
| No Internet | 27 | 4.7% |
| Total | 572 | 100.0% |
Arnolds Park Summary
Arnolds Park is a city located in Dickinson County, Iowa, United States. It is situated on the east shore of West Okoboji Lake, one of the Iowa Great Lakes. The population was 517 at the 2010 census.
History
Arnolds Park was founded in 1876 by John Arnold, a German immigrant who had come to the area in 1871. Arnold purchased the land from the government and began to develop it as a resort. He built a hotel, a dance hall, and a roller coaster, and the area quickly became a popular destination for tourists. In 1883, the town was officially incorporated as Arnolds Park.
In the early 1900s, Arnolds Park was a popular destination for wealthy vacationers from the Midwest. The town was home to several large hotels, including the Hotel Arnolds Park, the Hotel Okoboji, and the Hotel West Okoboji. The town also had a number of amusement parks, including the Arnolds Park Amusement Park, which opened in 1927 and is still in operation today.
Geography
Arnolds Park is located at 43°23'17" North, 95°7'17" West (43.3879, -95.1214). The city is situated on the east shore of West Okoboji Lake, one of the Iowa Great Lakes. The lake is part of the Des Moines River watershed.
According to the United States Census Bureau, the city has a total area of 0.7 square miles (1.8 km2), all of it land.
Economy
Arnolds Park is a popular tourist destination, and the city's economy is largely based on tourism. The city is home to several hotels, restaurants, and other businesses that cater to tourists. The Arnolds Park Amusement Park is a major attraction, and the city also hosts several festivals and events throughout the year.
Demographics
As of the census of 2010, there were 517 people, 233 households, and 135 families residing in the city. The population density was 745.7 people per square mile (288.2/km2). There were 263 housing units at an average density of 377.1 per square mile (145.9/km2). The racial makeup of the city was 97.3% White, 0.2% African American, 0.2% Native American, 0.2% Asian, 0.4% from other races, and 1.7% from two or more races. Hispanic or Latino of any race were 1.2% of the population.
There were 233 households, out of which 24.9% had children under the age of 18 living with them, 44.2% were married couples living together, 9.4% had a female householder with no husband present, and 42.2% were non-families. 36.2% of all households were made up of individuals, and 15.3% had someone living alone who was 65 years of age or older. The average household size was 2.22 and the average family size was 2.90.
In the city, the population was spread out, with 22.2% under the age of 18, 6.7% from 18 to 24, 24.2% from 25 to 44, 28.2% from 45 to 64, and 18.7% who were 65 years of age or older. The median age was 42 years. For every 100 females, there were 97.7 males. For every 100 females age 18 and over, there were 94.2 males.
The median income for a household in the city was $37,500, and the median income for a family was $45,000. Males had a median income of $31,250 versus $21,250 for females. The per capita income for the city was $20,945. About 5.3% of families and 8.2% of the population were below the poverty line, including 10.2% of those under age 18 and 8.3% of those age 65 or over.
Common Questions
What is Per Capita Income in Arnolds Park?
Per Capita income in Arnolds Park is $59,353.
What is the Median Family Income in Arnolds Park?
Median Family Income in Arnolds Park is $115,109.
What is the Median Household income in Arnolds Park?
Median Household Income in Arnolds Park is $82,500.
What is Income or Wage Gap in Arnolds Park?
Income or Wage Gap in Arnolds Park is 22.9%.
Women in Arnolds Park earn 77.1 cents for every dollar earned by a man.
What is Inequality or Gini Index in Arnolds Park?
Inequality or Gini Index in Arnolds Park is 0.43.
What is the Total Population of Arnolds Park?
Total Population of Arnolds Park is 989.
What is the Total Male Population of Arnolds Park?
Total Male Population of Arnolds Park is 458.
What is the Total Female Population of Arnolds Park?
Total Female Population of Arnolds Park is 531.
What is the Ratio of Males per 100 Females in Arnolds Park?
There are 86.25 Males per 100 Females in Arnolds Park.
What is the Ratio of Females per 100 Males in Arnolds Park?
There are 115.94 Females per 100 Males in Arnolds Park.
What is the Median Population Age in Arnolds Park?
Median Population Age in Arnolds Park is 62.1 Years.
What is the Average Family Size in Arnolds Park
Average Family Size in Arnolds Park is 2.1 People.
What is the Average Household Size in Arnolds Park
Average Household Size in Arnolds Park is 1.7 People.
How Large is the Labor Force in Arnolds Park?
There are 504 People in the Labor Forcein in Arnolds Park.
What is the Percentage of People in the Labor Force in Arnolds Park?
53.6% of People are in the Labor Force in Arnolds Park.
What is the Unemployment Rate in Arnolds Park?
Unemployment Rate in Arnolds Park is 0.4%.