Hudson, IA Map & Demographics
Hudson Map
Hudson Overview
$45,057
PER CAPITA INCOME
$120,634
AVG FAMILY INCOME
$113,274
AVG HOUSEHOLD INCOME
43.3%
WAGE / INCOME GAP [ % ]
56.7¢/ $1
WAGE / INCOME GAP [ $ ]
0.35
INEQUALITY / GINI INDEX
2,557
TOTAL POPULATION
1,445
MALE POPULATION
1,112
FEMALE POPULATION
129.95
MALES / 100 FEMALES
76.96
FEMALES / 100 MALES
42.0
MEDIAN AGE
3.1
AVG FAMILY SIZE
2.7
AVG HOUSEHOLD SIZE
1,327
LABOR FORCE [ PEOPLE ]
69.1%
PERCENT IN LABOR FORCE
4.4%
UNEMPLOYMENT RATE
Hudson Zip Codes
Hudson Area Codes
Income in Hudson
Income Overview in Hudson
Per Capita Income in Hudson is $45,057, while median incomes of families and households are $120,634 and $113,274 respectively.
| Characteristic | Number | Measure |
| Per Capita Income | 2,557 | $45,057 |
| Median Family Income | 723 | $120,634 |
| Mean Family Income | 723 | $130,059 |
| Median Household Income | 963 | $113,274 |
| Mean Household Income | 963 | $115,452 |
| Income Deficit | 723 | $0 |
| Wage / Income Gap (%) | 2,557 | 43.25% |
| Wage / Income Gap ($) | 2,557 | 56.75¢ per $1 |
| Gini / Inequality Index | 2,557 | 0.35 |
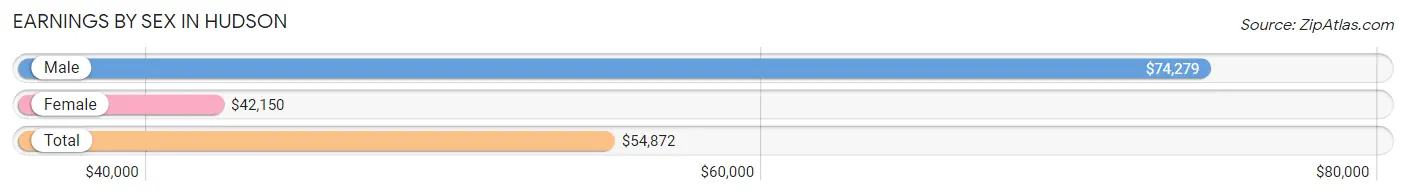
Earnings by Sex in Hudson
Average Earnings in Hudson are $54,872, $74,279 for men and $42,150 for women, a difference of 43.2%.
| Sex | Number | Average Earnings |
| Male | 803 (56.4%) | $74,279 |
| Female | 621 (43.6%) | $42,150 |
| Total | 1,424 (100.0%) | $54,872 |
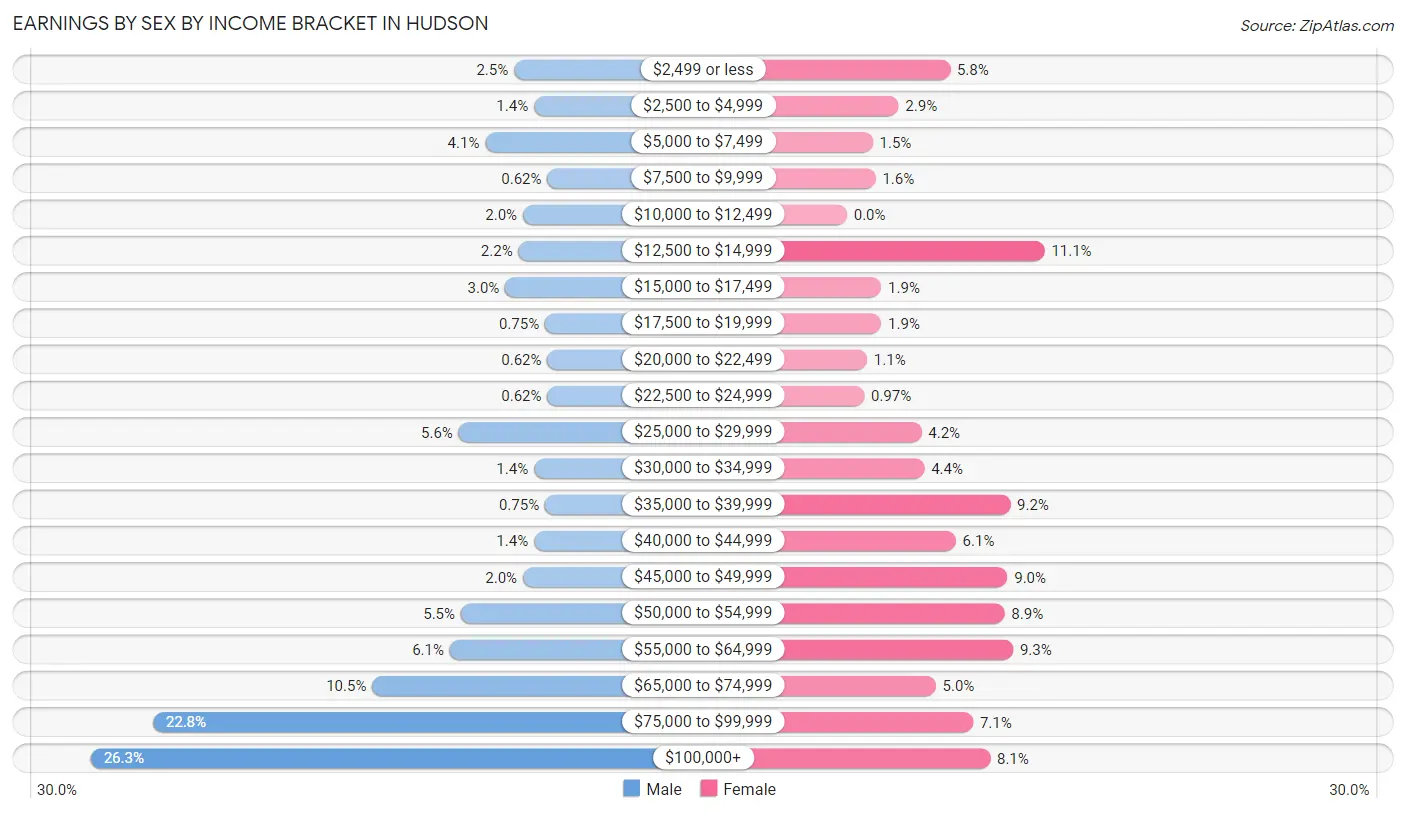
Earnings by Sex by Income Bracket in Hudson
The most common earnings brackets in Hudson are $100,000+ for men (211 | 26.3%) and $12,500 to $14,999 for women (69 | 11.1%).
| Income | Male | Female |
| $2,499 or less | 20 (2.5%) | 36 (5.8%) |
| $2,500 to $4,999 | 11 (1.4%) | 18 (2.9%) |
| $5,000 to $7,499 | 33 (4.1%) | 9 (1.5%) |
| $7,500 to $9,999 | 5 (0.6%) | 10 (1.6%) |
| $10,000 to $12,499 | 16 (2.0%) | 0 (0.0%) |
| $12,500 to $14,999 | 18 (2.2%) | 69 (11.1%) |
| $15,000 to $17,499 | 24 (3.0%) | 12 (1.9%) |
| $17,500 to $19,999 | 6 (0.7%) | 12 (1.9%) |
| $20,000 to $22,499 | 5 (0.6%) | 7 (1.1%) |
| $22,500 to $24,999 | 5 (0.6%) | 6 (1.0%) |
| $25,000 to $29,999 | 45 (5.6%) | 26 (4.2%) |
| $30,000 to $34,999 | 11 (1.4%) | 27 (4.3%) |
| $35,000 to $39,999 | 6 (0.7%) | 57 (9.2%) |
| $40,000 to $44,999 | 11 (1.4%) | 38 (6.1%) |
| $45,000 to $49,999 | 16 (2.0%) | 56 (9.0%) |
| $50,000 to $54,999 | 44 (5.5%) | 55 (8.9%) |
| $55,000 to $64,999 | 49 (6.1%) | 58 (9.3%) |
| $65,000 to $74,999 | 84 (10.5%) | 31 (5.0%) |
| $75,000 to $99,999 | 183 (22.8%) | 44 (7.1%) |
| $100,000+ | 211 (26.3%) | 50 (8.1%) |
| Total | 803 (100.0%) | 621 (100.0%) |
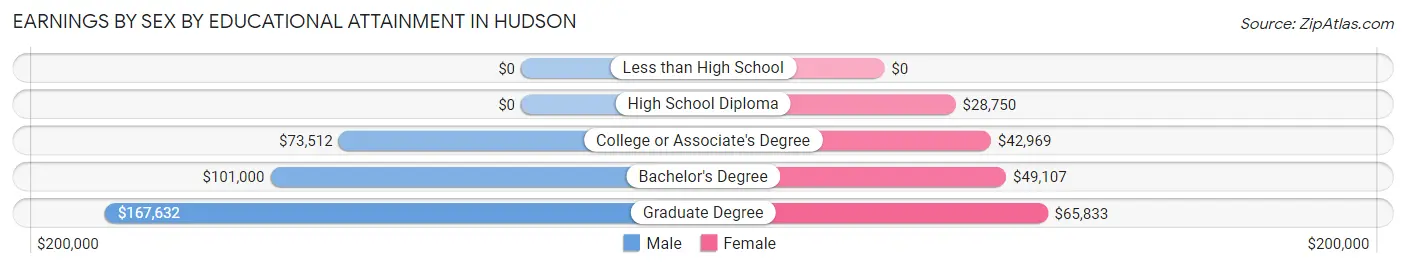
Earnings by Sex by Educational Attainment in Hudson
Average earnings in Hudson are $78,988 for men and $44,327 for women, a difference of 43.9%. Men with an educational attainment of graduate degree enjoy the highest average annual earnings of $167,632, while those with college or associate's degree education earn the least with $73,512. Women with an educational attainment of graduate degree earn the most with the average annual earnings of $65,833, while those with high school diploma education have the smallest earnings of $28,750.
| Educational Attainment | Male Income | Female Income |
| Less than High School | - | - |
| High School Diploma | - | - |
| College or Associate's Degree | $73,512 | $42,969 |
| Bachelor's Degree | $101,000 | $49,107 |
| Graduate Degree | $167,632 | $65,833 |
| Total | $78,988 | $44,327 |
Family Income in Hudson
Family Income Brackets in Hudson
According to the Hudson family income data, there are 290 families falling into the $100,000 to $149,999 income range, which is the most common income bracket and makes up 40.1% of all families.
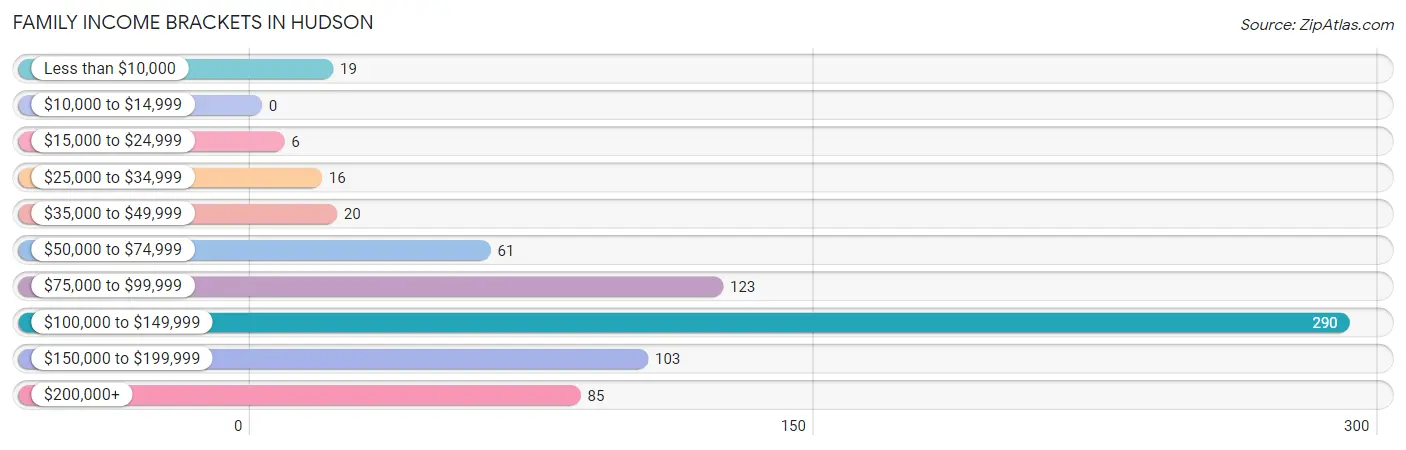
| Income Bracket | # Families | % Families |
| Less than $10,000 | 19 | 2.6% |
| $10,000 to $14,999 | 0 | 0.0% |
| $15,000 to $24,999 | 6 | 0.8% |
| $25,000 to $34,999 | 16 | 2.2% |
| $35,000 to $49,999 | 20 | 2.8% |
| $50,000 to $74,999 | 61 | 8.4% |
| $75,000 to $99,999 | 123 | 17.0% |
| $100,000 to $149,999 | 290 | 40.1% |
| $150,000 to $199,999 | 103 | 14.2% |
| $200,000+ | 85 | 11.8% |
Family Income by Famaliy Size in Hudson
6-person families (21 | 2.9%) account for the highest median family income in Hudson with $177,656 per family, while 2-person families (372 | 51.4%) have the highest median income of $60,088 per family member.
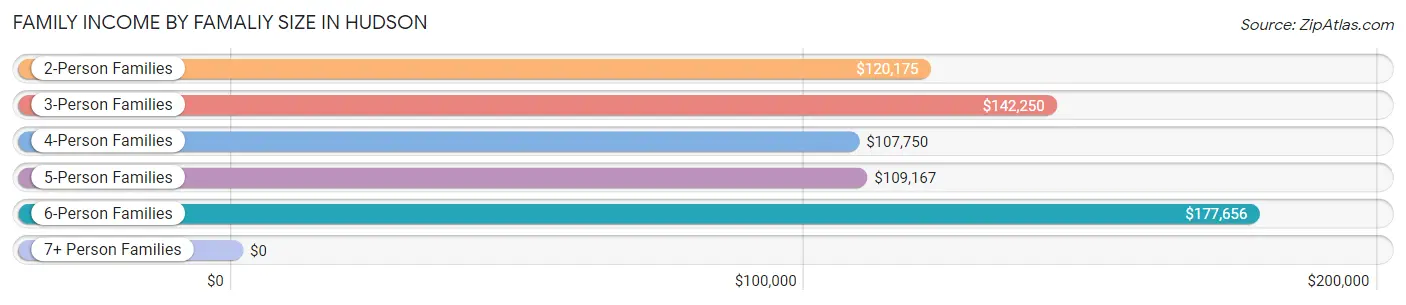
| Income Bracket | # Families | Median Income |
| 2-Person Families | 372 (51.4%) | $120,175 |
| 3-Person Families | 129 (17.8%) | $142,250 |
| 4-Person Families | 121 (16.7%) | $107,750 |
| 5-Person Families | 80 (11.1%) | $109,167 |
| 6-Person Families | 21 (2.9%) | $177,656 |
| 7+ Person Families | 0 (0.0%) | $0 |
| Total | 723 (100.0%) | $120,634 |
Family Income by Number of Earners in Hudson
The median family income in Hudson is $120,634, with families comprising 3+ earners (72) having the highest median family income of $163,000, while families with 1 earner (181) have the lowest median family income of $78,565, accounting for 10.0% and 25.0% of families, respectively.
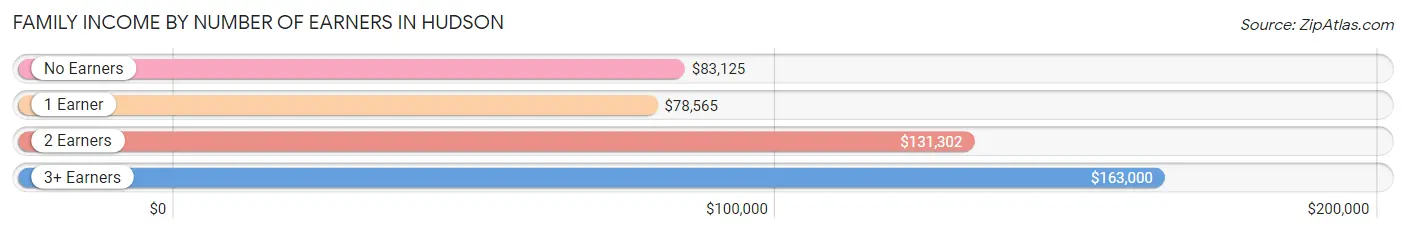
| Number of Earners | # Families | Median Income |
| No Earners | 99 (13.7%) | $83,125 |
| 1 Earner | 181 (25.0%) | $78,565 |
| 2 Earners | 371 (51.3%) | $131,302 |
| 3+ Earners | 72 (10.0%) | $163,000 |
| Total | 723 (100.0%) | $120,634 |
Household Income in Hudson
Household Income Brackets in Hudson
With 309 households falling in the category, the $100,000 to $149,999 income range is the most frequent in Hudson, accounting for 32.1% of all households.
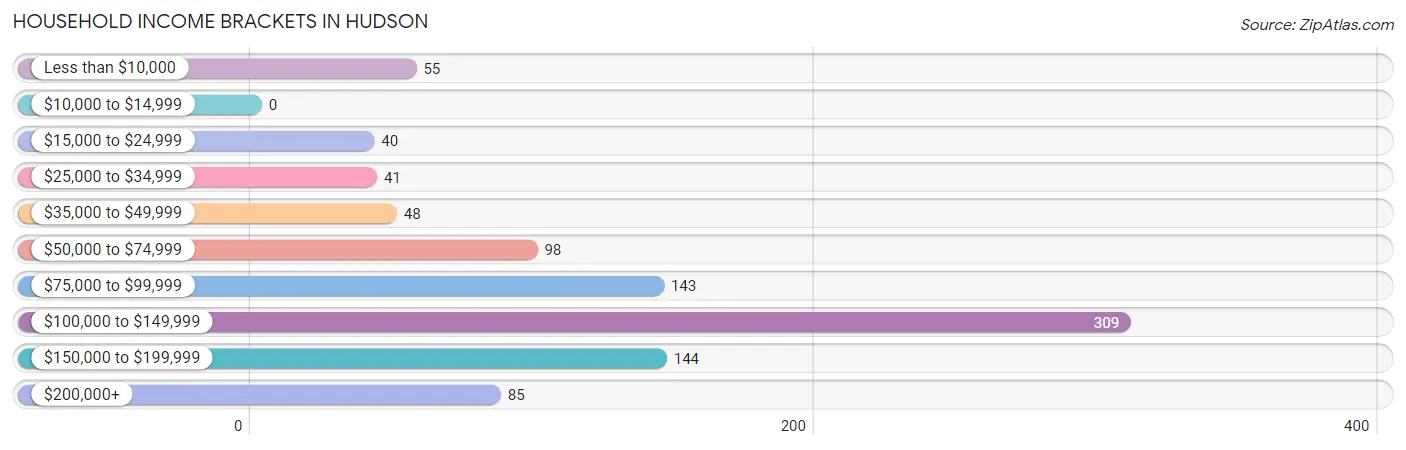
| Income Bracket | # Households | % Households |
| Less than $10,000 | 55 | 5.7% |
| $10,000 to $14,999 | 0 | 0.0% |
| $15,000 to $24,999 | 40 | 4.2% |
| $25,000 to $34,999 | 41 | 4.3% |
| $35,000 to $49,999 | 48 | 5.0% |
| $50,000 to $74,999 | 98 | 10.2% |
| $75,000 to $99,999 | 143 | 14.8% |
| $100,000 to $149,999 | 309 | 32.1% |
| $150,000 to $199,999 | 144 | 15.0% |
| $200,000+ | 85 | 8.8% |
Household Income by Householder Age in Hudson
The median household income in Hudson is $113,274, with the highest median household income of $121,627 found in the 45 to 64 years age bracket for the primary householder. A total of 368 households (38.2%) fall into this category. Meanwhile, the 15 to 24 years age bracket for the primary householder has the lowest median household income of $0, with 30 households (3.1%) in this group.
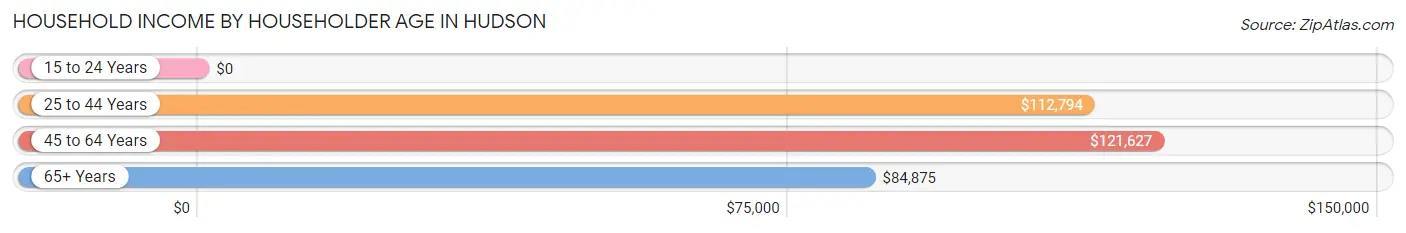
| Income Bracket | # Households | Median Income |
| 15 to 24 Years | 30 (3.1%) | $0 |
| 25 to 44 Years | 322 (33.4%) | $112,794 |
| 45 to 64 Years | 368 (38.2%) | $121,627 |
| 65+ Years | 243 (25.2%) | $84,875 |
| Total | 963 (100.0%) | $113,274 |
Poverty in Hudson
Income Below Poverty by Sex and Age in Hudson
With 5.5% poverty level for males and 6.7% for females among the residents of Hudson, 18 to 24 year old males and 18 to 24 year old females are the most vulnerable to poverty, with 16 males (18.6%) and 15 females (27.3%) in their respective age groups living below the poverty level.
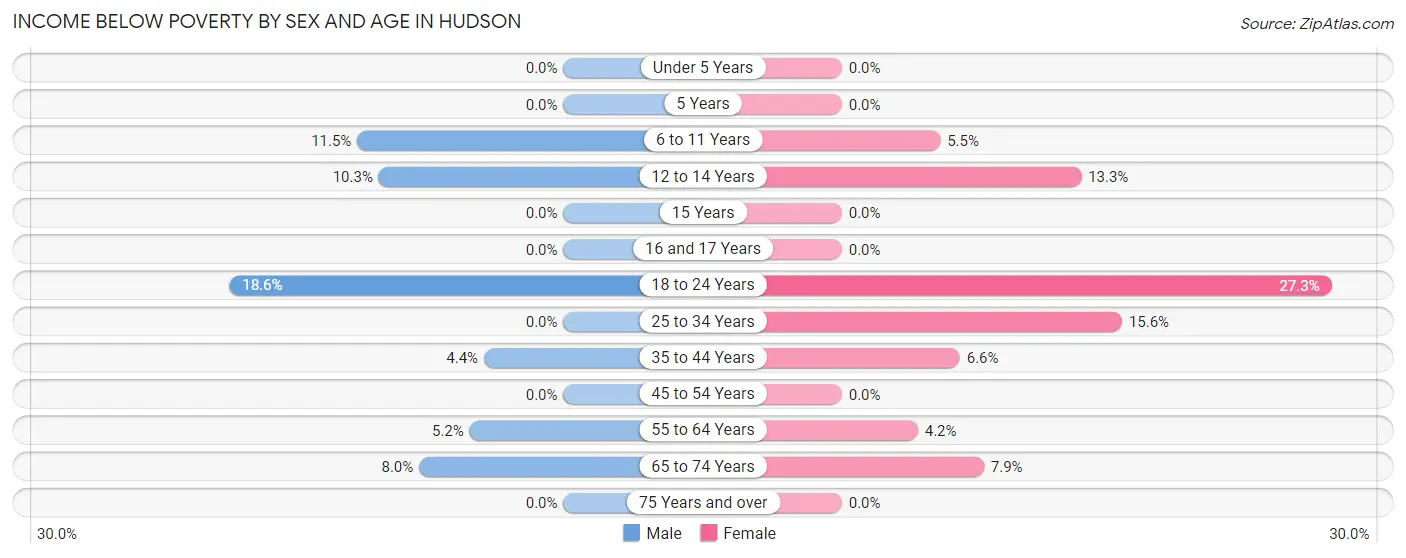
| Age Bracket | Male | Female |
| Under 5 Years | 0 (0.0%) | 0 (0.0%) |
| 5 Years | 0 (0.0%) | 0 (0.0%) |
| 6 to 11 Years | 21 (11.5%) | 4 (5.5%) |
| 12 to 14 Years | 11 (10.3%) | 4 (13.3%) |
| 15 Years | 0 (0.0%) | 0 (0.0%) |
| 16 and 17 Years | 0 (0.0%) | 0 (0.0%) |
| 18 to 24 Years | 16 (18.6%) | 15 (27.3%) |
| 25 to 34 Years | 0 (0.0%) | 17 (15.6%) |
| 35 to 44 Years | 8 (4.4%) | 14 (6.6%) |
| 45 to 54 Years | 0 (0.0%) | 0 (0.0%) |
| 55 to 64 Years | 12 (5.2%) | 9 (4.2%) |
| 65 to 74 Years | 11 (8.0%) | 11 (7.9%) |
| 75 Years and over | 0 (0.0%) | 0 (0.0%) |
| Total | 79 (5.5%) | 74 (6.7%) |
Income Above Poverty by Sex and Age in Hudson
According to the poverty statistics in Hudson, males aged under 5 years and females aged under 5 years are the age groups that are most secure financially, with 100.0% of males and 100.0% of females in these age groups living above the poverty line.
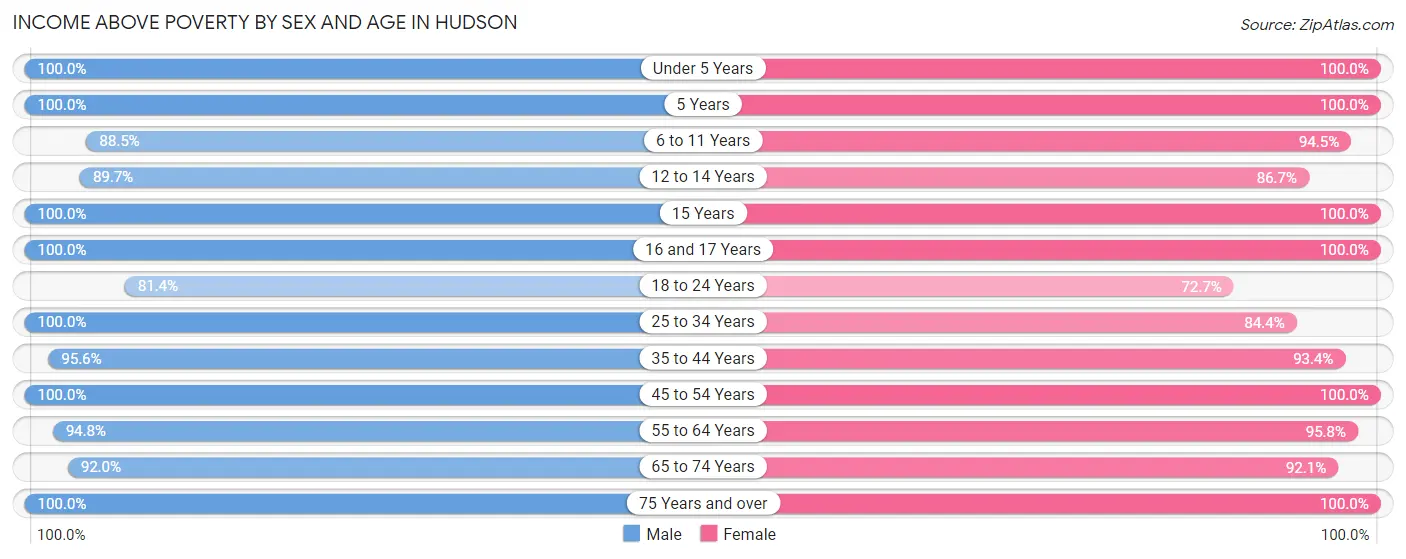
| Age Bracket | Male | Female |
| Under 5 Years | 83 (100.0%) | 57 (100.0%) |
| 5 Years | 48 (100.0%) | 15 (100.0%) |
| 6 to 11 Years | 162 (88.5%) | 69 (94.5%) |
| 12 to 14 Years | 96 (89.7%) | 26 (86.7%) |
| 15 Years | 19 (100.0%) | 9 (100.0%) |
| 16 and 17 Years | 31 (100.0%) | 11 (100.0%) |
| 18 to 24 Years | 70 (81.4%) | 40 (72.7%) |
| 25 to 34 Years | 88 (100.0%) | 92 (84.4%) |
| 35 to 44 Years | 173 (95.6%) | 199 (93.4%) |
| 45 to 54 Years | 161 (100.0%) | 105 (100.0%) |
| 55 to 64 Years | 218 (94.8%) | 204 (95.8%) |
| 65 to 74 Years | 126 (92.0%) | 128 (92.1%) |
| 75 Years and over | 91 (100.0%) | 70 (100.0%) |
| Total | 1,366 (94.5%) | 1,025 (93.3%) |
Income Below Poverty Among Married-Couple Families in Hudson
The poverty statistics for married-couple families in Hudson show that 2.3% or 15 of the total 664 families live below the poverty line. Families with no children have the highest poverty rate of 2.7%, comprising of 11 families. On the other hand, families with 3 or 4 children have the lowest poverty rate of 0.0%, which includes 0 families.
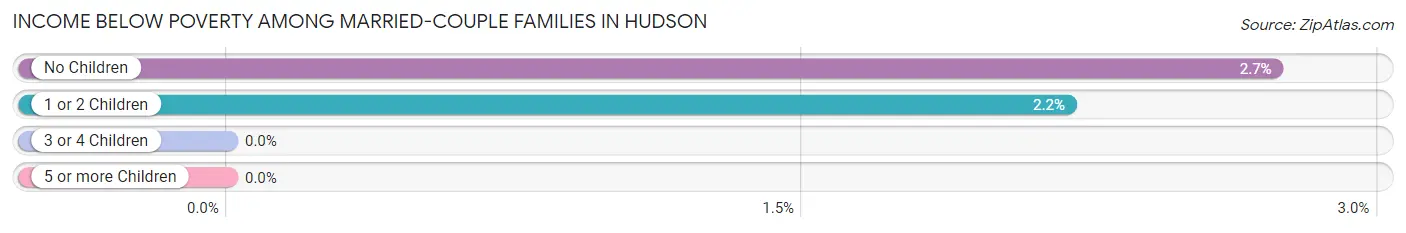
| Children | Above Poverty | Below Poverty |
| No Children | 392 (97.3%) | 11 (2.7%) |
| 1 or 2 Children | 179 (97.8%) | 4 (2.2%) |
| 3 or 4 Children | 78 (100.0%) | 0 (0.0%) |
| 5 or more Children | 0 (0.0%) | 0 (0.0%) |
| Total | 649 (97.7%) | 15 (2.3%) |
Income Below Poverty Among Single-Parent Households in Hudson
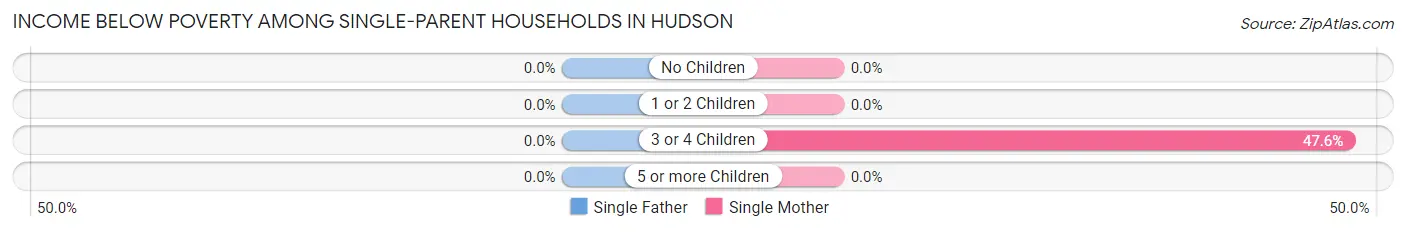
| Children | Single Father | Single Mother |
| No Children | 0 (0.0%) | 0 (0.0%) |
| 1 or 2 Children | 0 (0.0%) | 0 (0.0%) |
| 3 or 4 Children | 0 (0.0%) | 10 (47.6%) |
| 5 or more Children | 0 (0.0%) | 0 (0.0%) |
| Total | 0 (0.0%) | 10 (22.2%) |
Income Below Poverty Among Married-Couple vs Single-Parent Households in Hudson
The poverty data for Hudson shows that 15 of the married-couple family households (2.3%) and 10 of the single-parent households (17.0%) are living below the poverty level. Within the married-couple family households, those with no children have the highest poverty rate, with 11 households (2.7%) falling below the poverty line. Among the single-parent households, those with 3 or 4 children have the highest poverty rate, with 10 household (40.0%) living below poverty.
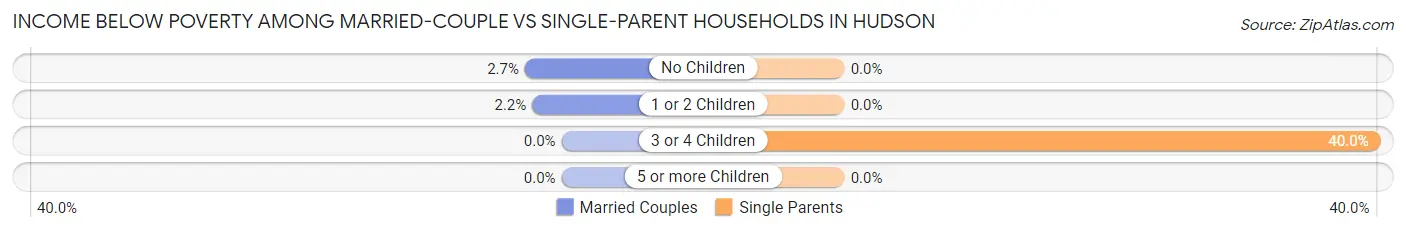
| Children | Married-Couple Families | Single-Parent Households |
| No Children | 11 (2.7%) | 0 (0.0%) |
| 1 or 2 Children | 4 (2.2%) | 0 (0.0%) |
| 3 or 4 Children | 0 (0.0%) | 10 (40.0%) |
| 5 or more Children | 0 (0.0%) | 0 (0.0%) |
| Total | 15 (2.3%) | 10 (17.0%) |
Race in Hudson
The most populous races in Hudson are White / Caucasian (2,405 | 94.1%), Hispanic or Latino (91 | 3.6%), and Two or more Races (83 | 3.3%).
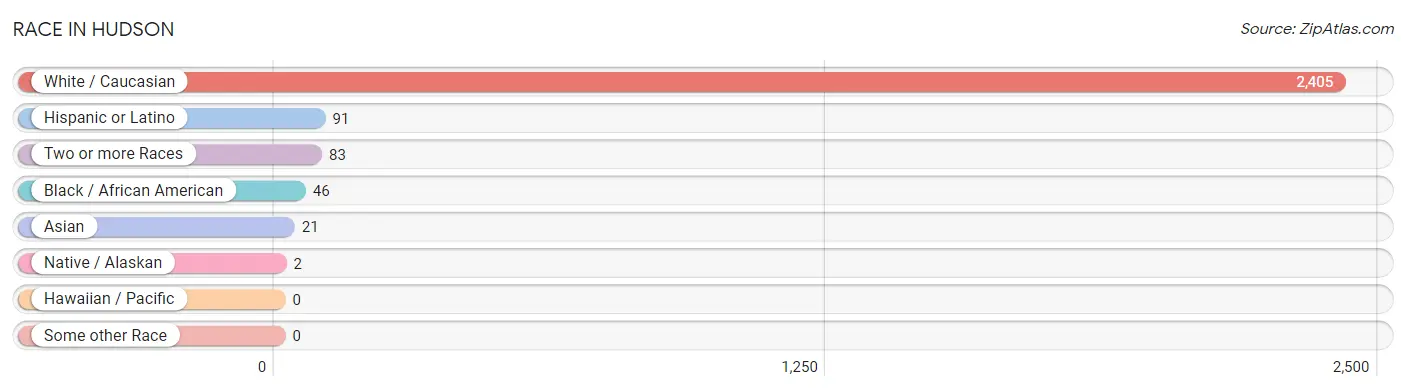
| Race | # Population | % Population |
| Asian | 21 | 0.8% |
| Black / African American | 46 | 1.8% |
| Hawaiian / Pacific | 0 | 0.0% |
| Hispanic or Latino | 91 | 3.6% |
| Native / Alaskan | 2 | 0.1% |
| White / Caucasian | 2,405 | 94.1% |
| Two or more Races | 83 | 3.3% |
| Some other Race | 0 | 0.0% |
| Total | 2,557 | 100.0% |
Ancestry in Hudson
The most populous ancestries reported in Hudson are German (1,263 | 49.4%), Irish (375 | 14.7%), English (234 | 9.1%), Norwegian (231 | 9.0%), and American (106 | 4.2%), together accounting for 86.4% of all Hudson residents.
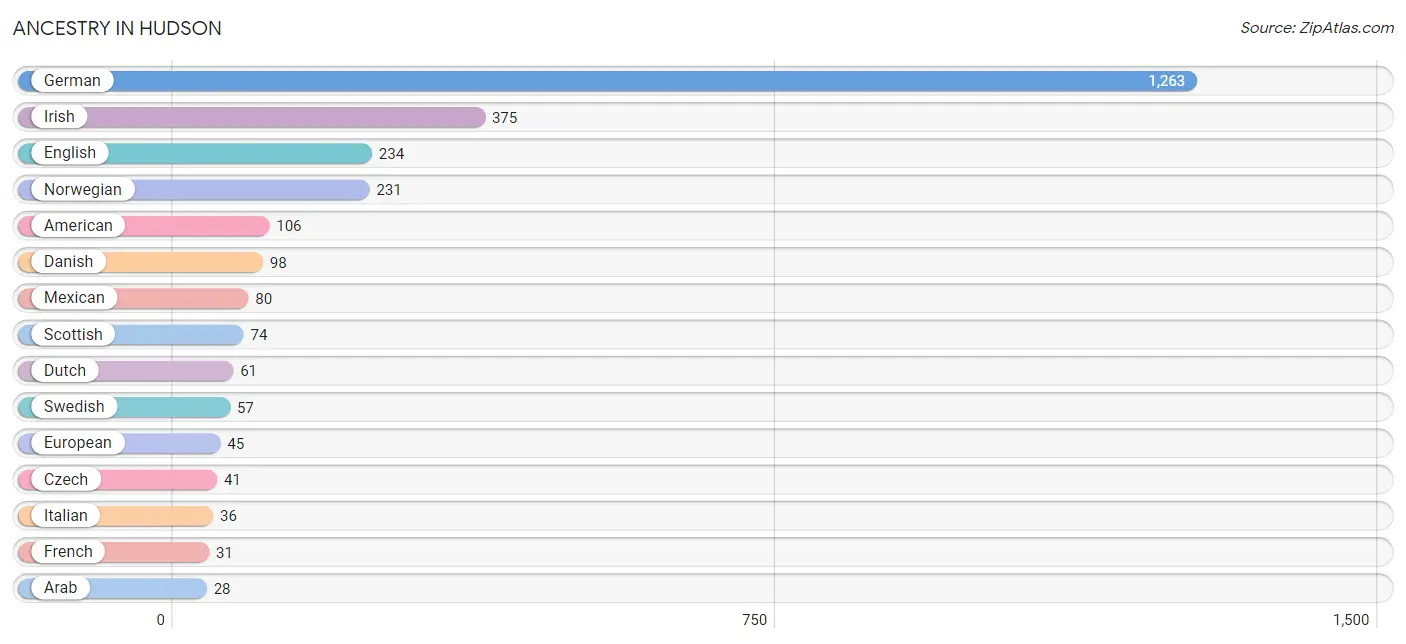
| Ancestry | # Population | % Population |
| American | 106 | 4.2% |
| Apache | 4 | 0.2% |
| Arab | 28 | 1.1% |
| Burmese | 6 | 0.2% |
| Cherokee | 13 | 0.5% |
| Colombian | 11 | 0.4% |
| Czech | 41 | 1.6% |
| Czechoslovakian | 24 | 0.9% |
| Danish | 98 | 3.8% |
| Dutch | 61 | 2.4% |
| Eastern European | 25 | 1.0% |
| English | 234 | 9.1% |
| European | 45 | 1.8% |
| Filipino | 22 | 0.9% |
| French | 31 | 1.2% |
| French Canadian | 5 | 0.2% |
| German | 1,263 | 49.4% |
| Haitian | 20 | 0.8% |
| Hungarian | 2 | 0.1% |
| Irish | 375 | 14.7% |
| Italian | 36 | 1.4% |
| Mexican | 80 | 3.1% |
| Mexican American Indian | 2 | 0.1% |
| Northern European | 10 | 0.4% |
| Norwegian | 231 | 9.0% |
| Polish | 12 | 0.5% |
| Scandinavian | 5 | 0.2% |
| Scotch-Irish | 26 | 1.0% |
| Scottish | 74 | 2.9% |
| Slovak | 24 | 0.9% |
| South American | 11 | 0.4% |
| Swedish | 57 | 2.2% |
| Welsh | 12 | 0.5% | View All 33 Rows |
Immigrants in Hudson
The most numerous immigrant groups reported in Hudson came from Latin America (35 | 1.4%), Asia (21 | 0.8%), Eastern Asia (21 | 0.8%), Caribbean (20 | 0.8%), and Haiti (20 | 0.8%), together accounting for 4.6% of all Hudson residents.
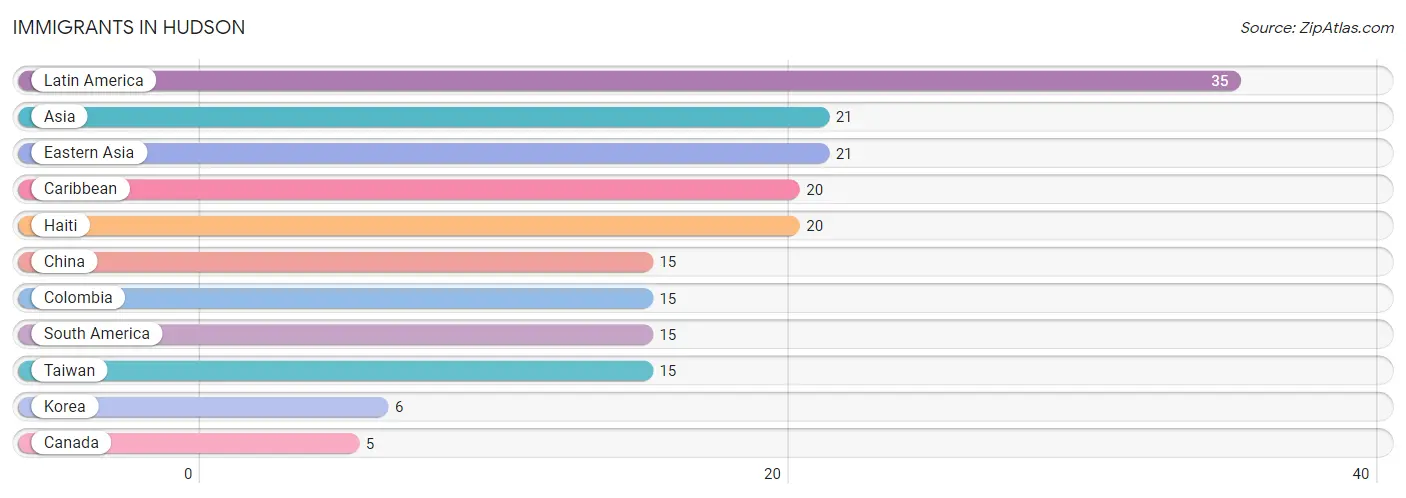
| Immigration Origin | # Population | % Population |
| Asia | 21 | 0.8% |
| Canada | 5 | 0.2% |
| Caribbean | 20 | 0.8% |
| China | 15 | 0.6% |
| Colombia | 15 | 0.6% |
| Eastern Asia | 21 | 0.8% |
| Haiti | 20 | 0.8% |
| Korea | 6 | 0.2% |
| Latin America | 35 | 1.4% |
| South America | 15 | 0.6% |
| Taiwan | 15 | 0.6% | View All 11 Rows |
Sex and Age in Hudson
Sex and Age in Hudson
The most populous age groups in Hudson are 10 to 14 Years (175 | 12.1%) for men and 55 to 59 Years (151 | 13.6%) for women.
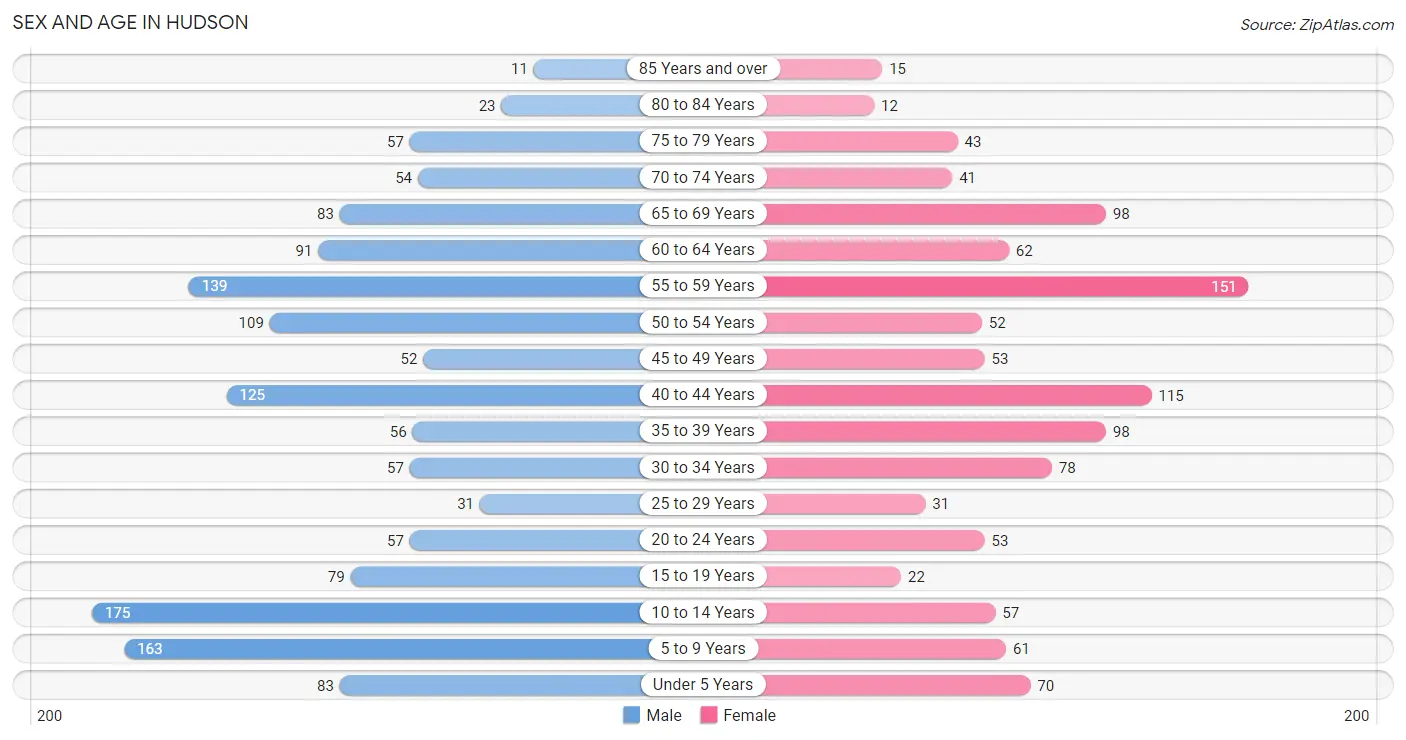
| Age Bracket | Male | Female |
| Under 5 Years | 83 (5.7%) | 70 (6.3%) |
| 5 to 9 Years | 163 (11.3%) | 61 (5.5%) |
| 10 to 14 Years | 175 (12.1%) | 57 (5.1%) |
| 15 to 19 Years | 79 (5.5%) | 22 (2.0%) |
| 20 to 24 Years | 57 (3.9%) | 53 (4.8%) |
| 25 to 29 Years | 31 (2.1%) | 31 (2.8%) |
| 30 to 34 Years | 57 (3.9%) | 78 (7.0%) |
| 35 to 39 Years | 56 (3.9%) | 98 (8.8%) |
| 40 to 44 Years | 125 (8.6%) | 115 (10.3%) |
| 45 to 49 Years | 52 (3.6%) | 53 (4.8%) |
| 50 to 54 Years | 109 (7.5%) | 52 (4.7%) |
| 55 to 59 Years | 139 (9.6%) | 151 (13.6%) |
| 60 to 64 Years | 91 (6.3%) | 62 (5.6%) |
| 65 to 69 Years | 83 (5.7%) | 98 (8.8%) |
| 70 to 74 Years | 54 (3.7%) | 41 (3.7%) |
| 75 to 79 Years | 57 (3.9%) | 43 (3.9%) |
| 80 to 84 Years | 23 (1.6%) | 12 (1.1%) |
| 85 Years and over | 11 (0.8%) | 15 (1.3%) |
| Total | 1,445 (100.0%) | 1,112 (100.0%) |
Families and Households in Hudson
Median Family Size in Hudson
The median family size in Hudson is 3.11 persons per family, with single male/father families (14 | 1.9%) accounting for the largest median family size of 4.21 persons per family. On the other hand, married-couple families (664 | 91.8%) represent the smallest median family size with 3.08 persons per family.
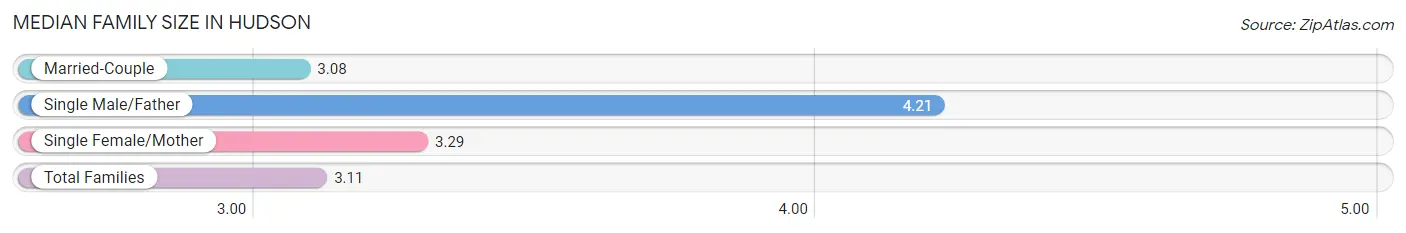
| Family Type | # Families | Family Size |
| Married-Couple | 664 (91.8%) | 3.08 |
| Single Male/Father | 14 (1.9%) | 4.21 |
| Single Female/Mother | 45 (6.2%) | 3.29 |
| Total Families | 723 (100.0%) | 3.11 |
Median Household Size in Hudson
The median household size in Hudson is 2.66 persons per household, with single male/father households (14 | 1.5%) accounting for the largest median household size of 4.21 persons per household. non-family households (240 | 24.9%) represent the smallest median household size with 1.22 persons per household.
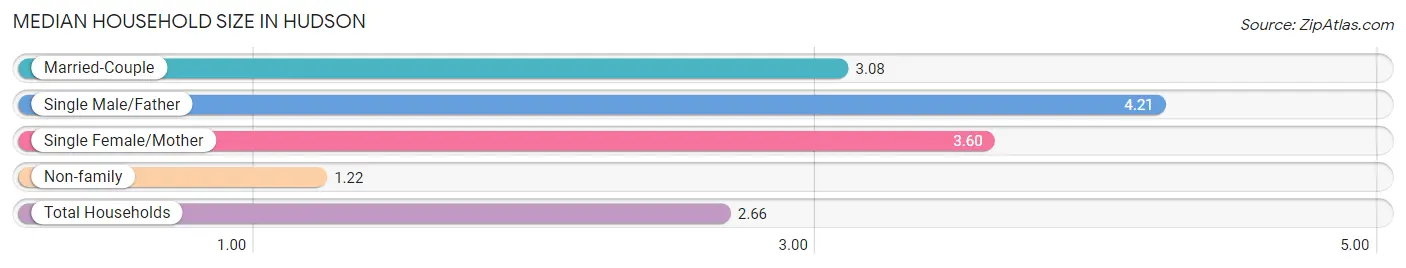
| Household Type | # Households | Household Size |
| Married-Couple | 664 (69.0%) | 3.08 |
| Single Male/Father | 14 (1.5%) | 4.21 |
| Single Female/Mother | 45 (4.7%) | 3.60 |
| Non-family | 240 (24.9%) | 1.22 |
| Total Households | 963 (100.0%) | 2.66 |
Household Size by Marriage Status in Hudson
Out of a total of 963 households in Hudson, 723 (75.1%) are family households, while 240 (24.9%) are nonfamily households. The most numerous type of family households are 2-person households, comprising 372, and the most common type of nonfamily households are 1-person households, comprising 209.
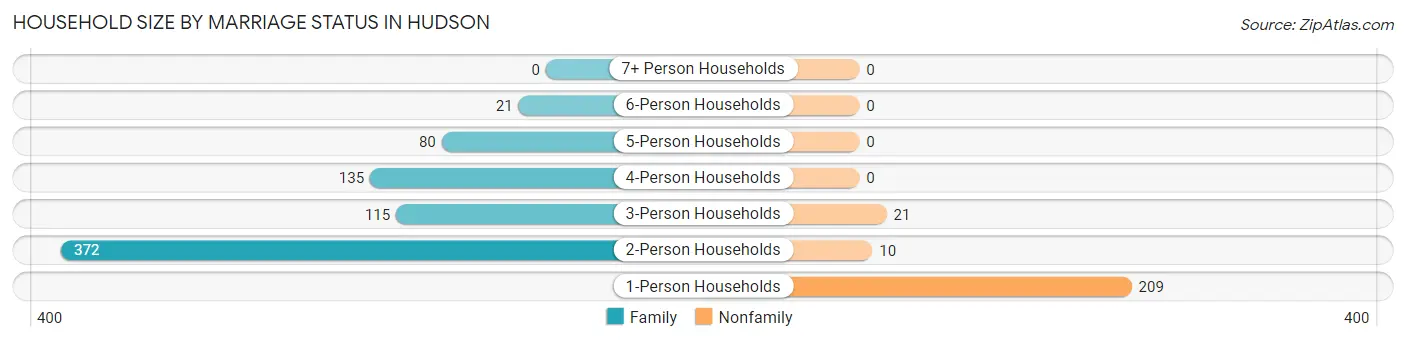
| Household Size | Family Households | Nonfamily Households |
| 1-Person Households | - | 209 (21.7%) |
| 2-Person Households | 372 (38.6%) | 10 (1.0%) |
| 3-Person Households | 115 (11.9%) | 21 (2.2%) |
| 4-Person Households | 135 (14.0%) | 0 (0.0%) |
| 5-Person Households | 80 (8.3%) | 0 (0.0%) |
| 6-Person Households | 21 (2.2%) | 0 (0.0%) |
| 7+ Person Households | 0 (0.0%) | 0 (0.0%) |
| Total | 723 (75.1%) | 240 (24.9%) |
Female Fertility in Hudson
Fertility by Age in Hudson
Average fertility rate in Hudson is 34.0 births per 1,000 women. Women in the age bracket of 20 to 34 years have the highest fertility rate with 99.0 births per 1,000 women. Women in the age bracket of 20 to 34 years acount for 100.0% of all women with births.
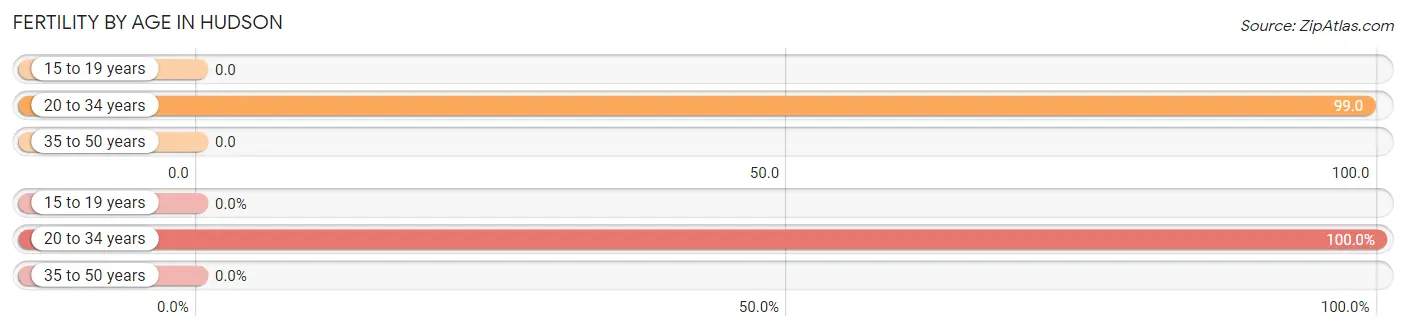
| Age Bracket | Women with Births | Births / 1,000 Women |
| 15 to 19 years | 0 (0.0%) | 0.0 |
| 20 to 34 years | 16 (100.0%) | 99.0 |
| 35 to 50 years | 0 (0.0%) | 0.0 |
| Total | 16 (100.0%) | 34.0 |
Fertility by Age by Marriage Status in Hudson
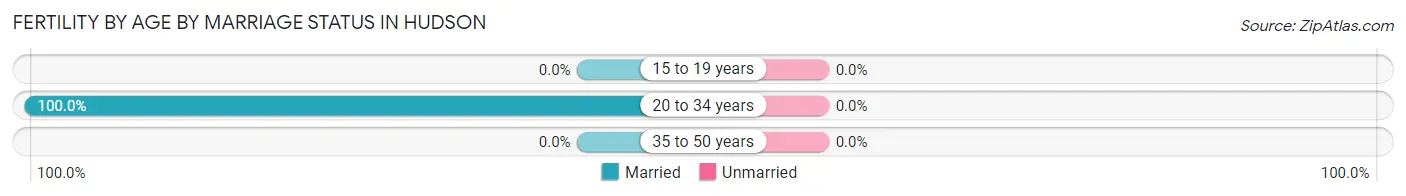
| Age Bracket | Married | Unmarried |
| 15 to 19 years | 0 (0.0%) | 0 (0.0%) |
| 20 to 34 years | 16 (100.0%) | 0 (0.0%) |
| 35 to 50 years | 0 (0.0%) | 0 (0.0%) |
| Total | 16 (100.0%) | 0 (0.0%) |
Fertility by Education in Hudson
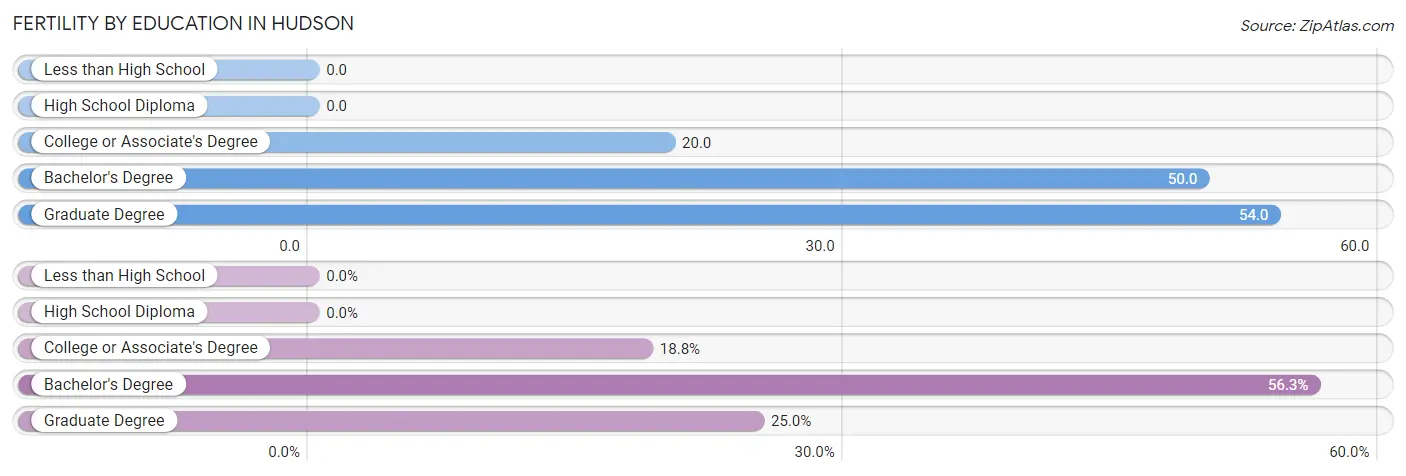
| Educational Attainment | Women with Births | Births / 1,000 Women |
| Less than High School | 0 (0.0%) | 0.0 |
| High School Diploma | 0 (0.0%) | 0.0 |
| College or Associate's Degree | 3 (18.8%) | 20.0 |
| Bachelor's Degree | 9 (56.2%) | 50.0 |
| Graduate Degree | 4 (25.0%) | 54.0 |
| Total | 16 (100.0%) | 34.0 |
Fertility by Education by Marriage Status in Hudson
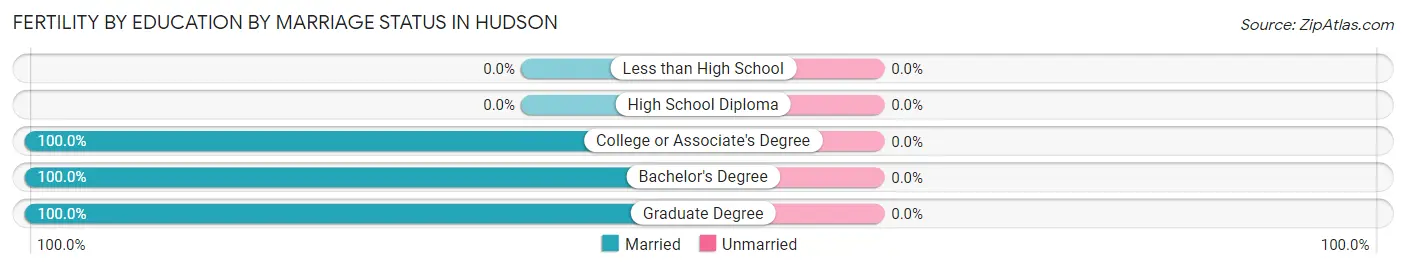
| Educational Attainment | Married | Unmarried |
| Less than High School | 0 (0.0%) | 0 (0.0%) |
| High School Diploma | 0 (0.0%) | 0 (0.0%) |
| College or Associate's Degree | 3 (100.0%) | 0 (0.0%) |
| Bachelor's Degree | 9 (100.0%) | 0 (0.0%) |
| Graduate Degree | 4 (100.0%) | 0 (0.0%) |
| Total | 16 (100.0%) | 0 (0.0%) |
Employment Characteristics in Hudson
Employment by Class of Employer in Hudson
Among the 1,244 employed individuals in Hudson, private company employees (743 | 59.7%), not-for-profit organizations (133 | 10.7%), and self-employed (incorporated) (121 | 9.7%) make up the most common classes of employment.
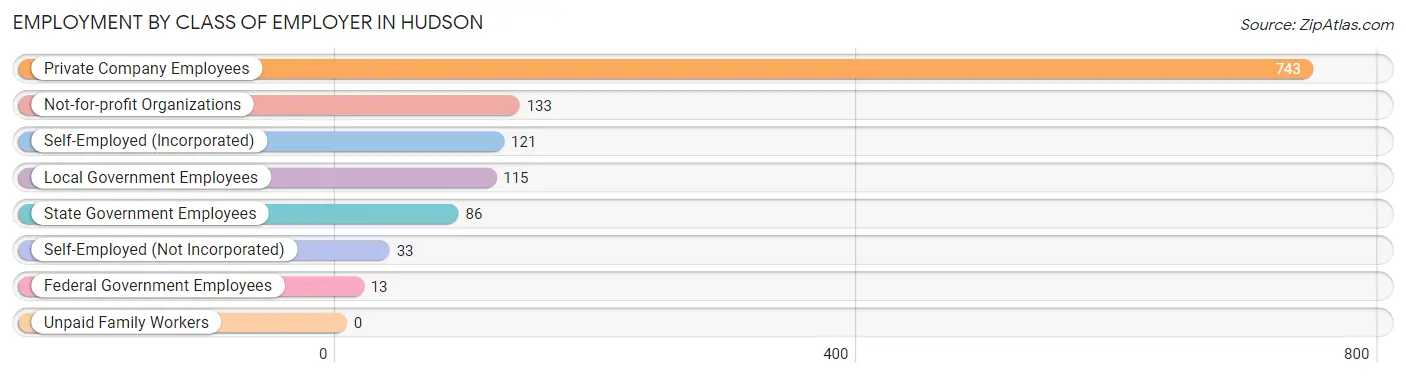
| Employer Class | # Employees | % Employees |
| Private Company Employees | 743 | 59.7% |
| Self-Employed (Incorporated) | 121 | 9.7% |
| Self-Employed (Not Incorporated) | 33 | 2.6% |
| Not-for-profit Organizations | 133 | 10.7% |
| Local Government Employees | 115 | 9.2% |
| State Government Employees | 86 | 6.9% |
| Federal Government Employees | 13 | 1.1% |
| Unpaid Family Workers | 0 | 0.0% |
| Total | 1,244 | 100.0% |
Employment Status by Age in Hudson
According to the labor force statistics for Hudson, out of the total population over 16 years of age (1,920), 69.1% or 1,327 individuals are in the labor force, with 4.4% or 58 of them unemployed. The age group with the highest labor force participation rate is 25 to 29 years, with 100.0% or 62 individuals in the labor force. Within the labor force, the 55 to 59 years age range has the highest percentage of unemployed individuals, with 14.7% or 37 of them being unemployed.
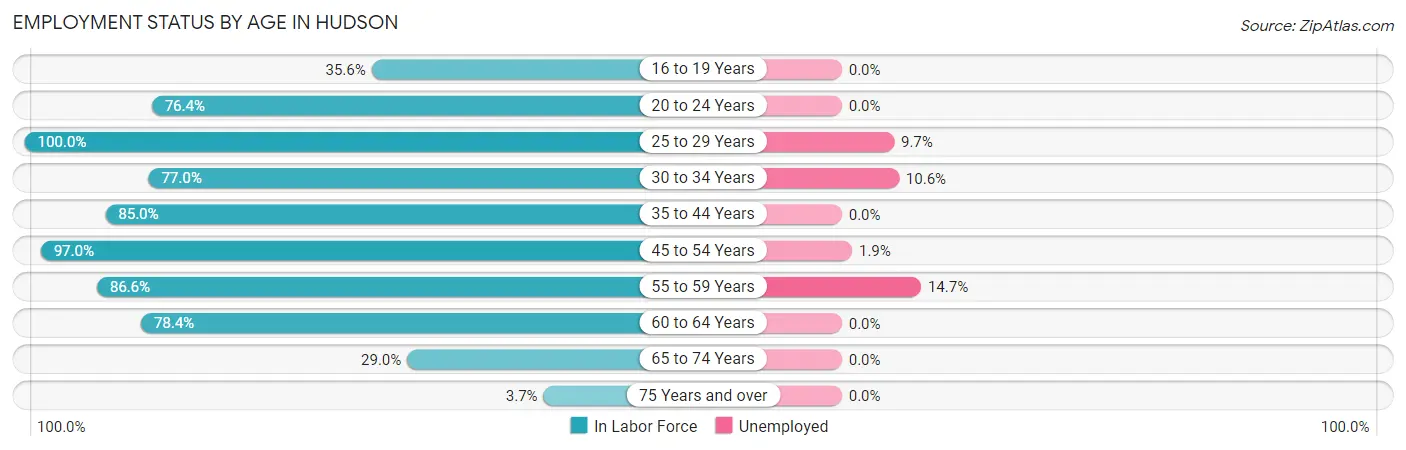
| Age Bracket | In Labor Force | Unemployed |
| 16 to 19 Years | 26 (35.6%) | 0 (0.0%) |
| 20 to 24 Years | 84 (76.4%) | 0 (0.0%) |
| 25 to 29 Years | 62 (100.0%) | 6 (9.7%) |
| 30 to 34 Years | 104 (77.0%) | 11 (10.6%) |
| 35 to 44 Years | 335 (85.0%) | 0 (0.0%) |
| 45 to 54 Years | 258 (97.0%) | 5 (1.9%) |
| 55 to 59 Years | 251 (86.6%) | 37 (14.7%) |
| 60 to 64 Years | 120 (78.4%) | 0 (0.0%) |
| 65 to 74 Years | 80 (29.0%) | 0 (0.0%) |
| 75 Years and over | 6 (3.7%) | 0 (0.0%) |
| Total | 1,327 (69.1%) | 58 (4.4%) |
Employment Status by Educational Attainment in Hudson
According to labor force statistics for Hudson, 86.9% of individuals (1,130) out of the total population between 25 and 64 years of age (1,300) are in the labor force, with 5.2% or 59 of them being unemployed. The group with the highest labor force participation rate are those with the educational attainment of bachelor's degree or higher, with 93.0% or 521 individuals in the labor force. Within the labor force, individuals with high school diploma education have the highest percentage of unemployment, with 21.4% or 48 of them being unemployed.
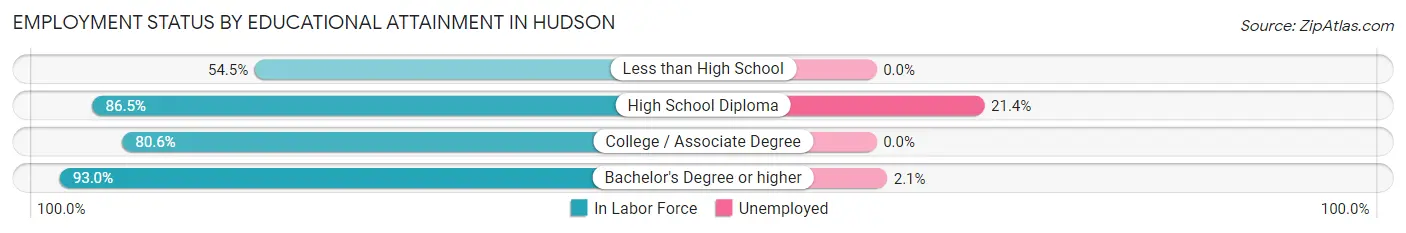
| Educational Attainment | In Labor Force | Unemployed |
| Less than High School | 6 (54.5%) | 0 (0.0%) |
| High School Diploma | 224 (86.5%) | 55 (21.4%) |
| College / Associate Degree | 379 (80.6%) | 0 (0.0%) |
| Bachelor's Degree or higher | 521 (93.0%) | 12 (2.1%) |
| Total | 1,130 (86.9%) | 68 (5.2%) |
Employment Occupations by Sex in Hudson
Management, Business, Science and Arts Occupations
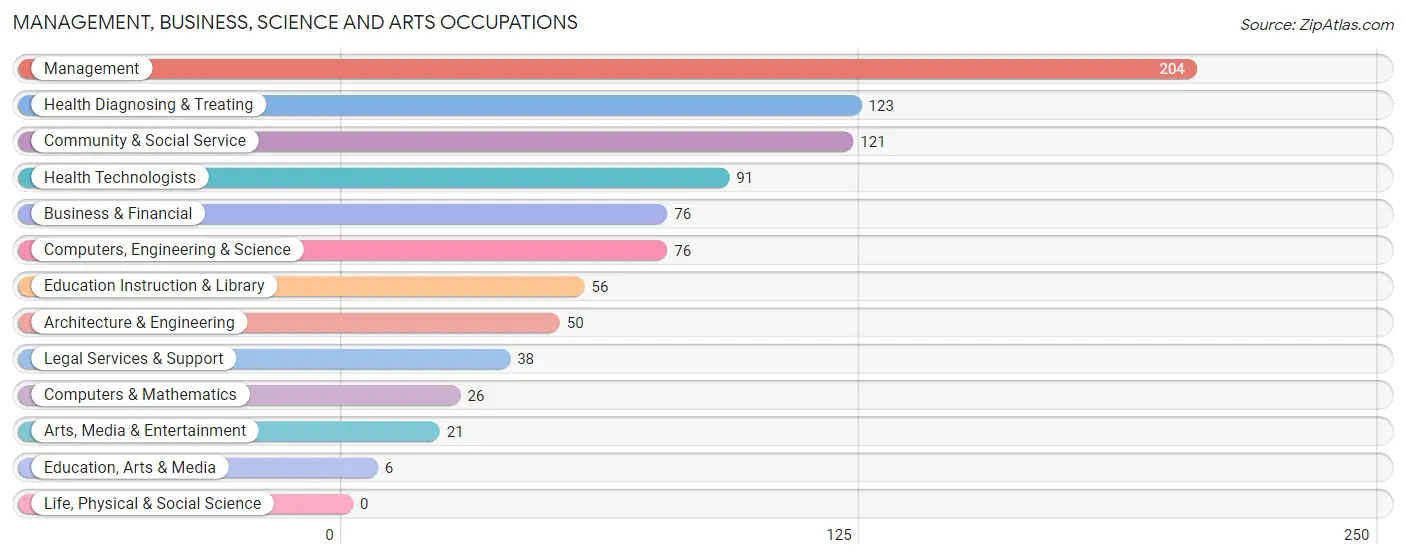
The most common Management, Business, Science and Arts occupations in Hudson are Management (204 | 16.1%), Health Diagnosing & Treating (123 | 9.7%), Community & Social Service (121 | 9.6%), Health Technologists (91 | 7.2%), and Business & Financial (76 | 6.0%).
Management, Business, Science and Arts Occupations by Sex
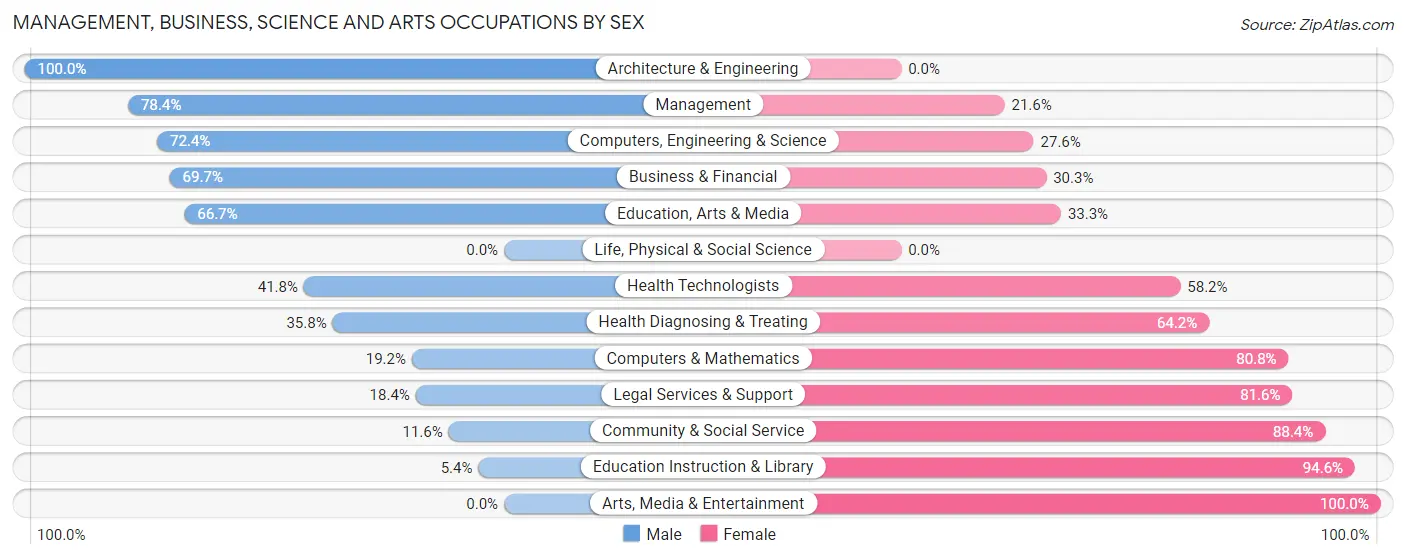
Within the Management, Business, Science and Arts occupations in Hudson, the most male-oriented occupations are Architecture & Engineering (100.0%), Management (78.4%), and Computers, Engineering & Science (72.4%), while the most female-oriented occupations are Arts, Media & Entertainment (100.0%), Education Instruction & Library (94.6%), and Community & Social Service (88.4%).
| Occupation | Male | Female |
| Management | 160 (78.4%) | 44 (21.6%) |
| Business & Financial | 53 (69.7%) | 23 (30.3%) |
| Computers, Engineering & Science | 55 (72.4%) | 21 (27.6%) |
| Computers & Mathematics | 5 (19.2%) | 21 (80.8%) |
| Architecture & Engineering | 50 (100.0%) | 0 (0.0%) |
| Life, Physical & Social Science | 0 (0.0%) | 0 (0.0%) |
| Community & Social Service | 14 (11.6%) | 107 (88.4%) |
| Education, Arts & Media | 4 (66.7%) | 2 (33.3%) |
| Legal Services & Support | 7 (18.4%) | 31 (81.6%) |
| Education Instruction & Library | 3 (5.4%) | 53 (94.6%) |
| Arts, Media & Entertainment | 0 (0.0%) | 21 (100.0%) |
| Health Diagnosing & Treating | 44 (35.8%) | 79 (64.2%) |
| Health Technologists | 38 (41.8%) | 53 (58.2%) |
| Total (Category) | 326 (54.3%) | 274 (45.7%) |
| Total (Overall) | 755 (59.6%) | 512 (40.4%) |
Services Occupations
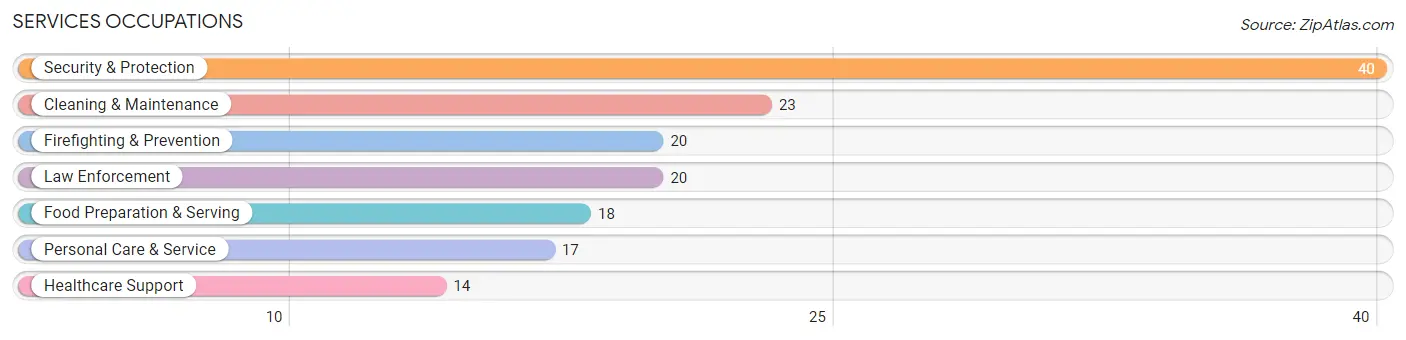
The most common Services occupations in Hudson are Security & Protection (40 | 3.2%), Cleaning & Maintenance (23 | 1.8%), Firefighting & Prevention (20 | 1.6%), Law Enforcement (20 | 1.6%), and Food Preparation & Serving (18 | 1.4%).
Services Occupations by Sex
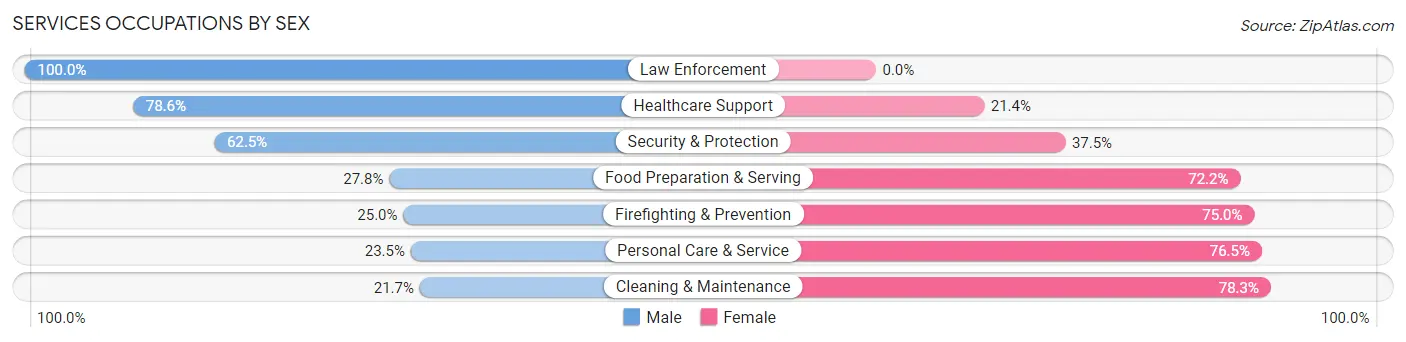
Within the Services occupations in Hudson, the most male-oriented occupations are Law Enforcement (100.0%), Healthcare Support (78.6%), and Security & Protection (62.5%), while the most female-oriented occupations are Cleaning & Maintenance (78.3%), Personal Care & Service (76.5%), and Firefighting & Prevention (75.0%).
| Occupation | Male | Female |
| Healthcare Support | 11 (78.6%) | 3 (21.4%) |
| Security & Protection | 25 (62.5%) | 15 (37.5%) |
| Firefighting & Prevention | 5 (25.0%) | 15 (75.0%) |
| Law Enforcement | 20 (100.0%) | 0 (0.0%) |
| Food Preparation & Serving | 5 (27.8%) | 13 (72.2%) |
| Cleaning & Maintenance | 5 (21.7%) | 18 (78.3%) |
| Personal Care & Service | 4 (23.5%) | 13 (76.5%) |
| Total (Category) | 50 (44.6%) | 62 (55.4%) |
| Total (Overall) | 755 (59.6%) | 512 (40.4%) |
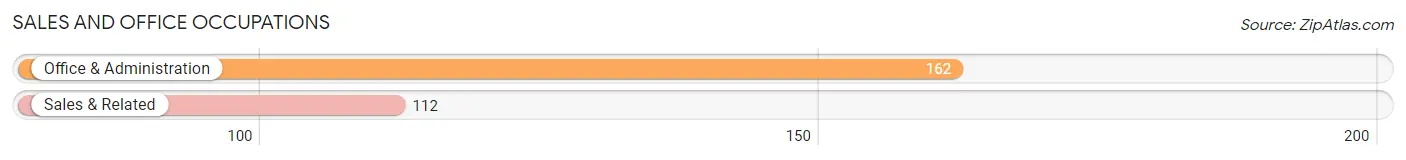
Sales and Office Occupations
The most common Sales and Office occupations in Hudson are Office & Administration (162 | 12.8%), and Sales & Related (112 | 8.8%).
Sales and Office Occupations by Sex
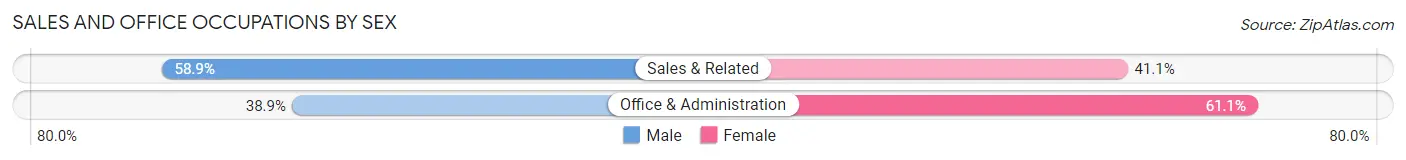
| Occupation | Male | Female |
| Sales & Related | 66 (58.9%) | 46 (41.1%) |
| Office & Administration | 63 (38.9%) | 99 (61.1%) |
| Total (Category) | 129 (47.1%) | 145 (52.9%) |
| Total (Overall) | 755 (59.6%) | 512 (40.4%) |
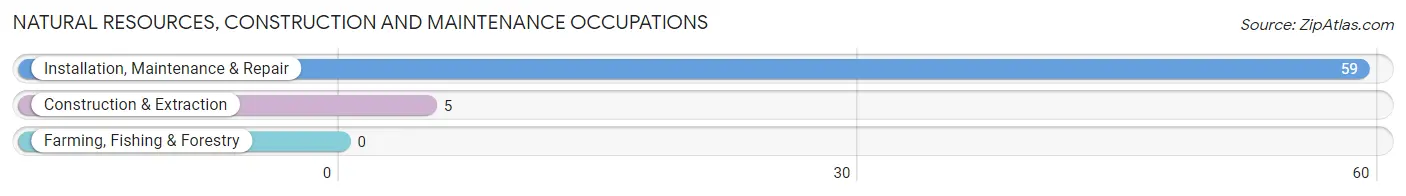
Natural Resources, Construction and Maintenance Occupations
The most common Natural Resources, Construction and Maintenance occupations in Hudson are Installation, Maintenance & Repair (59 | 4.7%), and Construction & Extraction (5 | 0.4%).
Natural Resources, Construction and Maintenance Occupations by Sex
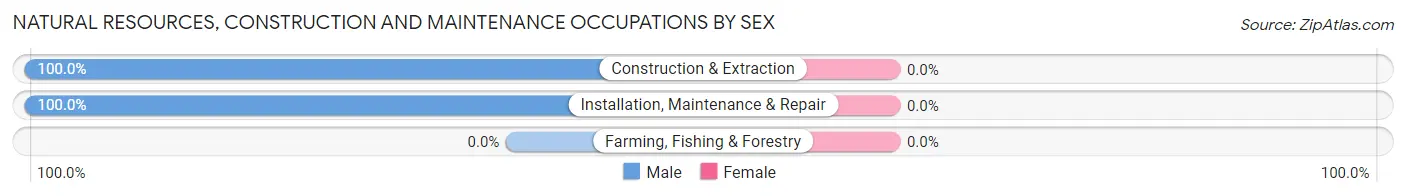
| Occupation | Male | Female |
| Farming, Fishing & Forestry | 0 (0.0%) | 0 (0.0%) |
| Construction & Extraction | 5 (100.0%) | 0 (0.0%) |
| Installation, Maintenance & Repair | 59 (100.0%) | 0 (0.0%) |
| Total (Category) | 64 (100.0%) | 0 (0.0%) |
| Total (Overall) | 755 (59.6%) | 512 (40.4%) |
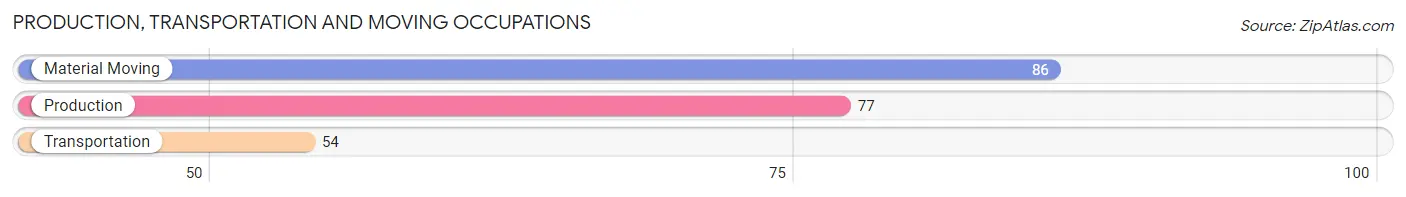
Production, Transportation and Moving Occupations
The most common Production, Transportation and Moving occupations in Hudson are Material Moving (86 | 6.8%), Production (77 | 6.1%), and Transportation (54 | 4.3%).
Production, Transportation and Moving Occupations by Sex
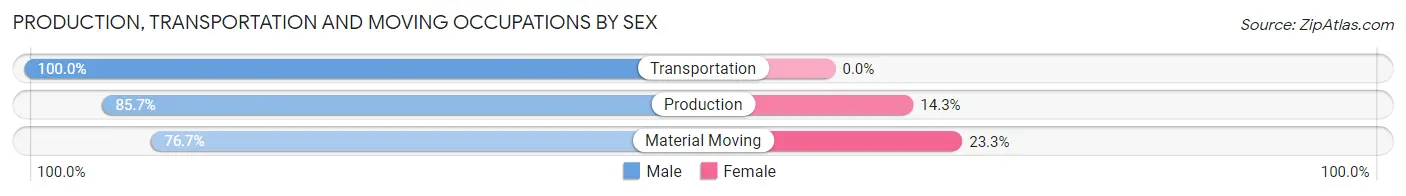
| Occupation | Male | Female |
| Production | 66 (85.7%) | 11 (14.3%) |
| Transportation | 54 (100.0%) | 0 (0.0%) |
| Material Moving | 66 (76.7%) | 20 (23.3%) |
| Total (Category) | 186 (85.7%) | 31 (14.3%) |
| Total (Overall) | 755 (59.6%) | 512 (40.4%) |
Employment Industries by Sex in Hudson
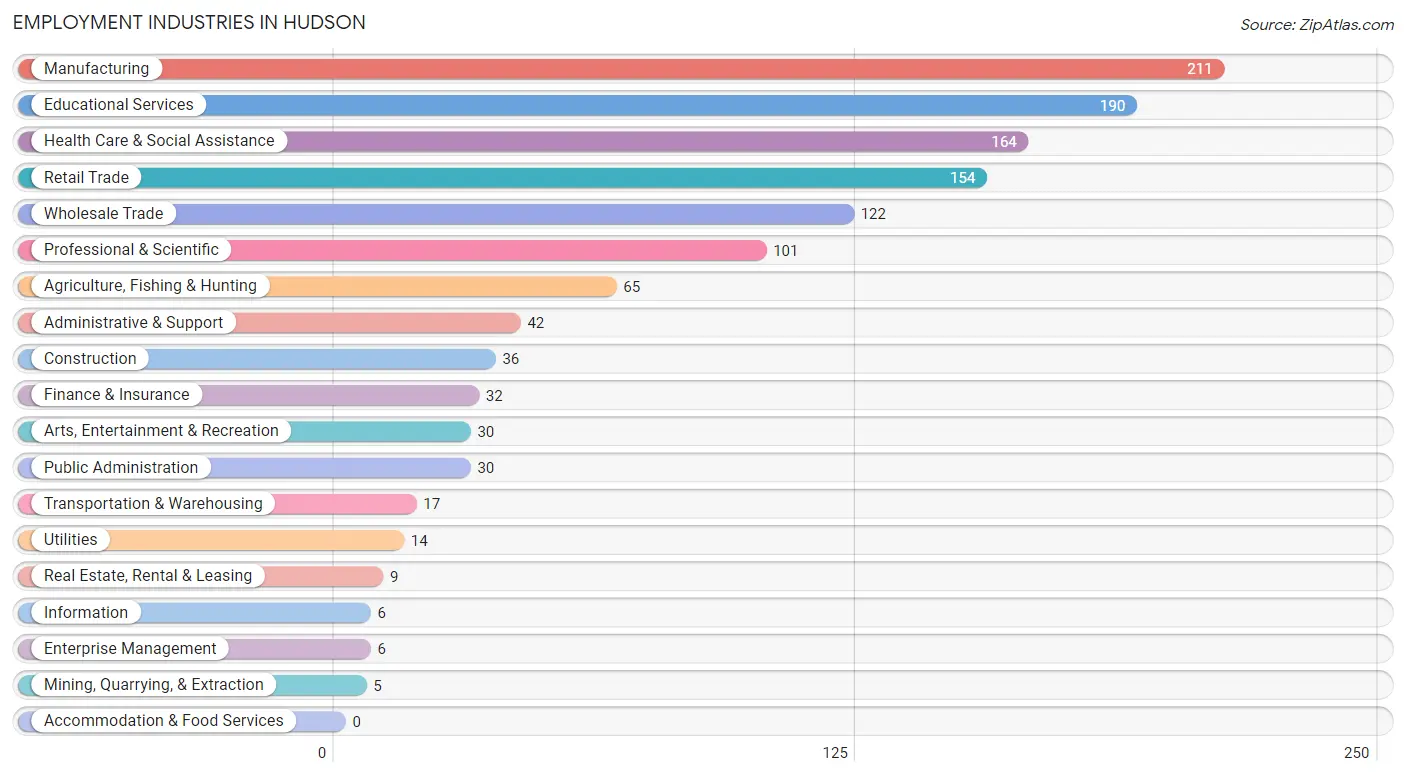
Employment Industries in Hudson
The major employment industries in Hudson include Manufacturing (211 | 16.7%), Educational Services (190 | 15.0%), Health Care & Social Assistance (164 | 12.9%), Retail Trade (154 | 12.1%), and Wholesale Trade (122 | 9.6%).
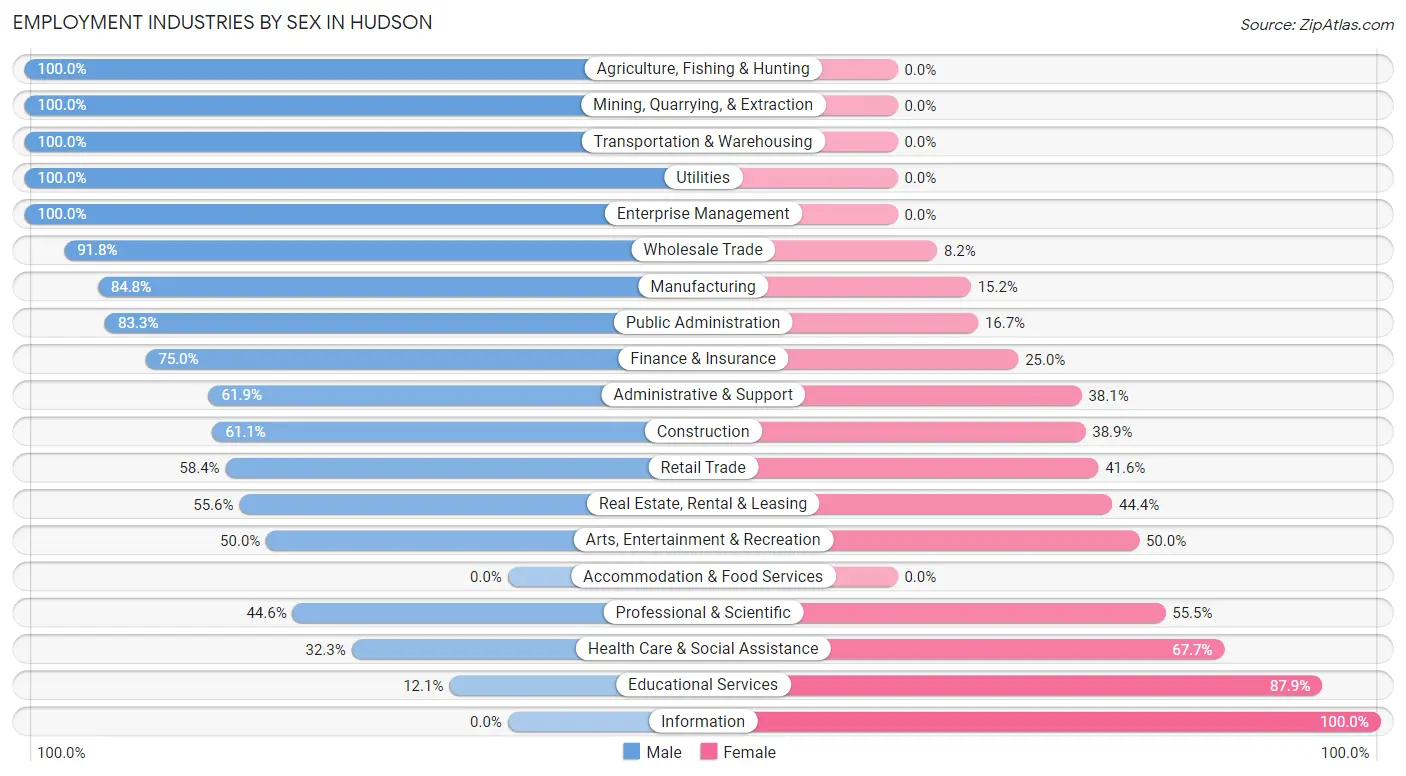
Employment Industries by Sex in Hudson
The Hudson industries that see more men than women are Agriculture, Fishing & Hunting (100.0%), Mining, Quarrying, & Extraction (100.0%), and Transportation & Warehousing (100.0%), whereas the industries that tend to have a higher number of women are Information (100.0%), Educational Services (87.9%), and Health Care & Social Assistance (67.7%).
| Industry | Male | Female |
| Agriculture, Fishing & Hunting | 65 (100.0%) | 0 (0.0%) |
| Mining, Quarrying, & Extraction | 5 (100.0%) | 0 (0.0%) |
| Construction | 22 (61.1%) | 14 (38.9%) |
| Manufacturing | 179 (84.8%) | 32 (15.2%) |
| Wholesale Trade | 112 (91.8%) | 10 (8.2%) |
| Retail Trade | 90 (58.4%) | 64 (41.6%) |
| Transportation & Warehousing | 17 (100.0%) | 0 (0.0%) |
| Utilities | 14 (100.0%) | 0 (0.0%) |
| Information | 0 (0.0%) | 6 (100.0%) |
| Finance & Insurance | 24 (75.0%) | 8 (25.0%) |
| Real Estate, Rental & Leasing | 5 (55.6%) | 4 (44.4%) |
| Professional & Scientific | 45 (44.6%) | 56 (55.4%) |
| Enterprise Management | 6 (100.0%) | 0 (0.0%) |
| Administrative & Support | 26 (61.9%) | 16 (38.1%) |
| Educational Services | 23 (12.1%) | 167 (87.9%) |
| Health Care & Social Assistance | 53 (32.3%) | 111 (67.7%) |
| Arts, Entertainment & Recreation | 15 (50.0%) | 15 (50.0%) |
| Accommodation & Food Services | 0 (0.0%) | 0 (0.0%) |
| Public Administration | 25 (83.3%) | 5 (16.7%) |
| Total | 755 (59.6%) | 512 (40.4%) |
Education in Hudson
School Enrollment in Hudson
The most common levels of schooling among the 675 students in Hudson are middle school (177 | 26.2%), elementary school (151 | 22.4%), and high school (118 | 17.5%).
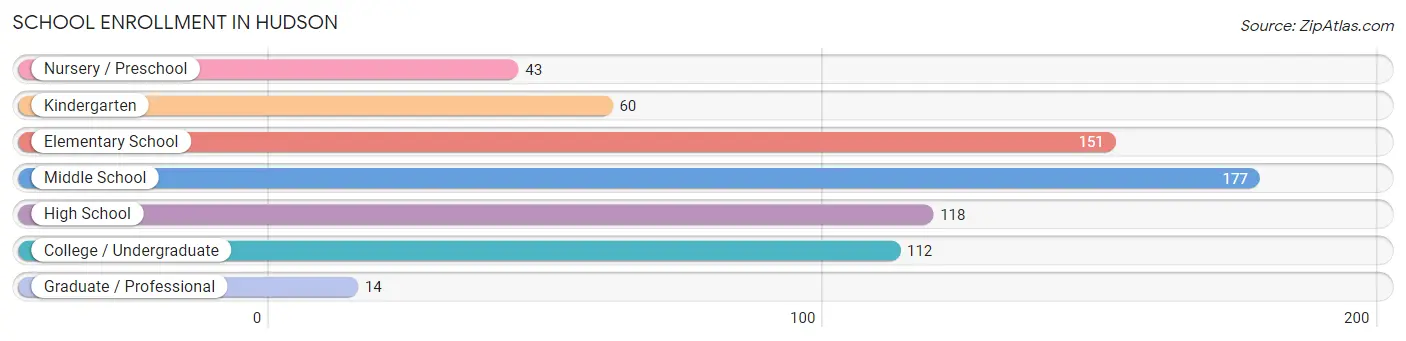
| School Level | # Students | % Students |
| Nursery / Preschool | 43 | 6.4% |
| Kindergarten | 60 | 8.9% |
| Elementary School | 151 | 22.4% |
| Middle School | 177 | 26.2% |
| High School | 118 | 17.5% |
| College / Undergraduate | 112 | 16.6% |
| Graduate / Professional | 14 | 2.1% |
| Total | 675 | 100.0% |
School Enrollment by Age by Funding Source in Hudson
Out of a total of 675 students who are enrolled in schools in Hudson, 139 (20.6%) attend a private institution, while the remaining 536 (79.4%) are enrolled in public schools. The age group of 3 to 4 year olds has the highest likelihood of being enrolled in private schools, with 7 (70.0% in the age bracket) enrolled. Conversely, the age group of 15 to 17 year olds has the lowest likelihood of being enrolled in a private school, with 70 (100.0% in the age bracket) attending a public institution.
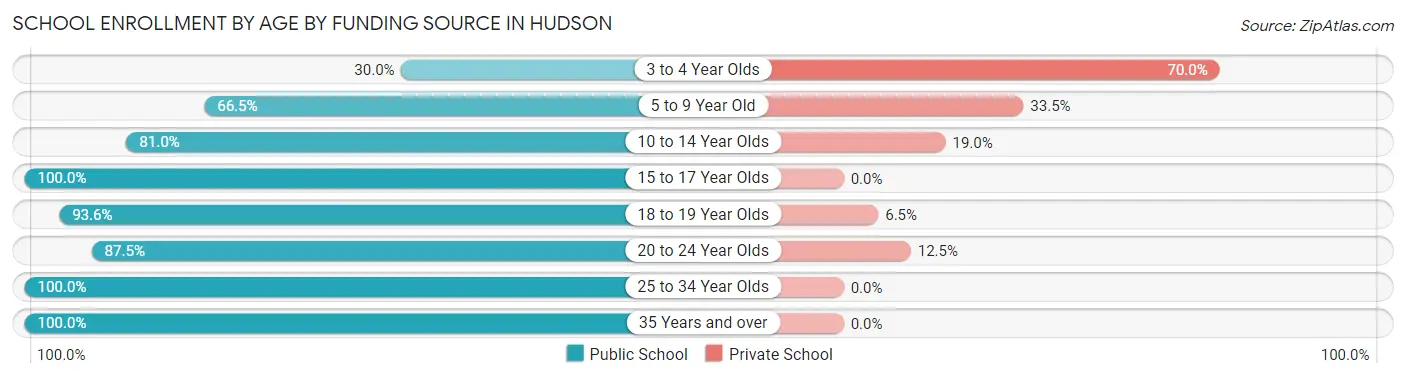
| Age Bracket | Public School | Private School |
| 3 to 4 Year Olds | 3 (30.0%) | 7 (70.0%) |
| 5 to 9 Year Old | 149 (66.5%) | 75 (33.5%) |
| 10 to 14 Year Olds | 188 (81.0%) | 44 (19.0%) |
| 15 to 17 Year Olds | 70 (100.0%) | 0 (0.0%) |
| 18 to 19 Year Olds | 29 (93.5%) | 2 (6.5%) |
| 20 to 24 Year Olds | 77 (87.5%) | 11 (12.5%) |
| 25 to 34 Year Olds | 11 (100.0%) | 0 (0.0%) |
| 35 Years and over | 9 (100.0%) | 0 (0.0%) |
| Total | 536 (79.4%) | 139 (20.6%) |
Educational Attainment by Field of Study in Hudson
Business (155 | 20.6%), science & technology (117 | 15.5%), education (117 | 15.5%), bio, nature & agricultural (75 | 10.0%), and social sciences (67 | 8.9%) are the most common fields of study among 753 individuals in Hudson who have obtained a bachelor's degree or higher.
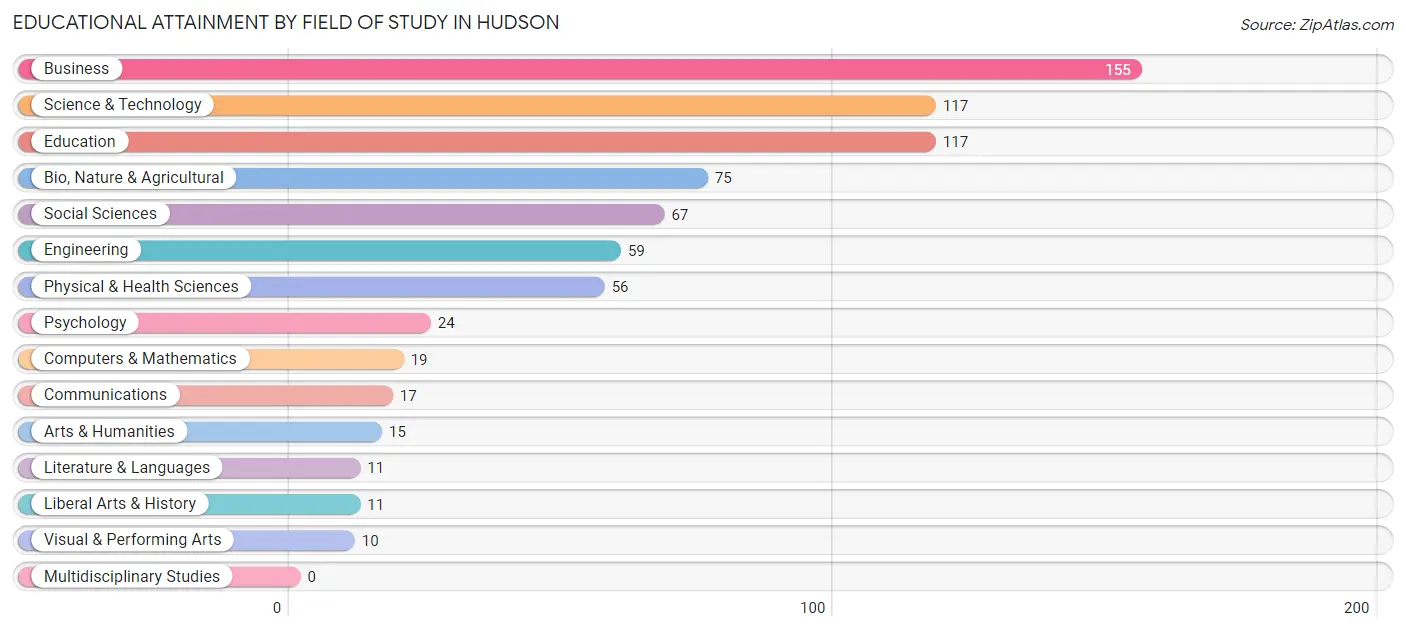
| Field of Study | # Graduates | % Graduates |
| Computers & Mathematics | 19 | 2.5% |
| Bio, Nature & Agricultural | 75 | 10.0% |
| Physical & Health Sciences | 56 | 7.4% |
| Psychology | 24 | 3.2% |
| Social Sciences | 67 | 8.9% |
| Engineering | 59 | 7.8% |
| Multidisciplinary Studies | 0 | 0.0% |
| Science & Technology | 117 | 15.5% |
| Business | 155 | 20.6% |
| Education | 117 | 15.5% |
| Literature & Languages | 11 | 1.5% |
| Liberal Arts & History | 11 | 1.5% |
| Visual & Performing Arts | 10 | 1.3% |
| Communications | 17 | 2.3% |
| Arts & Humanities | 15 | 2.0% |
| Total | 753 | 100.0% |
Transportation & Commute in Hudson
Vehicle Availability by Sex in Hudson
The most prevalent vehicle ownership categories in Hudson are males with 2 vehicles (282, accounting for 38.3%) and females with 2 vehicles (211, making up 55.5%).
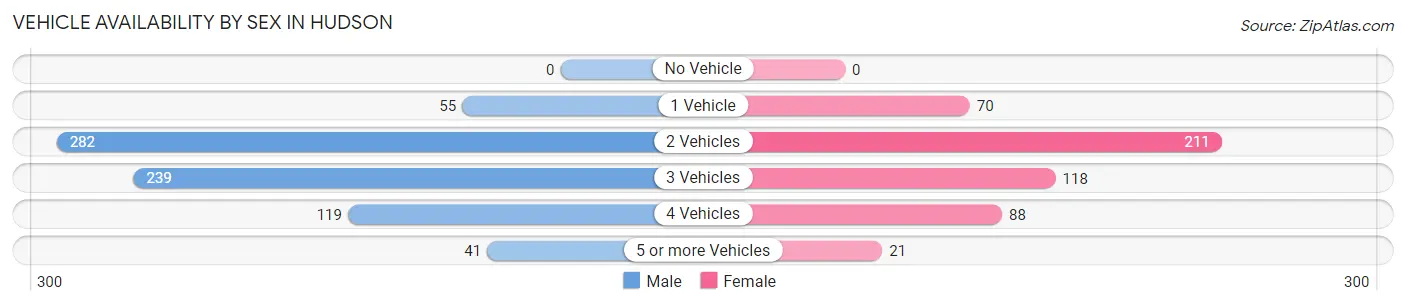
| Vehicles Available | Male | Female |
| No Vehicle | 0 (0.0%) | 0 (0.0%) |
| 1 Vehicle | 55 (7.5%) | 70 (13.8%) |
| 2 Vehicles | 282 (38.3%) | 211 (41.5%) |
| 3 Vehicles | 239 (32.5%) | 118 (23.2%) |
| 4 Vehicles | 119 (16.2%) | 88 (17.3%) |
| 5 or more Vehicles | 41 (5.6%) | 21 (4.1%) |
| Total | 736 (100.0%) | 508 (100.0%) |
Commute Time in Hudson
The most frequently occuring commute durations in Hudson are 15 to 19 minutes (406 commuters, 35.9%), 20 to 24 minutes (256 commuters, 22.6%), and 10 to 14 minutes (160 commuters, 14.1%).
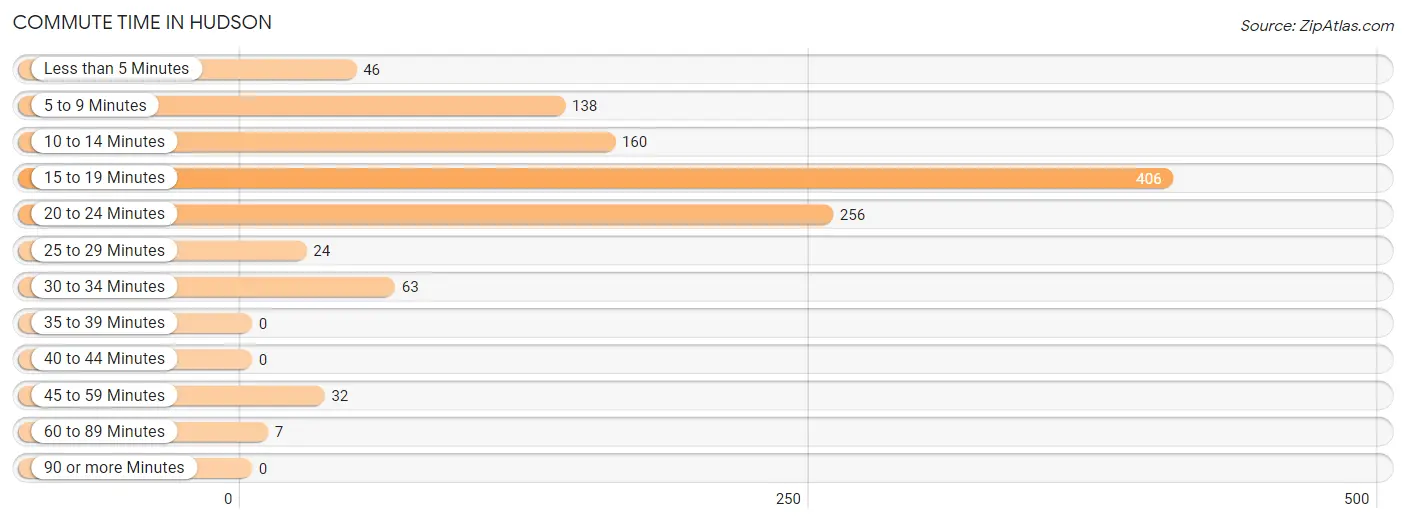
| Commute Time | # Commuters | % Commuters |
| Less than 5 Minutes | 46 | 4.1% |
| 5 to 9 Minutes | 138 | 12.2% |
| 10 to 14 Minutes | 160 | 14.1% |
| 15 to 19 Minutes | 406 | 35.9% |
| 20 to 24 Minutes | 256 | 22.6% |
| 25 to 29 Minutes | 24 | 2.1% |
| 30 to 34 Minutes | 63 | 5.6% |
| 35 to 39 Minutes | 0 | 0.0% |
| 40 to 44 Minutes | 0 | 0.0% |
| 45 to 59 Minutes | 32 | 2.8% |
| 60 to 89 Minutes | 7 | 0.6% |
| 90 or more Minutes | 0 | 0.0% |
Commute Time by Sex in Hudson
The most common commute times in Hudson are 15 to 19 minutes (249 commuters, 38.0%) for males and 15 to 19 minutes (157 commuters, 33.0%) for females.
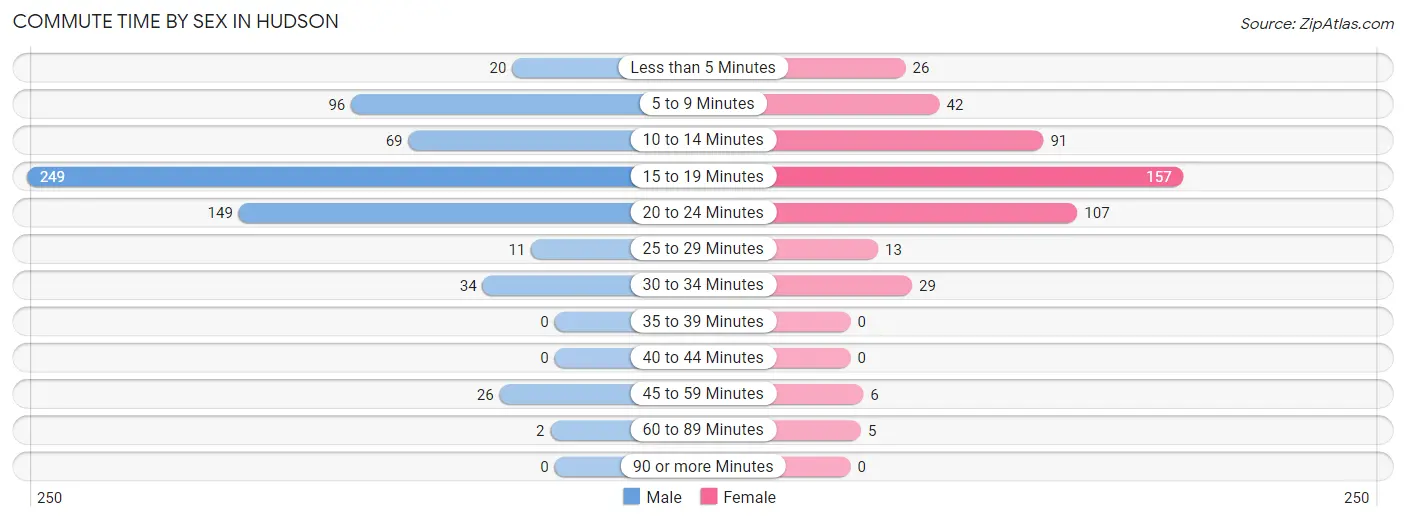
| Commute Time | Male | Female |
| Less than 5 Minutes | 20 (3.0%) | 26 (5.5%) |
| 5 to 9 Minutes | 96 (14.6%) | 42 (8.8%) |
| 10 to 14 Minutes | 69 (10.5%) | 91 (19.1%) |
| 15 to 19 Minutes | 249 (38.0%) | 157 (33.0%) |
| 20 to 24 Minutes | 149 (22.7%) | 107 (22.5%) |
| 25 to 29 Minutes | 11 (1.7%) | 13 (2.7%) |
| 30 to 34 Minutes | 34 (5.2%) | 29 (6.1%) |
| 35 to 39 Minutes | 0 (0.0%) | 0 (0.0%) |
| 40 to 44 Minutes | 0 (0.0%) | 0 (0.0%) |
| 45 to 59 Minutes | 26 (4.0%) | 6 (1.3%) |
| 60 to 89 Minutes | 2 (0.3%) | 5 (1.1%) |
| 90 or more Minutes | 0 (0.0%) | 0 (0.0%) |
Time of Departure to Work by Sex in Hudson
The most frequent times of departure to work in Hudson are 6:30 AM to 6:59 AM (191, 29.1%) for males and 7:30 AM to 7:59 AM (119, 25.0%) for females.
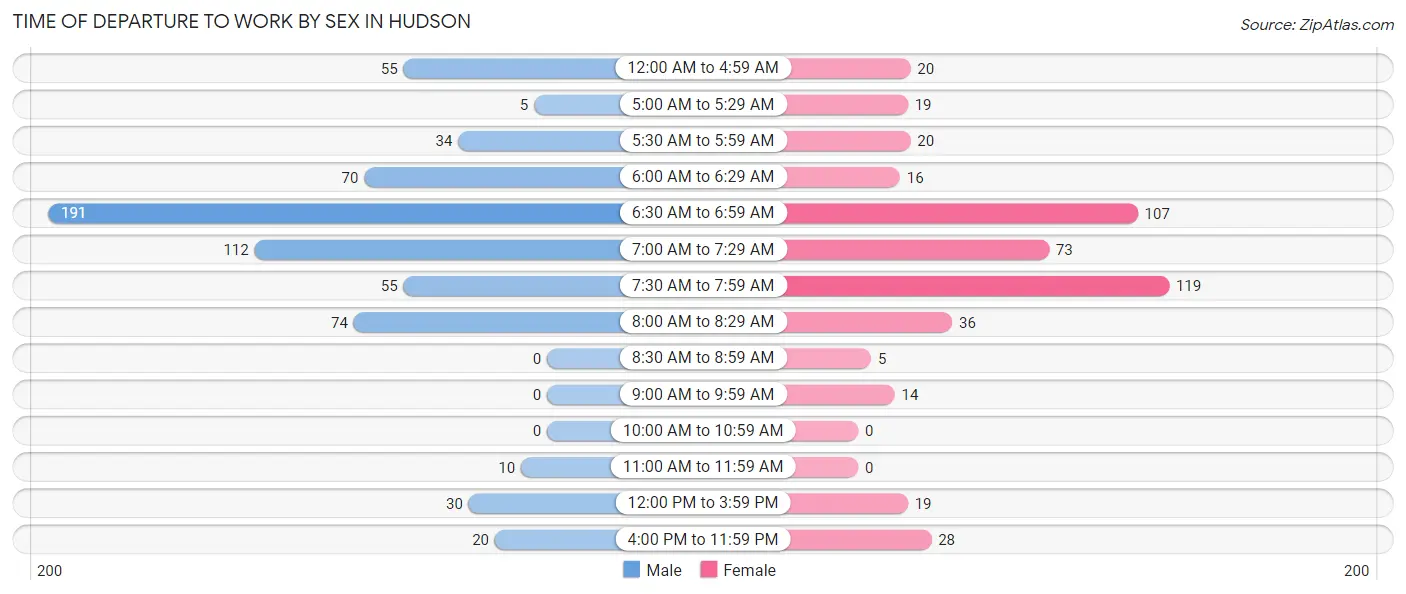
| Time of Departure | Male | Female |
| 12:00 AM to 4:59 AM | 55 (8.4%) | 20 (4.2%) |
| 5:00 AM to 5:29 AM | 5 (0.8%) | 19 (4.0%) |
| 5:30 AM to 5:59 AM | 34 (5.2%) | 20 (4.2%) |
| 6:00 AM to 6:29 AM | 70 (10.7%) | 16 (3.4%) |
| 6:30 AM to 6:59 AM | 191 (29.1%) | 107 (22.5%) |
| 7:00 AM to 7:29 AM | 112 (17.1%) | 73 (15.3%) |
| 7:30 AM to 7:59 AM | 55 (8.4%) | 119 (25.0%) |
| 8:00 AM to 8:29 AM | 74 (11.3%) | 36 (7.6%) |
| 8:30 AM to 8:59 AM | 0 (0.0%) | 5 (1.1%) |
| 9:00 AM to 9:59 AM | 0 (0.0%) | 14 (2.9%) |
| 10:00 AM to 10:59 AM | 0 (0.0%) | 0 (0.0%) |
| 11:00 AM to 11:59 AM | 10 (1.5%) | 0 (0.0%) |
| 12:00 PM to 3:59 PM | 30 (4.6%) | 19 (4.0%) |
| 4:00 PM to 11:59 PM | 20 (3.0%) | 28 (5.9%) |
| Total | 656 (100.0%) | 476 (100.0%) |
Housing Occupancy in Hudson
Occupancy by Ownership in Hudson
Of the total 963 dwellings in Hudson, owner-occupied units account for 858 (89.1%), while renter-occupied units make up 105 (10.9%).
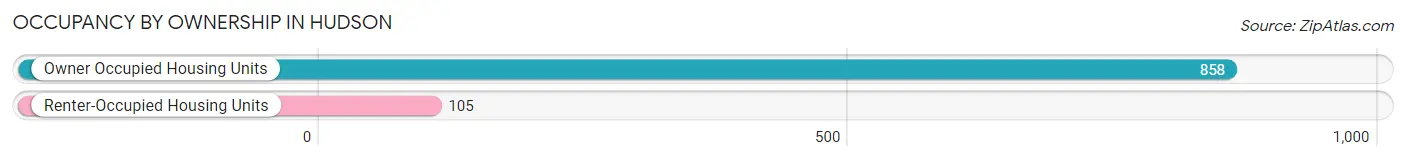
| Occupancy | # Housing Units | % Housing Units |
| Owner Occupied Housing Units | 858 | 89.1% |
| Renter-Occupied Housing Units | 105 | 10.9% |
| Total Occupied Housing Units | 963 | 100.0% |
Occupancy by Household Size in Hudson
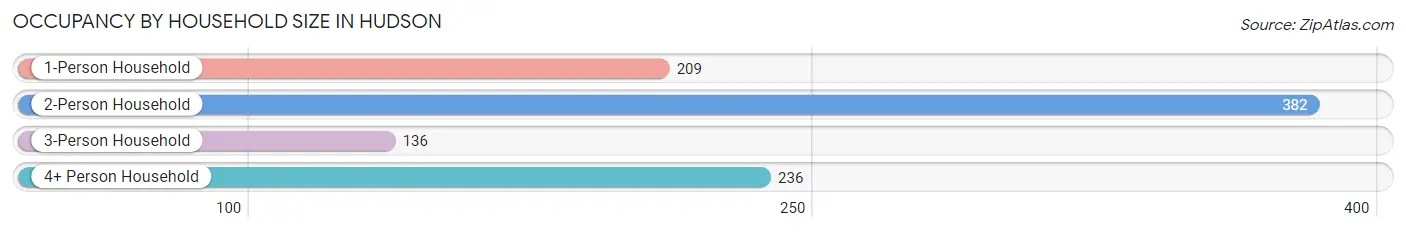
| Household Size | # Housing Units | % Housing Units |
| 1-Person Household | 209 | 21.7% |
| 2-Person Household | 382 | 39.7% |
| 3-Person Household | 136 | 14.1% |
| 4+ Person Household | 236 | 24.5% |
| Total Housing Units | 963 | 100.0% |
Occupancy by Ownership by Household Size in Hudson
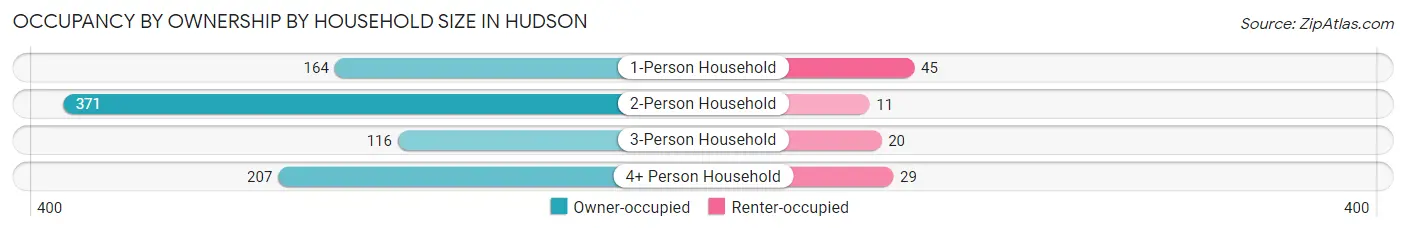
| Household Size | Owner-occupied | Renter-occupied |
| 1-Person Household | 164 (78.5%) | 45 (21.5%) |
| 2-Person Household | 371 (97.1%) | 11 (2.9%) |
| 3-Person Household | 116 (85.3%) | 20 (14.7%) |
| 4+ Person Household | 207 (87.7%) | 29 (12.3%) |
| Total Housing Units | 858 (89.1%) | 105 (10.9%) |
Occupancy by Educational Attainment in Hudson
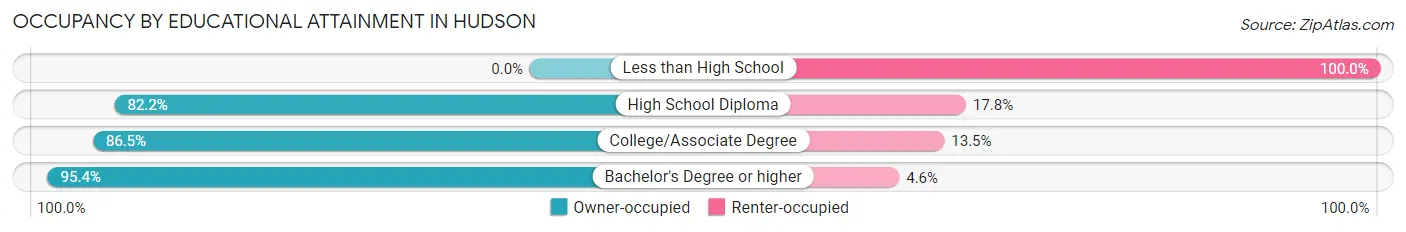
| Household Size | Owner-occupied | Renter-occupied |
| Less than High School | 0 (0.0%) | 6 (100.0%) |
| High School Diploma | 166 (82.2%) | 36 (17.8%) |
| College/Associate Degree | 275 (86.5%) | 43 (13.5%) |
| Bachelor's Degree or higher | 417 (95.4%) | 20 (4.6%) |
Occupancy by Age of Householder in Hudson
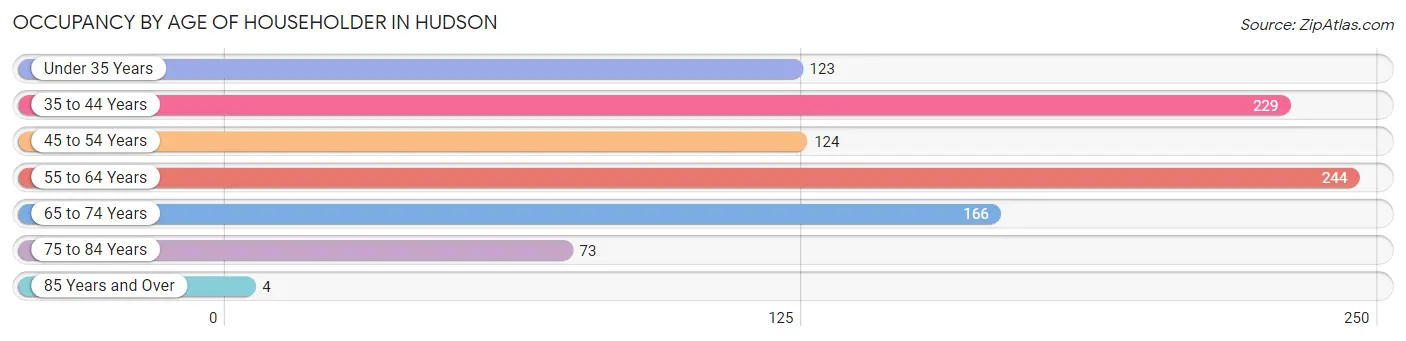
| Age Bracket | # Households | % Households |
| Under 35 Years | 123 | 12.8% |
| 35 to 44 Years | 229 | 23.8% |
| 45 to 54 Years | 124 | 12.9% |
| 55 to 64 Years | 244 | 25.3% |
| 65 to 74 Years | 166 | 17.2% |
| 75 to 84 Years | 73 | 7.6% |
| 85 Years and Over | 4 | 0.4% |
| Total | 963 | 100.0% |
Housing Finances in Hudson
Median Income by Occupancy in Hudson
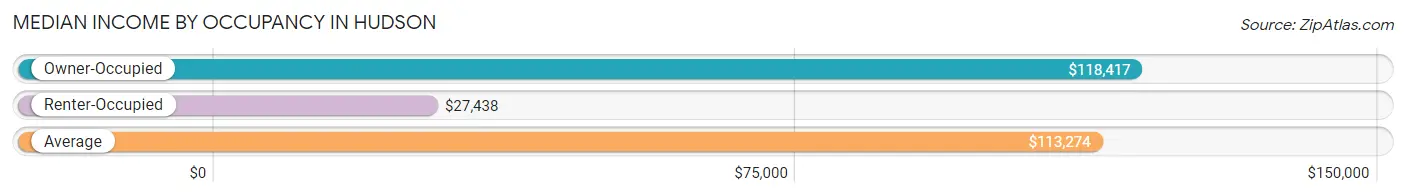
| Occupancy Type | # Households | Median Income |
| Owner-Occupied | 858 (89.1%) | $118,417 |
| Renter-Occupied | 105 (10.9%) | $27,438 |
| Average | 963 (100.0%) | $113,274 |
Occupancy by Householder Income Bracket in Hudson
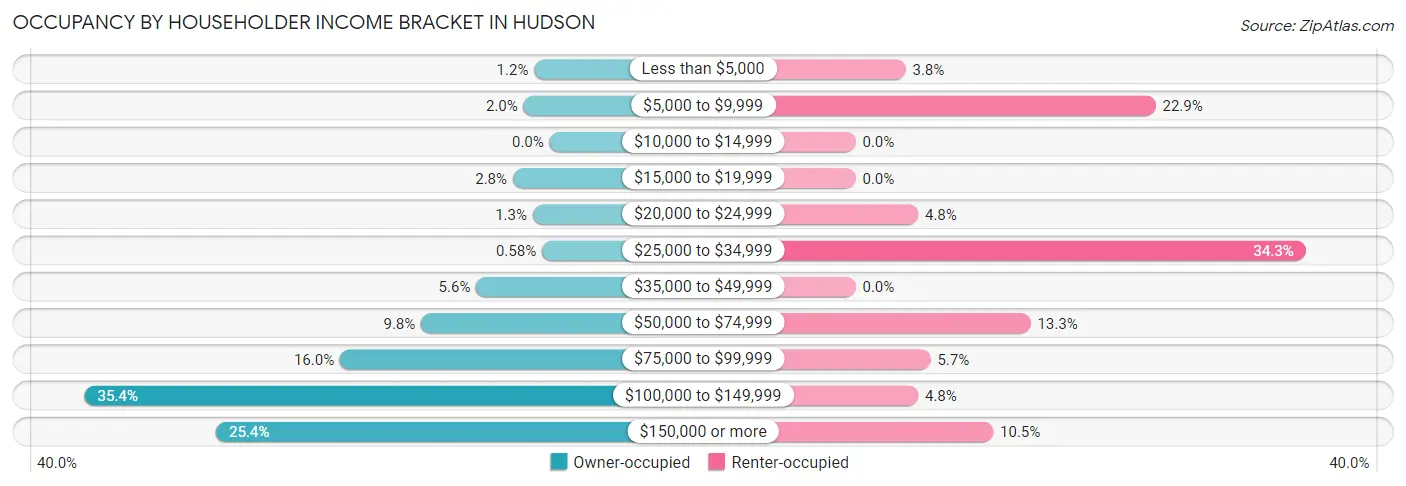
| Income Bracket | Owner-occupied | Renter-occupied |
| Less than $5,000 | 10 (1.2%) | 4 (3.8%) |
| $5,000 to $9,999 | 17 (2.0%) | 24 (22.9%) |
| $10,000 to $14,999 | 0 (0.0%) | 0 (0.0%) |
| $15,000 to $19,999 | 24 (2.8%) | 0 (0.0%) |
| $20,000 to $24,999 | 11 (1.3%) | 5 (4.8%) |
| $25,000 to $34,999 | 5 (0.6%) | 36 (34.3%) |
| $35,000 to $49,999 | 48 (5.6%) | 0 (0.0%) |
| $50,000 to $74,999 | 84 (9.8%) | 14 (13.3%) |
| $75,000 to $99,999 | 137 (16.0%) | 6 (5.7%) |
| $100,000 to $149,999 | 304 (35.4%) | 5 (4.8%) |
| $150,000 or more | 218 (25.4%) | 11 (10.5%) |
| Total | 858 (100.0%) | 105 (100.0%) |
Monthly Housing Cost Tiers in Hudson
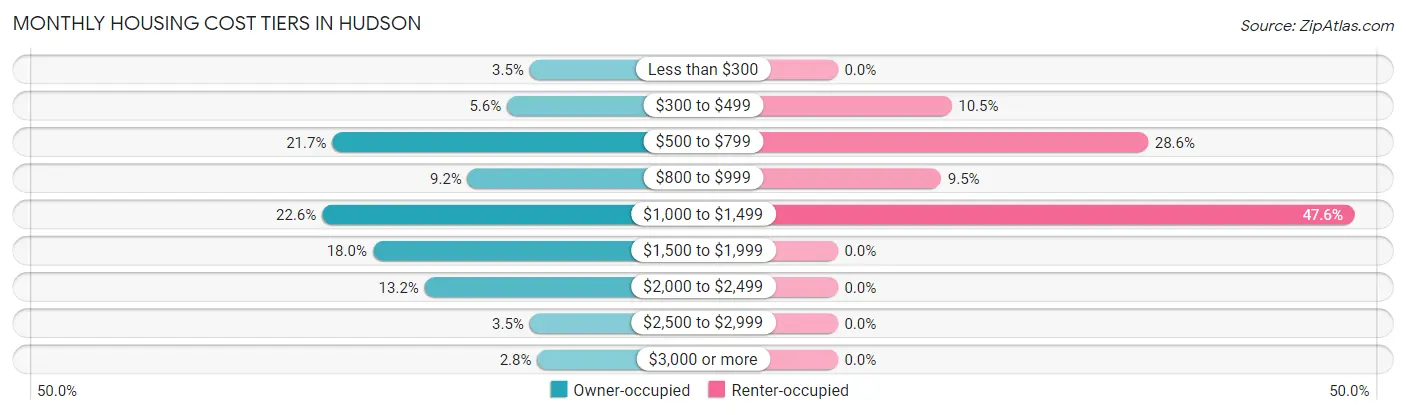
| Monthly Cost | Owner-occupied | Renter-occupied |
| Less than $300 | 30 (3.5%) | 0 (0.0%) |
| $300 to $499 | 48 (5.6%) | 11 (10.5%) |
| $500 to $799 | 186 (21.7%) | 30 (28.6%) |
| $800 to $999 | 79 (9.2%) | 10 (9.5%) |
| $1,000 to $1,499 | 194 (22.6%) | 50 (47.6%) |
| $1,500 to $1,999 | 154 (17.9%) | 0 (0.0%) |
| $2,000 to $2,499 | 113 (13.2%) | 0 (0.0%) |
| $2,500 to $2,999 | 30 (3.5%) | 0 (0.0%) |
| $3,000 or more | 24 (2.8%) | 0 (0.0%) |
| Total | 858 (100.0%) | 105 (100.0%) |
Physical Housing Characteristics in Hudson
Housing Structures in Hudson
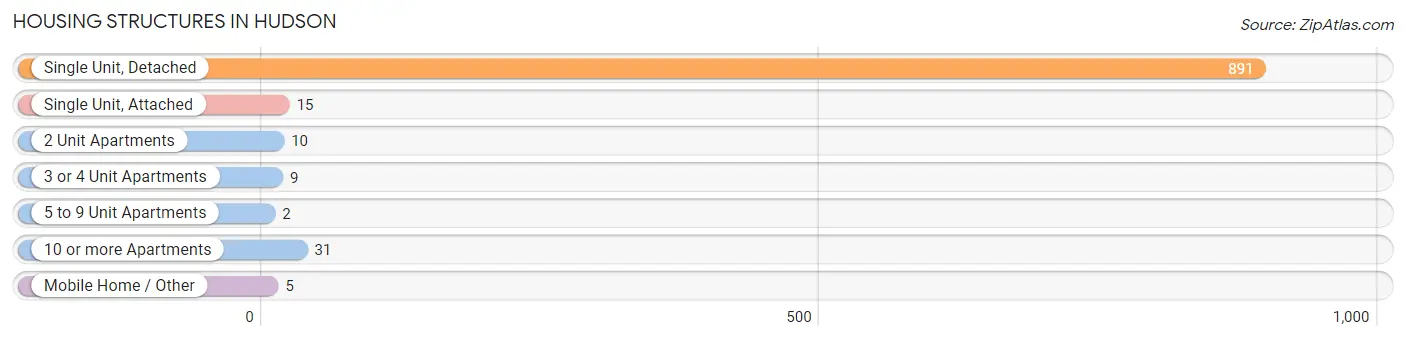
| Structure Type | # Housing Units | % Housing Units |
| Single Unit, Detached | 891 | 92.5% |
| Single Unit, Attached | 15 | 1.6% |
| 2 Unit Apartments | 10 | 1.0% |
| 3 or 4 Unit Apartments | 9 | 0.9% |
| 5 to 9 Unit Apartments | 2 | 0.2% |
| 10 or more Apartments | 31 | 3.2% |
| Mobile Home / Other | 5 | 0.5% |
| Total | 963 | 100.0% |
Housing Structures by Occupancy in Hudson
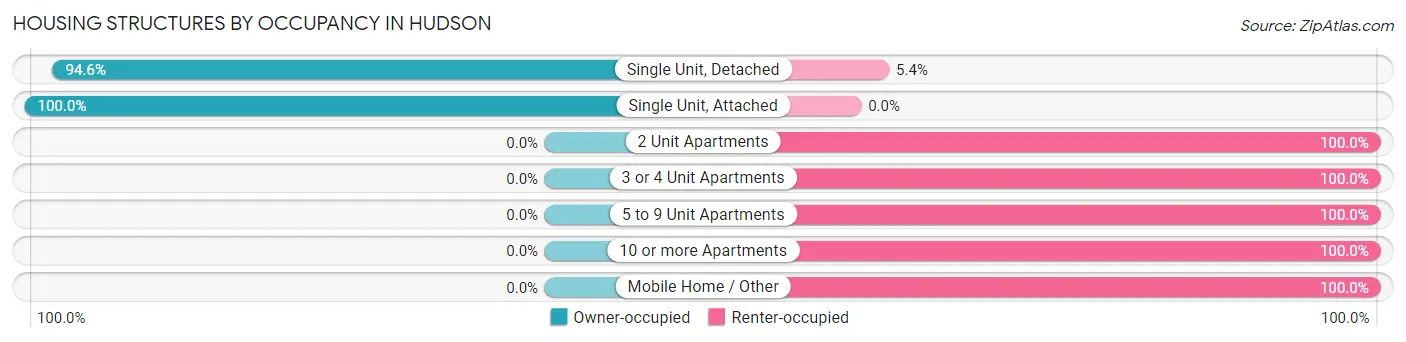
| Structure Type | Owner-occupied | Renter-occupied |
| Single Unit, Detached | 843 (94.6%) | 48 (5.4%) |
| Single Unit, Attached | 15 (100.0%) | 0 (0.0%) |
| 2 Unit Apartments | 0 (0.0%) | 10 (100.0%) |
| 3 or 4 Unit Apartments | 0 (0.0%) | 9 (100.0%) |
| 5 to 9 Unit Apartments | 0 (0.0%) | 2 (100.0%) |
| 10 or more Apartments | 0 (0.0%) | 31 (100.0%) |
| Mobile Home / Other | 0 (0.0%) | 5 (100.0%) |
| Total | 858 (89.1%) | 105 (10.9%) |
Housing Structures by Number of Rooms in Hudson
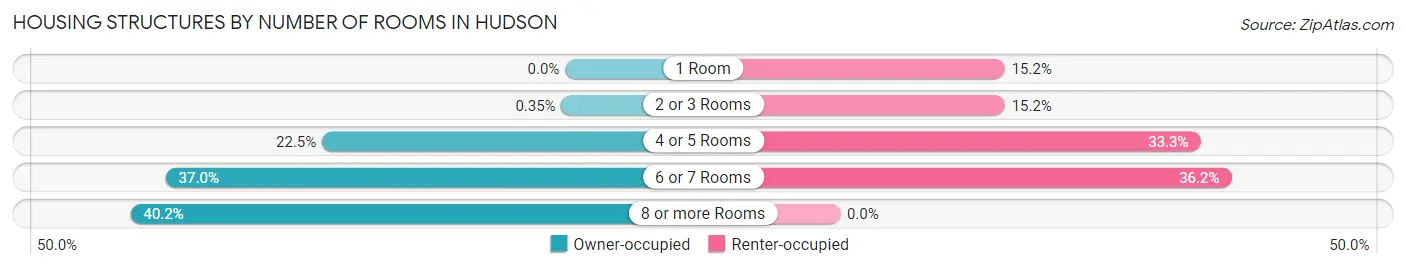
| Number of Rooms | Owner-occupied | Renter-occupied |
| 1 Room | 0 (0.0%) | 16 (15.2%) |
| 2 or 3 Rooms | 3 (0.4%) | 16 (15.2%) |
| 4 or 5 Rooms | 193 (22.5%) | 35 (33.3%) |
| 6 or 7 Rooms | 317 (36.9%) | 38 (36.2%) |
| 8 or more Rooms | 345 (40.2%) | 0 (0.0%) |
| Total | 858 (100.0%) | 105 (100.0%) |
Housing Structure by Heating Type in Hudson
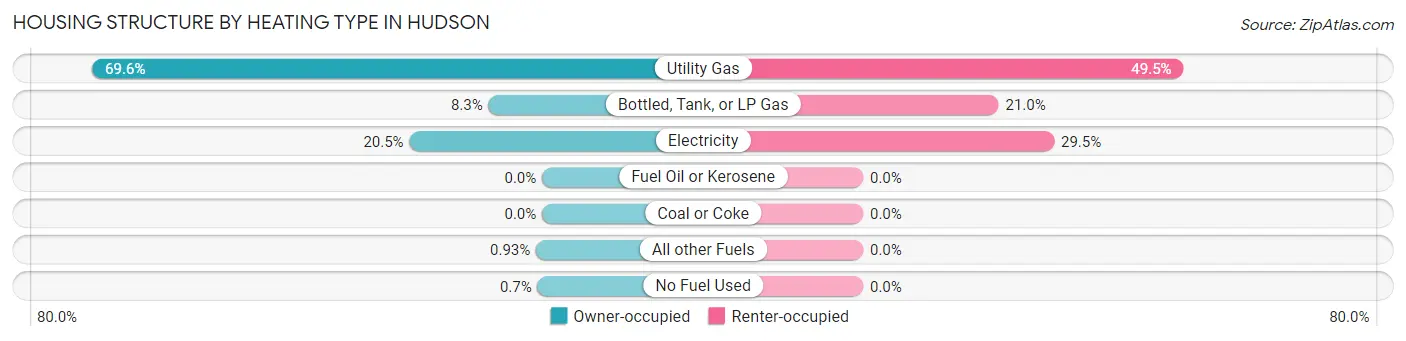
| Heating Type | Owner-occupied | Renter-occupied |
| Utility Gas | 597 (69.6%) | 52 (49.5%) |
| Bottled, Tank, or LP Gas | 71 (8.3%) | 22 (20.9%) |
| Electricity | 176 (20.5%) | 31 (29.5%) |
| Fuel Oil or Kerosene | 0 (0.0%) | 0 (0.0%) |
| Coal or Coke | 0 (0.0%) | 0 (0.0%) |
| All other Fuels | 8 (0.9%) | 0 (0.0%) |
| No Fuel Used | 6 (0.7%) | 0 (0.0%) |
| Total | 858 (100.0%) | 105 (100.0%) |
Household Vehicle Usage in Hudson
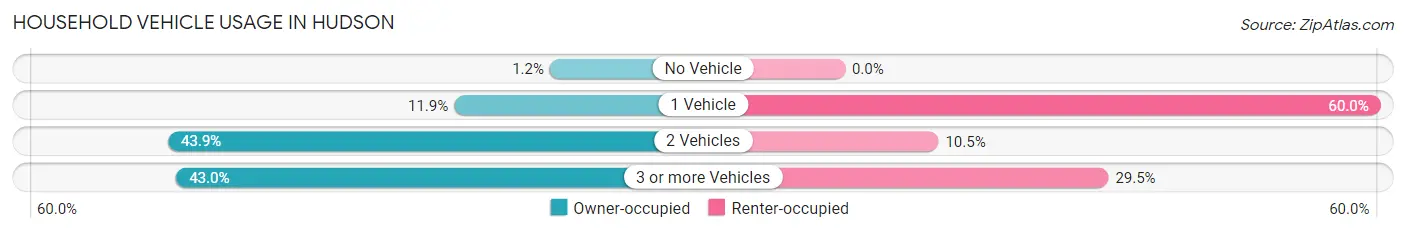
| Vehicles per Household | Owner-occupied | Renter-occupied |
| No Vehicle | 10 (1.2%) | 0 (0.0%) |
| 1 Vehicle | 102 (11.9%) | 63 (60.0%) |
| 2 Vehicles | 377 (43.9%) | 11 (10.5%) |
| 3 or more Vehicles | 369 (43.0%) | 31 (29.5%) |
| Total | 858 (100.0%) | 105 (100.0%) |
Real Estate & Mortgages in Hudson
Real Estate and Mortgage Overview in Hudson
| Characteristic | Without Mortgage | With Mortgage |
| Housing Units | 300 | 558 |
| Median Property Value | $221,100 | $237,900 |
| Median Household Income | $120,500 | $114 |
| Monthly Housing Costs | $674 | $24 |
| Real Estate Taxes | $3,595 | $6 |
Property Value by Mortgage Status in Hudson
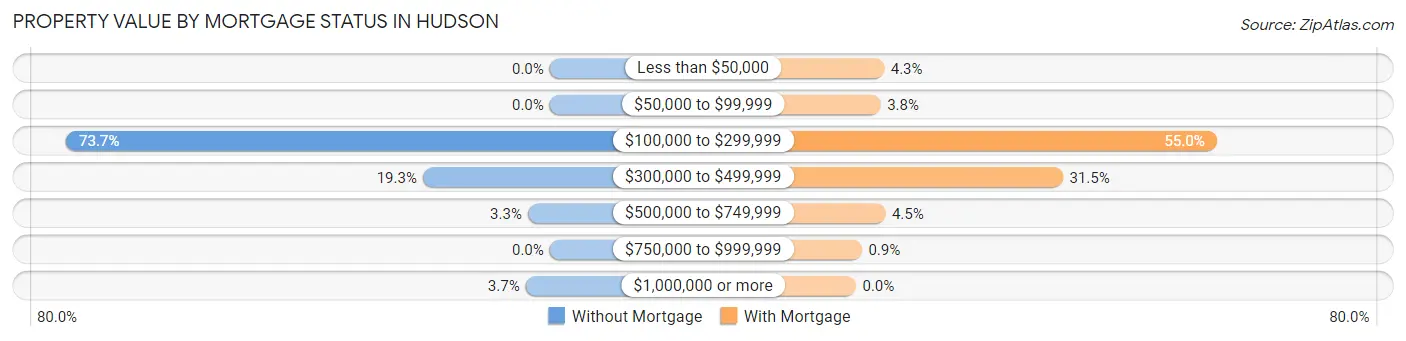
| Property Value | Without Mortgage | With Mortgage |
| Less than $50,000 | 0 (0.0%) | 24 (4.3%) |
| $50,000 to $99,999 | 0 (0.0%) | 21 (3.8%) |
| $100,000 to $299,999 | 221 (73.7%) | 307 (55.0%) |
| $300,000 to $499,999 | 58 (19.3%) | 176 (31.5%) |
| $500,000 to $749,999 | 10 (3.3%) | 25 (4.5%) |
| $750,000 to $999,999 | 0 (0.0%) | 5 (0.9%) |
| $1,000,000 or more | 11 (3.7%) | 0 (0.0%) |
| Total | 300 (100.0%) | 558 (100.0%) |
Household Income by Mortgage Status in Hudson
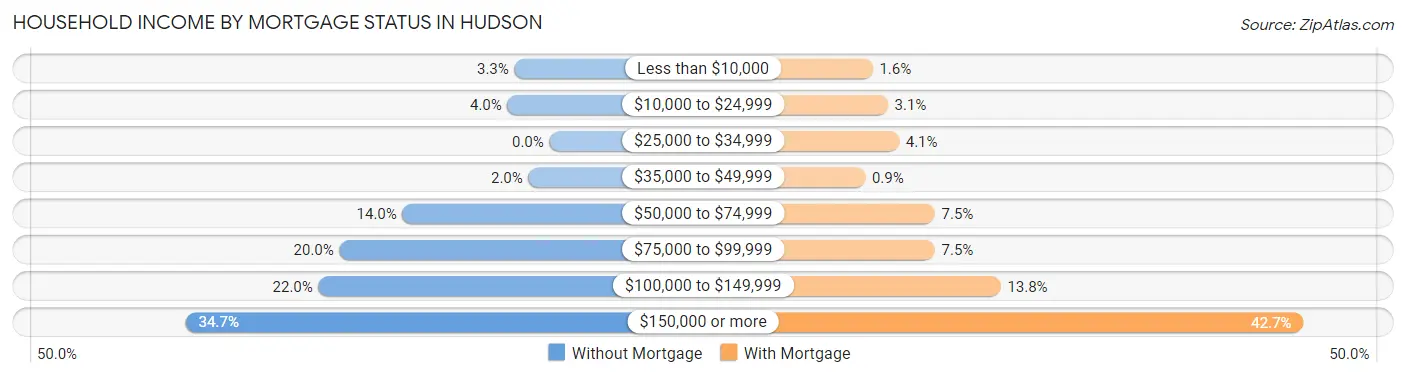
| Household Income | Without Mortgage | With Mortgage |
| Less than $10,000 | 10 (3.3%) | 9 (1.6%) |
| $10,000 to $24,999 | 12 (4.0%) | 17 (3.0%) |
| $25,000 to $34,999 | 0 (0.0%) | 23 (4.1%) |
| $35,000 to $49,999 | 6 (2.0%) | 5 (0.9%) |
| $50,000 to $74,999 | 42 (14.0%) | 42 (7.5%) |
| $75,000 to $99,999 | 60 (20.0%) | 42 (7.5%) |
| $100,000 to $149,999 | 66 (22.0%) | 77 (13.8%) |
| $150,000 or more | 104 (34.7%) | 238 (42.6%) |
| Total | 300 (100.0%) | 558 (100.0%) |
Property Value to Household Income Ratio in Hudson
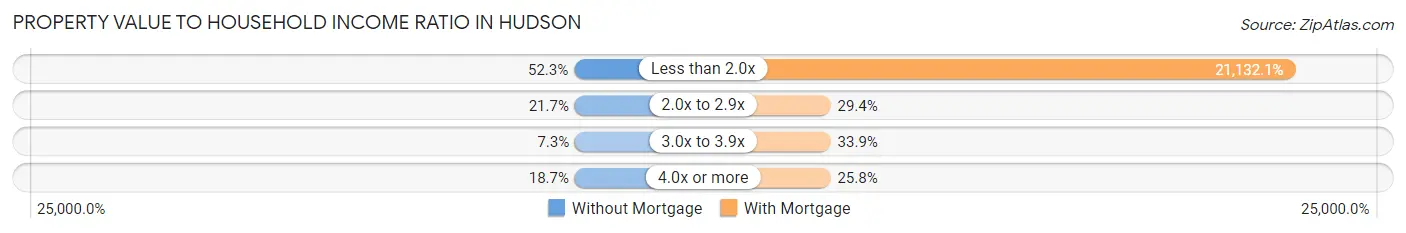
| Value-to-Income Ratio | Without Mortgage | With Mortgage |
| Less than 2.0x | 157 (52.3%) | 117,917 (21,132.1%) |
| 2.0x to 2.9x | 65 (21.7%) | 164 (29.4%) |
| 3.0x to 3.9x | 22 (7.3%) | 189 (33.9%) |
| 4.0x or more | 56 (18.7%) | 144 (25.8%) |
| Total | 300 (100.0%) | 558 (100.0%) |
Real Estate Taxes by Mortgage Status in Hudson
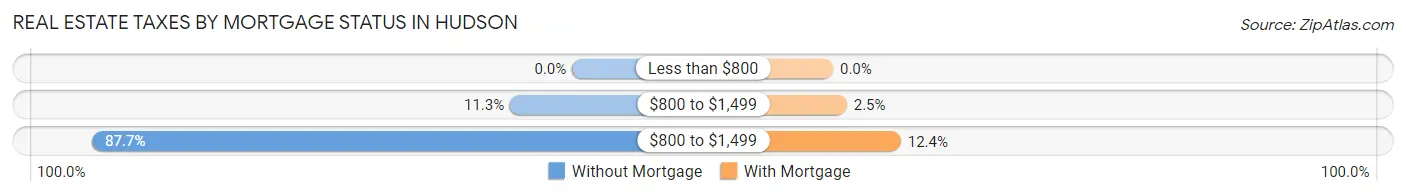
| Property Taxes | Without Mortgage | With Mortgage |
| Less than $800 | 0 (0.0%) | 0 (0.0%) |
| $800 to $1,499 | 34 (11.3%) | 14 (2.5%) |
| $800 to $1,499 | 263 (87.7%) | 69 (12.4%) |
| Total | 300 (100.0%) | 558 (100.0%) |
Health & Disability in Hudson
Health Insurance Coverage by Age in Hudson
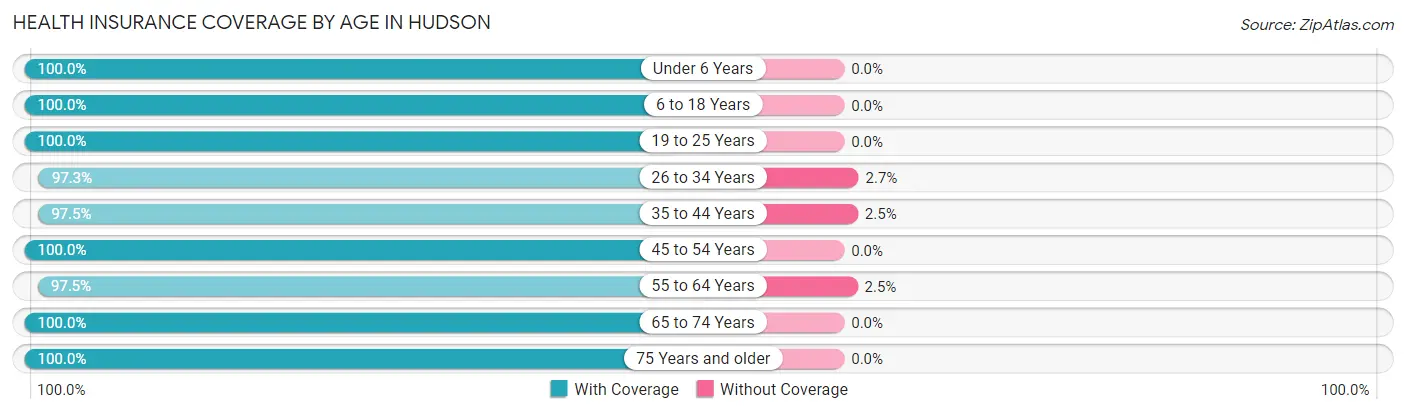
| Age Bracket | With Coverage | Without Coverage |
| Under 6 Years | 216 (100.0%) | 0 (0.0%) |
| 6 to 18 Years | 494 (100.0%) | 0 (0.0%) |
| 19 to 25 Years | 119 (100.0%) | 0 (0.0%) |
| 26 to 34 Years | 183 (97.3%) | 5 (2.7%) |
| 35 to 44 Years | 384 (97.5%) | 10 (2.5%) |
| 45 to 54 Years | 266 (100.0%) | 0 (0.0%) |
| 55 to 64 Years | 432 (97.5%) | 11 (2.5%) |
| 65 to 74 Years | 276 (100.0%) | 0 (0.0%) |
| 75 Years and older | 161 (100.0%) | 0 (0.0%) |
| Total | 2,531 (99.0%) | 26 (1.0%) |
Health Insurance Coverage by Citizenship Status in Hudson
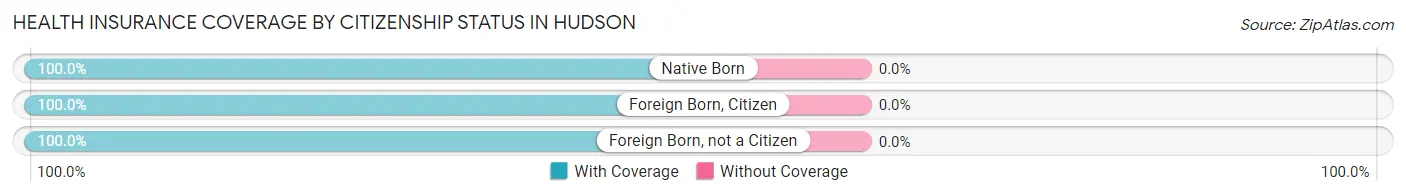
| Citizenship Status | With Coverage | Without Coverage |
| Native Born | 216 (100.0%) | 0 (0.0%) |
| Foreign Born, Citizen | 494 (100.0%) | 0 (0.0%) |
| Foreign Born, not a Citizen | 119 (100.0%) | 0 (0.0%) |
Health Insurance Coverage by Household Income in Hudson
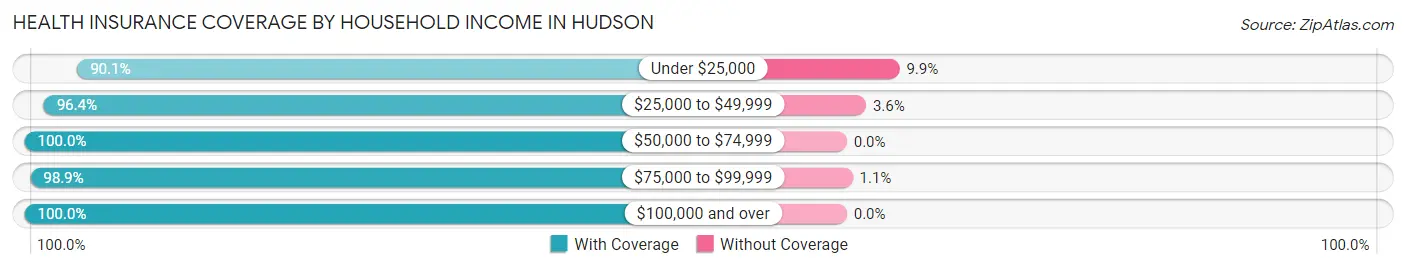
| Household Income | With Coverage | Without Coverage |
| Under $25,000 | 137 (90.1%) | 15 (9.9%) |
| $25,000 to $49,999 | 161 (96.4%) | 6 (3.6%) |
| $50,000 to $74,999 | 239 (100.0%) | 0 (0.0%) |
| $75,000 to $99,999 | 454 (98.9%) | 5 (1.1%) |
| $100,000 and over | 1,540 (100.0%) | 0 (0.0%) |
Public vs Private Health Insurance Coverage by Age in Hudson
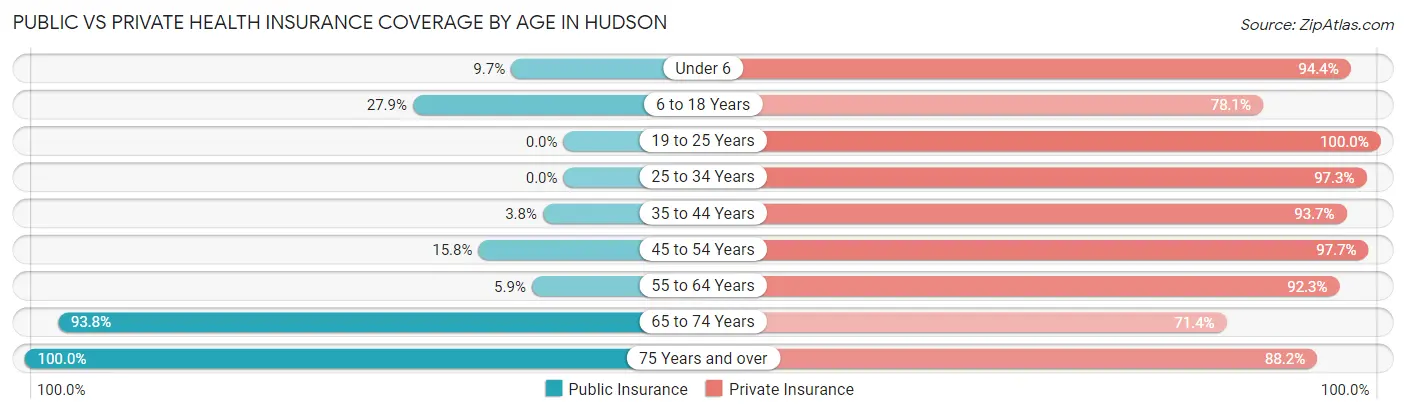
| Age Bracket | Public Insurance | Private Insurance |
| Under 6 | 21 (9.7%) | 204 (94.4%) |
| 6 to 18 Years | 138 (27.9%) | 386 (78.1%) |
| 19 to 25 Years | 0 (0.0%) | 119 (100.0%) |
| 25 to 34 Years | 0 (0.0%) | 183 (97.3%) |
| 35 to 44 Years | 15 (3.8%) | 369 (93.6%) |
| 45 to 54 Years | 42 (15.8%) | 260 (97.7%) |
| 55 to 64 Years | 26 (5.9%) | 409 (92.3%) |
| 65 to 74 Years | 259 (93.8%) | 197 (71.4%) |
| 75 Years and over | 161 (100.0%) | 142 (88.2%) |
| Total | 662 (25.9%) | 2,269 (88.7%) |
Disability Status by Sex by Age in Hudson
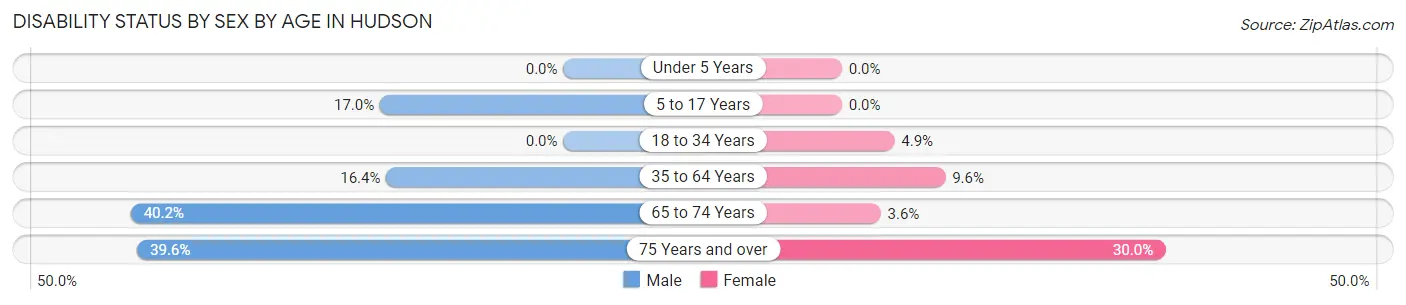
| Age Bracket | Male | Female |
| Under 5 Years | 0 (0.0%) | 0 (0.0%) |
| 5 to 17 Years | 66 (17.0%) | 0 (0.0%) |
| 18 to 34 Years | 0 (0.0%) | 8 (4.9%) |
| 35 to 64 Years | 94 (16.4%) | 51 (9.6%) |
| 65 to 74 Years | 55 (40.2%) | 5 (3.6%) |
| 75 Years and over | 36 (39.6%) | 21 (30.0%) |
Disability Class by Sex by Age in Hudson
Disability Class: Hearing Difficulty
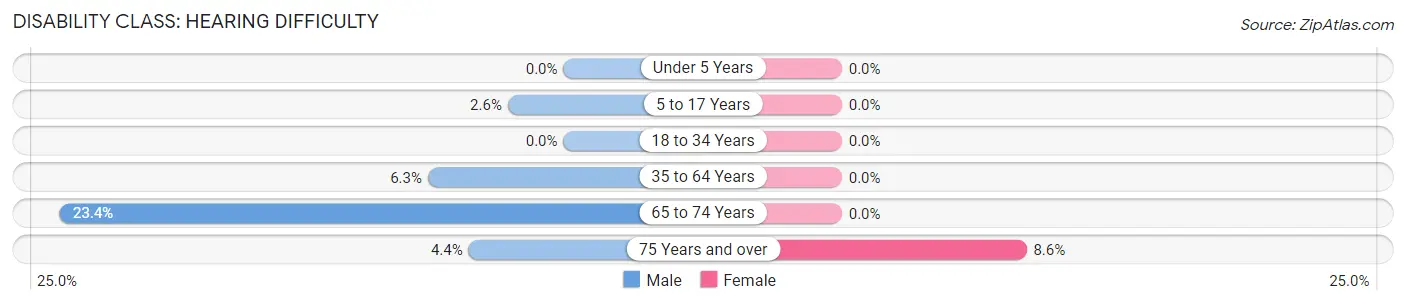
| Age Bracket | Male | Female |
| Under 5 Years | 0 (0.0%) | 0 (0.0%) |
| 5 to 17 Years | 10 (2.6%) | 0 (0.0%) |
| 18 to 34 Years | 0 (0.0%) | 0 (0.0%) |
| 35 to 64 Years | 36 (6.3%) | 0 (0.0%) |
| 65 to 74 Years | 32 (23.4%) | 0 (0.0%) |
| 75 Years and over | 4 (4.4%) | 6 (8.6%) |
Disability Class: Vision Difficulty
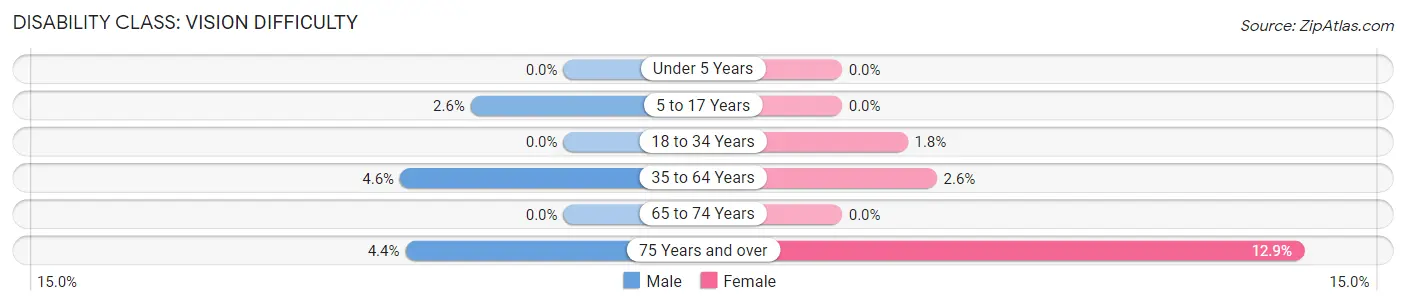
| Age Bracket | Male | Female |
| Under 5 Years | 0 (0.0%) | 0 (0.0%) |
| 5 to 17 Years | 10 (2.6%) | 0 (0.0%) |
| 18 to 34 Years | 0 (0.0%) | 3 (1.8%) |
| 35 to 64 Years | 26 (4.5%) | 14 (2.6%) |
| 65 to 74 Years | 0 (0.0%) | 0 (0.0%) |
| 75 Years and over | 4 (4.4%) | 9 (12.9%) |
Disability Class: Cognitive Difficulty
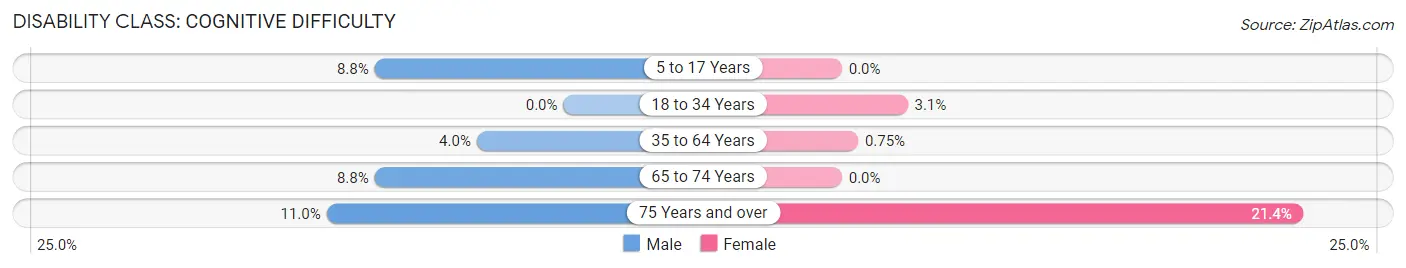
| Age Bracket | Male | Female |
| 5 to 17 Years | 34 (8.8%) | 0 (0.0%) |
| 18 to 34 Years | 0 (0.0%) | 5 (3.0%) |
| 35 to 64 Years | 23 (4.0%) | 4 (0.7%) |
| 65 to 74 Years | 12 (8.8%) | 0 (0.0%) |
| 75 Years and over | 10 (11.0%) | 15 (21.4%) |
Disability Class: Ambulatory Difficulty
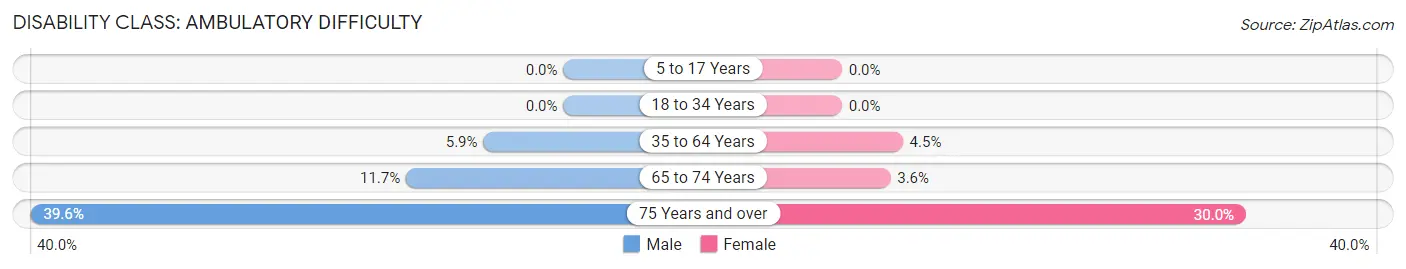
| Age Bracket | Male | Female |
| 5 to 17 Years | 0 (0.0%) | 0 (0.0%) |
| 18 to 34 Years | 0 (0.0%) | 0 (0.0%) |
| 35 to 64 Years | 34 (5.9%) | 24 (4.5%) |
| 65 to 74 Years | 16 (11.7%) | 5 (3.6%) |
| 75 Years and over | 36 (39.6%) | 21 (30.0%) |
Disability Class: Self-Care Difficulty
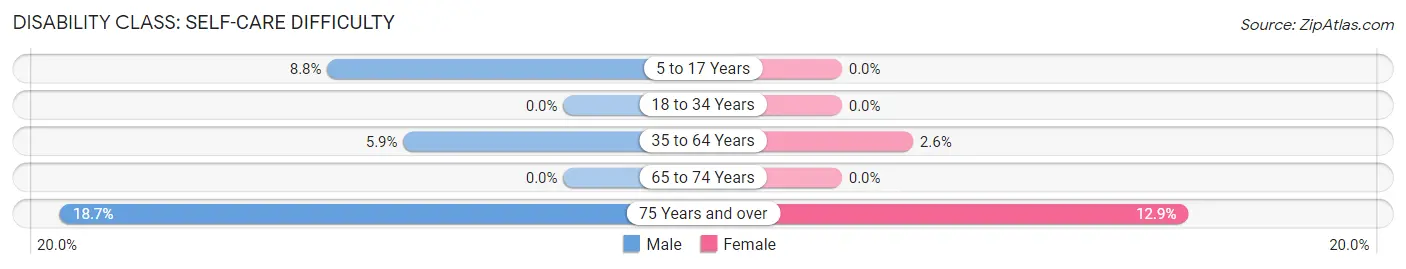
| Age Bracket | Male | Female |
| 5 to 17 Years | 34 (8.8%) | 0 (0.0%) |
| 18 to 34 Years | 0 (0.0%) | 0 (0.0%) |
| 35 to 64 Years | 34 (5.9%) | 14 (2.6%) |
| 65 to 74 Years | 0 (0.0%) | 0 (0.0%) |
| 75 Years and over | 17 (18.7%) | 9 (12.9%) |
Technology Access in Hudson
Computing Device Access in Hudson
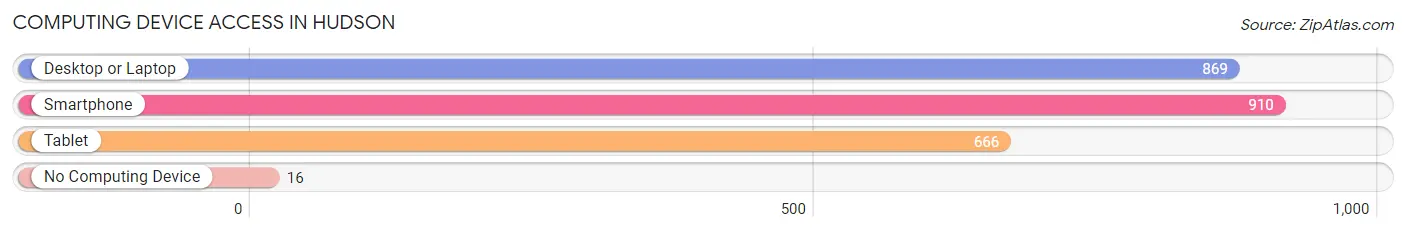
| Device Type | # Households | % Households |
| Desktop or Laptop | 869 | 90.2% |
| Smartphone | 910 | 94.5% |
| Tablet | 666 | 69.2% |
| No Computing Device | 16 | 1.7% |
| Total | 963 | 100.0% |
Internet Access in Hudson
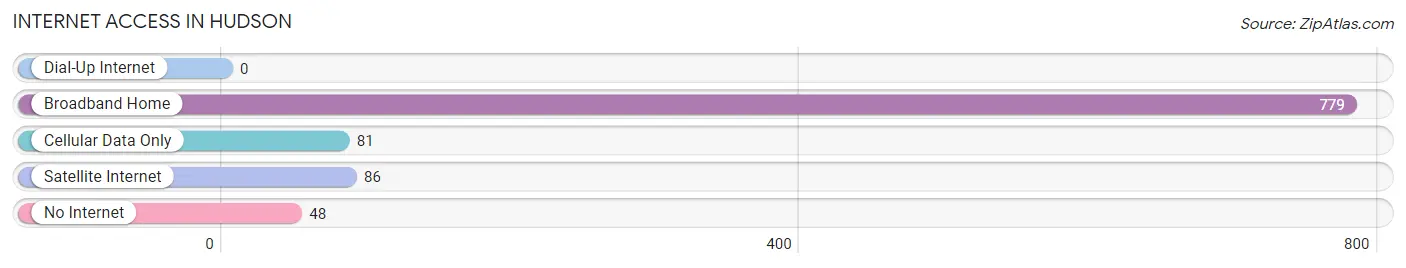
| Internet Type | # Households | % Households |
| Dial-Up Internet | 0 | 0.0% |
| Broadband Home | 779 | 80.9% |
| Cellular Data Only | 81 | 8.4% |
| Satellite Internet | 86 | 8.9% |
| No Internet | 48 | 5.0% |
| Total | 963 | 100.0% |
Hudson Summary
Hudson, Iowa is a small city located in Black Hawk County, Iowa. It is situated on the banks of the Cedar River and is part of the Waterloo-Cedar Falls Metropolitan Statistical Area. The city has a population of approximately 4,000 people and is known for its small-town charm and friendly atmosphere.
Geography
Hudson is located in the northeast corner of Black Hawk County, Iowa, on the banks of the Cedar River. The city is situated at an elevation of 890 feet above sea level and is surrounded by rolling hills and farmland. The city is located approximately 25 miles from Waterloo and Cedar Falls, and is accessible by Interstate 380.
Climate
Hudson has a humid continental climate, with hot summers and cold winters. The average annual temperature is 48°F, with an average high of 73°F in the summer and an average low of 24°F in the winter. The average annual precipitation is 33 inches, with the majority of it falling in the spring and summer months.
Demographics
As of the 2010 census, the population of Hudson was 4,039. The racial makeup of the city was 94.3% White, 1.2% African American, 0.3% Native American, 0.7% Asian, 0.1% Pacific Islander, 1.7% from other races, and 1.9% from two or more races. Hispanic or Latino of any race were 4.2% of the population.
Economy
Hudson is home to a variety of businesses, including manufacturing, retail, and service industries. The city is home to several large employers, including John Deere, Tyson Foods, and the University of Northern Iowa. The city also has a vibrant downtown area, with a variety of shops, restaurants, and other businesses.
Education
Hudson is served by the Hudson Community School District, which includes an elementary school, middle school, and high school. The city is also home to the University of Northern Iowa, which offers a variety of undergraduate and graduate degree programs.
Culture
Hudson is home to a variety of cultural attractions, including the Cedar Valley Arboretum and Botanical Gardens, the Hudson Historical Museum, and the Cedar Valley Nature Trail. The city also hosts a variety of annual events, including the Hudson Summer Festival, the Hudson Fall Festival, and the Hudson Christmas Parade.
Conclusion
Hudson, Iowa is a small city located in Black Hawk County, Iowa. It is situated on the banks of the Cedar River and is part of the Waterloo-Cedar Falls Metropolitan Statistical Area. The city has a population of approximately 4,000 people and is known for its small-town charm and friendly atmosphere. The city is home to a variety of businesses, including manufacturing, retail, and service industries. It is also home to the University of Northern Iowa and a variety of cultural attractions. Hudson is a great place to live, work, and play.
Common Questions
What is Per Capita Income in Hudson?
Per Capita income in Hudson is $45,057.
What is the Median Family Income in Hudson?
Median Family Income in Hudson is $120,634.
What is the Median Household income in Hudson?
Median Household Income in Hudson is $113,274.
What is Income or Wage Gap in Hudson?
Income or Wage Gap in Hudson is 43.3%.
Women in Hudson earn 56.7 cents for every dollar earned by a man.
What is Inequality or Gini Index in Hudson?
Inequality or Gini Index in Hudson is 0.35.
What is the Total Population of Hudson?
Total Population of Hudson is 2,557.
What is the Total Male Population of Hudson?
Total Male Population of Hudson is 1,445.
What is the Total Female Population of Hudson?
Total Female Population of Hudson is 1,112.
What is the Ratio of Males per 100 Females in Hudson?
There are 129.95 Males per 100 Females in Hudson.
What is the Ratio of Females per 100 Males in Hudson?
There are 76.96 Females per 100 Males in Hudson.
What is the Median Population Age in Hudson?
Median Population Age in Hudson is 42.0 Years.
What is the Average Family Size in Hudson
Average Family Size in Hudson is 3.1 People.
What is the Average Household Size in Hudson
Average Household Size in Hudson is 2.7 People.
How Large is the Labor Force in Hudson?
There are 1,327 People in the Labor Forcein in Hudson.
What is the Percentage of People in the Labor Force in Hudson?
69.1% of People are in the Labor Force in Hudson.
What is the Unemployment Rate in Hudson?
Unemployment Rate in Hudson is 4.4%.