Farley, IA
Farley Map
Farley Overview
1,833
TOTAL POPULATION
885
MALE POPULATION
948
FEMALE POPULATION
93.35
MALES / 100 FEMALES
107.12
FEMALES / 100 MALES
35.0
MEDIAN AGE
3.1
AVG FAMILY SIZE
2.8
AVG HOUSEHOLD SIZE
$39,077
PER CAPITA INCOME
$100,648
AVG FAMILY INCOME
$97,868
AVG HOUSEHOLD INCOME
40.8%
WAGE / INCOME GAP [ % ]
59.2¢/ $1
WAGE / INCOME GAP [ $ ]
0.36
INEQUALITY / GINI INDEX
1,023
LABOR FORCE [ PEOPLE ]
75.2%
PERCENT IN LABOR FORCE
4.8%
UNEMPLOYMENT RATE
Farley Zip Codes
Farley Area Codes
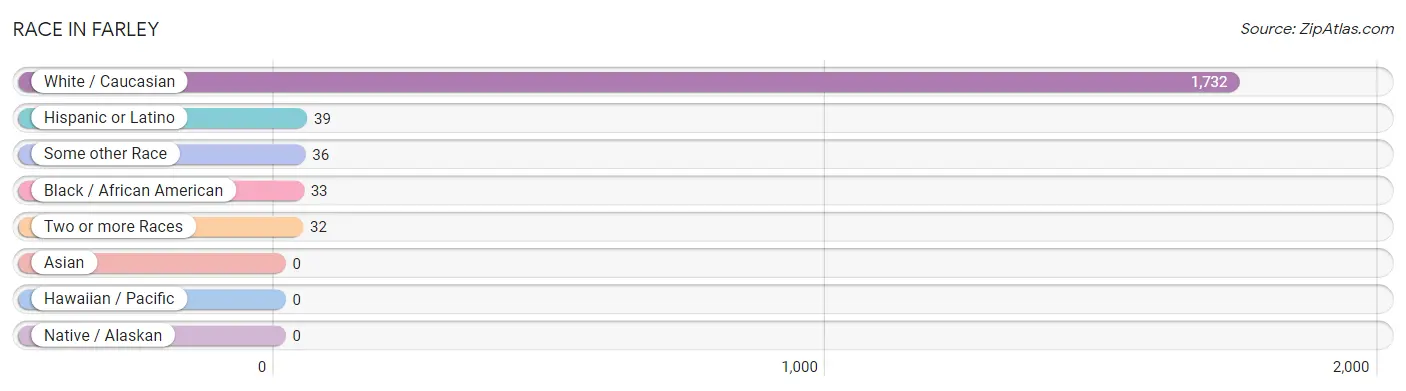
Race in Farley
The most populous races in Farley are White / Caucasian (1,732 | 94.5%), Hispanic or Latino (39 | 2.1%), and Some other Race (36 | 2.0%).
| Race | # Population | % Population |
| Asian | 0 | 0.0% |
| Black / African American | 33 | 1.8% |
| Hawaiian / Pacific | 0 | 0.0% |
| Hispanic or Latino | 39 | 2.1% |
| Native / Alaskan | 0 | 0.0% |
| White / Caucasian | 1,732 | 94.5% |
| Two or more Races | 32 | 1.8% |
| Some other Race | 36 | 2.0% |
| Total | 1,833 | 100.0% |
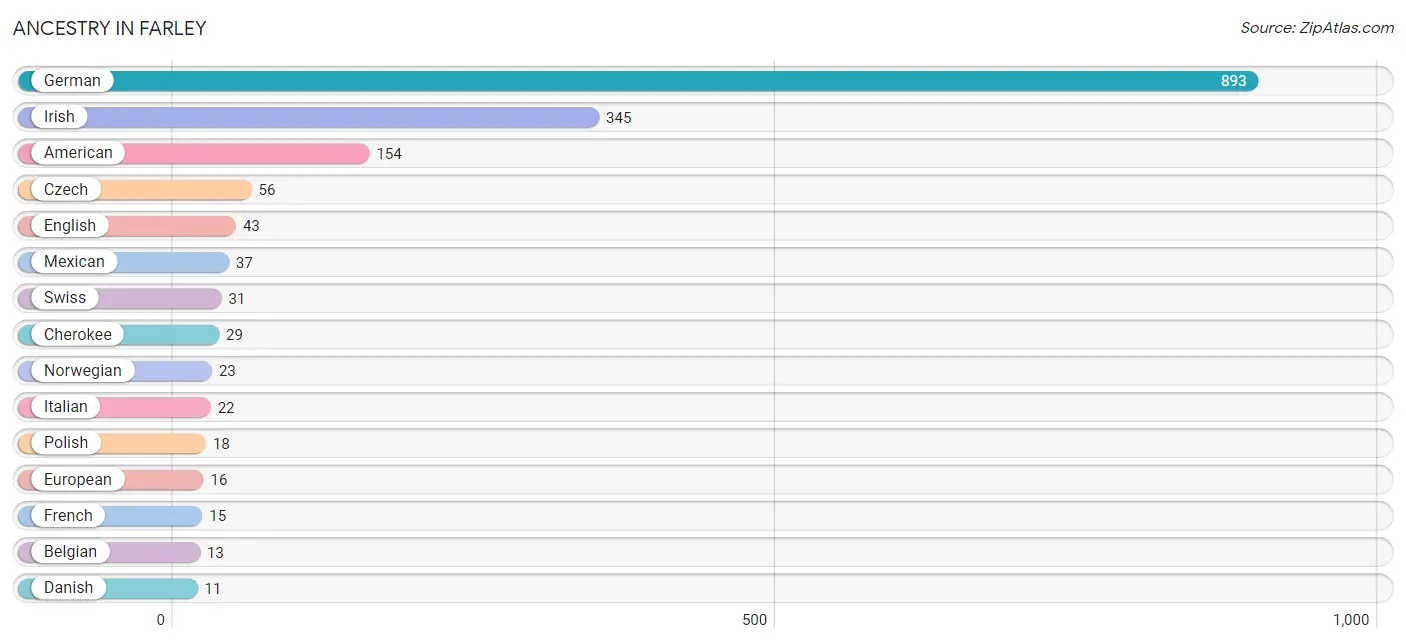
Ancestry in Farley
The most populous ancestries reported in Farley are German (893 | 48.7%), Irish (345 | 18.8%), American (154 | 8.4%), Czech (56 | 3.1%), and English (43 | 2.4%), together accounting for 81.3% of all Farley residents.
| Ancestry | # Population | % Population |
| American | 154 | 8.4% |
| Belgian | 13 | 0.7% |
| Central American | 2 | 0.1% |
| Cherokee | 29 | 1.6% |
| Czech | 56 | 3.1% |
| Danish | 11 | 0.6% |
| Dutch | 2 | 0.1% |
| English | 43 | 2.4% |
| European | 16 | 0.9% |
| French | 15 | 0.8% |
| German | 893 | 48.7% |
| Greek | 10 | 0.5% |
| Irish | 345 | 18.8% |
| Italian | 22 | 1.2% |
| Lithuanian | 5 | 0.3% |
| Mexican | 37 | 2.0% |
| Norwegian | 23 | 1.3% |
| Polish | 18 | 1.0% |
| Salvadoran | 2 | 0.1% |
| Slovene | 3 | 0.2% |
| Swedish | 3 | 0.2% |
| Swiss | 31 | 1.7% |
| Welsh | 4 | 0.2% | View All 23 Rows |
Immigrants in Farley

| Immigration Origin | # Population | % Population | View All 0 Rows |
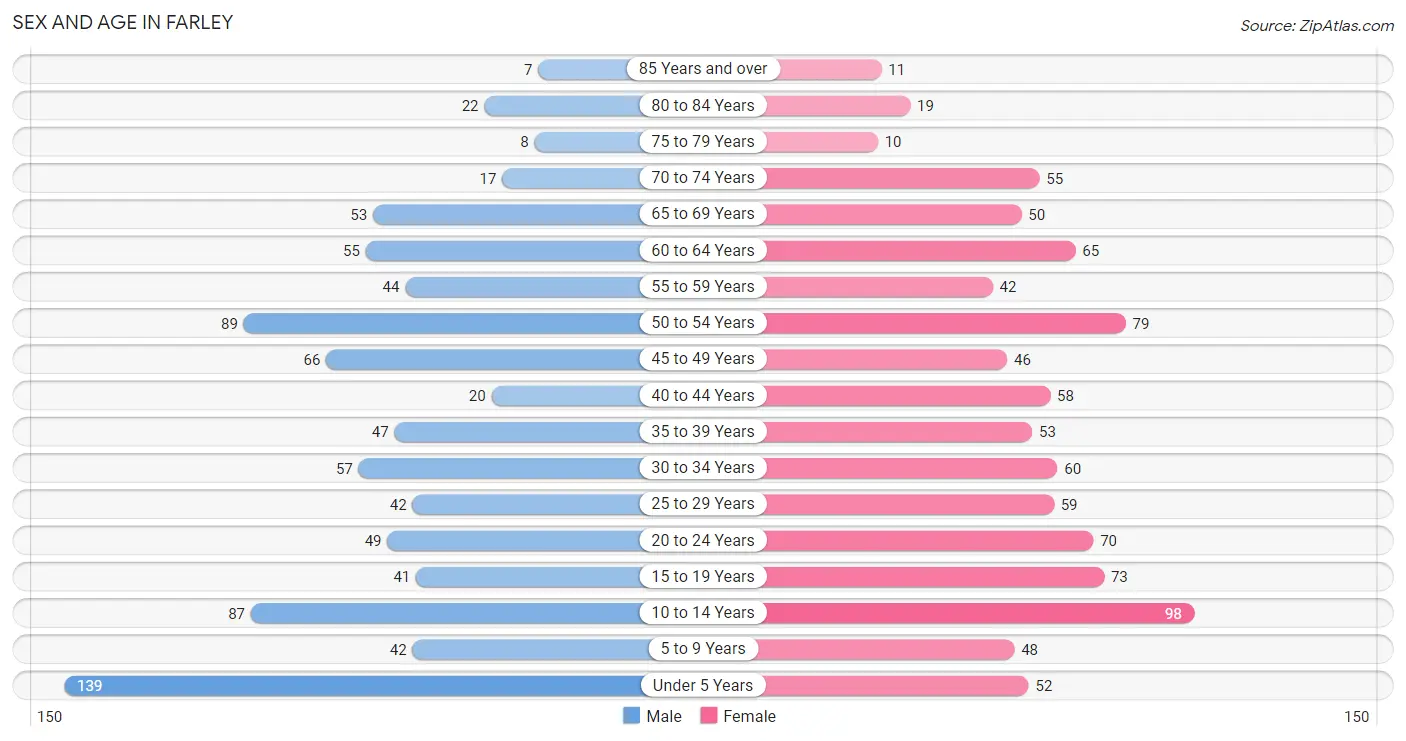
Sex and Age in Farley
Sex and Age in Farley
The most populous age groups in Farley are Under 5 Years (139 | 15.7%) for men and 10 to 14 Years (98 | 10.3%) for women.
| Age Bracket | Male | Female |
| Under 5 Years | 139 (15.7%) | 52 (5.5%) |
| 5 to 9 Years | 42 (4.8%) | 48 (5.1%) |
| 10 to 14 Years | 87 (9.8%) | 98 (10.3%) |
| 15 to 19 Years | 41 (4.6%) | 73 (7.7%) |
| 20 to 24 Years | 49 (5.5%) | 70 (7.4%) |
| 25 to 29 Years | 42 (4.8%) | 59 (6.2%) |
| 30 to 34 Years | 57 (6.4%) | 60 (6.3%) |
| 35 to 39 Years | 47 (5.3%) | 53 (5.6%) |
| 40 to 44 Years | 20 (2.3%) | 58 (6.1%) |
| 45 to 49 Years | 66 (7.5%) | 46 (4.9%) |
| 50 to 54 Years | 89 (10.1%) | 79 (8.3%) |
| 55 to 59 Years | 44 (5.0%) | 42 (4.4%) |
| 60 to 64 Years | 55 (6.2%) | 65 (6.9%) |
| 65 to 69 Years | 53 (6.0%) | 50 (5.3%) |
| 70 to 74 Years | 17 (1.9%) | 55 (5.8%) |
| 75 to 79 Years | 8 (0.9%) | 10 (1.1%) |
| 80 to 84 Years | 22 (2.5%) | 19 (2.0%) |
| 85 Years and over | 7 (0.8%) | 11 (1.2%) |
| Total | 885 (100.0%) | 948 (100.0%) |
Families and Households in Farley
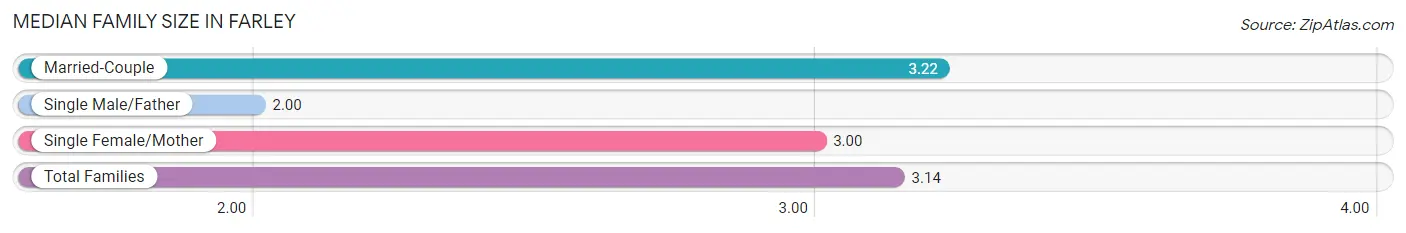
Median Family Size in Farley
The median family size in Farley is 3.14 persons per family, with married-couple families (433 | 83.0%) accounting for the largest median family size of 3.22 persons per family. On the other hand, single male/father families (23 | 4.4%) represent the smallest median family size with 2.00 persons per family.
| Family Type | # Families | Family Size |
| Married-Couple | 433 (83.0%) | 3.22 |
| Single Male/Father | 23 (4.4%) | 2.00 |
| Single Female/Mother | 66 (12.6%) | 3.00 |
| Total Families | 522 (100.0%) | 3.14 |
Median Household Size in Farley
The median household size in Farley is 2.77 persons per household, with married-couple households (433 | 65.6%) accounting for the largest median household size of 3.23 persons per household. non-family households (138 | 20.9%) represent the smallest median household size with 1.26 persons per household.

| Household Type | # Households | Household Size |
| Married-Couple | 433 (65.6%) | 3.23 |
| Single Male/Father | 23 (3.5%) | 2.57 |
| Single Female/Mother | 66 (10.0%) | 3.00 |
| Non-family | 138 (20.9%) | 1.26 |
| Total Households | 660 (100.0%) | 2.77 |
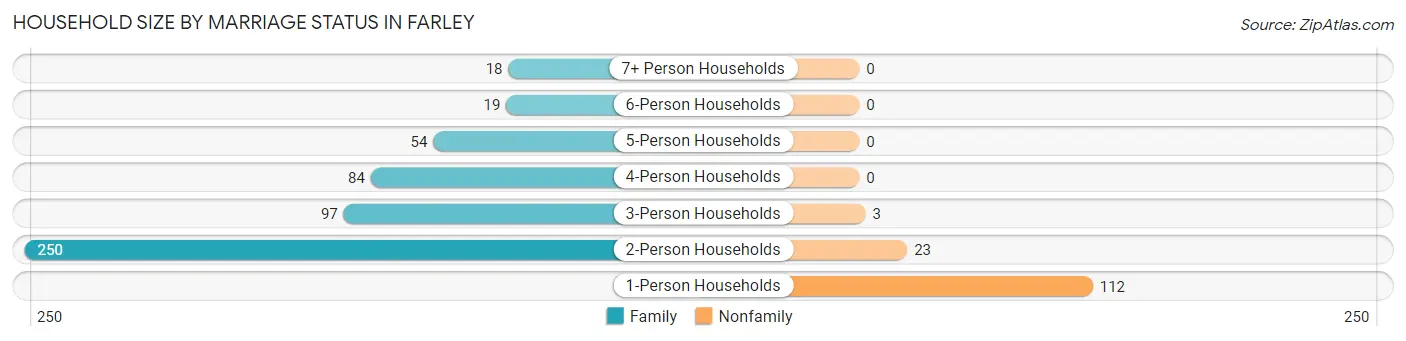
Household Size by Marriage Status in Farley
Out of a total of 660 households in Farley, 522 (79.1%) are family households, while 138 (20.9%) are nonfamily households. The most numerous type of family households are 2-person households, comprising 250, and the most common type of nonfamily households are 1-person households, comprising 112.
| Household Size | Family Households | Nonfamily Households |
| 1-Person Households | - | 112 (17.0%) |
| 2-Person Households | 250 (37.9%) | 23 (3.5%) |
| 3-Person Households | 97 (14.7%) | 3 (0.4%) |
| 4-Person Households | 84 (12.7%) | 0 (0.0%) |
| 5-Person Households | 54 (8.2%) | 0 (0.0%) |
| 6-Person Households | 19 (2.9%) | 0 (0.0%) |
| 7+ Person Households | 18 (2.7%) | 0 (0.0%) |
| Total | 522 (79.1%) | 138 (20.9%) |
Female Fertility in Farley
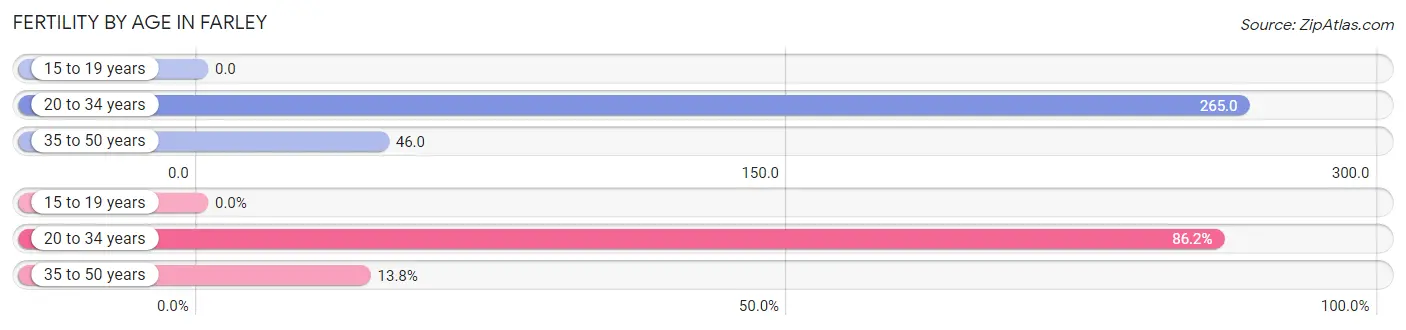
Fertility by Age in Farley
Average fertility rate in Farley is 133.0 births per 1,000 women. Women in the age bracket of 20 to 34 years have the highest fertility rate with 265.0 births per 1,000 women. Women in the age bracket of 20 to 34 years acount for 86.2% of all women with births.
| Age Bracket | Women with Births | Births / 1,000 Women |
| 15 to 19 years | 0 (0.0%) | 0.0 |
| 20 to 34 years | 50 (86.2%) | 265.0 |
| 35 to 50 years | 8 (13.8%) | 46.0 |
| Total | 58 (100.0%) | 133.0 |
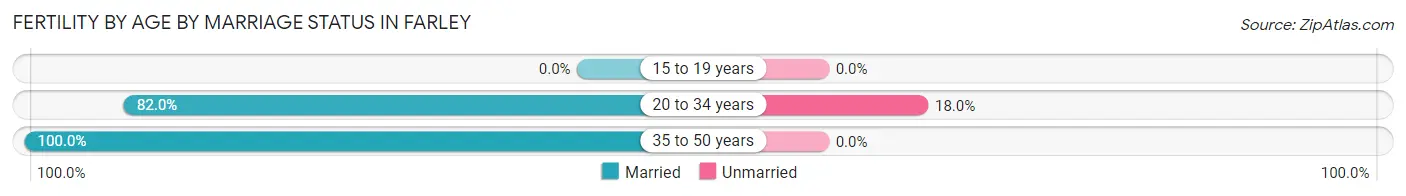
Fertility by Age by Marriage Status in Farley
84.5% of women with births (58) in Farley are married. The highest percentage of unmarried women with births falls into 20 to 34 years age bracket with 18.0% of them unmarried at the time of birth, while the lowest percentage of unmarried women with births belong to 35 to 50 years age bracket with 0.0% of them unmarried.
| Age Bracket | Married | Unmarried |
| 15 to 19 years | 0 (0.0%) | 0 (0.0%) |
| 20 to 34 years | 41 (82.0%) | 9 (18.0%) |
| 35 to 50 years | 8 (100.0%) | 0 (0.0%) |
| Total | 49 (84.5%) | 9 (15.5%) |
Fertility by Education in Farley
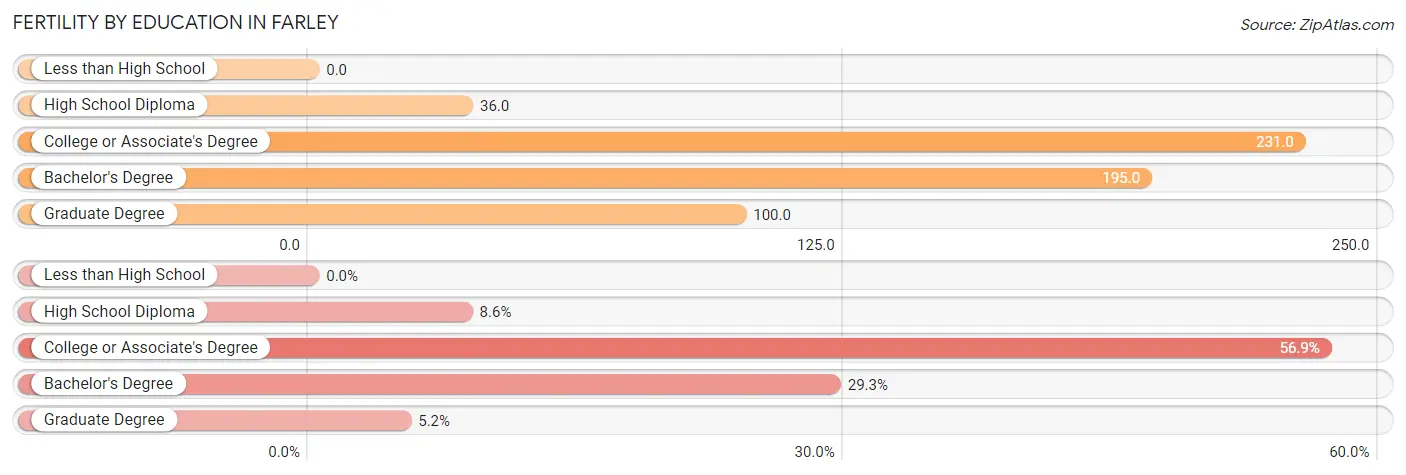
| Educational Attainment | Women with Births | Births / 1,000 Women |
| Less than High School | 0 (0.0%) | 0.0 |
| High School Diploma | 5 (8.6%) | 36.0 |
| College or Associate's Degree | 33 (56.9%) | 231.0 |
| Bachelor's Degree | 17 (29.3%) | 195.0 |
| Graduate Degree | 3 (5.2%) | 100.0 |
| Total | 58 (100.0%) | 133.0 |
Fertility by Education by Marriage Status in Farley
15.5% of women with births in Farley are unmarried. Women with the educational attainment of high school diploma are most likely to be married with 100.0% of them married at childbirth, while women with the educational attainment of college or associate's degree are least likely to be married with 27.3% of them unmarried at childbirth.
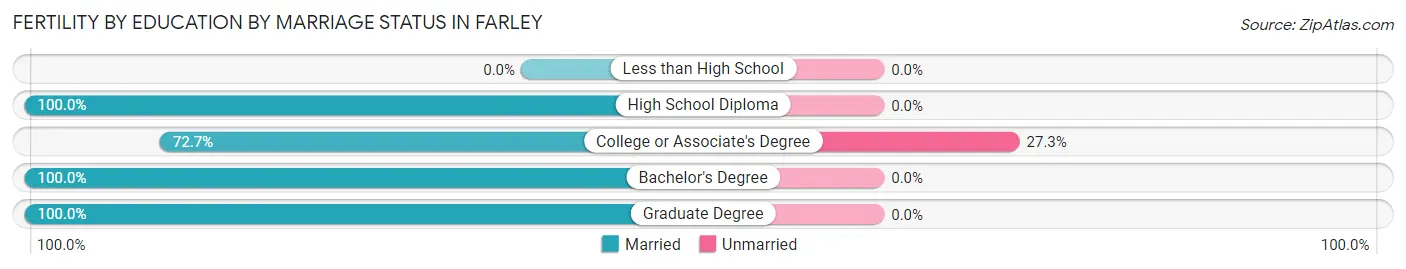
| Educational Attainment | Married | Unmarried |
| Less than High School | 0 (0.0%) | 0 (0.0%) |
| High School Diploma | 5 (100.0%) | 0 (0.0%) |
| College or Associate's Degree | 24 (72.7%) | 9 (27.3%) |
| Bachelor's Degree | 17 (100.0%) | 0 (0.0%) |
| Graduate Degree | 3 (100.0%) | 0 (0.0%) |
| Total | 49 (84.5%) | 9 (15.5%) |
Income in Farley
Income Overview in Farley
Per Capita Income in Farley is $39,077, while median incomes of families and households are $100,648 and $97,868 respectively.
| Characteristic | Number | Measure |
| Per Capita Income | 1,833 | $39,077 |
| Median Family Income | 522 | $100,648 |
| Mean Family Income | 522 | $121,234 |
| Median Household Income | 660 | $97,868 |
| Mean Household Income | 660 | $109,316 |
| Income Deficit | 522 | $0 |
| Wage / Income Gap (%) | 1,833 | 40.82% |
| Wage / Income Gap ($) | 1,833 | 59.18¢ per $1 |
| Gini / Inequality Index | 1,833 | 0.36 |
Earnings by Sex in Farley
Average Earnings in Farley are $43,317, $57,557 for men and $34,063 for women, a difference of 40.8%.
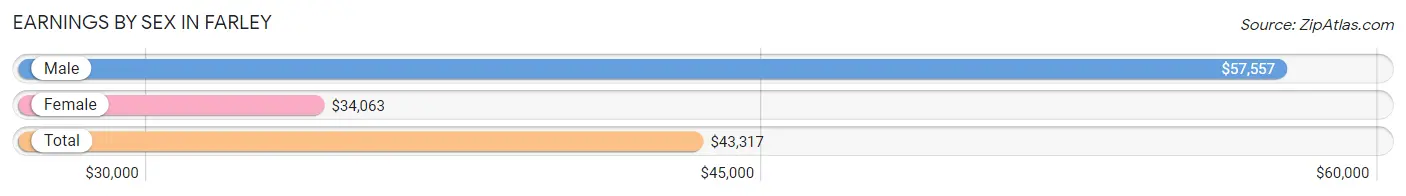
| Sex | Number | Average Earnings |
| Male | 507 (46.5%) | $57,557 |
| Female | 584 (53.5%) | $34,063 |
| Total | 1,091 (100.0%) | $43,317 |
Earnings by Sex by Income Bracket in Farley
The most common earnings brackets in Farley are $75,000 to $99,999 for men (97 | 19.1%) and $30,000 to $34,999 for women (103 | 17.6%).
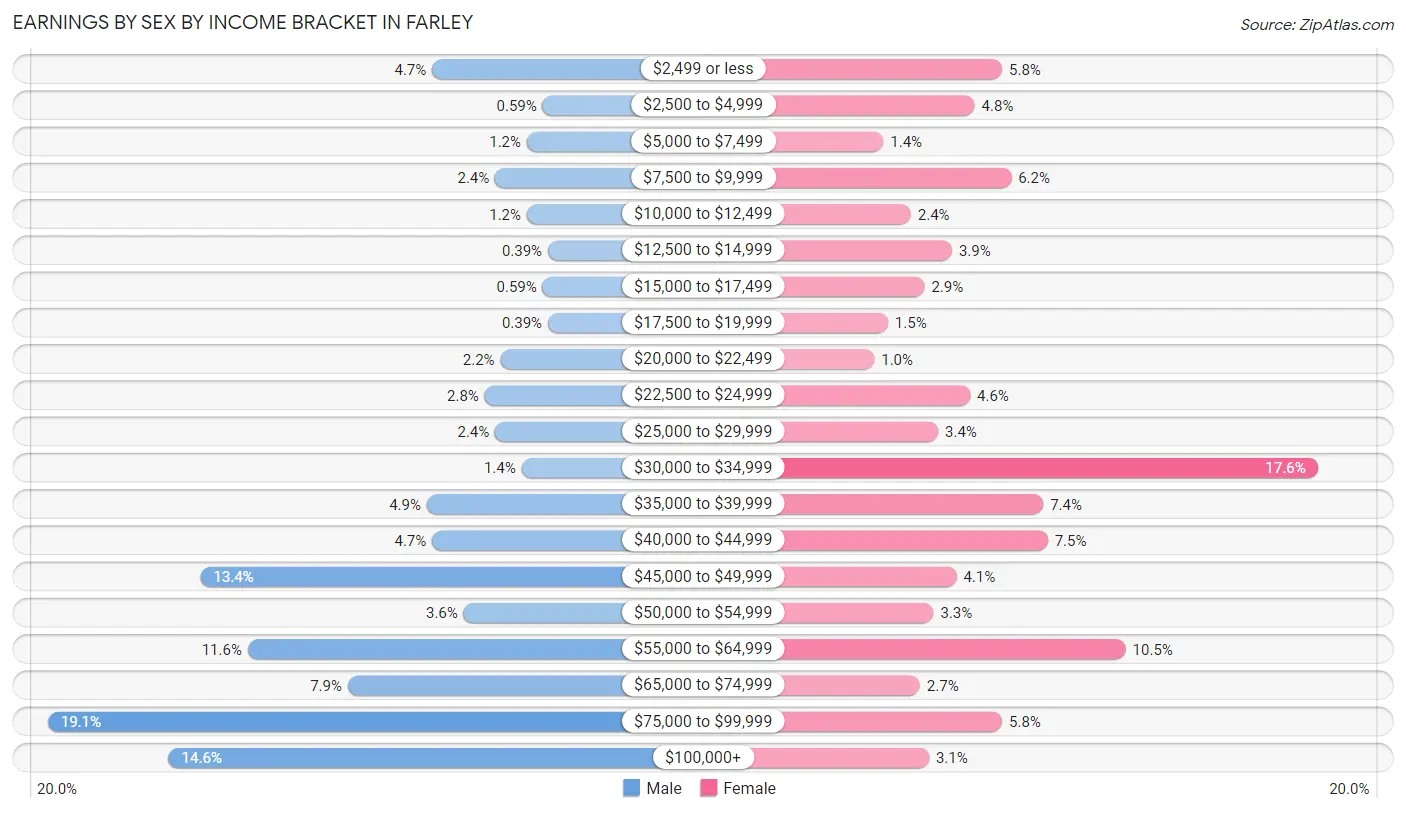
| Income | Male | Female |
| $2,499 or less | 24 (4.7%) | 34 (5.8%) |
| $2,500 to $4,999 | 3 (0.6%) | 28 (4.8%) |
| $5,000 to $7,499 | 6 (1.2%) | 8 (1.4%) |
| $7,500 to $9,999 | 12 (2.4%) | 36 (6.2%) |
| $10,000 to $12,499 | 6 (1.2%) | 14 (2.4%) |
| $12,500 to $14,999 | 2 (0.4%) | 23 (3.9%) |
| $15,000 to $17,499 | 3 (0.6%) | 17 (2.9%) |
| $17,500 to $19,999 | 2 (0.4%) | 9 (1.5%) |
| $20,000 to $22,499 | 11 (2.2%) | 6 (1.0%) |
| $22,500 to $24,999 | 14 (2.8%) | 27 (4.6%) |
| $25,000 to $29,999 | 12 (2.4%) | 20 (3.4%) |
| $30,000 to $34,999 | 7 (1.4%) | 103 (17.6%) |
| $35,000 to $39,999 | 25 (4.9%) | 43 (7.4%) |
| $40,000 to $44,999 | 24 (4.7%) | 44 (7.5%) |
| $45,000 to $49,999 | 68 (13.4%) | 24 (4.1%) |
| $50,000 to $54,999 | 18 (3.5%) | 19 (3.3%) |
| $55,000 to $64,999 | 59 (11.6%) | 61 (10.4%) |
| $65,000 to $74,999 | 40 (7.9%) | 16 (2.7%) |
| $75,000 to $99,999 | 97 (19.1%) | 34 (5.8%) |
| $100,000+ | 74 (14.6%) | 18 (3.1%) |
| Total | 507 (100.0%) | 584 (100.0%) |
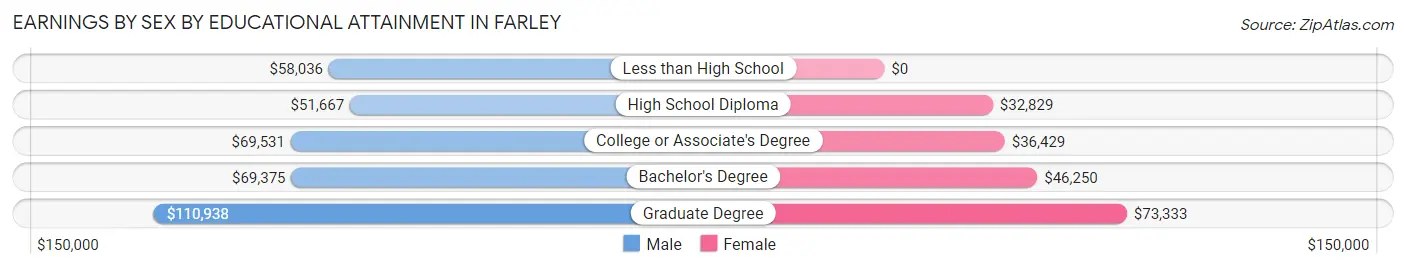
Earnings by Sex by Educational Attainment in Farley
Average earnings in Farley are $62,583 for men and $38,558 for women, a difference of 38.4%. Men with an educational attainment of graduate degree enjoy the highest average annual earnings of $110,938, while those with high school diploma education earn the least with $51,667. Women with an educational attainment of graduate degree earn the most with the average annual earnings of $73,333, while those with high school diploma education have the smallest earnings of $32,829.
| Educational Attainment | Male Income | Female Income |
| Less than High School | $58,036 | $0 |
| High School Diploma | $51,667 | $32,829 |
| College or Associate's Degree | $69,531 | $36,429 |
| Bachelor's Degree | $69,375 | $46,250 |
| Graduate Degree | $110,938 | $73,333 |
| Total | $62,583 | $38,558 |
Family Income in Farley
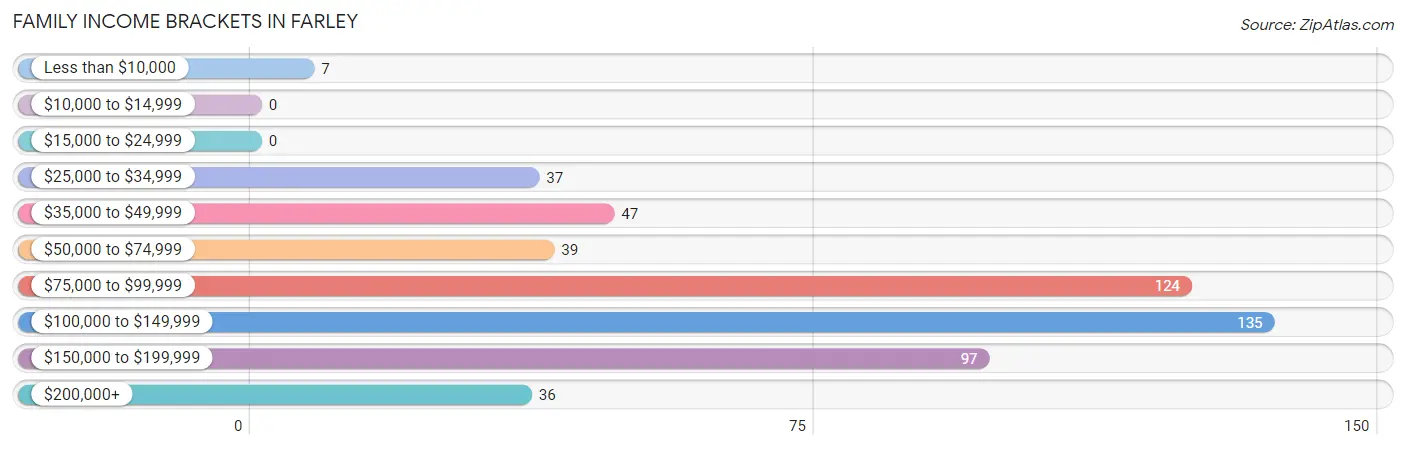
Family Income Brackets in Farley
According to the Farley family income data, there are 135 families falling into the $100,000 to $149,999 income range, which is the most common income bracket and makes up 25.9% of all families.
| Income Bracket | # Families | % Families |
| Less than $10,000 | 7 | 1.3% |
| $10,000 to $14,999 | 0 | 0.0% |
| $15,000 to $24,999 | 0 | 0.0% |
| $25,000 to $34,999 | 37 | 7.1% |
| $35,000 to $49,999 | 47 | 9.0% |
| $50,000 to $74,999 | 39 | 7.5% |
| $75,000 to $99,999 | 124 | 23.8% |
| $100,000 to $149,999 | 135 | 25.9% |
| $150,000 to $199,999 | 97 | 18.6% |
| $200,000+ | 36 | 6.9% |
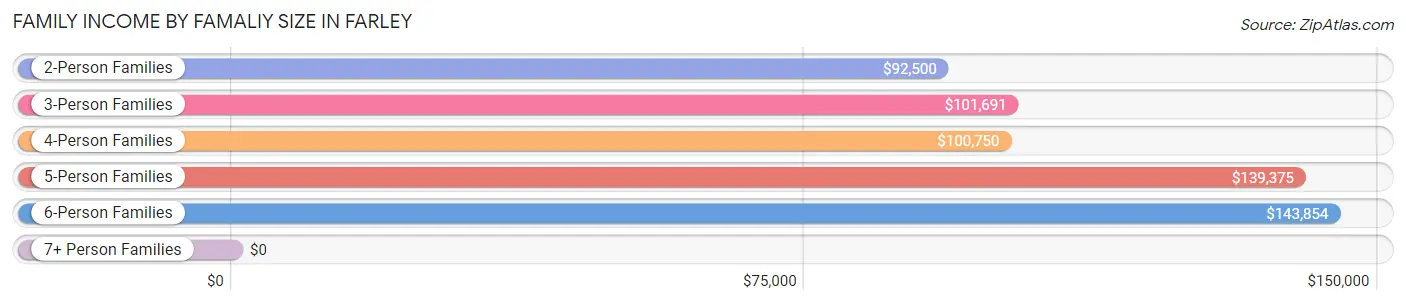
Family Income by Famaliy Size in Farley
6-person families (19 | 3.6%) account for the highest median family income in Farley with $143,854 per family, while 2-person families (258 | 49.4%) have the highest median income of $46,250 per family member.
| Income Bracket | # Families | Median Income |
| 2-Person Families | 258 (49.4%) | $92,500 |
| 3-Person Families | 97 (18.6%) | $101,691 |
| 4-Person Families | 76 (14.6%) | $100,750 |
| 5-Person Families | 54 (10.3%) | $139,375 |
| 6-Person Families | 19 (3.6%) | $143,854 |
| 7+ Person Families | 18 (3.5%) | $0 |
| Total | 522 (100.0%) | $100,648 |
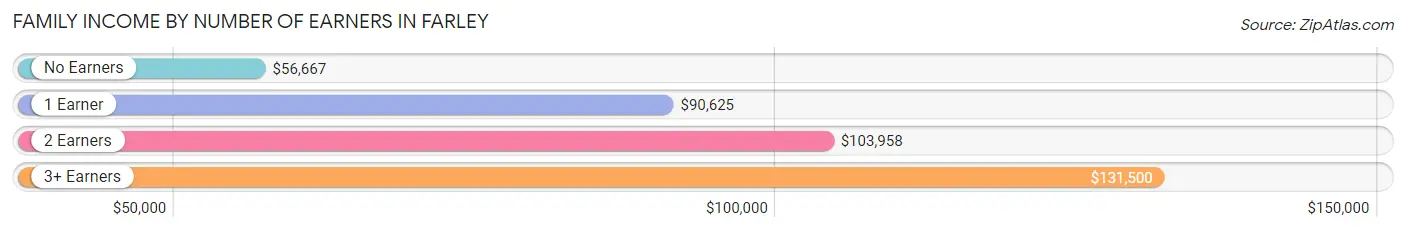
Family Income by Number of Earners in Farley
The median family income in Farley is $100,648, with families comprising 3+ earners (96) having the highest median family income of $131,500, while families with no earners (52) have the lowest median family income of $56,667, accounting for 18.4% and 10.0% of families, respectively.
| Number of Earners | # Families | Median Income |
| No Earners | 52 (10.0%) | $56,667 |
| 1 Earner | 119 (22.8%) | $90,625 |
| 2 Earners | 255 (48.8%) | $103,958 |
| 3+ Earners | 96 (18.4%) | $131,500 |
| Total | 522 (100.0%) | $100,648 |
Household Income in Farley
Household Income Brackets in Farley
With 168 households falling in the category, the $100,000 to $149,999 income range is the most frequent in Farley, accounting for 25.5% of all households.
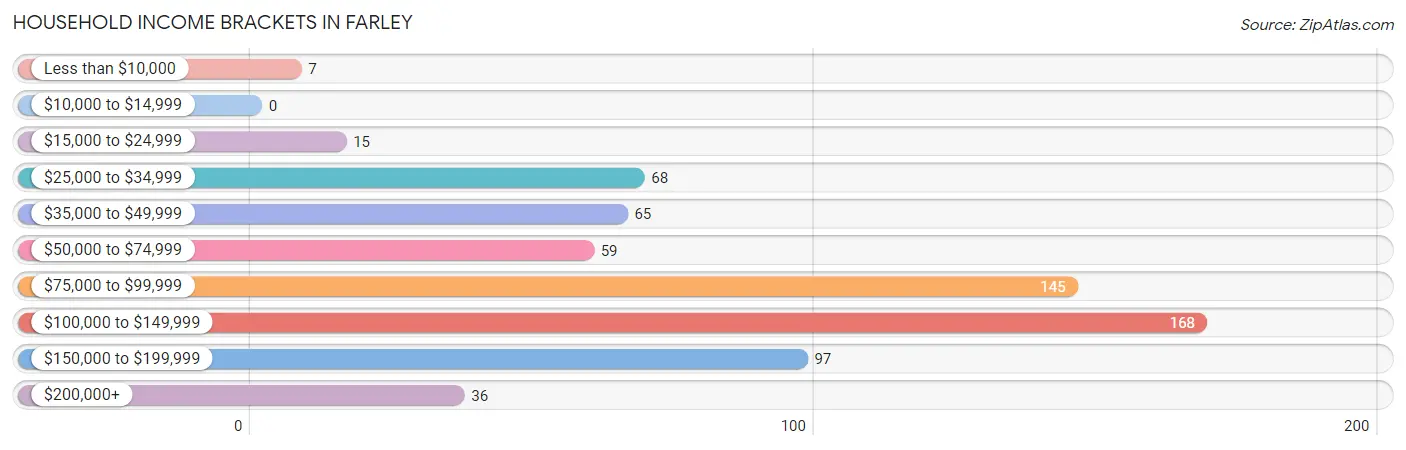
| Income Bracket | # Households | % Households |
| Less than $10,000 | 7 | 1.1% |
| $10,000 to $14,999 | 0 | 0.0% |
| $15,000 to $24,999 | 15 | 2.3% |
| $25,000 to $34,999 | 68 | 10.3% |
| $35,000 to $49,999 | 65 | 9.8% |
| $50,000 to $74,999 | 59 | 8.9% |
| $75,000 to $99,999 | 145 | 22.0% |
| $100,000 to $149,999 | 168 | 25.5% |
| $150,000 to $199,999 | 97 | 14.7% |
| $200,000+ | 36 | 5.5% |
Household Income by Householder Age in Farley
The median household income in Farley is $97,868, with the highest median household income of $112,188 found in the 45 to 64 years age bracket for the primary householder. A total of 259 households (39.2%) fall into this category. Meanwhile, the 15 to 24 years age bracket for the primary householder has the lowest median household income of $0, with 22 households (3.3%) in this group.
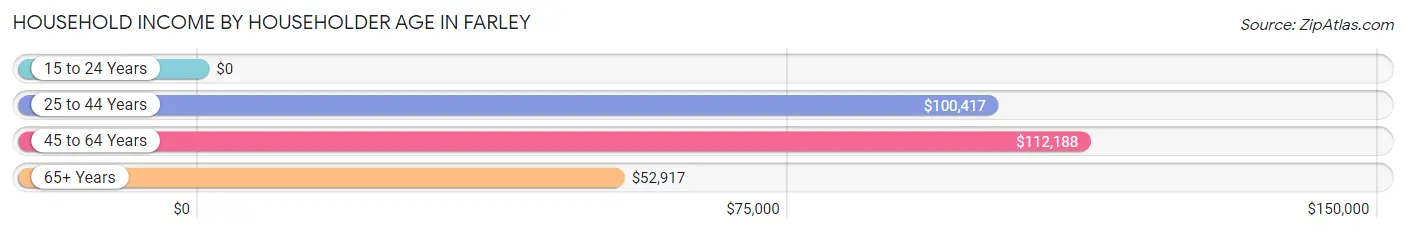
| Income Bracket | # Households | Median Income |
| 15 to 24 Years | 22 (3.3%) | $0 |
| 25 to 44 Years | 226 (34.2%) | $100,417 |
| 45 to 64 Years | 259 (39.2%) | $112,188 |
| 65+ Years | 153 (23.2%) | $52,917 |
| Total | 660 (100.0%) | $97,868 |
Poverty in Farley
Income Below Poverty by Sex and Age in Farley
With 1.9% poverty level for males and 4.1% for females among the residents of Farley, 12 to 14 year old males and 5 year old females are the most vulnerable to poverty, with 15 males (25.9%) and 4 females (33.3%) in their respective age groups living below the poverty level.
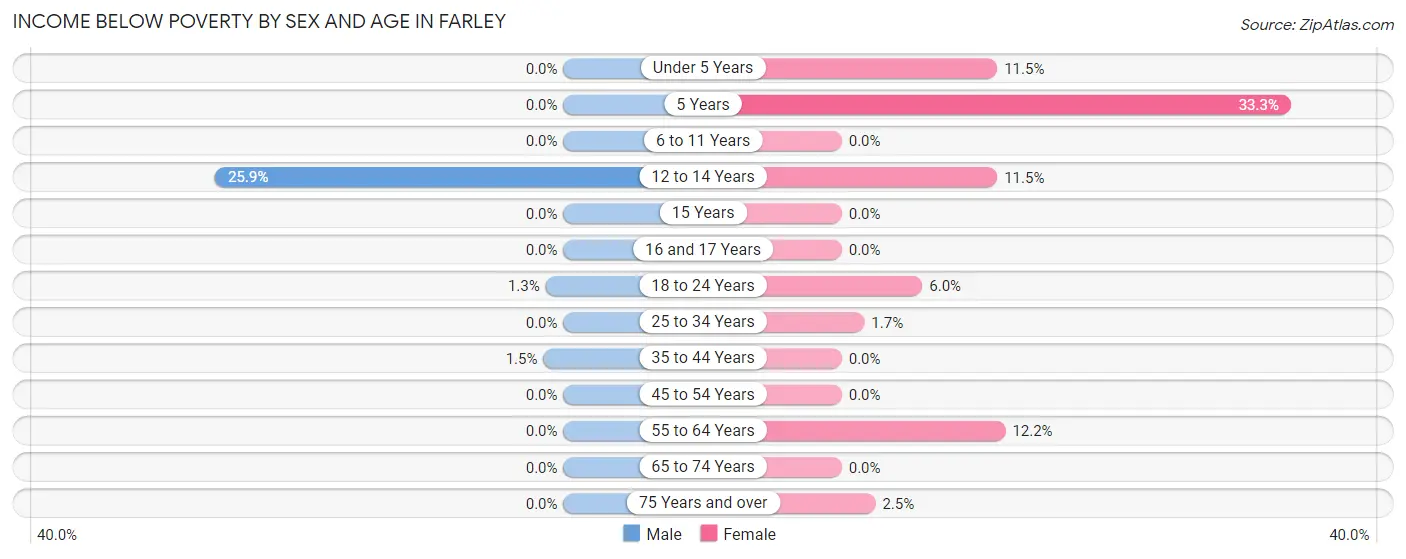
| Age Bracket | Male | Female |
| Under 5 Years | 0 (0.0%) | 6 (11.5%) |
| 5 Years | 0 (0.0%) | 4 (33.3%) |
| 6 to 11 Years | 0 (0.0%) | 0 (0.0%) |
| 12 to 14 Years | 15 (25.9%) | 6 (11.5%) |
| 15 Years | 0 (0.0%) | 0 (0.0%) |
| 16 and 17 Years | 0 (0.0%) | 0 (0.0%) |
| 18 to 24 Years | 1 (1.3%) | 7 (6.0%) |
| 25 to 34 Years | 0 (0.0%) | 2 (1.7%) |
| 35 to 44 Years | 1 (1.5%) | 0 (0.0%) |
| 45 to 54 Years | 0 (0.0%) | 0 (0.0%) |
| 55 to 64 Years | 0 (0.0%) | 13 (12.1%) |
| 65 to 74 Years | 0 (0.0%) | 0 (0.0%) |
| 75 Years and over | 0 (0.0%) | 1 (2.5%) |
| Total | 17 (1.9%) | 39 (4.1%) |
Income Above Poverty by Sex and Age in Farley
According to the poverty statistics in Farley, males aged under 5 years and females aged 6 to 11 years are the age groups that are most secure financially, with 100.0% of males and 100.0% of females in these age groups living above the poverty line.
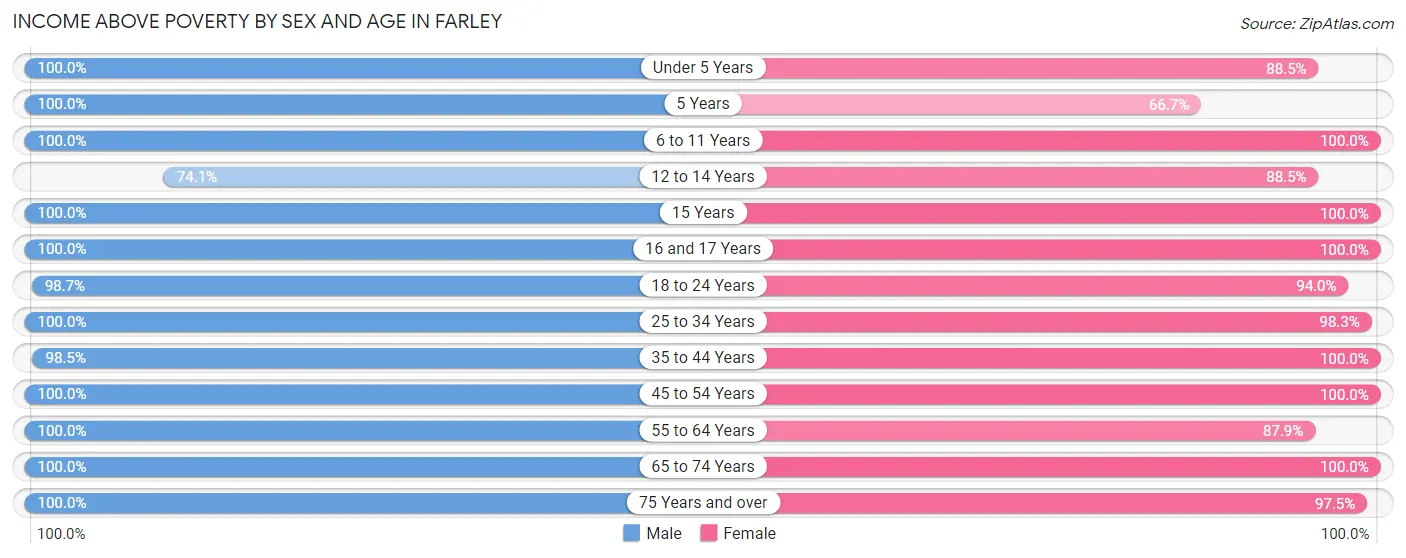
| Age Bracket | Male | Female |
| Under 5 Years | 136 (100.0%) | 46 (88.5%) |
| 5 Years | 9 (100.0%) | 8 (66.7%) |
| 6 to 11 Years | 62 (100.0%) | 82 (100.0%) |
| 12 to 14 Years | 43 (74.1%) | 46 (88.5%) |
| 15 Years | 4 (100.0%) | 3 (100.0%) |
| 16 and 17 Years | 10 (100.0%) | 23 (100.0%) |
| 18 to 24 Years | 75 (98.7%) | 110 (94.0%) |
| 25 to 34 Years | 99 (100.0%) | 117 (98.3%) |
| 35 to 44 Years | 66 (98.5%) | 111 (100.0%) |
| 45 to 54 Years | 155 (100.0%) | 125 (100.0%) |
| 55 to 64 Years | 99 (100.0%) | 94 (87.8%) |
| 65 to 74 Years | 70 (100.0%) | 105 (100.0%) |
| 75 Years and over | 37 (100.0%) | 39 (97.5%) |
| Total | 865 (98.1%) | 909 (95.9%) |
Income Below Poverty Among Married-Couple Families in Farley
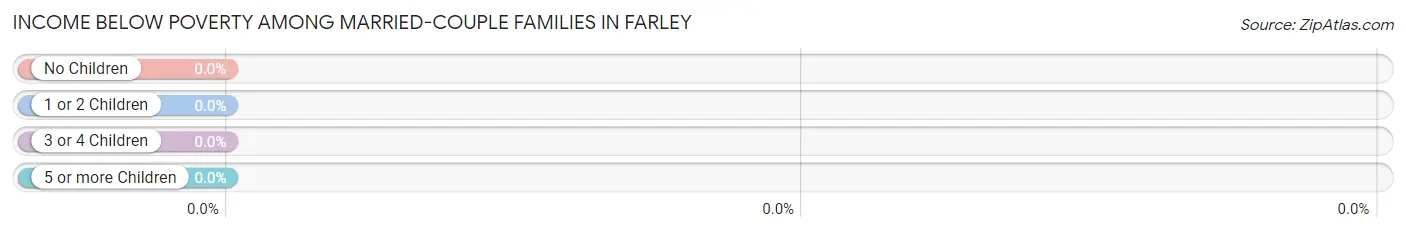
| Children | Above Poverty | Below Poverty |
| No Children | 235 (100.0%) | 0 (0.0%) |
| 1 or 2 Children | 117 (100.0%) | 0 (0.0%) |
| 3 or 4 Children | 81 (100.0%) | 0 (0.0%) |
| 5 or more Children | 0 (0.0%) | 0 (0.0%) |
| Total | 433 (100.0%) | 0 (0.0%) |
Income Below Poverty Among Single-Parent Households in Farley
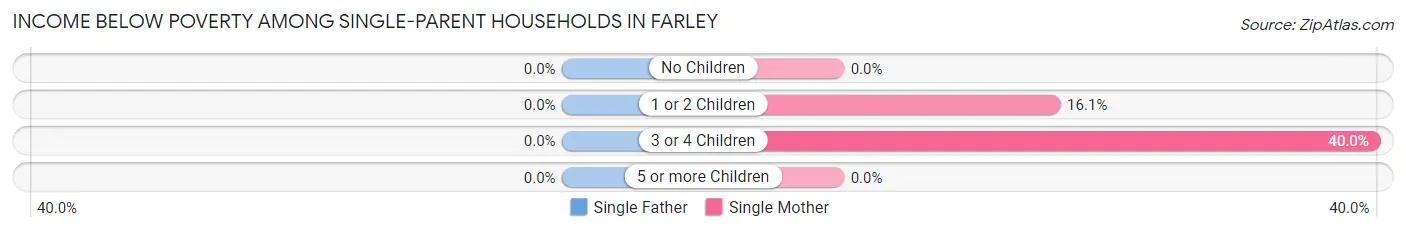
| Children | Single Father | Single Mother |
| No Children | 0 (0.0%) | 0 (0.0%) |
| 1 or 2 Children | 0 (0.0%) | 5 (16.1%) |
| 3 or 4 Children | 0 (0.0%) | 2 (40.0%) |
| 5 or more Children | 0 (0.0%) | 0 (0.0%) |
| Total | 0 (0.0%) | 7 (10.6%) |
Income Below Poverty Among Married-Couple vs Single-Parent Households in Farley
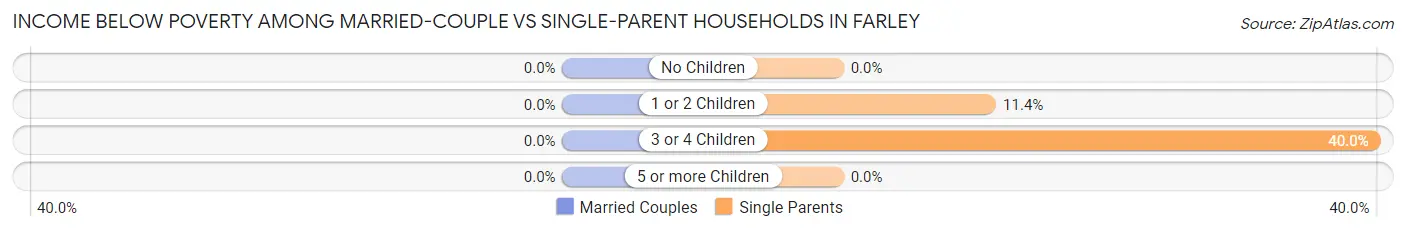
| Children | Married-Couple Families | Single-Parent Households |
| No Children | 0 (0.0%) | 0 (0.0%) |
| 1 or 2 Children | 0 (0.0%) | 5 (11.4%) |
| 3 or 4 Children | 0 (0.0%) | 2 (40.0%) |
| 5 or more Children | 0 (0.0%) | 0 (0.0%) |
| Total | 0 (0.0%) | 7 (7.9%) |
Employment Characteristics in Farley
Employment by Class of Employer in Farley
Among the 964 employed individuals in Farley, private company employees (642 | 66.6%), not-for-profit organizations (122 | 12.7%), and local government employees (68 | 7.0%) make up the most common classes of employment.
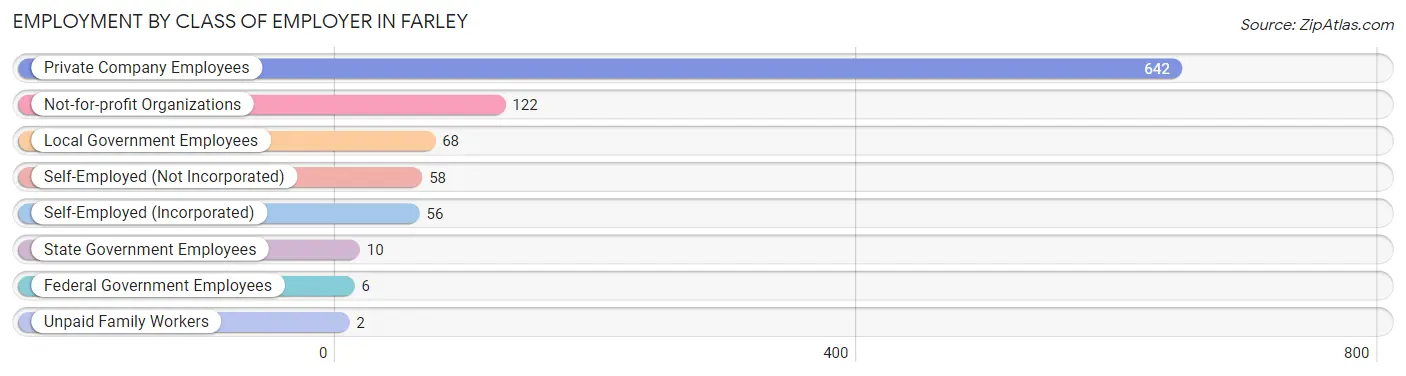
| Employer Class | # Employees | % Employees |
| Private Company Employees | 642 | 66.6% |
| Self-Employed (Incorporated) | 56 | 5.8% |
| Self-Employed (Not Incorporated) | 58 | 6.0% |
| Not-for-profit Organizations | 122 | 12.7% |
| Local Government Employees | 68 | 7.0% |
| State Government Employees | 10 | 1.0% |
| Federal Government Employees | 6 | 0.6% |
| Unpaid Family Workers | 2 | 0.2% |
| Total | 964 | 100.0% |
Employment Status by Age in Farley
According to the labor force statistics for Farley, out of the total population over 16 years of age (1,360), 75.2% or 1,023 individuals are in the labor force, with 4.8% or 49 of them unemployed. The age group with the highest labor force participation rate is 30 to 34 years, with 100.0% or 117 individuals in the labor force. Within the labor force, the 20 to 24 years age range has the highest percentage of unemployed individuals, with 16.4% or 19 of them being unemployed.
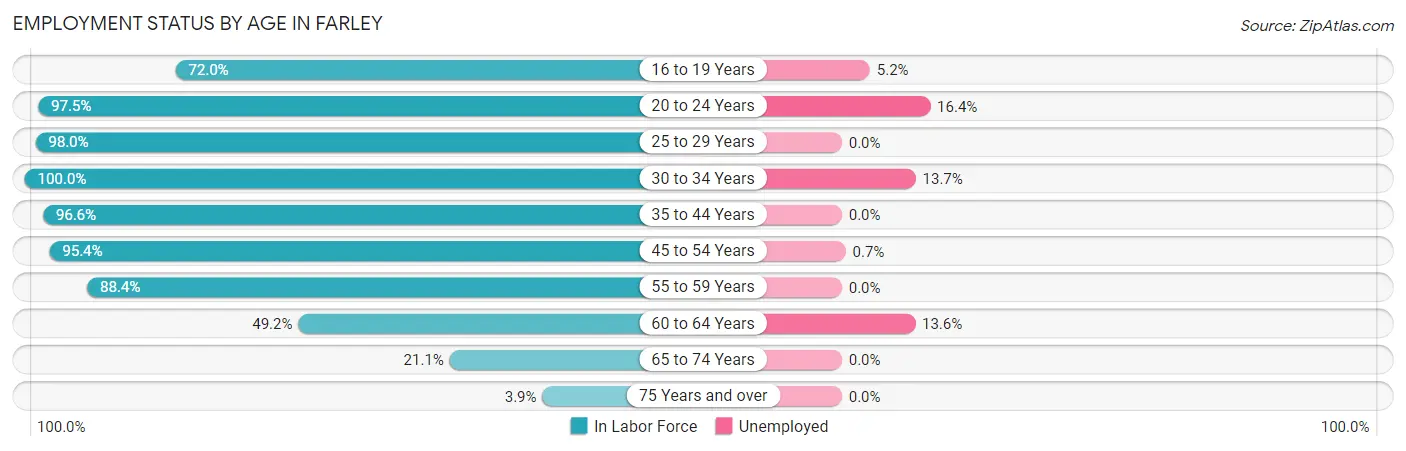
| Age Bracket | In Labor Force | Unemployed |
| 16 to 19 Years | 77 (72.0%) | 4 (5.2%) |
| 20 to 24 Years | 116 (97.5%) | 19 (16.4%) |
| 25 to 29 Years | 99 (98.0%) | 0 (0.0%) |
| 30 to 34 Years | 117 (100.0%) | 16 (13.7%) |
| 35 to 44 Years | 172 (96.6%) | 0 (0.0%) |
| 45 to 54 Years | 267 (95.4%) | 2 (0.7%) |
| 55 to 59 Years | 76 (88.4%) | 0 (0.0%) |
| 60 to 64 Years | 59 (49.2%) | 8 (13.6%) |
| 65 to 74 Years | 37 (21.1%) | 0 (0.0%) |
| 75 Years and over | 3 (3.9%) | 0 (0.0%) |
| Total | 1,023 (75.2%) | 49 (4.8%) |
Employment Status by Educational Attainment in Farley
According to labor force statistics for Farley, 89.6% of individuals (790) out of the total population between 25 and 64 years of age (882) are in the labor force, with 3.3% or 26 of them being unemployed. The group with the highest labor force participation rate are those with the educational attainment of bachelor's degree or higher, with 99.0% or 198 individuals in the labor force. Within the labor force, individuals with less than high school education have the highest percentage of unemployment, with 8.0% or 2 of them being unemployed.
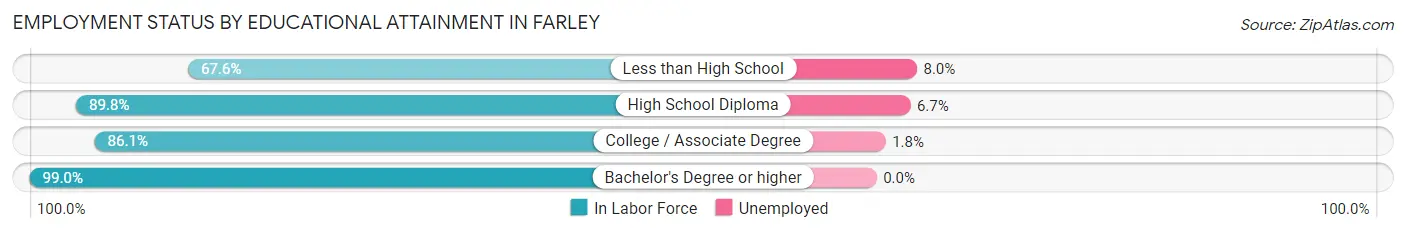
| Educational Attainment | In Labor Force | Unemployed |
| Less than High School | 25 (67.6%) | 3 (8.0%) |
| High School Diploma | 282 (89.8%) | 21 (6.7%) |
| College / Associate Degree | 285 (86.1%) | 6 (1.8%) |
| Bachelor's Degree or higher | 198 (99.0%) | 0 (0.0%) |
| Total | 790 (89.6%) | 29 (3.3%) |
Employment Occupations by Sex in Farley
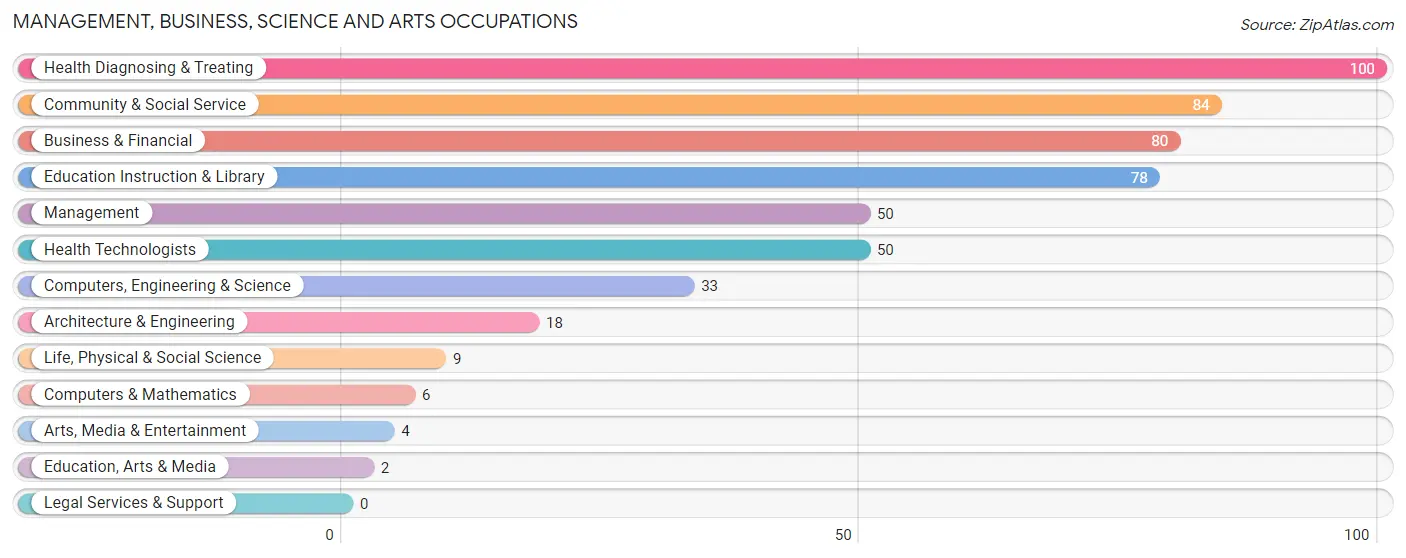
Management, Business, Science and Arts Occupations
The most common Management, Business, Science and Arts occupations in Farley are Health Diagnosing & Treating (100 | 10.3%), Community & Social Service (84 | 8.6%), Business & Financial (80 | 8.2%), Education Instruction & Library (78 | 8.0%), and Management (50 | 5.1%).
Management, Business, Science and Arts Occupations by Sex
Within the Management, Business, Science and Arts occupations in Farley, the most male-oriented occupations are Architecture & Engineering (100.0%), Life, Physical & Social Science (100.0%), and Computers, Engineering & Science (87.9%), while the most female-oriented occupations are Education, Arts & Media (100.0%), Arts, Media & Entertainment (100.0%), and Community & Social Service (96.4%).
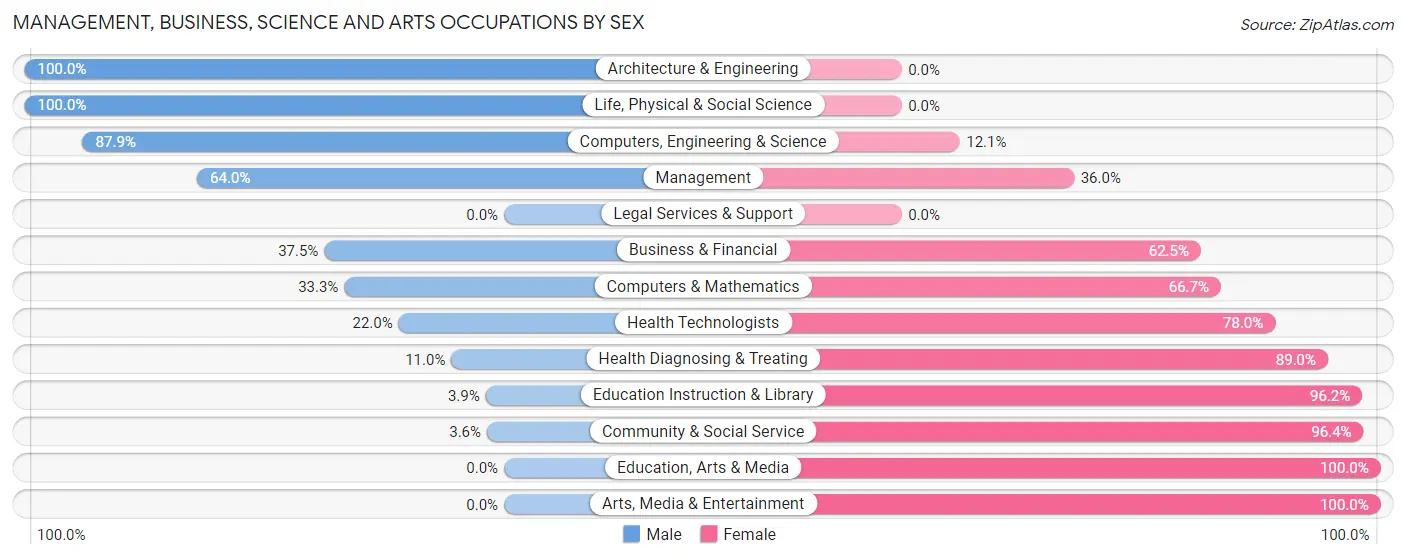
| Occupation | Male | Female |
| Management | 32 (64.0%) | 18 (36.0%) |
| Business & Financial | 30 (37.5%) | 50 (62.5%) |
| Computers, Engineering & Science | 29 (87.9%) | 4 (12.1%) |
| Computers & Mathematics | 2 (33.3%) | 4 (66.7%) |
| Architecture & Engineering | 18 (100.0%) | 0 (0.0%) |
| Life, Physical & Social Science | 9 (100.0%) | 0 (0.0%) |
| Community & Social Service | 3 (3.6%) | 81 (96.4%) |
| Education, Arts & Media | 0 (0.0%) | 2 (100.0%) |
| Legal Services & Support | 0 (0.0%) | 0 (0.0%) |
| Education Instruction & Library | 3 (3.8%) | 75 (96.2%) |
| Arts, Media & Entertainment | 0 (0.0%) | 4 (100.0%) |
| Health Diagnosing & Treating | 11 (11.0%) | 89 (89.0%) |
| Health Technologists | 11 (22.0%) | 39 (78.0%) |
| Total (Category) | 105 (30.3%) | 242 (69.7%) |
| Total (Overall) | 473 (48.6%) | 501 (51.4%) |
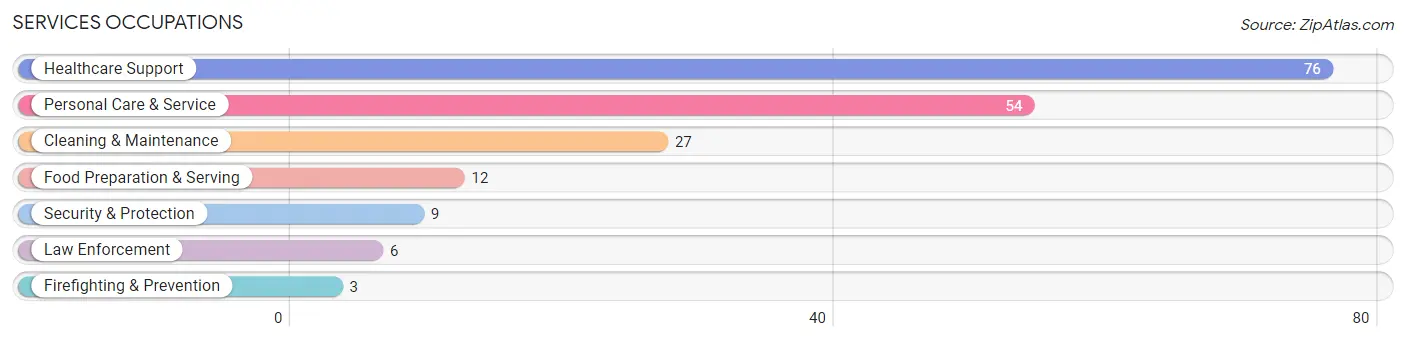
Services Occupations
The most common Services occupations in Farley are Healthcare Support (76 | 7.8%), Personal Care & Service (54 | 5.5%), Cleaning & Maintenance (27 | 2.8%), Food Preparation & Serving (12 | 1.2%), and Security & Protection (9 | 0.9%).
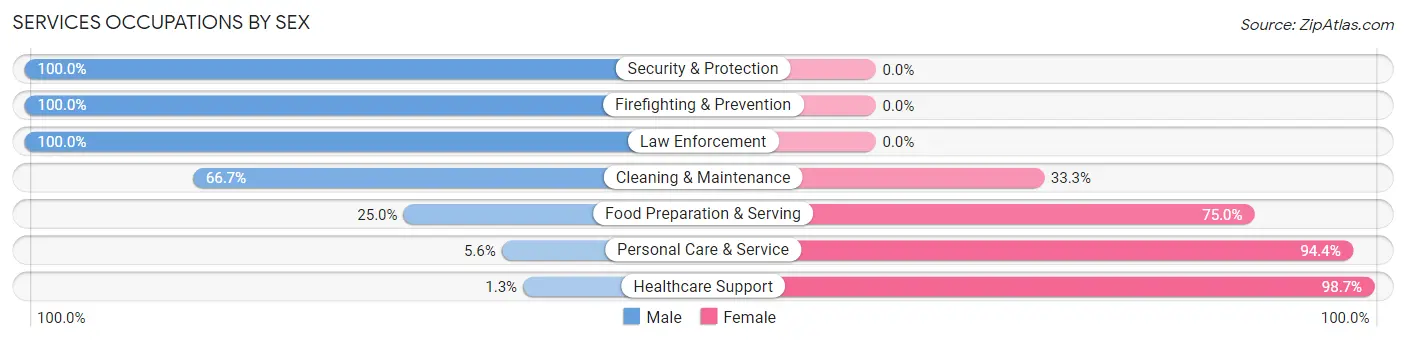
Services Occupations by Sex
Within the Services occupations in Farley, the most male-oriented occupations are Security & Protection (100.0%), Firefighting & Prevention (100.0%), and Law Enforcement (100.0%), while the most female-oriented occupations are Healthcare Support (98.7%), Personal Care & Service (94.4%), and Food Preparation & Serving (75.0%).
| Occupation | Male | Female |
| Healthcare Support | 1 (1.3%) | 75 (98.7%) |
| Security & Protection | 9 (100.0%) | 0 (0.0%) |
| Firefighting & Prevention | 3 (100.0%) | 0 (0.0%) |
| Law Enforcement | 6 (100.0%) | 0 (0.0%) |
| Food Preparation & Serving | 3 (25.0%) | 9 (75.0%) |
| Cleaning & Maintenance | 18 (66.7%) | 9 (33.3%) |
| Personal Care & Service | 3 (5.6%) | 51 (94.4%) |
| Total (Category) | 34 (19.1%) | 144 (80.9%) |
| Total (Overall) | 473 (48.6%) | 501 (51.4%) |
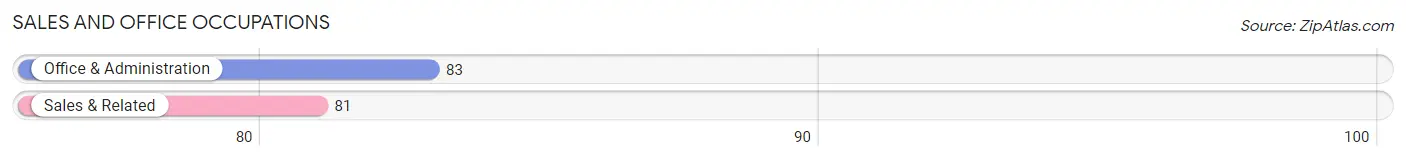
Sales and Office Occupations
The most common Sales and Office occupations in Farley are Office & Administration (83 | 8.5%), and Sales & Related (81 | 8.3%).
Sales and Office Occupations by Sex
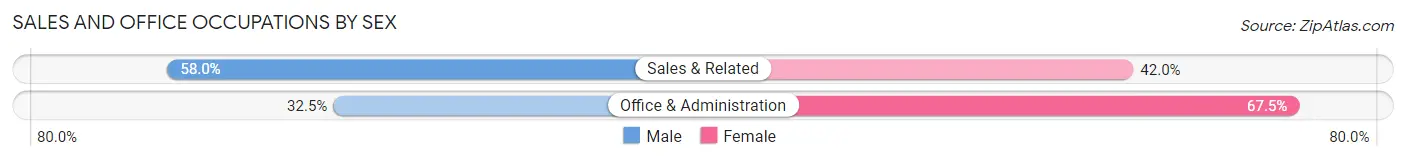
| Occupation | Male | Female |
| Sales & Related | 47 (58.0%) | 34 (42.0%) |
| Office & Administration | 27 (32.5%) | 56 (67.5%) |
| Total (Category) | 74 (45.1%) | 90 (54.9%) |
| Total (Overall) | 473 (48.6%) | 501 (51.4%) |
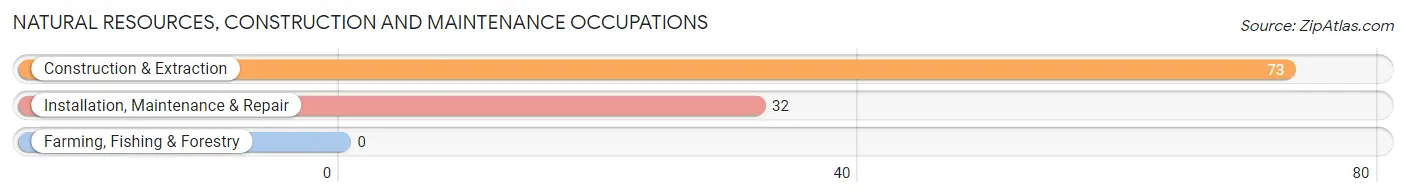
Natural Resources, Construction and Maintenance Occupations
The most common Natural Resources, Construction and Maintenance occupations in Farley are Construction & Extraction (73 | 7.5%), and Installation, Maintenance & Repair (32 | 3.3%).
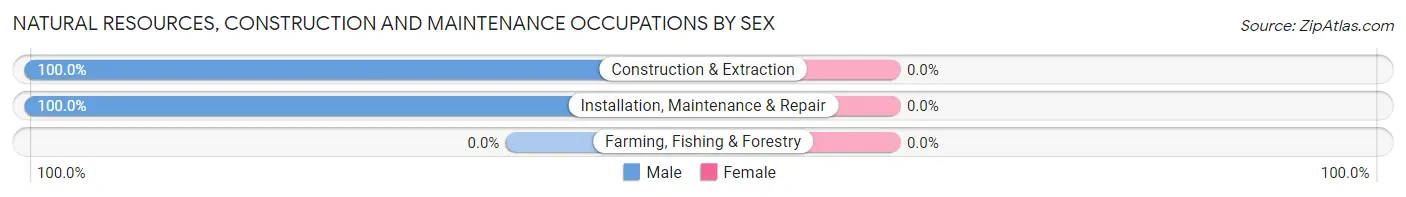
Natural Resources, Construction and Maintenance Occupations by Sex
| Occupation | Male | Female |
| Farming, Fishing & Forestry | 0 (0.0%) | 0 (0.0%) |
| Construction & Extraction | 73 (100.0%) | 0 (0.0%) |
| Installation, Maintenance & Repair | 32 (100.0%) | 0 (0.0%) |
| Total (Category) | 105 (100.0%) | 0 (0.0%) |
| Total (Overall) | 473 (48.6%) | 501 (51.4%) |
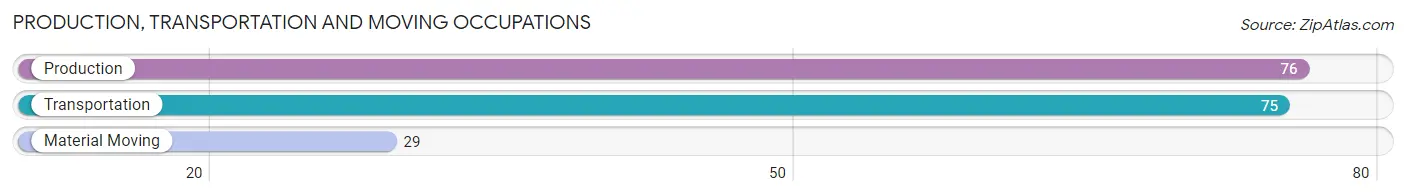
Production, Transportation and Moving Occupations
The most common Production, Transportation and Moving occupations in Farley are Production (76 | 7.8%), Transportation (75 | 7.7%), and Material Moving (29 | 3.0%).
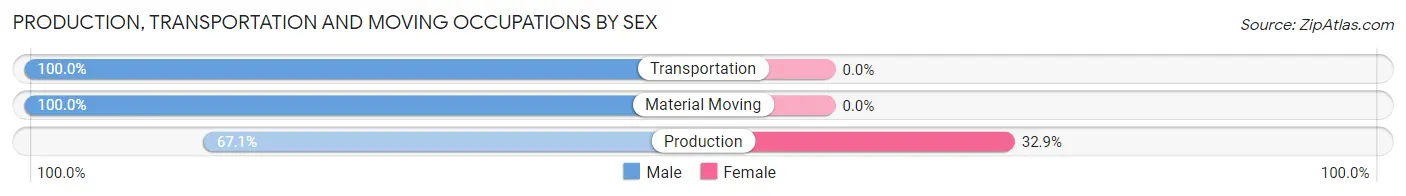
Production, Transportation and Moving Occupations by Sex
| Occupation | Male | Female |
| Production | 51 (67.1%) | 25 (32.9%) |
| Transportation | 75 (100.0%) | 0 (0.0%) |
| Material Moving | 29 (100.0%) | 0 (0.0%) |
| Total (Category) | 155 (86.1%) | 25 (13.9%) |
| Total (Overall) | 473 (48.6%) | 501 (51.4%) |
Employment Industries by Sex in Farley
Employment Industries in Farley
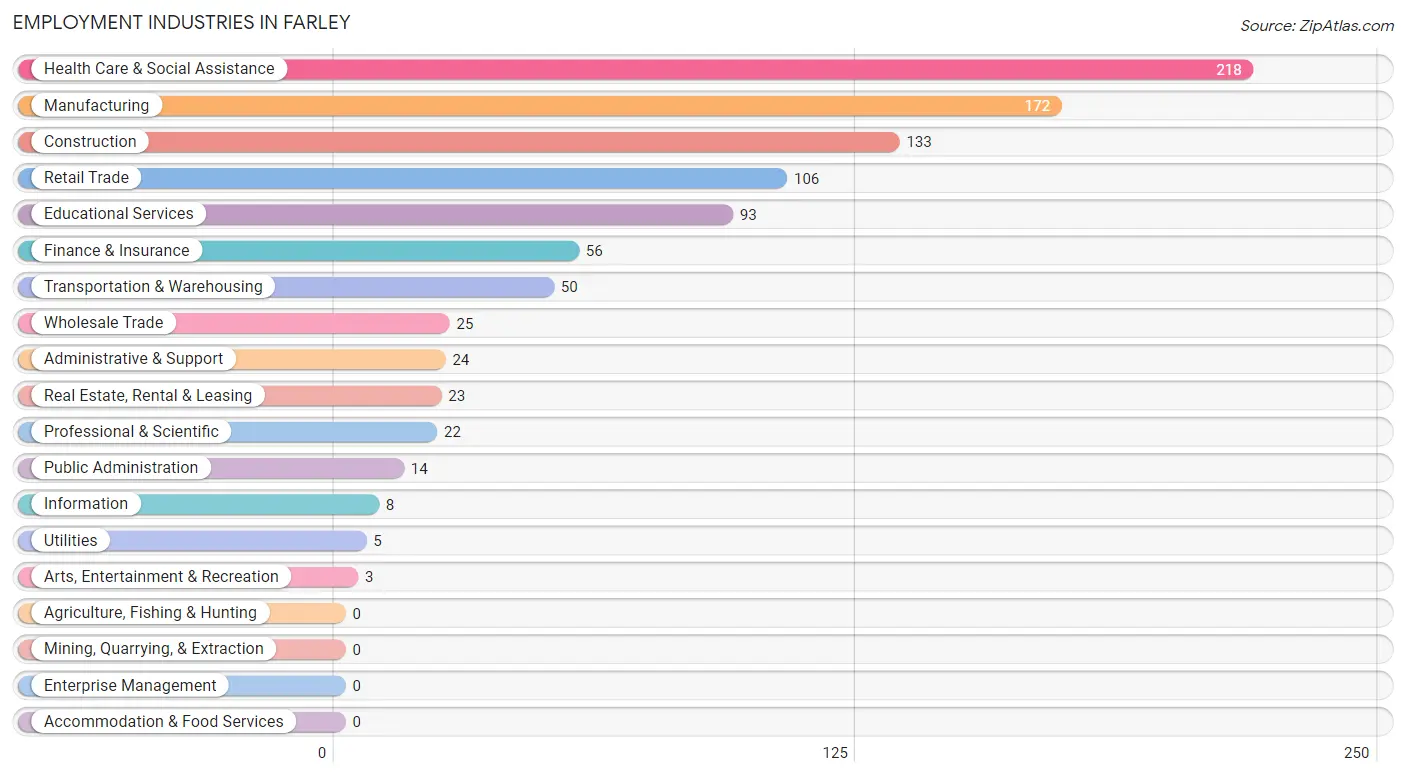
The major employment industries in Farley include Health Care & Social Assistance (218 | 22.4%), Manufacturing (172 | 17.7%), Construction (133 | 13.7%), Retail Trade (106 | 10.9%), and Educational Services (93 | 9.6%).
Employment Industries by Sex in Farley
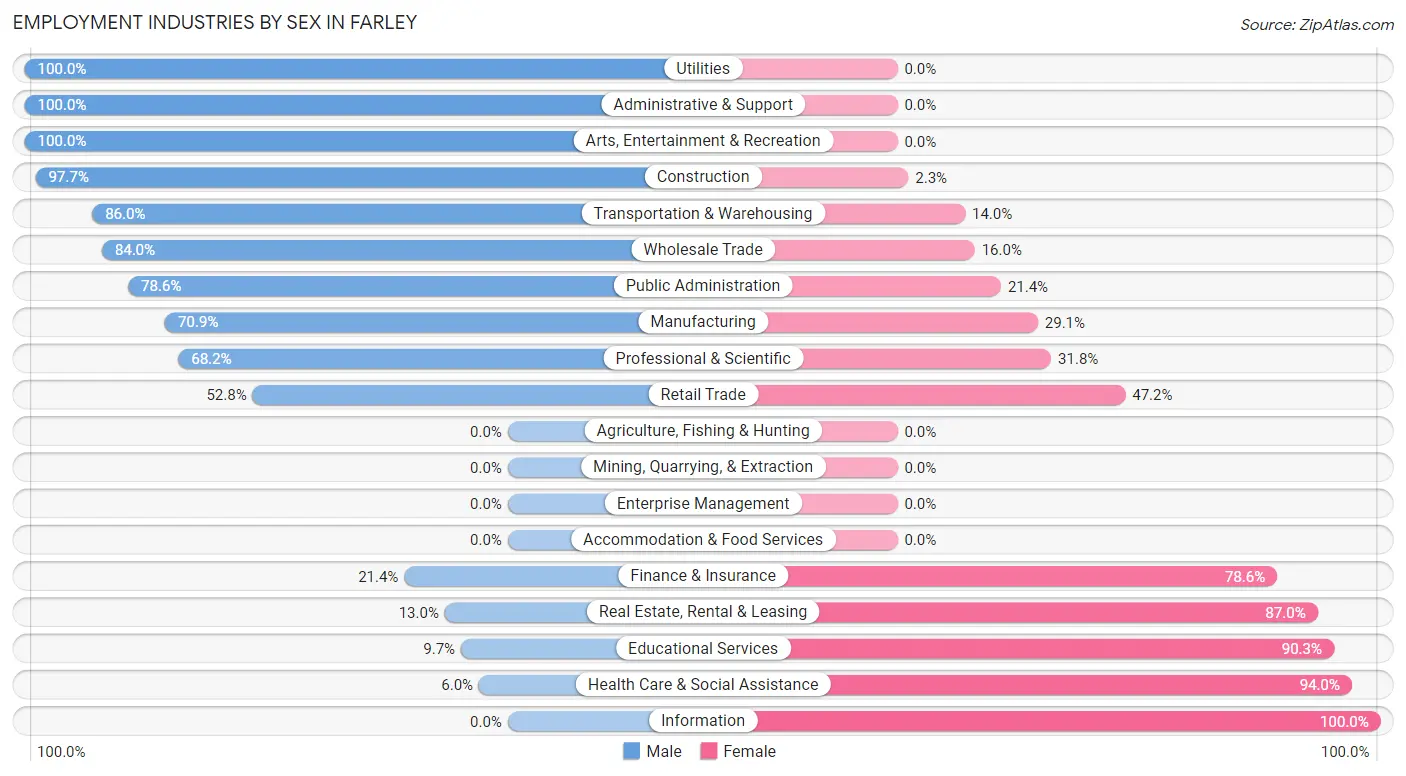
The Farley industries that see more men than women are Utilities (100.0%), Administrative & Support (100.0%), and Arts, Entertainment & Recreation (100.0%), whereas the industries that tend to have a higher number of women are Information (100.0%), Health Care & Social Assistance (94.0%), and Educational Services (90.3%).
| Industry | Male | Female |
| Agriculture, Fishing & Hunting | 0 (0.0%) | 0 (0.0%) |
| Mining, Quarrying, & Extraction | 0 (0.0%) | 0 (0.0%) |
| Construction | 130 (97.7%) | 3 (2.3%) |
| Manufacturing | 122 (70.9%) | 50 (29.1%) |
| Wholesale Trade | 21 (84.0%) | 4 (16.0%) |
| Retail Trade | 56 (52.8%) | 50 (47.2%) |
| Transportation & Warehousing | 43 (86.0%) | 7 (14.0%) |
| Utilities | 5 (100.0%) | 0 (0.0%) |
| Information | 0 (0.0%) | 8 (100.0%) |
| Finance & Insurance | 12 (21.4%) | 44 (78.6%) |
| Real Estate, Rental & Leasing | 3 (13.0%) | 20 (87.0%) |
| Professional & Scientific | 15 (68.2%) | 7 (31.8%) |
| Enterprise Management | 0 (0.0%) | 0 (0.0%) |
| Administrative & Support | 24 (100.0%) | 0 (0.0%) |
| Educational Services | 9 (9.7%) | 84 (90.3%) |
| Health Care & Social Assistance | 13 (6.0%) | 205 (94.0%) |
| Arts, Entertainment & Recreation | 3 (100.0%) | 0 (0.0%) |
| Accommodation & Food Services | 0 (0.0%) | 0 (0.0%) |
| Public Administration | 11 (78.6%) | 3 (21.4%) |
| Total | 473 (48.6%) | 501 (51.4%) |
Education in Farley
School Enrollment in Farley
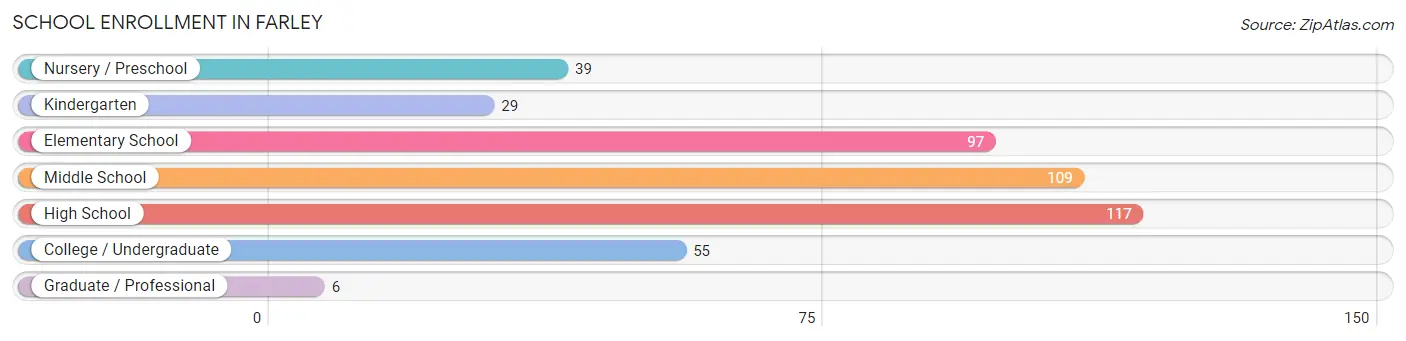
The most common levels of schooling among the 452 students in Farley are high school (117 | 25.9%), middle school (109 | 24.1%), and elementary school (97 | 21.5%).
| School Level | # Students | % Students |
| Nursery / Preschool | 39 | 8.6% |
| Kindergarten | 29 | 6.4% |
| Elementary School | 97 | 21.5% |
| Middle School | 109 | 24.1% |
| High School | 117 | 25.9% |
| College / Undergraduate | 55 | 12.2% |
| Graduate / Professional | 6 | 1.3% |
| Total | 452 | 100.0% |
School Enrollment by Age by Funding Source in Farley
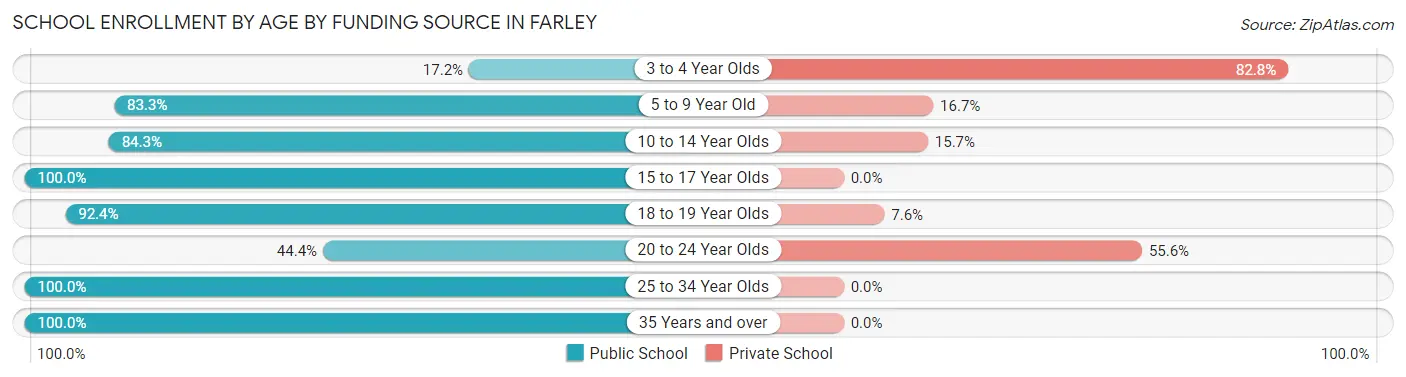
Out of a total of 452 students who are enrolled in schools in Farley, 88 (19.5%) attend a private institution, while the remaining 364 (80.5%) are enrolled in public schools. The age group of 3 to 4 year olds has the highest likelihood of being enrolled in private schools, with 24 (82.8% in the age bracket) enrolled. Conversely, the age group of 15 to 17 year olds has the lowest likelihood of being enrolled in a private school, with 40 (100.0% in the age bracket) attending a public institution.
| Age Bracket | Public School | Private School |
| 3 to 4 Year Olds | 5 (17.2%) | 24 (82.8%) |
| 5 to 9 Year Old | 75 (83.3%) | 15 (16.7%) |
| 10 to 14 Year Olds | 156 (84.3%) | 29 (15.7%) |
| 15 to 17 Year Olds | 40 (100.0%) | 0 (0.0%) |
| 18 to 19 Year Olds | 61 (92.4%) | 5 (7.6%) |
| 20 to 24 Year Olds | 12 (44.4%) | 15 (55.6%) |
| 25 to 34 Year Olds | 13 (100.0%) | 0 (0.0%) |
| 35 Years and over | 2 (100.0%) | 0 (0.0%) |
| Total | 364 (80.5%) | 88 (19.5%) |
Educational Attainment by Field of Study in Farley
Business (60 | 25.2%), science & technology (56 | 23.5%), education (44 | 18.5%), arts & humanities (18 | 7.6%), and engineering (13 | 5.5%) are the most common fields of study among 238 individuals in Farley who have obtained a bachelor's degree or higher.
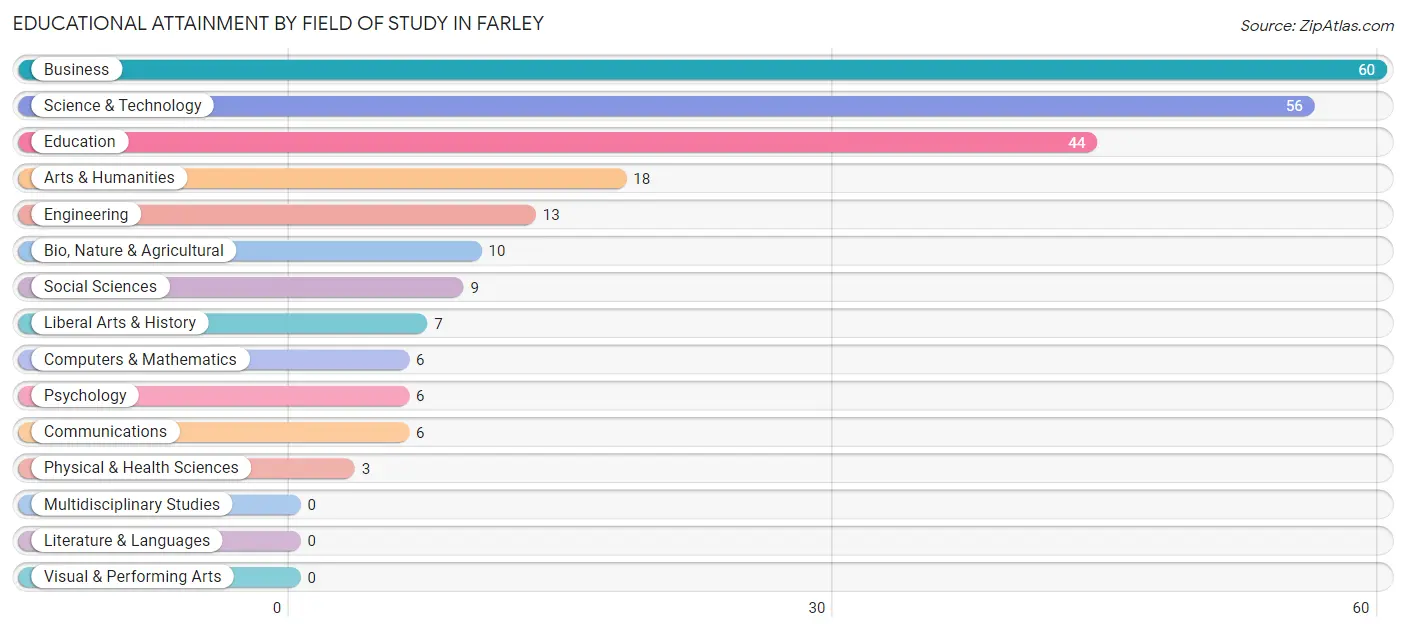
| Field of Study | # Graduates | % Graduates |
| Computers & Mathematics | 6 | 2.5% |
| Bio, Nature & Agricultural | 10 | 4.2% |
| Physical & Health Sciences | 3 | 1.3% |
| Psychology | 6 | 2.5% |
| Social Sciences | 9 | 3.8% |
| Engineering | 13 | 5.5% |
| Multidisciplinary Studies | 0 | 0.0% |
| Science & Technology | 56 | 23.5% |
| Business | 60 | 25.2% |
| Education | 44 | 18.5% |
| Literature & Languages | 0 | 0.0% |
| Liberal Arts & History | 7 | 2.9% |
| Visual & Performing Arts | 0 | 0.0% |
| Communications | 6 | 2.5% |
| Arts & Humanities | 18 | 7.6% |
| Total | 238 | 100.0% |
Transportation & Commute in Farley
Vehicle Availability by Sex in Farley
The most prevalent vehicle ownership categories in Farley are males with 2 vehicles (182, accounting for 38.8%) and females with 2 vehicles (153, making up 36.8%).
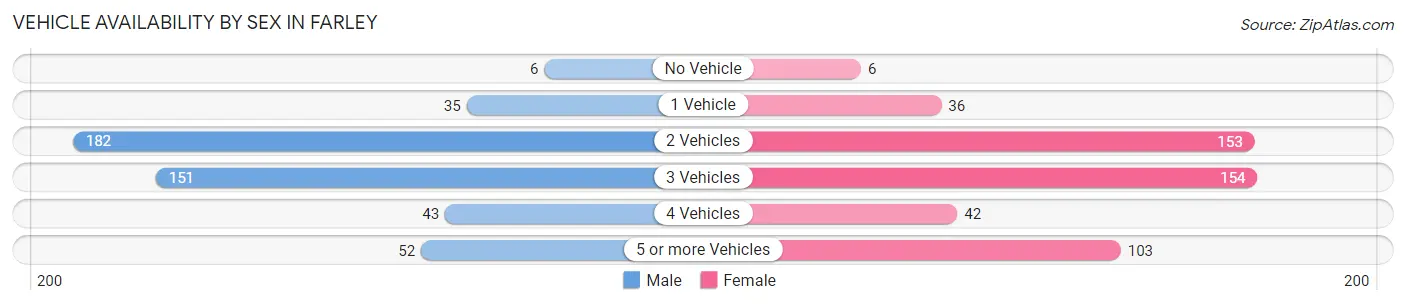
| Vehicles Available | Male | Female |
| No Vehicle | 6 (1.3%) | 6 (1.2%) |
| 1 Vehicle | 35 (7.5%) | 36 (7.3%) |
| 2 Vehicles | 182 (38.8%) | 153 (31.0%) |
| 3 Vehicles | 151 (32.2%) | 154 (31.2%) |
| 4 Vehicles | 43 (9.2%) | 42 (8.5%) |
| 5 or more Vehicles | 52 (11.1%) | 103 (20.8%) |
| Total | 469 (100.0%) | 494 (100.0%) |
Commute Time in Farley
The most frequently occuring commute durations in Farley are 15 to 19 minutes (189 commuters, 20.8%), 10 to 14 minutes (162 commuters, 17.8%), and 5 to 9 minutes (123 commuters, 13.5%).
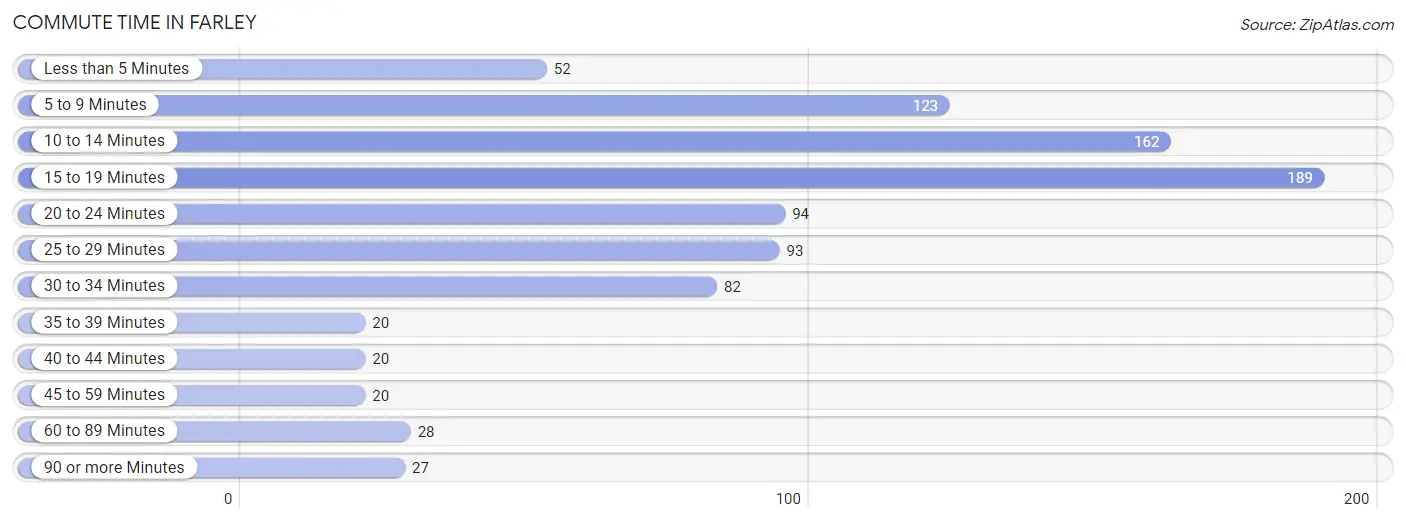
| Commute Time | # Commuters | % Commuters |
| Less than 5 Minutes | 52 | 5.7% |
| 5 to 9 Minutes | 123 | 13.5% |
| 10 to 14 Minutes | 162 | 17.8% |
| 15 to 19 Minutes | 189 | 20.8% |
| 20 to 24 Minutes | 94 | 10.3% |
| 25 to 29 Minutes | 93 | 10.2% |
| 30 to 34 Minutes | 82 | 9.0% |
| 35 to 39 Minutes | 20 | 2.2% |
| 40 to 44 Minutes | 20 | 2.2% |
| 45 to 59 Minutes | 20 | 2.2% |
| 60 to 89 Minutes | 28 | 3.1% |
| 90 or more Minutes | 27 | 3.0% |
Commute Time by Sex in Farley
The most common commute times in Farley are 10 to 14 minutes (116 commuters, 25.4%) for males and 15 to 19 minutes (104 commuters, 22.9%) for females.
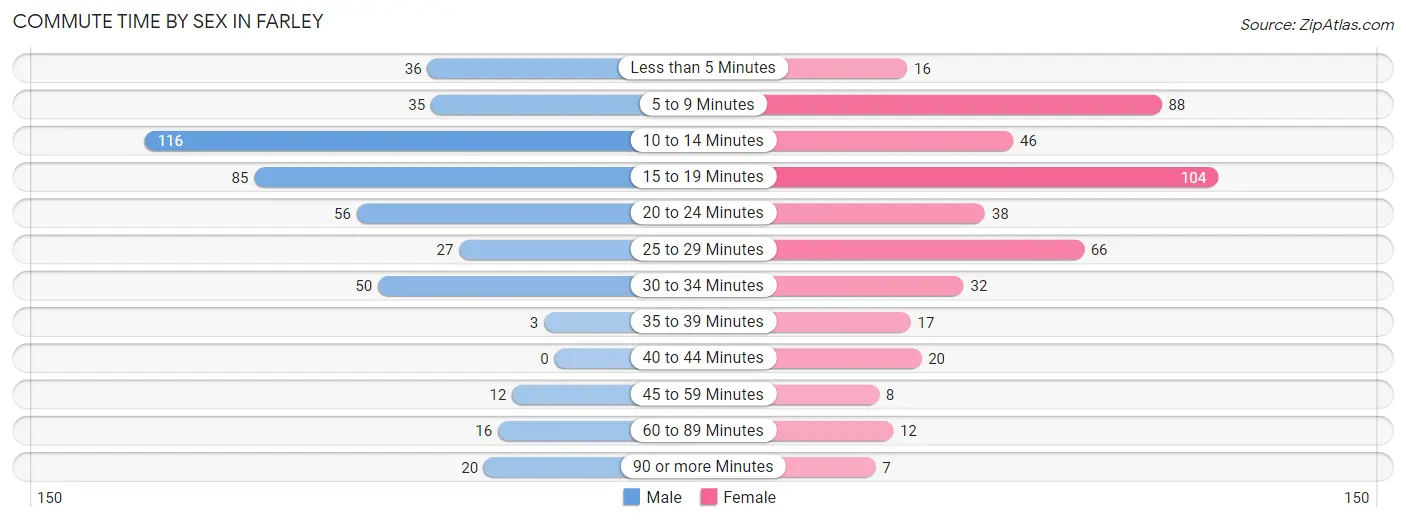
| Commute Time | Male | Female |
| Less than 5 Minutes | 36 (7.9%) | 16 (3.5%) |
| 5 to 9 Minutes | 35 (7.7%) | 88 (19.4%) |
| 10 to 14 Minutes | 116 (25.4%) | 46 (10.1%) |
| 15 to 19 Minutes | 85 (18.6%) | 104 (22.9%) |
| 20 to 24 Minutes | 56 (12.3%) | 38 (8.4%) |
| 25 to 29 Minutes | 27 (5.9%) | 66 (14.5%) |
| 30 to 34 Minutes | 50 (11.0%) | 32 (7.0%) |
| 35 to 39 Minutes | 3 (0.7%) | 17 (3.7%) |
| 40 to 44 Minutes | 0 (0.0%) | 20 (4.4%) |
| 45 to 59 Minutes | 12 (2.6%) | 8 (1.8%) |
| 60 to 89 Minutes | 16 (3.5%) | 12 (2.6%) |
| 90 or more Minutes | 20 (4.4%) | 7 (1.5%) |
Time of Departure to Work by Sex in Farley
The most frequent times of departure to work in Farley are 6:00 AM to 6:29 AM (83, 18.2%) for males and 12:00 PM to 3:59 PM (92, 20.3%) for females.
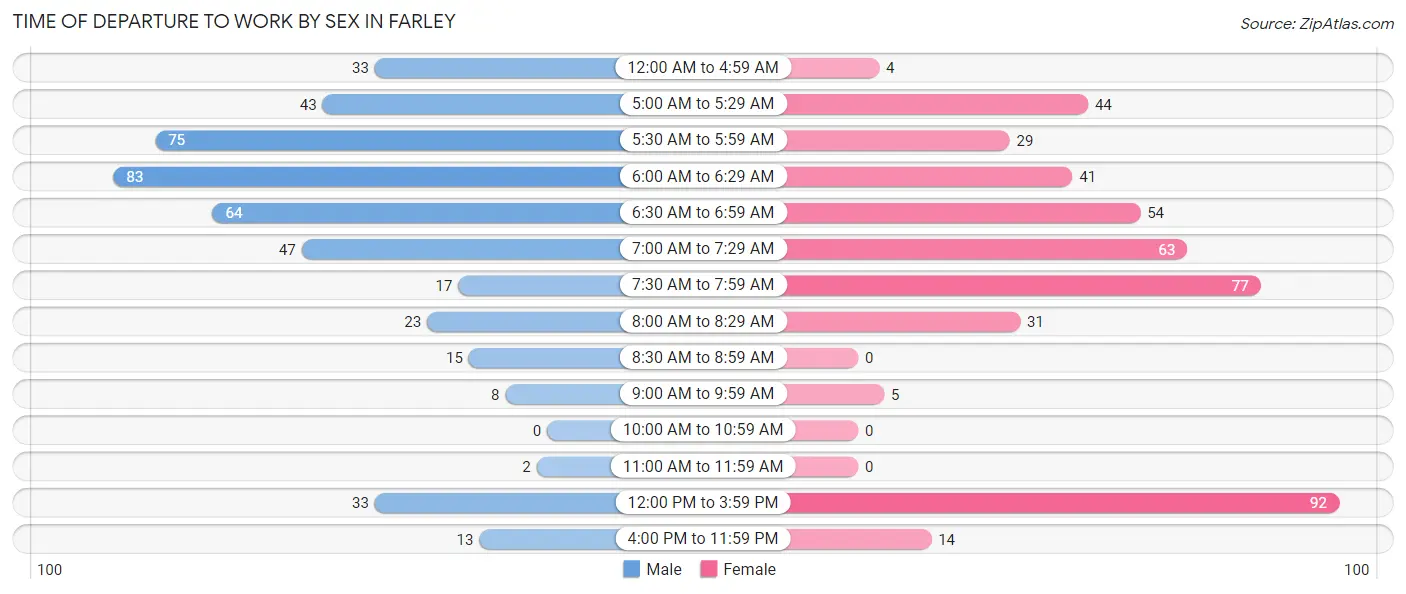
| Time of Departure | Male | Female |
| 12:00 AM to 4:59 AM | 33 (7.2%) | 4 (0.9%) |
| 5:00 AM to 5:29 AM | 43 (9.4%) | 44 (9.7%) |
| 5:30 AM to 5:59 AM | 75 (16.5%) | 29 (6.4%) |
| 6:00 AM to 6:29 AM | 83 (18.2%) | 41 (9.0%) |
| 6:30 AM to 6:59 AM | 64 (14.0%) | 54 (11.9%) |
| 7:00 AM to 7:29 AM | 47 (10.3%) | 63 (13.9%) |
| 7:30 AM to 7:59 AM | 17 (3.7%) | 77 (17.0%) |
| 8:00 AM to 8:29 AM | 23 (5.0%) | 31 (6.8%) |
| 8:30 AM to 8:59 AM | 15 (3.3%) | 0 (0.0%) |
| 9:00 AM to 9:59 AM | 8 (1.8%) | 5 (1.1%) |
| 10:00 AM to 10:59 AM | 0 (0.0%) | 0 (0.0%) |
| 11:00 AM to 11:59 AM | 2 (0.4%) | 0 (0.0%) |
| 12:00 PM to 3:59 PM | 33 (7.2%) | 92 (20.3%) |
| 4:00 PM to 11:59 PM | 13 (2.9%) | 14 (3.1%) |
| Total | 456 (100.0%) | 454 (100.0%) |
Housing Occupancy in Farley
Occupancy by Ownership in Farley
Of the total 660 dwellings in Farley, owner-occupied units account for 527 (79.8%), while renter-occupied units make up 133 (20.2%).
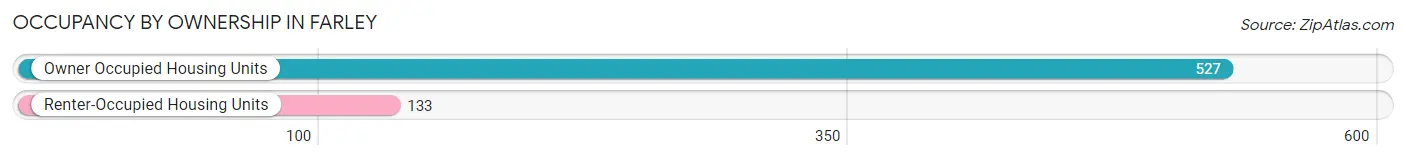
| Occupancy | # Housing Units | % Housing Units |
| Owner Occupied Housing Units | 527 | 79.8% |
| Renter-Occupied Housing Units | 133 | 20.2% |
| Total Occupied Housing Units | 660 | 100.0% |
Occupancy by Household Size in Farley
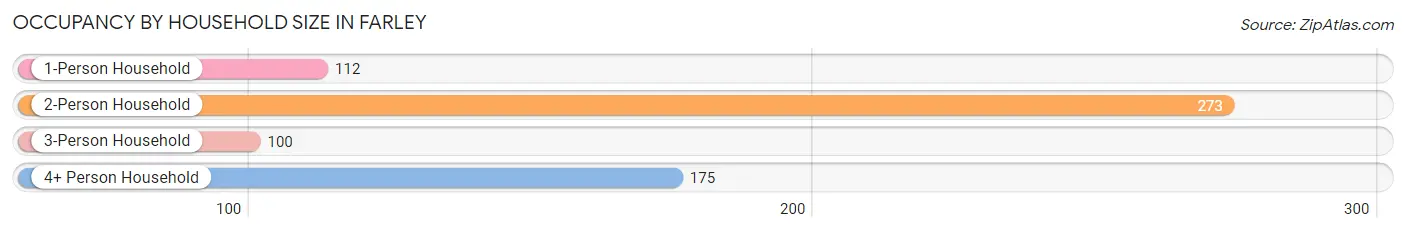
| Household Size | # Housing Units | % Housing Units |
| 1-Person Household | 112 | 17.0% |
| 2-Person Household | 273 | 41.4% |
| 3-Person Household | 100 | 15.1% |
| 4+ Person Household | 175 | 26.5% |
| Total Housing Units | 660 | 100.0% |
Occupancy by Ownership by Household Size in Farley
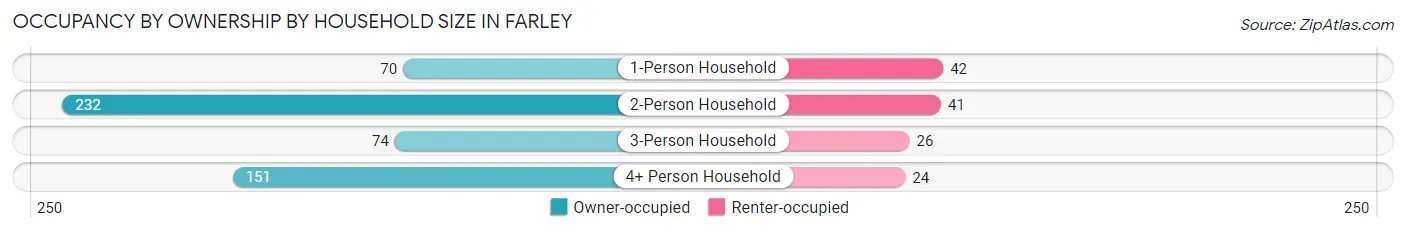
| Household Size | Owner-occupied | Renter-occupied |
| 1-Person Household | 70 (62.5%) | 42 (37.5%) |
| 2-Person Household | 232 (85.0%) | 41 (15.0%) |
| 3-Person Household | 74 (74.0%) | 26 (26.0%) |
| 4+ Person Household | 151 (86.3%) | 24 (13.7%) |
| Total Housing Units | 527 (79.8%) | 133 (20.2%) |
Occupancy by Educational Attainment in Farley
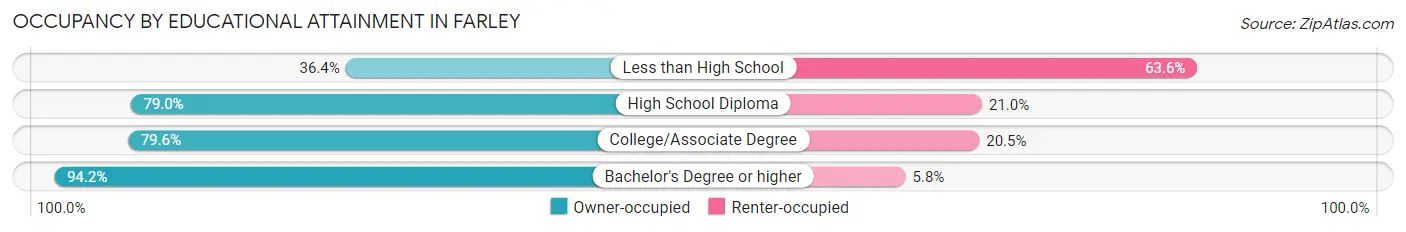
| Household Size | Owner-occupied | Renter-occupied |
| Less than High School | 12 (36.4%) | 21 (63.6%) |
| High School Diploma | 192 (79.0%) | 51 (21.0%) |
| College/Associate Degree | 210 (79.5%) | 54 (20.4%) |
| Bachelor's Degree or higher | 113 (94.2%) | 7 (5.8%) |
Occupancy by Age of Householder in Farley
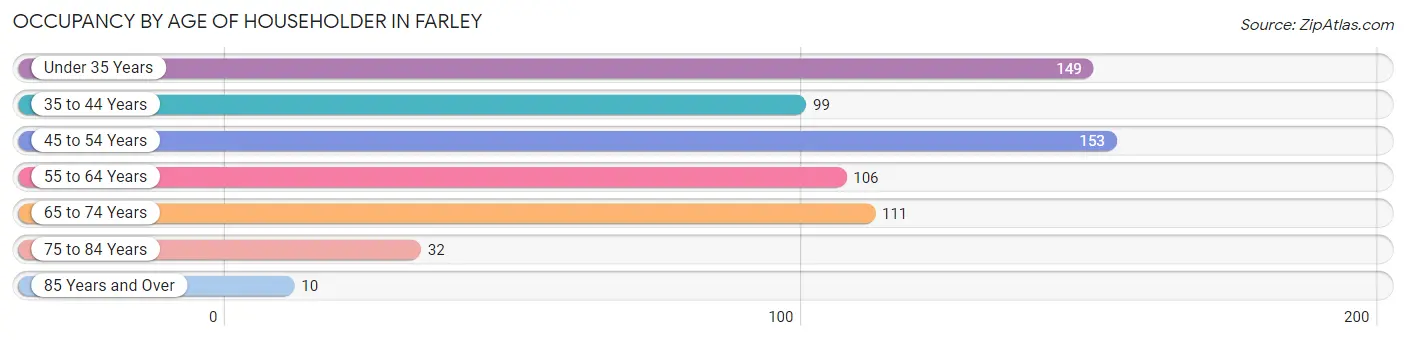
| Age Bracket | # Households | % Households |
| Under 35 Years | 149 | 22.6% |
| 35 to 44 Years | 99 | 15.0% |
| 45 to 54 Years | 153 | 23.2% |
| 55 to 64 Years | 106 | 16.1% |
| 65 to 74 Years | 111 | 16.8% |
| 75 to 84 Years | 32 | 4.9% |
| 85 Years and Over | 10 | 1.5% |
| Total | 660 | 100.0% |
Housing Finances in Farley
Median Income by Occupancy in Farley
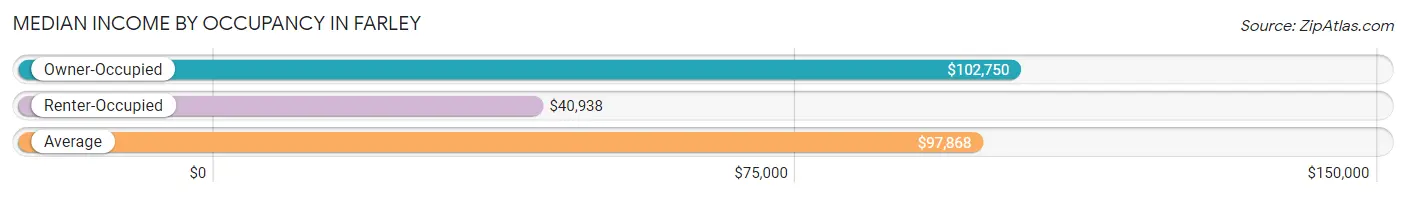
| Occupancy Type | # Households | Median Income |
| Owner-Occupied | 527 (79.8%) | $102,750 |
| Renter-Occupied | 133 (20.2%) | $40,938 |
| Average | 660 (100.0%) | $97,868 |
Occupancy by Householder Income Bracket in Farley
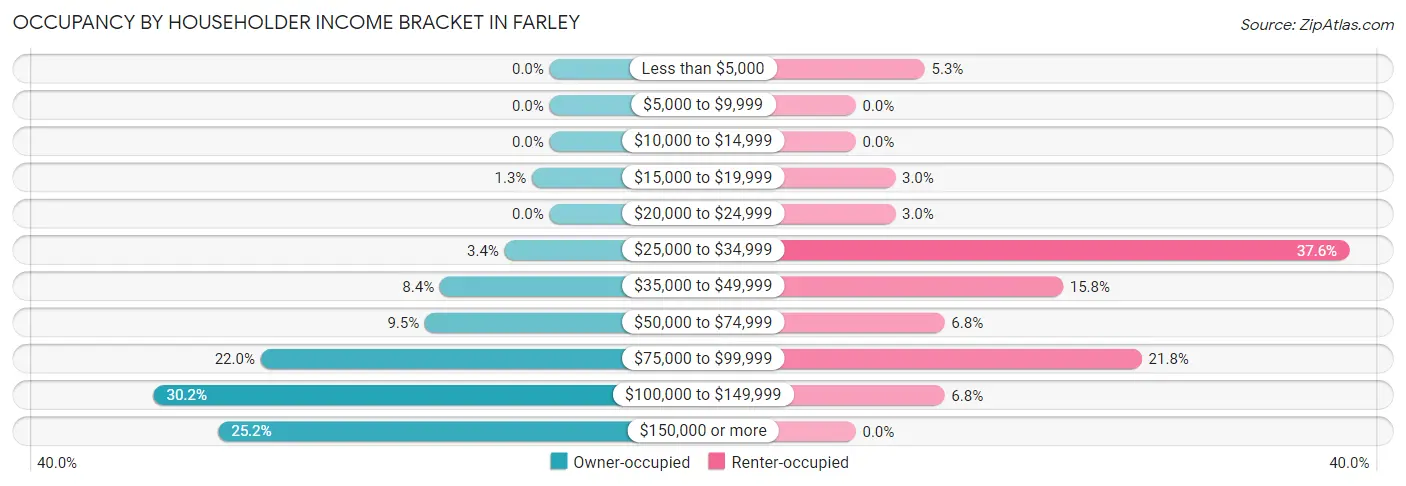
| Income Bracket | Owner-occupied | Renter-occupied |
| Less than $5,000 | 0 (0.0%) | 7 (5.3%) |
| $5,000 to $9,999 | 0 (0.0%) | 0 (0.0%) |
| $10,000 to $14,999 | 0 (0.0%) | 0 (0.0%) |
| $15,000 to $19,999 | 7 (1.3%) | 4 (3.0%) |
| $20,000 to $24,999 | 0 (0.0%) | 4 (3.0%) |
| $25,000 to $34,999 | 18 (3.4%) | 50 (37.6%) |
| $35,000 to $49,999 | 44 (8.4%) | 21 (15.8%) |
| $50,000 to $74,999 | 50 (9.5%) | 9 (6.8%) |
| $75,000 to $99,999 | 116 (22.0%) | 29 (21.8%) |
| $100,000 to $149,999 | 159 (30.2%) | 9 (6.8%) |
| $150,000 or more | 133 (25.2%) | 0 (0.0%) |
| Total | 527 (100.0%) | 133 (100.0%) |
Monthly Housing Cost Tiers in Farley
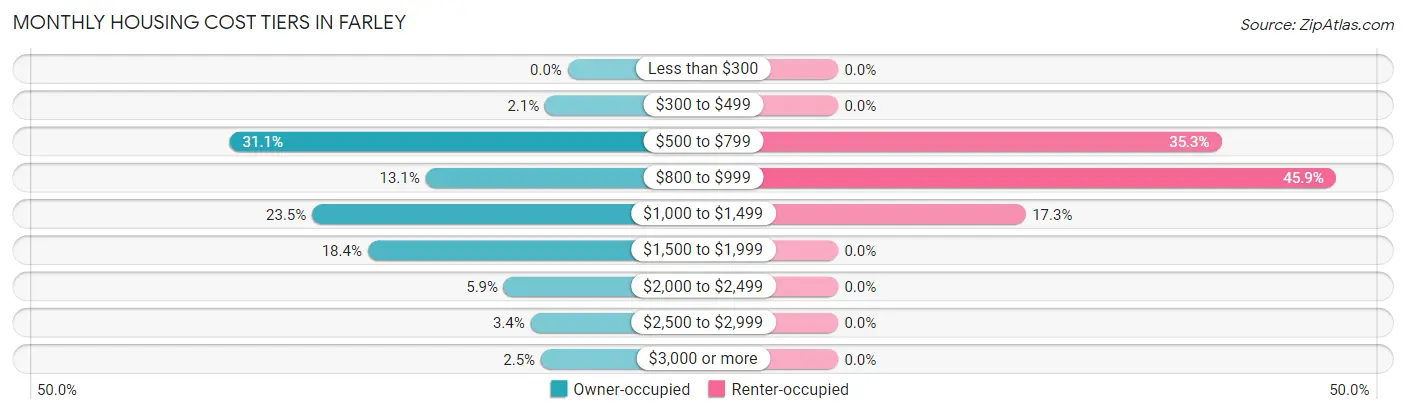
| Monthly Cost | Owner-occupied | Renter-occupied |
| Less than $300 | 0 (0.0%) | 0 (0.0%) |
| $300 to $499 | 11 (2.1%) | 0 (0.0%) |
| $500 to $799 | 164 (31.1%) | 47 (35.3%) |
| $800 to $999 | 69 (13.1%) | 61 (45.9%) |
| $1,000 to $1,499 | 124 (23.5%) | 23 (17.3%) |
| $1,500 to $1,999 | 97 (18.4%) | 0 (0.0%) |
| $2,000 to $2,499 | 31 (5.9%) | 0 (0.0%) |
| $2,500 to $2,999 | 18 (3.4%) | 0 (0.0%) |
| $3,000 or more | 13 (2.5%) | 0 (0.0%) |
| Total | 527 (100.0%) | 133 (100.0%) |
Physical Housing Characteristics in Farley
Housing Structures in Farley
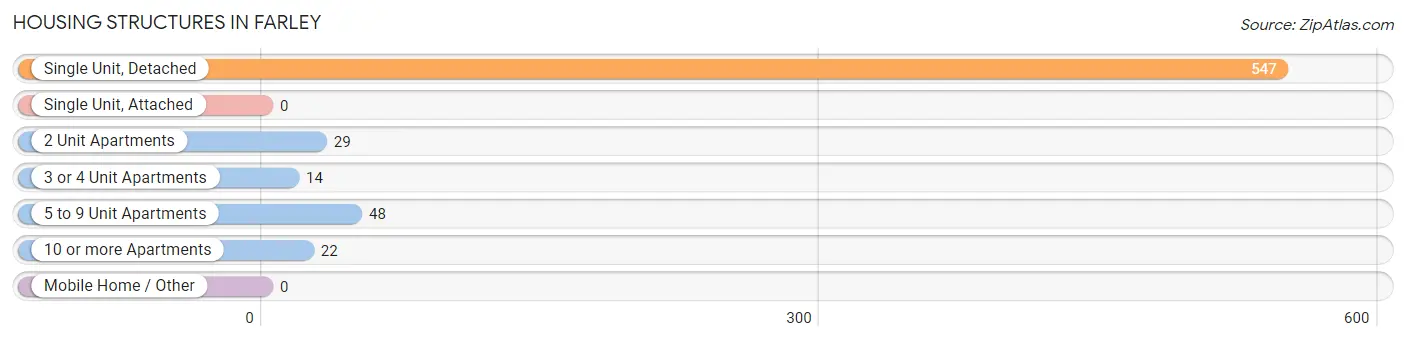
| Structure Type | # Housing Units | % Housing Units |
| Single Unit, Detached | 547 | 82.9% |
| Single Unit, Attached | 0 | 0.0% |
| 2 Unit Apartments | 29 | 4.4% |
| 3 or 4 Unit Apartments | 14 | 2.1% |
| 5 to 9 Unit Apartments | 48 | 7.3% |
| 10 or more Apartments | 22 | 3.3% |
| Mobile Home / Other | 0 | 0.0% |
| Total | 660 | 100.0% |
Housing Structures by Occupancy in Farley
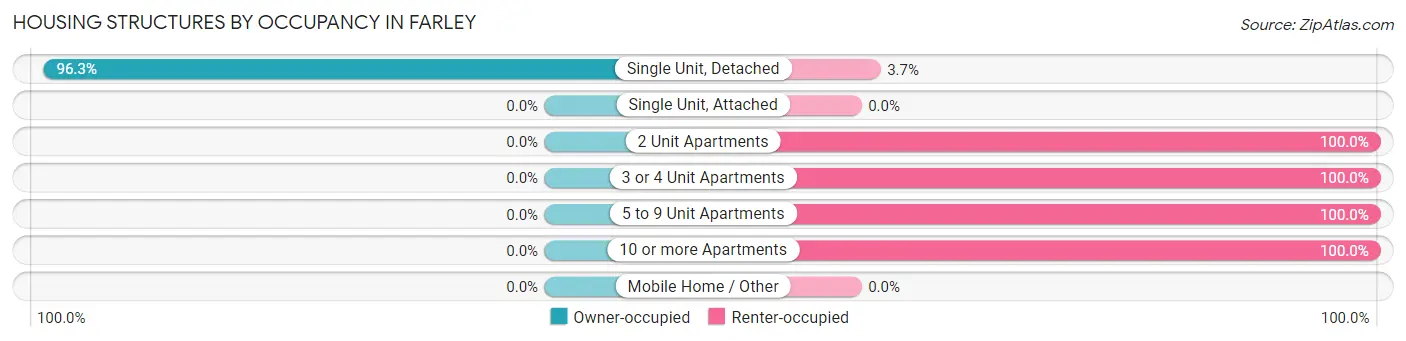
| Structure Type | Owner-occupied | Renter-occupied |
| Single Unit, Detached | 527 (96.3%) | 20 (3.7%) |
| Single Unit, Attached | 0 (0.0%) | 0 (0.0%) |
| 2 Unit Apartments | 0 (0.0%) | 29 (100.0%) |
| 3 or 4 Unit Apartments | 0 (0.0%) | 14 (100.0%) |
| 5 to 9 Unit Apartments | 0 (0.0%) | 48 (100.0%) |
| 10 or more Apartments | 0 (0.0%) | 22 (100.0%) |
| Mobile Home / Other | 0 (0.0%) | 0 (0.0%) |
| Total | 527 (79.8%) | 133 (20.2%) |
Housing Structures by Number of Rooms in Farley
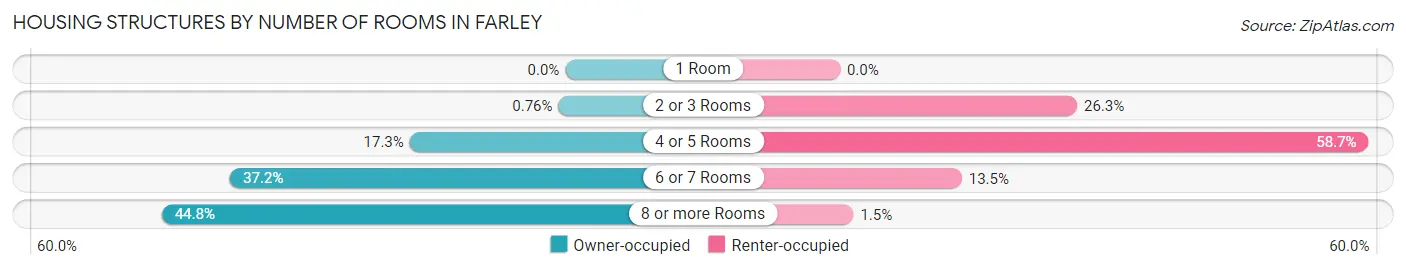
| Number of Rooms | Owner-occupied | Renter-occupied |
| 1 Room | 0 (0.0%) | 0 (0.0%) |
| 2 or 3 Rooms | 4 (0.8%) | 35 (26.3%) |
| 4 or 5 Rooms | 91 (17.3%) | 78 (58.7%) |
| 6 or 7 Rooms | 196 (37.2%) | 18 (13.5%) |
| 8 or more Rooms | 236 (44.8%) | 2 (1.5%) |
| Total | 527 (100.0%) | 133 (100.0%) |
Housing Structure by Heating Type in Farley
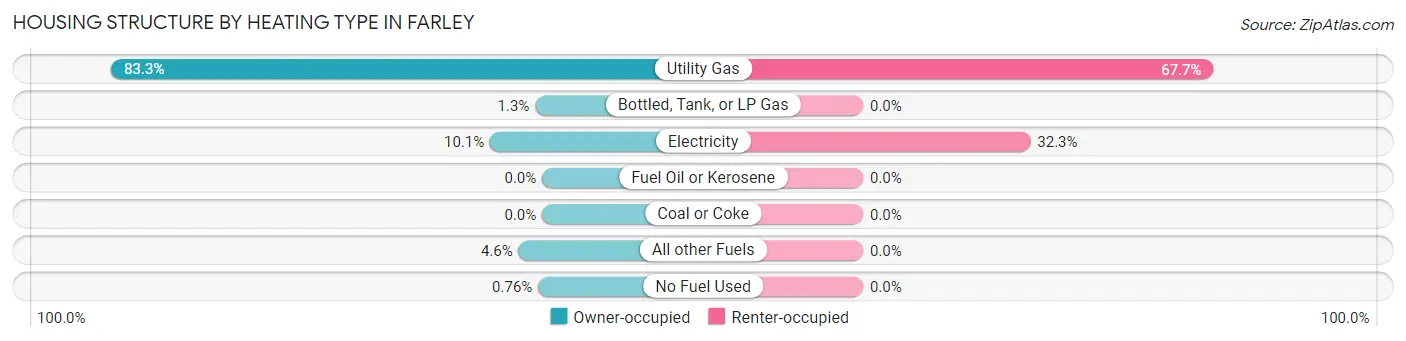
| Heating Type | Owner-occupied | Renter-occupied |
| Utility Gas | 439 (83.3%) | 90 (67.7%) |
| Bottled, Tank, or LP Gas | 7 (1.3%) | 0 (0.0%) |
| Electricity | 53 (10.1%) | 43 (32.3%) |
| Fuel Oil or Kerosene | 0 (0.0%) | 0 (0.0%) |
| Coal or Coke | 0 (0.0%) | 0 (0.0%) |
| All other Fuels | 24 (4.5%) | 0 (0.0%) |
| No Fuel Used | 4 (0.8%) | 0 (0.0%) |
| Total | 527 (100.0%) | 133 (100.0%) |
Household Vehicle Usage in Farley
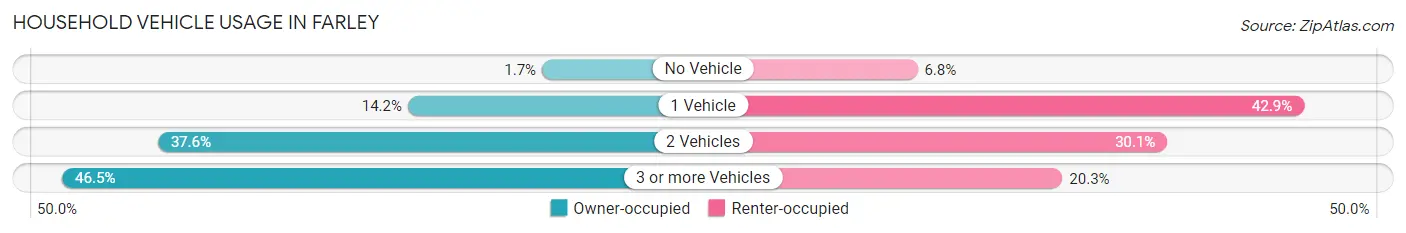
| Vehicles per Household | Owner-occupied | Renter-occupied |
| No Vehicle | 9 (1.7%) | 9 (6.8%) |
| 1 Vehicle | 75 (14.2%) | 57 (42.9%) |
| 2 Vehicles | 198 (37.6%) | 40 (30.1%) |
| 3 or more Vehicles | 245 (46.5%) | 27 (20.3%) |
| Total | 527 (100.0%) | 133 (100.0%) |
Real Estate & Mortgages in Farley
Real Estate and Mortgage Overview in Farley
| Characteristic | Without Mortgage | With Mortgage |
| Housing Units | 210 | 317 |
| Median Property Value | $224,100 | $215,200 |
| Median Household Income | $98,365 | $73 |
| Monthly Housing Costs | $655 | $13 |
| Real Estate Taxes | $3,190 | $2 |
Property Value by Mortgage Status in Farley
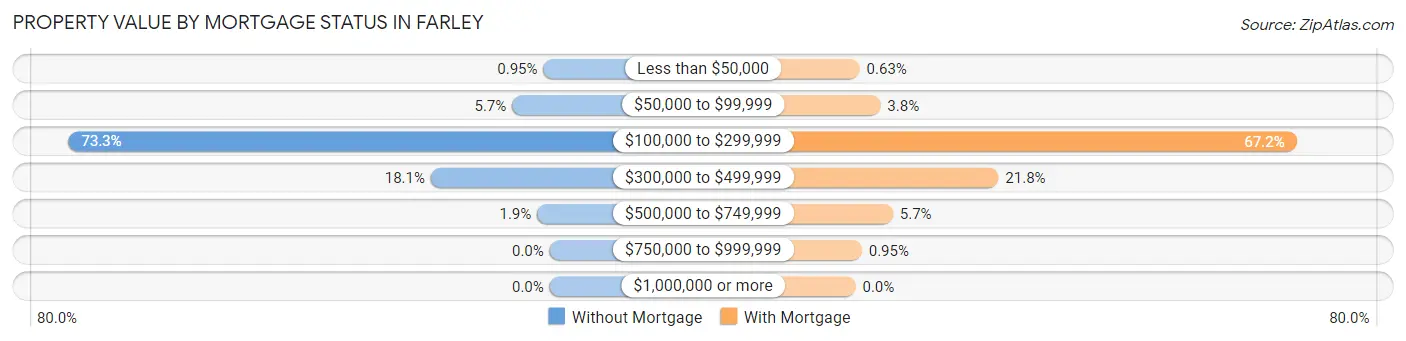
| Property Value | Without Mortgage | With Mortgage |
| Less than $50,000 | 2 (0.9%) | 2 (0.6%) |
| $50,000 to $99,999 | 12 (5.7%) | 12 (3.8%) |
| $100,000 to $299,999 | 154 (73.3%) | 213 (67.2%) |
| $300,000 to $499,999 | 38 (18.1%) | 69 (21.8%) |
| $500,000 to $749,999 | 4 (1.9%) | 18 (5.7%) |
| $750,000 to $999,999 | 0 (0.0%) | 3 (0.9%) |
| $1,000,000 or more | 0 (0.0%) | 0 (0.0%) |
| Total | 210 (100.0%) | 317 (100.0%) |
Household Income by Mortgage Status in Farley
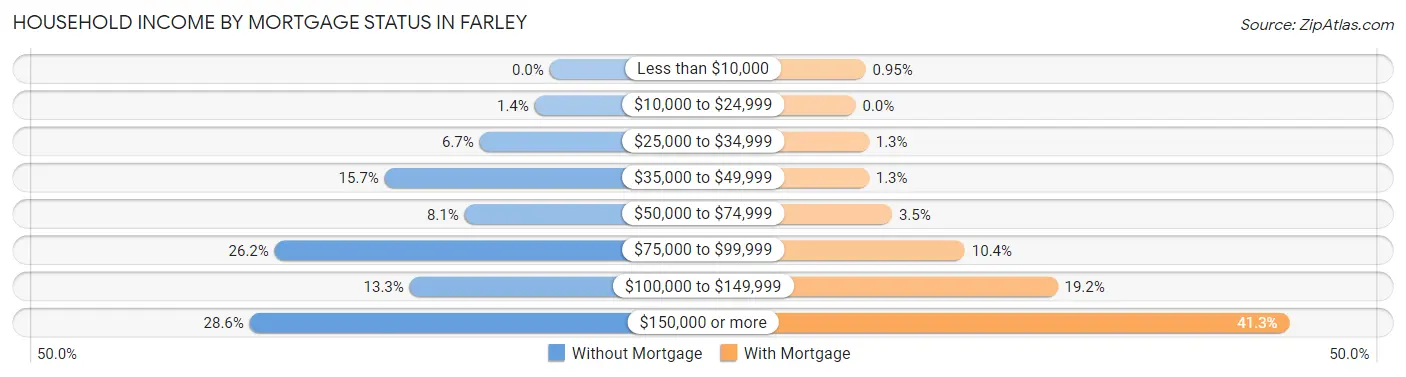
| Household Income | Without Mortgage | With Mortgage |
| Less than $10,000 | 0 (0.0%) | 3 (0.9%) |
| $10,000 to $24,999 | 3 (1.4%) | 0 (0.0%) |
| $25,000 to $34,999 | 14 (6.7%) | 4 (1.3%) |
| $35,000 to $49,999 | 33 (15.7%) | 4 (1.3%) |
| $50,000 to $74,999 | 17 (8.1%) | 11 (3.5%) |
| $75,000 to $99,999 | 55 (26.2%) | 33 (10.4%) |
| $100,000 to $149,999 | 28 (13.3%) | 61 (19.2%) |
| $150,000 or more | 60 (28.6%) | 131 (41.3%) |
| Total | 210 (100.0%) | 317 (100.0%) |
Property Value to Household Income Ratio in Farley
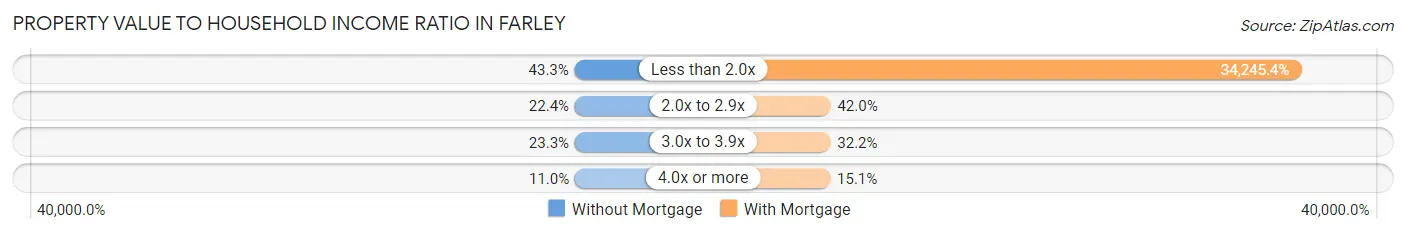
| Value-to-Income Ratio | Without Mortgage | With Mortgage |
| Less than 2.0x | 91 (43.3%) | 108,558 (34,245.4%) |
| 2.0x to 2.9x | 47 (22.4%) | 133 (42.0%) |
| 3.0x to 3.9x | 49 (23.3%) | 102 (32.2%) |
| 4.0x or more | 23 (11.0%) | 48 (15.1%) |
| Total | 210 (100.0%) | 317 (100.0%) |
Real Estate Taxes by Mortgage Status in Farley
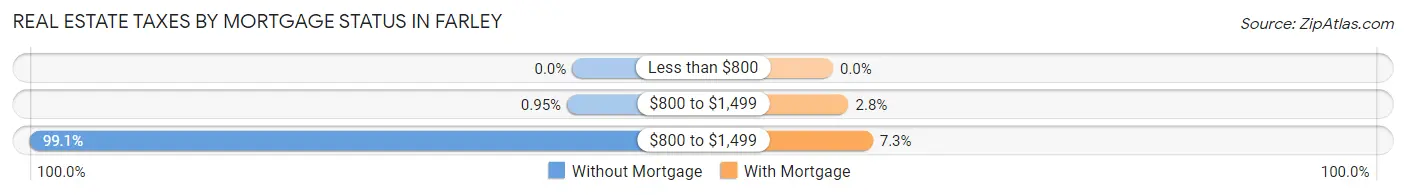
| Property Taxes | Without Mortgage | With Mortgage |
| Less than $800 | 0 (0.0%) | 0 (0.0%) |
| $800 to $1,499 | 2 (0.9%) | 9 (2.8%) |
| $800 to $1,499 | 208 (99.1%) | 23 (7.3%) |
| Total | 210 (100.0%) | 317 (100.0%) |
Health & Disability in Farley
Health Insurance Coverage by Age in Farley
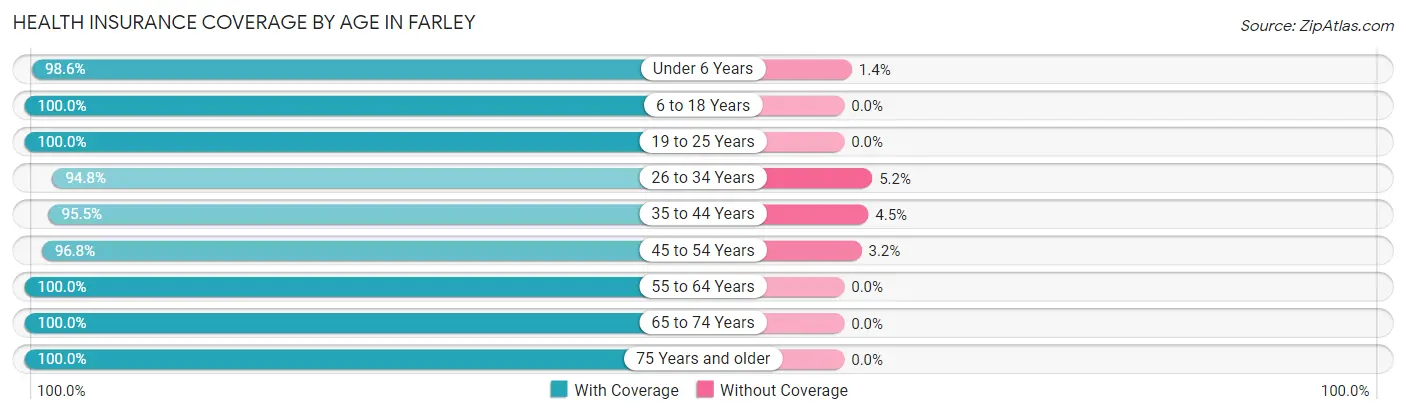
| Age Bracket | With Coverage | Without Coverage |
| Under 6 Years | 209 (98.6%) | 3 (1.4%) |
| 6 to 18 Years | 345 (100.0%) | 0 (0.0%) |
| 19 to 25 Years | 168 (100.0%) | 0 (0.0%) |
| 26 to 34 Years | 182 (94.8%) | 10 (5.2%) |
| 35 to 44 Years | 170 (95.5%) | 8 (4.5%) |
| 45 to 54 Years | 271 (96.8%) | 9 (3.2%) |
| 55 to 64 Years | 206 (100.0%) | 0 (0.0%) |
| 65 to 74 Years | 175 (100.0%) | 0 (0.0%) |
| 75 Years and older | 77 (100.0%) | 0 (0.0%) |
| Total | 1,803 (98.4%) | 30 (1.6%) |
Health Insurance Coverage by Citizenship Status in Farley
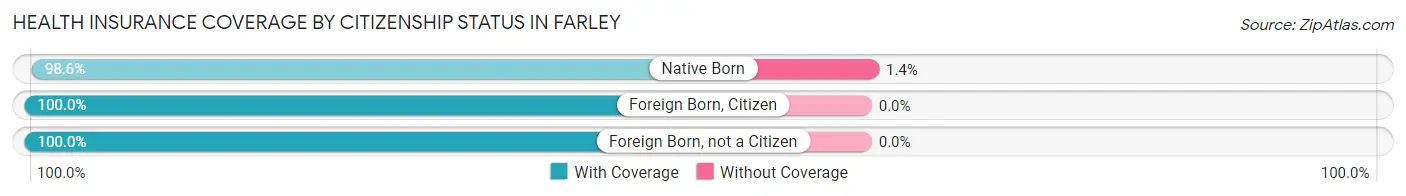
| Citizenship Status | With Coverage | Without Coverage |
| Native Born | 209 (98.6%) | 3 (1.4%) |
| Foreign Born, Citizen | 345 (100.0%) | 0 (0.0%) |
| Foreign Born, not a Citizen | 168 (100.0%) | 0 (0.0%) |
Health Insurance Coverage by Household Income in Farley
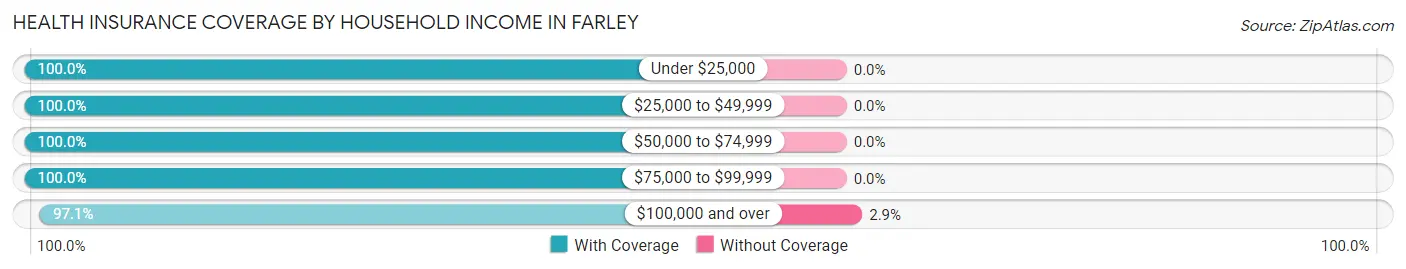
| Household Income | With Coverage | Without Coverage |
| Under $25,000 | 60 (100.0%) | 0 (0.0%) |
| $25,000 to $49,999 | 260 (100.0%) | 0 (0.0%) |
| $50,000 to $74,999 | 118 (100.0%) | 0 (0.0%) |
| $75,000 to $99,999 | 357 (100.0%) | 0 (0.0%) |
| $100,000 and over | 1,004 (97.1%) | 30 (2.9%) |
Public vs Private Health Insurance Coverage by Age in Farley
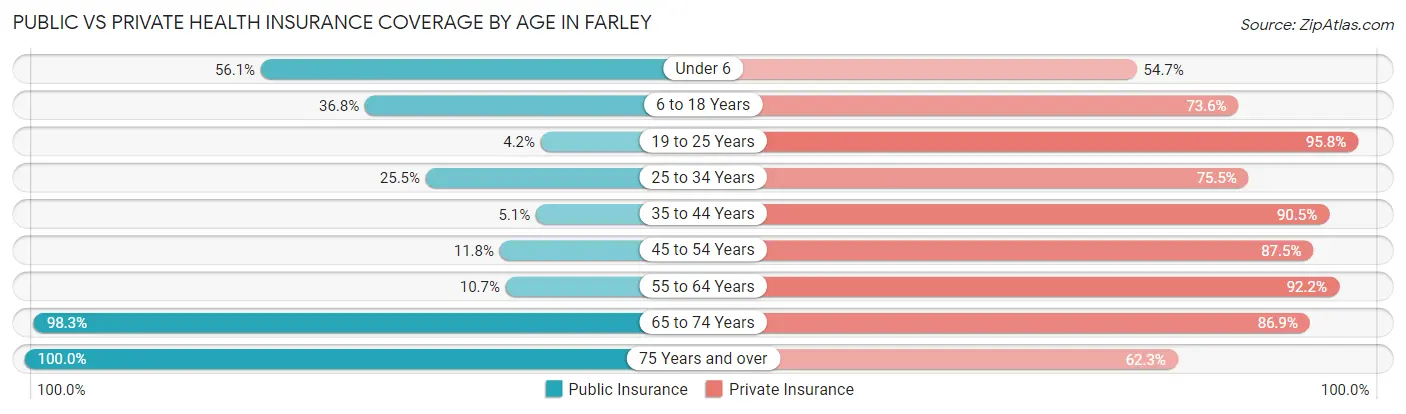
| Age Bracket | Public Insurance | Private Insurance |
| Under 6 | 119 (56.1%) | 116 (54.7%) |
| 6 to 18 Years | 127 (36.8%) | 254 (73.6%) |
| 19 to 25 Years | 7 (4.2%) | 161 (95.8%) |
| 25 to 34 Years | 49 (25.5%) | 145 (75.5%) |
| 35 to 44 Years | 9 (5.1%) | 161 (90.4%) |
| 45 to 54 Years | 33 (11.8%) | 245 (87.5%) |
| 55 to 64 Years | 22 (10.7%) | 190 (92.2%) |
| 65 to 74 Years | 172 (98.3%) | 152 (86.9%) |
| 75 Years and over | 77 (100.0%) | 48 (62.3%) |
| Total | 615 (33.6%) | 1,472 (80.3%) |
Disability Status by Sex by Age in Farley
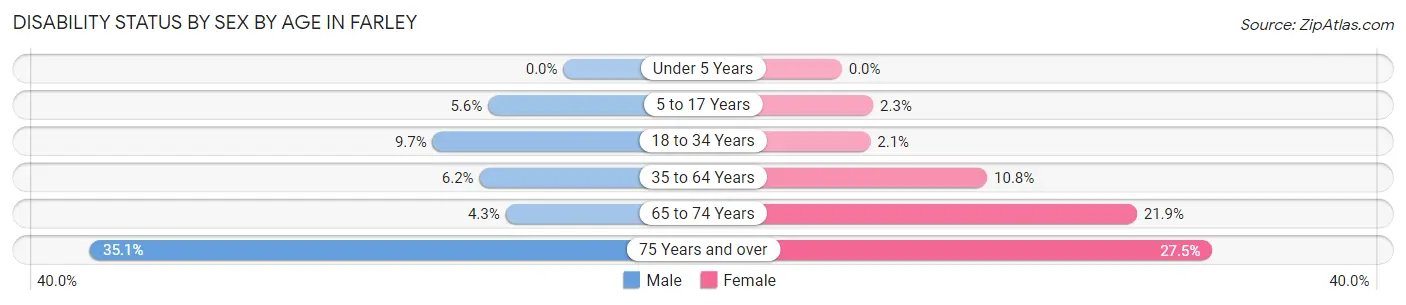
| Age Bracket | Male | Female |
| Under 5 Years | 0 (0.0%) | 0 (0.0%) |
| 5 to 17 Years | 8 (5.6%) | 4 (2.3%) |
| 18 to 34 Years | 17 (9.7%) | 5 (2.1%) |
| 35 to 64 Years | 20 (6.2%) | 37 (10.8%) |
| 65 to 74 Years | 3 (4.3%) | 23 (21.9%) |
| 75 Years and over | 13 (35.1%) | 11 (27.5%) |
Disability Class by Sex by Age in Farley
Disability Class: Hearing Difficulty
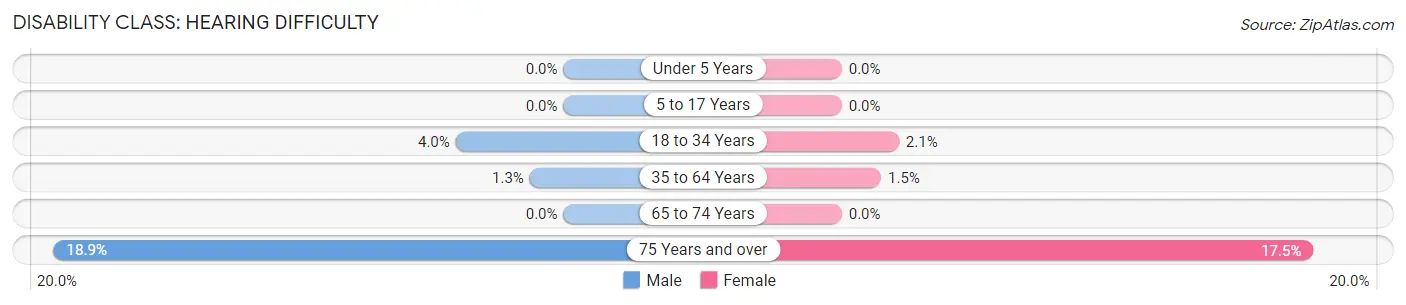
| Age Bracket | Male | Female |
| Under 5 Years | 0 (0.0%) | 0 (0.0%) |
| 5 to 17 Years | 0 (0.0%) | 0 (0.0%) |
| 18 to 34 Years | 7 (4.0%) | 5 (2.1%) |
| 35 to 64 Years | 4 (1.3%) | 5 (1.5%) |
| 65 to 74 Years | 0 (0.0%) | 0 (0.0%) |
| 75 Years and over | 7 (18.9%) | 7 (17.5%) |
Disability Class: Vision Difficulty
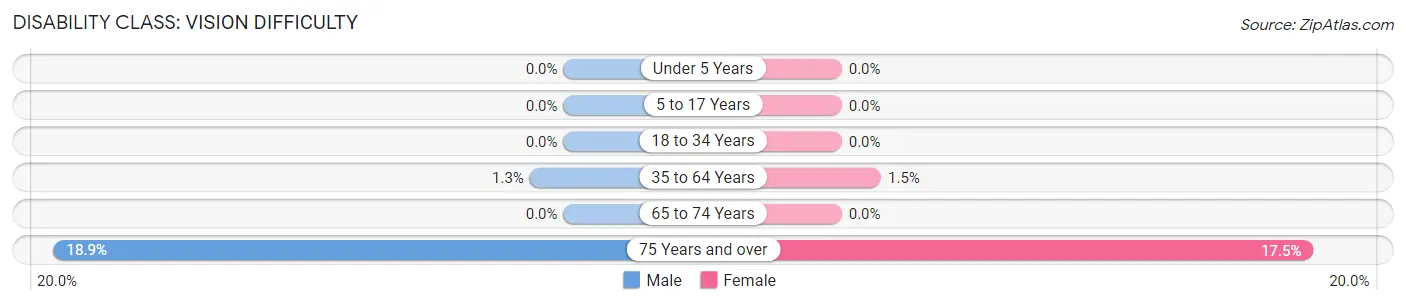
| Age Bracket | Male | Female |
| Under 5 Years | 0 (0.0%) | 0 (0.0%) |
| 5 to 17 Years | 0 (0.0%) | 0 (0.0%) |
| 18 to 34 Years | 0 (0.0%) | 0 (0.0%) |
| 35 to 64 Years | 4 (1.3%) | 5 (1.5%) |
| 65 to 74 Years | 0 (0.0%) | 0 (0.0%) |
| 75 Years and over | 7 (18.9%) | 7 (17.5%) |
Disability Class: Cognitive Difficulty
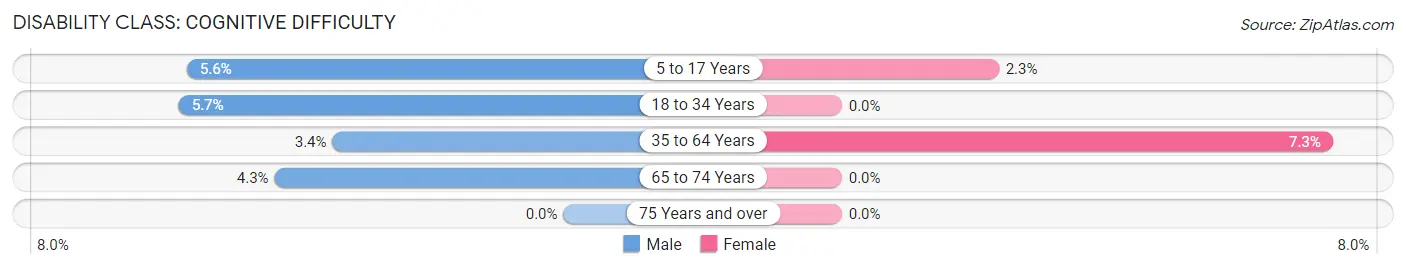
| Age Bracket | Male | Female |
| 5 to 17 Years | 8 (5.6%) | 4 (2.3%) |
| 18 to 34 Years | 10 (5.7%) | 0 (0.0%) |
| 35 to 64 Years | 11 (3.4%) | 25 (7.3%) |
| 65 to 74 Years | 3 (4.3%) | 0 (0.0%) |
| 75 Years and over | 0 (0.0%) | 0 (0.0%) |
Disability Class: Ambulatory Difficulty
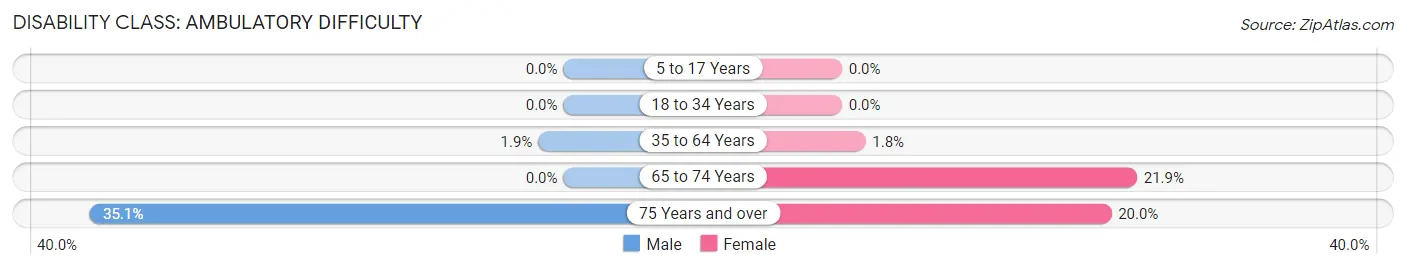
| Age Bracket | Male | Female |
| 5 to 17 Years | 0 (0.0%) | 0 (0.0%) |
| 18 to 34 Years | 0 (0.0%) | 0 (0.0%) |
| 35 to 64 Years | 6 (1.9%) | 6 (1.8%) |
| 65 to 74 Years | 0 (0.0%) | 23 (21.9%) |
| 75 Years and over | 13 (35.1%) | 8 (20.0%) |
Disability Class: Self-Care Difficulty
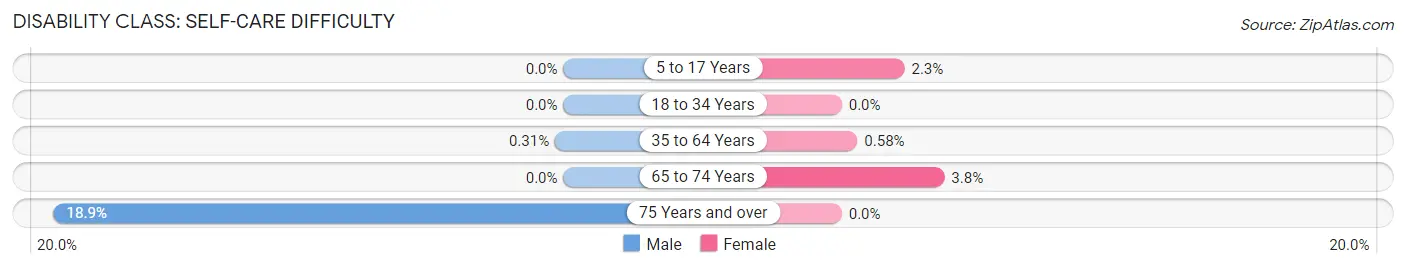
| Age Bracket | Male | Female |
| 5 to 17 Years | 0 (0.0%) | 4 (2.3%) |
| 18 to 34 Years | 0 (0.0%) | 0 (0.0%) |
| 35 to 64 Years | 1 (0.3%) | 2 (0.6%) |
| 65 to 74 Years | 0 (0.0%) | 4 (3.8%) |
| 75 Years and over | 7 (18.9%) | 0 (0.0%) |
Technology Access in Farley
Computing Device Access in Farley
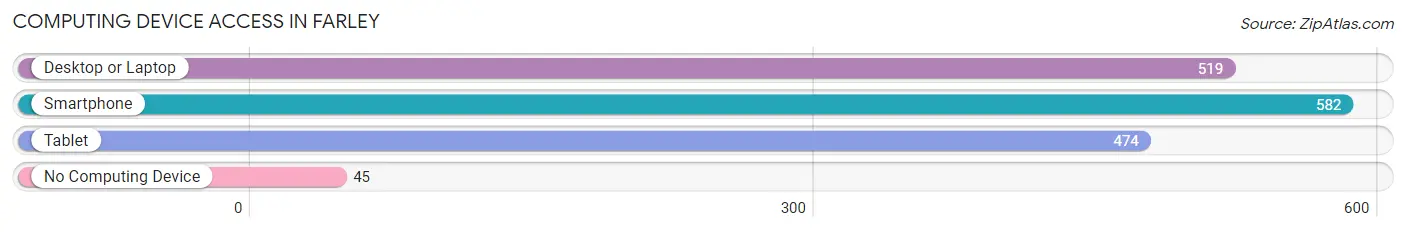
| Device Type | # Households | % Households |
| Desktop or Laptop | 519 | 78.6% |
| Smartphone | 582 | 88.2% |
| Tablet | 474 | 71.8% |
| No Computing Device | 45 | 6.8% |
| Total | 660 | 100.0% |
Internet Access in Farley
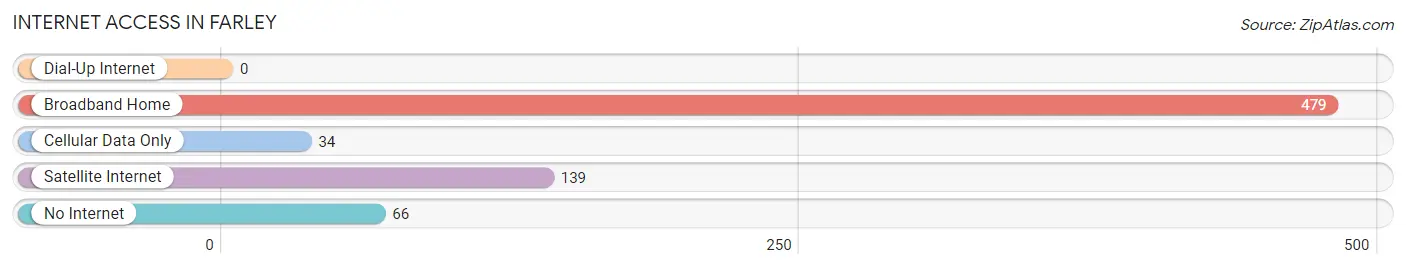
| Internet Type | # Households | % Households |
| Dial-Up Internet | 0 | 0.0% |
| Broadband Home | 479 | 72.6% |
| Cellular Data Only | 34 | 5.1% |
| Satellite Internet | 139 | 21.1% |
| No Internet | 66 | 10.0% |
| Total | 660 | 100.0% |
Farley Summary
Farley, Iowa is a small city located in Dubuque County, Iowa. It is situated on the banks of the Mississippi River, just south of the city of Dubuque. Farley has a population of 1,845 people, according to the 2010 census. The city is part of the Dubuque Metropolitan Statistical Area.
History
Farley was founded in 1855 by a group of settlers from the nearby city of Dubuque. The city was named after William Farley, a prominent local businessman. Farley was incorporated in 1872 and has remained a small, rural community ever since.
The city was home to a number of industries in the late 19th and early 20th centuries, including a flour mill, a brickyard, and a sawmill. The city also had a number of small businesses, including a general store, a blacksmith shop, and a hotel.
Geography
Farley is located in the rolling hills of the Driftless Area of Iowa. The city is situated on the banks of the Mississippi River, just south of the city of Dubuque. The city is surrounded by farmland and is located near the cities of Dyersville and Cascade.
The city has a total area of 1.2 square miles, all of which is land. The city has a humid continental climate, with cold winters and hot, humid summers.
Economy
Farley’s economy is largely based on agriculture and tourism. The city is home to a number of small businesses, including a general store, a hardware store, and a restaurant. The city also has a number of small manufacturing businesses, including a furniture factory and a printing company.
The city is also home to a number of tourist attractions, including the Farley Historical Museum, the Farley Aquatic Center, and the Farley Speedway. The city also hosts a number of annual events, including the Farley Fair and the Farley Festival.
Demographics
According to the 2010 census, Farley has a population of 1,845 people. The city has a median household income of $45,000 and a median home value of $125,000. The city is predominantly white, with 92.3% of the population identifying as white. The city also has a small Hispanic population, with 4.2% of the population identifying as Hispanic or Latino.
The city has a low unemployment rate, with only 4.2% of the population unemployed. The city also has a low poverty rate, with only 8.3% of the population living below the poverty line.
Conclusion
Farley, Iowa is a small city located in Dubuque County, Iowa. It is situated on the banks of the Mississippi River, just south of the city of Dubuque. Farley has a population of 1,845 people, according to the 2010 census. The city is part of the Dubuque Metropolitan Statistical Area. Farley’s economy is largely based on agriculture and tourism, and the city is home to a number of small businesses and tourist attractions. The city has a predominantly white population, with a small Hispanic population. The city has a low unemployment rate and a low poverty rate.
Common Questions
What is the Total Population of Farley?
Total Population of Farley is 1,833.
What is the Total Male Population of Farley?
Total Male Population of Farley is 885.
What is the Total Female Population of Farley?
Total Female Population of Farley is 948.
What is the Ratio of Males per 100 Females in Farley?
There are 93.35 Males per 100 Females in Farley.
What is the Ratio of Females per 100 Males in Farley?
There are 107.12 Females per 100 Males in Farley.
What is the Median Population Age in Farley?
Median Population Age in Farley is 35.0 Years.
What is the Average Family Size in Farley
Average Family Size in Farley is 3.1 People.
What is the Average Household Size in Farley
Average Household Size in Farley is 2.8 People.
What is Per Capita Income in Farley?
Per Capita income in Farley is $39,077.
What is the Median Family Income in Farley?
Median Family Income in Farley is $100,648.
What is the Median Household income in Farley?
Median Household Income in Farley is $97,868.
What is Income or Wage Gap in Farley?
Income or Wage Gap in Farley is 40.8%.
Women in Farley earn 59.2 cents for every dollar earned by a man.
What is Inequality or Gini Index in Farley?
Inequality or Gini Index in Farley is 0.36.
How Large is the Labor Force in Farley?
There are 1,023 People in the Labor Forcein in Farley.
What is the Percentage of People in the Labor Force in Farley?
75.2% of People are in the Labor Force in Farley.
What is the Unemployment Rate in Farley?
Unemployment Rate in Farley is 4.8%.