Westwood, IA Map & Demographics
Westwood Map
Westwood Overview
$50,254
PER CAPITA INCOME
$111,250
AVG FAMILY INCOME
$100,625
AVG HOUSEHOLD INCOME
22.4%
WAGE / INCOME GAP [ % ]
77.6¢/ $1
WAGE / INCOME GAP [ $ ]
0.24
INEQUALITY / GINI INDEX
84
TOTAL POPULATION
39
MALE POPULATION
45
FEMALE POPULATION
86.67
MALES / 100 FEMALES
115.38
FEMALES / 100 MALES
60.8
MEDIAN AGE
2.2
AVG FAMILY SIZE
1.9
AVG HOUSEHOLD SIZE
52
LABOR FORCE [ PEOPLE ]
65.0%
PERCENT IN LABOR FORCE
Income in Westwood
Income Overview in Westwood
Per Capita Income in Westwood is $50,254, while median incomes of families and households are $111,250 and $100,625 respectively.
| Characteristic | Number | Measure |
| Per Capita Income | 84 | $50,254 |
| Median Family Income | 32 | $111,250 |
| Mean Family Income | 32 | $107,325 |
| Median Household Income | 43 | $100,625 |
| Mean Household Income | 43 | $98,279 |
| Income Deficit | 32 | $0 |
| Wage / Income Gap (%) | 84 | 22.39% |
| Wage / Income Gap ($) | 84 | 77.61¢ per $1 |
| Gini / Inequality Index | 84 | 0.24 |
Earnings by Sex in Westwood
Average Earnings in Westwood are $40,000, $41,875 for men and $32,500 for women, a difference of 22.4%.
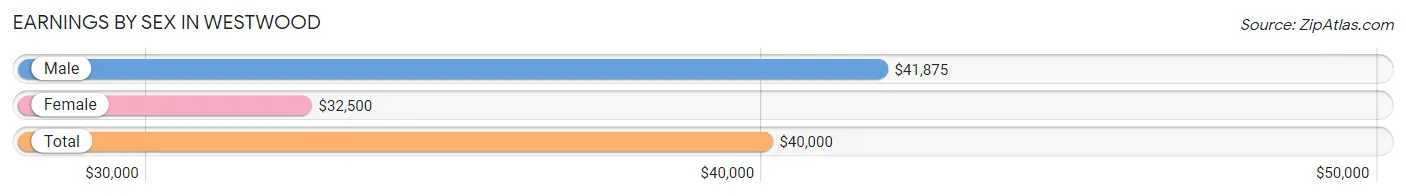
| Sex | Number | Average Earnings |
| Male | 28 (51.8%) | $41,875 |
| Female | 26 (48.1%) | $32,500 |
| Total | 54 (100.0%) | $40,000 |
Earnings by Sex by Income Bracket in Westwood
The most common earnings brackets in Westwood are $75,000 to $99,999 for men (6 | 21.4%) and $25,000 to $29,999 for women (5 | 19.2%).
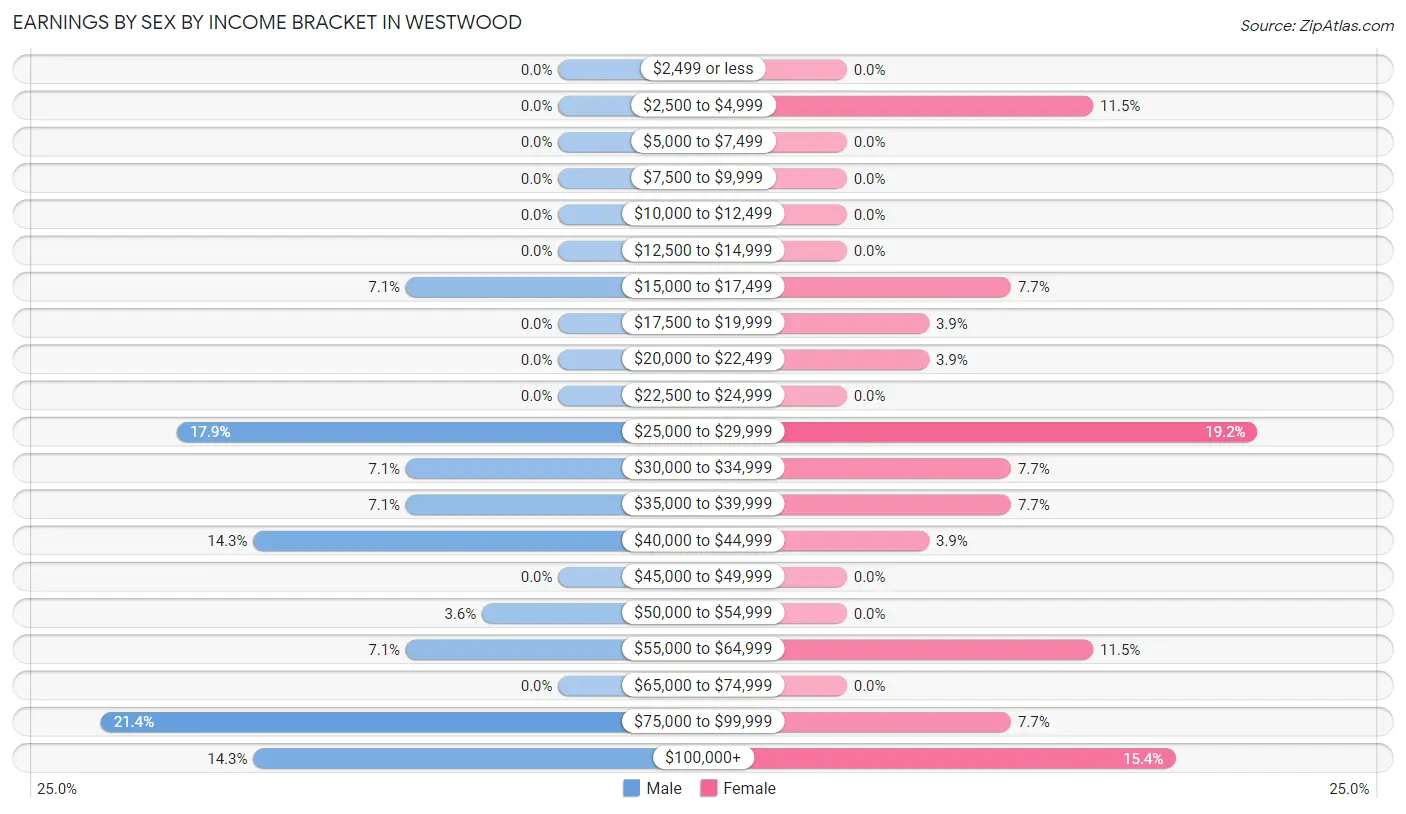
| Income | Male | Female |
| $2,499 or less | 0 (0.0%) | 0 (0.0%) |
| $2,500 to $4,999 | 0 (0.0%) | 3 (11.5%) |
| $5,000 to $7,499 | 0 (0.0%) | 0 (0.0%) |
| $7,500 to $9,999 | 0 (0.0%) | 0 (0.0%) |
| $10,000 to $12,499 | 0 (0.0%) | 0 (0.0%) |
| $12,500 to $14,999 | 0 (0.0%) | 0 (0.0%) |
| $15,000 to $17,499 | 2 (7.1%) | 2 (7.7%) |
| $17,500 to $19,999 | 0 (0.0%) | 1 (3.8%) |
| $20,000 to $22,499 | 0 (0.0%) | 1 (3.8%) |
| $22,500 to $24,999 | 0 (0.0%) | 0 (0.0%) |
| $25,000 to $29,999 | 5 (17.9%) | 5 (19.2%) |
| $30,000 to $34,999 | 2 (7.1%) | 2 (7.7%) |
| $35,000 to $39,999 | 2 (7.1%) | 2 (7.7%) |
| $40,000 to $44,999 | 4 (14.3%) | 1 (3.8%) |
| $45,000 to $49,999 | 0 (0.0%) | 0 (0.0%) |
| $50,000 to $54,999 | 1 (3.6%) | 0 (0.0%) |
| $55,000 to $64,999 | 2 (7.1%) | 3 (11.5%) |
| $65,000 to $74,999 | 0 (0.0%) | 0 (0.0%) |
| $75,000 to $99,999 | 6 (21.4%) | 2 (7.7%) |
| $100,000+ | 4 (14.3%) | 4 (15.4%) |
| Total | 28 (100.0%) | 26 (100.0%) |
Earnings by Sex by Educational Attainment in Westwood
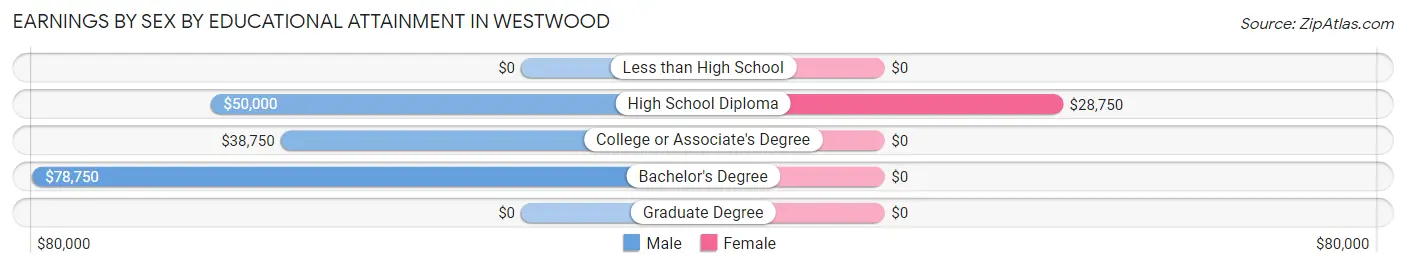
| Educational Attainment | Male Income | Female Income |
| Less than High School | - | - |
| High School Diploma | $50,000 | $28,750 |
| College or Associate's Degree | $38,750 | $0 |
| Bachelor's Degree | $78,750 | $0 |
| Graduate Degree | - | - |
| Total | $46,250 | $0 |
Family Income in Westwood
Family Income Brackets in Westwood
According to the Westwood family income data, there are 10 families falling into the $100,000 to $149,999 income range, which is the most common income bracket and makes up 31.2% of all families.
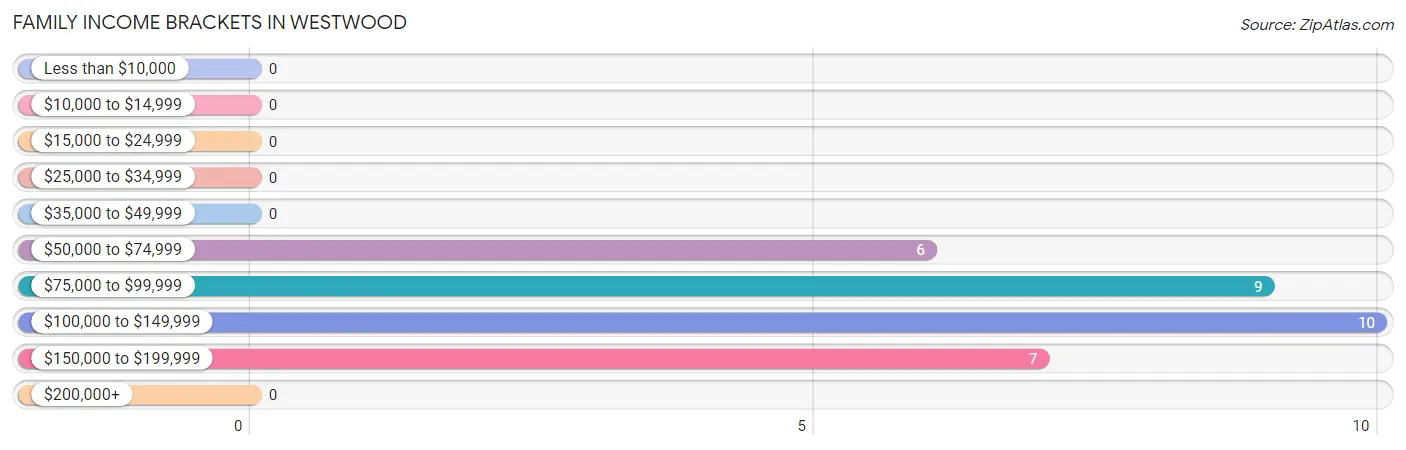
| Income Bracket | # Families | % Families |
| Less than $10,000 | 0 | 0.0% |
| $10,000 to $14,999 | 0 | 0.0% |
| $15,000 to $24,999 | 0 | 0.0% |
| $25,000 to $34,999 | 0 | 0.0% |
| $35,000 to $49,999 | 0 | 0.0% |
| $50,000 to $74,999 | 6 | 18.8% |
| $75,000 to $99,999 | 9 | 28.1% |
| $100,000 to $149,999 | 10 | 31.3% |
| $150,000 to $199,999 | 7 | 21.9% |
| $200,000+ | 0 | 0.0% |
Family Income by Famaliy Size in Westwood
3-person families (4 | 12.5%) account for the highest median family income in Westwood with $151,250 per family, while 3-person families (4 | 12.5%) have the highest median income of $50,417 per family member.
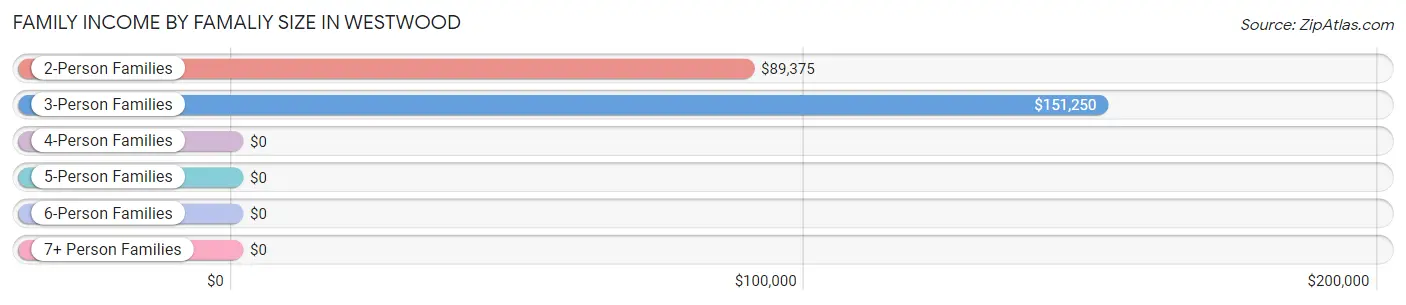
| Income Bracket | # Families | Median Income |
| 2-Person Families | 27 (84.4%) | $89,375 |
| 3-Person Families | 4 (12.5%) | $151,250 |
| 4-Person Families | 1 (3.1%) | $0 |
| 5-Person Families | 0 (0.0%) | $0 |
| 6-Person Families | 0 (0.0%) | $0 |
| 7+ Person Families | 0 (0.0%) | $0 |
| Total | 32 (100.0%) | $111,250 |
Family Income by Number of Earners in Westwood
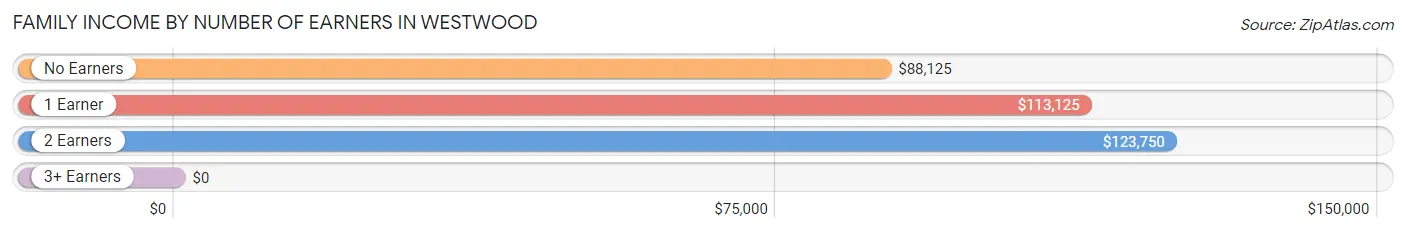
| Number of Earners | # Families | Median Income |
| No Earners | 7 (21.9%) | $88,125 |
| 1 Earner | 7 (21.9%) | $113,125 |
| 2 Earners | 17 (53.1%) | $123,750 |
| 3+ Earners | 1 (3.1%) | $0 |
| Total | 32 (100.0%) | $111,250 |
Household Income in Westwood
Household Income Brackets in Westwood
With 15 households falling in the category, the $100,000 to $149,999 income range is the most frequent in Westwood, accounting for 34.9% of all households.
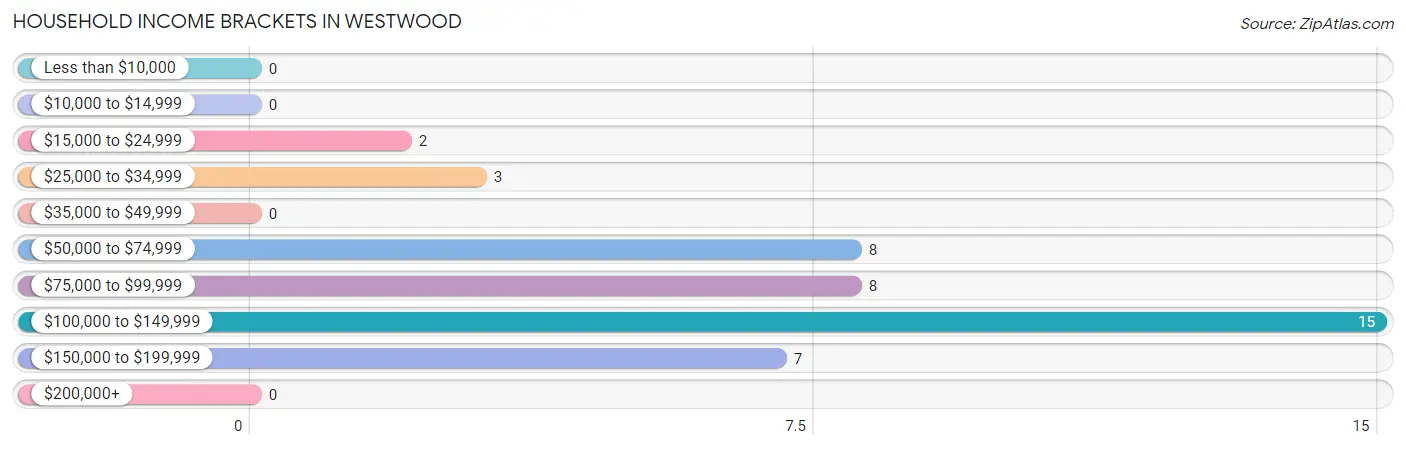
| Income Bracket | # Households | % Households |
| Less than $10,000 | 0 | 0.0% |
| $10,000 to $14,999 | 0 | 0.0% |
| $15,000 to $24,999 | 2 | 4.7% |
| $25,000 to $34,999 | 3 | 7.0% |
| $35,000 to $49,999 | 0 | 0.0% |
| $50,000 to $74,999 | 8 | 18.6% |
| $75,000 to $99,999 | 8 | 18.6% |
| $100,000 to $149,999 | 15 | 34.9% |
| $150,000 to $199,999 | 7 | 16.3% |
| $200,000+ | 0 | 0.0% |
Household Income by Householder Age in Westwood
The median household income in Westwood is $100,625, with the highest median household income of $135,000 found in the 25 to 44 years age bracket for the primary householder. A total of 6 households (14.0%) fall into this category.
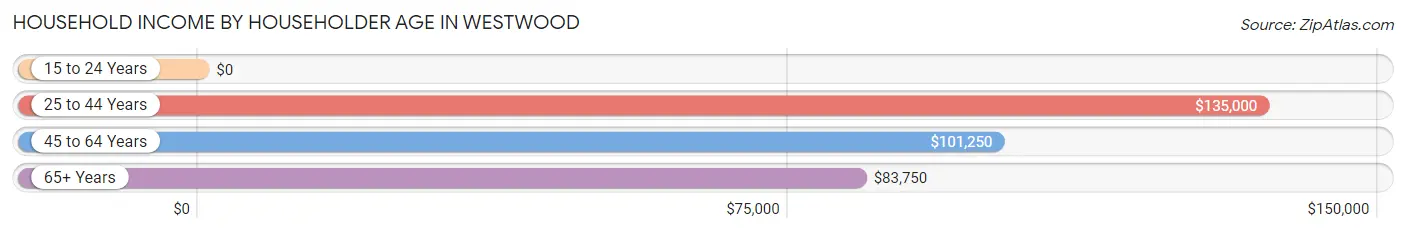
| Income Bracket | # Households | Median Income |
| 15 to 24 Years | 0 (0.0%) | $0 |
| 25 to 44 Years | 6 (14.0%) | $135,000 |
| 45 to 64 Years | 18 (41.9%) | $101,250 |
| 65+ Years | 19 (44.2%) | $83,750 |
| Total | 43 (100.0%) | $100,625 |
Poverty in Westwood
Income Below Poverty by Sex and Age in Westwood
| Age Bracket | Male | Female |
| Under 5 Years | 0 (0.0%) | 0 (0.0%) |
| 5 Years | 0 (0.0%) | 0 (0.0%) |
| 6 to 11 Years | 0 (0.0%) | 0 (0.0%) |
| 12 to 14 Years | 0 (0.0%) | 0 (0.0%) |
| 15 Years | 0 (0.0%) | 0 (0.0%) |
| 16 and 17 Years | 0 (0.0%) | 0 (0.0%) |
| 18 to 24 Years | 0 (0.0%) | 0 (0.0%) |
| 25 to 34 Years | 0 (0.0%) | 0 (0.0%) |
| 35 to 44 Years | 0 (0.0%) | 0 (0.0%) |
| 45 to 54 Years | 0 (0.0%) | 0 (0.0%) |
| 55 to 64 Years | 0 (0.0%) | 0 (0.0%) |
| 65 to 74 Years | 0 (0.0%) | 0 (0.0%) |
| 75 Years and over | 0 (0.0%) | 0 (0.0%) |
| Total | 0 (0.0%) | 0 (0.0%) |
Income Above Poverty by Sex and Age in Westwood
According to the poverty statistics in Westwood, males aged 6 to 11 years and females aged under 5 years are the age groups that are most secure financially, with 100.0% of males and 100.0% of females in these age groups living above the poverty line.
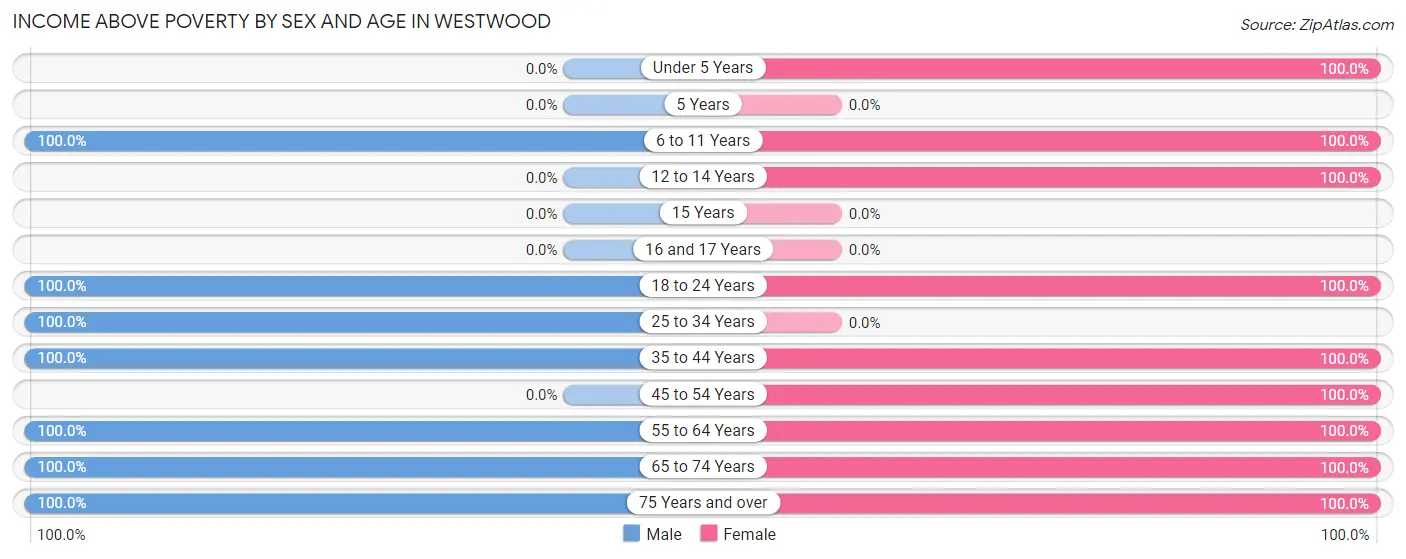
| Age Bracket | Male | Female |
| Under 5 Years | 0 (0.0%) | 1 (100.0%) |
| 5 Years | 0 (0.0%) | 0 (0.0%) |
| 6 to 11 Years | 1 (100.0%) | 1 (100.0%) |
| 12 to 14 Years | 0 (0.0%) | 1 (100.0%) |
| 15 Years | 0 (0.0%) | 0 (0.0%) |
| 16 and 17 Years | 0 (0.0%) | 0 (0.0%) |
| 18 to 24 Years | 2 (100.0%) | 4 (100.0%) |
| 25 to 34 Years | 4 (100.0%) | 0 (0.0%) |
| 35 to 44 Years | 4 (100.0%) | 4 (100.0%) |
| 45 to 54 Years | 0 (0.0%) | 8 (100.0%) |
| 55 to 64 Years | 11 (100.0%) | 14 (100.0%) |
| 65 to 74 Years | 15 (100.0%) | 7 (100.0%) |
| 75 Years and over | 2 (100.0%) | 5 (100.0%) |
| Total | 39 (100.0%) | 45 (100.0%) |
Income Below Poverty Among Married-Couple Families in Westwood
| Children | Above Poverty | Below Poverty |
| No Children | 26 (100.0%) | 0 (0.0%) |
| 1 or 2 Children | 4 (100.0%) | 0 (0.0%) |
| 3 or 4 Children | 0 (0.0%) | 0 (0.0%) |
| 5 or more Children | 0 (0.0%) | 0 (0.0%) |
| Total | 30 (100.0%) | 0 (0.0%) |
Income Below Poverty Among Single-Parent Households in Westwood
| Children | Single Father | Single Mother |
| No Children | 0 (0.0%) | 0 (0.0%) |
| 1 or 2 Children | 0 (0.0%) | 0 (0.0%) |
| 3 or 4 Children | 0 (0.0%) | 0 (0.0%) |
| 5 or more Children | 0 (0.0%) | 0 (0.0%) |
| Total | 0 (0.0%) | 0 (0.0%) |
Income Below Poverty Among Married-Couple vs Single-Parent Households in Westwood
| Children | Married-Couple Families | Single-Parent Households |
| No Children | 0 (0.0%) | 0 (0.0%) |
| 1 or 2 Children | 0 (0.0%) | 0 (0.0%) |
| 3 or 4 Children | 0 (0.0%) | 0 (0.0%) |
| 5 or more Children | 0 (0.0%) | 0 (0.0%) |
| Total | 0 (0.0%) | 0 (0.0%) |
Race in Westwood
The most populous races in Westwood are , and White / Caucasian (84 | 100.0%).
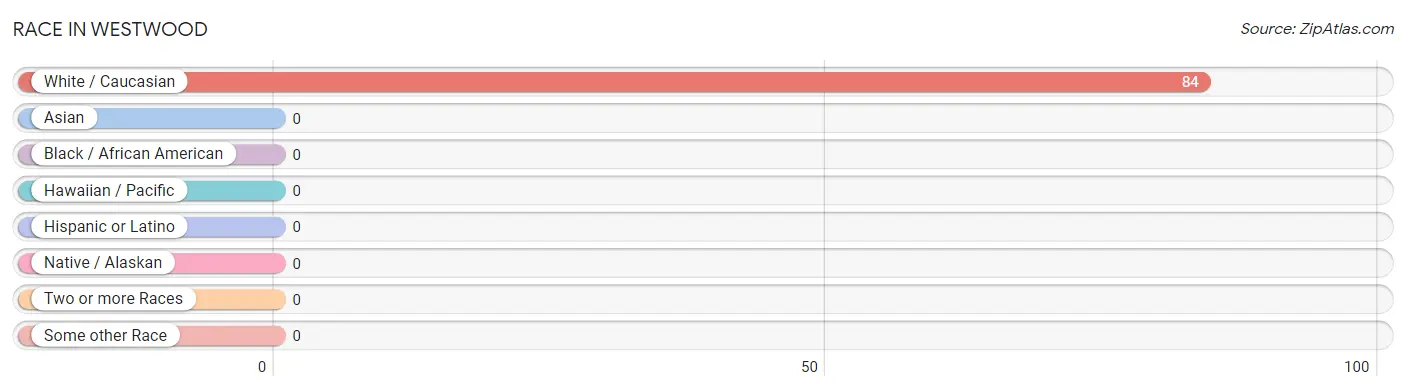
| Race | # Population | % Population |
| Asian | 0 | 0.0% |
| Black / African American | 0 | 0.0% |
| Hawaiian / Pacific | 0 | 0.0% |
| Hispanic or Latino | 0 | 0.0% |
| Native / Alaskan | 0 | 0.0% |
| White / Caucasian | 84 | 100.0% |
| Two or more Races | 0 | 0.0% |
| Some other Race | 0 | 0.0% |
| Total | 84 | 100.0% |
Ancestry in Westwood
The most populous ancestries reported in Westwood are German (36 | 42.9%), English (18 | 21.4%), Irish (13 | 15.5%), European (6 | 7.1%), and Norwegian (4 | 4.8%), together accounting for 91.7% of all Westwood residents.
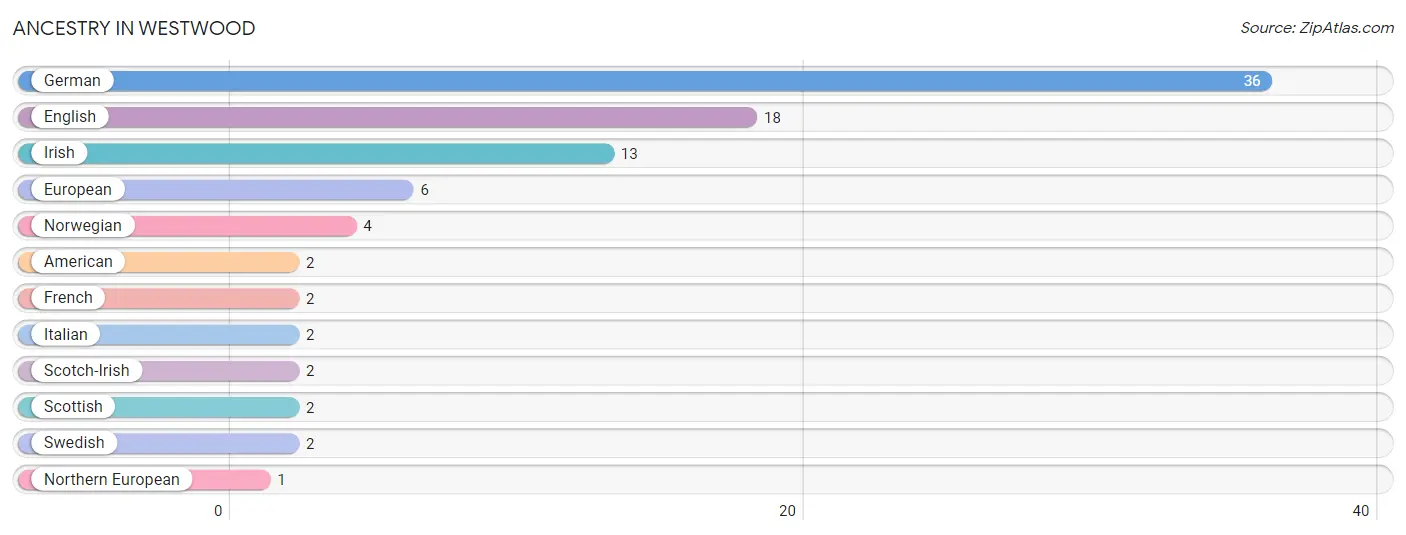
| Ancestry | # Population | % Population |
| American | 2 | 2.4% |
| English | 18 | 21.4% |
| European | 6 | 7.1% |
| French | 2 | 2.4% |
| German | 36 | 42.9% |
| Irish | 13 | 15.5% |
| Italian | 2 | 2.4% |
| Northern European | 1 | 1.2% |
| Norwegian | 4 | 4.8% |
| Scotch-Irish | 2 | 2.4% |
| Scottish | 2 | 2.4% |
| Swedish | 2 | 2.4% | View All 12 Rows |
Immigrants in Westwood
The most numerous immigrant groups reported in Westwood came from , and Canada (3 | 3.6%), together accounting for 3.6% of all Westwood residents.

| Immigration Origin | # Population | % Population |
| Canada | 3 | 3.6% | View All 1 Rows |
Sex and Age in Westwood
Sex and Age in Westwood
The most populous age groups in Westwood are 65 to 69 Years (9 | 23.1%) for men and 60 to 64 Years (9 | 20.0%) for women.
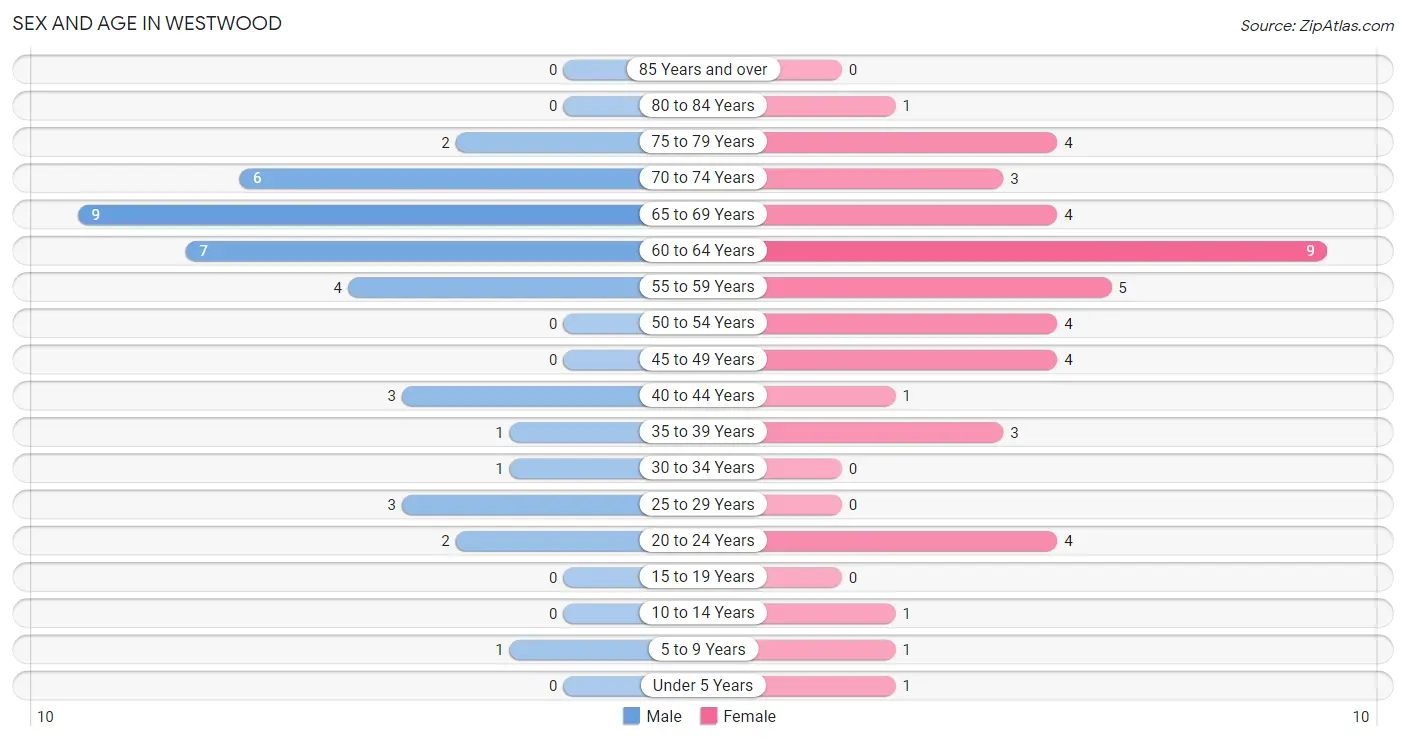
| Age Bracket | Male | Female |
| Under 5 Years | 0 (0.0%) | 1 (2.2%) |
| 5 to 9 Years | 1 (2.6%) | 1 (2.2%) |
| 10 to 14 Years | 0 (0.0%) | 1 (2.2%) |
| 15 to 19 Years | 0 (0.0%) | 0 (0.0%) |
| 20 to 24 Years | 2 (5.1%) | 4 (8.9%) |
| 25 to 29 Years | 3 (7.7%) | 0 (0.0%) |
| 30 to 34 Years | 1 (2.6%) | 0 (0.0%) |
| 35 to 39 Years | 1 (2.6%) | 3 (6.7%) |
| 40 to 44 Years | 3 (7.7%) | 1 (2.2%) |
| 45 to 49 Years | 0 (0.0%) | 4 (8.9%) |
| 50 to 54 Years | 0 (0.0%) | 4 (8.9%) |
| 55 to 59 Years | 4 (10.3%) | 5 (11.1%) |
| 60 to 64 Years | 7 (17.9%) | 9 (20.0%) |
| 65 to 69 Years | 9 (23.1%) | 4 (8.9%) |
| 70 to 74 Years | 6 (15.4%) | 3 (6.7%) |
| 75 to 79 Years | 2 (5.1%) | 4 (8.9%) |
| 80 to 84 Years | 0 (0.0%) | 1 (2.2%) |
| 85 Years and over | 0 (0.0%) | 0 (0.0%) |
| Total | 39 (100.0%) | 45 (100.0%) |
Families and Households in Westwood
Median Family Size in Westwood
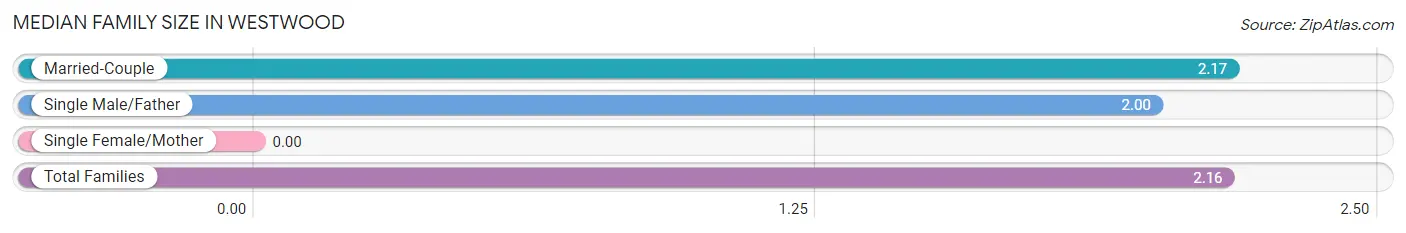
| Family Type | # Families | Family Size |
| Married-Couple | 30 (93.8%) | 2.17 |
| Single Male/Father | 2 (6.2%) | 2.00 |
| Single Female/Mother | 0 (0.0%) | - |
| Total Families | 32 (100.0%) | 2.16 |
Median Household Size in Westwood
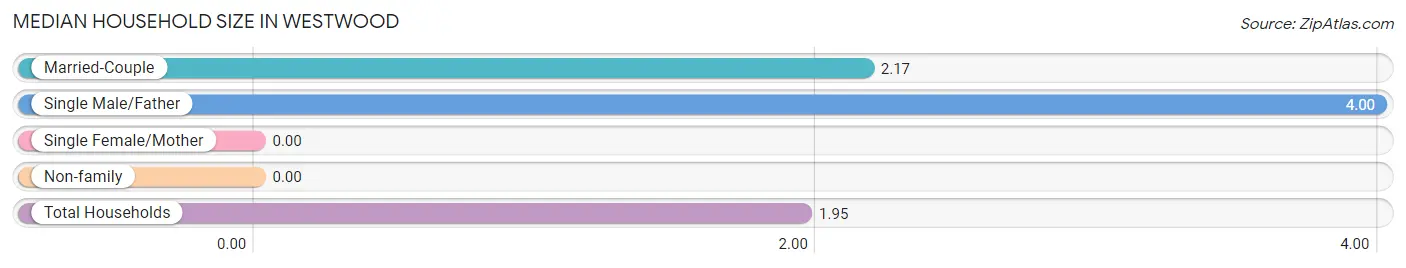
| Household Type | # Households | Household Size |
| Married-Couple | 30 (69.8%) | 2.17 |
| Single Male/Father | 2 (4.6%) | 4.00 |
| Single Female/Mother | 0 (0.0%) | - |
| Non-family | 11 (25.6%) | - |
| Total Households | 43 (100.0%) | 1.95 |
Household Size by Marriage Status in Westwood
Out of a total of 43 households in Westwood, 32 (74.4%) are family households, while 11 (25.6%) are nonfamily households. The most numerous type of family households are 2-person households, comprising 25, and the most common type of nonfamily households are 1-person households, comprising 11.
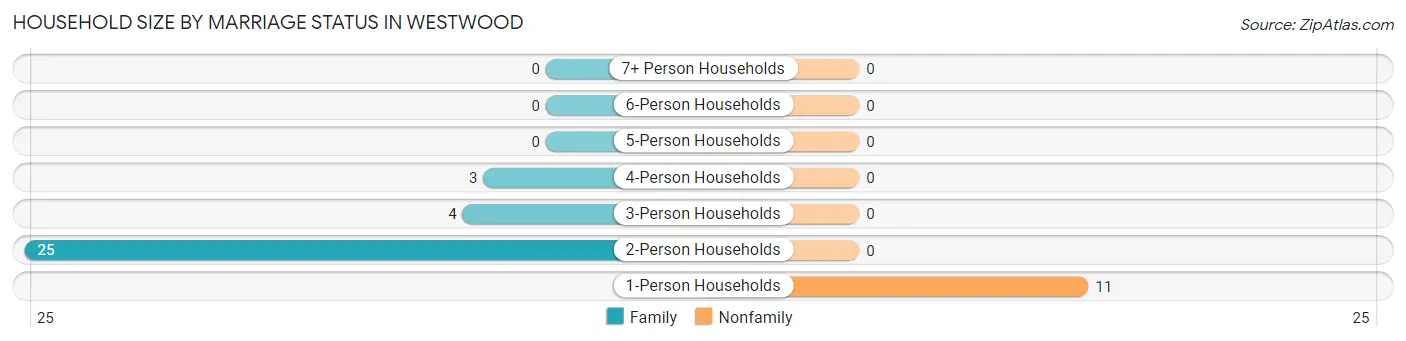
| Household Size | Family Households | Nonfamily Households |
| 1-Person Households | - | 11 (25.6%) |
| 2-Person Households | 25 (58.1%) | 0 (0.0%) |
| 3-Person Households | 4 (9.3%) | 0 (0.0%) |
| 4-Person Households | 3 (7.0%) | 0 (0.0%) |
| 5-Person Households | 0 (0.0%) | 0 (0.0%) |
| 6-Person Households | 0 (0.0%) | 0 (0.0%) |
| 7+ Person Households | 0 (0.0%) | 0 (0.0%) |
| Total | 32 (74.4%) | 11 (25.6%) |
Female Fertility in Westwood
Fertility by Age in Westwood
| Age Bracket | Women with Births | Births / 1,000 Women |
| 15 to 19 years | 0 (0.0%) | 0.0 |
| 20 to 34 years | 0 (0.0%) | 0.0 |
| 35 to 50 years | 0 (0.0%) | 0.0 |
| Total | 0 (0.0%) | 0.0 |
Fertility by Age by Marriage Status in Westwood
| Age Bracket | Married | Unmarried |
| 15 to 19 years | 0 (0.0%) | 0 (0.0%) |
| 20 to 34 years | 0 (0.0%) | 0 (0.0%) |
| 35 to 50 years | 0 (0.0%) | 0 (0.0%) |
| Total | 0 (0.0%) | 0 (0.0%) |
Fertility by Education in Westwood
| Educational Attainment | Women with Births | Births / 1,000 Women |
| Less than High School | 0 (0.0%) | 0.0 |
| High School Diploma | 0 (0.0%) | 0.0 |
| College or Associate's Degree | 0 (0.0%) | 0.0 |
| Bachelor's Degree | 0 (0.0%) | 0.0 |
| Graduate Degree | 0 (0.0%) | 0.0 |
| Total | 0 (0.0%) | 0.0 |
Fertility by Education by Marriage Status in Westwood
| Educational Attainment | Married | Unmarried |
| Less than High School | 0 (0.0%) | 0 (0.0%) |
| High School Diploma | 0 (0.0%) | 0 (0.0%) |
| College or Associate's Degree | 0 (0.0%) | 0 (0.0%) |
| Bachelor's Degree | 0 (0.0%) | 0 (0.0%) |
| Graduate Degree | 0 (0.0%) | 0 (0.0%) |
| Total | 0 (0.0%) | 0 (0.0%) |
Employment Characteristics in Westwood
Employment by Class of Employer in Westwood
Among the 52 employed individuals in Westwood, private company employees (33 | 63.5%), not-for-profit organizations (6 | 11.5%), and local government employees (6 | 11.5%) make up the most common classes of employment.
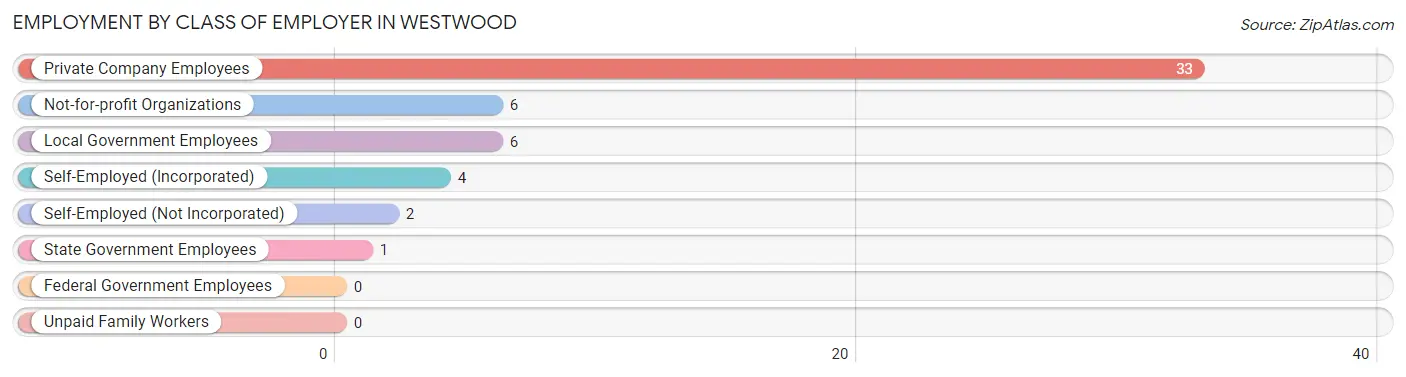
| Employer Class | # Employees | % Employees |
| Private Company Employees | 33 | 63.5% |
| Self-Employed (Incorporated) | 4 | 7.7% |
| Self-Employed (Not Incorporated) | 2 | 3.8% |
| Not-for-profit Organizations | 6 | 11.5% |
| Local Government Employees | 6 | 11.5% |
| State Government Employees | 1 | 1.9% |
| Federal Government Employees | 0 | 0.0% |
| Unpaid Family Workers | 0 | 0.0% |
| Total | 52 | 100.0% |
Employment Status by Age in Westwood
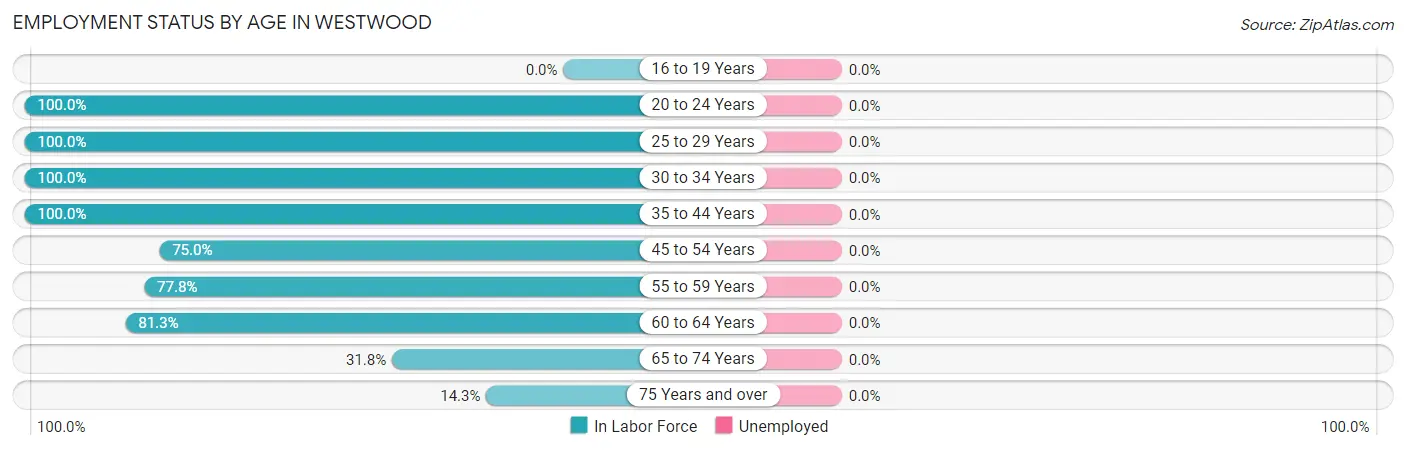
| Age Bracket | In Labor Force | Unemployed |
| 16 to 19 Years | 0 (0.0%) | 0 (0.0%) |
| 20 to 24 Years | 6 (100.0%) | 0 (0.0%) |
| 25 to 29 Years | 3 (100.0%) | 0 (0.0%) |
| 30 to 34 Years | 1 (100.0%) | 0 (0.0%) |
| 35 to 44 Years | 8 (100.0%) | 0 (0.0%) |
| 45 to 54 Years | 6 (75.0%) | 0 (0.0%) |
| 55 to 59 Years | 7 (77.8%) | 0 (0.0%) |
| 60 to 64 Years | 13 (81.3%) | 0 (0.0%) |
| 65 to 74 Years | 7 (31.8%) | 0 (0.0%) |
| 75 Years and over | 1 (14.3%) | 0 (0.0%) |
| Total | 52 (65.0%) | 0 (0.0%) |
Employment Status by Educational Attainment in Westwood
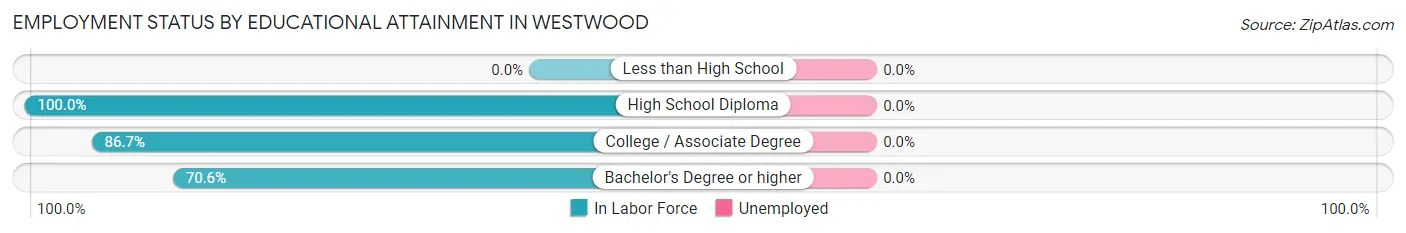
| Educational Attainment | In Labor Force | Unemployed |
| Less than High School | 0 (0.0%) | 0 (0.0%) |
| High School Diploma | 13 (100.0%) | 0 (0.0%) |
| College / Associate Degree | 13 (86.7%) | 0 (0.0%) |
| Bachelor's Degree or higher | 12 (70.6%) | 0 (0.0%) |
| Total | 38 (84.4%) | 0 (0.0%) |
Employment Occupations by Sex in Westwood
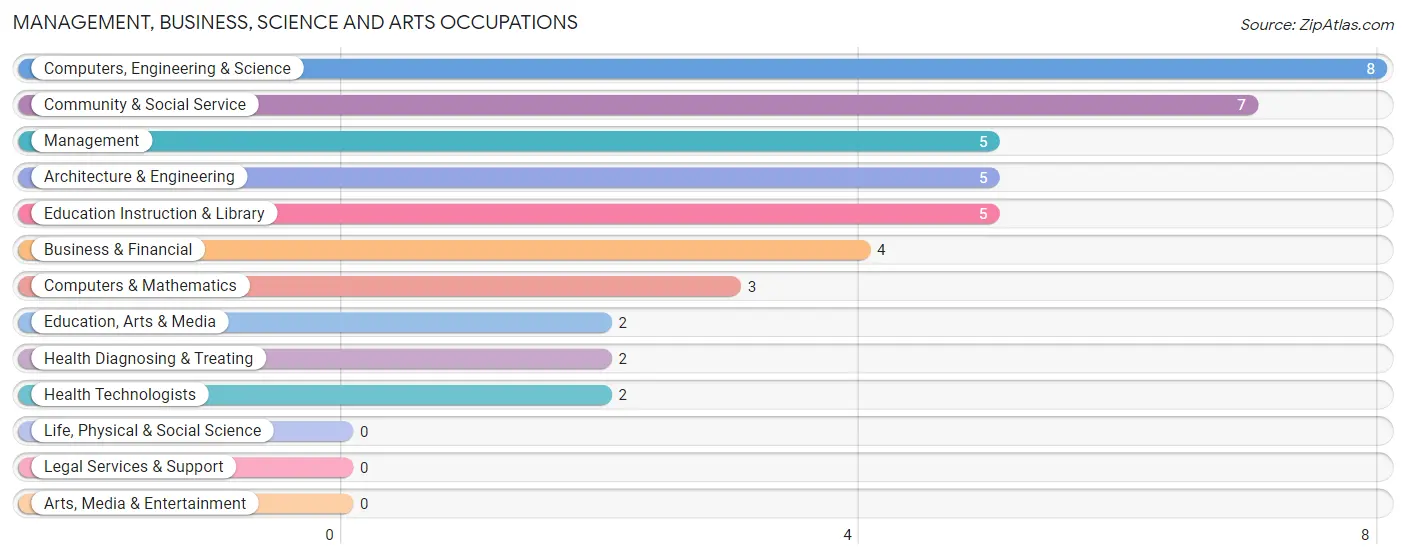
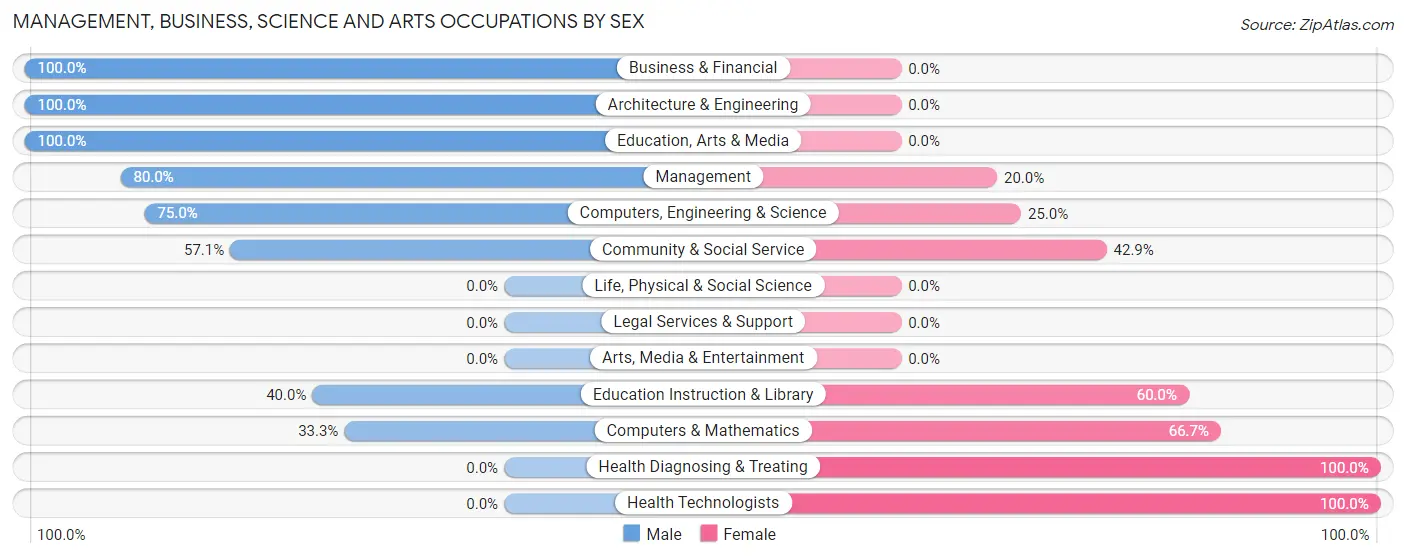
Management, Business, Science and Arts Occupations
The most common Management, Business, Science and Arts occupations in Westwood are Computers, Engineering & Science (8 | 15.4%), Community & Social Service (7 | 13.5%), Management (5 | 9.6%), Architecture & Engineering (5 | 9.6%), and Education Instruction & Library (5 | 9.6%).
Management, Business, Science and Arts Occupations by Sex
Within the Management, Business, Science and Arts occupations in Westwood, the most male-oriented occupations are Business & Financial (100.0%), Architecture & Engineering (100.0%), and Education, Arts & Media (100.0%), while the most female-oriented occupations are Health Diagnosing & Treating (100.0%), Health Technologists (100.0%), and Computers & Mathematics (66.7%).
| Occupation | Male | Female |
| Management | 4 (80.0%) | 1 (20.0%) |
| Business & Financial | 4 (100.0%) | 0 (0.0%) |
| Computers, Engineering & Science | 6 (75.0%) | 2 (25.0%) |
| Computers & Mathematics | 1 (33.3%) | 2 (66.7%) |
| Architecture & Engineering | 5 (100.0%) | 0 (0.0%) |
| Life, Physical & Social Science | 0 (0.0%) | 0 (0.0%) |
| Community & Social Service | 4 (57.1%) | 3 (42.9%) |
| Education, Arts & Media | 2 (100.0%) | 0 (0.0%) |
| Legal Services & Support | 0 (0.0%) | 0 (0.0%) |
| Education Instruction & Library | 2 (40.0%) | 3 (60.0%) |
| Arts, Media & Entertainment | 0 (0.0%) | 0 (0.0%) |
| Health Diagnosing & Treating | 0 (0.0%) | 2 (100.0%) |
| Health Technologists | 0 (0.0%) | 2 (100.0%) |
| Total (Category) | 18 (69.2%) | 8 (30.8%) |
| Total (Overall) | 28 (53.8%) | 24 (46.2%) |
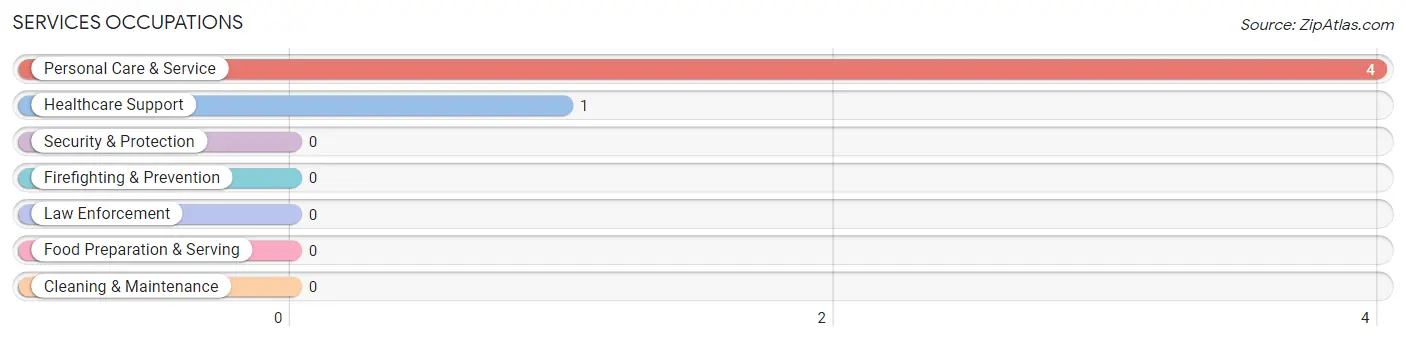
Services Occupations
The most common Services occupations in Westwood are Personal Care & Service (4 | 7.7%), and Healthcare Support (1 | 1.9%).
Services Occupations by Sex
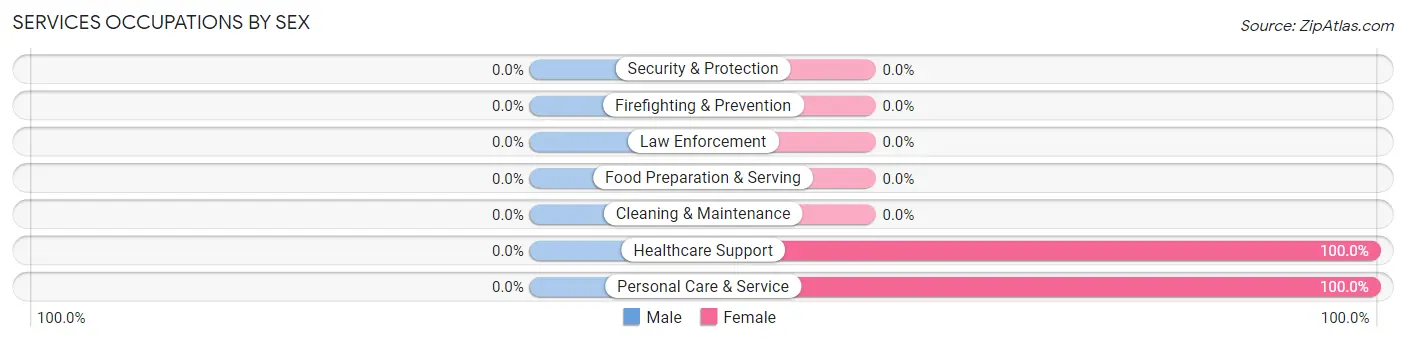
| Occupation | Male | Female |
| Healthcare Support | 0 (0.0%) | 1 (100.0%) |
| Security & Protection | 0 (0.0%) | 0 (0.0%) |
| Firefighting & Prevention | 0 (0.0%) | 0 (0.0%) |
| Law Enforcement | 0 (0.0%) | 0 (0.0%) |
| Food Preparation & Serving | 0 (0.0%) | 0 (0.0%) |
| Cleaning & Maintenance | 0 (0.0%) | 0 (0.0%) |
| Personal Care & Service | 0 (0.0%) | 4 (100.0%) |
| Total (Category) | 0 (0.0%) | 5 (100.0%) |
| Total (Overall) | 28 (53.8%) | 24 (46.2%) |
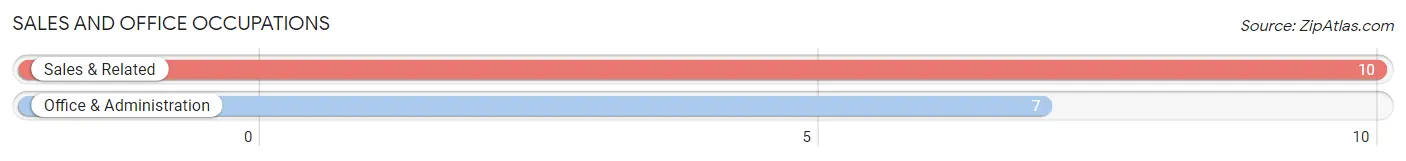
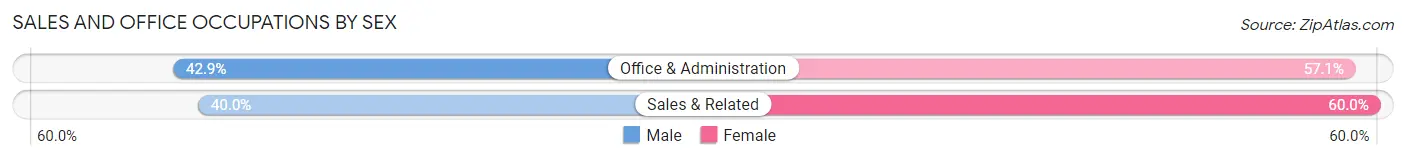
Sales and Office Occupations
The most common Sales and Office occupations in Westwood are Sales & Related (10 | 19.2%), and Office & Administration (7 | 13.5%).
Sales and Office Occupations by Sex
| Occupation | Male | Female |
| Sales & Related | 4 (40.0%) | 6 (60.0%) |
| Office & Administration | 3 (42.9%) | 4 (57.1%) |
| Total (Category) | 7 (41.2%) | 10 (58.8%) |
| Total (Overall) | 28 (53.8%) | 24 (46.2%) |
Natural Resources, Construction and Maintenance Occupations
The most common Natural Resources, Construction and Maintenance occupations in Westwood are , and Installation, Maintenance & Repair (1 | 1.9%).
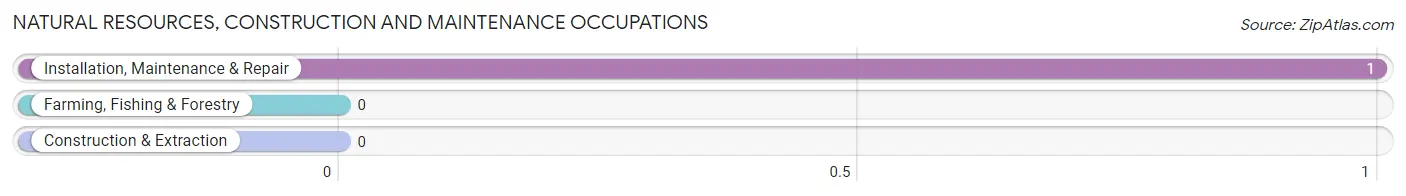
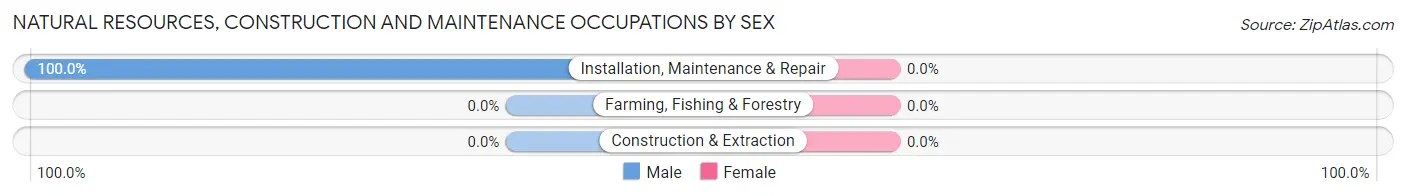
Natural Resources, Construction and Maintenance Occupations by Sex
| Occupation | Male | Female |
| Farming, Fishing & Forestry | 0 (0.0%) | 0 (0.0%) |
| Construction & Extraction | 0 (0.0%) | 0 (0.0%) |
| Installation, Maintenance & Repair | 1 (100.0%) | 0 (0.0%) |
| Total (Category) | 1 (100.0%) | 0 (0.0%) |
| Total (Overall) | 28 (53.8%) | 24 (46.2%) |
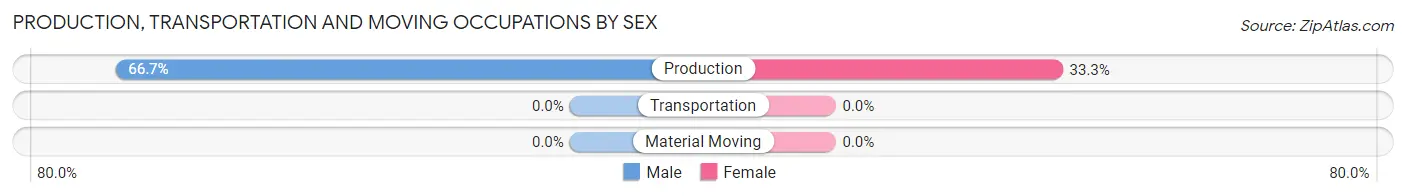
Production, Transportation and Moving Occupations
The most common Production, Transportation and Moving occupations in Westwood are , and Production (3 | 5.8%).
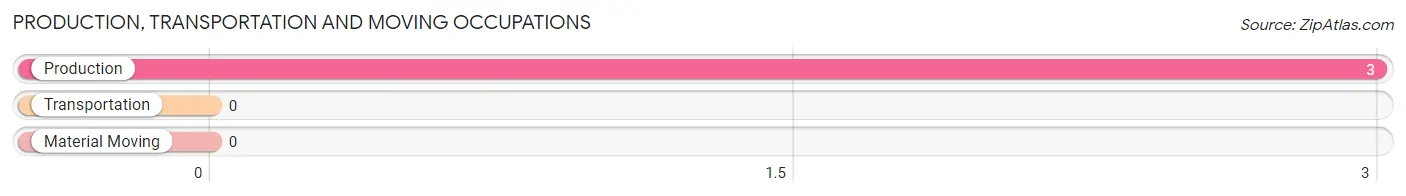
Production, Transportation and Moving Occupations by Sex
| Occupation | Male | Female |
| Production | 2 (66.7%) | 1 (33.3%) |
| Transportation | 0 (0.0%) | 0 (0.0%) |
| Material Moving | 0 (0.0%) | 0 (0.0%) |
| Total (Category) | 2 (66.7%) | 1 (33.3%) |
| Total (Overall) | 28 (53.8%) | 24 (46.2%) |
Employment Industries by Sex in Westwood
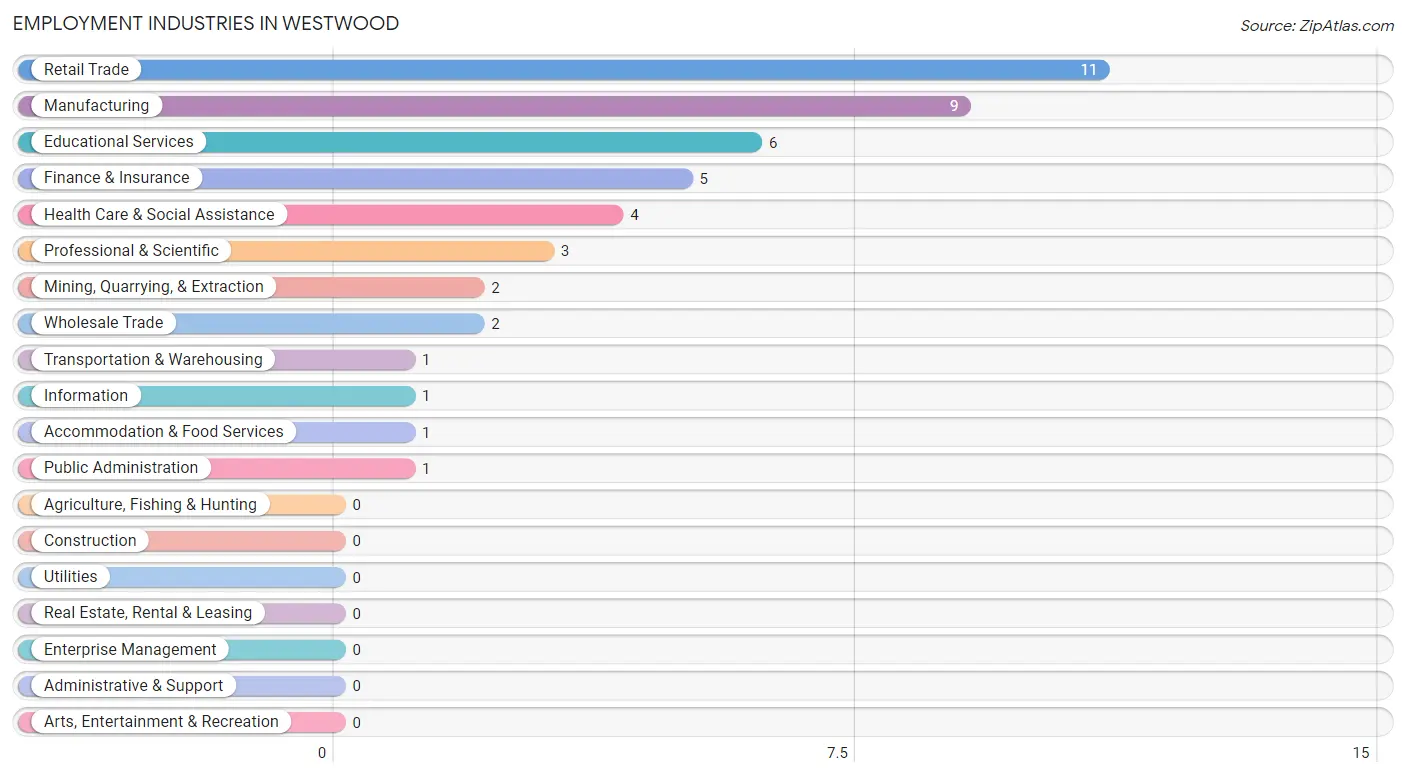
Employment Industries in Westwood
The major employment industries in Westwood include Retail Trade (11 | 21.1%), Manufacturing (9 | 17.3%), Educational Services (6 | 11.5%), Finance & Insurance (5 | 9.6%), and Health Care & Social Assistance (4 | 7.7%).
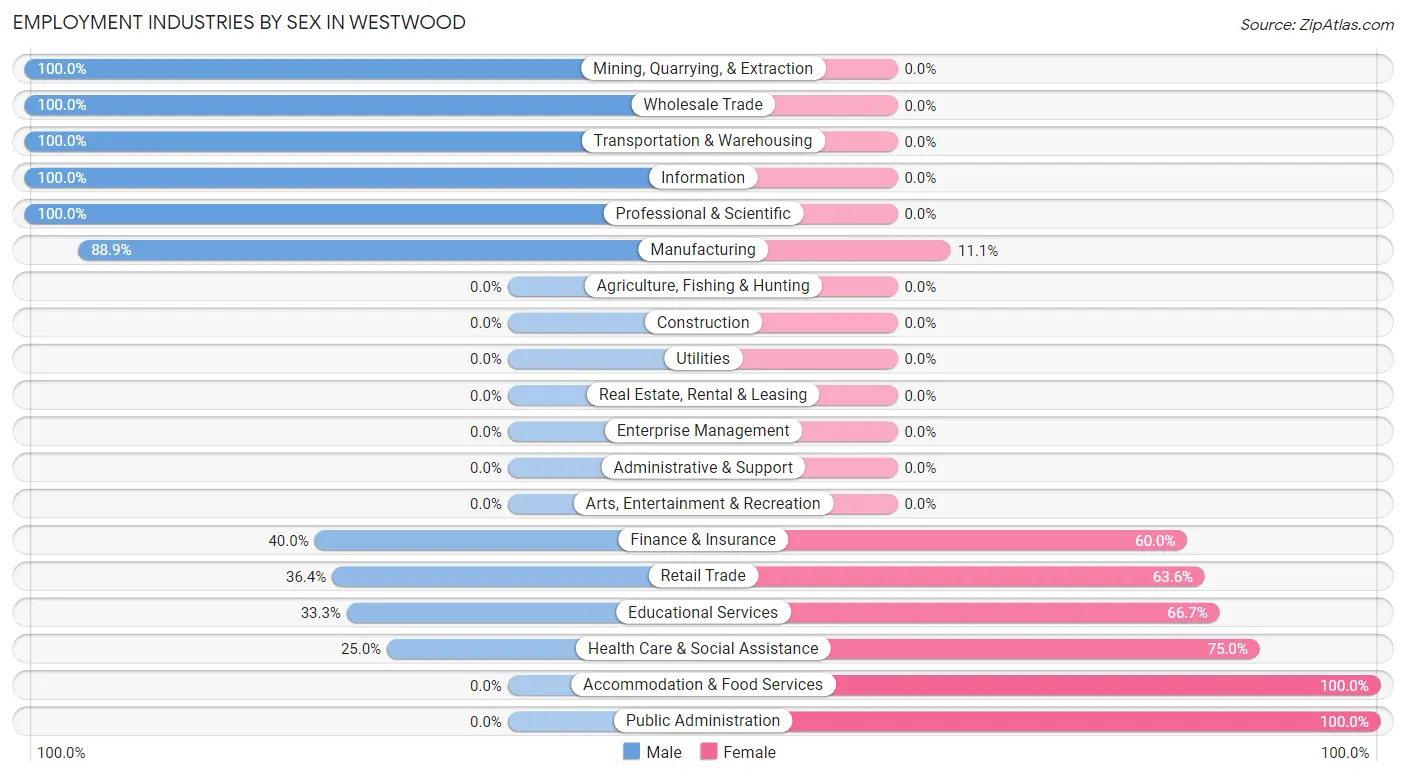
Employment Industries by Sex in Westwood
The Westwood industries that see more men than women are Mining, Quarrying, & Extraction (100.0%), Wholesale Trade (100.0%), and Transportation & Warehousing (100.0%), whereas the industries that tend to have a higher number of women are Accommodation & Food Services (100.0%), Public Administration (100.0%), and Health Care & Social Assistance (75.0%).
| Industry | Male | Female |
| Agriculture, Fishing & Hunting | 0 (0.0%) | 0 (0.0%) |
| Mining, Quarrying, & Extraction | 2 (100.0%) | 0 (0.0%) |
| Construction | 0 (0.0%) | 0 (0.0%) |
| Manufacturing | 8 (88.9%) | 1 (11.1%) |
| Wholesale Trade | 2 (100.0%) | 0 (0.0%) |
| Retail Trade | 4 (36.4%) | 7 (63.6%) |
| Transportation & Warehousing | 1 (100.0%) | 0 (0.0%) |
| Utilities | 0 (0.0%) | 0 (0.0%) |
| Information | 1 (100.0%) | 0 (0.0%) |
| Finance & Insurance | 2 (40.0%) | 3 (60.0%) |
| Real Estate, Rental & Leasing | 0 (0.0%) | 0 (0.0%) |
| Professional & Scientific | 3 (100.0%) | 0 (0.0%) |
| Enterprise Management | 0 (0.0%) | 0 (0.0%) |
| Administrative & Support | 0 (0.0%) | 0 (0.0%) |
| Educational Services | 2 (33.3%) | 4 (66.7%) |
| Health Care & Social Assistance | 1 (25.0%) | 3 (75.0%) |
| Arts, Entertainment & Recreation | 0 (0.0%) | 0 (0.0%) |
| Accommodation & Food Services | 0 (0.0%) | 1 (100.0%) |
| Public Administration | 0 (0.0%) | 1 (100.0%) |
| Total | 28 (53.8%) | 24 (46.2%) |
Education in Westwood
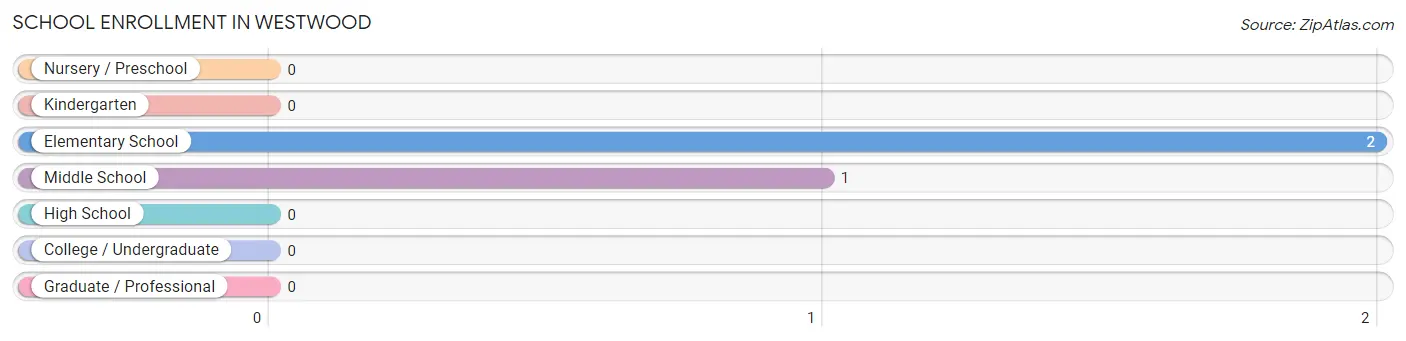
School Enrollment in Westwood
The most common levels of schooling among the 3 students in Westwood are elementary school (2 | 66.7%), and middle school (1 | 33.3%).
| School Level | # Students | % Students |
| Nursery / Preschool | 0 | 0.0% |
| Kindergarten | 0 | 0.0% |
| Elementary School | 2 | 66.7% |
| Middle School | 1 | 33.3% |
| High School | 0 | 0.0% |
| College / Undergraduate | 0 | 0.0% |
| Graduate / Professional | 0 | 0.0% |
| Total | 3 | 100.0% |
School Enrollment by Age by Funding Source in Westwood
Out of a total of 3 students who are enrolled in schools in Westwood, 1 (33.3%) attend a private institution, while the remaining 2 (66.7%) are enrolled in public schools. The age group of 5 to 9 year old has the highest likelihood of being enrolled in private schools, with 1 (50.0% in the age bracket) enrolled. Conversely, the age group of 10 to 14 year olds has the lowest likelihood of being enrolled in a private school, with 1 (100.0% in the age bracket) attending a public institution.
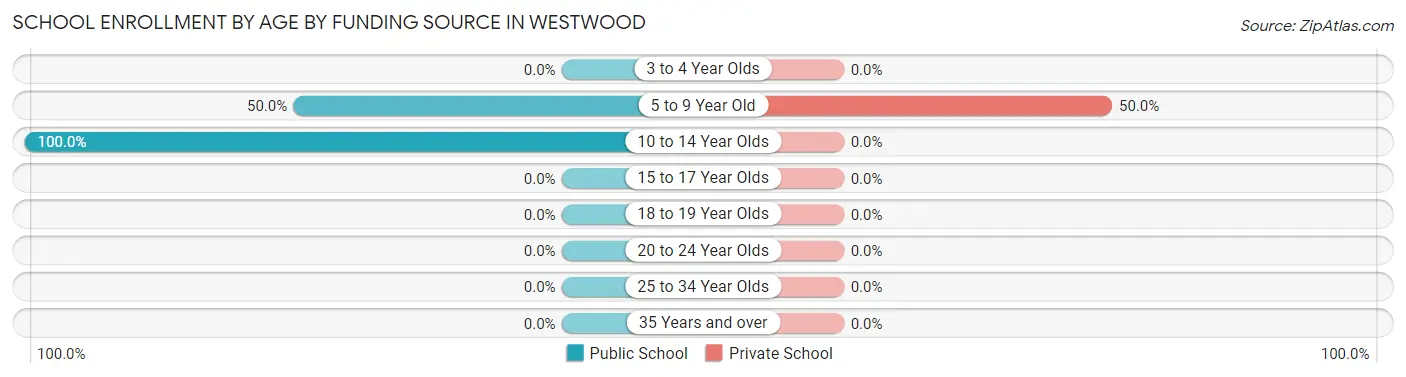
| Age Bracket | Public School | Private School |
| 3 to 4 Year Olds | 0 (0.0%) | 0 (0.0%) |
| 5 to 9 Year Old | 1 (50.0%) | 1 (50.0%) |
| 10 to 14 Year Olds | 1 (100.0%) | 0 (0.0%) |
| 15 to 17 Year Olds | 0 (0.0%) | 0 (0.0%) |
| 18 to 19 Year Olds | 0 (0.0%) | 0 (0.0%) |
| 20 to 24 Year Olds | 0 (0.0%) | 0 (0.0%) |
| 25 to 34 Year Olds | 0 (0.0%) | 0 (0.0%) |
| 35 Years and over | 0 (0.0%) | 0 (0.0%) |
| Total | 2 (66.7%) | 1 (33.3%) |
Educational Attainment by Field of Study in Westwood
Bio, nature & agricultural (9 | 26.5%), education (6 | 17.6%), liberal arts & history (6 | 17.6%), literature & languages (4 | 11.8%), and arts & humanities (3 | 8.8%) are the most common fields of study among 34 individuals in Westwood who have obtained a bachelor's degree or higher.
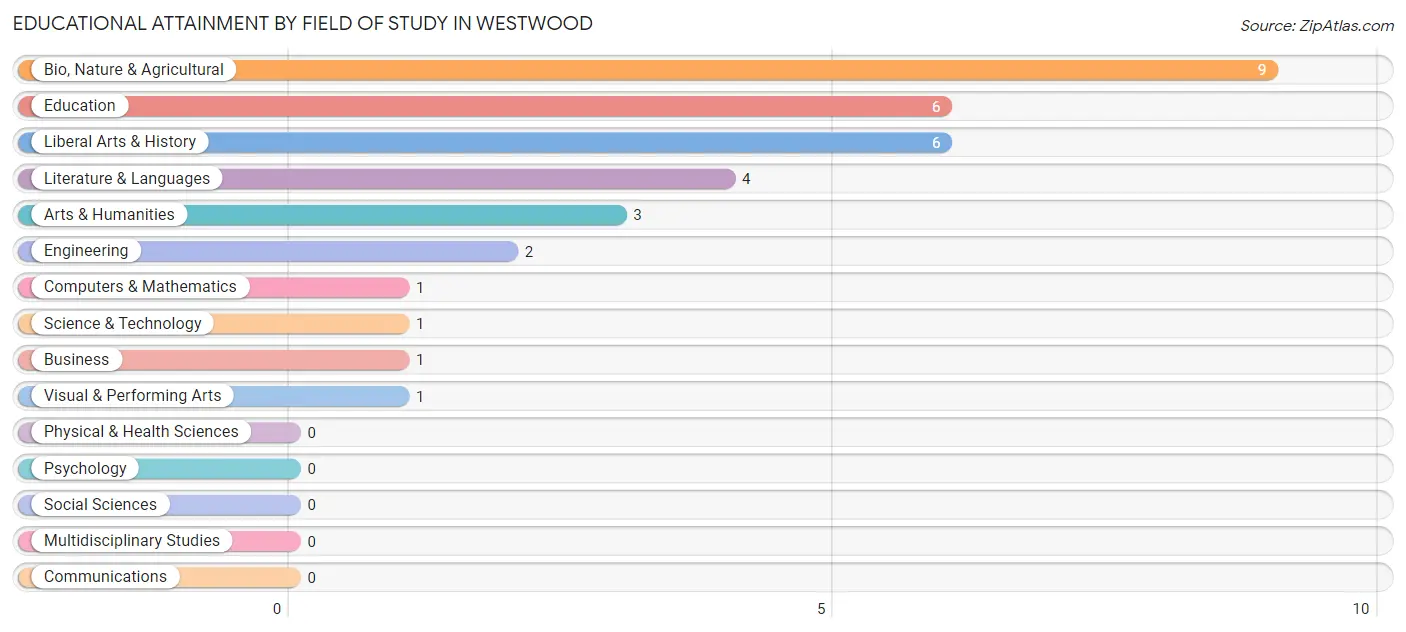
| Field of Study | # Graduates | % Graduates |
| Computers & Mathematics | 1 | 2.9% |
| Bio, Nature & Agricultural | 9 | 26.5% |
| Physical & Health Sciences | 0 | 0.0% |
| Psychology | 0 | 0.0% |
| Social Sciences | 0 | 0.0% |
| Engineering | 2 | 5.9% |
| Multidisciplinary Studies | 0 | 0.0% |
| Science & Technology | 1 | 2.9% |
| Business | 1 | 2.9% |
| Education | 6 | 17.6% |
| Literature & Languages | 4 | 11.8% |
| Liberal Arts & History | 6 | 17.6% |
| Visual & Performing Arts | 1 | 2.9% |
| Communications | 0 | 0.0% |
| Arts & Humanities | 3 | 8.8% |
| Total | 34 | 100.0% |
Transportation & Commute in Westwood
Vehicle Availability by Sex in Westwood
The most prevalent vehicle ownership categories in Westwood are males with 2 vehicles (18, accounting for 64.3%) and females with 2 vehicles (12, making up 75.0%).
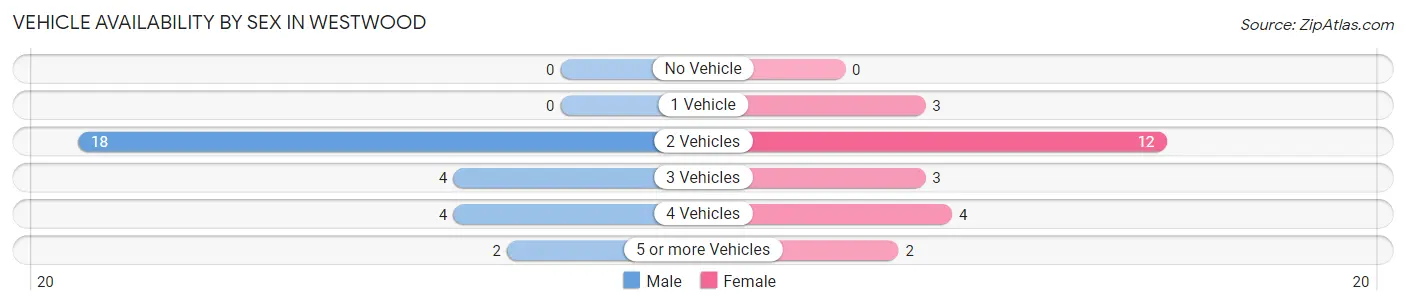
| Vehicles Available | Male | Female |
| No Vehicle | 0 (0.0%) | 0 (0.0%) |
| 1 Vehicle | 0 (0.0%) | 3 (12.5%) |
| 2 Vehicles | 18 (64.3%) | 12 (50.0%) |
| 3 Vehicles | 4 (14.3%) | 3 (12.5%) |
| 4 Vehicles | 4 (14.3%) | 4 (16.7%) |
| 5 or more Vehicles | 2 (7.1%) | 2 (8.3%) |
| Total | 28 (100.0%) | 24 (100.0%) |
Commute Time in Westwood
The most frequently occuring commute durations in Westwood are 10 to 14 minutes (24 commuters, 50.0%), less than 5 minutes (5 commuters, 10.4%), and 20 to 24 minutes (5 commuters, 10.4%).
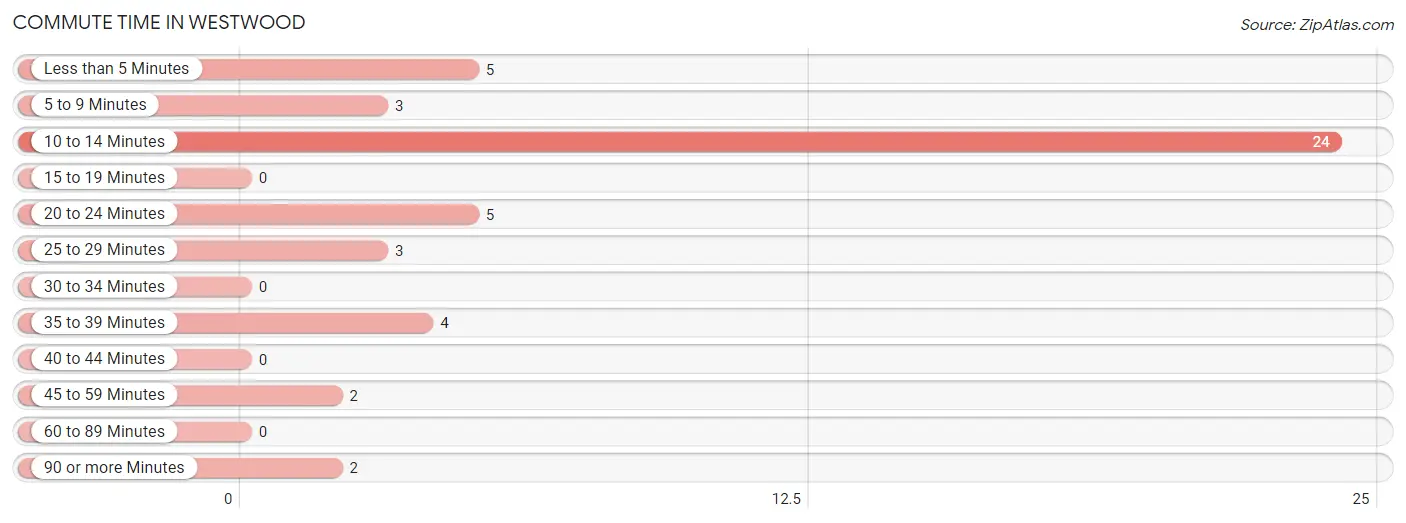
| Commute Time | # Commuters | % Commuters |
| Less than 5 Minutes | 5 | 10.4% |
| 5 to 9 Minutes | 3 | 6.2% |
| 10 to 14 Minutes | 24 | 50.0% |
| 15 to 19 Minutes | 0 | 0.0% |
| 20 to 24 Minutes | 5 | 10.4% |
| 25 to 29 Minutes | 3 | 6.2% |
| 30 to 34 Minutes | 0 | 0.0% |
| 35 to 39 Minutes | 4 | 8.3% |
| 40 to 44 Minutes | 0 | 0.0% |
| 45 to 59 Minutes | 2 | 4.2% |
| 60 to 89 Minutes | 0 | 0.0% |
| 90 or more Minutes | 2 | 4.2% |
Commute Time by Sex in Westwood
The most common commute times in Westwood are 10 to 14 minutes (11 commuters, 42.3%) for males and 10 to 14 minutes (13 commuters, 59.1%) for females.
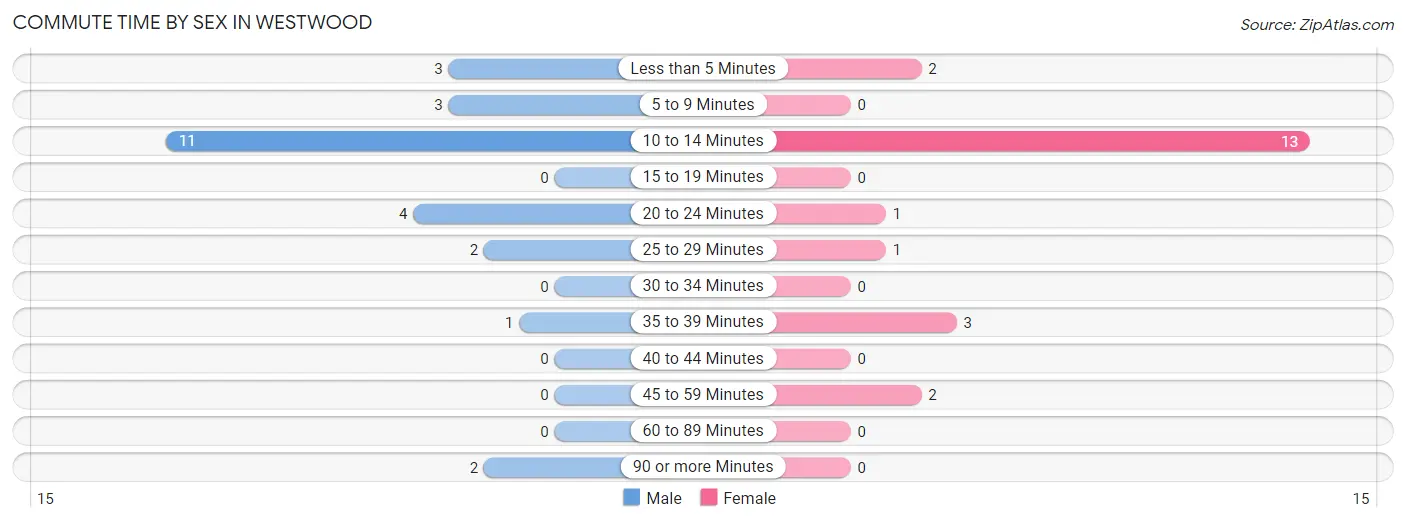
| Commute Time | Male | Female |
| Less than 5 Minutes | 3 (11.5%) | 2 (9.1%) |
| 5 to 9 Minutes | 3 (11.5%) | 0 (0.0%) |
| 10 to 14 Minutes | 11 (42.3%) | 13 (59.1%) |
| 15 to 19 Minutes | 0 (0.0%) | 0 (0.0%) |
| 20 to 24 Minutes | 4 (15.4%) | 1 (4.5%) |
| 25 to 29 Minutes | 2 (7.7%) | 1 (4.5%) |
| 30 to 34 Minutes | 0 (0.0%) | 0 (0.0%) |
| 35 to 39 Minutes | 1 (3.8%) | 3 (13.6%) |
| 40 to 44 Minutes | 0 (0.0%) | 0 (0.0%) |
| 45 to 59 Minutes | 0 (0.0%) | 2 (9.1%) |
| 60 to 89 Minutes | 0 (0.0%) | 0 (0.0%) |
| 90 or more Minutes | 2 (7.7%) | 0 (0.0%) |
Time of Departure to Work by Sex in Westwood
The most frequent times of departure to work in Westwood are 6:30 AM to 6:59 AM (7, 26.9%) for males and 7:30 AM to 7:59 AM (9, 40.9%) for females.
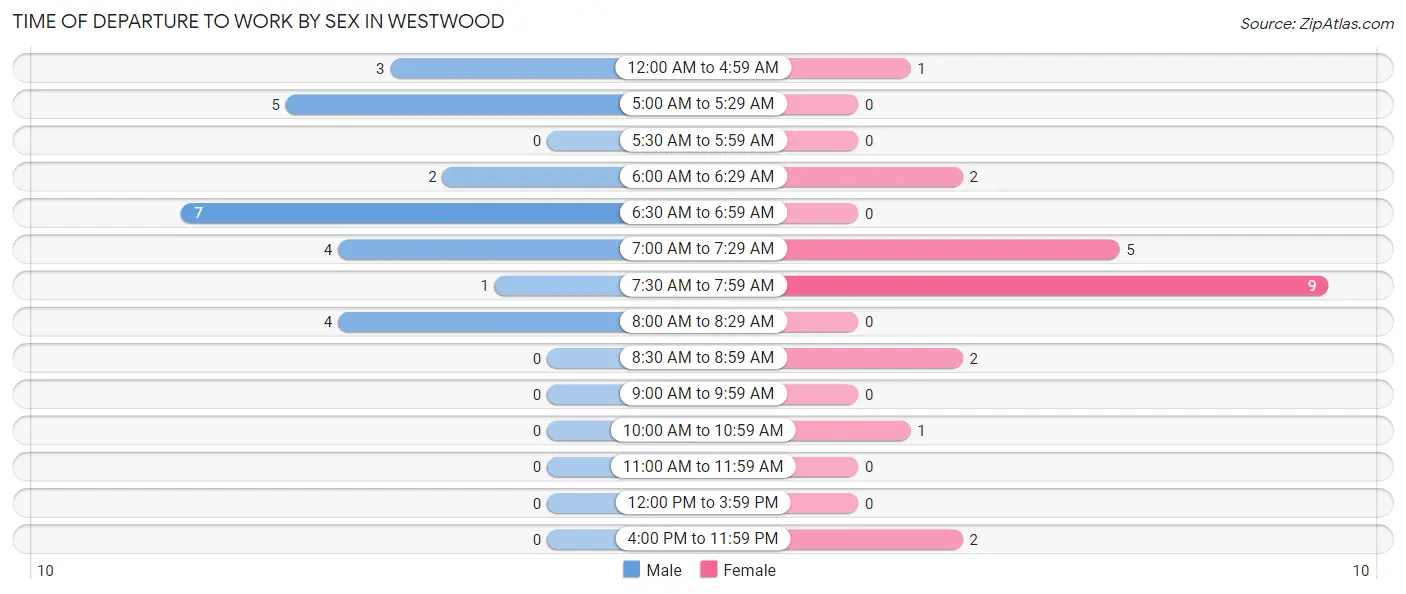
| Time of Departure | Male | Female |
| 12:00 AM to 4:59 AM | 3 (11.5%) | 1 (4.5%) |
| 5:00 AM to 5:29 AM | 5 (19.2%) | 0 (0.0%) |
| 5:30 AM to 5:59 AM | 0 (0.0%) | 0 (0.0%) |
| 6:00 AM to 6:29 AM | 2 (7.7%) | 2 (9.1%) |
| 6:30 AM to 6:59 AM | 7 (26.9%) | 0 (0.0%) |
| 7:00 AM to 7:29 AM | 4 (15.4%) | 5 (22.7%) |
| 7:30 AM to 7:59 AM | 1 (3.8%) | 9 (40.9%) |
| 8:00 AM to 8:29 AM | 4 (15.4%) | 0 (0.0%) |
| 8:30 AM to 8:59 AM | 0 (0.0%) | 2 (9.1%) |
| 9:00 AM to 9:59 AM | 0 (0.0%) | 0 (0.0%) |
| 10:00 AM to 10:59 AM | 0 (0.0%) | 1 (4.5%) |
| 11:00 AM to 11:59 AM | 0 (0.0%) | 0 (0.0%) |
| 12:00 PM to 3:59 PM | 0 (0.0%) | 0 (0.0%) |
| 4:00 PM to 11:59 PM | 0 (0.0%) | 2 (9.1%) |
| Total | 26 (100.0%) | 22 (100.0%) |
Housing Occupancy in Westwood
Occupancy by Ownership in Westwood
Of the total 43 dwellings in Westwood, owner-occupied units account for 43 (100.0%), while renter-occupied units make up 0 (0.0%).
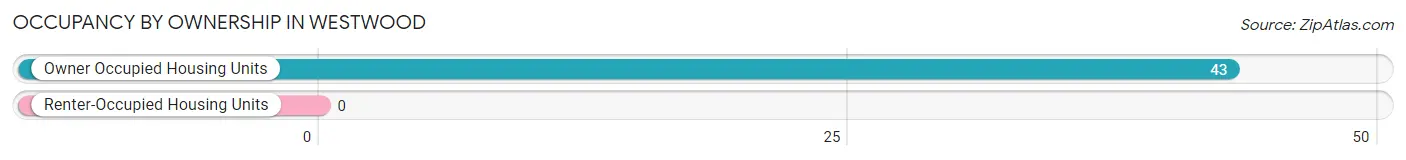
| Occupancy | # Housing Units | % Housing Units |
| Owner Occupied Housing Units | 43 | 100.0% |
| Renter-Occupied Housing Units | 0 | 0.0% |
| Total Occupied Housing Units | 43 | 100.0% |
Occupancy by Household Size in Westwood
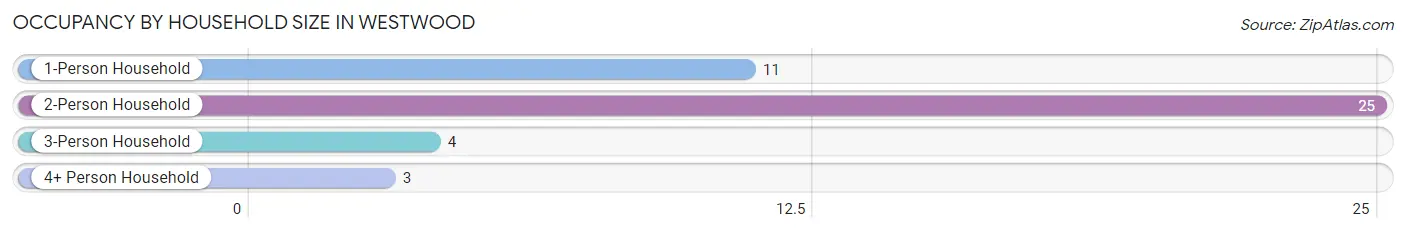
| Household Size | # Housing Units | % Housing Units |
| 1-Person Household | 11 | 25.6% |
| 2-Person Household | 25 | 58.1% |
| 3-Person Household | 4 | 9.3% |
| 4+ Person Household | 3 | 7.0% |
| Total Housing Units | 43 | 100.0% |
Occupancy by Ownership by Household Size in Westwood
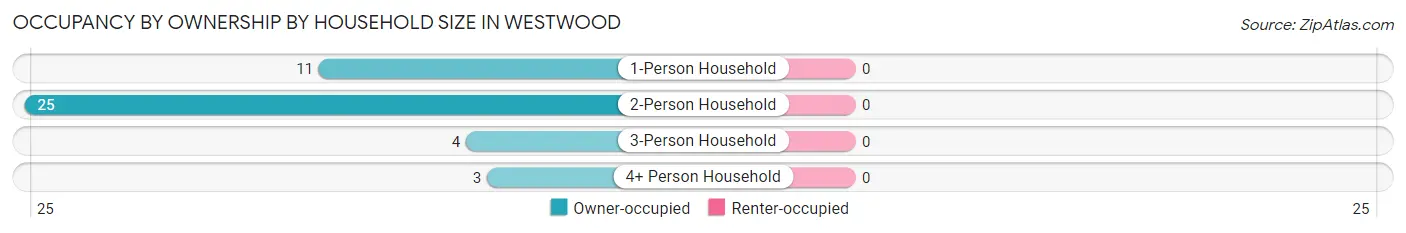
| Household Size | Owner-occupied | Renter-occupied |
| 1-Person Household | 11 (100.0%) | 0 (0.0%) |
| 2-Person Household | 25 (100.0%) | 0 (0.0%) |
| 3-Person Household | 4 (100.0%) | 0 (0.0%) |
| 4+ Person Household | 3 (100.0%) | 0 (0.0%) |
| Total Housing Units | 43 (100.0%) | 0 (0.0%) |
Occupancy by Educational Attainment in Westwood
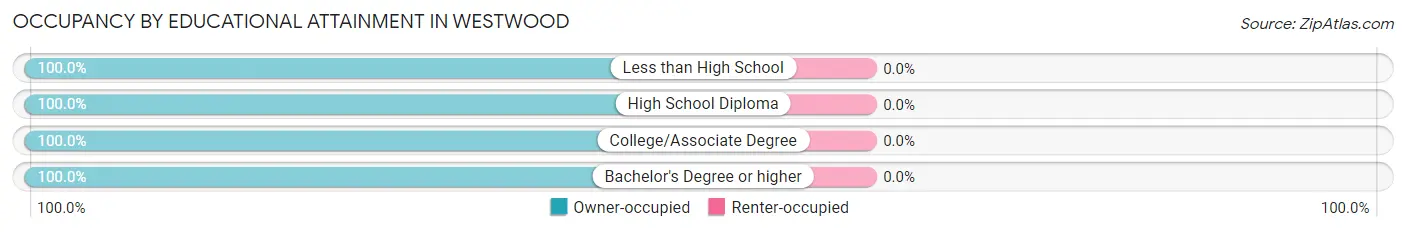
| Household Size | Owner-occupied | Renter-occupied |
| Less than High School | 2 (100.0%) | 0 (0.0%) |
| High School Diploma | 5 (100.0%) | 0 (0.0%) |
| College/Associate Degree | 14 (100.0%) | 0 (0.0%) |
| Bachelor's Degree or higher | 22 (100.0%) | 0 (0.0%) |
Occupancy by Age of Householder in Westwood
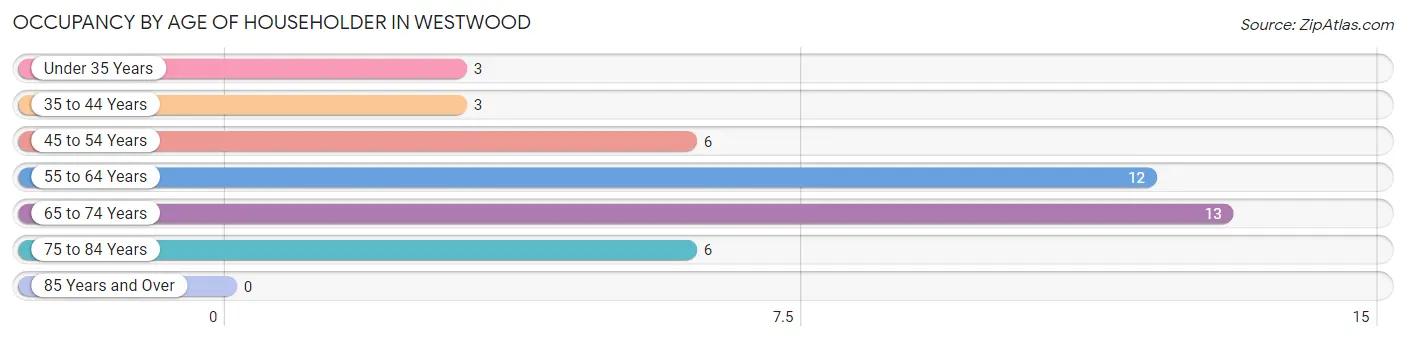
| Age Bracket | # Households | % Households |
| Under 35 Years | 3 | 7.0% |
| 35 to 44 Years | 3 | 7.0% |
| 45 to 54 Years | 6 | 14.0% |
| 55 to 64 Years | 12 | 27.9% |
| 65 to 74 Years | 13 | 30.2% |
| 75 to 84 Years | 6 | 14.0% |
| 85 Years and Over | 0 | 0.0% |
| Total | 43 | 100.0% |
Housing Finances in Westwood
Median Income by Occupancy in Westwood
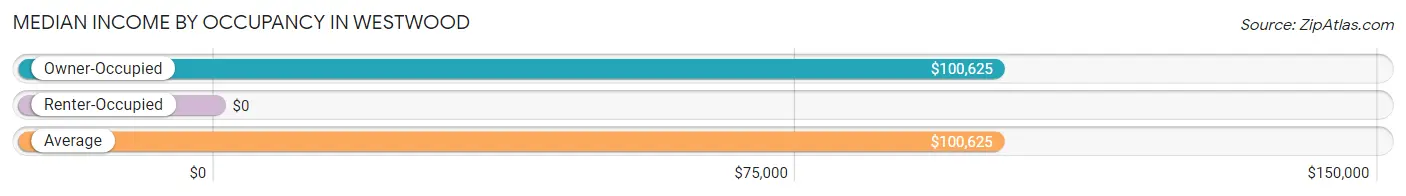
| Occupancy Type | # Households | Median Income |
| Owner-Occupied | 43 (100.0%) | $100,625 |
| Renter-Occupied | 0 (0.0%) | $0 |
| Average | 43 (100.0%) | $100,625 |
Occupancy by Householder Income Bracket in Westwood
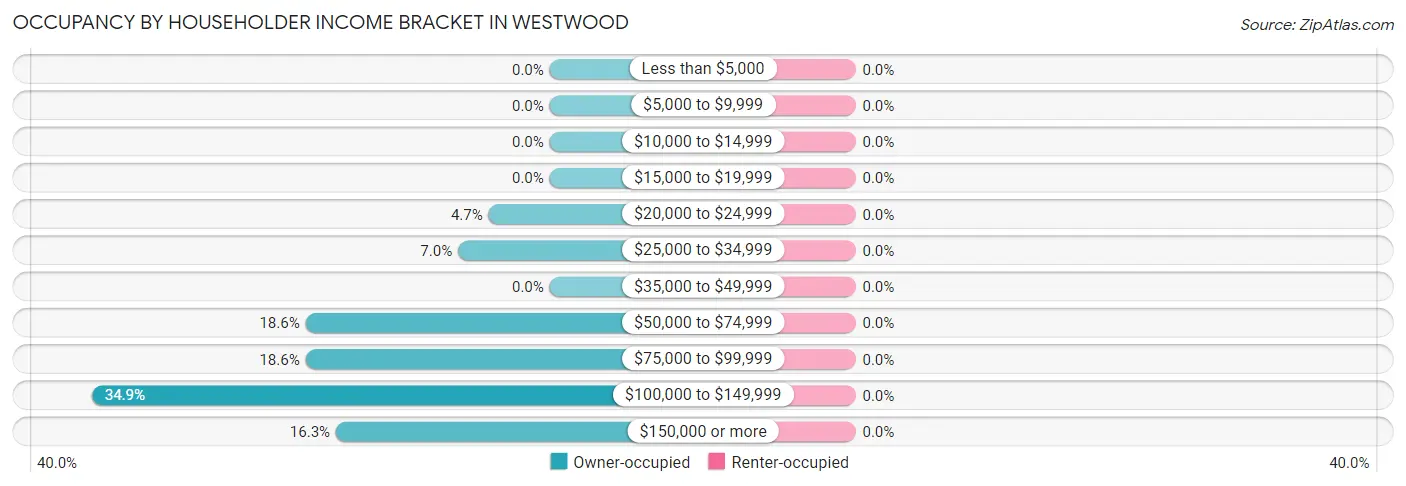
| Income Bracket | Owner-occupied | Renter-occupied |
| Less than $5,000 | 0 (0.0%) | 0 (0.0%) |
| $5,000 to $9,999 | 0 (0.0%) | 0 (0.0%) |
| $10,000 to $14,999 | 0 (0.0%) | 0 (0.0%) |
| $15,000 to $19,999 | 0 (0.0%) | 0 (0.0%) |
| $20,000 to $24,999 | 2 (4.6%) | 0 (0.0%) |
| $25,000 to $34,999 | 3 (7.0%) | 0 (0.0%) |
| $35,000 to $49,999 | 0 (0.0%) | 0 (0.0%) |
| $50,000 to $74,999 | 8 (18.6%) | 0 (0.0%) |
| $75,000 to $99,999 | 8 (18.6%) | 0 (0.0%) |
| $100,000 to $149,999 | 15 (34.9%) | 0 (0.0%) |
| $150,000 or more | 7 (16.3%) | 0 (0.0%) |
| Total | 43 (100.0%) | 0 (0.0%) |
Monthly Housing Cost Tiers in Westwood
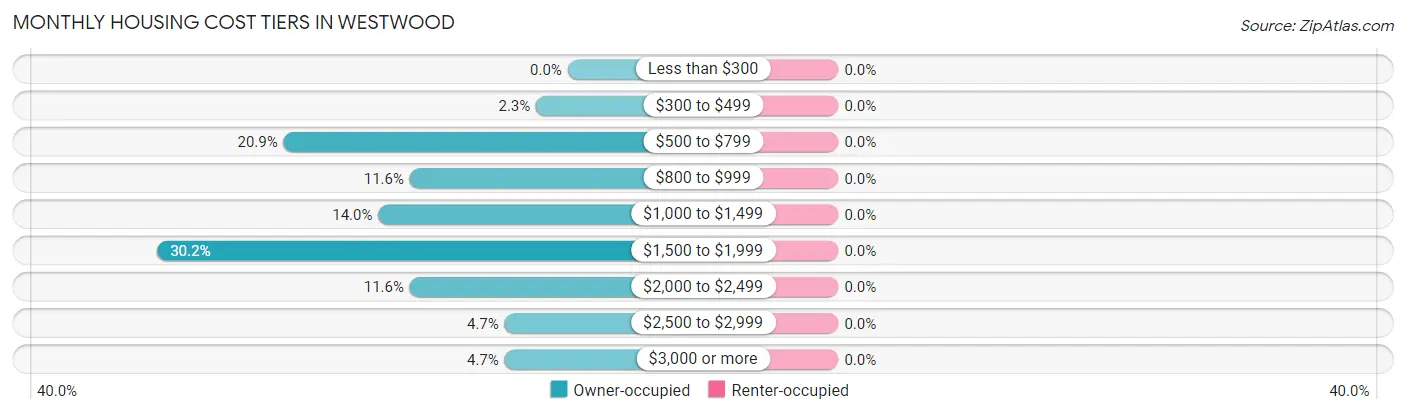
| Monthly Cost | Owner-occupied | Renter-occupied |
| Less than $300 | 0 (0.0%) | 0 (0.0%) |
| $300 to $499 | 1 (2.3%) | 0 (0.0%) |
| $500 to $799 | 9 (20.9%) | 0 (0.0%) |
| $800 to $999 | 5 (11.6%) | 0 (0.0%) |
| $1,000 to $1,499 | 6 (14.0%) | 0 (0.0%) |
| $1,500 to $1,999 | 13 (30.2%) | 0 (0.0%) |
| $2,000 to $2,499 | 5 (11.6%) | 0 (0.0%) |
| $2,500 to $2,999 | 2 (4.6%) | 0 (0.0%) |
| $3,000 or more | 2 (4.6%) | 0 (0.0%) |
| Total | 43 (100.0%) | 0 (0.0%) |
Physical Housing Characteristics in Westwood
Housing Structures in Westwood
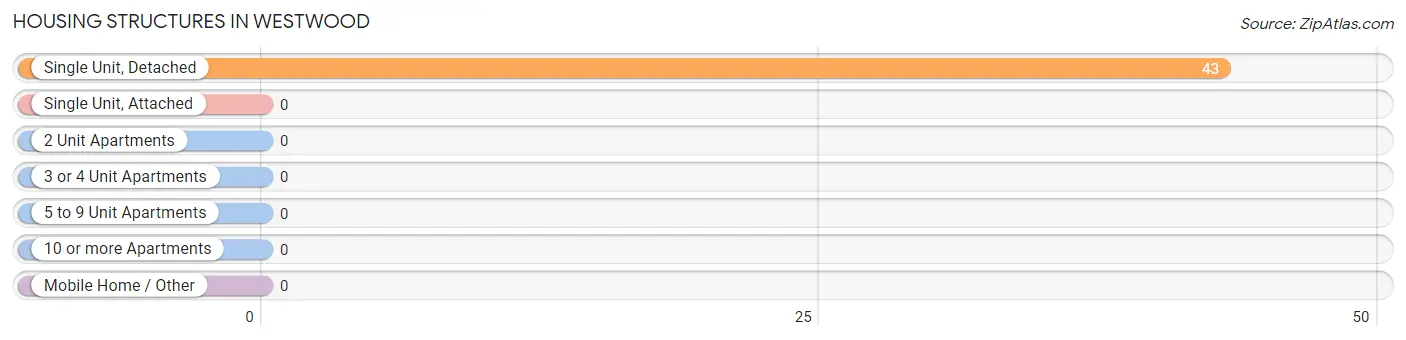
| Structure Type | # Housing Units | % Housing Units |
| Single Unit, Detached | 43 | 100.0% |
| Single Unit, Attached | 0 | 0.0% |
| 2 Unit Apartments | 0 | 0.0% |
| 3 or 4 Unit Apartments | 0 | 0.0% |
| 5 to 9 Unit Apartments | 0 | 0.0% |
| 10 or more Apartments | 0 | 0.0% |
| Mobile Home / Other | 0 | 0.0% |
| Total | 43 | 100.0% |
Housing Structures by Occupancy in Westwood
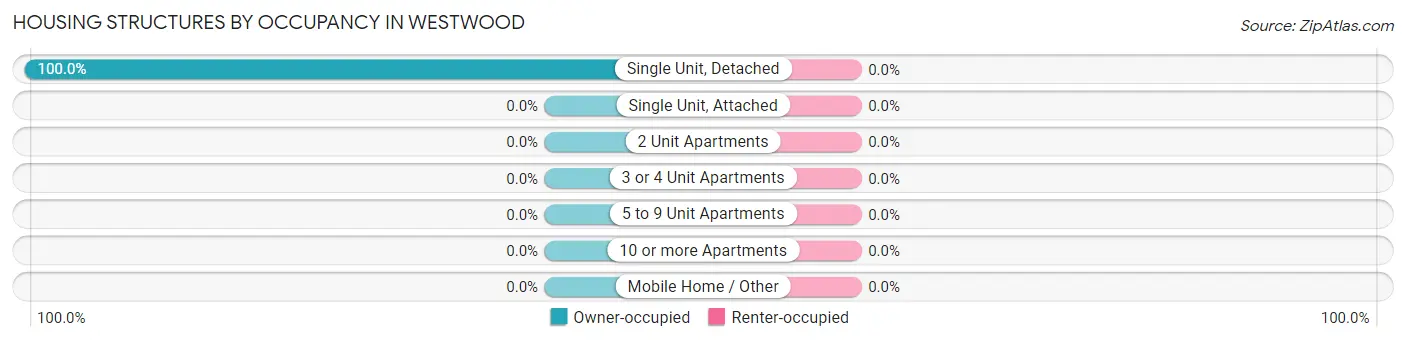
| Structure Type | Owner-occupied | Renter-occupied |
| Single Unit, Detached | 43 (100.0%) | 0 (0.0%) |
| Single Unit, Attached | 0 (0.0%) | 0 (0.0%) |
| 2 Unit Apartments | 0 (0.0%) | 0 (0.0%) |
| 3 or 4 Unit Apartments | 0 (0.0%) | 0 (0.0%) |
| 5 to 9 Unit Apartments | 0 (0.0%) | 0 (0.0%) |
| 10 or more Apartments | 0 (0.0%) | 0 (0.0%) |
| Mobile Home / Other | 0 (0.0%) | 0 (0.0%) |
| Total | 43 (100.0%) | 0 (0.0%) |
Housing Structures by Number of Rooms in Westwood
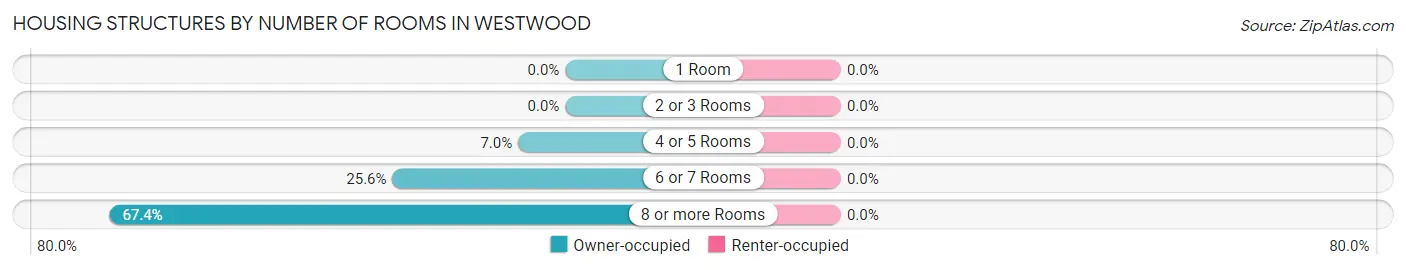
| Number of Rooms | Owner-occupied | Renter-occupied |
| 1 Room | 0 (0.0%) | 0 (0.0%) |
| 2 or 3 Rooms | 0 (0.0%) | 0 (0.0%) |
| 4 or 5 Rooms | 3 (7.0%) | 0 (0.0%) |
| 6 or 7 Rooms | 11 (25.6%) | 0 (0.0%) |
| 8 or more Rooms | 29 (67.4%) | 0 (0.0%) |
| Total | 43 (100.0%) | 0 (0.0%) |
Housing Structure by Heating Type in Westwood
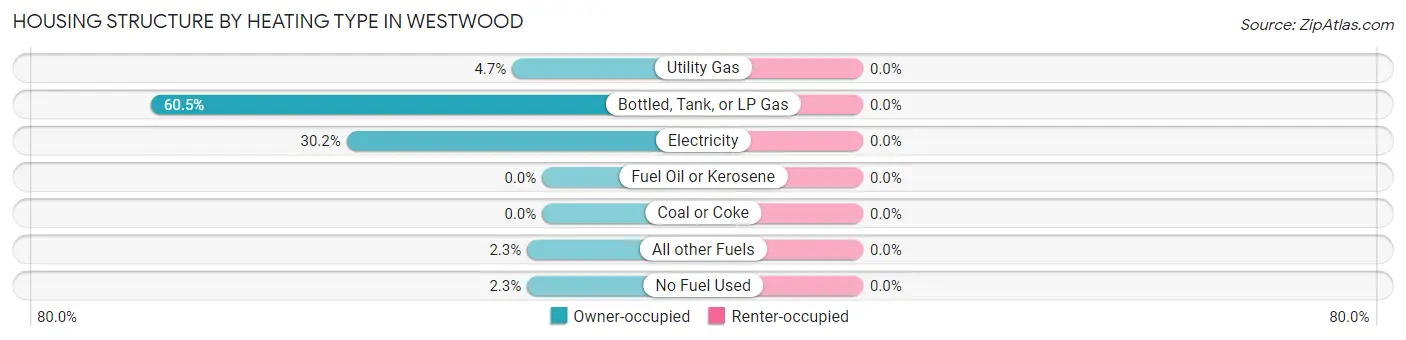
| Heating Type | Owner-occupied | Renter-occupied |
| Utility Gas | 2 (4.6%) | 0 (0.0%) |
| Bottled, Tank, or LP Gas | 26 (60.5%) | 0 (0.0%) |
| Electricity | 13 (30.2%) | 0 (0.0%) |
| Fuel Oil or Kerosene | 0 (0.0%) | 0 (0.0%) |
| Coal or Coke | 0 (0.0%) | 0 (0.0%) |
| All other Fuels | 1 (2.3%) | 0 (0.0%) |
| No Fuel Used | 1 (2.3%) | 0 (0.0%) |
| Total | 43 (100.0%) | 0 (0.0%) |
Household Vehicle Usage in Westwood
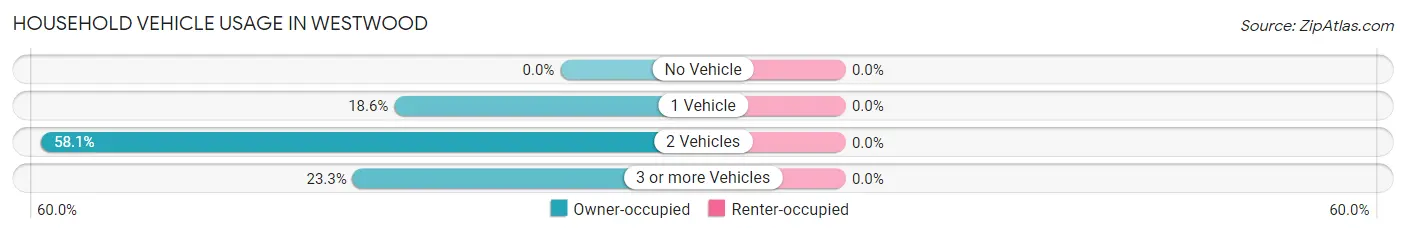
| Vehicles per Household | Owner-occupied | Renter-occupied |
| No Vehicle | 0 (0.0%) | 0 (0.0%) |
| 1 Vehicle | 8 (18.6%) | 0 (0.0%) |
| 2 Vehicles | 25 (58.1%) | 0 (0.0%) |
| 3 or more Vehicles | 10 (23.3%) | 0 (0.0%) |
| Total | 43 (100.0%) | 0 (0.0%) |
Real Estate & Mortgages in Westwood
Real Estate and Mortgage Overview in Westwood
| Characteristic | Without Mortgage | With Mortgage |
| Housing Units | 15 | 28 |
| Median Property Value | $246,400 | $236,400 |
| Median Household Income | $83,750 | $7 |
| Monthly Housing Costs | $670 | $2 |
| Real Estate Taxes | $4,083 | $0 |
Property Value by Mortgage Status in Westwood
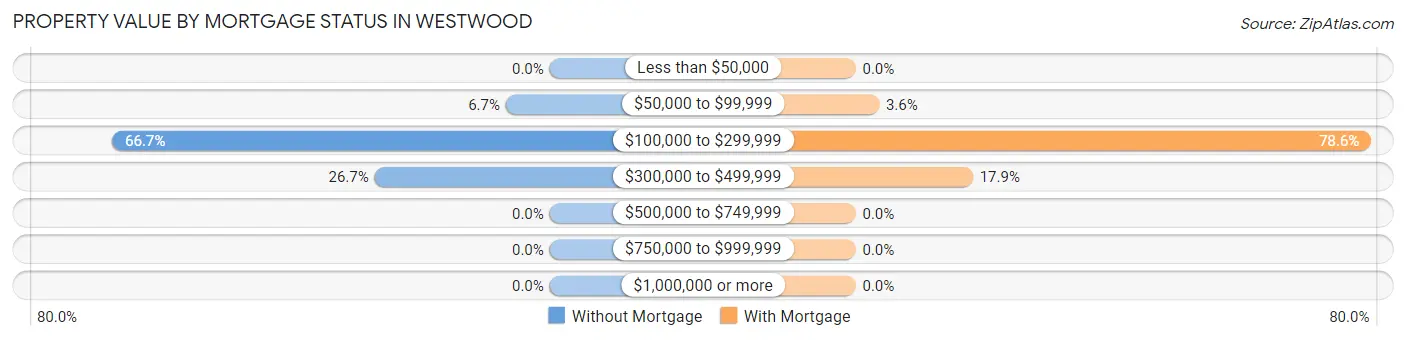
| Property Value | Without Mortgage | With Mortgage |
| Less than $50,000 | 0 (0.0%) | 0 (0.0%) |
| $50,000 to $99,999 | 1 (6.7%) | 1 (3.6%) |
| $100,000 to $299,999 | 10 (66.7%) | 22 (78.6%) |
| $300,000 to $499,999 | 4 (26.7%) | 5 (17.9%) |
| $500,000 to $749,999 | 0 (0.0%) | 0 (0.0%) |
| $750,000 to $999,999 | 0 (0.0%) | 0 (0.0%) |
| $1,000,000 or more | 0 (0.0%) | 0 (0.0%) |
| Total | 15 (100.0%) | 28 (100.0%) |
Household Income by Mortgage Status in Westwood
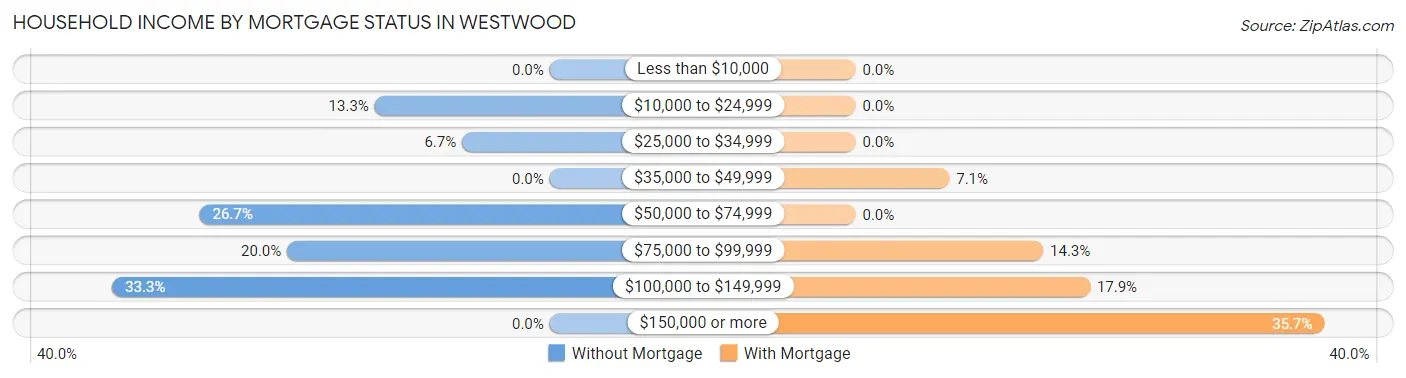
| Household Income | Without Mortgage | With Mortgage |
| Less than $10,000 | 0 (0.0%) | 0 (0.0%) |
| $10,000 to $24,999 | 2 (13.3%) | 0 (0.0%) |
| $25,000 to $34,999 | 1 (6.7%) | 0 (0.0%) |
| $35,000 to $49,999 | 0 (0.0%) | 2 (7.1%) |
| $50,000 to $74,999 | 4 (26.7%) | 0 (0.0%) |
| $75,000 to $99,999 | 3 (20.0%) | 4 (14.3%) |
| $100,000 to $149,999 | 5 (33.3%) | 5 (17.9%) |
| $150,000 or more | 0 (0.0%) | 10 (35.7%) |
| Total | 15 (100.0%) | 28 (100.0%) |
Property Value to Household Income Ratio in Westwood
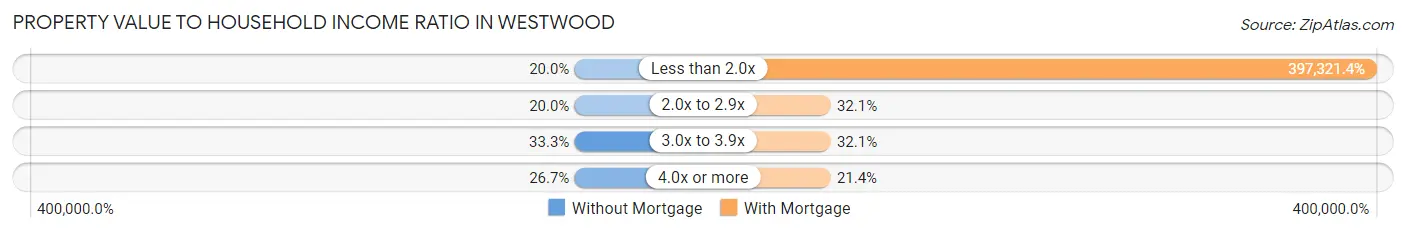
| Value-to-Income Ratio | Without Mortgage | With Mortgage |
| Less than 2.0x | 3 (20.0%) | 111,250 (397,321.4%) |
| 2.0x to 2.9x | 3 (20.0%) | 9 (32.1%) |
| 3.0x to 3.9x | 5 (33.3%) | 9 (32.1%) |
| 4.0x or more | 4 (26.7%) | 6 (21.4%) |
| Total | 15 (100.0%) | 28 (100.0%) |
Real Estate Taxes by Mortgage Status in Westwood
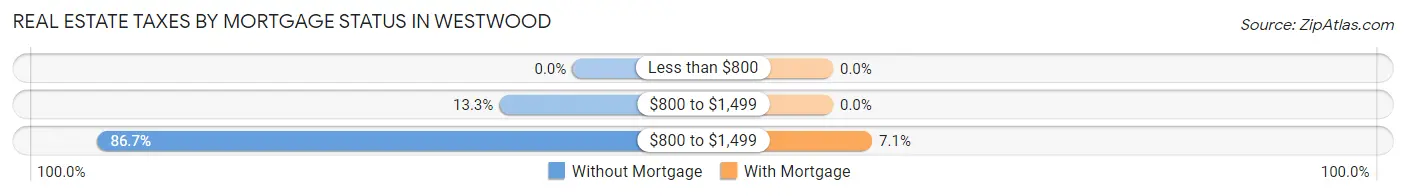
| Property Taxes | Without Mortgage | With Mortgage |
| Less than $800 | 0 (0.0%) | 0 (0.0%) |
| $800 to $1,499 | 2 (13.3%) | 0 (0.0%) |
| $800 to $1,499 | 13 (86.7%) | 2 (7.1%) |
| Total | 15 (100.0%) | 28 (100.0%) |
Health & Disability in Westwood
Health Insurance Coverage by Age in Westwood
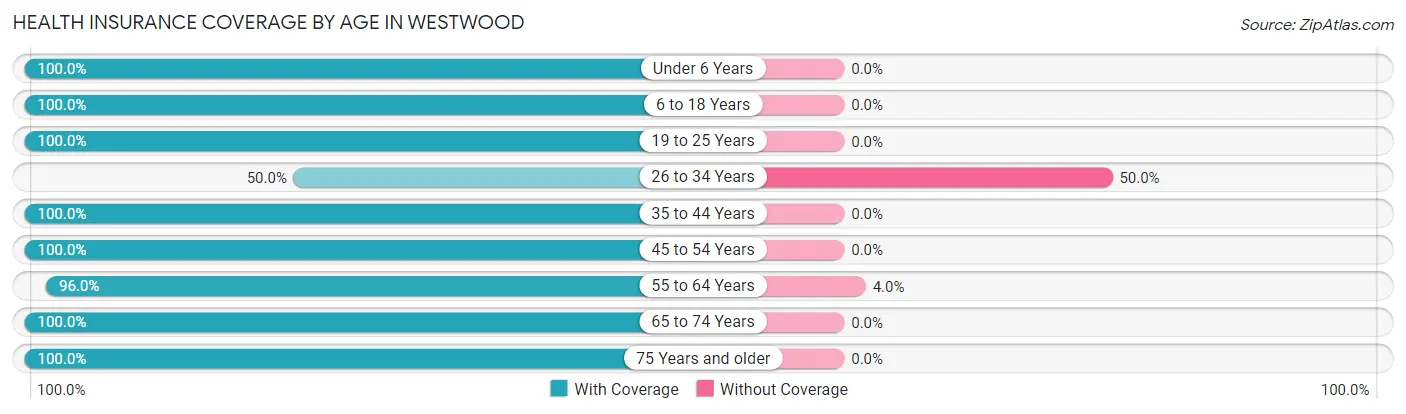
| Age Bracket | With Coverage | Without Coverage |
| Under 6 Years | 1 (100.0%) | 0 (0.0%) |
| 6 to 18 Years | 3 (100.0%) | 0 (0.0%) |
| 19 to 25 Years | 8 (100.0%) | 0 (0.0%) |
| 26 to 34 Years | 1 (50.0%) | 1 (50.0%) |
| 35 to 44 Years | 8 (100.0%) | 0 (0.0%) |
| 45 to 54 Years | 8 (100.0%) | 0 (0.0%) |
| 55 to 64 Years | 24 (96.0%) | 1 (4.0%) |
| 65 to 74 Years | 22 (100.0%) | 0 (0.0%) |
| 75 Years and older | 7 (100.0%) | 0 (0.0%) |
| Total | 82 (97.6%) | 2 (2.4%) |
Health Insurance Coverage by Citizenship Status in Westwood
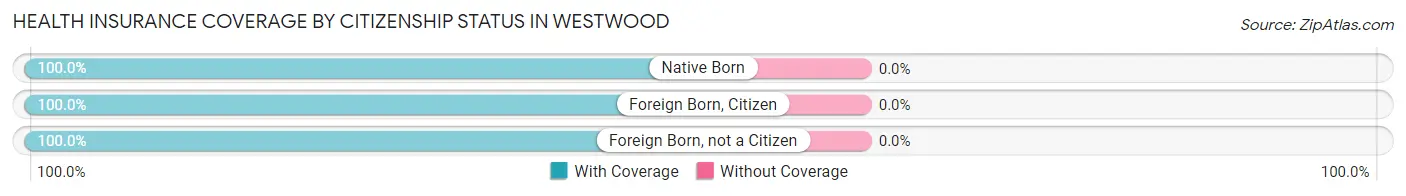
| Citizenship Status | With Coverage | Without Coverage |
| Native Born | 1 (100.0%) | 0 (0.0%) |
| Foreign Born, Citizen | 3 (100.0%) | 0 (0.0%) |
| Foreign Born, not a Citizen | 8 (100.0%) | 0 (0.0%) |
Health Insurance Coverage by Household Income in Westwood
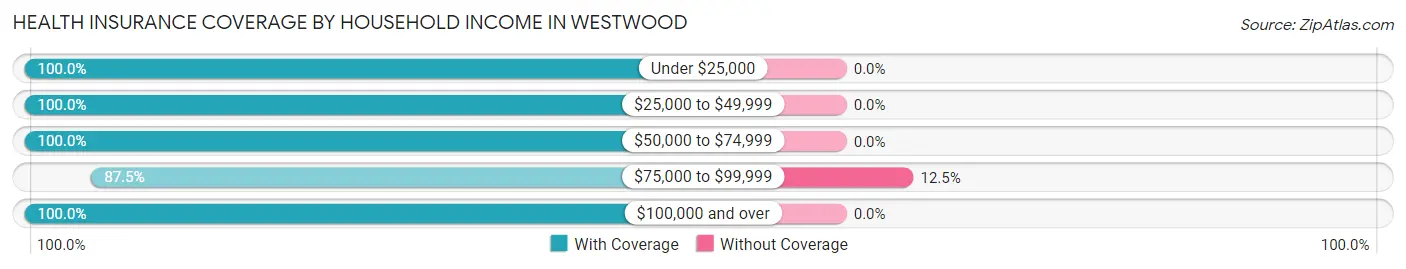
| Household Income | With Coverage | Without Coverage |
| Under $25,000 | 2 (100.0%) | 0 (0.0%) |
| $25,000 to $49,999 | 3 (100.0%) | 0 (0.0%) |
| $50,000 to $74,999 | 16 (100.0%) | 0 (0.0%) |
| $75,000 to $99,999 | 14 (87.5%) | 2 (12.5%) |
| $100,000 and over | 47 (100.0%) | 0 (0.0%) |
Public vs Private Health Insurance Coverage by Age in Westwood
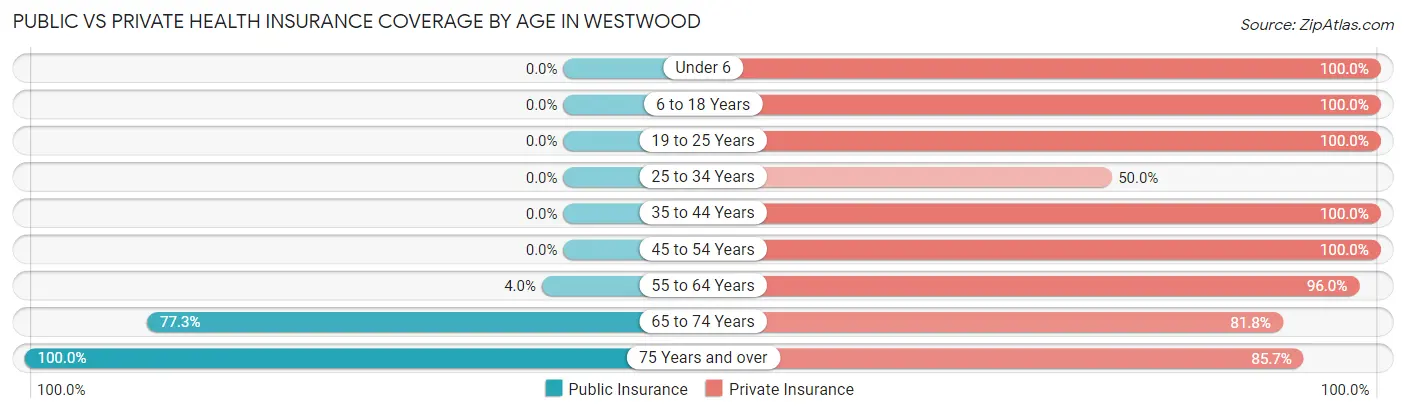
| Age Bracket | Public Insurance | Private Insurance |
| Under 6 | 0 (0.0%) | 1 (100.0%) |
| 6 to 18 Years | 0 (0.0%) | 3 (100.0%) |
| 19 to 25 Years | 0 (0.0%) | 8 (100.0%) |
| 25 to 34 Years | 0 (0.0%) | 1 (50.0%) |
| 35 to 44 Years | 0 (0.0%) | 8 (100.0%) |
| 45 to 54 Years | 0 (0.0%) | 8 (100.0%) |
| 55 to 64 Years | 1 (4.0%) | 24 (96.0%) |
| 65 to 74 Years | 17 (77.3%) | 18 (81.8%) |
| 75 Years and over | 7 (100.0%) | 6 (85.7%) |
| Total | 25 (29.8%) | 77 (91.7%) |
Disability Status by Sex by Age in Westwood
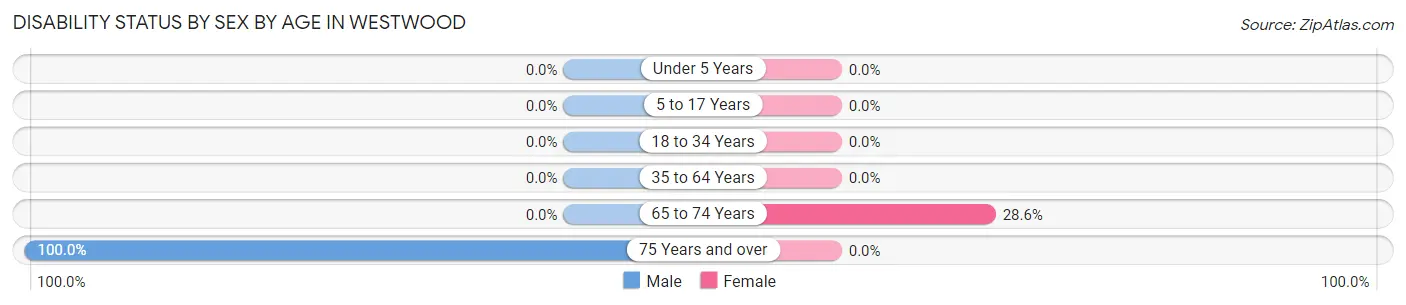
| Age Bracket | Male | Female |
| Under 5 Years | 0 (0.0%) | 0 (0.0%) |
| 5 to 17 Years | 0 (0.0%) | 0 (0.0%) |
| 18 to 34 Years | 0 (0.0%) | 0 (0.0%) |
| 35 to 64 Years | 0 (0.0%) | 0 (0.0%) |
| 65 to 74 Years | 0 (0.0%) | 2 (28.6%) |
| 75 Years and over | 2 (100.0%) | 0 (0.0%) |
Disability Class by Sex by Age in Westwood
Disability Class: Hearing Difficulty
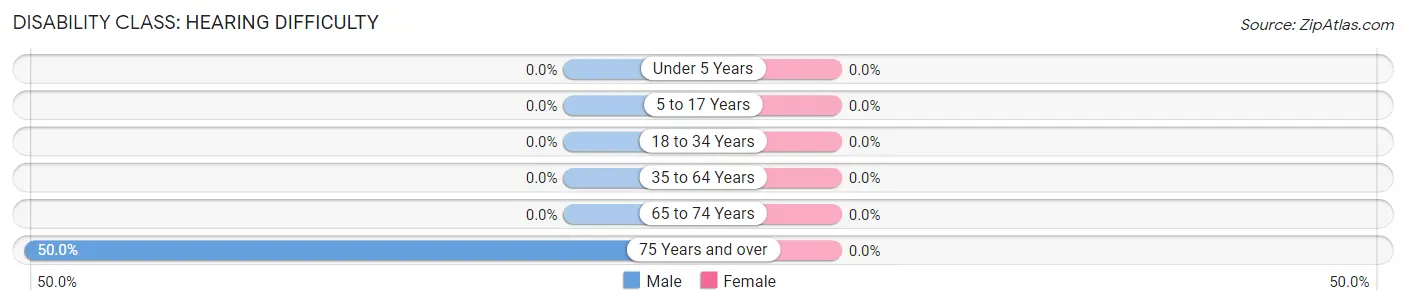
| Age Bracket | Male | Female |
| Under 5 Years | 0 (0.0%) | 0 (0.0%) |
| 5 to 17 Years | 0 (0.0%) | 0 (0.0%) |
| 18 to 34 Years | 0 (0.0%) | 0 (0.0%) |
| 35 to 64 Years | 0 (0.0%) | 0 (0.0%) |
| 65 to 74 Years | 0 (0.0%) | 0 (0.0%) |
| 75 Years and over | 1 (50.0%) | 0 (0.0%) |
Disability Class: Vision Difficulty
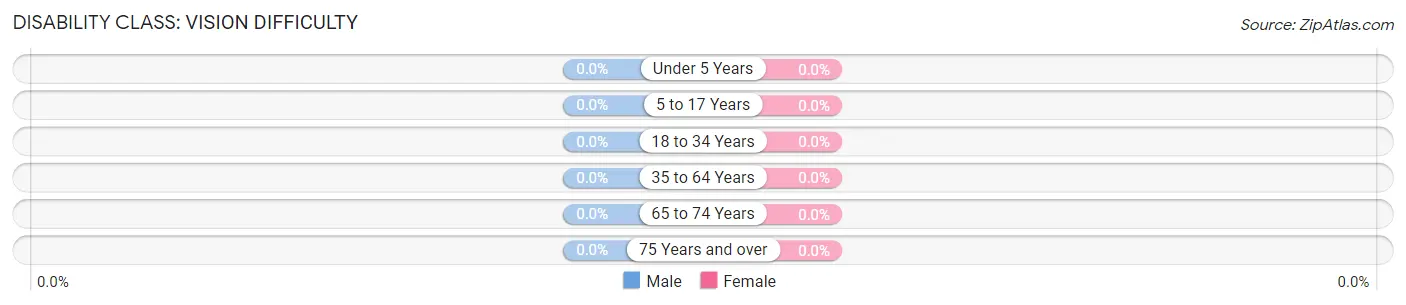
| Age Bracket | Male | Female |
| Under 5 Years | 0 (0.0%) | 0 (0.0%) |
| 5 to 17 Years | 0 (0.0%) | 0 (0.0%) |
| 18 to 34 Years | 0 (0.0%) | 0 (0.0%) |
| 35 to 64 Years | 0 (0.0%) | 0 (0.0%) |
| 65 to 74 Years | 0 (0.0%) | 0 (0.0%) |
| 75 Years and over | 0 (0.0%) | 0 (0.0%) |
Disability Class: Cognitive Difficulty
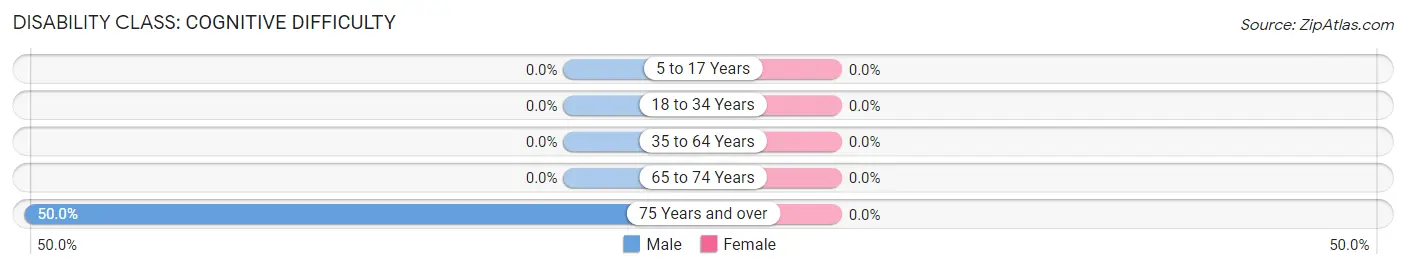
| Age Bracket | Male | Female |
| 5 to 17 Years | 0 (0.0%) | 0 (0.0%) |
| 18 to 34 Years | 0 (0.0%) | 0 (0.0%) |
| 35 to 64 Years | 0 (0.0%) | 0 (0.0%) |
| 65 to 74 Years | 0 (0.0%) | 0 (0.0%) |
| 75 Years and over | 1 (50.0%) | 0 (0.0%) |
Disability Class: Ambulatory Difficulty
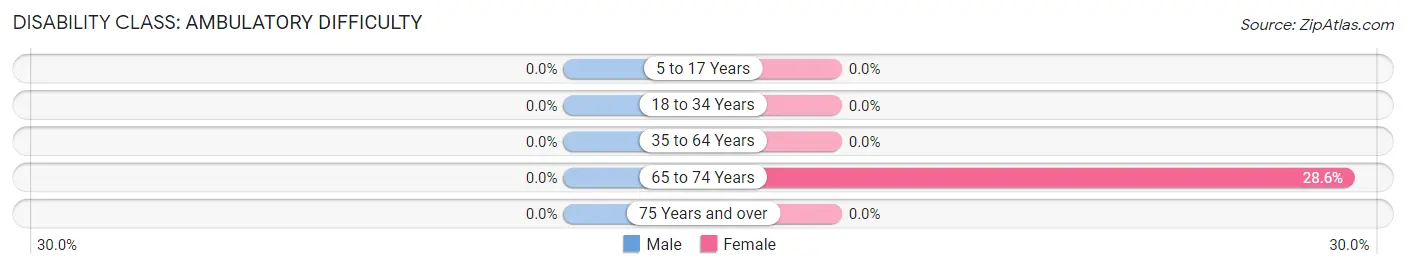
| Age Bracket | Male | Female |
| 5 to 17 Years | 0 (0.0%) | 0 (0.0%) |
| 18 to 34 Years | 0 (0.0%) | 0 (0.0%) |
| 35 to 64 Years | 0 (0.0%) | 0 (0.0%) |
| 65 to 74 Years | 0 (0.0%) | 2 (28.6%) |
| 75 Years and over | 0 (0.0%) | 0 (0.0%) |
Disability Class: Self-Care Difficulty
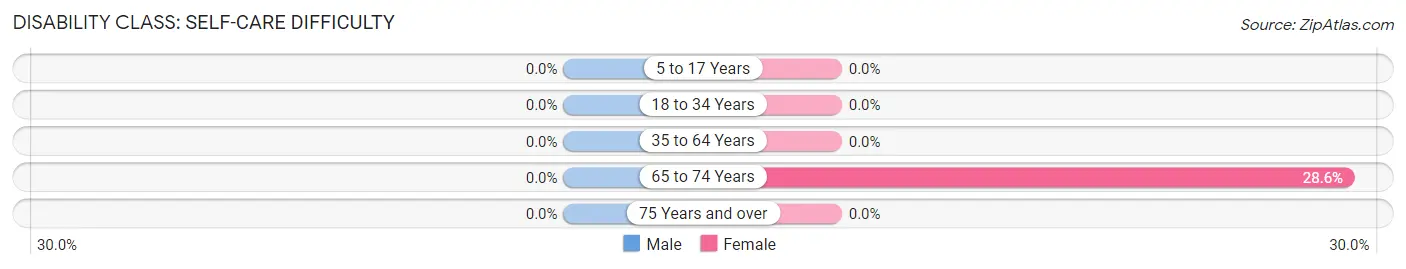
| Age Bracket | Male | Female |
| 5 to 17 Years | 0 (0.0%) | 0 (0.0%) |
| 18 to 34 Years | 0 (0.0%) | 0 (0.0%) |
| 35 to 64 Years | 0 (0.0%) | 0 (0.0%) |
| 65 to 74 Years | 0 (0.0%) | 2 (28.6%) |
| 75 Years and over | 0 (0.0%) | 0 (0.0%) |
Technology Access in Westwood
Computing Device Access in Westwood
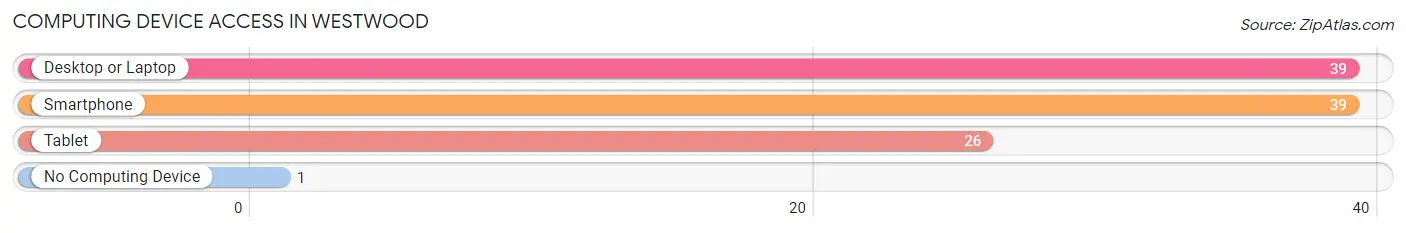
| Device Type | # Households | % Households |
| Desktop or Laptop | 39 | 90.7% |
| Smartphone | 39 | 90.7% |
| Tablet | 26 | 60.5% |
| No Computing Device | 1 | 2.3% |
| Total | 43 | 100.0% |
Internet Access in Westwood
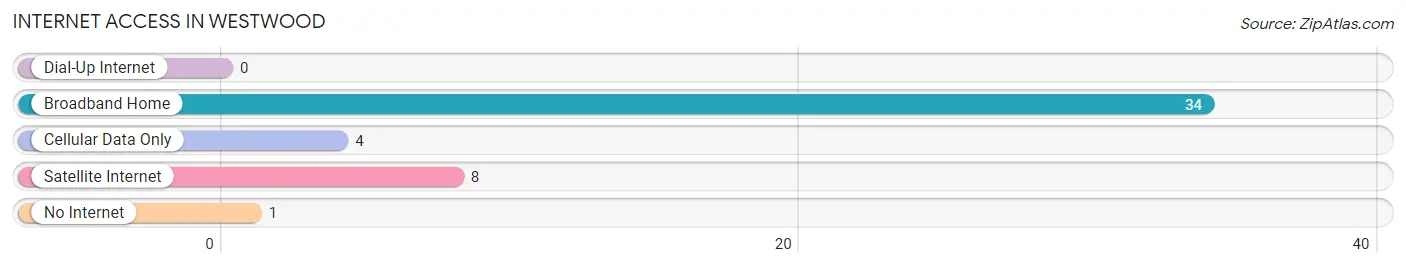
| Internet Type | # Households | % Households |
| Dial-Up Internet | 0 | 0.0% |
| Broadband Home | 34 | 79.1% |
| Cellular Data Only | 4 | 9.3% |
| Satellite Internet | 8 | 18.6% |
| No Internet | 1 | 2.3% |
| Total | 43 | 100.0% |
Westwood Summary
Westwood, Iowa is a small city located in the western part of the state, in the county of Pottawattamie. It is situated on the banks of the Missouri River, and is part of the Omaha-Council Bluffs metropolitan area. The city has a population of approximately 1,500 people, and is home to a variety of businesses, including a number of small manufacturing companies.
Geography
Westwood is located in the western part of Pottawattamie County, Iowa, on the banks of the Missouri River. The city is situated at an elevation of 1,068 feet above sea level, and is located approximately 25 miles south of Omaha, Nebraska. The city is bordered by the cities of Council Bluffs and Carter Lake to the north, and by the cities of Avoca and Minden to the south. The city is located in the Central Lowland region of the United States, and is characterized by rolling hills and flat plains.
Climate
Westwood has a humid continental climate, with hot summers and cold winters. The average temperature in the summer months is around 75 degrees Fahrenheit, while the average temperature in the winter months is around 25 degrees Fahrenheit. The city receives an average of 36 inches of precipitation per year, with most of the precipitation occurring in the spring and summer months.
Demographics
As of the 2010 census, Westwood had a population of 1,500 people. The racial makeup of the city was 95.3% White, 0.7% African American, 0.3% Native American, 0.7% Asian, 0.3% from other races, and 2.0% from two or more races. Hispanic or Latino of any race were 1.3% of the population.
Economy
Westwood is home to a variety of businesses, including a number of small manufacturing companies. The city is also home to a number of retail stores, restaurants, and other service-oriented businesses. The city is also home to a number of agricultural businesses, including a number of farms and ranches.
The city is served by the Westwood Municipal Airport, which is located just outside of the city limits. The airport is used primarily for general aviation, and is home to a number of private aircraft.
Education
Westwood is served by the Westwood Community School District, which consists of two elementary schools, one middle school, and one high school. The district also operates a number of alternative education programs, including a virtual academy and a home school program. The district also operates a number of extracurricular activities, including sports teams, music programs, and other clubs and organizations.
Conclusion
Westwood, Iowa is a small city located in the western part of the state, in the county of Pottawattamie. It is situated on the banks of the Missouri River, and is part of the Omaha-Council Bluffs metropolitan area. The city has a population of approximately 1,500 people, and is home to a variety of businesses, including a number of small manufacturing companies. The city is served by the Westwood Community School District, which consists of two elementary schools, one middle school, and one high school. The city is also home to a number of agricultural businesses, including a number of farms and ranches. Westwood is a great place to live, work, and raise a family, and is a great example of a small city with a big heart.
Common Questions
What is Per Capita Income in Westwood?
Per Capita income in Westwood is $50,254.
What is the Median Family Income in Westwood?
Median Family Income in Westwood is $111,250.
What is the Median Household income in Westwood?
Median Household Income in Westwood is $100,625.
What is Income or Wage Gap in Westwood?
Income or Wage Gap in Westwood is 22.4%.
Women in Westwood earn 77.6 cents for every dollar earned by a man.
What is Inequality or Gini Index in Westwood?
Inequality or Gini Index in Westwood is 0.24.
What is the Total Population of Westwood?
Total Population of Westwood is 84.
What is the Total Male Population of Westwood?
Total Male Population of Westwood is 39.
What is the Total Female Population of Westwood?
Total Female Population of Westwood is 45.
What is the Ratio of Males per 100 Females in Westwood?
There are 86.67 Males per 100 Females in Westwood.
What is the Ratio of Females per 100 Males in Westwood?
There are 115.38 Females per 100 Males in Westwood.
What is the Median Population Age in Westwood?
Median Population Age in Westwood is 60.8 Years.
What is the Average Family Size in Westwood
Average Family Size in Westwood is 2.2 People.
What is the Average Household Size in Westwood
Average Household Size in Westwood is 1.9 People.
How Large is the Labor Force in Westwood?
There are 52 People in the Labor Forcein in Westwood.
What is the Percentage of People in the Labor Force in Westwood?
65.0% of People are in the Labor Force in Westwood.