Westphalia, IA Map & Demographics
Westphalia Map
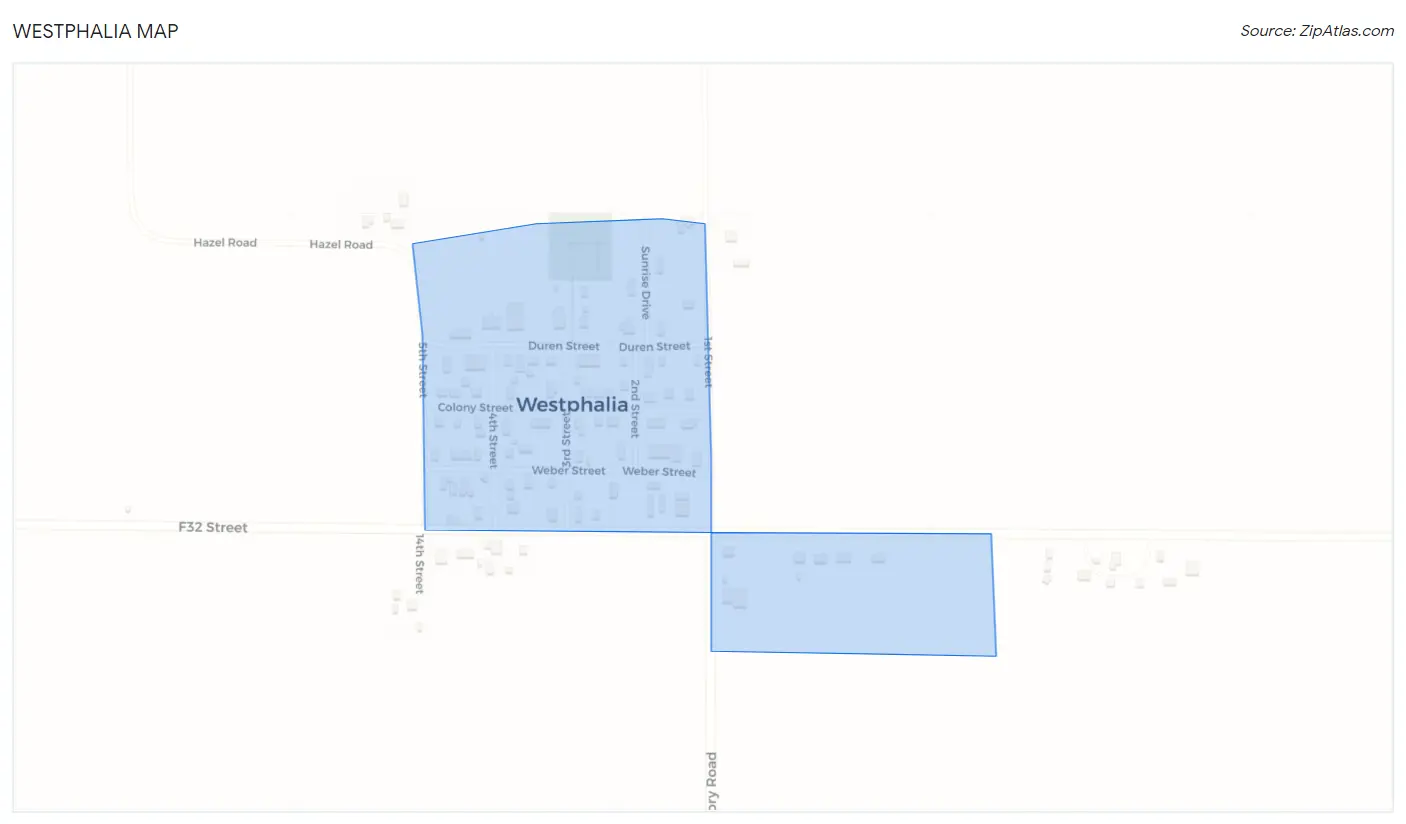
Westphalia Overview
$45,613
PER CAPITA INCOME
$103,636
AVG FAMILY INCOME
$102,955
AVG HOUSEHOLD INCOME
37.4%
WAGE / INCOME GAP [ % ]
62.6¢/ $1
WAGE / INCOME GAP [ $ ]
0.39
INEQUALITY / GINI INDEX
144
TOTAL POPULATION
60
MALE POPULATION
84
FEMALE POPULATION
71.43
MALES / 100 FEMALES
140.00
FEMALES / 100 MALES
58.2
MEDIAN AGE
2.6
AVG FAMILY SIZE
2.4
AVG HOUSEHOLD SIZE
91
LABOR FORCE [ PEOPLE ]
71.1%
PERCENT IN LABOR FORCE
Westphalia Zip Codes
Westphalia Area Codes
Income in Westphalia
Income Overview in Westphalia
Per Capita Income in Westphalia is $45,613, while median incomes of families and households are $103,636 and $102,955 respectively.
| Characteristic | Number | Measure |
| Per Capita Income | 144 | $45,613 |
| Median Family Income | 48 | $103,636 |
| Mean Family Income | 48 | $132,394 |
| Median Household Income | 60 | $102,955 |
| Mean Household Income | 60 | $117,643 |
| Income Deficit | 48 | $0 |
| Wage / Income Gap (%) | 144 | 37.38% |
| Wage / Income Gap ($) | 144 | 62.62¢ per $1 |
| Gini / Inequality Index | 144 | 0.39 |
Earnings by Sex in Westphalia
Average Earnings in Westphalia are $36,429, $51,042 for men and $31,964 for women, a difference of 37.4%.
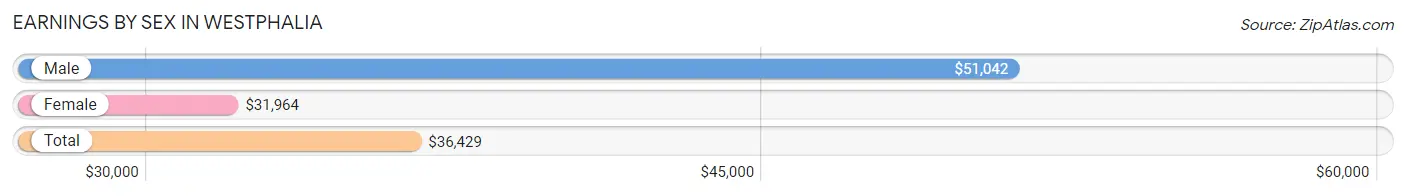
| Sex | Number | Average Earnings |
| Male | 53 (52.0%) | $51,042 |
| Female | 49 (48.0%) | $31,964 |
| Total | 102 (100.0%) | $36,429 |
Earnings by Sex by Income Bracket in Westphalia
The most common earnings brackets in Westphalia are $75,000 to $99,999 for men (9 | 17.0%) and $30,000 to $34,999 for women (11 | 22.5%).
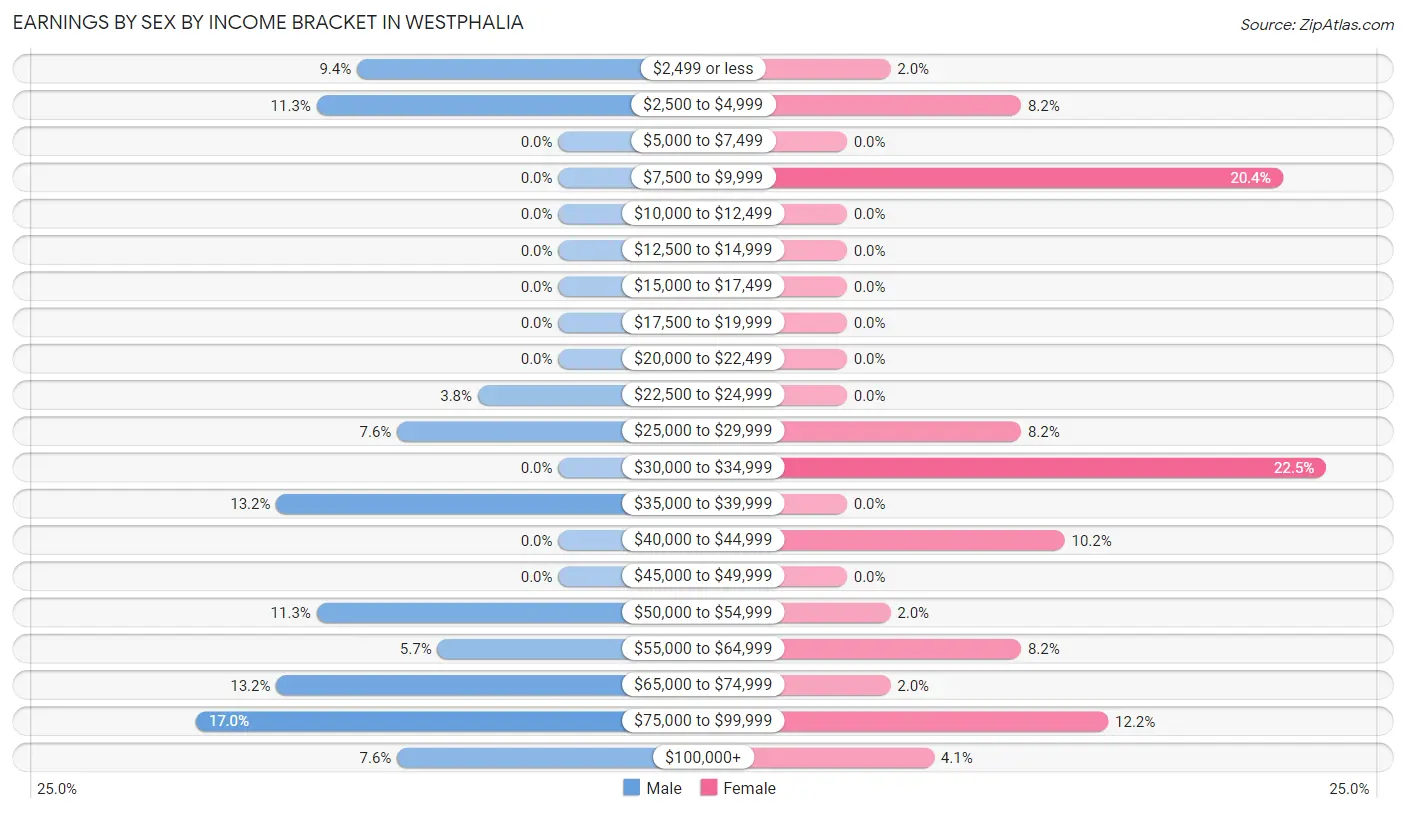
| Income | Male | Female |
| $2,499 or less | 5 (9.4%) | 1 (2.0%) |
| $2,500 to $4,999 | 6 (11.3%) | 4 (8.2%) |
| $5,000 to $7,499 | 0 (0.0%) | 0 (0.0%) |
| $7,500 to $9,999 | 0 (0.0%) | 10 (20.4%) |
| $10,000 to $12,499 | 0 (0.0%) | 0 (0.0%) |
| $12,500 to $14,999 | 0 (0.0%) | 0 (0.0%) |
| $15,000 to $17,499 | 0 (0.0%) | 0 (0.0%) |
| $17,500 to $19,999 | 0 (0.0%) | 0 (0.0%) |
| $20,000 to $22,499 | 0 (0.0%) | 0 (0.0%) |
| $22,500 to $24,999 | 2 (3.8%) | 0 (0.0%) |
| $25,000 to $29,999 | 4 (7.5%) | 4 (8.2%) |
| $30,000 to $34,999 | 0 (0.0%) | 11 (22.5%) |
| $35,000 to $39,999 | 7 (13.2%) | 0 (0.0%) |
| $40,000 to $44,999 | 0 (0.0%) | 5 (10.2%) |
| $45,000 to $49,999 | 0 (0.0%) | 0 (0.0%) |
| $50,000 to $54,999 | 6 (11.3%) | 1 (2.0%) |
| $55,000 to $64,999 | 3 (5.7%) | 4 (8.2%) |
| $65,000 to $74,999 | 7 (13.2%) | 1 (2.0%) |
| $75,000 to $99,999 | 9 (17.0%) | 6 (12.2%) |
| $100,000+ | 4 (7.5%) | 2 (4.1%) |
| Total | 53 (100.0%) | 49 (100.0%) |
Earnings by Sex by Educational Attainment in Westphalia
Average earnings in Westphalia are $51,042 for men and $38,750 for women, a difference of 24.1%. Men with an educational attainment of college or associate's degree enjoy the highest average annual earnings of $80,938, while those with high school diploma education earn the least with $35,893. Women with an educational attainment of college or associate's degree earn the most with the average annual earnings of $61,875, while those with high school diploma education have the smallest earnings of $31,250.
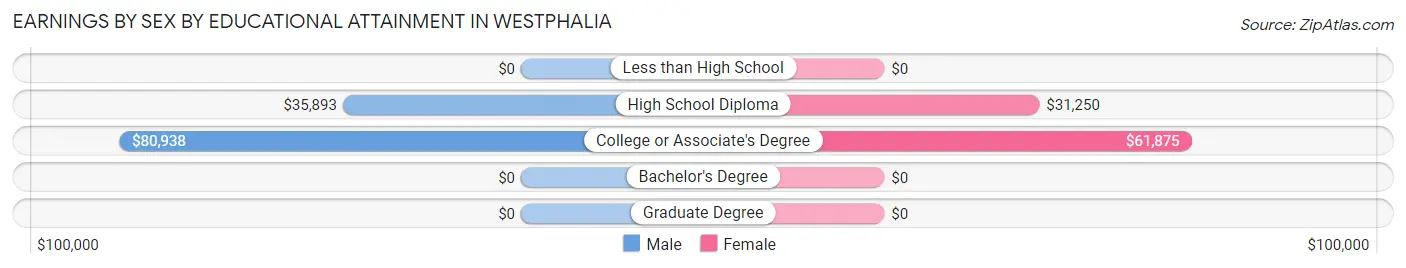
| Educational Attainment | Male Income | Female Income |
| Less than High School | - | - |
| High School Diploma | $35,893 | $31,250 |
| College or Associate's Degree | $80,938 | $61,875 |
| Bachelor's Degree | - | - |
| Graduate Degree | - | - |
| Total | $51,042 | $38,750 |
Family Income in Westphalia
Family Income Brackets in Westphalia
According to the Westphalia family income data, there are 14 families falling into the $100,000 to $149,999 income range, which is the most common income bracket and makes up 29.2% of all families.
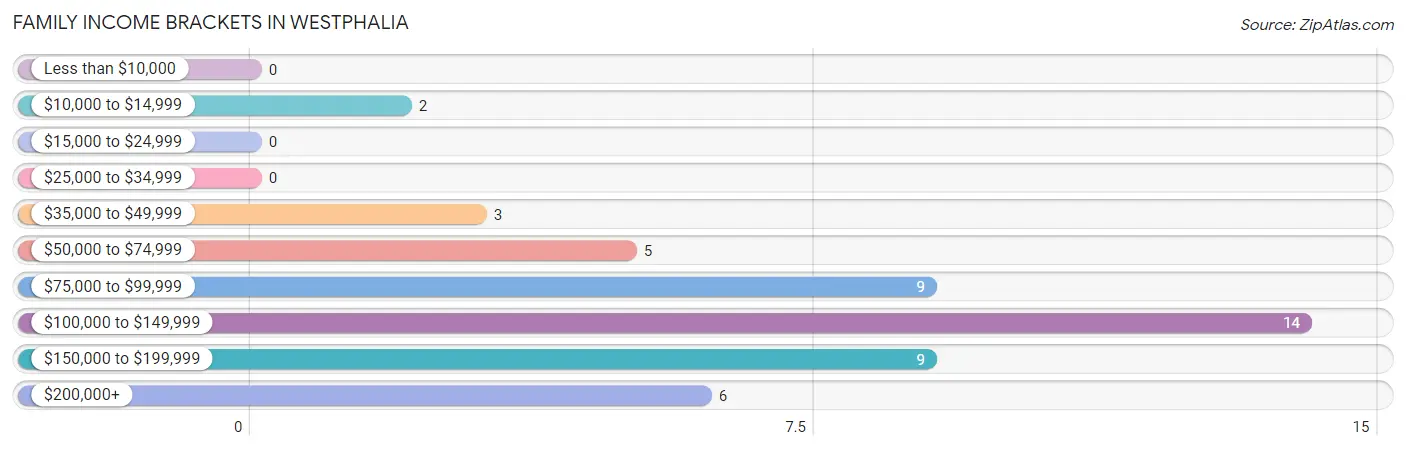
| Income Bracket | # Families | % Families |
| Less than $10,000 | 0 | 0.0% |
| $10,000 to $14,999 | 2 | 4.2% |
| $15,000 to $24,999 | 0 | 0.0% |
| $25,000 to $34,999 | 0 | 0.0% |
| $35,000 to $49,999 | 3 | 6.3% |
| $50,000 to $74,999 | 5 | 10.4% |
| $75,000 to $99,999 | 9 | 18.8% |
| $100,000 to $149,999 | 14 | 29.2% |
| $150,000 to $199,999 | 9 | 18.8% |
| $200,000+ | 6 | 12.5% |
Family Income by Famaliy Size in Westphalia
2-person families (33 | 68.8%) account for the highest median family income in Westphalia with $103,068 per family, while 2-person families (33 | 68.8%) have the highest median income of $51,534 per family member.
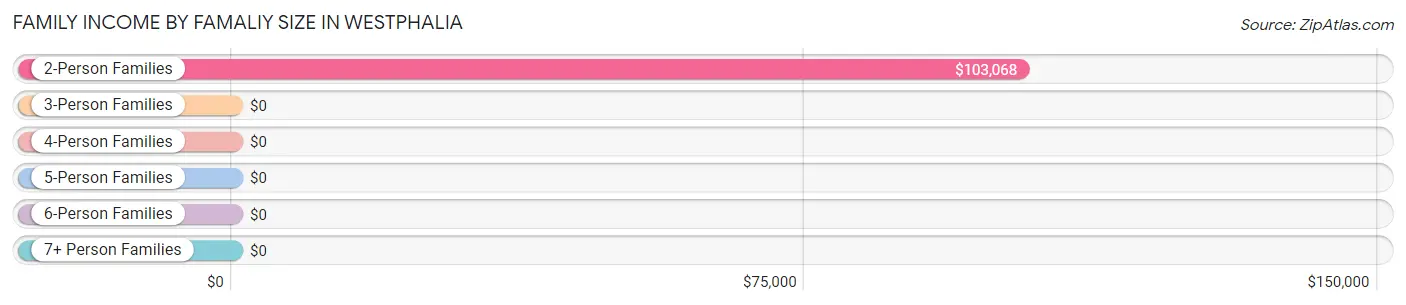
| Income Bracket | # Families | Median Income |
| 2-Person Families | 33 (68.8%) | $103,068 |
| 3-Person Families | 6 (12.5%) | $0 |
| 4-Person Families | 0 (0.0%) | $0 |
| 5-Person Families | 5 (10.4%) | $0 |
| 6-Person Families | 4 (8.3%) | $0 |
| 7+ Person Families | 0 (0.0%) | $0 |
| Total | 48 (100.0%) | $103,636 |
Family Income by Number of Earners in Westphalia
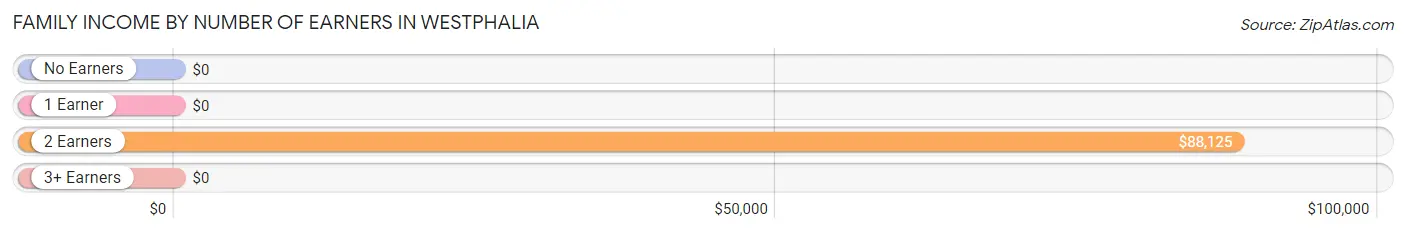
| Number of Earners | # Families | Median Income |
| No Earners | 2 (4.2%) | $0 |
| 1 Earner | 13 (27.1%) | $0 |
| 2 Earners | 24 (50.0%) | $88,125 |
| 3+ Earners | 9 (18.8%) | $0 |
| Total | 48 (100.0%) | $103,636 |
Household Income in Westphalia
Household Income Brackets in Westphalia
With 17 households falling in the category, the $100,000 to $149,999 income range is the most frequent in Westphalia, accounting for 28.3% of all households.
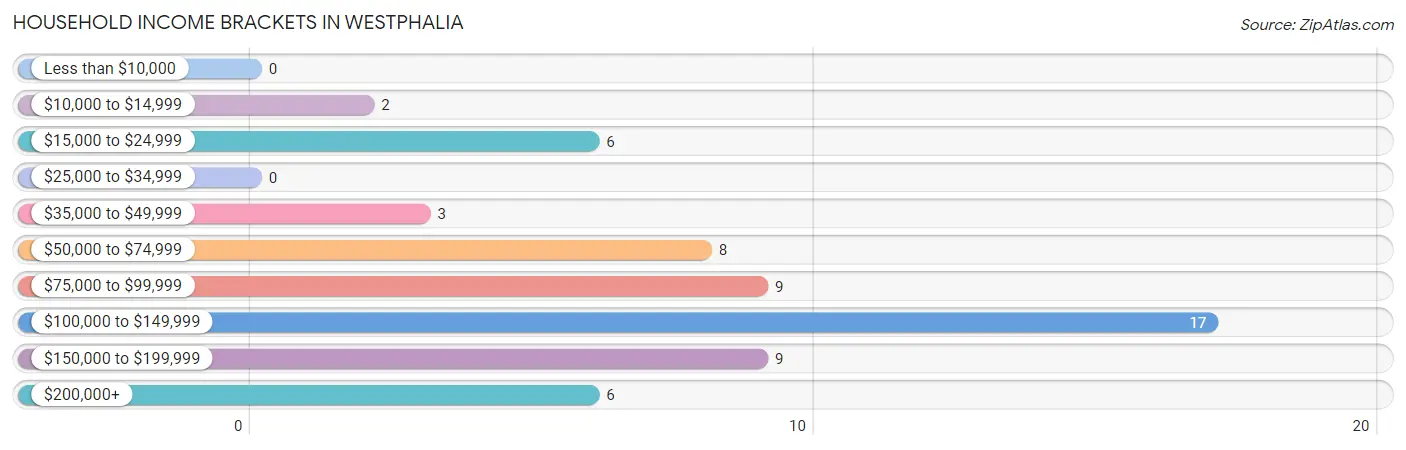
| Income Bracket | # Households | % Households |
| Less than $10,000 | 0 | 0.0% |
| $10,000 to $14,999 | 2 | 3.3% |
| $15,000 to $24,999 | 6 | 10.0% |
| $25,000 to $34,999 | 0 | 0.0% |
| $35,000 to $49,999 | 3 | 5.0% |
| $50,000 to $74,999 | 8 | 13.3% |
| $75,000 to $99,999 | 9 | 15.0% |
| $100,000 to $149,999 | 17 | 28.3% |
| $150,000 to $199,999 | 9 | 15.0% |
| $200,000+ | 6 | 10.0% |
Household Income by Householder Age in Westphalia
The median household income in Westphalia is $102,955, with the highest median household income of $135,833 found in the 45 to 64 years age bracket for the primary householder. A total of 24 households (40.0%) fall into this category.
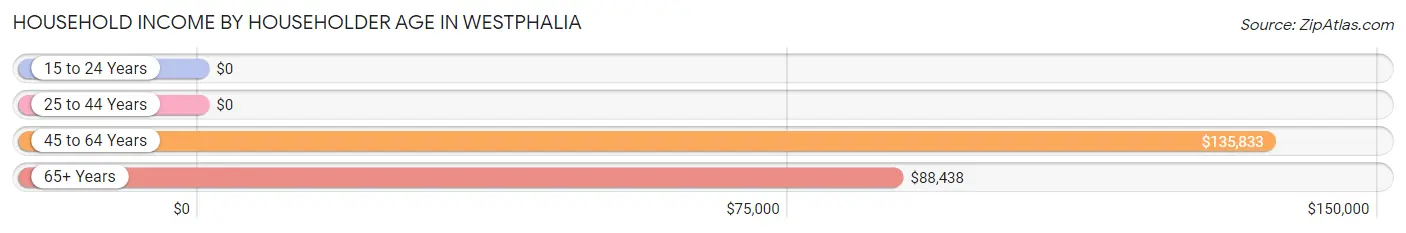
| Income Bracket | # Households | Median Income |
| 15 to 24 Years | 0 (0.0%) | $0 |
| 25 to 44 Years | 9 (15.0%) | $0 |
| 45 to 64 Years | 24 (40.0%) | $135,833 |
| 65+ Years | 27 (45.0%) | $88,438 |
| Total | 60 (100.0%) | $102,955 |
Poverty in Westphalia
Income Below Poverty by Sex and Age in Westphalia
With 3.3% poverty level for males and 5.9% for females among the residents of Westphalia, 6 to 11 year old males and 25 to 34 year old females are the most vulnerable to poverty, with 2 males (40.0%) and 2 females (22.2%) in their respective age groups living below the poverty level.
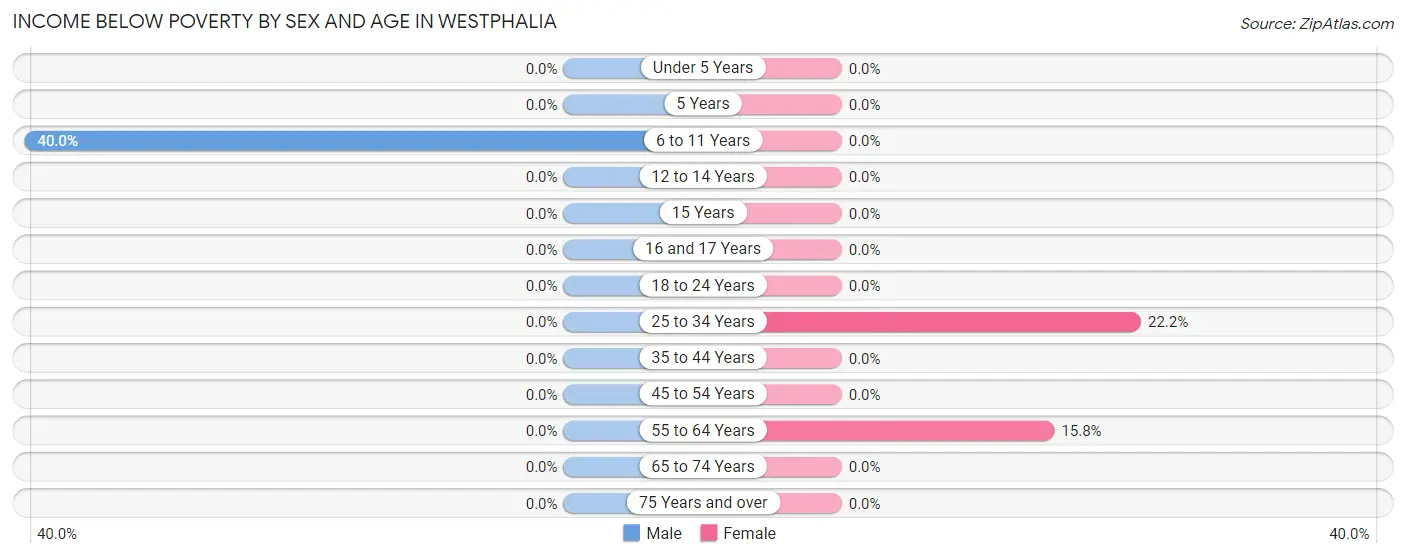
| Age Bracket | Male | Female |
| Under 5 Years | 0 (0.0%) | 0 (0.0%) |
| 5 Years | 0 (0.0%) | 0 (0.0%) |
| 6 to 11 Years | 2 (40.0%) | 0 (0.0%) |
| 12 to 14 Years | 0 (0.0%) | 0 (0.0%) |
| 15 Years | 0 (0.0%) | 0 (0.0%) |
| 16 and 17 Years | 0 (0.0%) | 0 (0.0%) |
| 18 to 24 Years | 0 (0.0%) | 0 (0.0%) |
| 25 to 34 Years | 0 (0.0%) | 2 (22.2%) |
| 35 to 44 Years | 0 (0.0%) | 0 (0.0%) |
| 45 to 54 Years | 0 (0.0%) | 0 (0.0%) |
| 55 to 64 Years | 0 (0.0%) | 3 (15.8%) |
| 65 to 74 Years | 0 (0.0%) | 0 (0.0%) |
| 75 Years and over | 0 (0.0%) | 0 (0.0%) |
| Total | 2 (3.3%) | 5 (5.9%) |
Income Above Poverty by Sex and Age in Westphalia
According to the poverty statistics in Westphalia, males aged 25 to 34 years and females aged 6 to 11 years are the age groups that are most secure financially, with 100.0% of males and 100.0% of females in these age groups living above the poverty line.
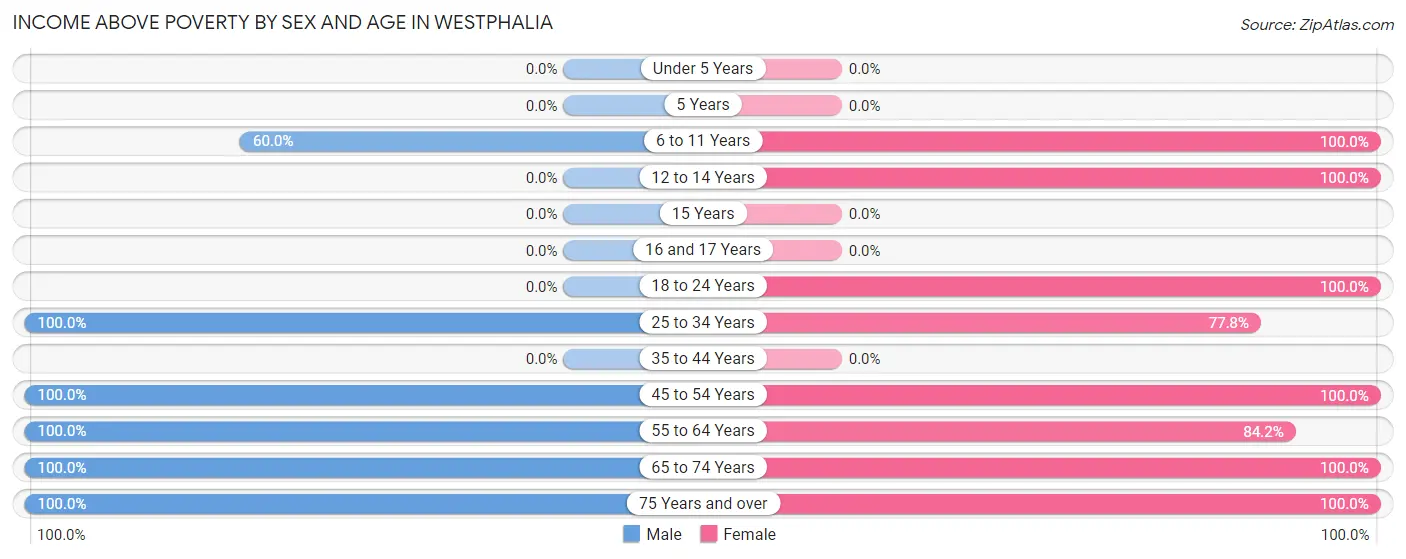
| Age Bracket | Male | Female |
| Under 5 Years | 0 (0.0%) | 0 (0.0%) |
| 5 Years | 0 (0.0%) | 0 (0.0%) |
| 6 to 11 Years | 3 (60.0%) | 5 (100.0%) |
| 12 to 14 Years | 0 (0.0%) | 6 (100.0%) |
| 15 Years | 0 (0.0%) | 0 (0.0%) |
| 16 and 17 Years | 0 (0.0%) | 0 (0.0%) |
| 18 to 24 Years | 0 (0.0%) | 11 (100.0%) |
| 25 to 34 Years | 9 (100.0%) | 7 (77.8%) |
| 35 to 44 Years | 0 (0.0%) | 0 (0.0%) |
| 45 to 54 Years | 11 (100.0%) | 8 (100.0%) |
| 55 to 64 Years | 18 (100.0%) | 16 (84.2%) |
| 65 to 74 Years | 7 (100.0%) | 6 (100.0%) |
| 75 Years and over | 10 (100.0%) | 20 (100.0%) |
| Total | 58 (96.7%) | 79 (94.1%) |
Income Below Poverty Among Married-Couple Families in Westphalia
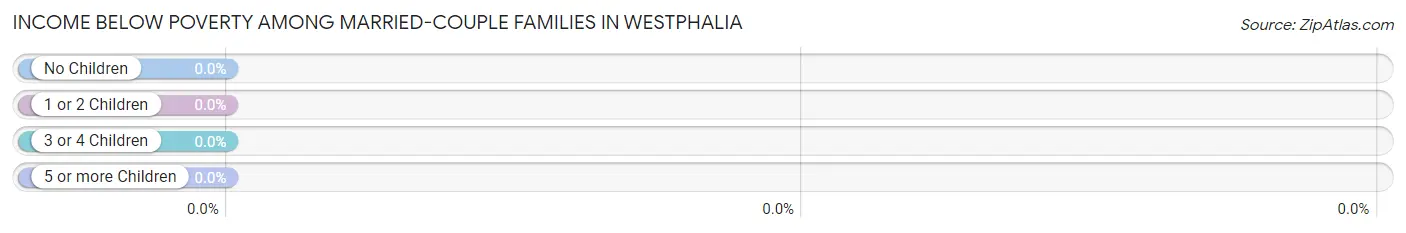
| Children | Above Poverty | Below Poverty |
| No Children | 33 (100.0%) | 0 (0.0%) |
| 1 or 2 Children | 10 (100.0%) | 0 (0.0%) |
| 3 or 4 Children | 0 (0.0%) | 0 (0.0%) |
| 5 or more Children | 0 (0.0%) | 0 (0.0%) |
| Total | 43 (100.0%) | 0 (0.0%) |
Income Below Poverty Among Single-Parent Households in Westphalia
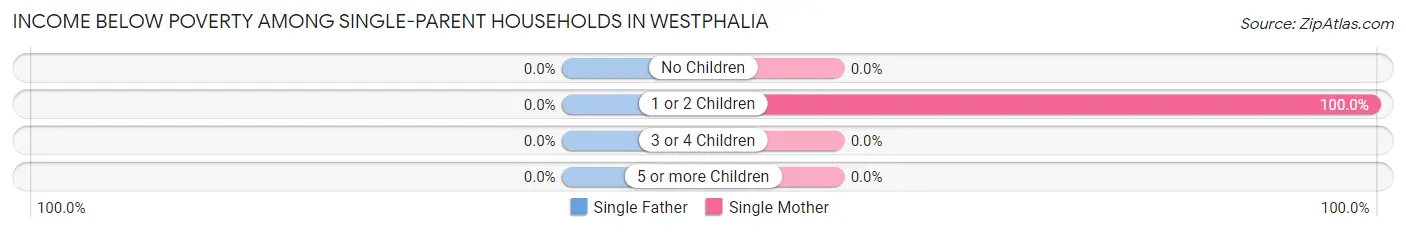
| Children | Single Father | Single Mother |
| No Children | 0 (0.0%) | 0 (0.0%) |
| 1 or 2 Children | 0 (0.0%) | 2 (100.0%) |
| 3 or 4 Children | 0 (0.0%) | 0 (0.0%) |
| 5 or more Children | 0 (0.0%) | 0 (0.0%) |
| Total | 0 (0.0%) | 2 (40.0%) |
Income Below Poverty Among Married-Couple vs Single-Parent Households in Westphalia
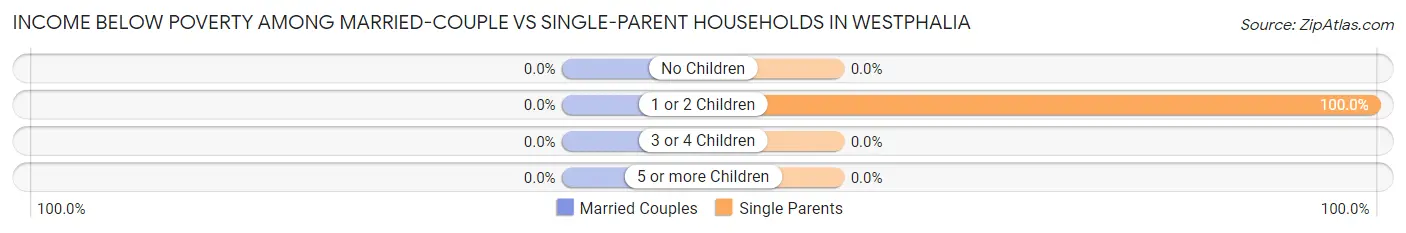
| Children | Married-Couple Families | Single-Parent Households |
| No Children | 0 (0.0%) | 0 (0.0%) |
| 1 or 2 Children | 0 (0.0%) | 2 (100.0%) |
| 3 or 4 Children | 0 (0.0%) | 0 (0.0%) |
| 5 or more Children | 0 (0.0%) | 0 (0.0%) |
| Total | 0 (0.0%) | 2 (40.0%) |
Race in Westphalia
The most populous races in Westphalia are , and White / Caucasian (144 | 100.0%).
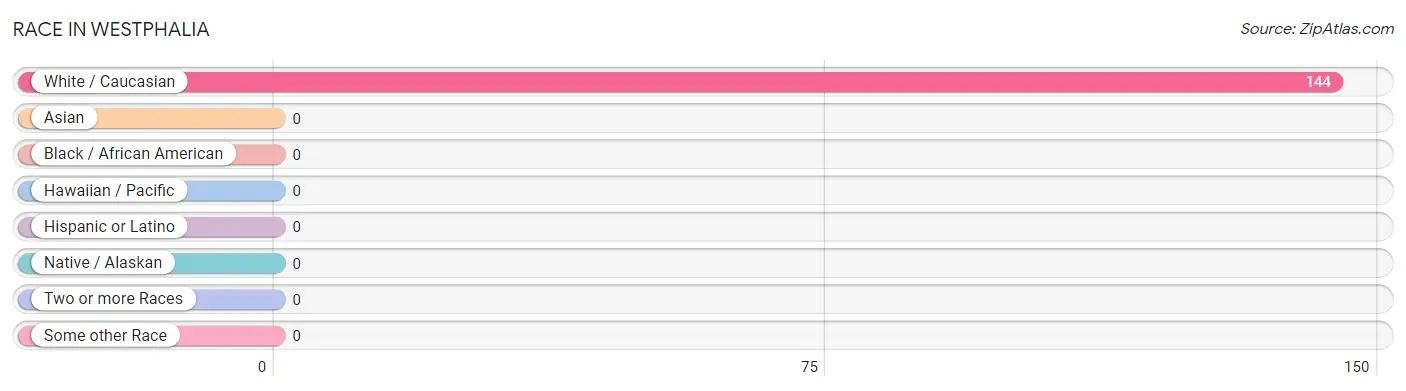
| Race | # Population | % Population |
| Asian | 0 | 0.0% |
| Black / African American | 0 | 0.0% |
| Hawaiian / Pacific | 0 | 0.0% |
| Hispanic or Latino | 0 | 0.0% |
| Native / Alaskan | 0 | 0.0% |
| White / Caucasian | 144 | 100.0% |
| Two or more Races | 0 | 0.0% |
| Some other Race | 0 | 0.0% |
| Total | 144 | 100.0% |
Ancestry in Westphalia
The most populous ancestries reported in Westphalia are German (92 | 63.9%), Irish (12 | 8.3%), English (4 | 2.8%), Danish (2 | 1.4%), and American (1 | 0.7%), together accounting for 77.1% of all Westphalia residents.
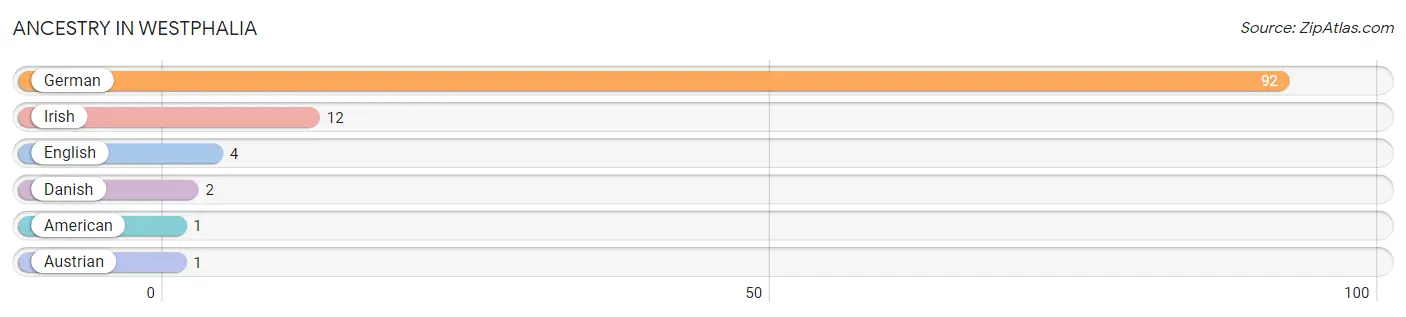
| Ancestry | # Population | % Population |
| American | 1 | 0.7% |
| Austrian | 1 | 0.7% |
| Danish | 2 | 1.4% |
| English | 4 | 2.8% |
| German | 92 | 63.9% |
| Irish | 12 | 8.3% | View All 6 Rows |
Immigrants in Westphalia

| Immigration Origin | # Population | % Population | View All 0 Rows |
Sex and Age in Westphalia
Sex and Age in Westphalia
The most populous age groups in Westphalia are 60 to 64 Years (13 | 21.7%) for men and 75 to 79 Years (16 | 19.1%) for women.
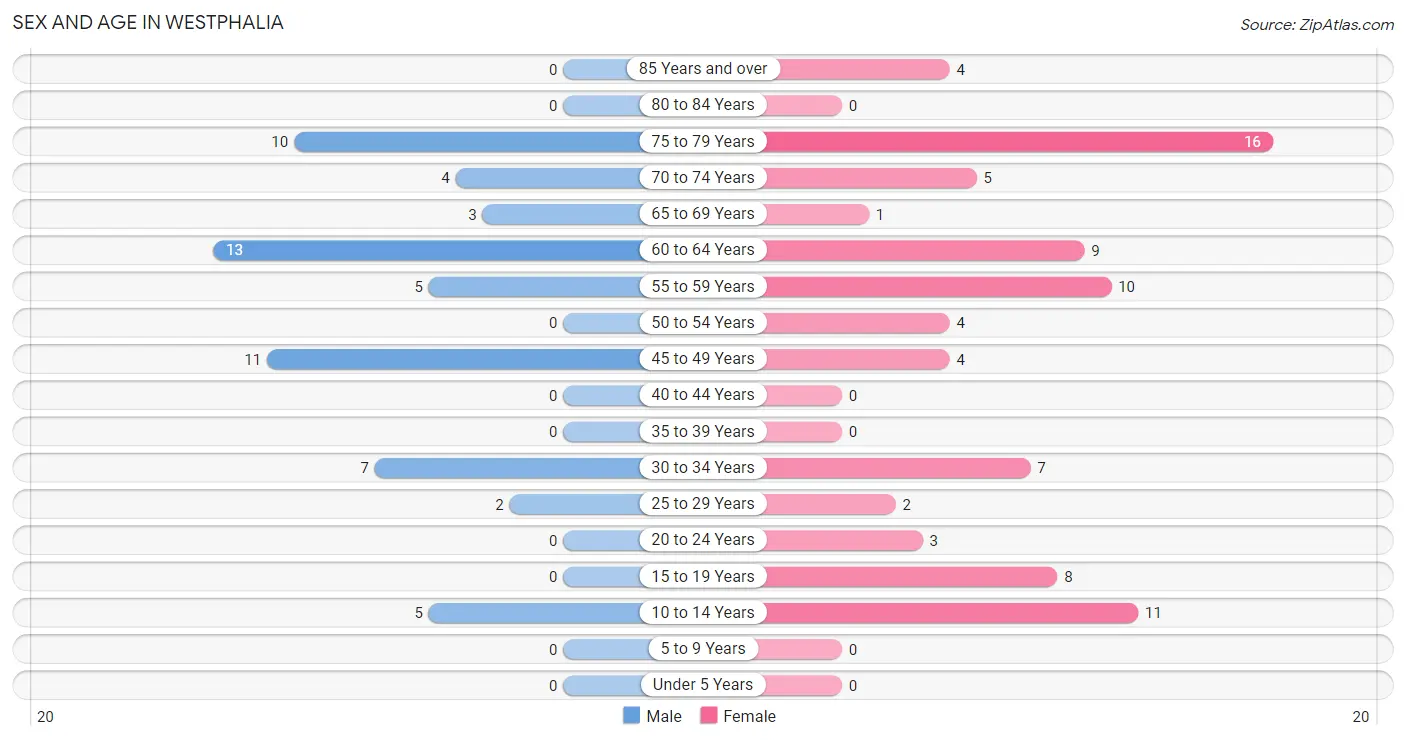
| Age Bracket | Male | Female |
| Under 5 Years | 0 (0.0%) | 0 (0.0%) |
| 5 to 9 Years | 0 (0.0%) | 0 (0.0%) |
| 10 to 14 Years | 5 (8.3%) | 11 (13.1%) |
| 15 to 19 Years | 0 (0.0%) | 8 (9.5%) |
| 20 to 24 Years | 0 (0.0%) | 3 (3.6%) |
| 25 to 29 Years | 2 (3.3%) | 2 (2.4%) |
| 30 to 34 Years | 7 (11.7%) | 7 (8.3%) |
| 35 to 39 Years | 0 (0.0%) | 0 (0.0%) |
| 40 to 44 Years | 0 (0.0%) | 0 (0.0%) |
| 45 to 49 Years | 11 (18.3%) | 4 (4.8%) |
| 50 to 54 Years | 0 (0.0%) | 4 (4.8%) |
| 55 to 59 Years | 5 (8.3%) | 10 (11.9%) |
| 60 to 64 Years | 13 (21.7%) | 9 (10.7%) |
| 65 to 69 Years | 3 (5.0%) | 1 (1.2%) |
| 70 to 74 Years | 4 (6.7%) | 5 (5.9%) |
| 75 to 79 Years | 10 (16.7%) | 16 (19.1%) |
| 80 to 84 Years | 0 (0.0%) | 0 (0.0%) |
| 85 Years and over | 0 (0.0%) | 4 (4.8%) |
| Total | 60 (100.0%) | 84 (100.0%) |
Families and Households in Westphalia
Median Family Size in Westphalia
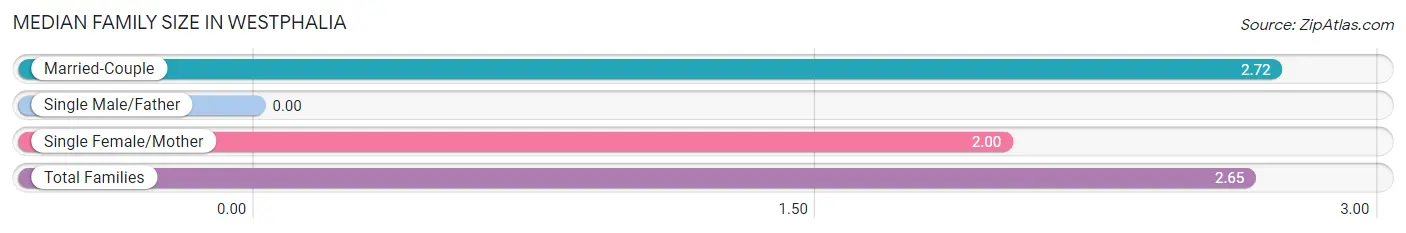
| Family Type | # Families | Family Size |
| Married-Couple | 43 (89.6%) | 2.72 |
| Single Male/Father | 0 (0.0%) | - |
| Single Female/Mother | 5 (10.4%) | 2.00 |
| Total Families | 48 (100.0%) | 2.65 |
Median Household Size in Westphalia
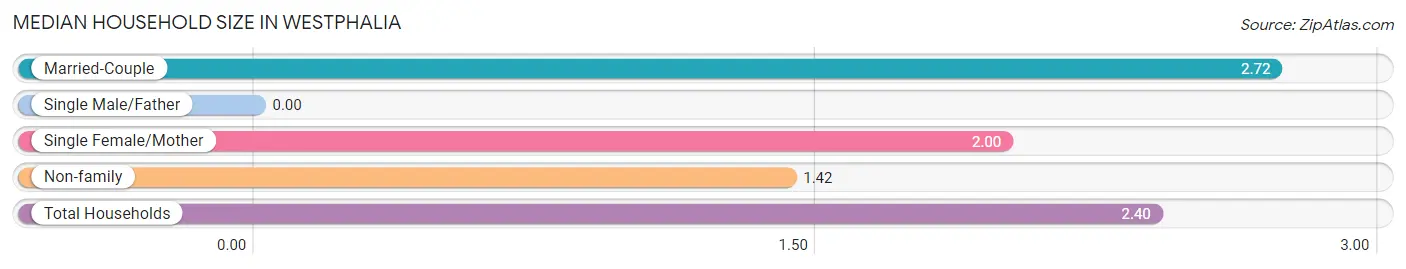
| Household Type | # Households | Household Size |
| Married-Couple | 43 (71.7%) | 2.72 |
| Single Male/Father | 0 (0.0%) | - |
| Single Female/Mother | 5 (8.3%) | 2.00 |
| Non-family | 12 (20.0%) | 1.42 |
| Total Households | 60 (100.0%) | 2.40 |
Household Size by Marriage Status in Westphalia
Out of a total of 60 households in Westphalia, 48 (80.0%) are family households, while 12 (20.0%) are nonfamily households. The most numerous type of family households are 2-person households, comprising 33, and the most common type of nonfamily households are 1-person households, comprising 9.
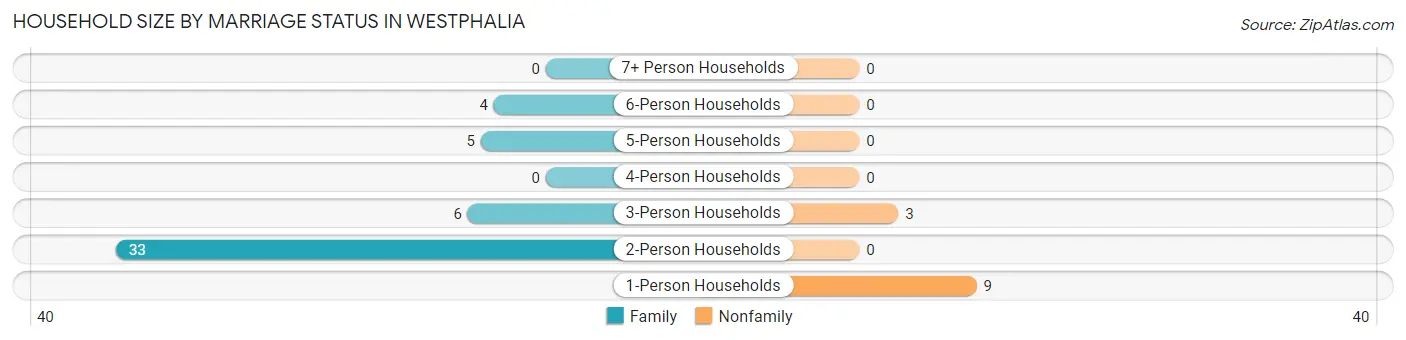
| Household Size | Family Households | Nonfamily Households |
| 1-Person Households | - | 9 (15.0%) |
| 2-Person Households | 33 (55.0%) | 0 (0.0%) |
| 3-Person Households | 6 (10.0%) | 3 (5.0%) |
| 4-Person Households | 0 (0.0%) | 0 (0.0%) |
| 5-Person Households | 5 (8.3%) | 0 (0.0%) |
| 6-Person Households | 4 (6.7%) | 0 (0.0%) |
| 7+ Person Households | 0 (0.0%) | 0 (0.0%) |
| Total | 48 (80.0%) | 12 (20.0%) |
Female Fertility in Westphalia
Fertility by Age in Westphalia
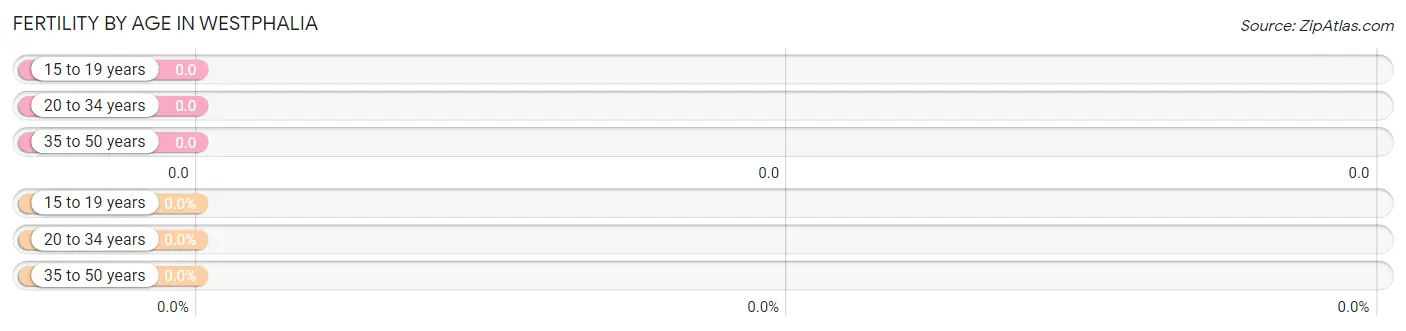
| Age Bracket | Women with Births | Births / 1,000 Women |
| 15 to 19 years | 0 (0.0%) | 0.0 |
| 20 to 34 years | 0 (0.0%) | 0.0 |
| 35 to 50 years | 0 (0.0%) | 0.0 |
| Total | 0 (0.0%) | 0.0 |
Fertility by Age by Marriage Status in Westphalia
| Age Bracket | Married | Unmarried |
| 15 to 19 years | 0 (0.0%) | 0 (0.0%) |
| 20 to 34 years | 0 (0.0%) | 0 (0.0%) |
| 35 to 50 years | 0 (0.0%) | 0 (0.0%) |
| Total | 0 (0.0%) | 0 (0.0%) |
Fertility by Education in Westphalia
| Educational Attainment | Women with Births | Births / 1,000 Women |
| Less than High School | 0 (0.0%) | 0.0 |
| High School Diploma | 0 (0.0%) | 0.0 |
| College or Associate's Degree | 0 (0.0%) | 0.0 |
| Bachelor's Degree | 0 (0.0%) | 0.0 |
| Graduate Degree | 0 (0.0%) | 0.0 |
| Total | 0 (0.0%) | 0.0 |
Fertility by Education by Marriage Status in Westphalia
| Educational Attainment | Married | Unmarried |
| Less than High School | 0 (0.0%) | 0 (0.0%) |
| High School Diploma | 0 (0.0%) | 0 (0.0%) |
| College or Associate's Degree | 0 (0.0%) | 0 (0.0%) |
| Bachelor's Degree | 0 (0.0%) | 0 (0.0%) |
| Graduate Degree | 0 (0.0%) | 0 (0.0%) |
| Total | 0 (0.0%) | 0 (0.0%) |
Employment Characteristics in Westphalia
Employment by Class of Employer in Westphalia
Among the 91 employed individuals in Westphalia, private company employees (75 | 82.4%), not-for-profit organizations (6 | 6.6%), and local government employees (6 | 6.6%) make up the most common classes of employment.
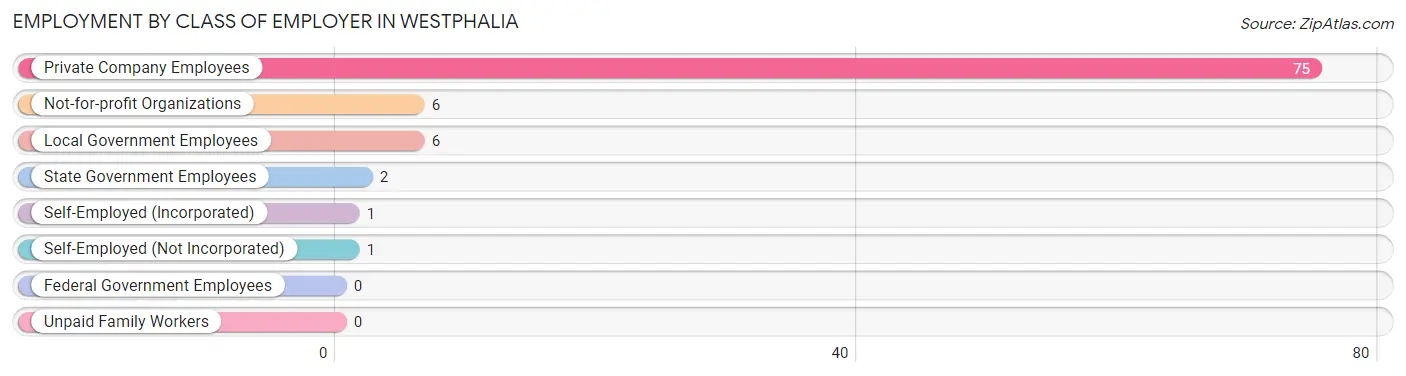
| Employer Class | # Employees | % Employees |
| Private Company Employees | 75 | 82.4% |
| Self-Employed (Incorporated) | 1 | 1.1% |
| Self-Employed (Not Incorporated) | 1 | 1.1% |
| Not-for-profit Organizations | 6 | 6.6% |
| Local Government Employees | 6 | 6.6% |
| State Government Employees | 2 | 2.2% |
| Federal Government Employees | 0 | 0.0% |
| Unpaid Family Workers | 0 | 0.0% |
| Total | 91 | 100.0% |
Employment Status by Age in Westphalia
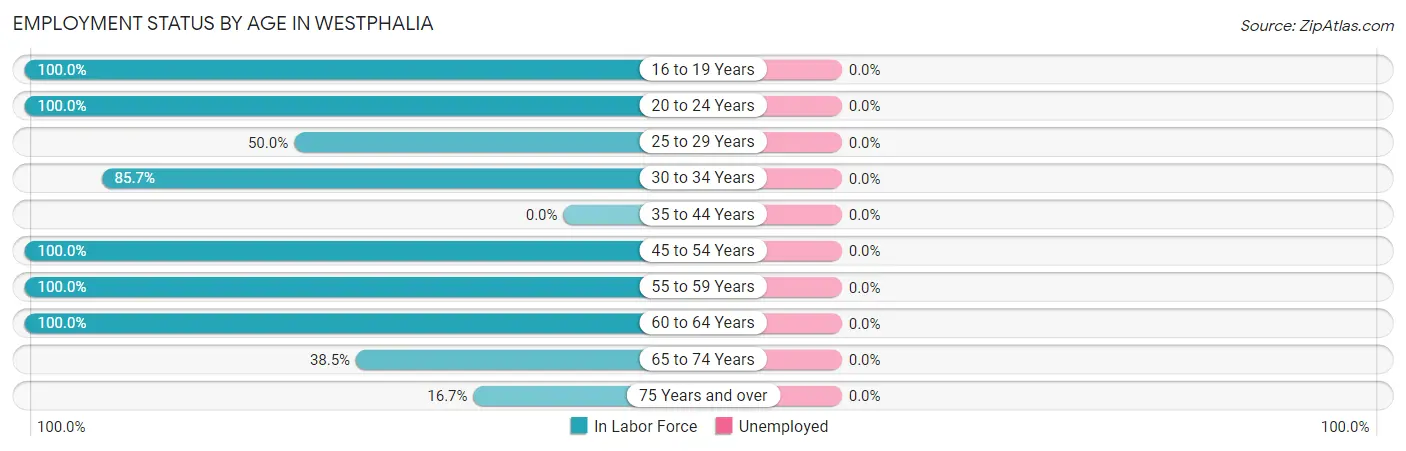
| Age Bracket | In Labor Force | Unemployed |
| 16 to 19 Years | 8 (100.0%) | 0 (0.0%) |
| 20 to 24 Years | 3 (100.0%) | 0 (0.0%) |
| 25 to 29 Years | 2 (50.0%) | 0 (0.0%) |
| 30 to 34 Years | 12 (85.7%) | 0 (0.0%) |
| 35 to 44 Years | 0 (0.0%) | 0 (0.0%) |
| 45 to 54 Years | 19 (100.0%) | 0 (0.0%) |
| 55 to 59 Years | 15 (100.0%) | 0 (0.0%) |
| 60 to 64 Years | 22 (100.0%) | 0 (0.0%) |
| 65 to 74 Years | 5 (38.5%) | 0 (0.0%) |
| 75 Years and over | 5 (16.7%) | 0 (0.0%) |
| Total | 91 (71.1%) | 0 (0.0%) |
Employment Status by Educational Attainment in Westphalia
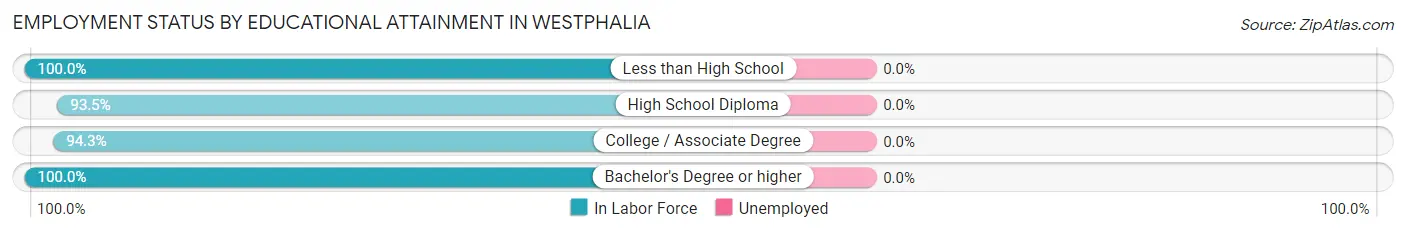
| Educational Attainment | In Labor Force | Unemployed |
| Less than High School | 5 (100.0%) | 0 (0.0%) |
| High School Diploma | 29 (93.5%) | 0 (0.0%) |
| College / Associate Degree | 33 (94.3%) | 0 (0.0%) |
| Bachelor's Degree or higher | 3 (100.0%) | 0 (0.0%) |
| Total | 70 (94.6%) | 0 (0.0%) |
Employment Occupations by Sex in Westphalia
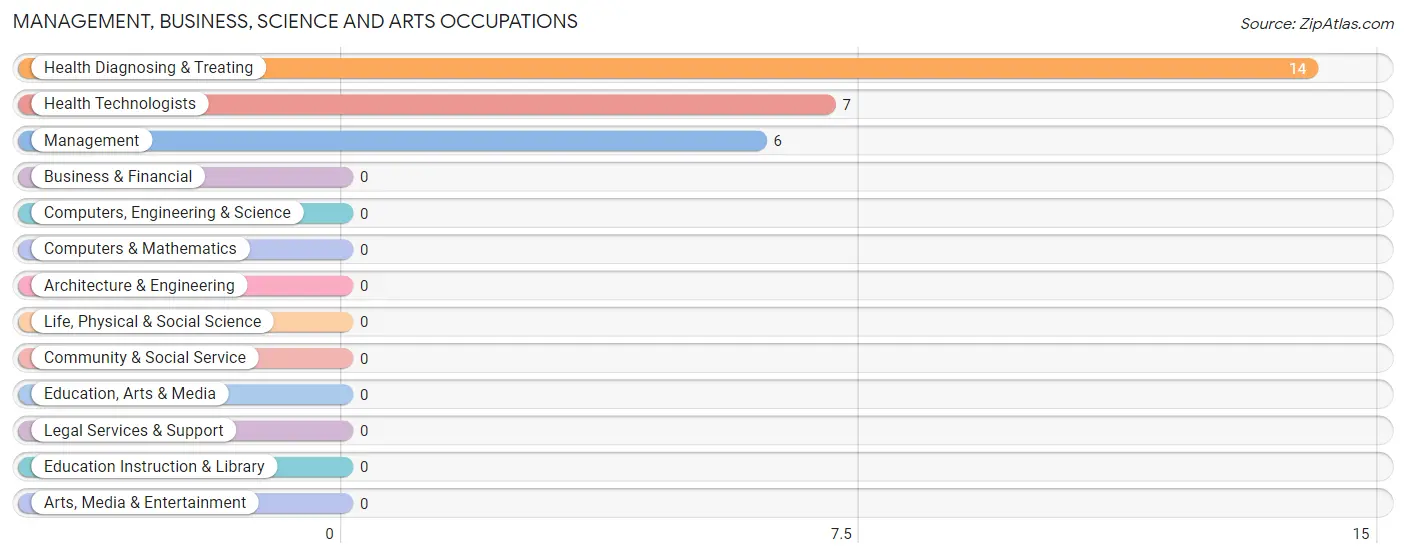
Management, Business, Science and Arts Occupations
The most common Management, Business, Science and Arts occupations in Westphalia are Health Diagnosing & Treating (14 | 15.4%), Health Technologists (7 | 7.7%), and Management (6 | 6.6%).
Management, Business, Science and Arts Occupations by Sex
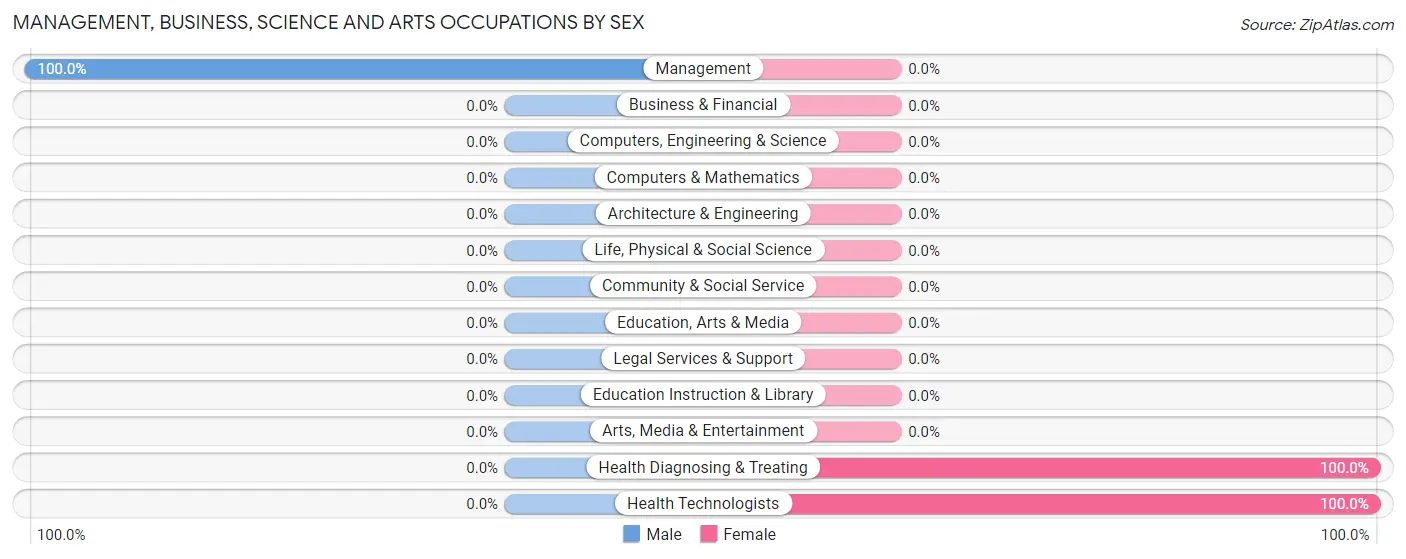
| Occupation | Male | Female |
| Management | 6 (100.0%) | 0 (0.0%) |
| Business & Financial | 0 (0.0%) | 0 (0.0%) |
| Computers, Engineering & Science | 0 (0.0%) | 0 (0.0%) |
| Computers & Mathematics | 0 (0.0%) | 0 (0.0%) |
| Architecture & Engineering | 0 (0.0%) | 0 (0.0%) |
| Life, Physical & Social Science | 0 (0.0%) | 0 (0.0%) |
| Community & Social Service | 0 (0.0%) | 0 (0.0%) |
| Education, Arts & Media | 0 (0.0%) | 0 (0.0%) |
| Legal Services & Support | 0 (0.0%) | 0 (0.0%) |
| Education Instruction & Library | 0 (0.0%) | 0 (0.0%) |
| Arts, Media & Entertainment | 0 (0.0%) | 0 (0.0%) |
| Health Diagnosing & Treating | 0 (0.0%) | 14 (100.0%) |
| Health Technologists | 0 (0.0%) | 7 (100.0%) |
| Total (Category) | 6 (30.0%) | 14 (70.0%) |
| Total (Overall) | 47 (51.6%) | 44 (48.3%) |
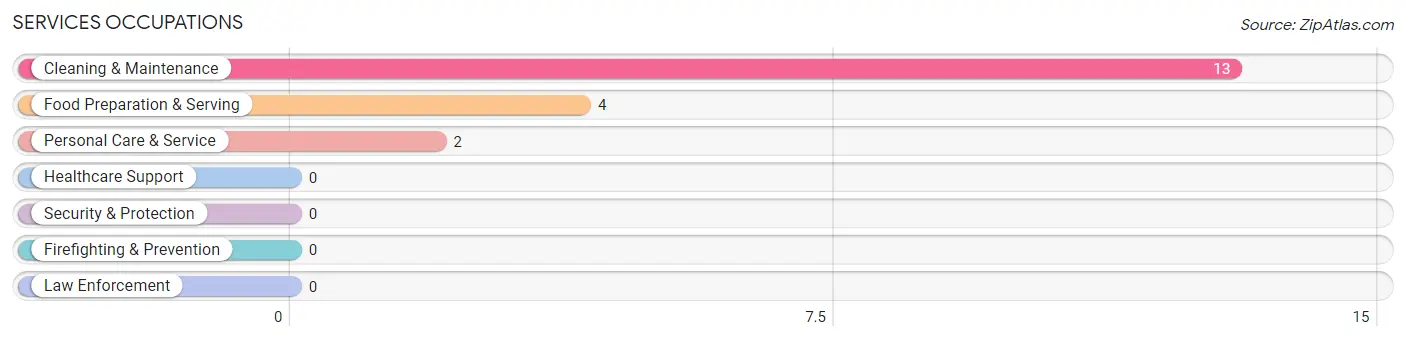
Services Occupations
The most common Services occupations in Westphalia are Cleaning & Maintenance (13 | 14.3%), Food Preparation & Serving (4 | 4.4%), and Personal Care & Service (2 | 2.2%).
Services Occupations by Sex
Within the Services occupations in Westphalia, the most male-oriented occupations are Cleaning & Maintenance (69.2%), and Personal Care & Service (50.0%), while the most female-oriented occupations are Food Preparation & Serving (100.0%), Personal Care & Service (50.0%), and Cleaning & Maintenance (30.8%).
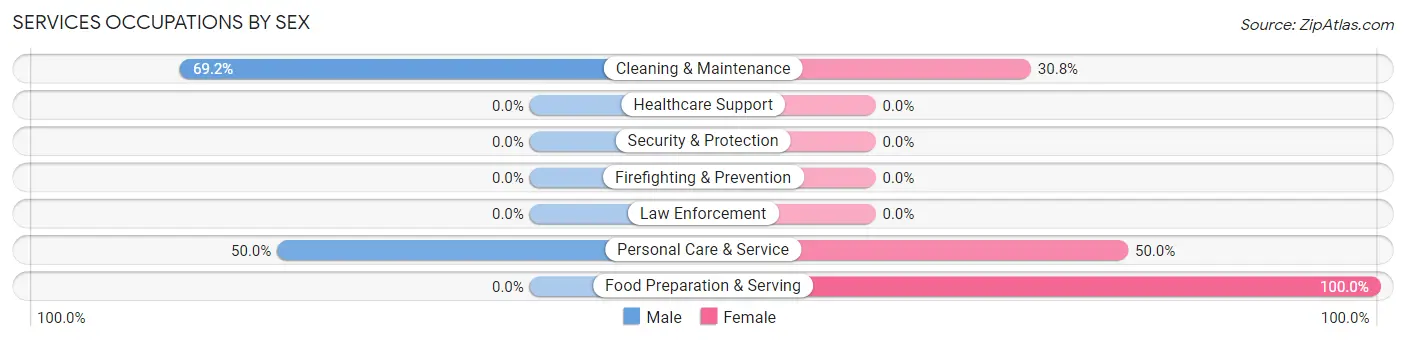
| Occupation | Male | Female |
| Healthcare Support | 0 (0.0%) | 0 (0.0%) |
| Security & Protection | 0 (0.0%) | 0 (0.0%) |
| Firefighting & Prevention | 0 (0.0%) | 0 (0.0%) |
| Law Enforcement | 0 (0.0%) | 0 (0.0%) |
| Food Preparation & Serving | 0 (0.0%) | 4 (100.0%) |
| Cleaning & Maintenance | 9 (69.2%) | 4 (30.8%) |
| Personal Care & Service | 1 (50.0%) | 1 (50.0%) |
| Total (Category) | 10 (52.6%) | 9 (47.4%) |
| Total (Overall) | 47 (51.6%) | 44 (48.3%) |
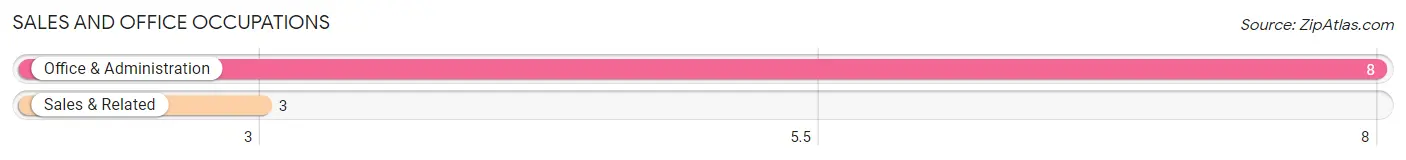
Sales and Office Occupations
The most common Sales and Office occupations in Westphalia are Office & Administration (8 | 8.8%), and Sales & Related (3 | 3.3%).
Sales and Office Occupations by Sex
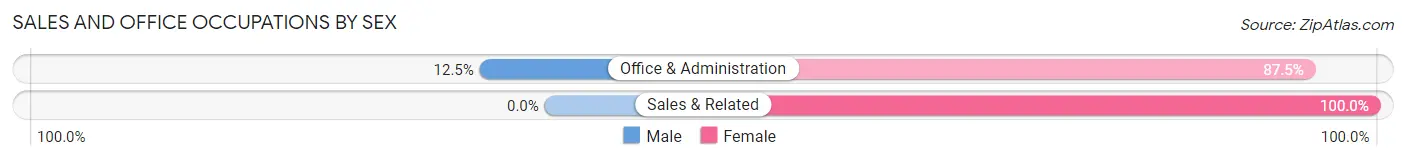
| Occupation | Male | Female |
| Sales & Related | 0 (0.0%) | 3 (100.0%) |
| Office & Administration | 1 (12.5%) | 7 (87.5%) |
| Total (Category) | 1 (9.1%) | 10 (90.9%) |
| Total (Overall) | 47 (51.6%) | 44 (48.3%) |
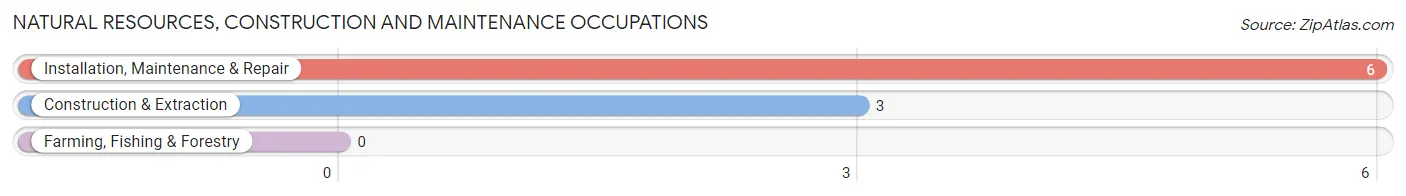
Natural Resources, Construction and Maintenance Occupations
The most common Natural Resources, Construction and Maintenance occupations in Westphalia are Installation, Maintenance & Repair (6 | 6.6%), and Construction & Extraction (3 | 3.3%).
Natural Resources, Construction and Maintenance Occupations by Sex
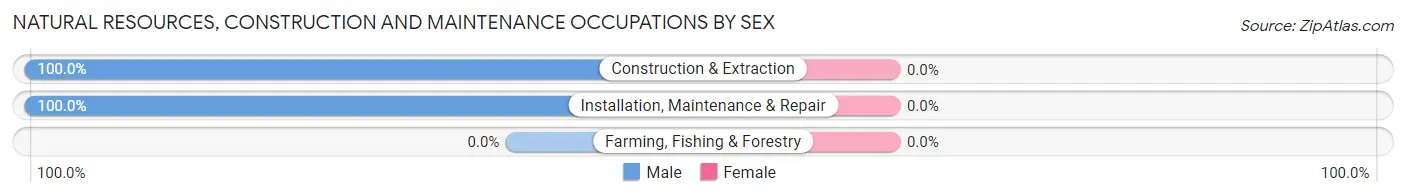
| Occupation | Male | Female |
| Farming, Fishing & Forestry | 0 (0.0%) | 0 (0.0%) |
| Construction & Extraction | 3 (100.0%) | 0 (0.0%) |
| Installation, Maintenance & Repair | 6 (100.0%) | 0 (0.0%) |
| Total (Category) | 9 (100.0%) | 0 (0.0%) |
| Total (Overall) | 47 (51.6%) | 44 (48.3%) |
Production, Transportation and Moving Occupations
The most common Production, Transportation and Moving occupations in Westphalia are Transportation (12 | 13.2%), Production (10 | 11.0%), and Material Moving (10 | 11.0%).
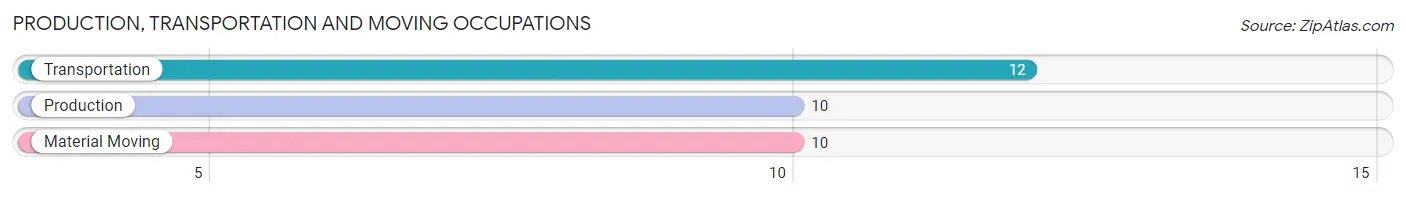
Production, Transportation and Moving Occupations by Sex
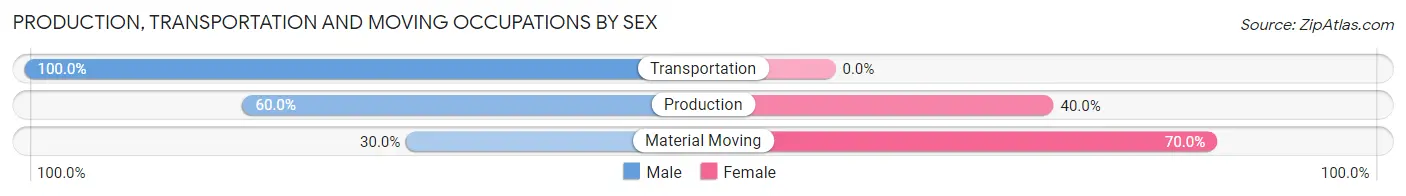
| Occupation | Male | Female |
| Production | 6 (60.0%) | 4 (40.0%) |
| Transportation | 12 (100.0%) | 0 (0.0%) |
| Material Moving | 3 (30.0%) | 7 (70.0%) |
| Total (Category) | 21 (65.6%) | 11 (34.4%) |
| Total (Overall) | 47 (51.6%) | 44 (48.3%) |
Employment Industries by Sex in Westphalia
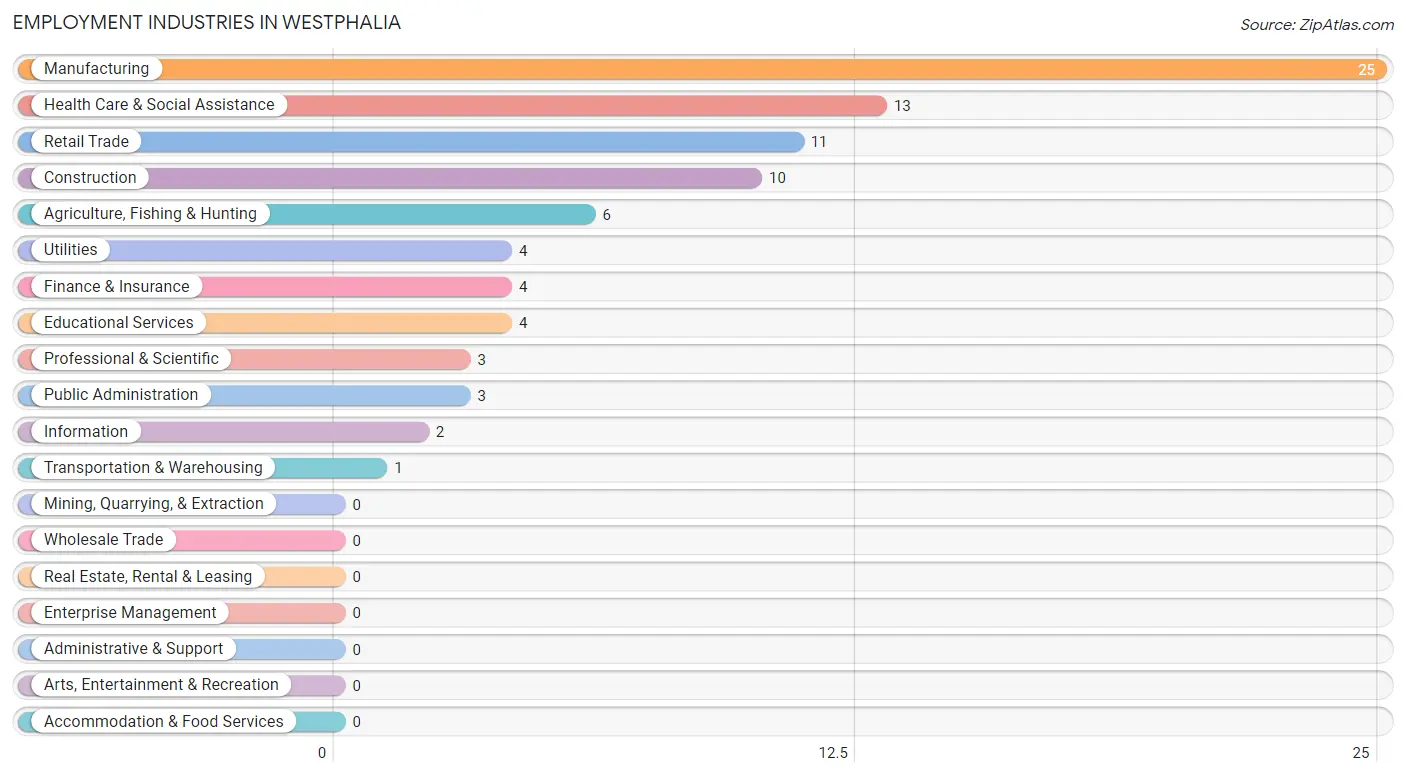
Employment Industries in Westphalia
The major employment industries in Westphalia include Manufacturing (25 | 27.5%), Health Care & Social Assistance (13 | 14.3%), Retail Trade (11 | 12.1%), Construction (10 | 11.0%), and Agriculture, Fishing & Hunting (6 | 6.6%).
Employment Industries by Sex in Westphalia
The Westphalia industries that see more men than women are Agriculture, Fishing & Hunting (100.0%), Construction (100.0%), and Transportation & Warehousing (100.0%), whereas the industries that tend to have a higher number of women are Retail Trade (100.0%), Information (100.0%), and Finance & Insurance (100.0%).
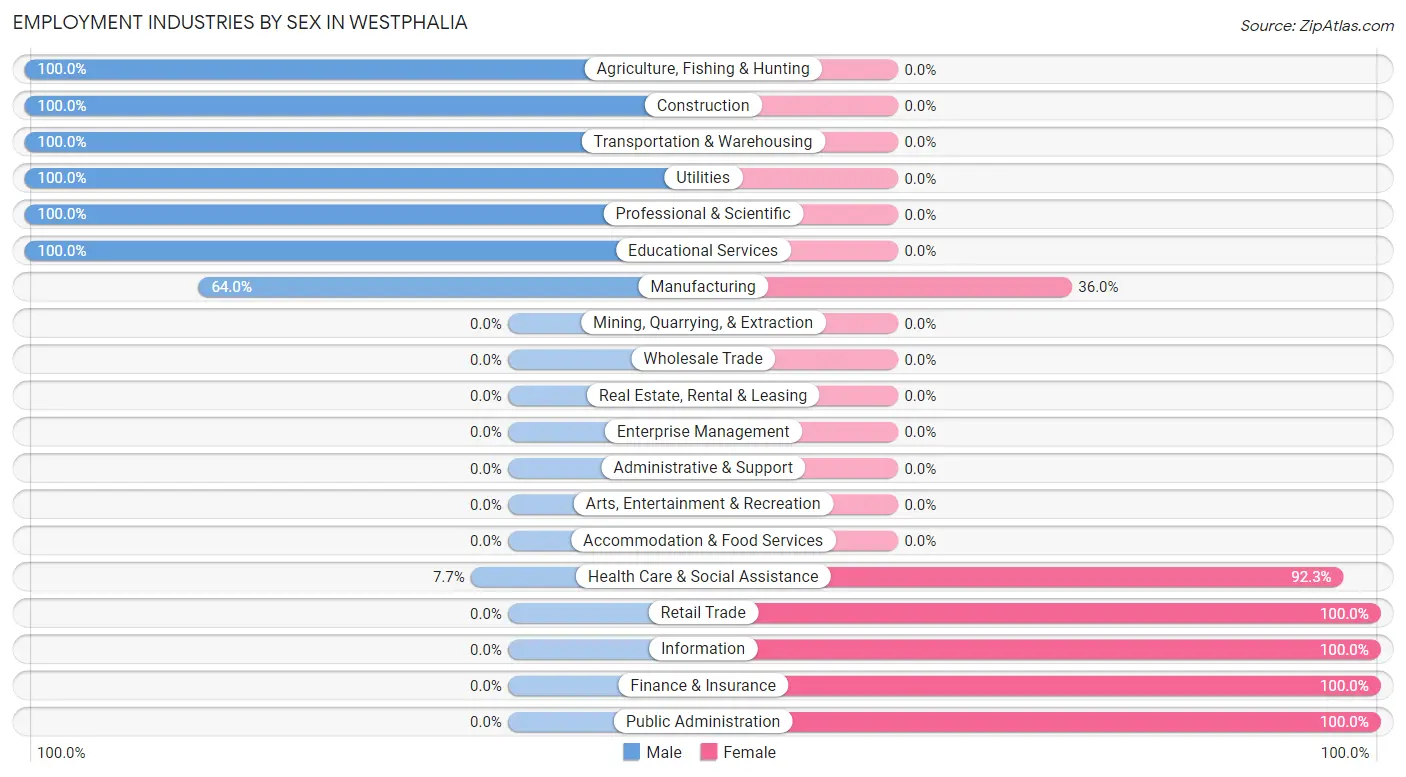
| Industry | Male | Female |
| Agriculture, Fishing & Hunting | 6 (100.0%) | 0 (0.0%) |
| Mining, Quarrying, & Extraction | 0 (0.0%) | 0 (0.0%) |
| Construction | 10 (100.0%) | 0 (0.0%) |
| Manufacturing | 16 (64.0%) | 9 (36.0%) |
| Wholesale Trade | 0 (0.0%) | 0 (0.0%) |
| Retail Trade | 0 (0.0%) | 11 (100.0%) |
| Transportation & Warehousing | 1 (100.0%) | 0 (0.0%) |
| Utilities | 4 (100.0%) | 0 (0.0%) |
| Information | 0 (0.0%) | 2 (100.0%) |
| Finance & Insurance | 0 (0.0%) | 4 (100.0%) |
| Real Estate, Rental & Leasing | 0 (0.0%) | 0 (0.0%) |
| Professional & Scientific | 3 (100.0%) | 0 (0.0%) |
| Enterprise Management | 0 (0.0%) | 0 (0.0%) |
| Administrative & Support | 0 (0.0%) | 0 (0.0%) |
| Educational Services | 4 (100.0%) | 0 (0.0%) |
| Health Care & Social Assistance | 1 (7.7%) | 12 (92.3%) |
| Arts, Entertainment & Recreation | 0 (0.0%) | 0 (0.0%) |
| Accommodation & Food Services | 0 (0.0%) | 0 (0.0%) |
| Public Administration | 0 (0.0%) | 3 (100.0%) |
| Total | 47 (51.6%) | 44 (48.3%) |
Education in Westphalia
School Enrollment in Westphalia
The most common levels of schooling among the 28 students in Westphalia are middle school (16 | 57.1%), college / undergraduate (8 | 28.6%), and high school (4 | 14.3%).
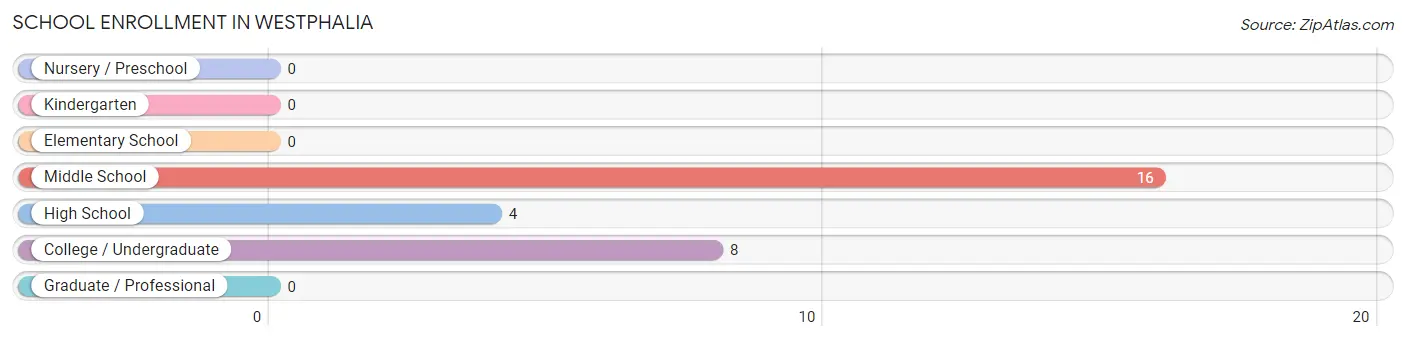
| School Level | # Students | % Students |
| Nursery / Preschool | 0 | 0.0% |
| Kindergarten | 0 | 0.0% |
| Elementary School | 0 | 0.0% |
| Middle School | 16 | 57.1% |
| High School | 4 | 14.3% |
| College / Undergraduate | 8 | 28.6% |
| Graduate / Professional | 0 | 0.0% |
| Total | 28 | 100.0% |
School Enrollment by Age by Funding Source in Westphalia
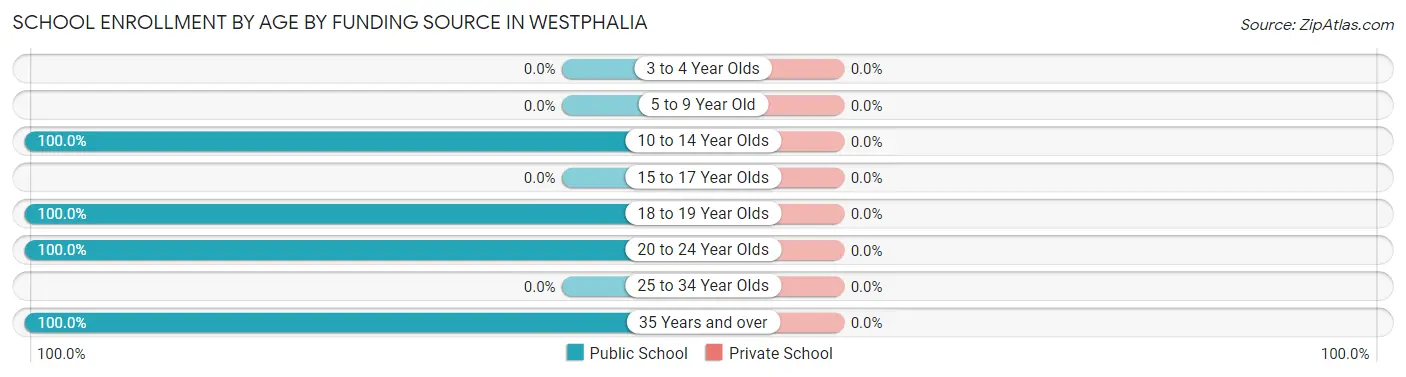
| Age Bracket | Public School | Private School |
| 3 to 4 Year Olds | 0 (0.0%) | 0 (0.0%) |
| 5 to 9 Year Old | 0 (0.0%) | 0 (0.0%) |
| 10 to 14 Year Olds | 16 (100.0%) | 0 (0.0%) |
| 15 to 17 Year Olds | 0 (0.0%) | 0 (0.0%) |
| 18 to 19 Year Olds | 8 (100.0%) | 0 (0.0%) |
| 20 to 24 Year Olds | 3 (100.0%) | 0 (0.0%) |
| 25 to 34 Year Olds | 0 (0.0%) | 0 (0.0%) |
| 35 Years and over | 1 (100.0%) | 0 (0.0%) |
| Total | 28 (100.0%) | 0 (0.0%) |
Educational Attainment by Field of Study in Westphalia
Science & technology (3 | 75.0%), and education (1 | 25.0%) are the most common fields of study among 4 individuals in Westphalia who have obtained a bachelor's degree or higher.
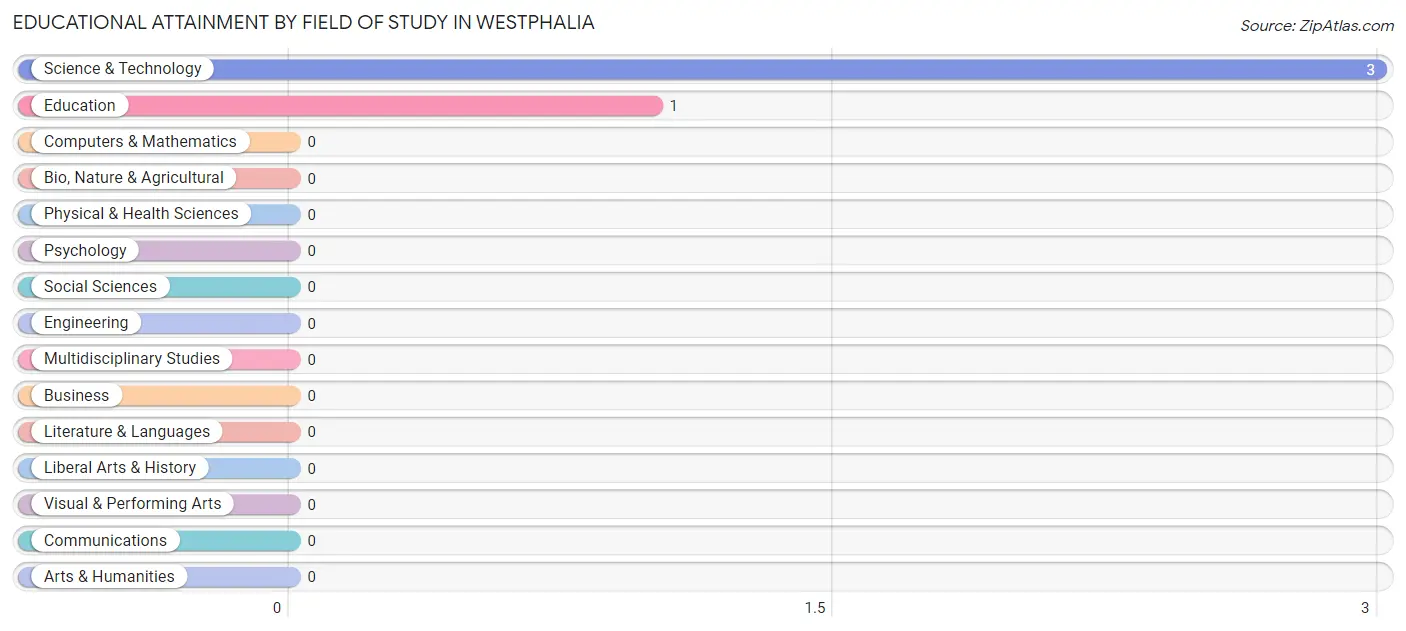
| Field of Study | # Graduates | % Graduates |
| Computers & Mathematics | 0 | 0.0% |
| Bio, Nature & Agricultural | 0 | 0.0% |
| Physical & Health Sciences | 0 | 0.0% |
| Psychology | 0 | 0.0% |
| Social Sciences | 0 | 0.0% |
| Engineering | 0 | 0.0% |
| Multidisciplinary Studies | 0 | 0.0% |
| Science & Technology | 3 | 75.0% |
| Business | 0 | 0.0% |
| Education | 1 | 25.0% |
| Literature & Languages | 0 | 0.0% |
| Liberal Arts & History | 0 | 0.0% |
| Visual & Performing Arts | 0 | 0.0% |
| Communications | 0 | 0.0% |
| Arts & Humanities | 0 | 0.0% |
| Total | 4 | 100.0% |
Transportation & Commute in Westphalia
Vehicle Availability by Sex in Westphalia
The most prevalent vehicle ownership categories in Westphalia are males with 2 vehicles (19, accounting for 40.4%) and females with 2 vehicles (11, making up 43.2%).
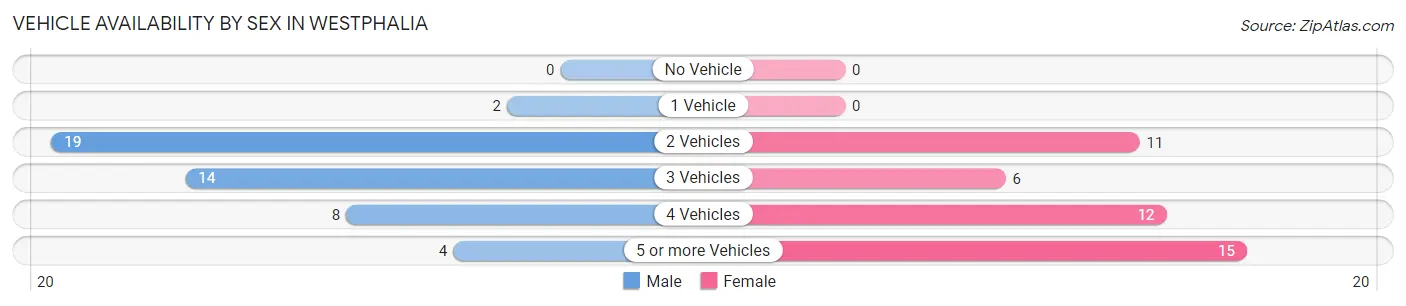
| Vehicles Available | Male | Female |
| No Vehicle | 0 (0.0%) | 0 (0.0%) |
| 1 Vehicle | 2 (4.3%) | 0 (0.0%) |
| 2 Vehicles | 19 (40.4%) | 11 (25.0%) |
| 3 Vehicles | 14 (29.8%) | 6 (13.6%) |
| 4 Vehicles | 8 (17.0%) | 12 (27.3%) |
| 5 or more Vehicles | 4 (8.5%) | 15 (34.1%) |
| Total | 47 (100.0%) | 44 (100.0%) |
Commute Time in Westphalia
The most frequently occuring commute durations in Westphalia are 15 to 19 minutes (38 commuters, 42.7%), 5 to 9 minutes (12 commuters, 13.5%), and 10 to 14 minutes (12 commuters, 13.5%).
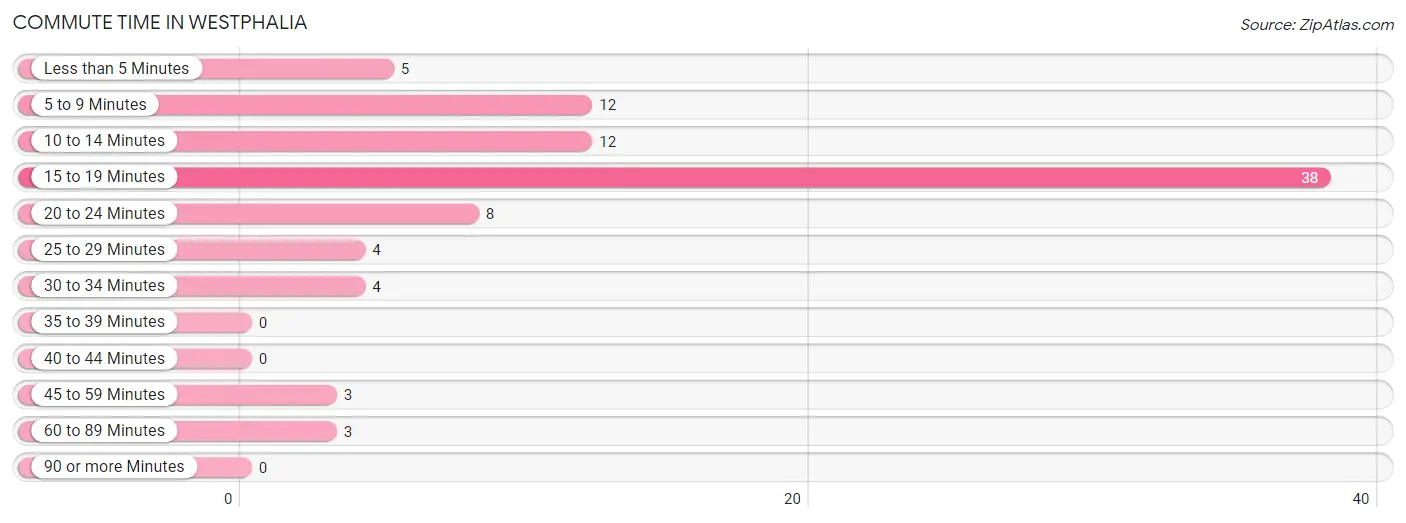
| Commute Time | # Commuters | % Commuters |
| Less than 5 Minutes | 5 | 5.6% |
| 5 to 9 Minutes | 12 | 13.5% |
| 10 to 14 Minutes | 12 | 13.5% |
| 15 to 19 Minutes | 38 | 42.7% |
| 20 to 24 Minutes | 8 | 9.0% |
| 25 to 29 Minutes | 4 | 4.5% |
| 30 to 34 Minutes | 4 | 4.5% |
| 35 to 39 Minutes | 0 | 0.0% |
| 40 to 44 Minutes | 0 | 0.0% |
| 45 to 59 Minutes | 3 | 3.4% |
| 60 to 89 Minutes | 3 | 3.4% |
| 90 or more Minutes | 0 | 0.0% |
Commute Time by Sex in Westphalia
The most common commute times in Westphalia are 15 to 19 minutes (25 commuters, 54.3%) for males and 15 to 19 minutes (13 commuters, 30.2%) for females.
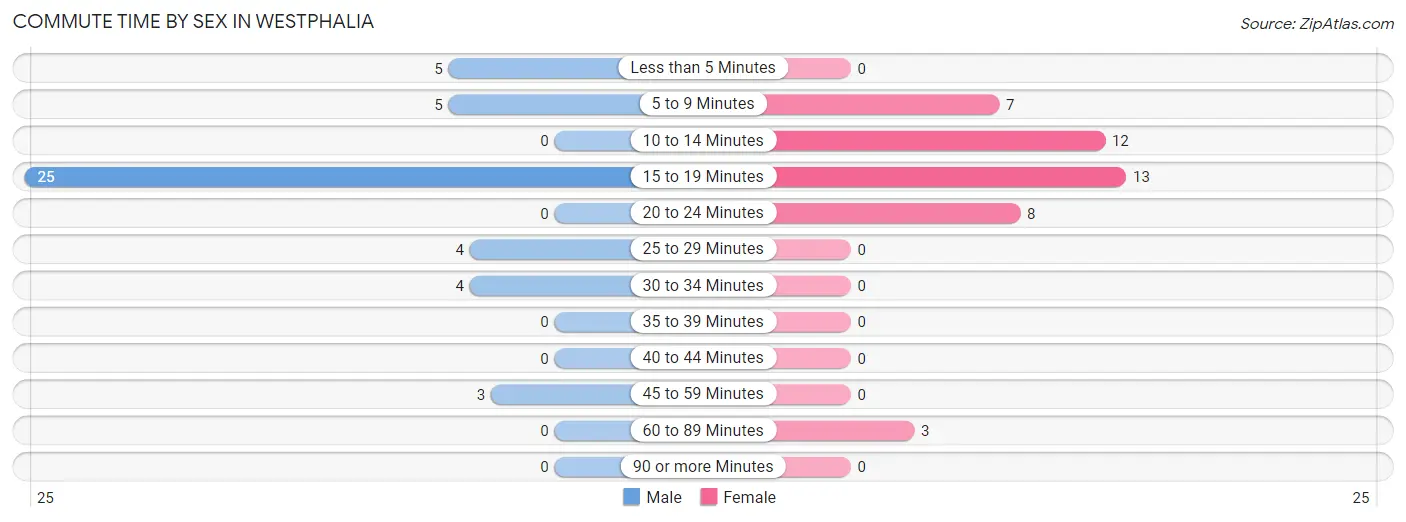
| Commute Time | Male | Female |
| Less than 5 Minutes | 5 (10.9%) | 0 (0.0%) |
| 5 to 9 Minutes | 5 (10.9%) | 7 (16.3%) |
| 10 to 14 Minutes | 0 (0.0%) | 12 (27.9%) |
| 15 to 19 Minutes | 25 (54.3%) | 13 (30.2%) |
| 20 to 24 Minutes | 0 (0.0%) | 8 (18.6%) |
| 25 to 29 Minutes | 4 (8.7%) | 0 (0.0%) |
| 30 to 34 Minutes | 4 (8.7%) | 0 (0.0%) |
| 35 to 39 Minutes | 0 (0.0%) | 0 (0.0%) |
| 40 to 44 Minutes | 0 (0.0%) | 0 (0.0%) |
| 45 to 59 Minutes | 3 (6.5%) | 0 (0.0%) |
| 60 to 89 Minutes | 0 (0.0%) | 3 (7.0%) |
| 90 or more Minutes | 0 (0.0%) | 0 (0.0%) |
Time of Departure to Work by Sex in Westphalia
The most frequent times of departure to work in Westphalia are 6:30 AM to 6:59 AM (17, 37.0%) for males and 7:30 AM to 7:59 AM (10, 23.3%) for females.
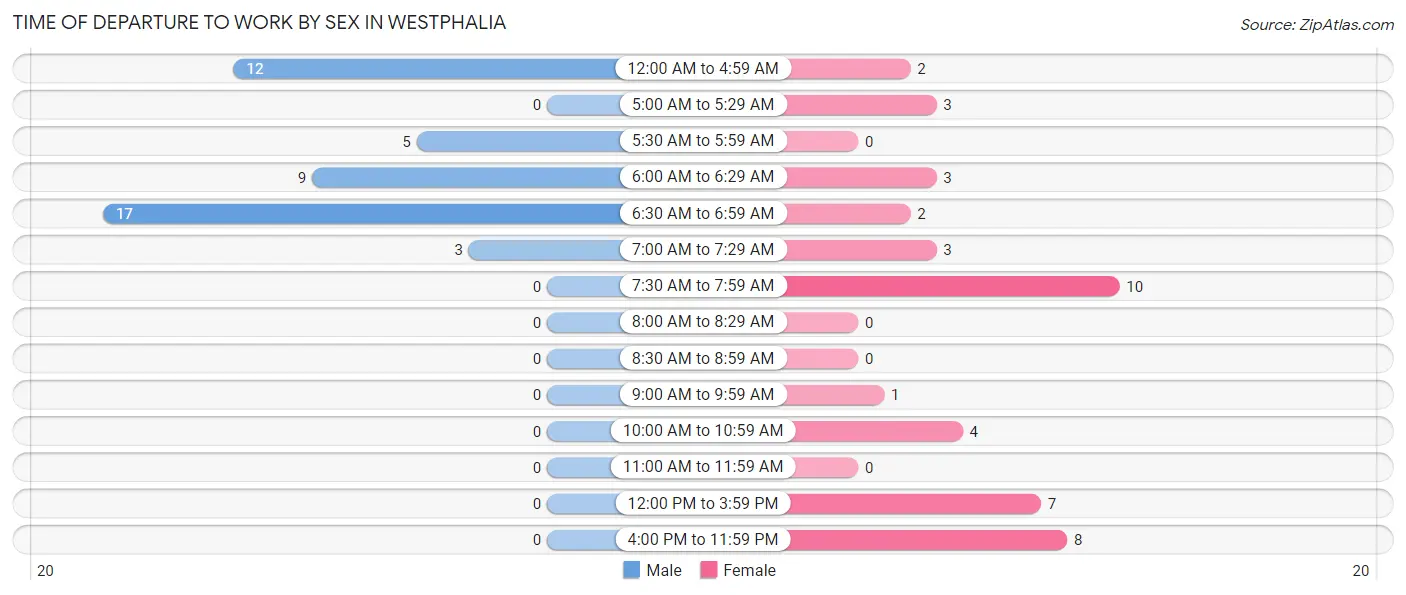
| Time of Departure | Male | Female |
| 12:00 AM to 4:59 AM | 12 (26.1%) | 2 (4.6%) |
| 5:00 AM to 5:29 AM | 0 (0.0%) | 3 (7.0%) |
| 5:30 AM to 5:59 AM | 5 (10.9%) | 0 (0.0%) |
| 6:00 AM to 6:29 AM | 9 (19.6%) | 3 (7.0%) |
| 6:30 AM to 6:59 AM | 17 (37.0%) | 2 (4.6%) |
| 7:00 AM to 7:29 AM | 3 (6.5%) | 3 (7.0%) |
| 7:30 AM to 7:59 AM | 0 (0.0%) | 10 (23.3%) |
| 8:00 AM to 8:29 AM | 0 (0.0%) | 0 (0.0%) |
| 8:30 AM to 8:59 AM | 0 (0.0%) | 0 (0.0%) |
| 9:00 AM to 9:59 AM | 0 (0.0%) | 1 (2.3%) |
| 10:00 AM to 10:59 AM | 0 (0.0%) | 4 (9.3%) |
| 11:00 AM to 11:59 AM | 0 (0.0%) | 0 (0.0%) |
| 12:00 PM to 3:59 PM | 0 (0.0%) | 7 (16.3%) |
| 4:00 PM to 11:59 PM | 0 (0.0%) | 8 (18.6%) |
| Total | 46 (100.0%) | 43 (100.0%) |
Housing Occupancy in Westphalia
Occupancy by Ownership in Westphalia
Of the total 60 dwellings in Westphalia, owner-occupied units account for 53 (88.3%), while renter-occupied units make up 7 (11.7%).
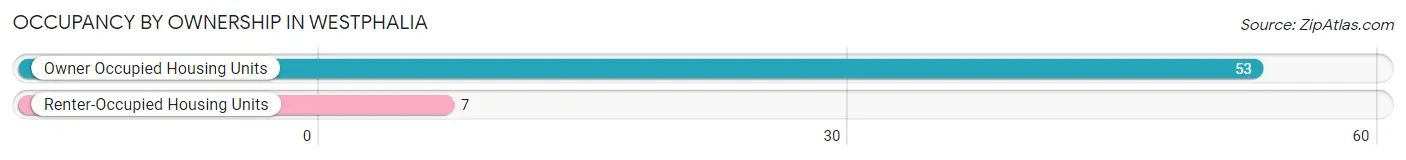
| Occupancy | # Housing Units | % Housing Units |
| Owner Occupied Housing Units | 53 | 88.3% |
| Renter-Occupied Housing Units | 7 | 11.7% |
| Total Occupied Housing Units | 60 | 100.0% |
Occupancy by Household Size in Westphalia
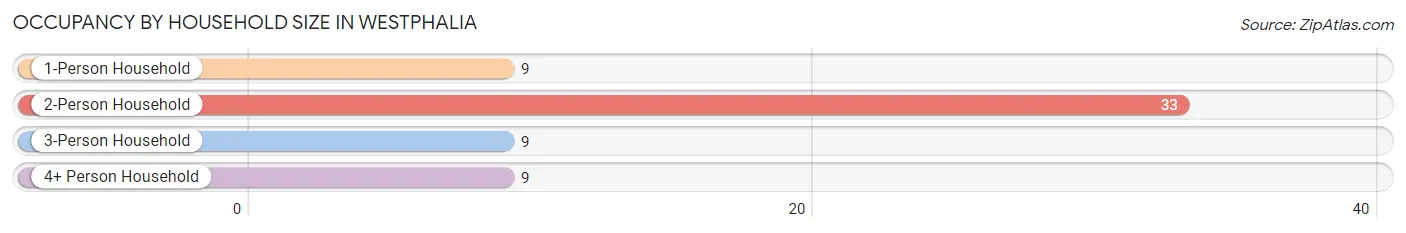
| Household Size | # Housing Units | % Housing Units |
| 1-Person Household | 9 | 15.0% |
| 2-Person Household | 33 | 55.0% |
| 3-Person Household | 9 | 15.0% |
| 4+ Person Household | 9 | 15.0% |
| Total Housing Units | 60 | 100.0% |
Occupancy by Ownership by Household Size in Westphalia
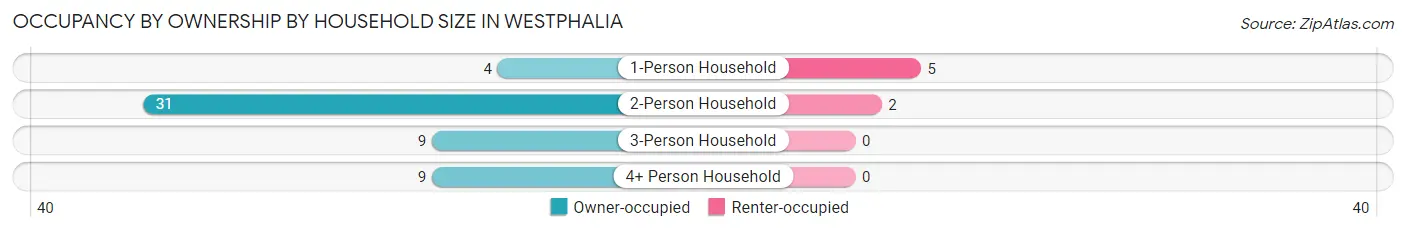
| Household Size | Owner-occupied | Renter-occupied |
| 1-Person Household | 4 (44.4%) | 5 (55.6%) |
| 2-Person Household | 31 (93.9%) | 2 (6.1%) |
| 3-Person Household | 9 (100.0%) | 0 (0.0%) |
| 4+ Person Household | 9 (100.0%) | 0 (0.0%) |
| Total Housing Units | 53 (88.3%) | 7 (11.7%) |
Occupancy by Educational Attainment in Westphalia
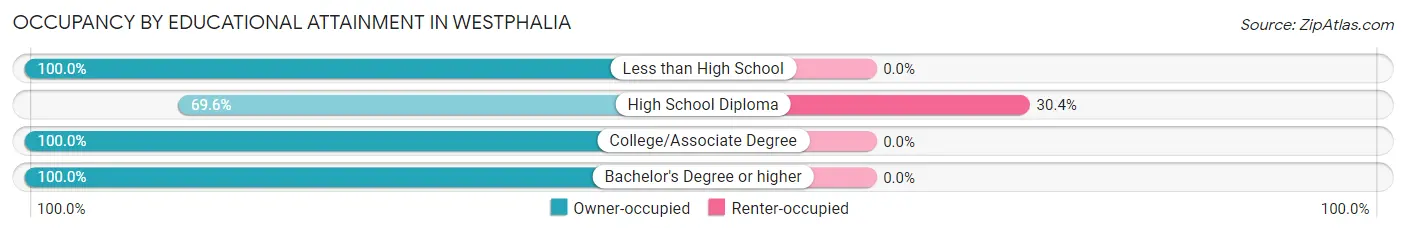
| Household Size | Owner-occupied | Renter-occupied |
| Less than High School | 5 (100.0%) | 0 (0.0%) |
| High School Diploma | 16 (69.6%) | 7 (30.4%) |
| College/Associate Degree | 28 (100.0%) | 0 (0.0%) |
| Bachelor's Degree or higher | 4 (100.0%) | 0 (0.0%) |
Occupancy by Age of Householder in Westphalia
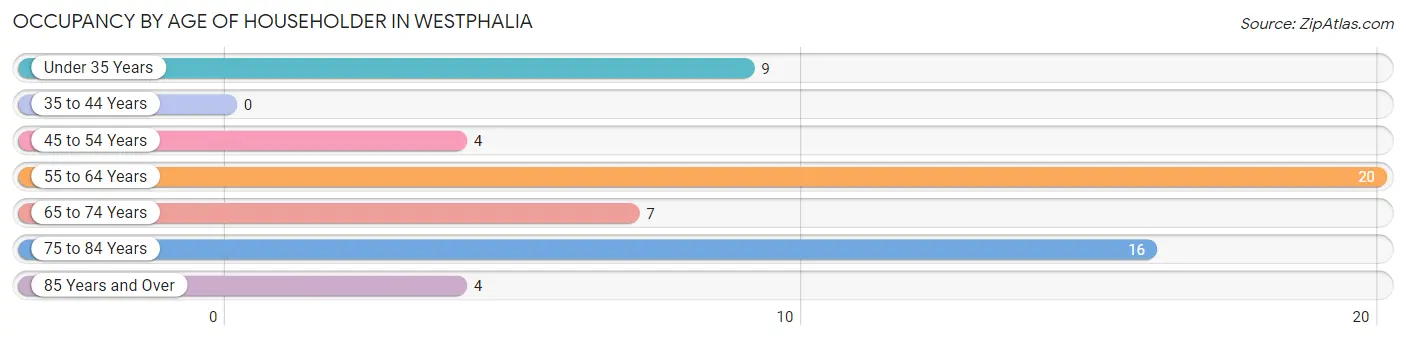
| Age Bracket | # Households | % Households |
| Under 35 Years | 9 | 15.0% |
| 35 to 44 Years | 0 | 0.0% |
| 45 to 54 Years | 4 | 6.7% |
| 55 to 64 Years | 20 | 33.3% |
| 65 to 74 Years | 7 | 11.7% |
| 75 to 84 Years | 16 | 26.7% |
| 85 Years and Over | 4 | 6.7% |
| Total | 60 | 100.0% |
Housing Finances in Westphalia
Median Income by Occupancy in Westphalia
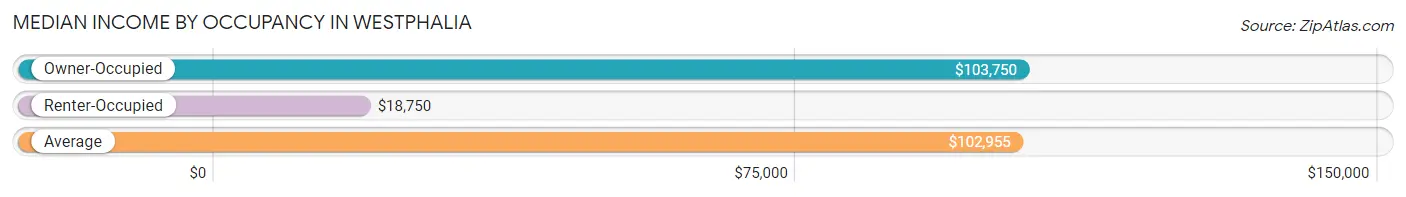
| Occupancy Type | # Households | Median Income |
| Owner-Occupied | 53 (88.3%) | $103,750 |
| Renter-Occupied | 7 (11.7%) | $18,750 |
| Average | 60 (100.0%) | $102,955 |
Occupancy by Householder Income Bracket in Westphalia
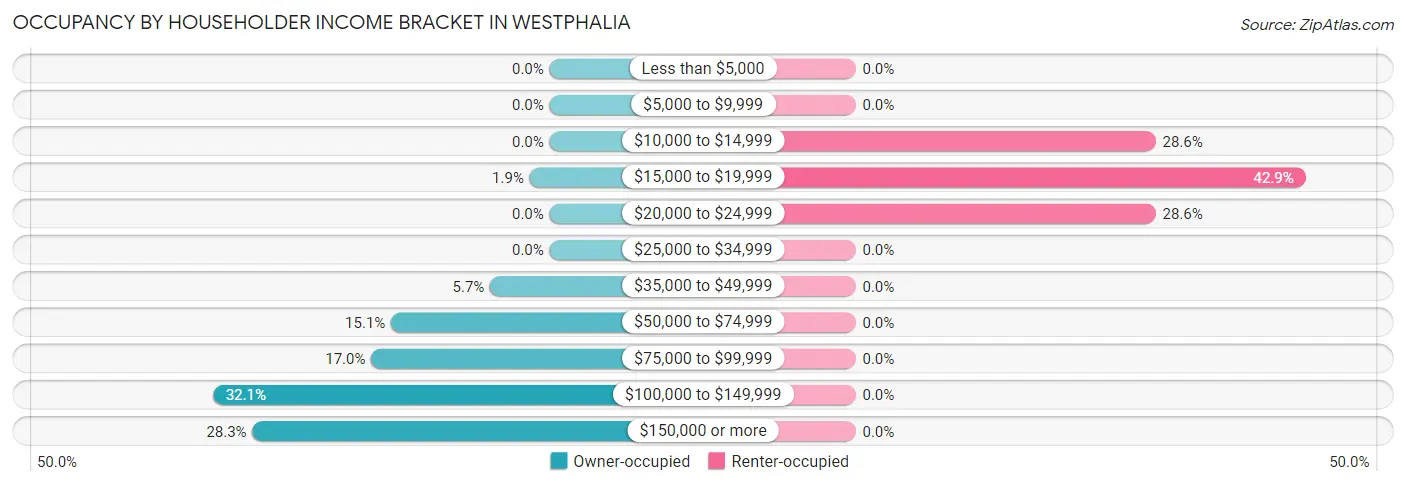
| Income Bracket | Owner-occupied | Renter-occupied |
| Less than $5,000 | 0 (0.0%) | 0 (0.0%) |
| $5,000 to $9,999 | 0 (0.0%) | 0 (0.0%) |
| $10,000 to $14,999 | 0 (0.0%) | 2 (28.6%) |
| $15,000 to $19,999 | 1 (1.9%) | 3 (42.9%) |
| $20,000 to $24,999 | 0 (0.0%) | 2 (28.6%) |
| $25,000 to $34,999 | 0 (0.0%) | 0 (0.0%) |
| $35,000 to $49,999 | 3 (5.7%) | 0 (0.0%) |
| $50,000 to $74,999 | 8 (15.1%) | 0 (0.0%) |
| $75,000 to $99,999 | 9 (17.0%) | 0 (0.0%) |
| $100,000 to $149,999 | 17 (32.1%) | 0 (0.0%) |
| $150,000 or more | 15 (28.3%) | 0 (0.0%) |
| Total | 53 (100.0%) | 7 (100.0%) |
Monthly Housing Cost Tiers in Westphalia
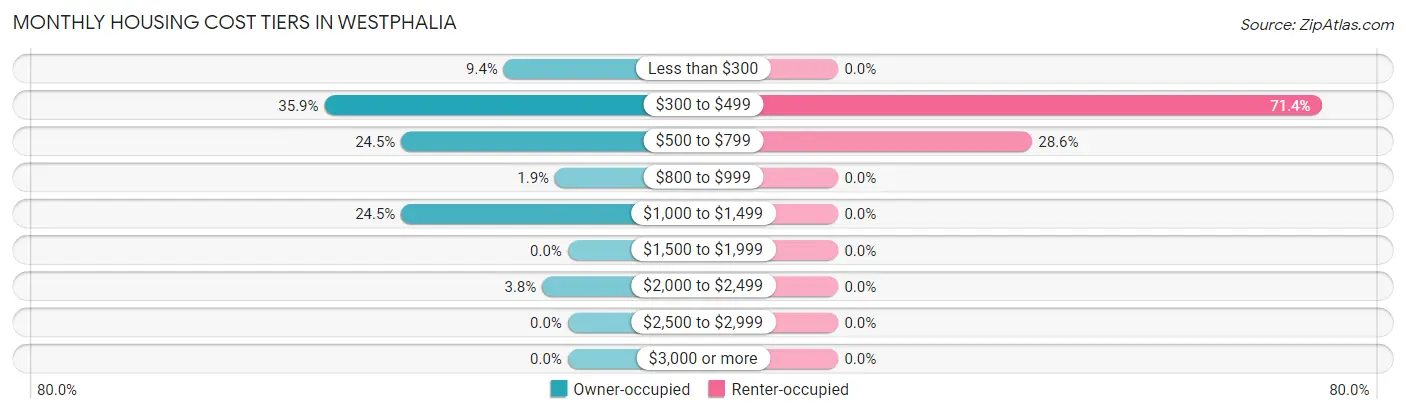
| Monthly Cost | Owner-occupied | Renter-occupied |
| Less than $300 | 5 (9.4%) | 0 (0.0%) |
| $300 to $499 | 19 (35.8%) | 5 (71.4%) |
| $500 to $799 | 13 (24.5%) | 2 (28.6%) |
| $800 to $999 | 1 (1.9%) | 0 (0.0%) |
| $1,000 to $1,499 | 13 (24.5%) | 0 (0.0%) |
| $1,500 to $1,999 | 0 (0.0%) | 0 (0.0%) |
| $2,000 to $2,499 | 2 (3.8%) | 0 (0.0%) |
| $2,500 to $2,999 | 0 (0.0%) | 0 (0.0%) |
| $3,000 or more | 0 (0.0%) | 0 (0.0%) |
| Total | 53 (100.0%) | 7 (100.0%) |
Physical Housing Characteristics in Westphalia
Housing Structures in Westphalia
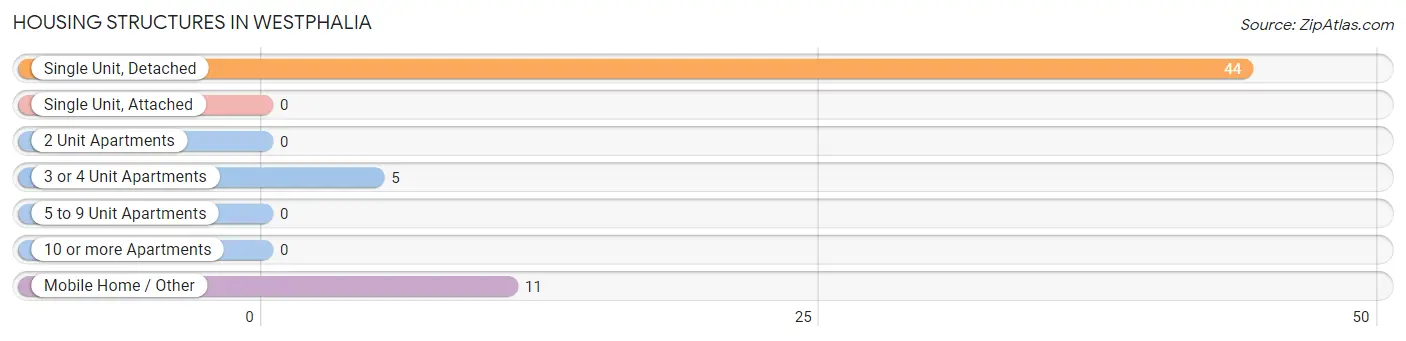
| Structure Type | # Housing Units | % Housing Units |
| Single Unit, Detached | 44 | 73.3% |
| Single Unit, Attached | 0 | 0.0% |
| 2 Unit Apartments | 0 | 0.0% |
| 3 or 4 Unit Apartments | 5 | 8.3% |
| 5 to 9 Unit Apartments | 0 | 0.0% |
| 10 or more Apartments | 0 | 0.0% |
| Mobile Home / Other | 11 | 18.3% |
| Total | 60 | 100.0% |
Housing Structures by Occupancy in Westphalia
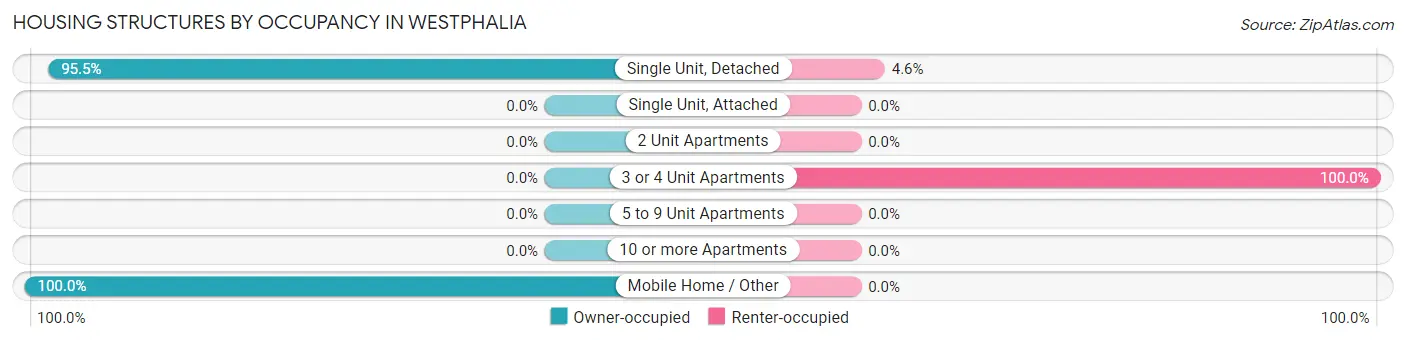
| Structure Type | Owner-occupied | Renter-occupied |
| Single Unit, Detached | 42 (95.5%) | 2 (4.5%) |
| Single Unit, Attached | 0 (0.0%) | 0 (0.0%) |
| 2 Unit Apartments | 0 (0.0%) | 0 (0.0%) |
| 3 or 4 Unit Apartments | 0 (0.0%) | 5 (100.0%) |
| 5 to 9 Unit Apartments | 0 (0.0%) | 0 (0.0%) |
| 10 or more Apartments | 0 (0.0%) | 0 (0.0%) |
| Mobile Home / Other | 11 (100.0%) | 0 (0.0%) |
| Total | 53 (88.3%) | 7 (11.7%) |
Housing Structures by Number of Rooms in Westphalia
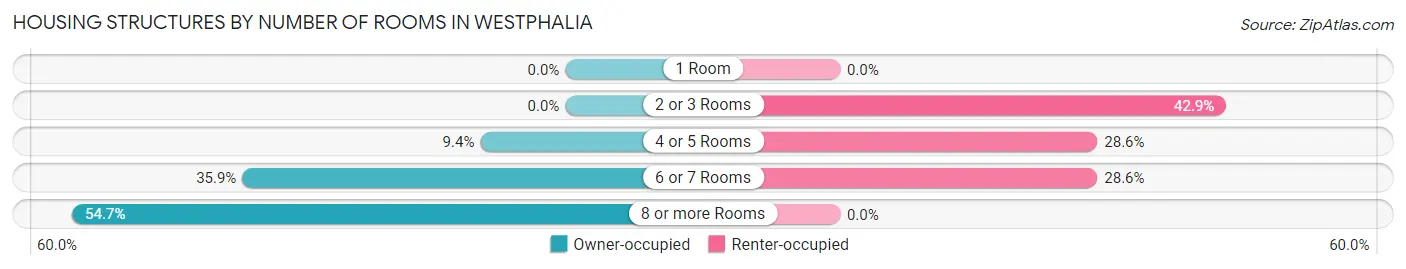
| Number of Rooms | Owner-occupied | Renter-occupied |
| 1 Room | 0 (0.0%) | 0 (0.0%) |
| 2 or 3 Rooms | 0 (0.0%) | 3 (42.9%) |
| 4 or 5 Rooms | 5 (9.4%) | 2 (28.6%) |
| 6 or 7 Rooms | 19 (35.8%) | 2 (28.6%) |
| 8 or more Rooms | 29 (54.7%) | 0 (0.0%) |
| Total | 53 (100.0%) | 7 (100.0%) |
Housing Structure by Heating Type in Westphalia
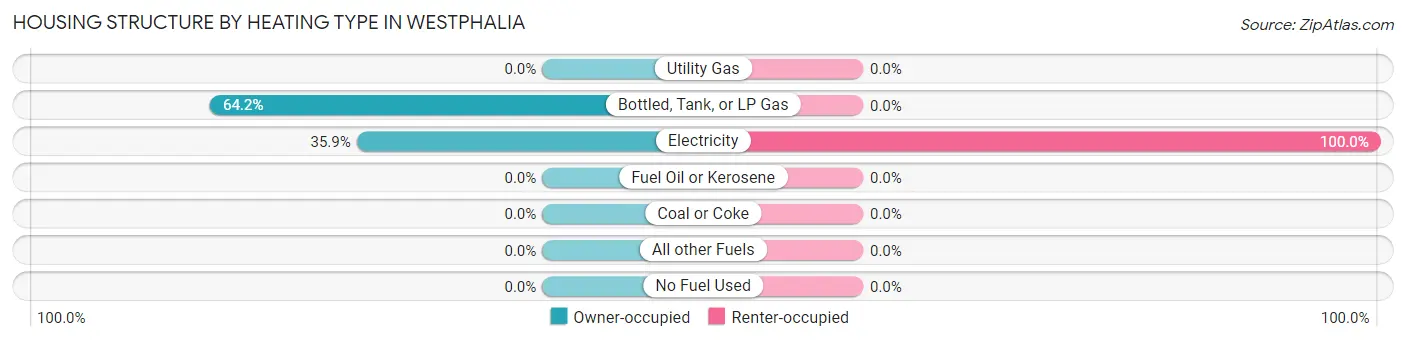
| Heating Type | Owner-occupied | Renter-occupied |
| Utility Gas | 0 (0.0%) | 0 (0.0%) |
| Bottled, Tank, or LP Gas | 34 (64.1%) | 0 (0.0%) |
| Electricity | 19 (35.8%) | 7 (100.0%) |
| Fuel Oil or Kerosene | 0 (0.0%) | 0 (0.0%) |
| Coal or Coke | 0 (0.0%) | 0 (0.0%) |
| All other Fuels | 0 (0.0%) | 0 (0.0%) |
| No Fuel Used | 0 (0.0%) | 0 (0.0%) |
| Total | 53 (100.0%) | 7 (100.0%) |
Household Vehicle Usage in Westphalia
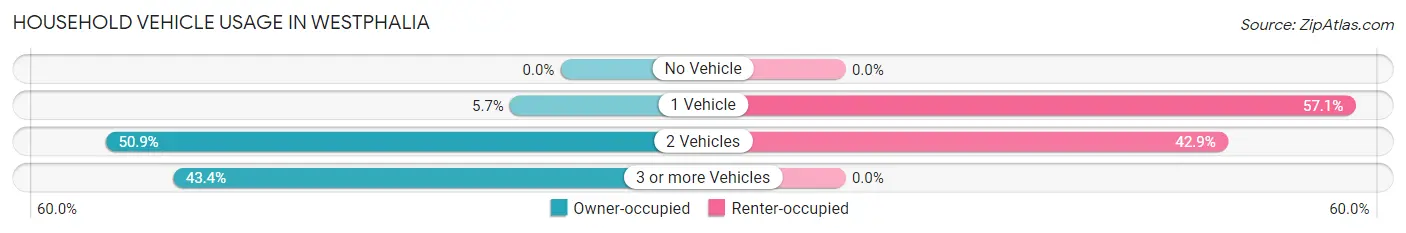
| Vehicles per Household | Owner-occupied | Renter-occupied |
| No Vehicle | 0 (0.0%) | 0 (0.0%) |
| 1 Vehicle | 3 (5.7%) | 4 (57.1%) |
| 2 Vehicles | 27 (50.9%) | 3 (42.9%) |
| 3 or more Vehicles | 23 (43.4%) | 0 (0.0%) |
| Total | 53 (100.0%) | 7 (100.0%) |
Real Estate & Mortgages in Westphalia
Real Estate and Mortgage Overview in Westphalia
| Characteristic | Without Mortgage | With Mortgage |
| Housing Units | 37 | 16 |
| Median Property Value | $87,100 | $100,000 |
| Median Household Income | $102,841 | $9 |
| Monthly Housing Costs | $454 | $0 |
| Real Estate Taxes | $1,438 | $0 |
Property Value by Mortgage Status in Westphalia
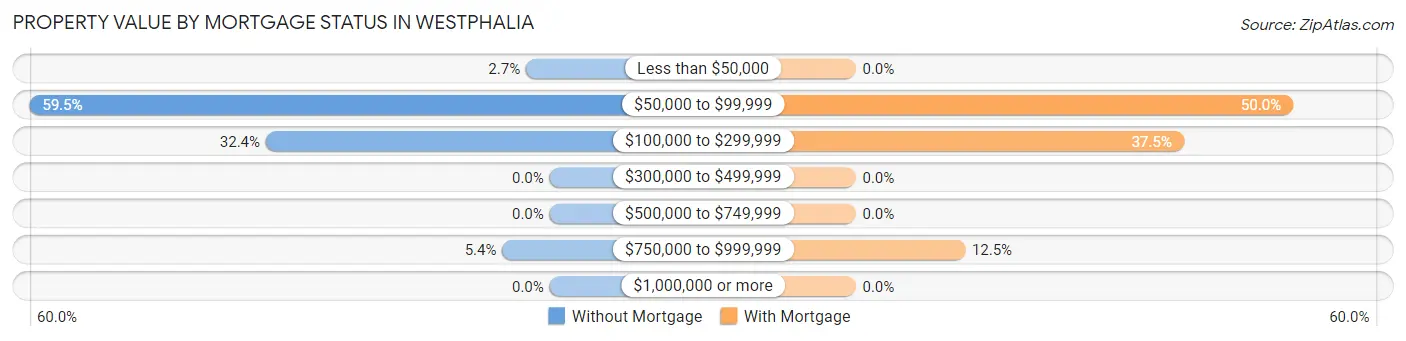
| Property Value | Without Mortgage | With Mortgage |
| Less than $50,000 | 1 (2.7%) | 0 (0.0%) |
| $50,000 to $99,999 | 22 (59.5%) | 8 (50.0%) |
| $100,000 to $299,999 | 12 (32.4%) | 6 (37.5%) |
| $300,000 to $499,999 | 0 (0.0%) | 0 (0.0%) |
| $500,000 to $749,999 | 0 (0.0%) | 0 (0.0%) |
| $750,000 to $999,999 | 2 (5.4%) | 2 (12.5%) |
| $1,000,000 or more | 0 (0.0%) | 0 (0.0%) |
| Total | 37 (100.0%) | 16 (100.0%) |
Household Income by Mortgage Status in Westphalia
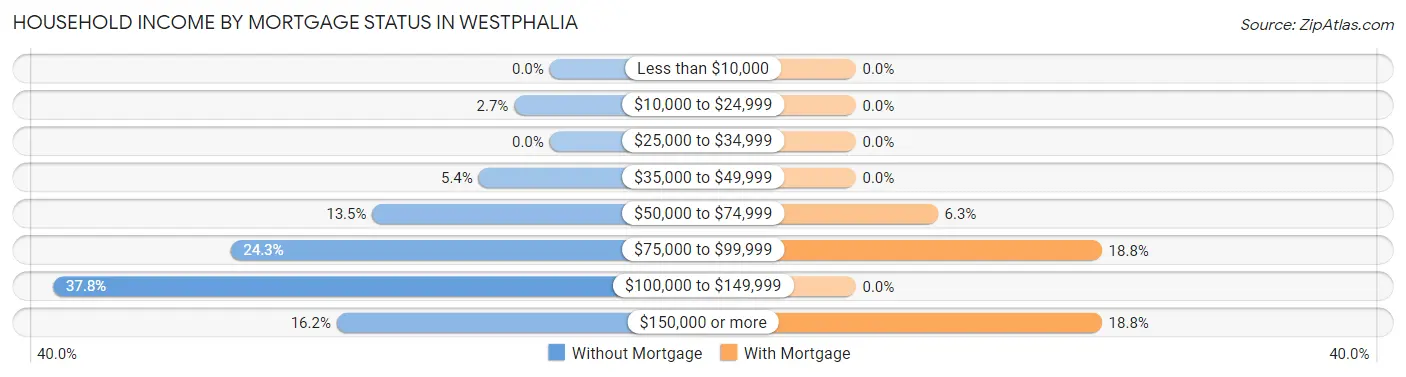
| Household Income | Without Mortgage | With Mortgage |
| Less than $10,000 | 0 (0.0%) | 0 (0.0%) |
| $10,000 to $24,999 | 1 (2.7%) | 0 (0.0%) |
| $25,000 to $34,999 | 0 (0.0%) | 0 (0.0%) |
| $35,000 to $49,999 | 2 (5.4%) | 0 (0.0%) |
| $50,000 to $74,999 | 5 (13.5%) | 1 (6.2%) |
| $75,000 to $99,999 | 9 (24.3%) | 3 (18.8%) |
| $100,000 to $149,999 | 14 (37.8%) | 0 (0.0%) |
| $150,000 or more | 6 (16.2%) | 3 (18.8%) |
| Total | 37 (100.0%) | 16 (100.0%) |
Property Value to Household Income Ratio in Westphalia
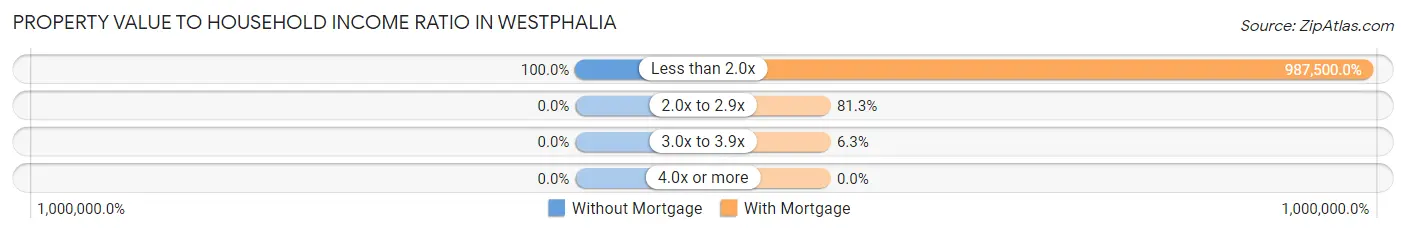
| Value-to-Income Ratio | Without Mortgage | With Mortgage |
| Less than 2.0x | 37 (100.0%) | 158,000 (987,500.0%) |
| 2.0x to 2.9x | 0 (0.0%) | 13 (81.2%) |
| 3.0x to 3.9x | 0 (0.0%) | 1 (6.2%) |
| 4.0x or more | 0 (0.0%) | 0 (0.0%) |
| Total | 37 (100.0%) | 16 (100.0%) |
Real Estate Taxes by Mortgage Status in Westphalia
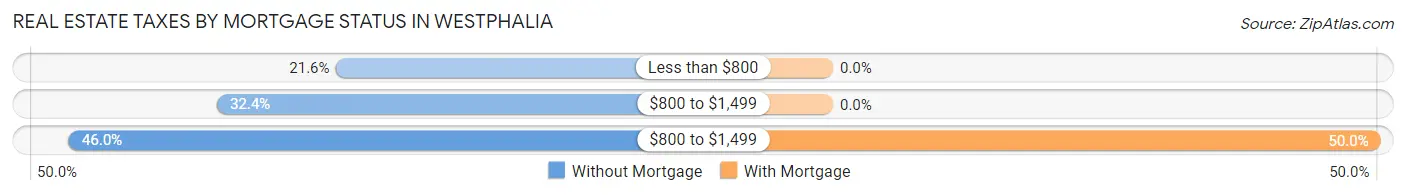
| Property Taxes | Without Mortgage | With Mortgage |
| Less than $800 | 8 (21.6%) | 0 (0.0%) |
| $800 to $1,499 | 12 (32.4%) | 0 (0.0%) |
| $800 to $1,499 | 17 (46.0%) | 8 (50.0%) |
| Total | 37 (100.0%) | 16 (100.0%) |
Health & Disability in Westphalia
Health Insurance Coverage by Age in Westphalia
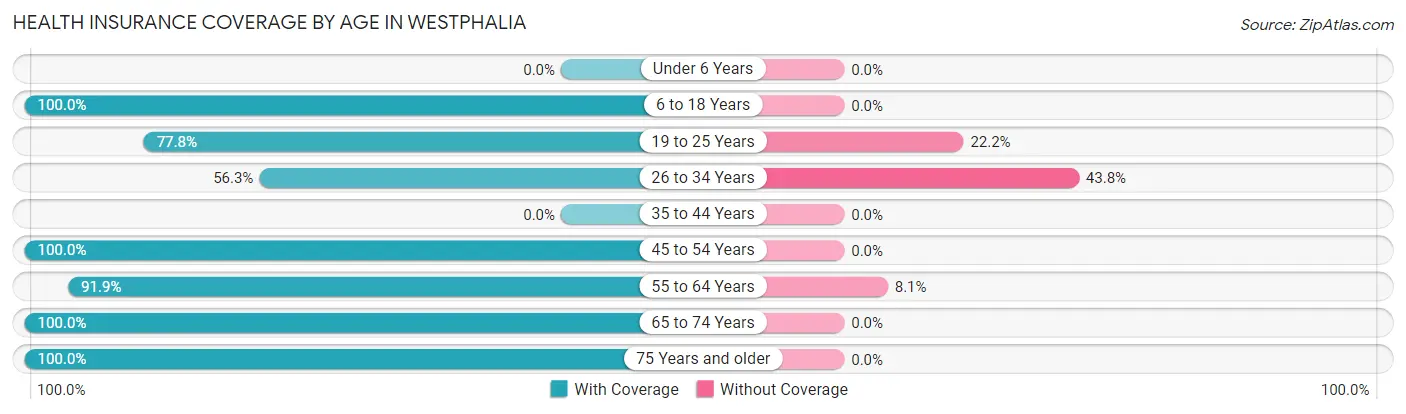
| Age Bracket | With Coverage | Without Coverage |
| Under 6 Years | 0 (0.0%) | 0 (0.0%) |
| 6 to 18 Years | 20 (100.0%) | 0 (0.0%) |
| 19 to 25 Years | 7 (77.8%) | 2 (22.2%) |
| 26 to 34 Years | 9 (56.2%) | 7 (43.8%) |
| 35 to 44 Years | 0 (0.0%) | 0 (0.0%) |
| 45 to 54 Years | 19 (100.0%) | 0 (0.0%) |
| 55 to 64 Years | 34 (91.9%) | 3 (8.1%) |
| 65 to 74 Years | 13 (100.0%) | 0 (0.0%) |
| 75 Years and older | 30 (100.0%) | 0 (0.0%) |
| Total | 132 (91.7%) | 12 (8.3%) |
Health Insurance Coverage by Citizenship Status in Westphalia
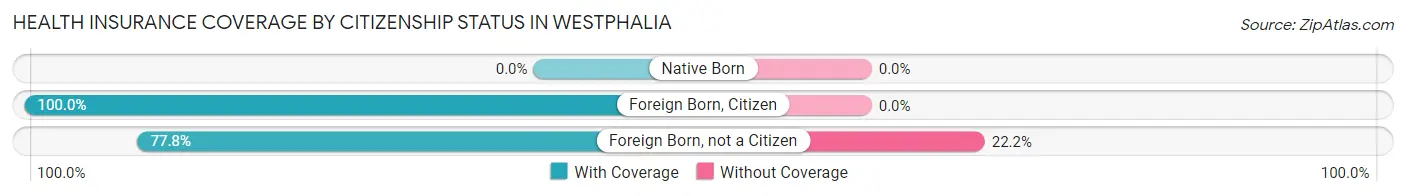
| Citizenship Status | With Coverage | Without Coverage |
| Native Born | 0 (0.0%) | 0 (0.0%) |
| Foreign Born, Citizen | 20 (100.0%) | 0 (0.0%) |
| Foreign Born, not a Citizen | 7 (77.8%) | 2 (22.2%) |
Health Insurance Coverage by Household Income in Westphalia
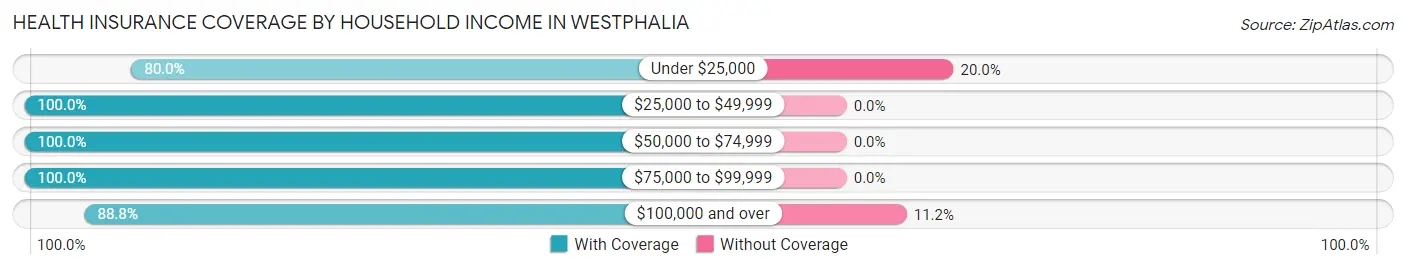
| Household Income | With Coverage | Without Coverage |
| Under $25,000 | 8 (80.0%) | 2 (20.0%) |
| $25,000 to $49,999 | 6 (100.0%) | 0 (0.0%) |
| $50,000 to $74,999 | 13 (100.0%) | 0 (0.0%) |
| $75,000 to $99,999 | 26 (100.0%) | 0 (0.0%) |
| $100,000 and over | 79 (88.8%) | 10 (11.2%) |
Public vs Private Health Insurance Coverage by Age in Westphalia
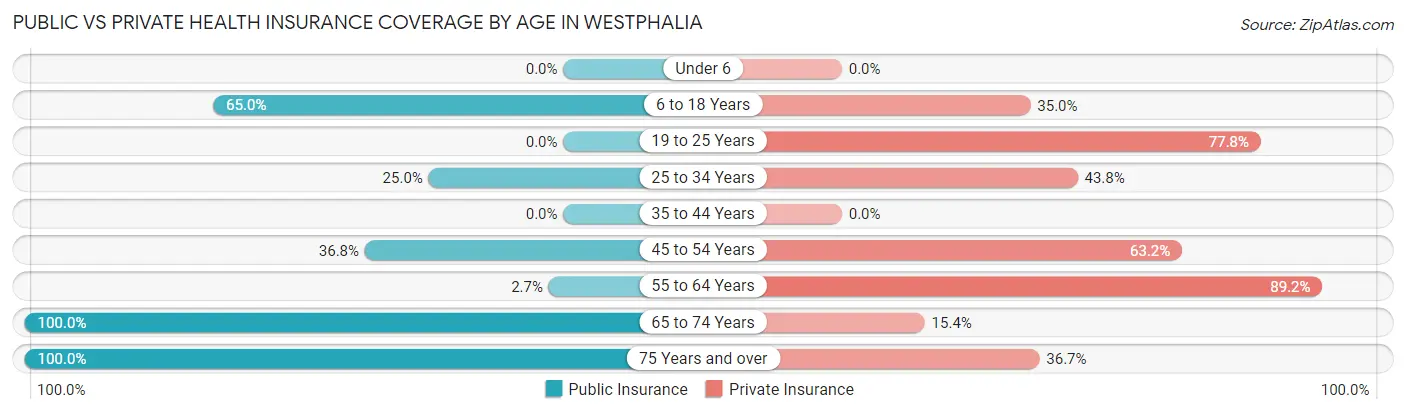
| Age Bracket | Public Insurance | Private Insurance |
| Under 6 | 0 (0.0%) | 0 (0.0%) |
| 6 to 18 Years | 13 (65.0%) | 7 (35.0%) |
| 19 to 25 Years | 0 (0.0%) | 7 (77.8%) |
| 25 to 34 Years | 4 (25.0%) | 7 (43.8%) |
| 35 to 44 Years | 0 (0.0%) | 0 (0.0%) |
| 45 to 54 Years | 7 (36.8%) | 12 (63.2%) |
| 55 to 64 Years | 1 (2.7%) | 33 (89.2%) |
| 65 to 74 Years | 13 (100.0%) | 2 (15.4%) |
| 75 Years and over | 30 (100.0%) | 11 (36.7%) |
| Total | 68 (47.2%) | 79 (54.9%) |
Disability Status by Sex by Age in Westphalia
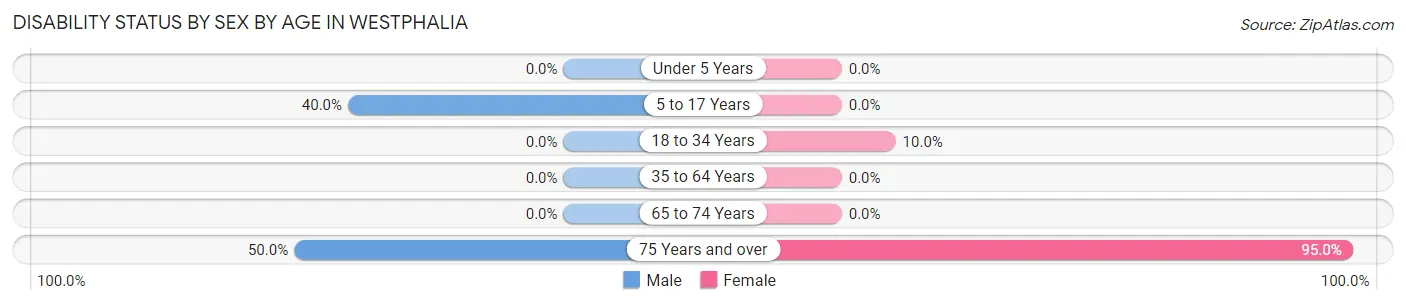
| Age Bracket | Male | Female |
| Under 5 Years | 0 (0.0%) | 0 (0.0%) |
| 5 to 17 Years | 2 (40.0%) | 0 (0.0%) |
| 18 to 34 Years | 0 (0.0%) | 2 (10.0%) |
| 35 to 64 Years | 0 (0.0%) | 0 (0.0%) |
| 65 to 74 Years | 0 (0.0%) | 0 (0.0%) |
| 75 Years and over | 5 (50.0%) | 19 (95.0%) |
Disability Class by Sex by Age in Westphalia
Disability Class: Hearing Difficulty
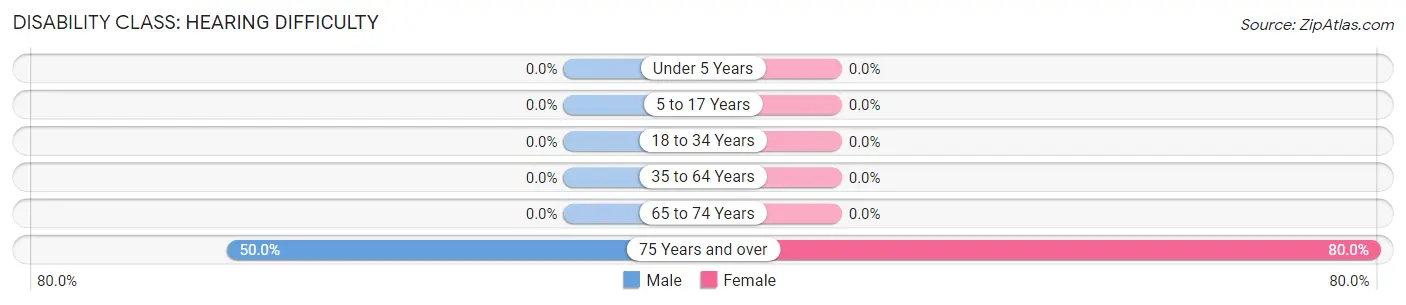
| Age Bracket | Male | Female |
| Under 5 Years | 0 (0.0%) | 0 (0.0%) |
| 5 to 17 Years | 0 (0.0%) | 0 (0.0%) |
| 18 to 34 Years | 0 (0.0%) | 0 (0.0%) |
| 35 to 64 Years | 0 (0.0%) | 0 (0.0%) |
| 65 to 74 Years | 0 (0.0%) | 0 (0.0%) |
| 75 Years and over | 5 (50.0%) | 16 (80.0%) |
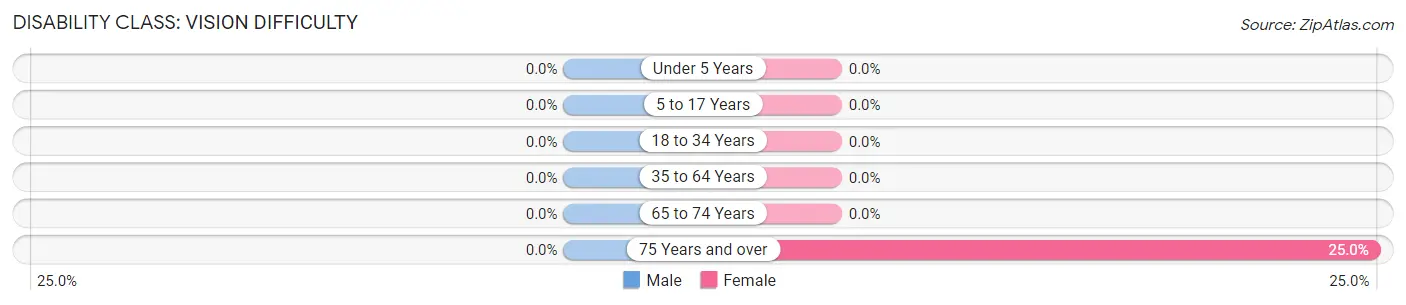
Disability Class: Vision Difficulty
| Age Bracket | Male | Female |
| Under 5 Years | 0 (0.0%) | 0 (0.0%) |
| 5 to 17 Years | 0 (0.0%) | 0 (0.0%) |
| 18 to 34 Years | 0 (0.0%) | 0 (0.0%) |
| 35 to 64 Years | 0 (0.0%) | 0 (0.0%) |
| 65 to 74 Years | 0 (0.0%) | 0 (0.0%) |
| 75 Years and over | 0 (0.0%) | 5 (25.0%) |
Disability Class: Cognitive Difficulty
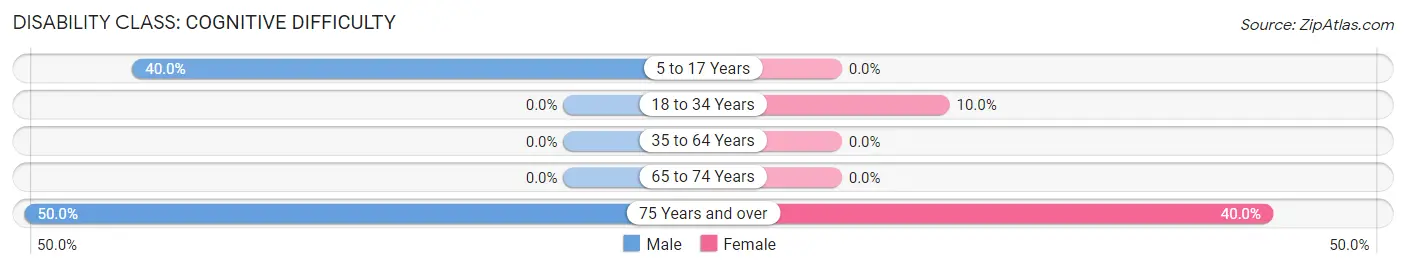
| Age Bracket | Male | Female |
| 5 to 17 Years | 2 (40.0%) | 0 (0.0%) |
| 18 to 34 Years | 0 (0.0%) | 2 (10.0%) |
| 35 to 64 Years | 0 (0.0%) | 0 (0.0%) |
| 65 to 74 Years | 0 (0.0%) | 0 (0.0%) |
| 75 Years and over | 5 (50.0%) | 8 (40.0%) |
Disability Class: Ambulatory Difficulty
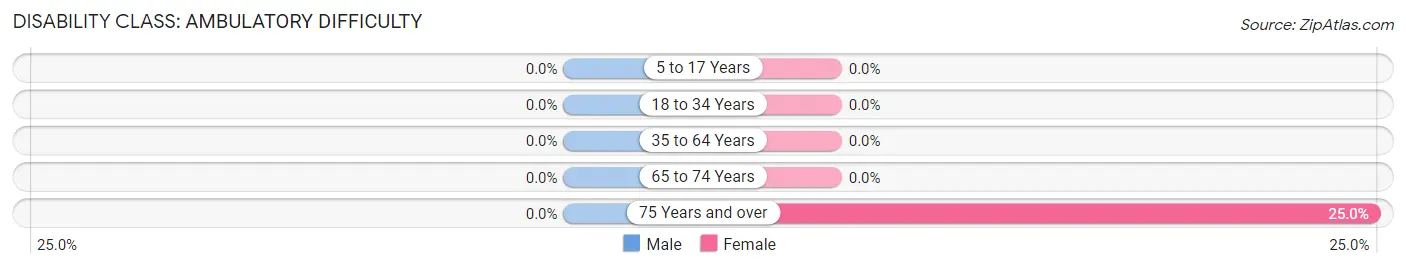
| Age Bracket | Male | Female |
| 5 to 17 Years | 0 (0.0%) | 0 (0.0%) |
| 18 to 34 Years | 0 (0.0%) | 0 (0.0%) |
| 35 to 64 Years | 0 (0.0%) | 0 (0.0%) |
| 65 to 74 Years | 0 (0.0%) | 0 (0.0%) |
| 75 Years and over | 0 (0.0%) | 5 (25.0%) |
Disability Class: Self-Care Difficulty
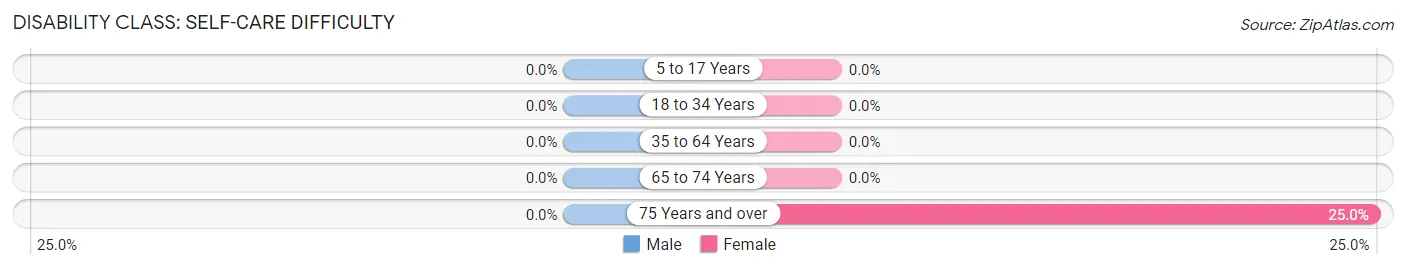
| Age Bracket | Male | Female |
| 5 to 17 Years | 0 (0.0%) | 0 (0.0%) |
| 18 to 34 Years | 0 (0.0%) | 0 (0.0%) |
| 35 to 64 Years | 0 (0.0%) | 0 (0.0%) |
| 65 to 74 Years | 0 (0.0%) | 0 (0.0%) |
| 75 Years and over | 0 (0.0%) | 5 (25.0%) |
Technology Access in Westphalia
Computing Device Access in Westphalia
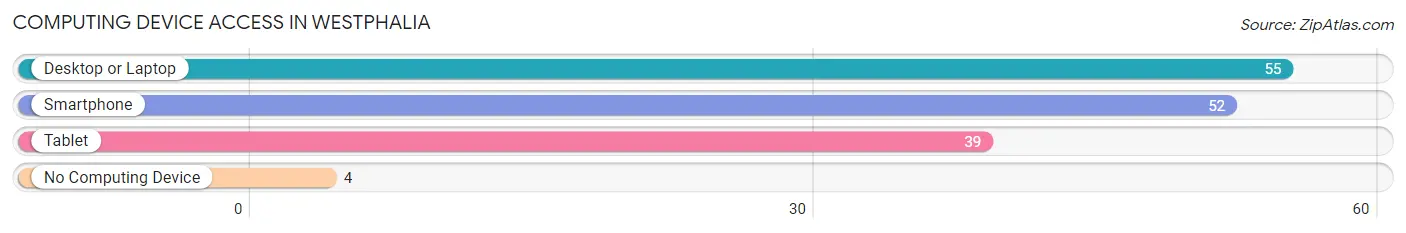
| Device Type | # Households | % Households |
| Desktop or Laptop | 55 | 91.7% |
| Smartphone | 52 | 86.7% |
| Tablet | 39 | 65.0% |
| No Computing Device | 4 | 6.7% |
| Total | 60 | 100.0% |
Internet Access in Westphalia
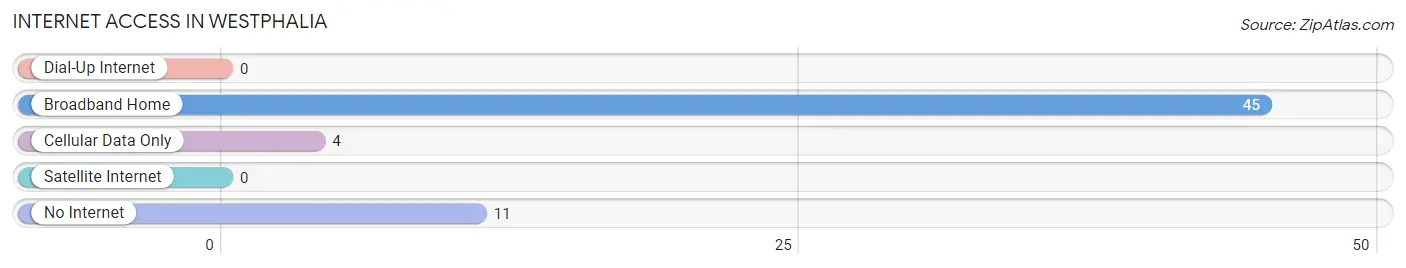
| Internet Type | # Households | % Households |
| Dial-Up Internet | 0 | 0.0% |
| Broadband Home | 45 | 75.0% |
| Cellular Data Only | 4 | 6.7% |
| Satellite Internet | 0 | 0.0% |
| No Internet | 11 | 18.3% |
| Total | 60 | 100.0% |
Westphalia Summary
Westphalia is a small town located in Fayette County, Iowa, United States. The population was estimated to be around 545 in 2020. Westphalia is located in the Upper Iowa River Valley, and is surrounded by rolling hills and farmland.
History
Westphalia was founded in 1854 by German immigrants from the Westphalia region of Germany. The town was named after the region in Germany, and the settlers brought with them their German culture and traditions. The town was originally a farming community, and the settlers grew wheat, corn, and oats.
In 1856, the first school was built in Westphalia. The school was a one-room schoolhouse, and it served as the educational center for the town. In 1868, the first church was built in Westphalia. The church was a Catholic church, and it served as the spiritual center for the town.
In 1872, the first post office was established in Westphalia. The post office was located in the general store, and it served as the communication center for the town. In 1876, the first bank was established in Westphalia. The bank was a private bank, and it served as the financial center for the town.
In 1882, the first newspaper was established in Westphalia. The newspaper was called the Westphalia Herald, and it served as the news source for the town. In 1884, the first telephone was installed in Westphalia. The telephone was a party line, and it served as the communication center for the town.
In 1887, the first railroad was built in Westphalia. The railroad was a branch line of the Chicago, Milwaukee, and St. Paul Railroad, and it served as the transportation center for the town. In 1889, the first electric lights were installed in Westphalia. The electric lights were powered by a generator, and they served as the lighting center for the town.
In 1895, the first fire department was established in Westphalia. The fire department was a volunteer fire department, and it served as the safety center for the town. In 1900, the first waterworks was established in Westphalia. The waterworks was a private waterworks, and it served as the water source for the town.
Geography
Westphalia is located in the Upper Iowa River Valley, and is surrounded by rolling hills and farmland. The town is located at the intersection of U.S. Route 18 and Iowa Highway 3. The town is located approximately 25 miles east of Waterloo, Iowa, and approximately 40 miles west of Cedar Rapids, Iowa.
The climate in Westphalia is classified as humid continental, with cold winters and hot summers. The average annual temperature is around 50 degrees Fahrenheit, and the average annual precipitation is around 30 inches.
Economy
The economy of Westphalia is primarily based on agriculture. The town is surrounded by farmland, and the main crops grown in the area are corn, soybeans, and oats. The town also has a few small businesses, including a general store, a hardware store, and a restaurant.
Demographics
The population of Westphalia was estimated to be around 545 in 2020. The population is primarily white, with a small percentage of African Americans and Hispanics. The median household income is around $50,000, and the median home value is around $150,000. The town has a low unemployment rate, and the poverty rate is below the national average.
Common Questions
What is Per Capita Income in Westphalia?
Per Capita income in Westphalia is $45,613.
What is the Median Family Income in Westphalia?
Median Family Income in Westphalia is $103,636.
What is the Median Household income in Westphalia?
Median Household Income in Westphalia is $102,955.
What is Income or Wage Gap in Westphalia?
Income or Wage Gap in Westphalia is 37.4%.
Women in Westphalia earn 62.6 cents for every dollar earned by a man.
What is Inequality or Gini Index in Westphalia?
Inequality or Gini Index in Westphalia is 0.39.
What is the Total Population of Westphalia?
Total Population of Westphalia is 144.
What is the Total Male Population of Westphalia?
Total Male Population of Westphalia is 60.
What is the Total Female Population of Westphalia?
Total Female Population of Westphalia is 84.
What is the Ratio of Males per 100 Females in Westphalia?
There are 71.43 Males per 100 Females in Westphalia.
What is the Ratio of Females per 100 Males in Westphalia?
There are 140.00 Females per 100 Males in Westphalia.
What is the Median Population Age in Westphalia?
Median Population Age in Westphalia is 58.2 Years.
What is the Average Family Size in Westphalia
Average Family Size in Westphalia is 2.6 People.
What is the Average Household Size in Westphalia
Average Household Size in Westphalia is 2.4 People.
How Large is the Labor Force in Westphalia?
There are 91 People in the Labor Forcein in Westphalia.
What is the Percentage of People in the Labor Force in Westphalia?
71.1% of People are in the Labor Force in Westphalia.