Urbana, IA Map & Demographics
Urbana Map
Urbana Overview
$38,264
PER CAPITA INCOME
$118,750
AVG FAMILY INCOME
$107,625
AVG HOUSEHOLD INCOME
36.9%
WAGE / INCOME GAP [ % ]
63.1¢/ $1
WAGE / INCOME GAP [ $ ]
0.33
INEQUALITY / GINI INDEX
1,565
TOTAL POPULATION
777
MALE POPULATION
788
FEMALE POPULATION
98.60
MALES / 100 FEMALES
101.42
FEMALES / 100 MALES
32.2
MEDIAN AGE
3.5
AVG FAMILY SIZE
3.0
AVG HOUSEHOLD SIZE
886
LABOR FORCE [ PEOPLE ]
78.0%
PERCENT IN LABOR FORCE
2.4%
UNEMPLOYMENT RATE
Urbana Zip Codes
Urbana Area Codes
Income in Urbana
Income Overview in Urbana
Per Capita Income in Urbana is $38,264, while median incomes of families and households are $118,750 and $107,625 respectively.
| Characteristic | Number | Measure |
| Per Capita Income | 1,565 | $38,264 |
| Median Family Income | 398 | $118,750 |
| Mean Family Income | 398 | $124,806 |
| Median Household Income | 521 | $107,625 |
| Mean Household Income | 521 | $111,825 |
| Income Deficit | 398 | $0 |
| Wage / Income Gap (%) | 1,565 | 36.94% |
| Wage / Income Gap ($) | 1,565 | 63.06¢ per $1 |
| Gini / Inequality Index | 1,565 | 0.33 |
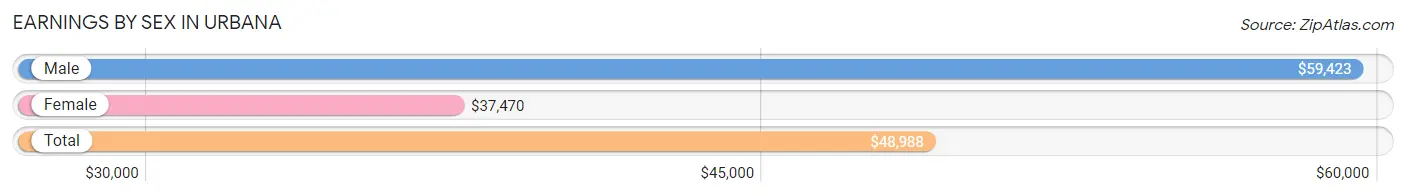
Earnings by Sex in Urbana
Average Earnings in Urbana are $48,988, $59,423 for men and $37,470 for women, a difference of 36.9%.
| Sex | Number | Average Earnings |
| Male | 456 (48.8%) | $59,423 |
| Female | 479 (51.2%) | $37,470 |
| Total | 935 (100.0%) | $48,988 |
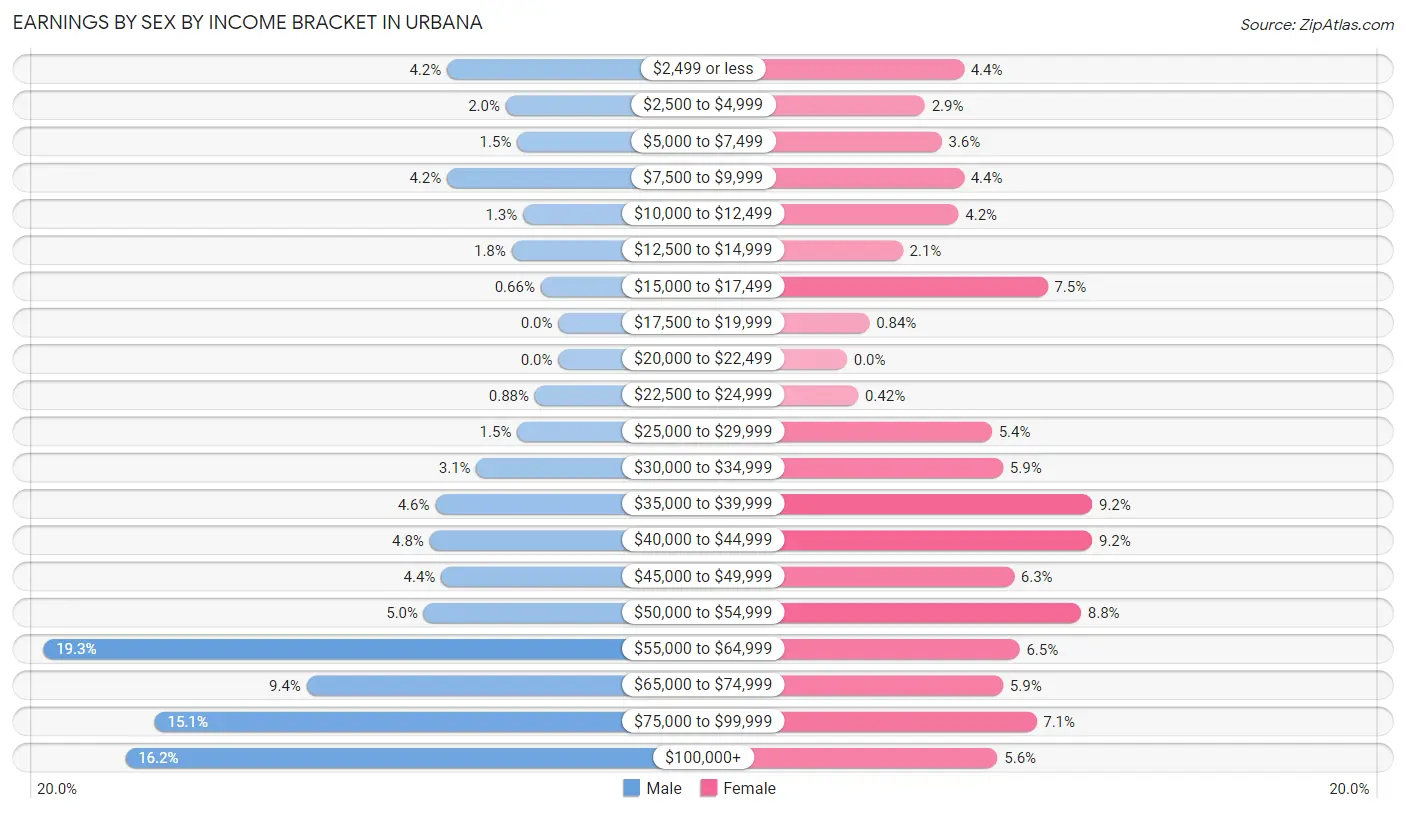
Earnings by Sex by Income Bracket in Urbana
The most common earnings brackets in Urbana are $55,000 to $64,999 for men (88 | 19.3%) and $35,000 to $39,999 for women (44 | 9.2%).
| Income | Male | Female |
| $2,499 or less | 19 (4.2%) | 21 (4.4%) |
| $2,500 to $4,999 | 9 (2.0%) | 14 (2.9%) |
| $5,000 to $7,499 | 7 (1.5%) | 17 (3.5%) |
| $7,500 to $9,999 | 19 (4.2%) | 21 (4.4%) |
| $10,000 to $12,499 | 6 (1.3%) | 20 (4.2%) |
| $12,500 to $14,999 | 8 (1.8%) | 10 (2.1%) |
| $15,000 to $17,499 | 3 (0.7%) | 36 (7.5%) |
| $17,500 to $19,999 | 0 (0.0%) | 4 (0.8%) |
| $20,000 to $22,499 | 0 (0.0%) | 0 (0.0%) |
| $22,500 to $24,999 | 4 (0.9%) | 2 (0.4%) |
| $25,000 to $29,999 | 7 (1.5%) | 26 (5.4%) |
| $30,000 to $34,999 | 14 (3.1%) | 28 (5.9%) |
| $35,000 to $39,999 | 21 (4.6%) | 44 (9.2%) |
| $40,000 to $44,999 | 22 (4.8%) | 44 (9.2%) |
| $45,000 to $49,999 | 20 (4.4%) | 30 (6.3%) |
| $50,000 to $54,999 | 23 (5.0%) | 42 (8.8%) |
| $55,000 to $64,999 | 88 (19.3%) | 31 (6.5%) |
| $65,000 to $74,999 | 43 (9.4%) | 28 (5.9%) |
| $75,000 to $99,999 | 69 (15.1%) | 34 (7.1%) |
| $100,000+ | 74 (16.2%) | 27 (5.6%) |
| Total | 456 (100.0%) | 479 (100.0%) |
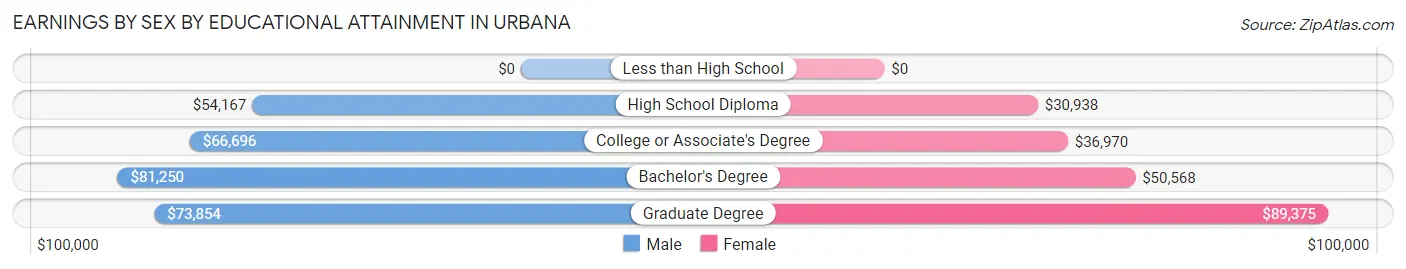
Earnings by Sex by Educational Attainment in Urbana
Average earnings in Urbana are $64,702 for men and $45,000 for women, a difference of 30.4%. Men with an educational attainment of bachelor's degree enjoy the highest average annual earnings of $81,250, while those with high school diploma education earn the least with $54,167. Women with an educational attainment of graduate degree earn the most with the average annual earnings of $89,375, while those with high school diploma education have the smallest earnings of $30,938.
| Educational Attainment | Male Income | Female Income |
| Less than High School | - | - |
| High School Diploma | $54,167 | $30,938 |
| College or Associate's Degree | $66,696 | $36,970 |
| Bachelor's Degree | $81,250 | $50,568 |
| Graduate Degree | $73,854 | $89,375 |
| Total | $64,702 | $45,000 |
Family Income in Urbana
Family Income Brackets in Urbana
According to the Urbana family income data, there are 145 families falling into the $100,000 to $149,999 income range, which is the most common income bracket and makes up 36.4% of all families. Conversely, the $10,000 to $14,999 income bracket is the least frequent group with only 4 families (1.0%) belonging to this category.
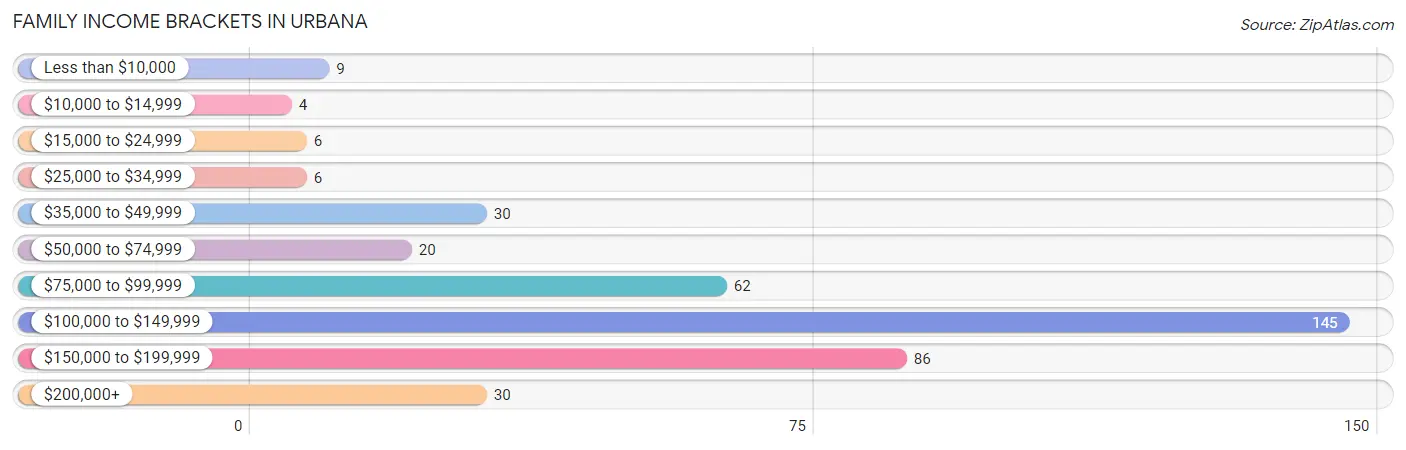
| Income Bracket | # Families | % Families |
| Less than $10,000 | 9 | 2.3% |
| $10,000 to $14,999 | 4 | 1.0% |
| $15,000 to $24,999 | 6 | 1.5% |
| $25,000 to $34,999 | 6 | 1.5% |
| $35,000 to $49,999 | 30 | 7.5% |
| $50,000 to $74,999 | 20 | 5.0% |
| $75,000 to $99,999 | 62 | 15.6% |
| $100,000 to $149,999 | 145 | 36.4% |
| $150,000 to $199,999 | 86 | 21.6% |
| $200,000+ | 30 | 7.5% |
Family Income by Famaliy Size in Urbana
4-person families (137 | 34.4%) account for the highest median family income in Urbana with $147,813 per family, while 2-person families (151 | 37.9%) have the highest median income of $49,688 per family member.
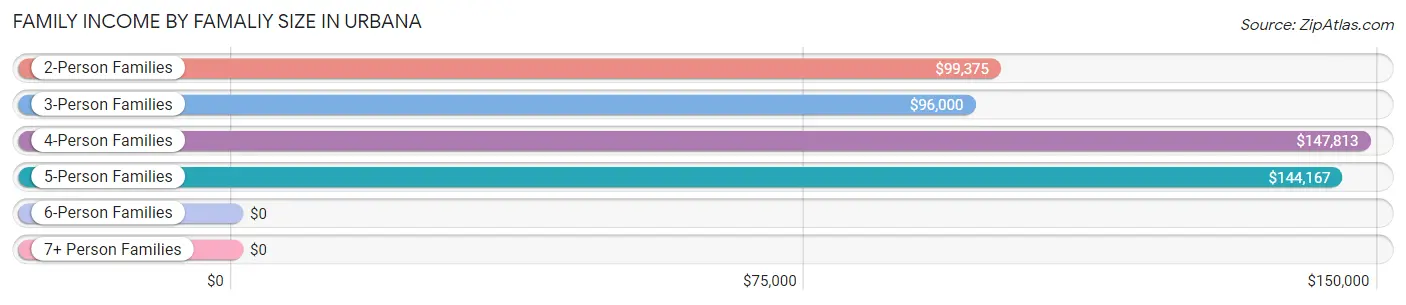
| Income Bracket | # Families | Median Income |
| 2-Person Families | 151 (37.9%) | $99,375 |
| 3-Person Families | 72 (18.1%) | $96,000 |
| 4-Person Families | 137 (34.4%) | $147,813 |
| 5-Person Families | 30 (7.5%) | $144,167 |
| 6-Person Families | 4 (1.0%) | $0 |
| 7+ Person Families | 4 (1.0%) | $0 |
| Total | 398 (100.0%) | $118,750 |
Family Income by Number of Earners in Urbana
The median family income in Urbana is $118,750, with families comprising 3+ earners (62) having the highest median family income of $152,679, while families with no earners (32) have the lowest median family income of $57,500, accounting for 15.6% and 8.0% of families, respectively.
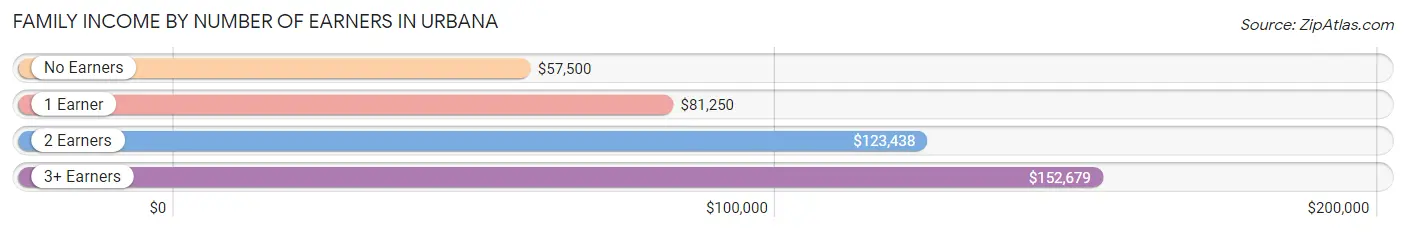
| Number of Earners | # Families | Median Income |
| No Earners | 32 (8.0%) | $57,500 |
| 1 Earner | 61 (15.3%) | $81,250 |
| 2 Earners | 243 (61.1%) | $123,438 |
| 3+ Earners | 62 (15.6%) | $152,679 |
| Total | 398 (100.0%) | $118,750 |
Household Income in Urbana
Household Income Brackets in Urbana
With 178 households falling in the category, the $100,000 to $149,999 income range is the most frequent in Urbana, accounting for 34.2% of all households. In contrast, only 4 households (0.8%) fall into the $10,000 to $14,999 income bracket, making it the least populous group.
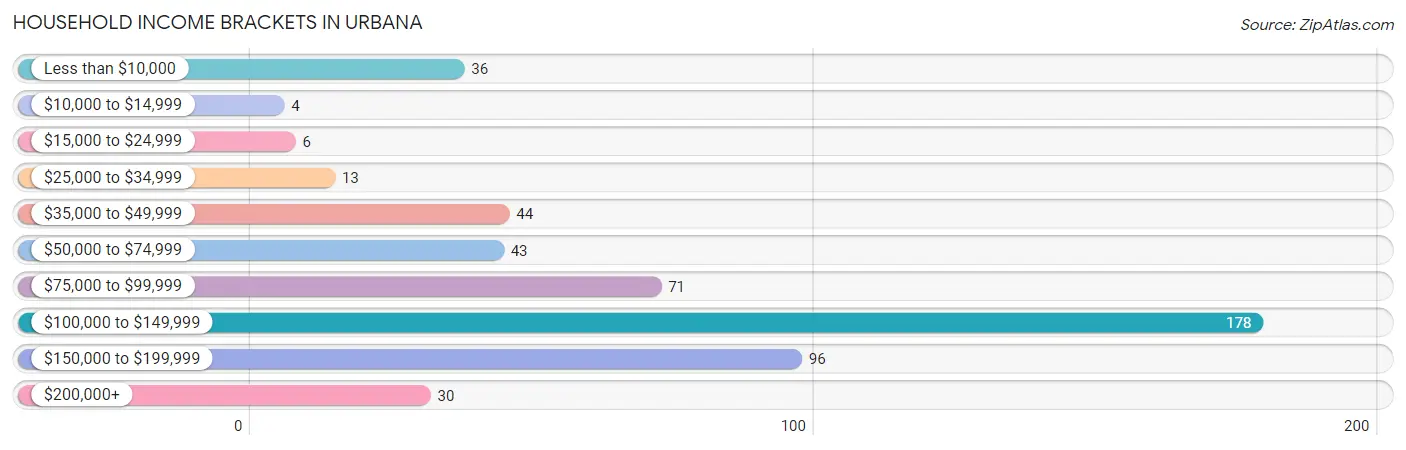
| Income Bracket | # Households | % Households |
| Less than $10,000 | 36 | 6.9% |
| $10,000 to $14,999 | 4 | 0.8% |
| $15,000 to $24,999 | 6 | 1.2% |
| $25,000 to $34,999 | 13 | 2.5% |
| $35,000 to $49,999 | 44 | 8.4% |
| $50,000 to $74,999 | 43 | 8.3% |
| $75,000 to $99,999 | 71 | 13.6% |
| $100,000 to $149,999 | 178 | 34.2% |
| $150,000 to $199,999 | 96 | 18.4% |
| $200,000+ | 30 | 5.8% |
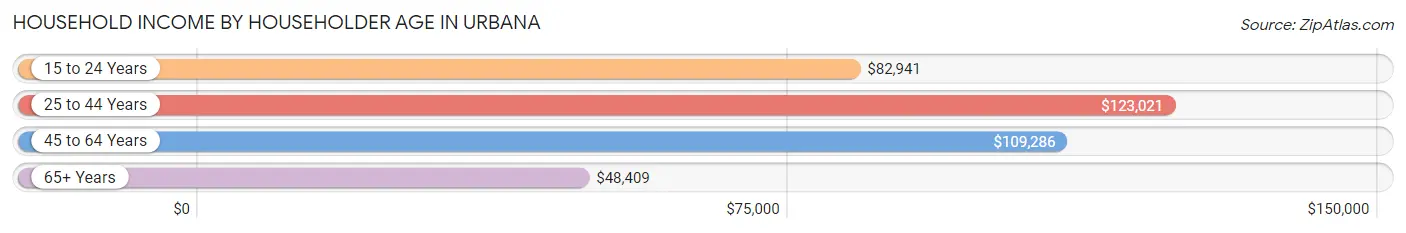
Household Income by Householder Age in Urbana
The median household income in Urbana is $107,625, with the highest median household income of $123,021 found in the 25 to 44 years age bracket for the primary householder. A total of 211 households (40.5%) fall into this category. Meanwhile, the 65+ years age bracket for the primary householder has the lowest median household income of $48,409, with 88 households (16.9%) in this group.
| Income Bracket | # Households | Median Income |
| 15 to 24 Years | 28 (5.4%) | $82,941 |
| 25 to 44 Years | 211 (40.5%) | $123,021 |
| 45 to 64 Years | 194 (37.2%) | $109,286 |
| 65+ Years | 88 (16.9%) | $48,409 |
| Total | 521 (100.0%) | $107,625 |
Poverty in Urbana
Income Below Poverty by Sex and Age in Urbana
With 6.6% poverty level for males and 10.2% for females among the residents of Urbana, 75 year old and over males and 75 year old and over females are the most vulnerable to poverty, with 11 males (50.0%) and 13 females (27.7%) in their respective age groups living below the poverty level.
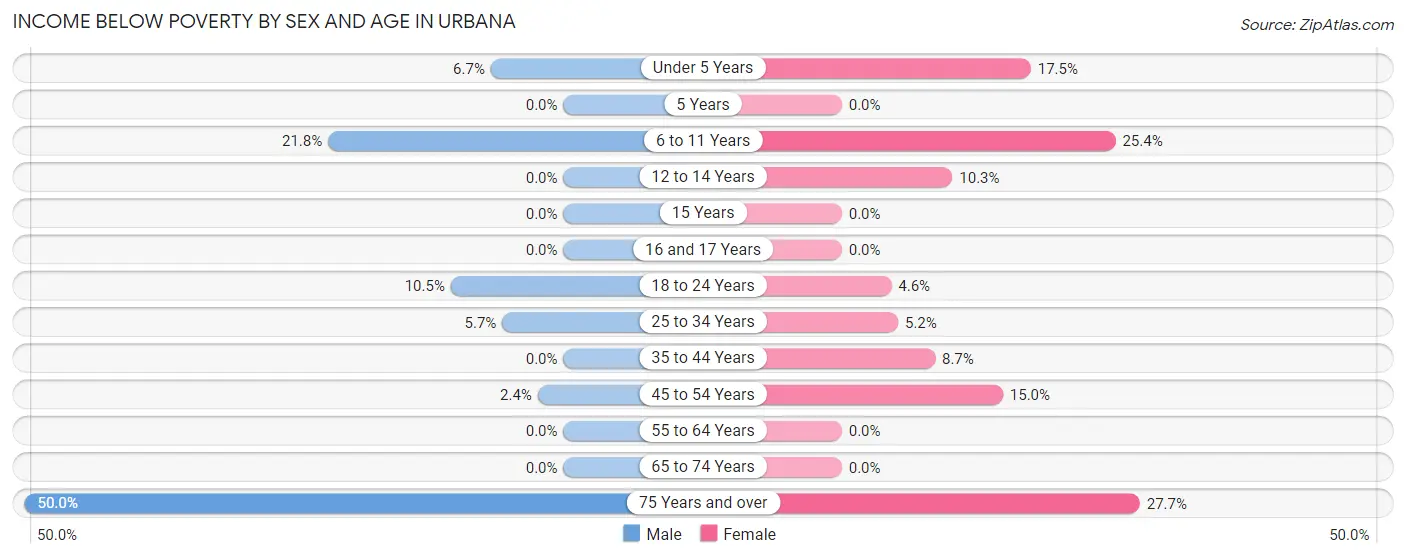
| Age Bracket | Male | Female |
| Under 5 Years | 6 (6.7%) | 10 (17.5%) |
| 5 Years | 0 (0.0%) | 0 (0.0%) |
| 6 to 11 Years | 19 (21.8%) | 16 (25.4%) |
| 12 to 14 Years | 0 (0.0%) | 4 (10.3%) |
| 15 Years | 0 (0.0%) | 0 (0.0%) |
| 16 and 17 Years | 0 (0.0%) | 0 (0.0%) |
| 18 to 24 Years | 7 (10.4%) | 4 (4.6%) |
| 25 to 34 Years | 5 (5.7%) | 7 (5.2%) |
| 35 to 44 Years | 0 (0.0%) | 9 (8.6%) |
| 45 to 54 Years | 3 (2.4%) | 16 (14.9%) |
| 55 to 64 Years | 0 (0.0%) | 0 (0.0%) |
| 65 to 74 Years | 0 (0.0%) | 0 (0.0%) |
| 75 Years and over | 11 (50.0%) | 13 (27.7%) |
| Total | 51 (6.6%) | 79 (10.2%) |
Income Above Poverty by Sex and Age in Urbana
According to the poverty statistics in Urbana, males aged 5 years and females aged 5 years are the age groups that are most secure financially, with 100.0% of males and 100.0% of females in these age groups living above the poverty line.
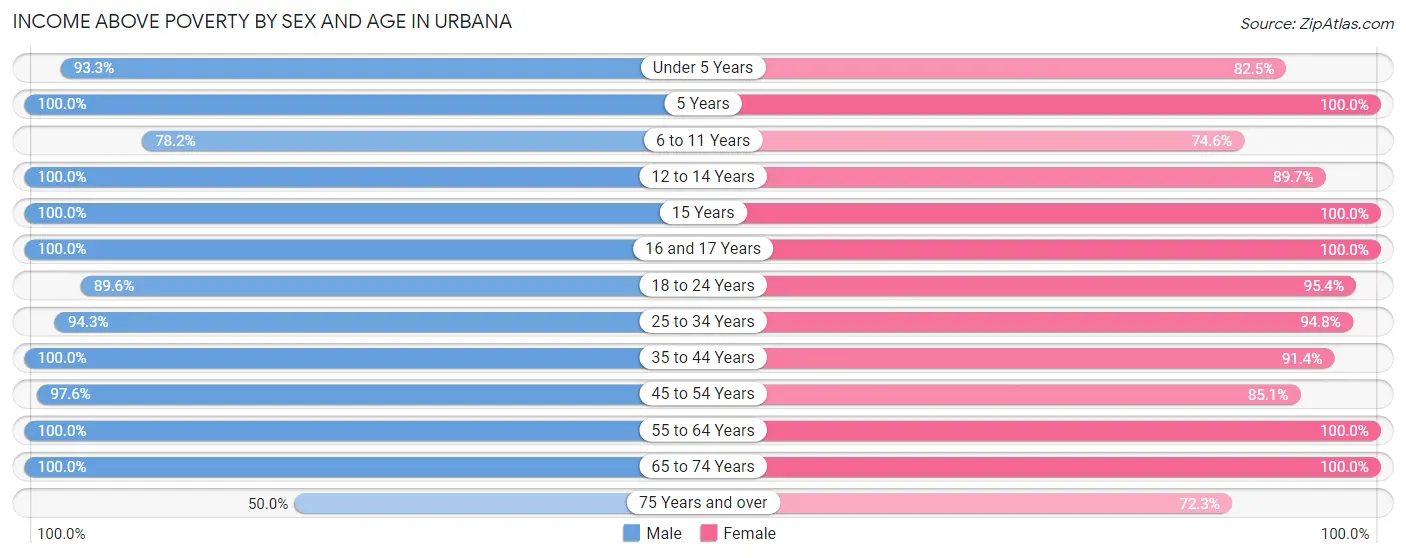
| Age Bracket | Male | Female |
| Under 5 Years | 83 (93.3%) | 47 (82.5%) |
| 5 Years | 18 (100.0%) | 5 (100.0%) |
| 6 to 11 Years | 68 (78.2%) | 47 (74.6%) |
| 12 to 14 Years | 22 (100.0%) | 35 (89.7%) |
| 15 Years | 17 (100.0%) | 20 (100.0%) |
| 16 and 17 Years | 27 (100.0%) | 14 (100.0%) |
| 18 to 24 Years | 60 (89.5%) | 83 (95.4%) |
| 25 to 34 Years | 83 (94.3%) | 127 (94.8%) |
| 35 to 44 Years | 121 (100.0%) | 95 (91.3%) |
| 45 to 54 Years | 123 (97.6%) | 91 (85.1%) |
| 55 to 64 Years | 52 (100.0%) | 54 (100.0%) |
| 65 to 74 Years | 41 (100.0%) | 45 (100.0%) |
| 75 Years and over | 11 (50.0%) | 34 (72.3%) |
| Total | 726 (93.4%) | 697 (89.8%) |
Income Below Poverty Among Married-Couple Families in Urbana
The poverty statistics for married-couple families in Urbana show that 2.3% or 8 of the total 345 families live below the poverty line. Families with 5 or more children have the highest poverty rate of 100.0%, comprising of 4 families. On the other hand, families with 1 or 2 children have the lowest poverty rate of 0.0%, which includes 0 families.
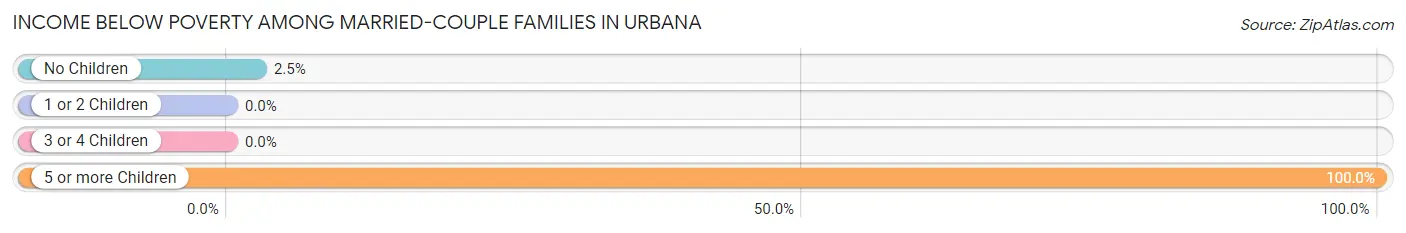
| Children | Above Poverty | Below Poverty |
| No Children | 155 (97.5%) | 4 (2.5%) |
| 1 or 2 Children | 152 (100.0%) | 0 (0.0%) |
| 3 or 4 Children | 30 (100.0%) | 0 (0.0%) |
| 5 or more Children | 0 (0.0%) | 4 (100.0%) |
| Total | 337 (97.7%) | 8 (2.3%) |
Income Below Poverty Among Single-Parent Households in Urbana
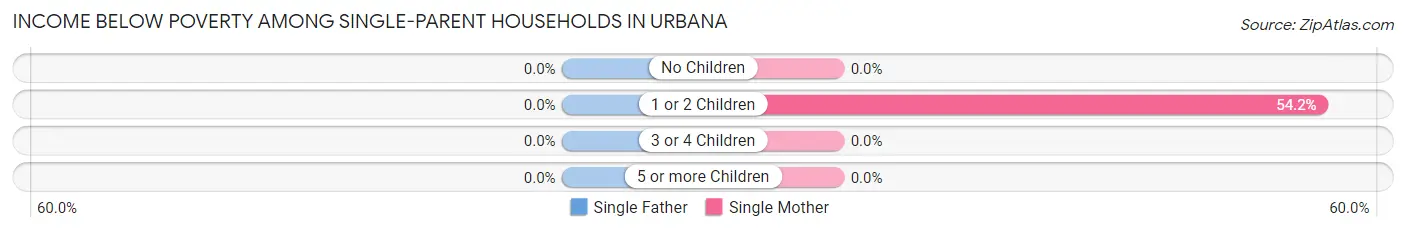
| Children | Single Father | Single Mother |
| No Children | 0 (0.0%) | 0 (0.0%) |
| 1 or 2 Children | 0 (0.0%) | 13 (54.2%) |
| 3 or 4 Children | 0 (0.0%) | 0 (0.0%) |
| 5 or more Children | 0 (0.0%) | 0 (0.0%) |
| Total | 0 (0.0%) | 13 (40.6%) |
Income Below Poverty Among Married-Couple vs Single-Parent Households in Urbana
The poverty data for Urbana shows that 8 of the married-couple family households (2.3%) and 13 of the single-parent households (24.5%) are living below the poverty level. Within the married-couple family households, those with 5 or more children have the highest poverty rate, with 4 households (100.0%) falling below the poverty line. Among the single-parent households, those with 1 or 2 children have the highest poverty rate, with 13 household (28.9%) living below poverty.
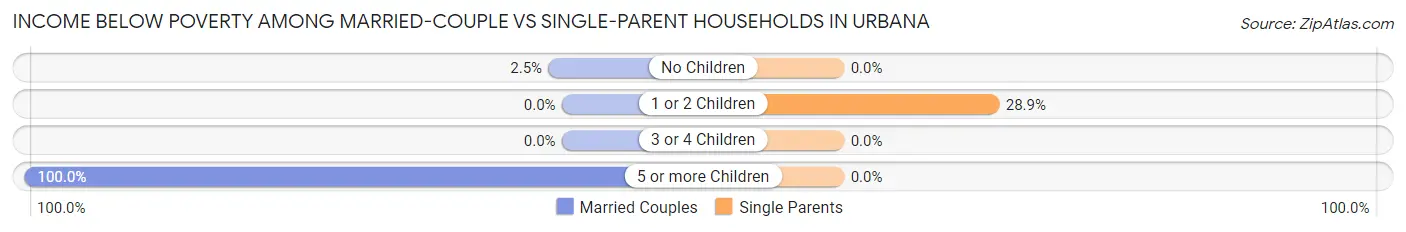
| Children | Married-Couple Families | Single-Parent Households |
| No Children | 4 (2.5%) | 0 (0.0%) |
| 1 or 2 Children | 0 (0.0%) | 13 (28.9%) |
| 3 or 4 Children | 0 (0.0%) | 0 (0.0%) |
| 5 or more Children | 4 (100.0%) | 0 (0.0%) |
| Total | 8 (2.3%) | 13 (24.5%) |
Race in Urbana
The most populous races in Urbana are White / Caucasian (1,473 | 94.1%), Hispanic or Latino (52 | 3.3%), and Two or more Races (39 | 2.5%).
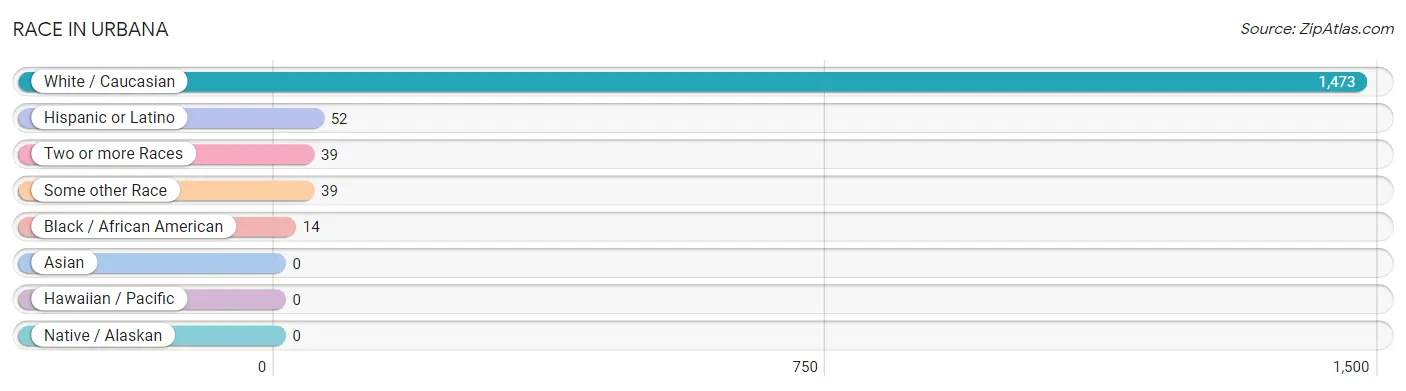
| Race | # Population | % Population |
| Asian | 0 | 0.0% |
| Black / African American | 14 | 0.9% |
| Hawaiian / Pacific | 0 | 0.0% |
| Hispanic or Latino | 52 | 3.3% |
| Native / Alaskan | 0 | 0.0% |
| White / Caucasian | 1,473 | 94.1% |
| Two or more Races | 39 | 2.5% |
| Some other Race | 39 | 2.5% |
| Total | 1,565 | 100.0% |
Ancestry in Urbana
The most populous ancestries reported in Urbana are German (621 | 39.7%), Irish (221 | 14.1%), English (109 | 7.0%), American (89 | 5.7%), and Norwegian (62 | 4.0%), together accounting for 70.4% of all Urbana residents.
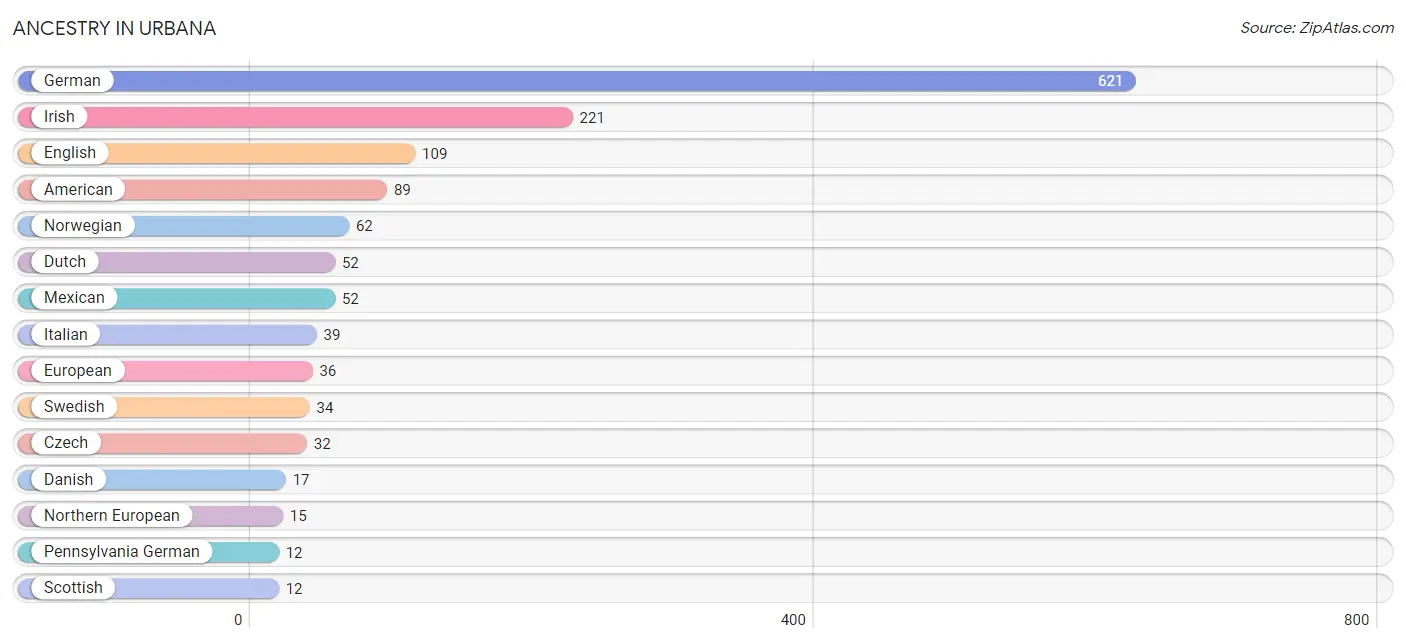
| Ancestry | # Population | % Population |
| American | 89 | 5.7% |
| British | 2 | 0.1% |
| Canadian | 9 | 0.6% |
| Cherokee | 2 | 0.1% |
| Czech | 32 | 2.0% |
| Czechoslovakian | 3 | 0.2% |
| Danish | 17 | 1.1% |
| Dutch | 52 | 3.3% |
| English | 109 | 7.0% |
| European | 36 | 2.3% |
| French | 8 | 0.5% |
| French Canadian | 8 | 0.5% |
| German | 621 | 39.7% |
| Indian (Asian) | 7 | 0.4% |
| Irish | 221 | 14.1% |
| Italian | 39 | 2.5% |
| Mexican | 52 | 3.3% |
| Northern European | 15 | 1.0% |
| Norwegian | 62 | 4.0% |
| Pennsylvania German | 12 | 0.8% |
| Scottish | 12 | 0.8% |
| Swedish | 34 | 2.2% |
| Swiss | 2 | 0.1% |
| Welsh | 9 | 0.6% | View All 24 Rows |
Immigrants in Urbana
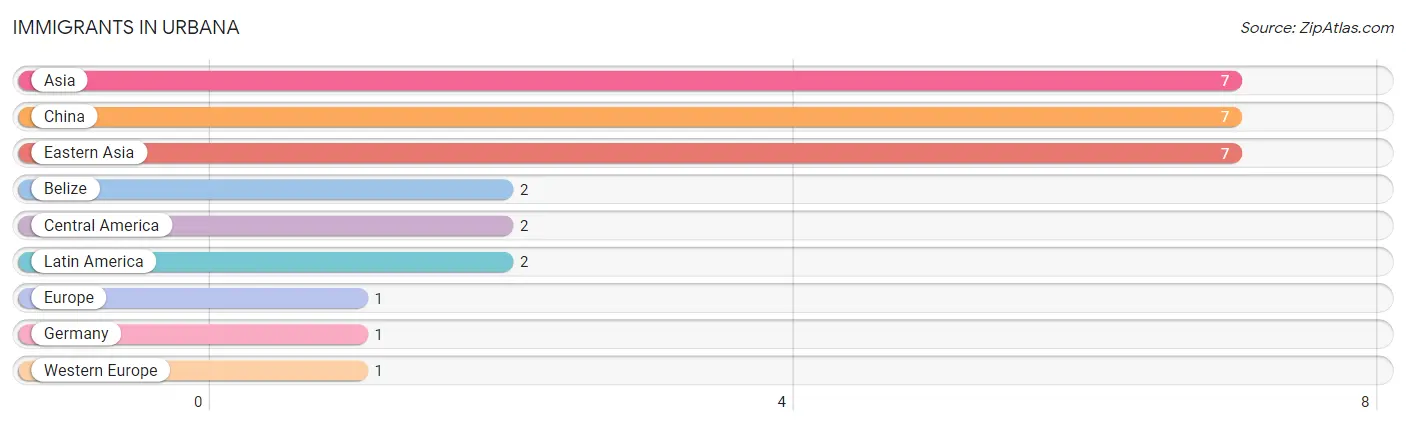
The most numerous immigrant groups reported in Urbana came from Asia (7 | 0.4%), China (7 | 0.4%), Eastern Asia (7 | 0.4%), Belize (2 | 0.1%), and Central America (2 | 0.1%), together accounting for 1.6% of all Urbana residents.
| Immigration Origin | # Population | % Population |
| Asia | 7 | 0.4% |
| Belize | 2 | 0.1% |
| Central America | 2 | 0.1% |
| China | 7 | 0.4% |
| Eastern Asia | 7 | 0.4% |
| Europe | 1 | 0.1% |
| Germany | 1 | 0.1% |
| Latin America | 2 | 0.1% |
| Western Europe | 1 | 0.1% | View All 9 Rows |
Sex and Age in Urbana
Sex and Age in Urbana
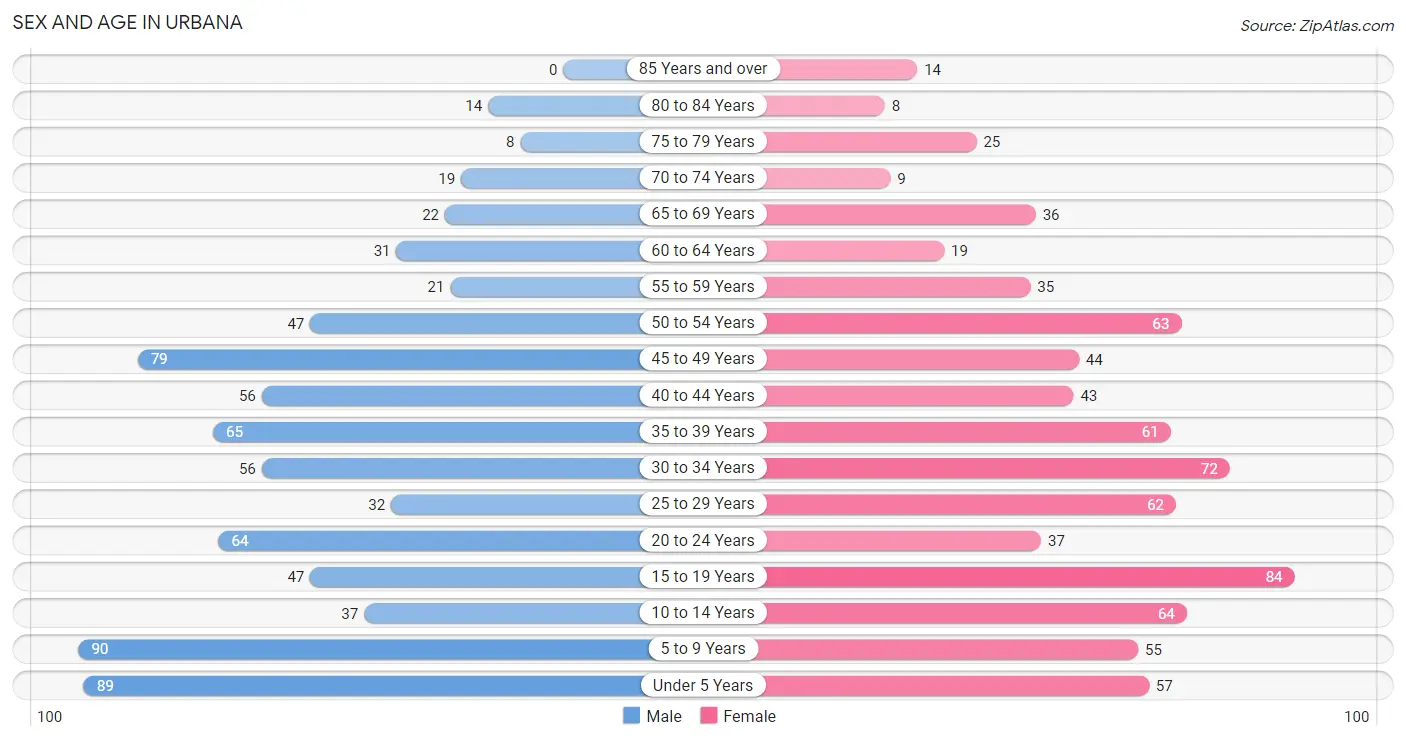
The most populous age groups in Urbana are 5 to 9 Years (90 | 11.6%) for men and 15 to 19 Years (84 | 10.7%) for women.
| Age Bracket | Male | Female |
| Under 5 Years | 89 (11.5%) | 57 (7.2%) |
| 5 to 9 Years | 90 (11.6%) | 55 (7.0%) |
| 10 to 14 Years | 37 (4.8%) | 64 (8.1%) |
| 15 to 19 Years | 47 (6.0%) | 84 (10.7%) |
| 20 to 24 Years | 64 (8.2%) | 37 (4.7%) |
| 25 to 29 Years | 32 (4.1%) | 62 (7.9%) |
| 30 to 34 Years | 56 (7.2%) | 72 (9.1%) |
| 35 to 39 Years | 65 (8.4%) | 61 (7.7%) |
| 40 to 44 Years | 56 (7.2%) | 43 (5.5%) |
| 45 to 49 Years | 79 (10.2%) | 44 (5.6%) |
| 50 to 54 Years | 47 (6.0%) | 63 (8.0%) |
| 55 to 59 Years | 21 (2.7%) | 35 (4.4%) |
| 60 to 64 Years | 31 (4.0%) | 19 (2.4%) |
| 65 to 69 Years | 22 (2.8%) | 36 (4.6%) |
| 70 to 74 Years | 19 (2.5%) | 9 (1.1%) |
| 75 to 79 Years | 8 (1.0%) | 25 (3.2%) |
| 80 to 84 Years | 14 (1.8%) | 8 (1.0%) |
| 85 Years and over | 0 (0.0%) | 14 (1.8%) |
| Total | 777 (100.0%) | 788 (100.0%) |
Families and Households in Urbana
Median Family Size in Urbana
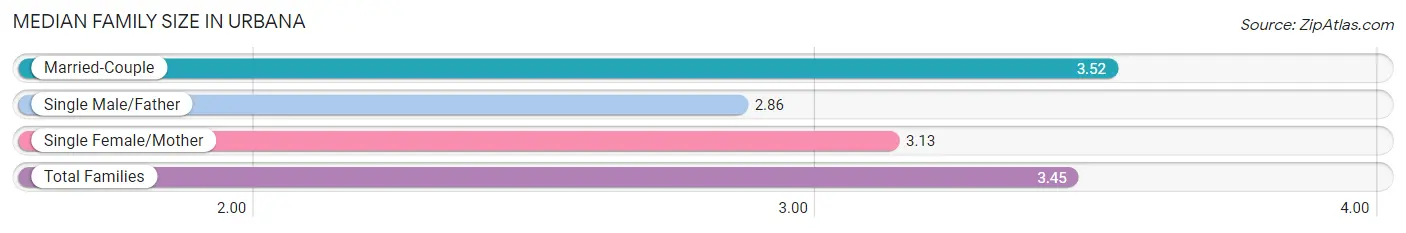
The median family size in Urbana is 3.45 persons per family, with married-couple families (345 | 86.7%) accounting for the largest median family size of 3.52 persons per family. On the other hand, single male/father families (21 | 5.3%) represent the smallest median family size with 2.86 persons per family.
| Family Type | # Families | Family Size |
| Married-Couple | 345 (86.7%) | 3.52 |
| Single Male/Father | 21 (5.3%) | 2.86 |
| Single Female/Mother | 32 (8.0%) | 3.13 |
| Total Families | 398 (100.0%) | 3.45 |
Median Household Size in Urbana
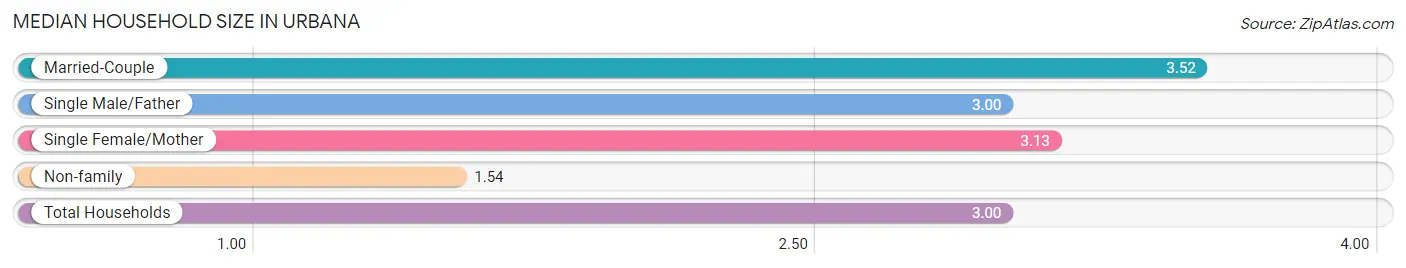
The median household size in Urbana is 3.00 persons per household, with married-couple households (345 | 66.2%) accounting for the largest median household size of 3.52 persons per household. non-family households (123 | 23.6%) represent the smallest median household size with 1.54 persons per household.
| Household Type | # Households | Household Size |
| Married-Couple | 345 (66.2%) | 3.52 |
| Single Male/Father | 21 (4.0%) | 3.00 |
| Single Female/Mother | 32 (6.1%) | 3.13 |
| Non-family | 123 (23.6%) | 1.54 |
| Total Households | 521 (100.0%) | 3.00 |
Household Size by Marriage Status in Urbana
Out of a total of 521 households in Urbana, 398 (76.4%) are family households, while 123 (23.6%) are nonfamily households. The most numerous type of family households are 2-person households, comprising 151, and the most common type of nonfamily households are 1-person households, comprising 78.
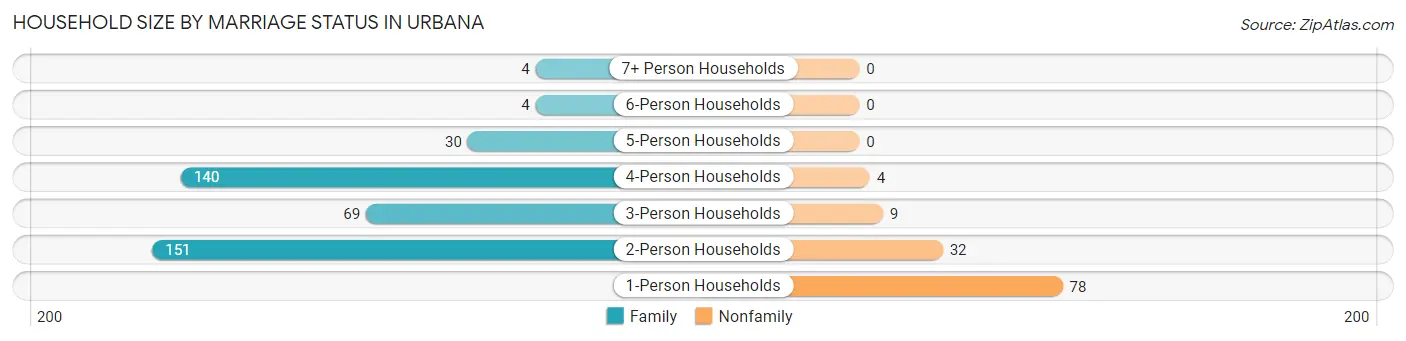
| Household Size | Family Households | Nonfamily Households |
| 1-Person Households | - | 78 (15.0%) |
| 2-Person Households | 151 (29.0%) | 32 (6.1%) |
| 3-Person Households | 69 (13.2%) | 9 (1.7%) |
| 4-Person Households | 140 (26.9%) | 4 (0.8%) |
| 5-Person Households | 30 (5.8%) | 0 (0.0%) |
| 6-Person Households | 4 (0.8%) | 0 (0.0%) |
| 7+ Person Households | 4 (0.8%) | 0 (0.0%) |
| Total | 398 (76.4%) | 123 (23.6%) |
Female Fertility in Urbana
Fertility by Age in Urbana
Average fertility rate in Urbana is 53.0 births per 1,000 women. Women in the age bracket of 20 to 34 years have the highest fertility rate with 94.0 births per 1,000 women. Women in the age bracket of 20 to 34 years acount for 69.6% of all women with births.
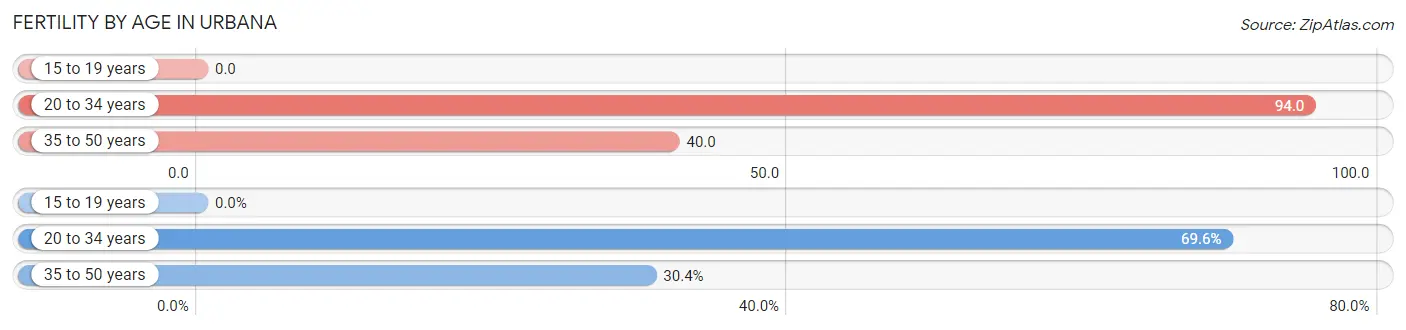
| Age Bracket | Women with Births | Births / 1,000 Women |
| 15 to 19 years | 0 (0.0%) | 0.0 |
| 20 to 34 years | 16 (69.6%) | 94.0 |
| 35 to 50 years | 7 (30.4%) | 40.0 |
| Total | 23 (100.0%) | 53.0 |
Fertility by Age by Marriage Status in Urbana
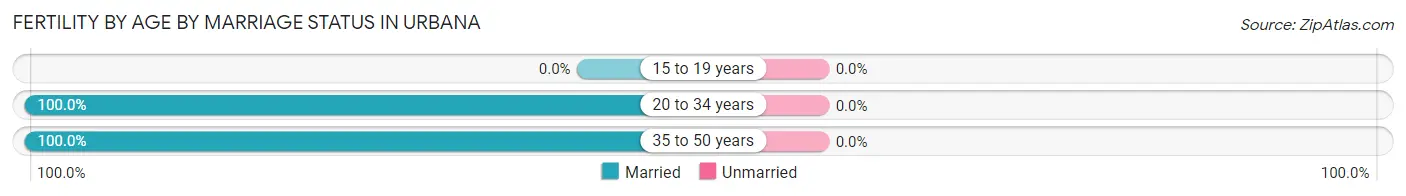
| Age Bracket | Married | Unmarried |
| 15 to 19 years | 0 (0.0%) | 0 (0.0%) |
| 20 to 34 years | 16 (100.0%) | 0 (0.0%) |
| 35 to 50 years | 7 (100.0%) | 0 (0.0%) |
| Total | 23 (100.0%) | 0 (0.0%) |
Fertility by Education in Urbana
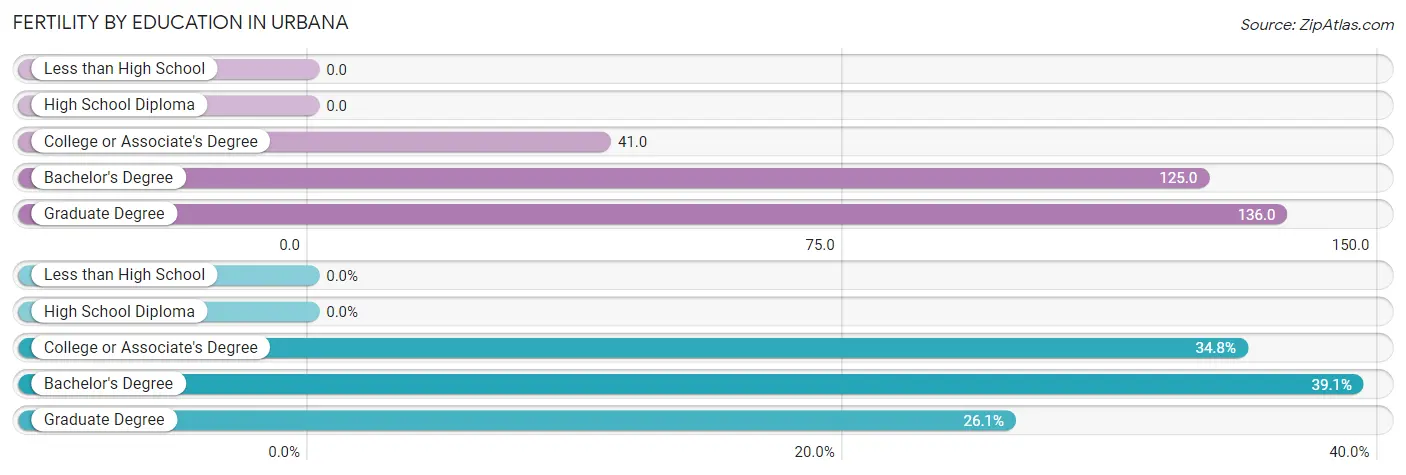
| Educational Attainment | Women with Births | Births / 1,000 Women |
| Less than High School | 0 (0.0%) | 0.0 |
| High School Diploma | 0 (0.0%) | 0.0 |
| College or Associate's Degree | 8 (34.8%) | 41.0 |
| Bachelor's Degree | 9 (39.1%) | 125.0 |
| Graduate Degree | 6 (26.1%) | 136.0 |
| Total | 23 (100.0%) | 53.0 |
Fertility by Education by Marriage Status in Urbana
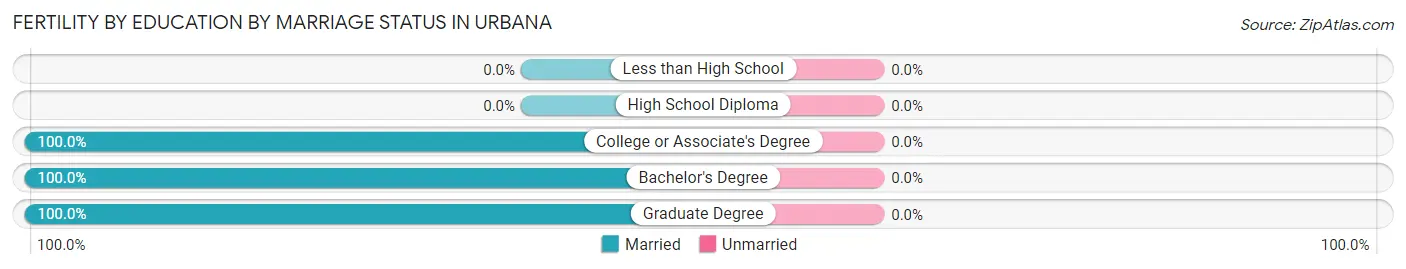
| Educational Attainment | Married | Unmarried |
| Less than High School | 0 (0.0%) | 0 (0.0%) |
| High School Diploma | 0 (0.0%) | 0 (0.0%) |
| College or Associate's Degree | 8 (100.0%) | 0 (0.0%) |
| Bachelor's Degree | 9 (100.0%) | 0 (0.0%) |
| Graduate Degree | 6 (100.0%) | 0 (0.0%) |
| Total | 23 (100.0%) | 0 (0.0%) |
Employment Characteristics in Urbana
Employment by Class of Employer in Urbana
Among the 860 employed individuals in Urbana, private company employees (616 | 71.6%), not-for-profit organizations (74 | 8.6%), and local government employees (70 | 8.1%) make up the most common classes of employment.
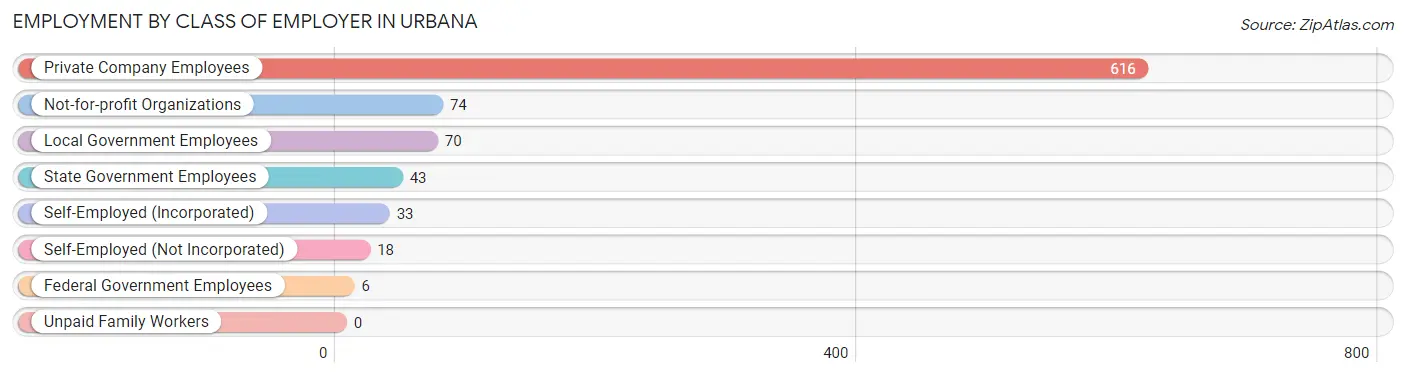
| Employer Class | # Employees | % Employees |
| Private Company Employees | 616 | 71.6% |
| Self-Employed (Incorporated) | 33 | 3.8% |
| Self-Employed (Not Incorporated) | 18 | 2.1% |
| Not-for-profit Organizations | 74 | 8.6% |
| Local Government Employees | 70 | 8.1% |
| State Government Employees | 43 | 5.0% |
| Federal Government Employees | 6 | 0.7% |
| Unpaid Family Workers | 0 | 0.0% |
| Total | 860 | 100.0% |
Employment Status by Age in Urbana
According to the labor force statistics for Urbana, out of the total population over 16 years of age (1,136), 78.0% or 886 individuals are in the labor force, with 2.4% or 21 of them unemployed. The age group with the highest labor force participation rate is 30 to 34 years, with 100.0% or 128 individuals in the labor force. Within the labor force, the 16 to 19 years age range has the highest percentage of unemployed individuals, with 5.2% or 3 of them being unemployed.
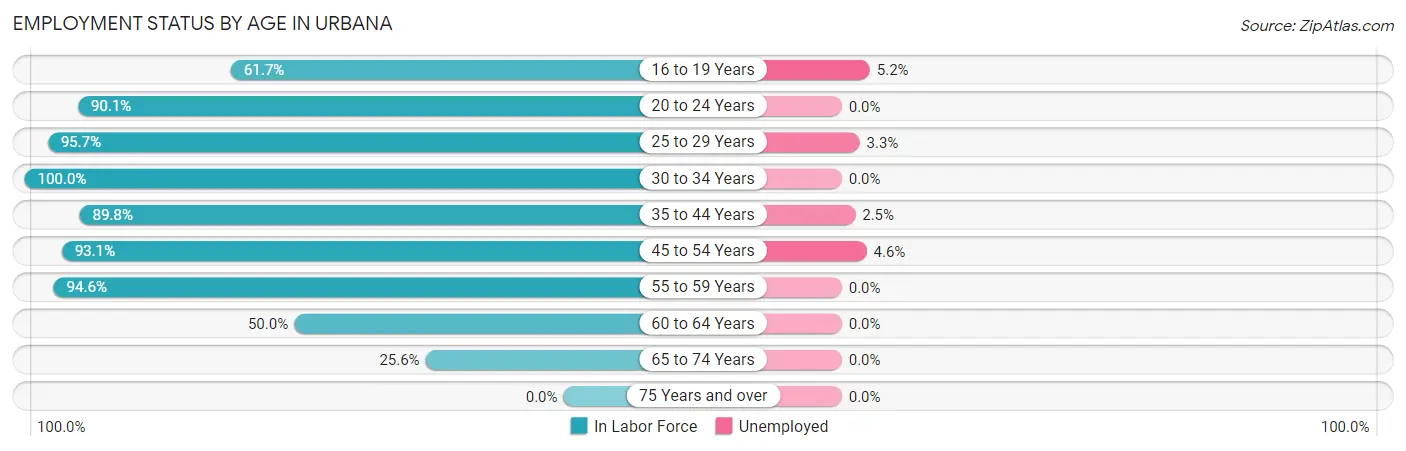
| Age Bracket | In Labor Force | Unemployed |
| 16 to 19 Years | 58 (61.7%) | 3 (5.2%) |
| 20 to 24 Years | 91 (90.1%) | 0 (0.0%) |
| 25 to 29 Years | 90 (95.7%) | 3 (3.3%) |
| 30 to 34 Years | 128 (100.0%) | 0 (0.0%) |
| 35 to 44 Years | 202 (89.8%) | 5 (2.5%) |
| 45 to 54 Years | 217 (93.1%) | 10 (4.6%) |
| 55 to 59 Years | 53 (94.6%) | 0 (0.0%) |
| 60 to 64 Years | 25 (50.0%) | 0 (0.0%) |
| 65 to 74 Years | 22 (25.6%) | 0 (0.0%) |
| 75 Years and over | 0 (0.0%) | 0 (0.0%) |
| Total | 886 (78.0%) | 21 (2.4%) |
Employment Status by Educational Attainment in Urbana
According to labor force statistics for Urbana, 91.0% of individuals (715) out of the total population between 25 and 64 years of age (786) are in the labor force, with 2.5% or 18 of them being unemployed. The group with the highest labor force participation rate are those with the educational attainment of bachelor's degree or higher, with 96.2% or 228 individuals in the labor force. Within the labor force, individuals with less than high school education have the highest percentage of unemployment, with 55.6% or 5 of them being unemployed.
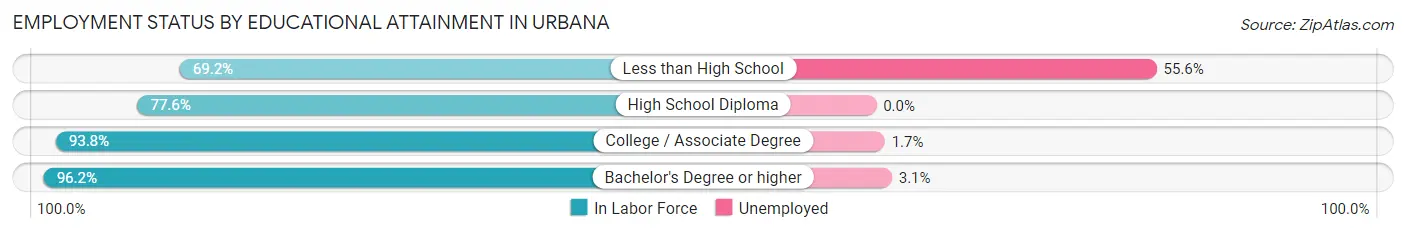
| Educational Attainment | In Labor Force | Unemployed |
| Less than High School | 9 (69.2%) | 7 (55.6%) |
| High School Diploma | 118 (77.6%) | 0 (0.0%) |
| College / Associate Degree | 360 (93.8%) | 7 (1.7%) |
| Bachelor's Degree or higher | 228 (96.2%) | 7 (3.1%) |
| Total | 715 (91.0%) | 20 (2.5%) |
Employment Occupations by Sex in Urbana
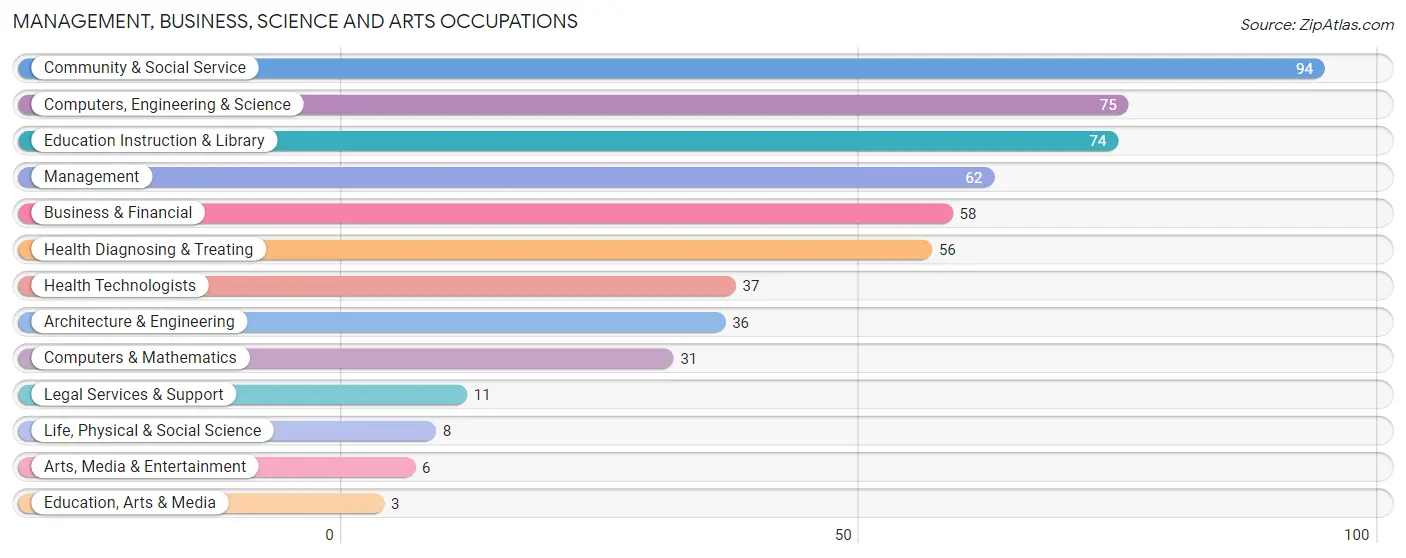
Management, Business, Science and Arts Occupations
The most common Management, Business, Science and Arts occupations in Urbana are Community & Social Service (94 | 10.9%), Computers, Engineering & Science (75 | 8.7%), Education Instruction & Library (74 | 8.6%), Management (62 | 7.2%), and Business & Financial (58 | 6.7%).
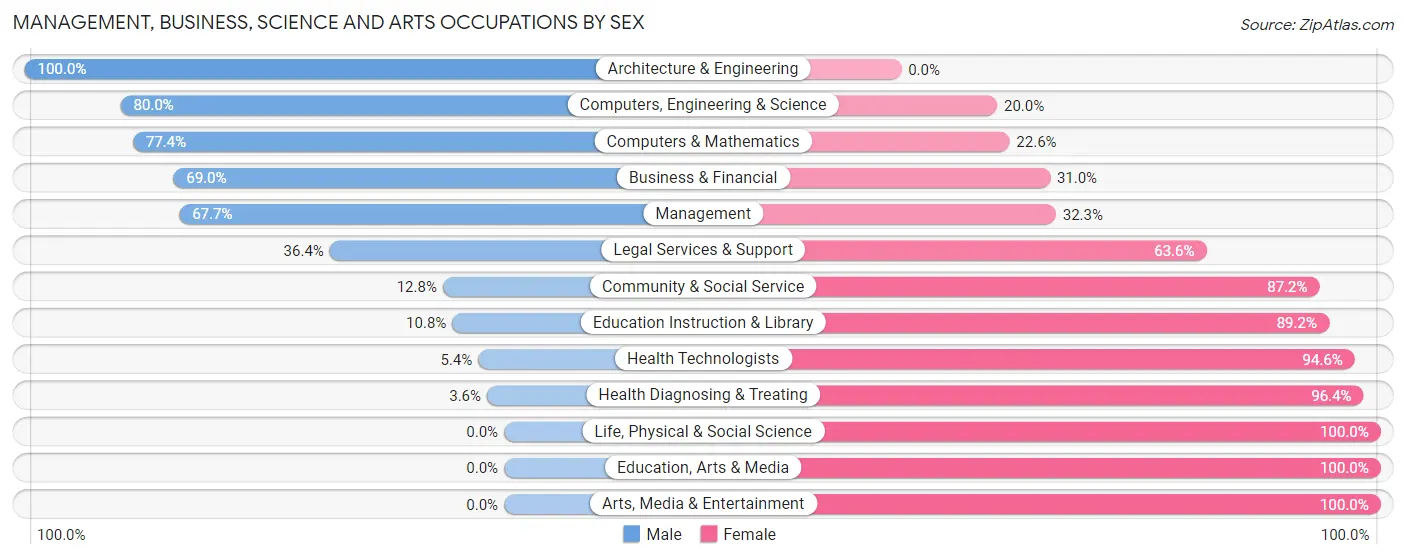
Management, Business, Science and Arts Occupations by Sex
Within the Management, Business, Science and Arts occupations in Urbana, the most male-oriented occupations are Architecture & Engineering (100.0%), Computers, Engineering & Science (80.0%), and Computers & Mathematics (77.4%), while the most female-oriented occupations are Life, Physical & Social Science (100.0%), Education, Arts & Media (100.0%), and Arts, Media & Entertainment (100.0%).
| Occupation | Male | Female |
| Management | 42 (67.7%) | 20 (32.3%) |
| Business & Financial | 40 (69.0%) | 18 (31.0%) |
| Computers, Engineering & Science | 60 (80.0%) | 15 (20.0%) |
| Computers & Mathematics | 24 (77.4%) | 7 (22.6%) |
| Architecture & Engineering | 36 (100.0%) | 0 (0.0%) |
| Life, Physical & Social Science | 0 (0.0%) | 8 (100.0%) |
| Community & Social Service | 12 (12.8%) | 82 (87.2%) |
| Education, Arts & Media | 0 (0.0%) | 3 (100.0%) |
| Legal Services & Support | 4 (36.4%) | 7 (63.6%) |
| Education Instruction & Library | 8 (10.8%) | 66 (89.2%) |
| Arts, Media & Entertainment | 0 (0.0%) | 6 (100.0%) |
| Health Diagnosing & Treating | 2 (3.6%) | 54 (96.4%) |
| Health Technologists | 2 (5.4%) | 35 (94.6%) |
| Total (Category) | 156 (45.2%) | 189 (54.8%) |
| Total (Overall) | 435 (50.3%) | 430 (49.7%) |
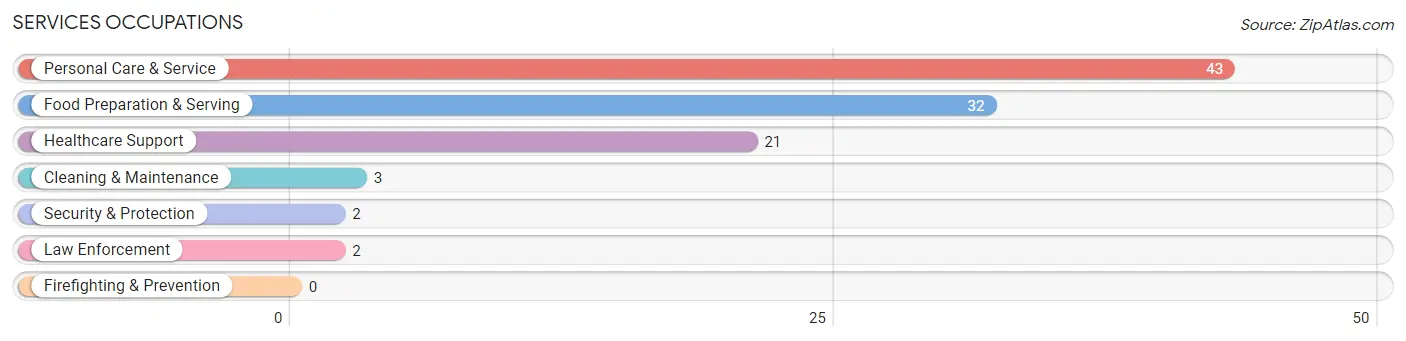
Services Occupations
The most common Services occupations in Urbana are Personal Care & Service (43 | 5.0%), Food Preparation & Serving (32 | 3.7%), Healthcare Support (21 | 2.4%), Cleaning & Maintenance (3 | 0.4%), and Security & Protection (2 | 0.2%).
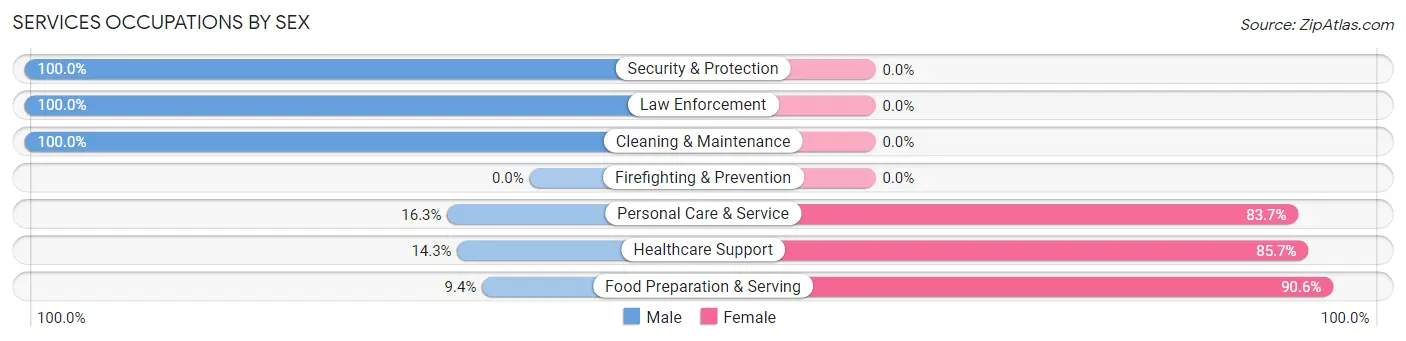
Services Occupations by Sex
Within the Services occupations in Urbana, the most male-oriented occupations are Security & Protection (100.0%), Law Enforcement (100.0%), and Cleaning & Maintenance (100.0%), while the most female-oriented occupations are Food Preparation & Serving (90.6%), Healthcare Support (85.7%), and Personal Care & Service (83.7%).
| Occupation | Male | Female |
| Healthcare Support | 3 (14.3%) | 18 (85.7%) |
| Security & Protection | 2 (100.0%) | 0 (0.0%) |
| Firefighting & Prevention | 0 (0.0%) | 0 (0.0%) |
| Law Enforcement | 2 (100.0%) | 0 (0.0%) |
| Food Preparation & Serving | 3 (9.4%) | 29 (90.6%) |
| Cleaning & Maintenance | 3 (100.0%) | 0 (0.0%) |
| Personal Care & Service | 7 (16.3%) | 36 (83.7%) |
| Total (Category) | 18 (17.8%) | 83 (82.2%) |
| Total (Overall) | 435 (50.3%) | 430 (49.7%) |
Sales and Office Occupations
The most common Sales and Office occupations in Urbana are Office & Administration (155 | 17.9%), and Sales & Related (27 | 3.1%).
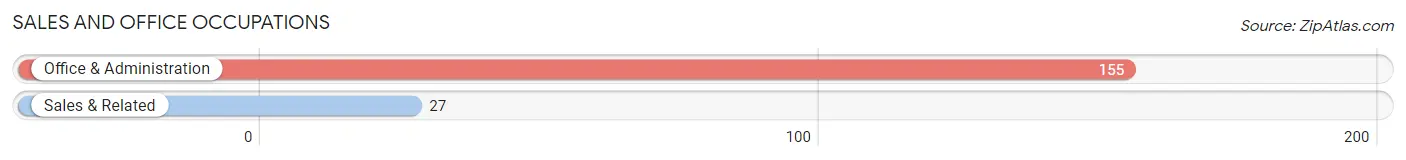
Sales and Office Occupations by Sex

| Occupation | Male | Female |
| Sales & Related | 9 (33.3%) | 18 (66.7%) |
| Office & Administration | 25 (16.1%) | 130 (83.9%) |
| Total (Category) | 34 (18.7%) | 148 (81.3%) |
| Total (Overall) | 435 (50.3%) | 430 (49.7%) |
Natural Resources, Construction and Maintenance Occupations
The most common Natural Resources, Construction and Maintenance occupations in Urbana are Construction & Extraction (79 | 9.1%), and Installation, Maintenance & Repair (35 | 4.1%).
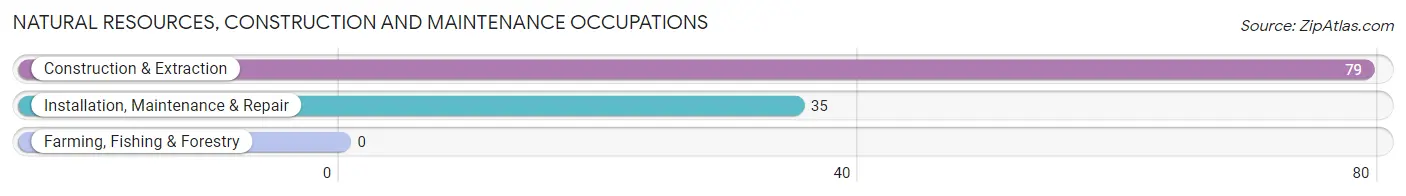
Natural Resources, Construction and Maintenance Occupations by Sex
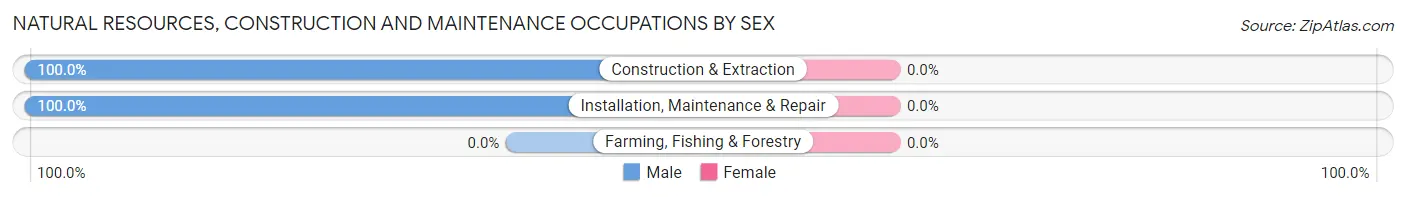
| Occupation | Male | Female |
| Farming, Fishing & Forestry | 0 (0.0%) | 0 (0.0%) |
| Construction & Extraction | 79 (100.0%) | 0 (0.0%) |
| Installation, Maintenance & Repair | 35 (100.0%) | 0 (0.0%) |
| Total (Category) | 114 (100.0%) | 0 (0.0%) |
| Total (Overall) | 435 (50.3%) | 430 (49.7%) |
Production, Transportation and Moving Occupations
The most common Production, Transportation and Moving occupations in Urbana are Production (91 | 10.5%), Transportation (29 | 3.4%), and Material Moving (3 | 0.4%).
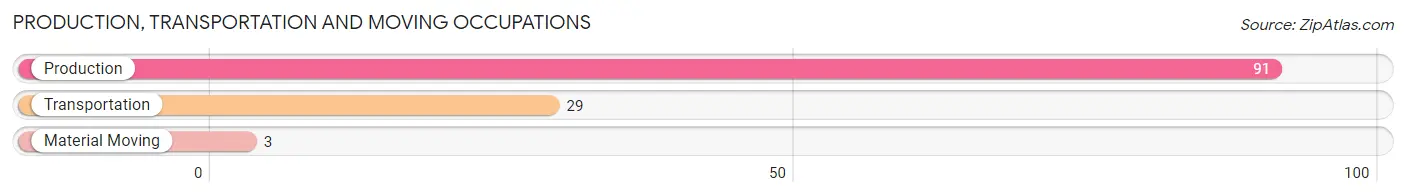
Production, Transportation and Moving Occupations by Sex
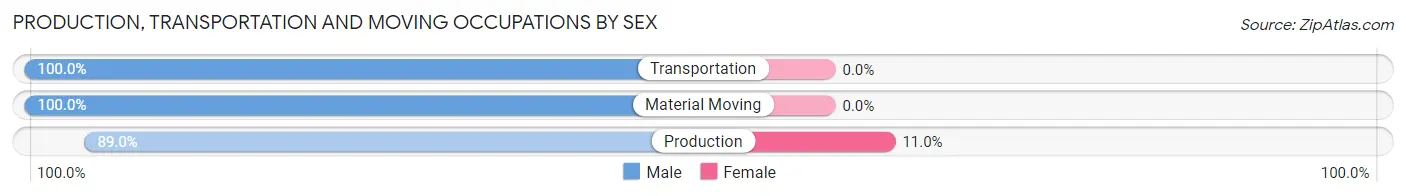
| Occupation | Male | Female |
| Production | 81 (89.0%) | 10 (11.0%) |
| Transportation | 29 (100.0%) | 0 (0.0%) |
| Material Moving | 3 (100.0%) | 0 (0.0%) |
| Total (Category) | 113 (91.9%) | 10 (8.1%) |
| Total (Overall) | 435 (50.3%) | 430 (49.7%) |
Employment Industries by Sex in Urbana
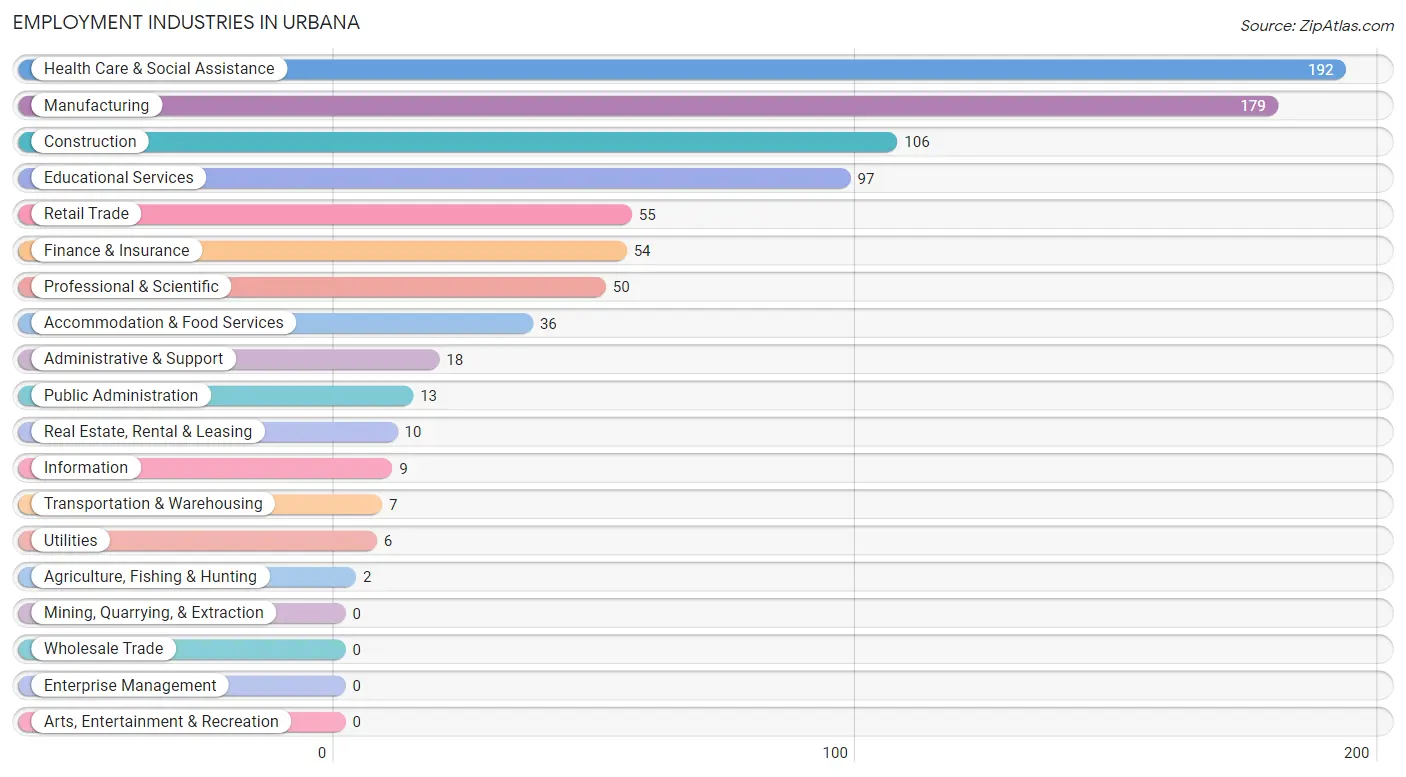
Employment Industries in Urbana
The major employment industries in Urbana include Health Care & Social Assistance (192 | 22.2%), Manufacturing (179 | 20.7%), Construction (106 | 12.2%), Educational Services (97 | 11.2%), and Retail Trade (55 | 6.4%).
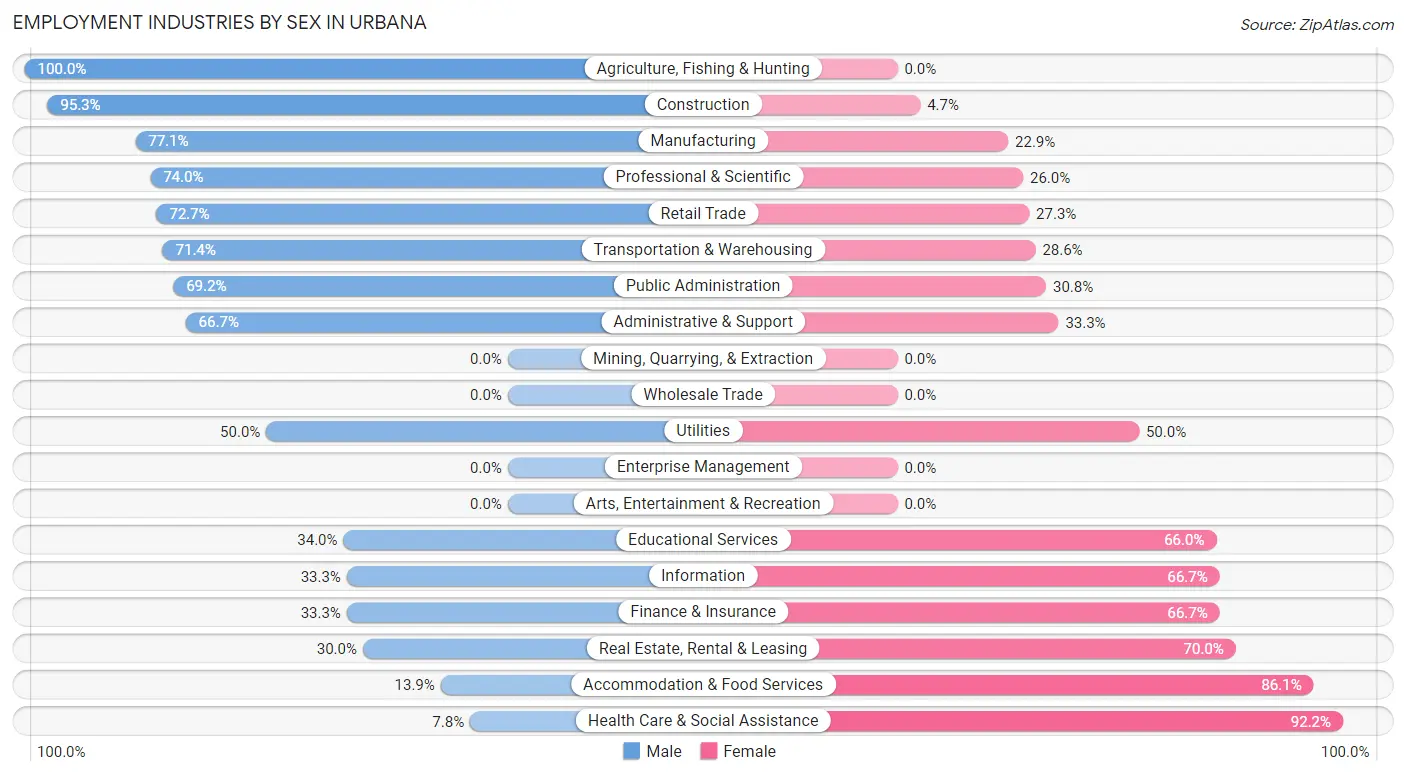
Employment Industries by Sex in Urbana
The Urbana industries that see more men than women are Agriculture, Fishing & Hunting (100.0%), Construction (95.3%), and Manufacturing (77.1%), whereas the industries that tend to have a higher number of women are Health Care & Social Assistance (92.2%), Accommodation & Food Services (86.1%), and Real Estate, Rental & Leasing (70.0%).
| Industry | Male | Female |
| Agriculture, Fishing & Hunting | 2 (100.0%) | 0 (0.0%) |
| Mining, Quarrying, & Extraction | 0 (0.0%) | 0 (0.0%) |
| Construction | 101 (95.3%) | 5 (4.7%) |
| Manufacturing | 138 (77.1%) | 41 (22.9%) |
| Wholesale Trade | 0 (0.0%) | 0 (0.0%) |
| Retail Trade | 40 (72.7%) | 15 (27.3%) |
| Transportation & Warehousing | 5 (71.4%) | 2 (28.6%) |
| Utilities | 3 (50.0%) | 3 (50.0%) |
| Information | 3 (33.3%) | 6 (66.7%) |
| Finance & Insurance | 18 (33.3%) | 36 (66.7%) |
| Real Estate, Rental & Leasing | 3 (30.0%) | 7 (70.0%) |
| Professional & Scientific | 37 (74.0%) | 13 (26.0%) |
| Enterprise Management | 0 (0.0%) | 0 (0.0%) |
| Administrative & Support | 12 (66.7%) | 6 (33.3%) |
| Educational Services | 33 (34.0%) | 64 (66.0%) |
| Health Care & Social Assistance | 15 (7.8%) | 177 (92.2%) |
| Arts, Entertainment & Recreation | 0 (0.0%) | 0 (0.0%) |
| Accommodation & Food Services | 5 (13.9%) | 31 (86.1%) |
| Public Administration | 9 (69.2%) | 4 (30.8%) |
| Total | 435 (50.3%) | 430 (49.7%) |
Education in Urbana
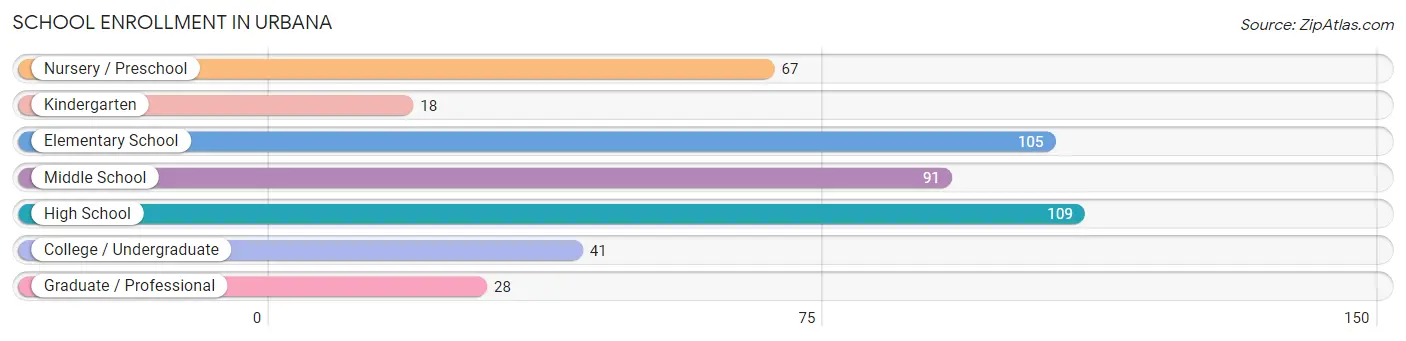
School Enrollment in Urbana
The most common levels of schooling among the 459 students in Urbana are high school (109 | 23.7%), elementary school (105 | 22.9%), and middle school (91 | 19.8%).
| School Level | # Students | % Students |
| Nursery / Preschool | 67 | 14.6% |
| Kindergarten | 18 | 3.9% |
| Elementary School | 105 | 22.9% |
| Middle School | 91 | 19.8% |
| High School | 109 | 23.7% |
| College / Undergraduate | 41 | 8.9% |
| Graduate / Professional | 28 | 6.1% |
| Total | 459 | 100.0% |
School Enrollment by Age by Funding Source in Urbana
Out of a total of 459 students who are enrolled in schools in Urbana, 33 (7.2%) attend a private institution, while the remaining 426 (92.8%) are enrolled in public schools. The age group of 35 years and over has the highest likelihood of being enrolled in private schools, with 17 (85.0% in the age bracket) enrolled. Conversely, the age group of 3 to 4 year olds has the lowest likelihood of being enrolled in a private school, with 49 (100.0% in the age bracket) attending a public institution.
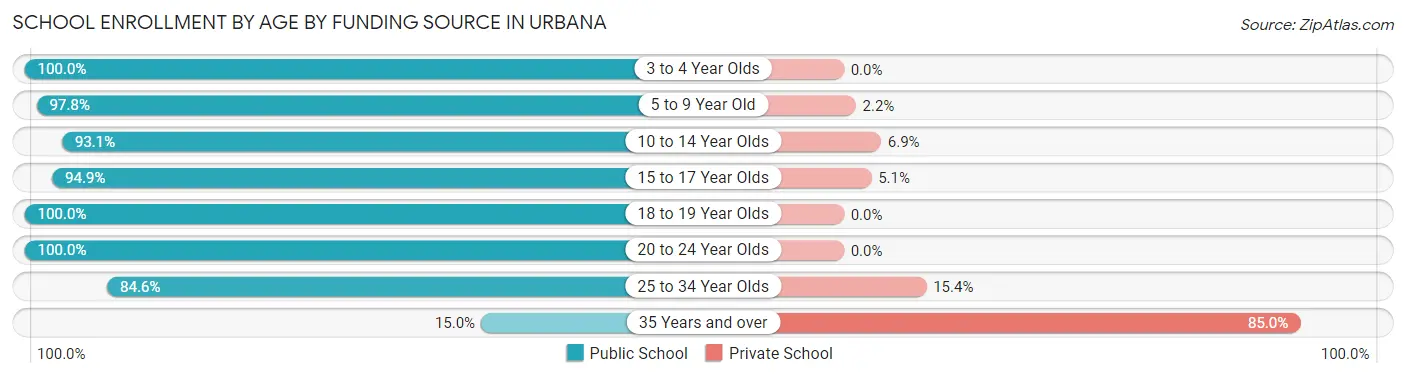
| Age Bracket | Public School | Private School |
| 3 to 4 Year Olds | 49 (100.0%) | 0 (0.0%) |
| 5 to 9 Year Old | 132 (97.8%) | 3 (2.2%) |
| 10 to 14 Year Olds | 94 (93.1%) | 7 (6.9%) |
| 15 to 17 Year Olds | 74 (94.9%) | 4 (5.1%) |
| 18 to 19 Year Olds | 39 (100.0%) | 0 (0.0%) |
| 20 to 24 Year Olds | 24 (100.0%) | 0 (0.0%) |
| 25 to 34 Year Olds | 11 (84.6%) | 2 (15.4%) |
| 35 Years and over | 3 (15.0%) | 17 (85.0%) |
| Total | 426 (92.8%) | 33 (7.2%) |
Educational Attainment by Field of Study in Urbana
Science & technology (74 | 27.3%), business (59 | 21.8%), education (47 | 17.3%), arts & humanities (16 | 5.9%), and computers & mathematics (14 | 5.2%) are the most common fields of study among 271 individuals in Urbana who have obtained a bachelor's degree or higher.
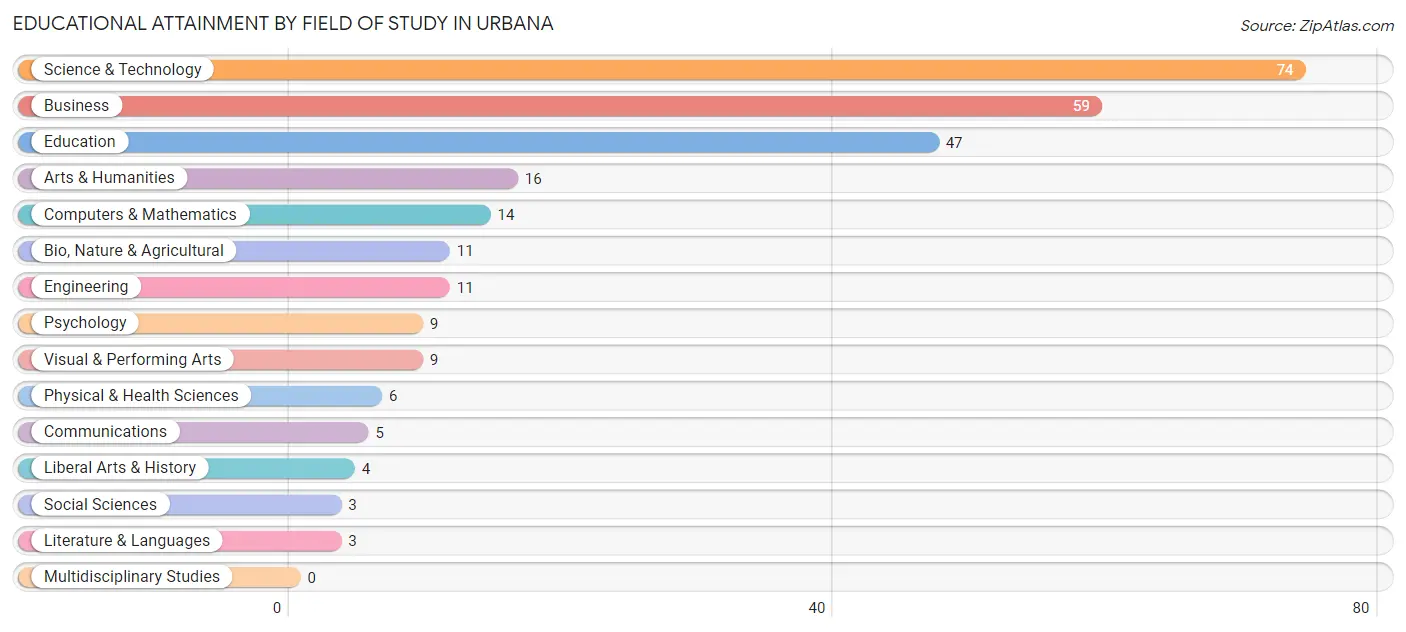
| Field of Study | # Graduates | % Graduates |
| Computers & Mathematics | 14 | 5.2% |
| Bio, Nature & Agricultural | 11 | 4.1% |
| Physical & Health Sciences | 6 | 2.2% |
| Psychology | 9 | 3.3% |
| Social Sciences | 3 | 1.1% |
| Engineering | 11 | 4.1% |
| Multidisciplinary Studies | 0 | 0.0% |
| Science & Technology | 74 | 27.3% |
| Business | 59 | 21.8% |
| Education | 47 | 17.3% |
| Literature & Languages | 3 | 1.1% |
| Liberal Arts & History | 4 | 1.5% |
| Visual & Performing Arts | 9 | 3.3% |
| Communications | 5 | 1.8% |
| Arts & Humanities | 16 | 5.9% |
| Total | 271 | 100.0% |
Transportation & Commute in Urbana
Vehicle Availability by Sex in Urbana
The most prevalent vehicle ownership categories in Urbana are males with 3 vehicles (188, accounting for 43.2%) and females with 3 vehicles (153, making up 44.2%).
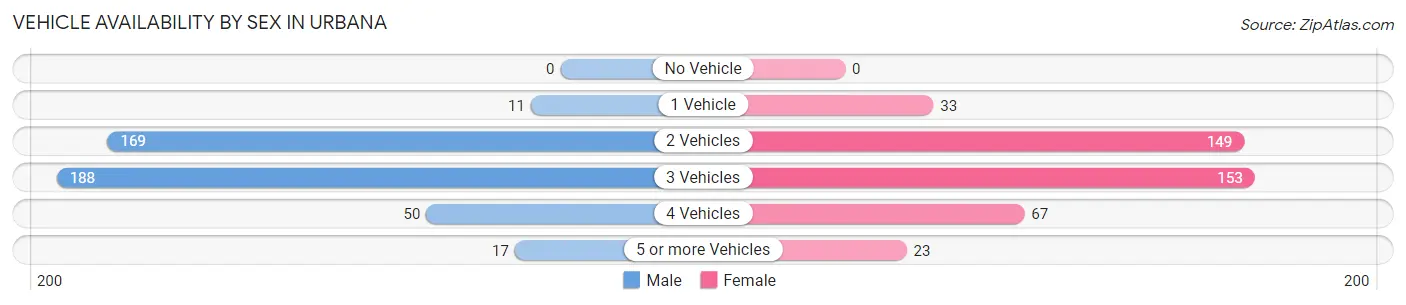
| Vehicles Available | Male | Female |
| No Vehicle | 0 (0.0%) | 0 (0.0%) |
| 1 Vehicle | 11 (2.5%) | 33 (7.8%) |
| 2 Vehicles | 169 (38.9%) | 149 (35.1%) |
| 3 Vehicles | 188 (43.2%) | 153 (36.0%) |
| 4 Vehicles | 50 (11.5%) | 67 (15.8%) |
| 5 or more Vehicles | 17 (3.9%) | 23 (5.4%) |
| Total | 435 (100.0%) | 425 (100.0%) |
Commute Time in Urbana
The most frequently occuring commute durations in Urbana are 30 to 34 minutes (223 commuters, 28.7%), 20 to 24 minutes (127 commuters, 16.3%), and 25 to 29 minutes (100 commuters, 12.9%).
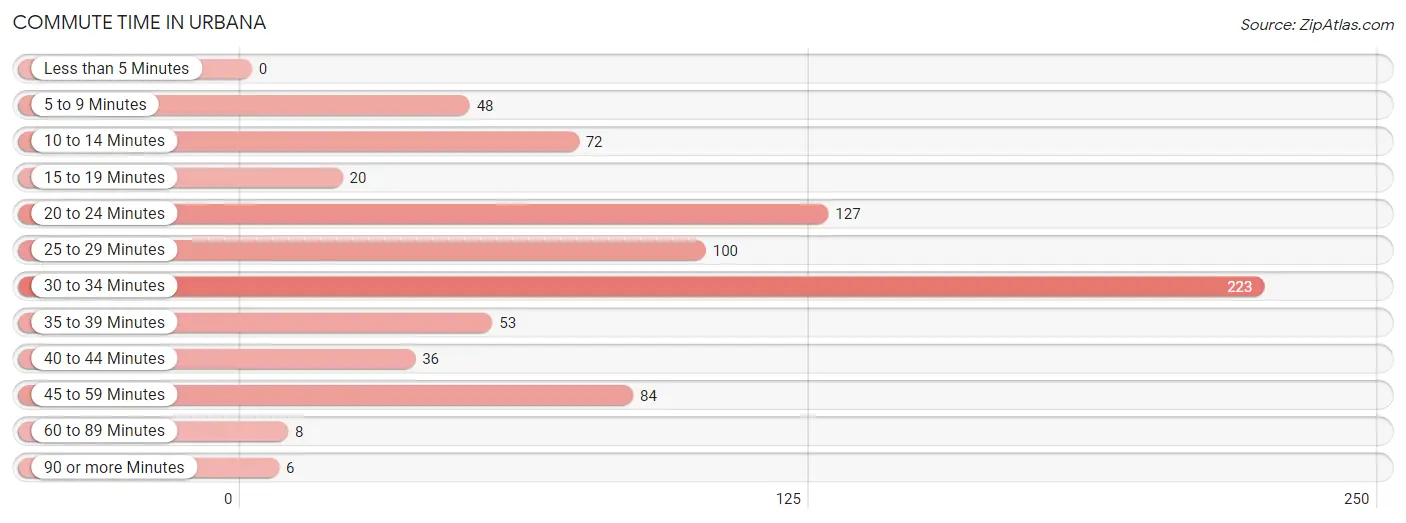
| Commute Time | # Commuters | % Commuters |
| Less than 5 Minutes | 0 | 0.0% |
| 5 to 9 Minutes | 48 | 6.2% |
| 10 to 14 Minutes | 72 | 9.3% |
| 15 to 19 Minutes | 20 | 2.6% |
| 20 to 24 Minutes | 127 | 16.3% |
| 25 to 29 Minutes | 100 | 12.9% |
| 30 to 34 Minutes | 223 | 28.7% |
| 35 to 39 Minutes | 53 | 6.8% |
| 40 to 44 Minutes | 36 | 4.6% |
| 45 to 59 Minutes | 84 | 10.8% |
| 60 to 89 Minutes | 8 | 1.0% |
| 90 or more Minutes | 6 | 0.8% |
Commute Time by Sex in Urbana
The most common commute times in Urbana are 30 to 34 minutes (134 commuters, 33.2%) for males and 30 to 34 minutes (89 commuters, 23.9%) for females.
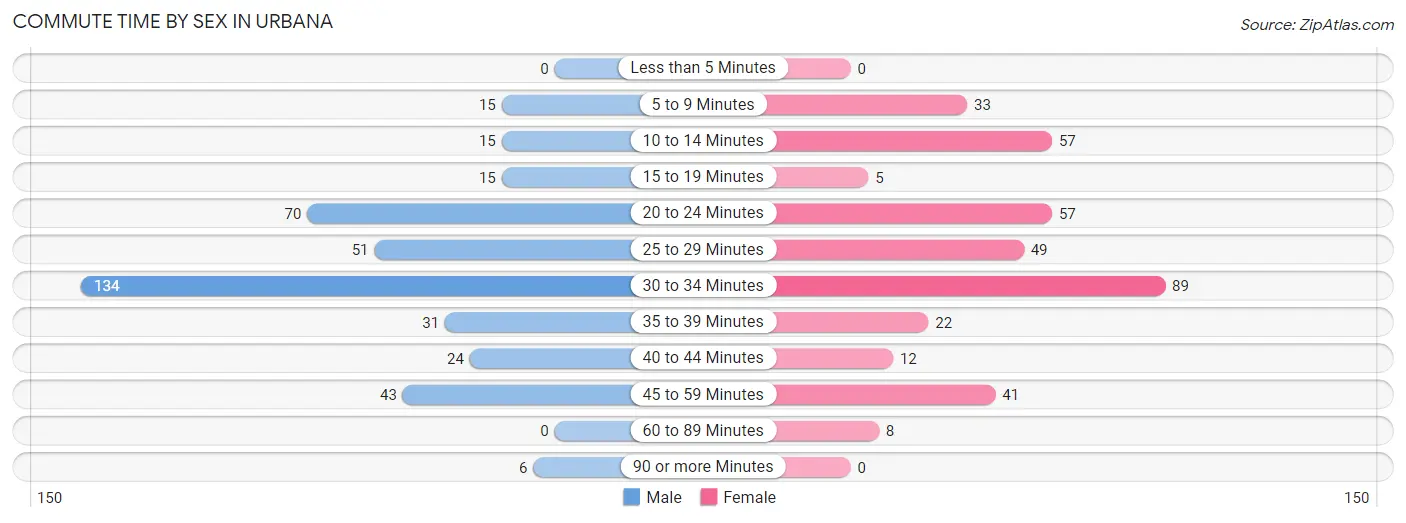
| Commute Time | Male | Female |
| Less than 5 Minutes | 0 (0.0%) | 0 (0.0%) |
| 5 to 9 Minutes | 15 (3.7%) | 33 (8.8%) |
| 10 to 14 Minutes | 15 (3.7%) | 57 (15.3%) |
| 15 to 19 Minutes | 15 (3.7%) | 5 (1.3%) |
| 20 to 24 Minutes | 70 (17.3%) | 57 (15.3%) |
| 25 to 29 Minutes | 51 (12.6%) | 49 (13.1%) |
| 30 to 34 Minutes | 134 (33.2%) | 89 (23.9%) |
| 35 to 39 Minutes | 31 (7.7%) | 22 (5.9%) |
| 40 to 44 Minutes | 24 (5.9%) | 12 (3.2%) |
| 45 to 59 Minutes | 43 (10.6%) | 41 (11.0%) |
| 60 to 89 Minutes | 0 (0.0%) | 8 (2.1%) |
| 90 or more Minutes | 6 (1.5%) | 0 (0.0%) |
Time of Departure to Work by Sex in Urbana
The most frequent times of departure to work in Urbana are 6:00 AM to 6:29 AM (90, 22.3%) for males and 7:00 AM to 7:29 AM (107, 28.7%) for females.
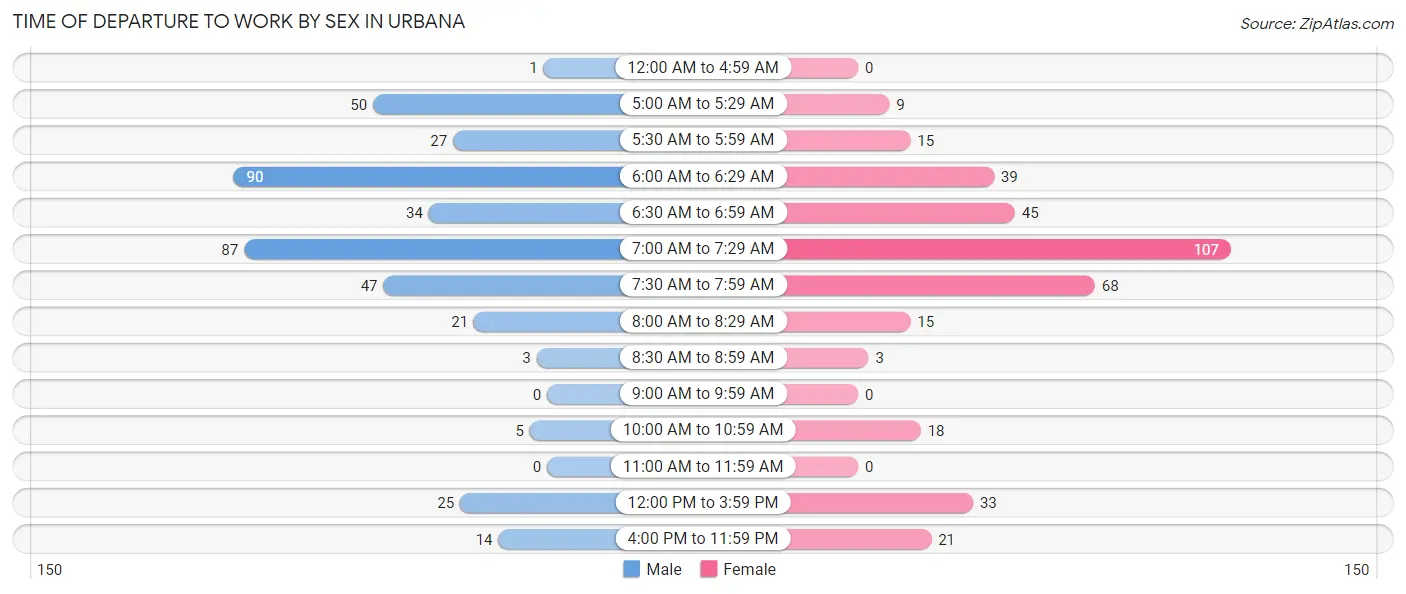
| Time of Departure | Male | Female |
| 12:00 AM to 4:59 AM | 1 (0.3%) | 0 (0.0%) |
| 5:00 AM to 5:29 AM | 50 (12.4%) | 9 (2.4%) |
| 5:30 AM to 5:59 AM | 27 (6.7%) | 15 (4.0%) |
| 6:00 AM to 6:29 AM | 90 (22.3%) | 39 (10.5%) |
| 6:30 AM to 6:59 AM | 34 (8.4%) | 45 (12.1%) |
| 7:00 AM to 7:29 AM | 87 (21.5%) | 107 (28.7%) |
| 7:30 AM to 7:59 AM | 47 (11.6%) | 68 (18.2%) |
| 8:00 AM to 8:29 AM | 21 (5.2%) | 15 (4.0%) |
| 8:30 AM to 8:59 AM | 3 (0.7%) | 3 (0.8%) |
| 9:00 AM to 9:59 AM | 0 (0.0%) | 0 (0.0%) |
| 10:00 AM to 10:59 AM | 5 (1.2%) | 18 (4.8%) |
| 11:00 AM to 11:59 AM | 0 (0.0%) | 0 (0.0%) |
| 12:00 PM to 3:59 PM | 25 (6.2%) | 33 (8.8%) |
| 4:00 PM to 11:59 PM | 14 (3.5%) | 21 (5.6%) |
| Total | 404 (100.0%) | 373 (100.0%) |
Housing Occupancy in Urbana
Occupancy by Ownership in Urbana
Of the total 521 dwellings in Urbana, owner-occupied units account for 460 (88.3%), while renter-occupied units make up 61 (11.7%).
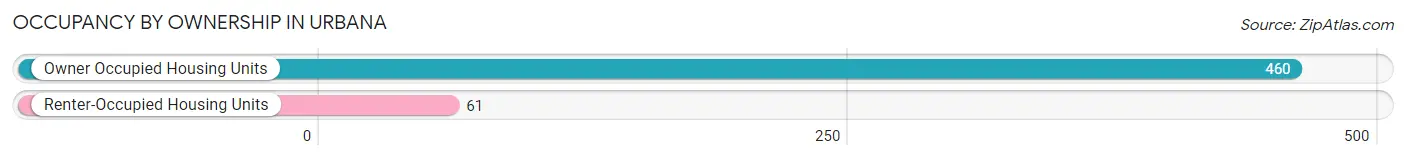
| Occupancy | # Housing Units | % Housing Units |
| Owner Occupied Housing Units | 460 | 88.3% |
| Renter-Occupied Housing Units | 61 | 11.7% |
| Total Occupied Housing Units | 521 | 100.0% |
Occupancy by Household Size in Urbana
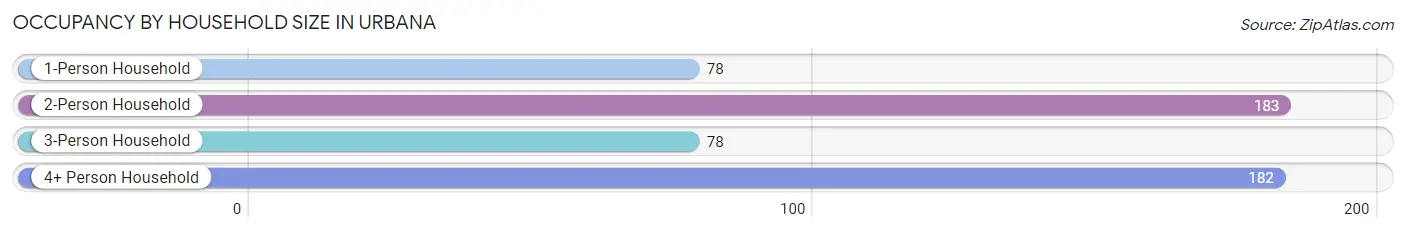
| Household Size | # Housing Units | % Housing Units |
| 1-Person Household | 78 | 15.0% |
| 2-Person Household | 183 | 35.1% |
| 3-Person Household | 78 | 15.0% |
| 4+ Person Household | 182 | 34.9% |
| Total Housing Units | 521 | 100.0% |
Occupancy by Ownership by Household Size in Urbana
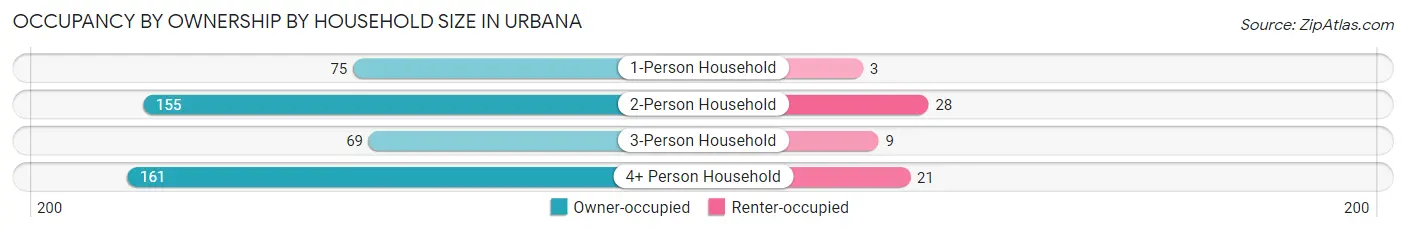
| Household Size | Owner-occupied | Renter-occupied |
| 1-Person Household | 75 (96.2%) | 3 (3.8%) |
| 2-Person Household | 155 (84.7%) | 28 (15.3%) |
| 3-Person Household | 69 (88.5%) | 9 (11.5%) |
| 4+ Person Household | 161 (88.5%) | 21 (11.5%) |
| Total Housing Units | 460 (88.3%) | 61 (11.7%) |
Occupancy by Educational Attainment in Urbana
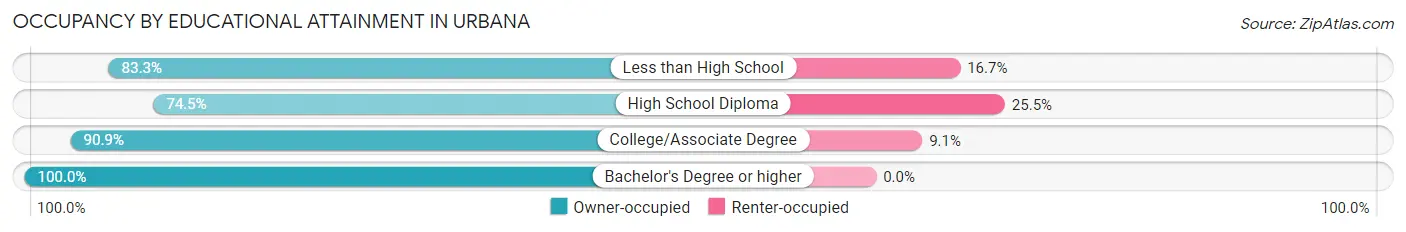
| Household Size | Owner-occupied | Renter-occupied |
| Less than High School | 15 (83.3%) | 3 (16.7%) |
| High School Diploma | 108 (74.5%) | 37 (25.5%) |
| College/Associate Degree | 209 (90.9%) | 21 (9.1%) |
| Bachelor's Degree or higher | 128 (100.0%) | 0 (0.0%) |
Occupancy by Age of Householder in Urbana
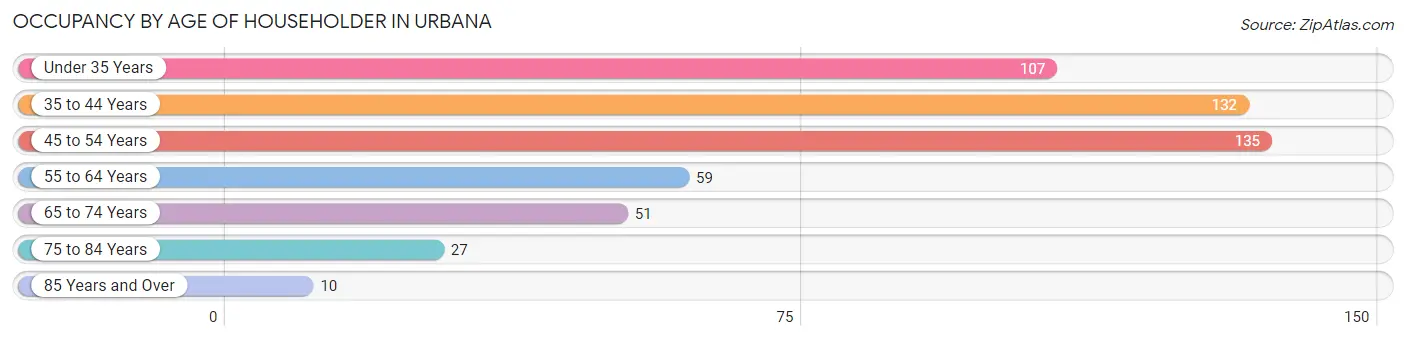
| Age Bracket | # Households | % Households |
| Under 35 Years | 107 | 20.5% |
| 35 to 44 Years | 132 | 25.3% |
| 45 to 54 Years | 135 | 25.9% |
| 55 to 64 Years | 59 | 11.3% |
| 65 to 74 Years | 51 | 9.8% |
| 75 to 84 Years | 27 | 5.2% |
| 85 Years and Over | 10 | 1.9% |
| Total | 521 | 100.0% |
Housing Finances in Urbana
Median Income by Occupancy in Urbana
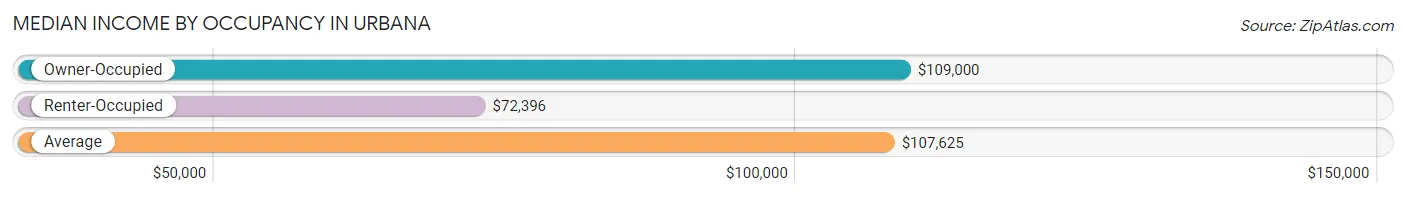
| Occupancy Type | # Households | Median Income |
| Owner-Occupied | 460 (88.3%) | $109,000 |
| Renter-Occupied | 61 (11.7%) | $72,396 |
| Average | 521 (100.0%) | $107,625 |
Occupancy by Householder Income Bracket in Urbana
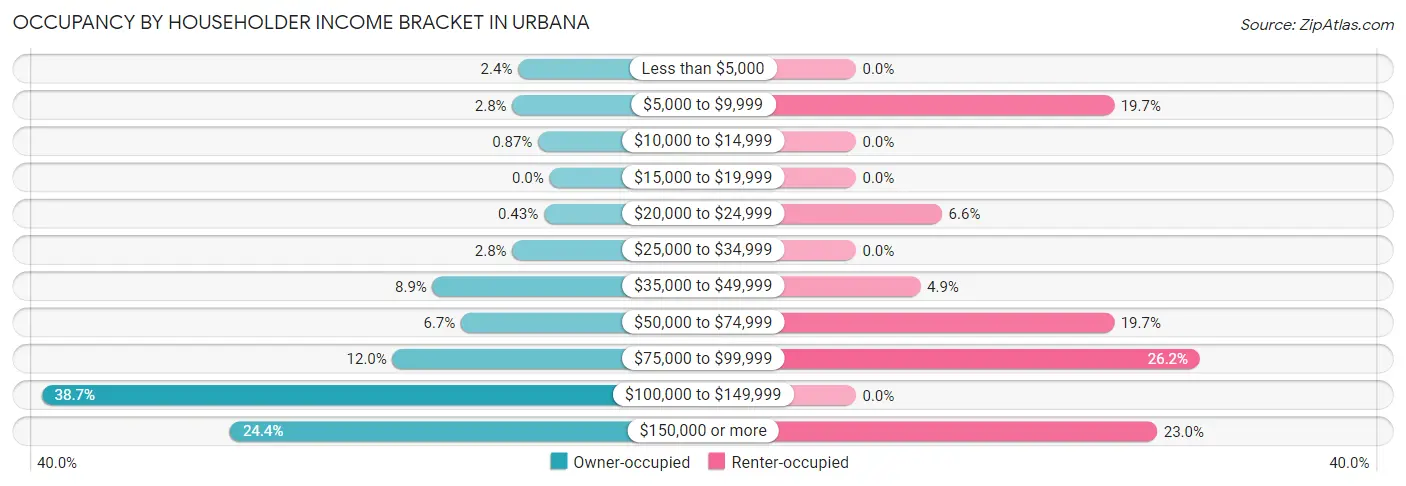
| Income Bracket | Owner-occupied | Renter-occupied |
| Less than $5,000 | 11 (2.4%) | 0 (0.0%) |
| $5,000 to $9,999 | 13 (2.8%) | 12 (19.7%) |
| $10,000 to $14,999 | 4 (0.9%) | 0 (0.0%) |
| $15,000 to $19,999 | 0 (0.0%) | 0 (0.0%) |
| $20,000 to $24,999 | 2 (0.4%) | 4 (6.6%) |
| $25,000 to $34,999 | 13 (2.8%) | 0 (0.0%) |
| $35,000 to $49,999 | 41 (8.9%) | 3 (4.9%) |
| $50,000 to $74,999 | 31 (6.7%) | 12 (19.7%) |
| $75,000 to $99,999 | 55 (12.0%) | 16 (26.2%) |
| $100,000 to $149,999 | 178 (38.7%) | 0 (0.0%) |
| $150,000 or more | 112 (24.3%) | 14 (23.0%) |
| Total | 460 (100.0%) | 61 (100.0%) |
Monthly Housing Cost Tiers in Urbana
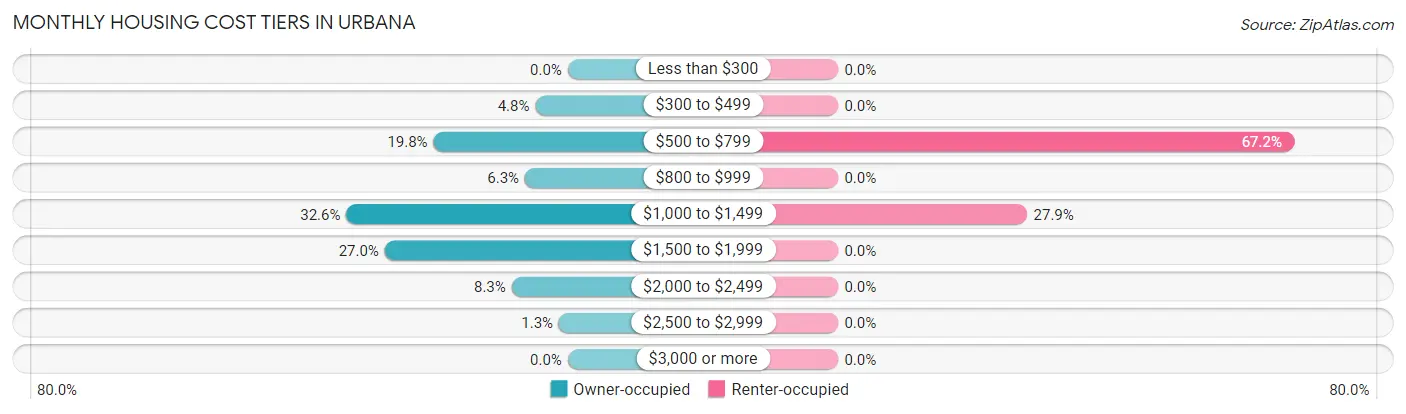
| Monthly Cost | Owner-occupied | Renter-occupied |
| Less than $300 | 0 (0.0%) | 0 (0.0%) |
| $300 to $499 | 22 (4.8%) | 0 (0.0%) |
| $500 to $799 | 91 (19.8%) | 41 (67.2%) |
| $800 to $999 | 29 (6.3%) | 0 (0.0%) |
| $1,000 to $1,499 | 150 (32.6%) | 17 (27.9%) |
| $1,500 to $1,999 | 124 (27.0%) | 0 (0.0%) |
| $2,000 to $2,499 | 38 (8.3%) | 0 (0.0%) |
| $2,500 to $2,999 | 6 (1.3%) | 0 (0.0%) |
| $3,000 or more | 0 (0.0%) | 0 (0.0%) |
| Total | 460 (100.0%) | 61 (100.0%) |
Physical Housing Characteristics in Urbana
Housing Structures in Urbana
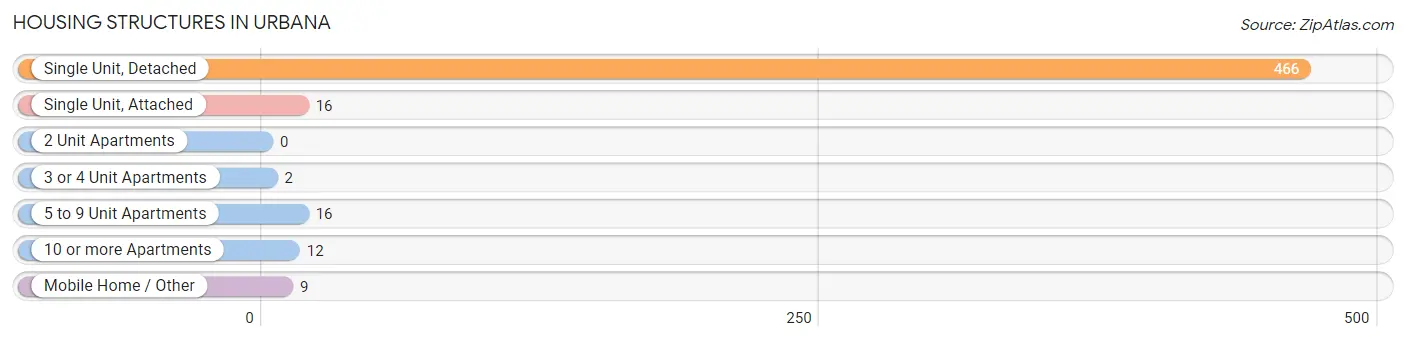
| Structure Type | # Housing Units | % Housing Units |
| Single Unit, Detached | 466 | 89.4% |
| Single Unit, Attached | 16 | 3.1% |
| 2 Unit Apartments | 0 | 0.0% |
| 3 or 4 Unit Apartments | 2 | 0.4% |
| 5 to 9 Unit Apartments | 16 | 3.1% |
| 10 or more Apartments | 12 | 2.3% |
| Mobile Home / Other | 9 | 1.7% |
| Total | 521 | 100.0% |
Housing Structures by Occupancy in Urbana
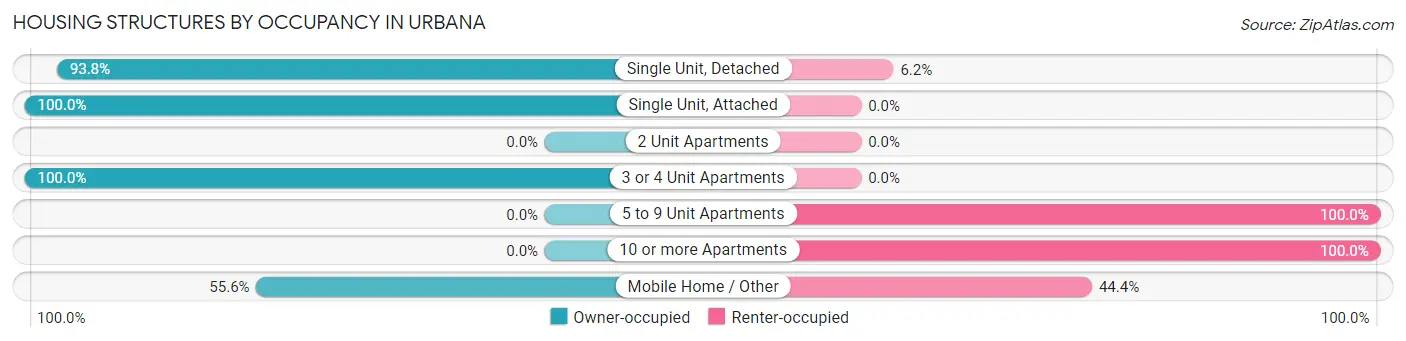
| Structure Type | Owner-occupied | Renter-occupied |
| Single Unit, Detached | 437 (93.8%) | 29 (6.2%) |
| Single Unit, Attached | 16 (100.0%) | 0 (0.0%) |
| 2 Unit Apartments | 0 (0.0%) | 0 (0.0%) |
| 3 or 4 Unit Apartments | 2 (100.0%) | 0 (0.0%) |
| 5 to 9 Unit Apartments | 0 (0.0%) | 16 (100.0%) |
| 10 or more Apartments | 0 (0.0%) | 12 (100.0%) |
| Mobile Home / Other | 5 (55.6%) | 4 (44.4%) |
| Total | 460 (88.3%) | 61 (11.7%) |
Housing Structures by Number of Rooms in Urbana
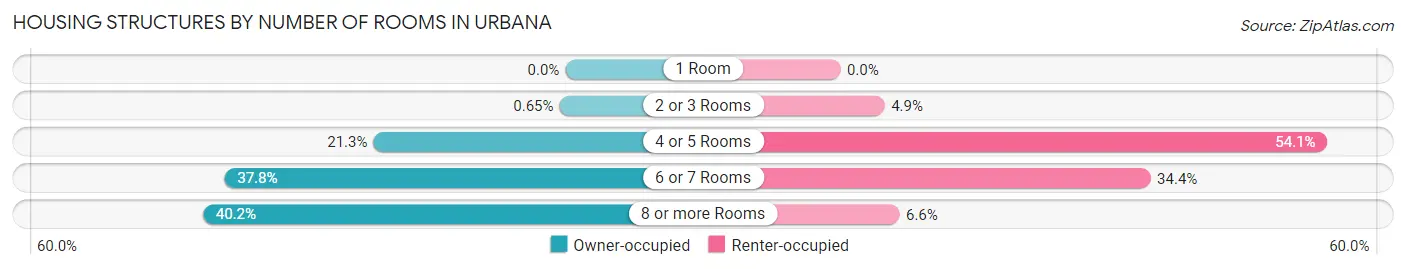
| Number of Rooms | Owner-occupied | Renter-occupied |
| 1 Room | 0 (0.0%) | 0 (0.0%) |
| 2 or 3 Rooms | 3 (0.6%) | 3 (4.9%) |
| 4 or 5 Rooms | 98 (21.3%) | 33 (54.1%) |
| 6 or 7 Rooms | 174 (37.8%) | 21 (34.4%) |
| 8 or more Rooms | 185 (40.2%) | 4 (6.6%) |
| Total | 460 (100.0%) | 61 (100.0%) |
Housing Structure by Heating Type in Urbana
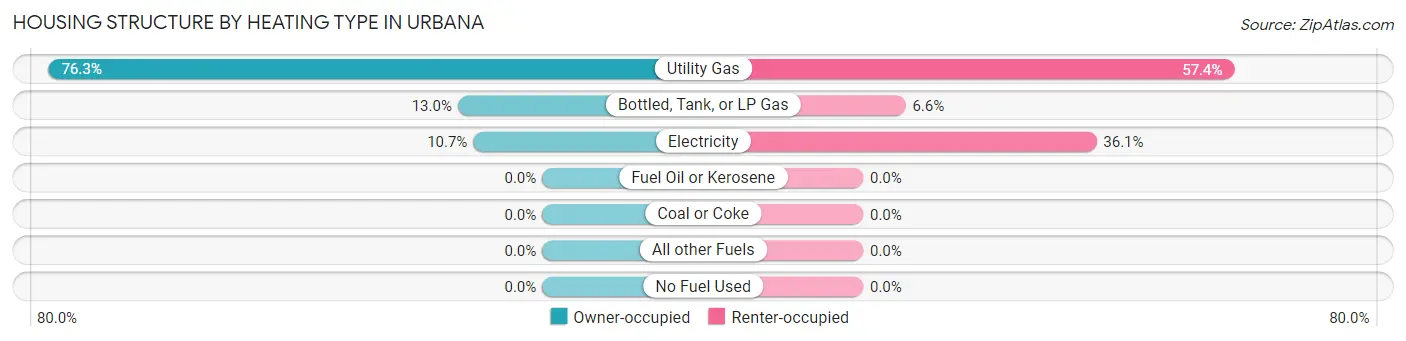
| Heating Type | Owner-occupied | Renter-occupied |
| Utility Gas | 351 (76.3%) | 35 (57.4%) |
| Bottled, Tank, or LP Gas | 60 (13.0%) | 4 (6.6%) |
| Electricity | 49 (10.6%) | 22 (36.1%) |
| Fuel Oil or Kerosene | 0 (0.0%) | 0 (0.0%) |
| Coal or Coke | 0 (0.0%) | 0 (0.0%) |
| All other Fuels | 0 (0.0%) | 0 (0.0%) |
| No Fuel Used | 0 (0.0%) | 0 (0.0%) |
| Total | 460 (100.0%) | 61 (100.0%) |
Household Vehicle Usage in Urbana
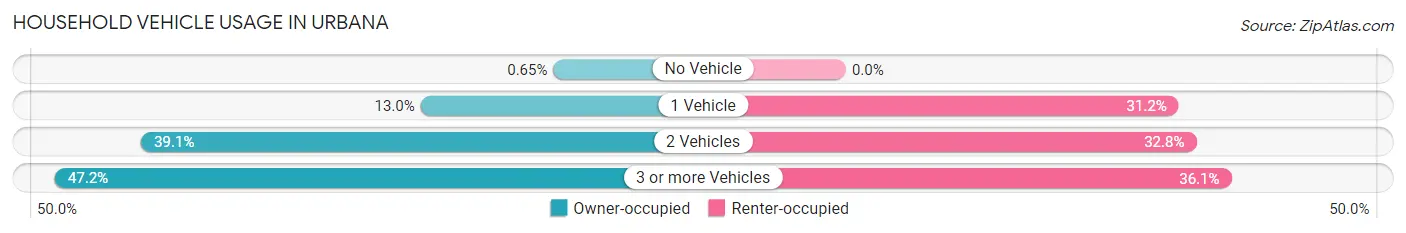
| Vehicles per Household | Owner-occupied | Renter-occupied |
| No Vehicle | 3 (0.6%) | 0 (0.0%) |
| 1 Vehicle | 60 (13.0%) | 19 (31.1%) |
| 2 Vehicles | 180 (39.1%) | 20 (32.8%) |
| 3 or more Vehicles | 217 (47.2%) | 22 (36.1%) |
| Total | 460 (100.0%) | 61 (100.0%) |
Real Estate & Mortgages in Urbana
Real Estate and Mortgage Overview in Urbana
| Characteristic | Without Mortgage | With Mortgage |
| Housing Units | 118 | 342 |
| Median Property Value | $195,800 | $203,500 |
| Median Household Income | $91,250 | $89 |
| Monthly Housing Costs | $693 | $0 |
| Real Estate Taxes | $3,553 | $14 |
Property Value by Mortgage Status in Urbana
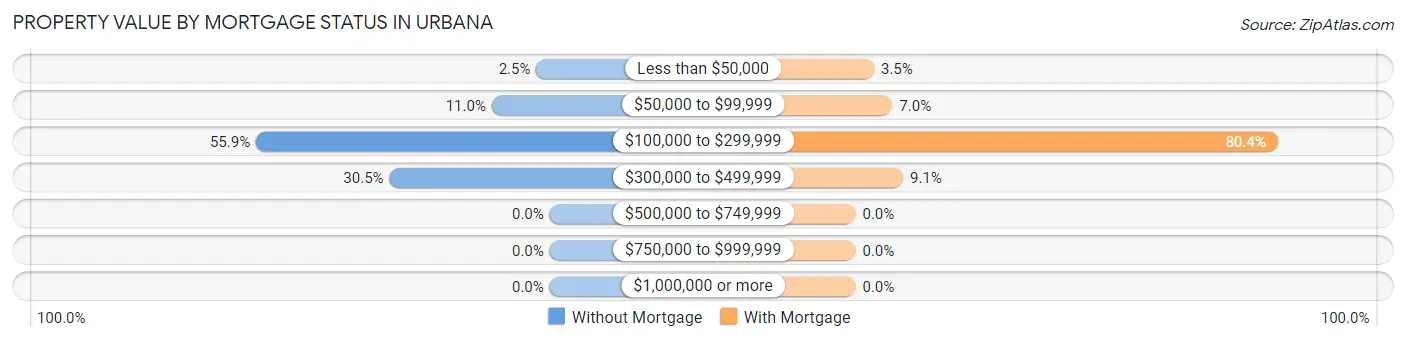
| Property Value | Without Mortgage | With Mortgage |
| Less than $50,000 | 3 (2.5%) | 12 (3.5%) |
| $50,000 to $99,999 | 13 (11.0%) | 24 (7.0%) |
| $100,000 to $299,999 | 66 (55.9%) | 275 (80.4%) |
| $300,000 to $499,999 | 36 (30.5%) | 31 (9.1%) |
| $500,000 to $749,999 | 0 (0.0%) | 0 (0.0%) |
| $750,000 to $999,999 | 0 (0.0%) | 0 (0.0%) |
| $1,000,000 or more | 0 (0.0%) | 0 (0.0%) |
| Total | 118 (100.0%) | 342 (100.0%) |
Household Income by Mortgage Status in Urbana
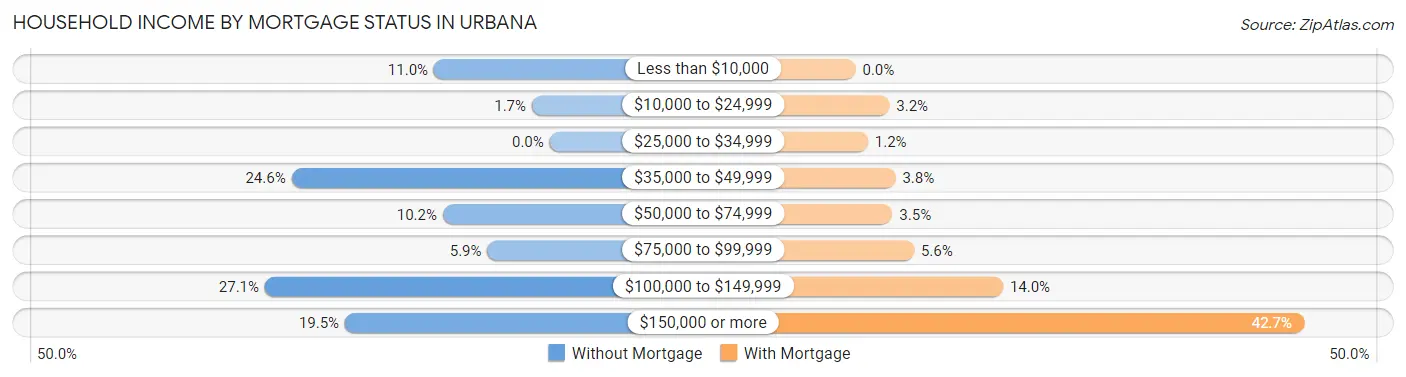
| Household Income | Without Mortgage | With Mortgage |
| Less than $10,000 | 13 (11.0%) | 0 (0.0%) |
| $10,000 to $24,999 | 2 (1.7%) | 11 (3.2%) |
| $25,000 to $34,999 | 0 (0.0%) | 4 (1.2%) |
| $35,000 to $49,999 | 29 (24.6%) | 13 (3.8%) |
| $50,000 to $74,999 | 12 (10.2%) | 12 (3.5%) |
| $75,000 to $99,999 | 7 (5.9%) | 19 (5.6%) |
| $100,000 to $149,999 | 32 (27.1%) | 48 (14.0%) |
| $150,000 or more | 23 (19.5%) | 146 (42.7%) |
| Total | 118 (100.0%) | 342 (100.0%) |
Property Value to Household Income Ratio in Urbana
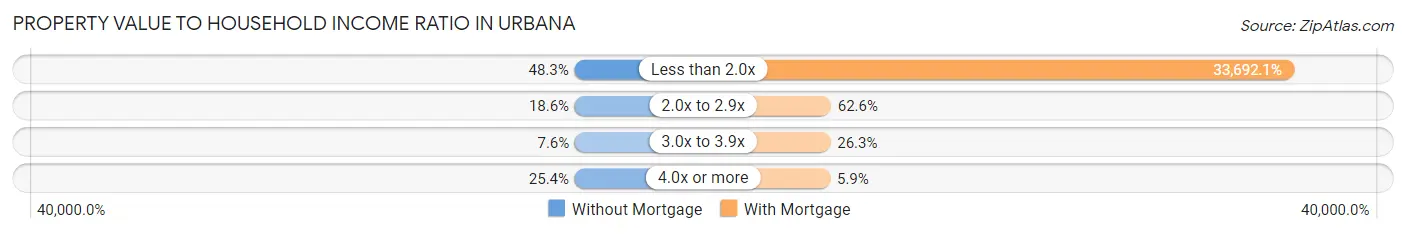
| Value-to-Income Ratio | Without Mortgage | With Mortgage |
| Less than 2.0x | 57 (48.3%) | 115,227 (33,692.1%) |
| 2.0x to 2.9x | 22 (18.6%) | 214 (62.6%) |
| 3.0x to 3.9x | 9 (7.6%) | 90 (26.3%) |
| 4.0x or more | 30 (25.4%) | 20 (5.9%) |
| Total | 118 (100.0%) | 342 (100.0%) |
Real Estate Taxes by Mortgage Status in Urbana
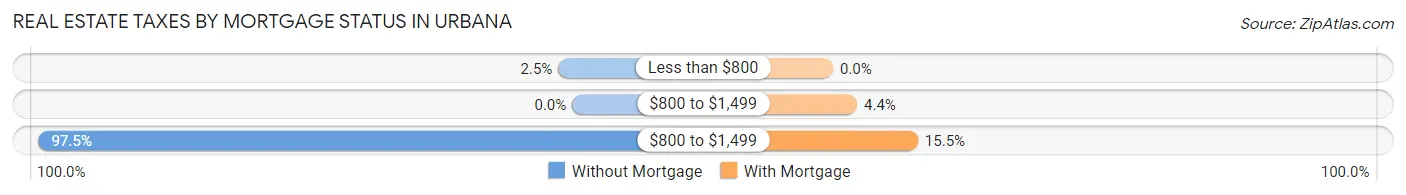
| Property Taxes | Without Mortgage | With Mortgage |
| Less than $800 | 3 (2.5%) | 0 (0.0%) |
| $800 to $1,499 | 0 (0.0%) | 15 (4.4%) |
| $800 to $1,499 | 115 (97.5%) | 53 (15.5%) |
| Total | 118 (100.0%) | 342 (100.0%) |
Health & Disability in Urbana
Health Insurance Coverage by Age in Urbana
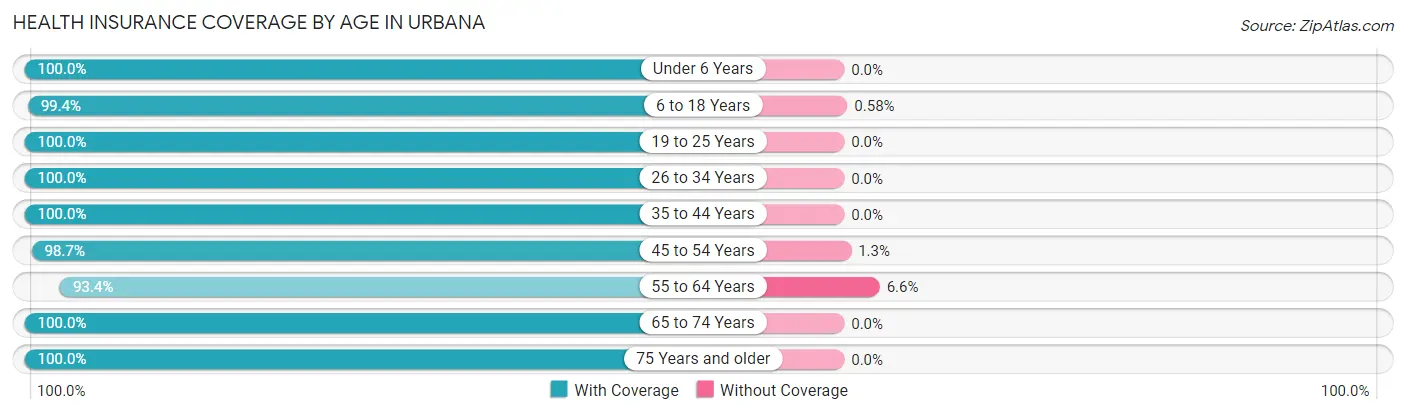
| Age Bracket | With Coverage | Without Coverage |
| Under 6 Years | 169 (100.0%) | 0 (0.0%) |
| 6 to 18 Years | 345 (99.4%) | 2 (0.6%) |
| 19 to 25 Years | 115 (100.0%) | 0 (0.0%) |
| 26 to 34 Years | 215 (100.0%) | 0 (0.0%) |
| 35 to 44 Years | 225 (100.0%) | 0 (0.0%) |
| 45 to 54 Years | 230 (98.7%) | 3 (1.3%) |
| 55 to 64 Years | 99 (93.4%) | 7 (6.6%) |
| 65 to 74 Years | 86 (100.0%) | 0 (0.0%) |
| 75 Years and older | 69 (100.0%) | 0 (0.0%) |
| Total | 1,553 (99.2%) | 12 (0.8%) |
Health Insurance Coverage by Citizenship Status in Urbana
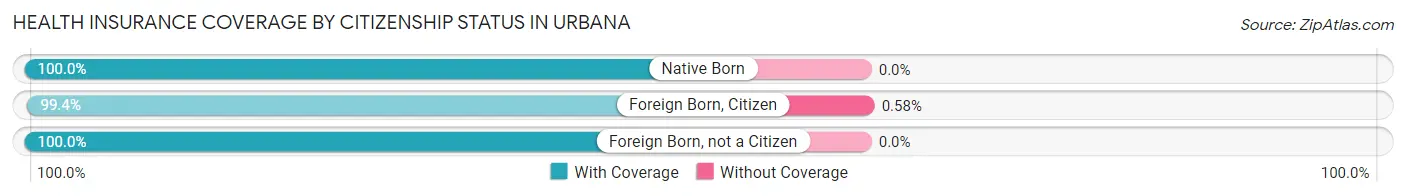
| Citizenship Status | With Coverage | Without Coverage |
| Native Born | 169 (100.0%) | 0 (0.0%) |
| Foreign Born, Citizen | 345 (99.4%) | 2 (0.6%) |
| Foreign Born, not a Citizen | 115 (100.0%) | 0 (0.0%) |
Health Insurance Coverage by Household Income in Urbana
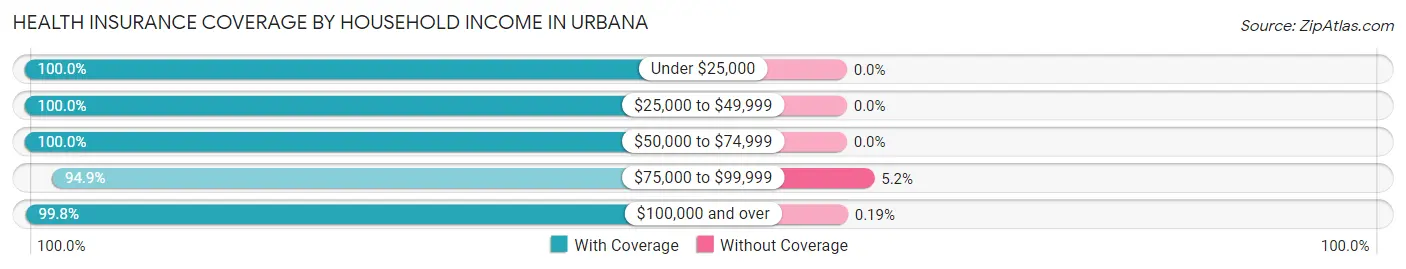
| Household Income | With Coverage | Without Coverage |
| Under $25,000 | 83 (100.0%) | 0 (0.0%) |
| $25,000 to $49,999 | 149 (100.0%) | 0 (0.0%) |
| $50,000 to $74,999 | 78 (100.0%) | 0 (0.0%) |
| $75,000 to $99,999 | 184 (94.9%) | 10 (5.1%) |
| $100,000 and over | 1,059 (99.8%) | 2 (0.2%) |
Public vs Private Health Insurance Coverage by Age in Urbana
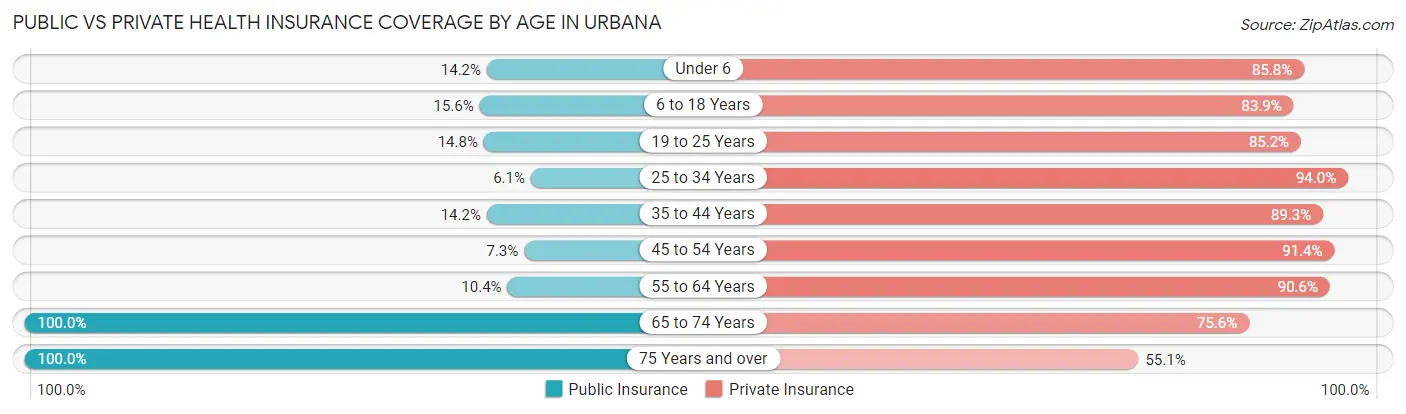
| Age Bracket | Public Insurance | Private Insurance |
| Under 6 | 24 (14.2%) | 145 (85.8%) |
| 6 to 18 Years | 54 (15.6%) | 291 (83.9%) |
| 19 to 25 Years | 17 (14.8%) | 98 (85.2%) |
| 25 to 34 Years | 13 (6.0%) | 202 (94.0%) |
| 35 to 44 Years | 32 (14.2%) | 201 (89.3%) |
| 45 to 54 Years | 17 (7.3%) | 213 (91.4%) |
| 55 to 64 Years | 11 (10.4%) | 96 (90.6%) |
| 65 to 74 Years | 86 (100.0%) | 65 (75.6%) |
| 75 Years and over | 69 (100.0%) | 38 (55.1%) |
| Total | 323 (20.6%) | 1,349 (86.2%) |
Disability Status by Sex by Age in Urbana
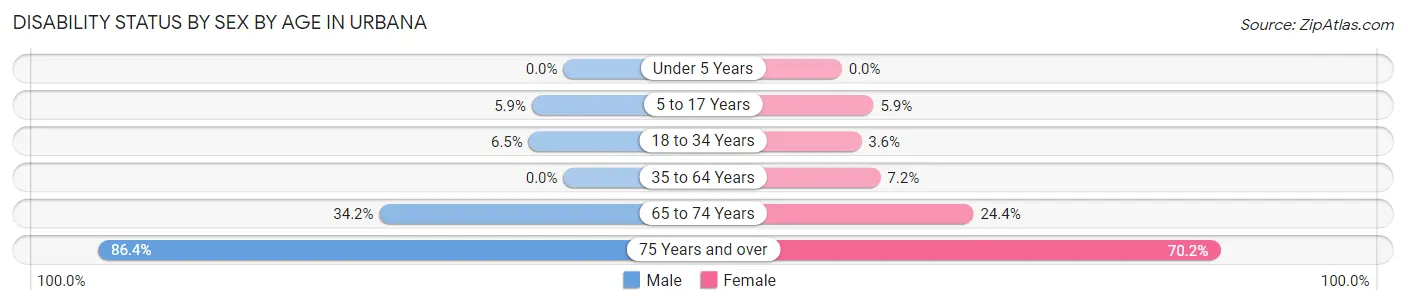
| Age Bracket | Male | Female |
| Under 5 Years | 0 (0.0%) | 0 (0.0%) |
| 5 to 17 Years | 10 (5.9%) | 9 (5.9%) |
| 18 to 34 Years | 10 (6.5%) | 8 (3.6%) |
| 35 to 64 Years | 0 (0.0%) | 19 (7.2%) |
| 65 to 74 Years | 14 (34.2%) | 11 (24.4%) |
| 75 Years and over | 19 (86.4%) | 33 (70.2%) |
Disability Class by Sex by Age in Urbana
Disability Class: Hearing Difficulty
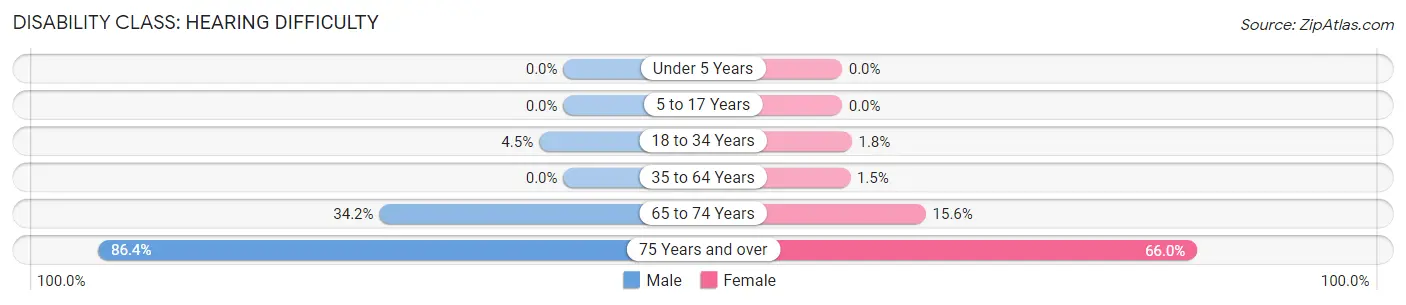
| Age Bracket | Male | Female |
| Under 5 Years | 0 (0.0%) | 0 (0.0%) |
| 5 to 17 Years | 0 (0.0%) | 0 (0.0%) |
| 18 to 34 Years | 7 (4.5%) | 4 (1.8%) |
| 35 to 64 Years | 0 (0.0%) | 4 (1.5%) |
| 65 to 74 Years | 14 (34.2%) | 7 (15.6%) |
| 75 Years and over | 19 (86.4%) | 31 (66.0%) |
Disability Class: Vision Difficulty
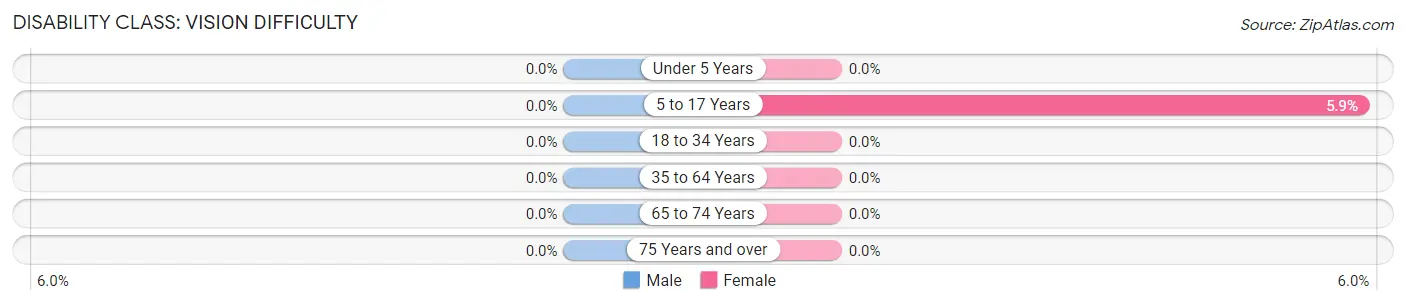
| Age Bracket | Male | Female |
| Under 5 Years | 0 (0.0%) | 0 (0.0%) |
| 5 to 17 Years | 0 (0.0%) | 9 (5.9%) |
| 18 to 34 Years | 0 (0.0%) | 0 (0.0%) |
| 35 to 64 Years | 0 (0.0%) | 0 (0.0%) |
| 65 to 74 Years | 0 (0.0%) | 0 (0.0%) |
| 75 Years and over | 0 (0.0%) | 0 (0.0%) |
Disability Class: Cognitive Difficulty
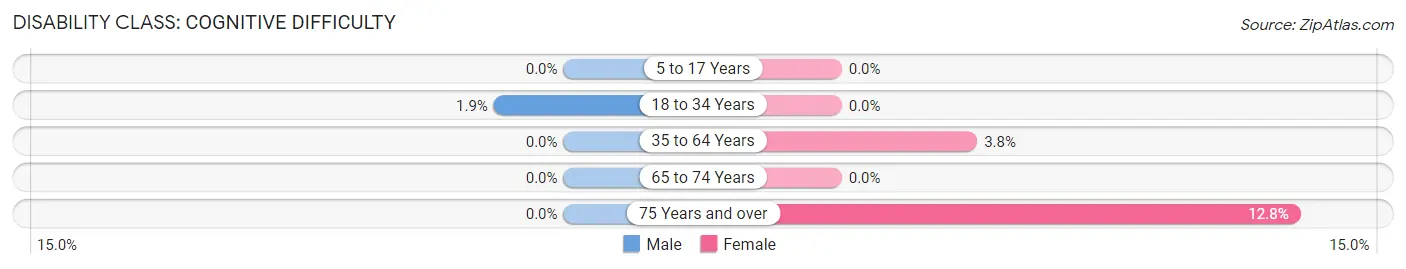
| Age Bracket | Male | Female |
| 5 to 17 Years | 0 (0.0%) | 0 (0.0%) |
| 18 to 34 Years | 3 (1.9%) | 0 (0.0%) |
| 35 to 64 Years | 0 (0.0%) | 10 (3.8%) |
| 65 to 74 Years | 0 (0.0%) | 0 (0.0%) |
| 75 Years and over | 0 (0.0%) | 6 (12.8%) |
Disability Class: Ambulatory Difficulty
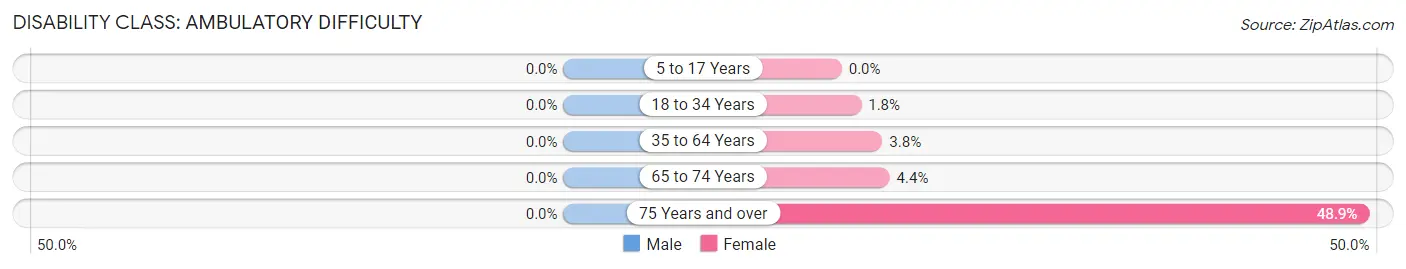
| Age Bracket | Male | Female |
| 5 to 17 Years | 0 (0.0%) | 0 (0.0%) |
| 18 to 34 Years | 0 (0.0%) | 4 (1.8%) |
| 35 to 64 Years | 0 (0.0%) | 10 (3.8%) |
| 65 to 74 Years | 0 (0.0%) | 2 (4.4%) |
| 75 Years and over | 0 (0.0%) | 23 (48.9%) |
Disability Class: Self-Care Difficulty
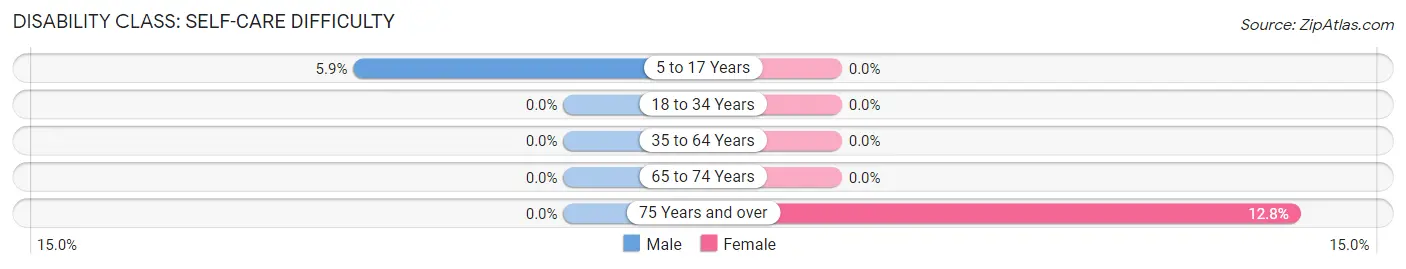
| Age Bracket | Male | Female |
| 5 to 17 Years | 10 (5.9%) | 0 (0.0%) |
| 18 to 34 Years | 0 (0.0%) | 0 (0.0%) |
| 35 to 64 Years | 0 (0.0%) | 0 (0.0%) |
| 65 to 74 Years | 0 (0.0%) | 0 (0.0%) |
| 75 Years and over | 0 (0.0%) | 6 (12.8%) |
Technology Access in Urbana
Computing Device Access in Urbana
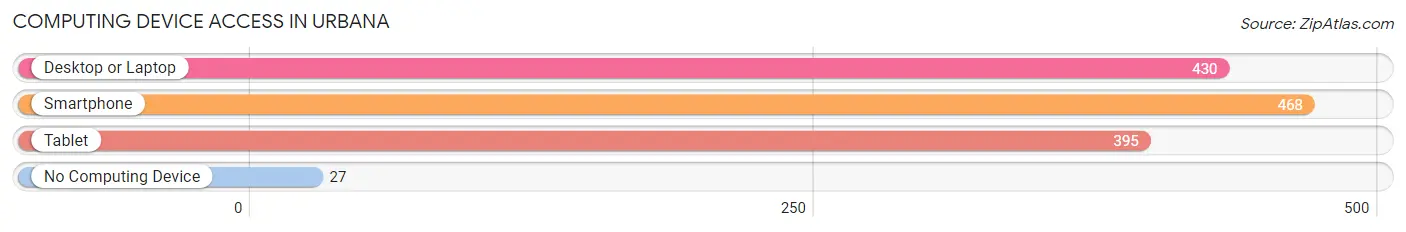
| Device Type | # Households | % Households |
| Desktop or Laptop | 430 | 82.5% |
| Smartphone | 468 | 89.8% |
| Tablet | 395 | 75.8% |
| No Computing Device | 27 | 5.2% |
| Total | 521 | 100.0% |
Internet Access in Urbana
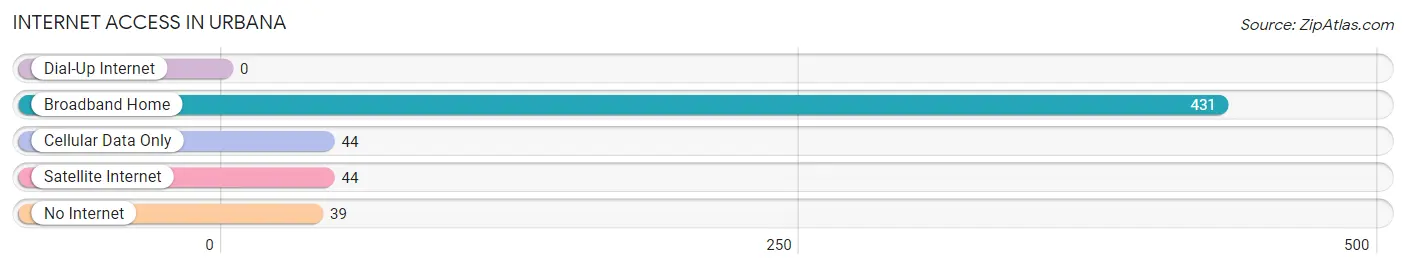
| Internet Type | # Households | % Households |
| Dial-Up Internet | 0 | 0.0% |
| Broadband Home | 431 | 82.7% |
| Cellular Data Only | 44 | 8.5% |
| Satellite Internet | 44 | 8.5% |
| No Internet | 39 | 7.5% |
| Total | 521 | 100.0% |
Urbana Summary
Urbana, Iowa is a small city located in the southeastern corner of Iowa, in the county of Benton. It is situated on the banks of the Cedar River, and is part of the Cedar Rapids metropolitan area. The city has a population of approximately 8,000 people, and is home to a variety of businesses, industries, and educational institutions.
History
The area that is now Urbana was first settled in 1845 by a group of settlers from Ohio. The town was originally known as “Cedar Rapids”, but was later renamed “Urbana” in 1851. The name was chosen to honor the city of Urbana, Ohio, which was the hometown of the settlers.
The city of Urbana was officially incorporated in 1857, and the first mayor was elected in 1858. The city quickly grew and prospered, and by the late 19th century, it was a thriving agricultural and industrial center. The city was home to several factories, including a flour mill, a sawmill, and a brickyard.
In the early 20th century, the city experienced a period of growth and development. The city was home to several educational institutions, including the University of Iowa, which was founded in 1847. The city also had a thriving business district, with several banks, stores, and other businesses.
Geography
Urbana is located in the southeastern corner of Iowa, in the county of Benton. It is situated on the banks of the Cedar River, and is part of the Cedar Rapids metropolitan area. The city has a total area of 4.2 square miles, and is located at an elevation of 845 feet above sea level.
The city is located in a humid continental climate zone, with hot summers and cold winters. The average annual temperature is around 50 degrees Fahrenheit, and the average annual precipitation is around 36 inches.
Economy
The economy of Urbana is largely based on agriculture and manufacturing. The city is home to several factories, including a flour mill, a sawmill, and a brickyard. The city is also home to several educational institutions, including the University of Iowa, which is one of the largest employers in the city.
The city also has a thriving business district, with several banks, stores, and other businesses. The city is home to several retail stores, restaurants, and other businesses. The city also has a vibrant arts and culture scene, with several galleries, museums, and other cultural attractions.
Demographics
As of the 2010 census, the population of Urbana was 8,000 people. The racial makeup of the city was 95.3% White, 0.7% African American, 0.3% Native American, 0.7% Asian, 0.1% Pacific Islander, and 2.8% from other races. The median household income was $41,000, and the median family income was $50,000.
The city has a large number of residents who are of German, Irish, and English descent. The city also has a large number of residents who are of Hispanic or Latino origin. The city has a large number of residents who are of Catholic faith.
Conclusion
Urbana, Iowa is a small city located in the southeastern corner of Iowa, in the county of Benton. It is situated on the banks of the Cedar River, and is part of the Cedar Rapids metropolitan area. The city has a population of approximately 8,000 people, and is home to a variety of businesses, industries, and educational institutions. The economy of Urbana is largely based on agriculture and manufacturing, and the city is home to several educational institutions, including the University of Iowa. The city also has a thriving business district, with several banks, stores, and other businesses. The city has a large number of residents who are of German, Irish, and English descent, and the city also has a large number of residents who are of Hispanic or Latino origin.
Common Questions
What is Per Capita Income in Urbana?
Per Capita income in Urbana is $38,264.
What is the Median Family Income in Urbana?
Median Family Income in Urbana is $118,750.
What is the Median Household income in Urbana?
Median Household Income in Urbana is $107,625.
What is Income or Wage Gap in Urbana?
Income or Wage Gap in Urbana is 36.9%.
Women in Urbana earn 63.1 cents for every dollar earned by a man.
What is Inequality or Gini Index in Urbana?
Inequality or Gini Index in Urbana is 0.33.
What is the Total Population of Urbana?
Total Population of Urbana is 1,565.
What is the Total Male Population of Urbana?
Total Male Population of Urbana is 777.
What is the Total Female Population of Urbana?
Total Female Population of Urbana is 788.
What is the Ratio of Males per 100 Females in Urbana?
There are 98.60 Males per 100 Females in Urbana.
What is the Ratio of Females per 100 Males in Urbana?
There are 101.42 Females per 100 Males in Urbana.
What is the Median Population Age in Urbana?
Median Population Age in Urbana is 32.2 Years.
What is the Average Family Size in Urbana
Average Family Size in Urbana is 3.5 People.
What is the Average Household Size in Urbana
Average Household Size in Urbana is 3.0 People.
How Large is the Labor Force in Urbana?
There are 886 People in the Labor Forcein in Urbana.
What is the Percentage of People in the Labor Force in Urbana?
78.0% of People are in the Labor Force in Urbana.
What is the Unemployment Rate in Urbana?
Unemployment Rate in Urbana is 2.4%.