Zip Codes with the Highest Percentage of Households with Income Above $100,000 in Davenport, IA
RELATED REPORTS & OPTIONS
Household Income | $100k+
Davenport
Compare Zip Codes
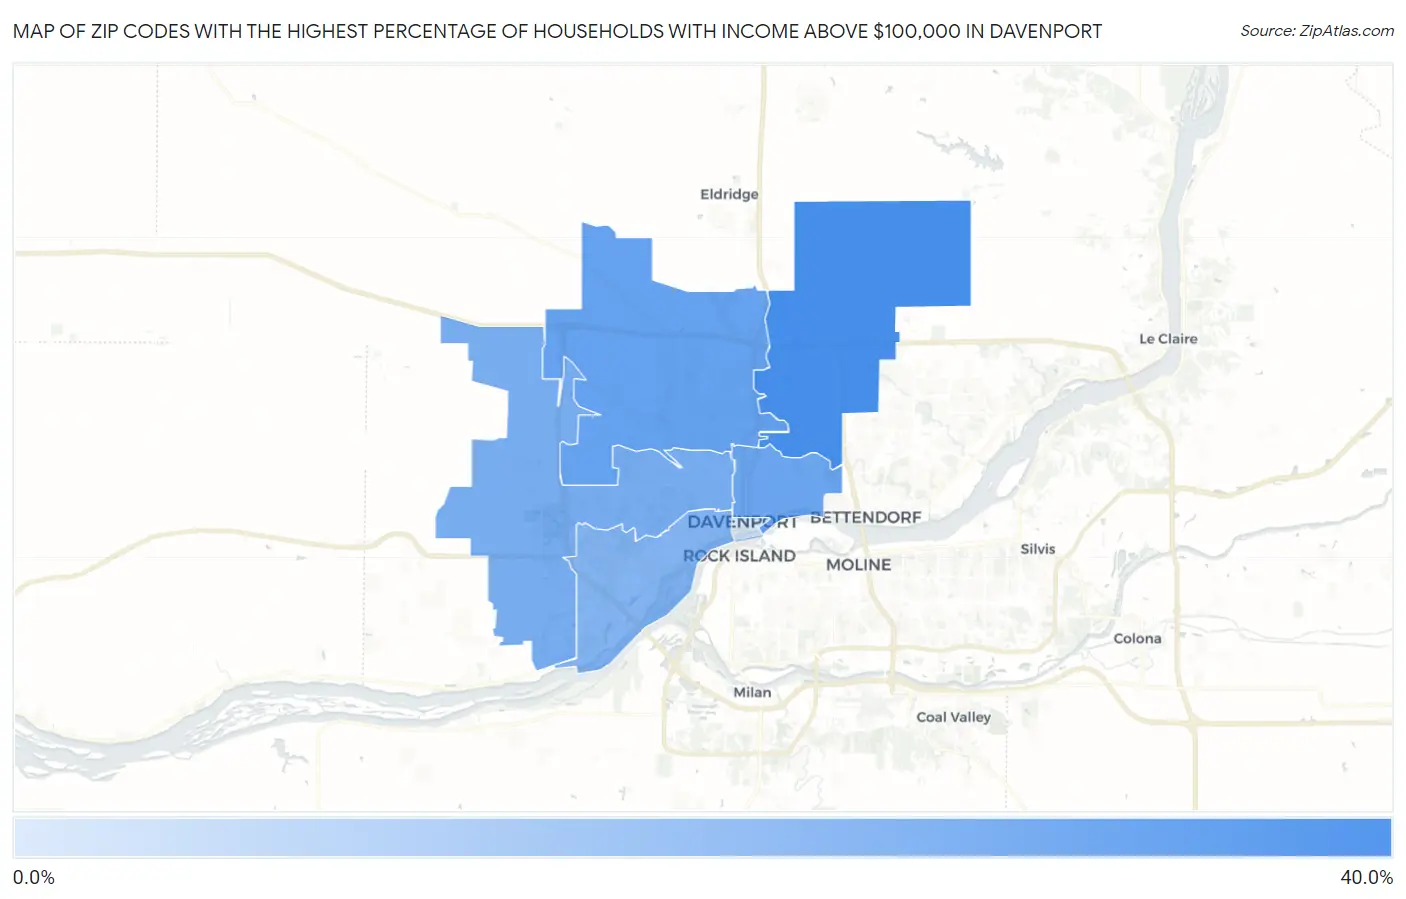
Map of Zip Codes with the Highest Percentage of Households with Income Above $100,000 in Davenport
5.3%
35.7%
Zip Codes with the Highest Percentage of Households with Income Above $100,000 in Davenport, IA
| Zip Code | Households with Income > $100k | vs State | vs National | |
| 1. | 52807 | 35.7% | 32.9%(+2.80)#289 | 37.3%(-1.60)#11,324 |
| 2. | 52806 | 29.0% | 32.9%(-3.90)#493 | 37.3%(-8.30)#16,229 |
| 3. | 52803 | 27.6% | 32.9%(-5.30)#545 | 37.3%(-9.70)#17,462 |
| 4. | 52804 | 24.8% | 32.9%(-8.10)#649 | 37.3%(-12.5)#19,926 |
| 5. | 52802 | 22.7% | 32.9%(-10.2)#728 | 37.3%(-14.6)#21,822 |
| 6. | 52801 | 5.3% | 32.9%(-27.6)#942 | 37.3%(-32.0)#30,998 |
1
Common Questions
What are the Top 5 Zip Codes with the Highest Percentage of Households with Income Above $100,000 in Davenport, IA?
Top 5 Zip Codes with the Highest Percentage of Households with Income Above $100,000 in Davenport, IA are:
What zip code has the Highest Percentage of Households with Income Above $100,000 in Davenport, IA?
52807 has the Highest Percentage of Households with Income Above $100,000 in Davenport, IA with 35.7%.
What is the Percentage of Households with Income Above $100,000 in Davenport, IA?
Percentage of Households with Income Above $100,000 in Davenport is 27.3%.
What is the Percentage of Households with Income Above $100,000 in Iowa?
Percentage of Households with Income Above $100,000 in Iowa is 32.9%.
What is the Percentage of Households with Income Above $100,000 in the United States?
Percentage of Households with Income Above $100,000 in the United States is 37.3%.