Robins, IA Map & Demographics
Robins Map
Robins Overview
$53,724
PER CAPITA INCOME
$128,173
AVG FAMILY INCOME
$127,443
AVG HOUSEHOLD INCOME
10.9%
WAGE / INCOME GAP [ % ]
89.1¢/ $1
WAGE / INCOME GAP [ $ ]
0.42
INEQUALITY / GINI INDEX
3,356
TOTAL POPULATION
1,754
MALE POPULATION
1,602
FEMALE POPULATION
109.49
MALES / 100 FEMALES
91.33
FEMALES / 100 MALES
45.2
MEDIAN AGE
2.9
AVG FAMILY SIZE
2.9
AVG HOUSEHOLD SIZE
1,689
LABOR FORCE [ PEOPLE ]
64.4%
PERCENT IN LABOR FORCE
6.8%
UNEMPLOYMENT RATE
Robins Zip Codes
Robins Area Codes
Income in Robins
Income Overview in Robins
Per Capita Income in Robins is $53,724, while median incomes of families and households are $128,173 and $127,443 respectively.
| Characteristic | Number | Measure |
| Per Capita Income | 3,356 | $53,724 |
| Median Family Income | 1,064 | $128,173 |
| Mean Family Income | 1,064 | $160,217 |
| Median Household Income | 1,161 | $127,443 |
| Mean Household Income | 1,161 | $155,580 |
| Income Deficit | 1,064 | $0 |
| Wage / Income Gap (%) | 3,356 | 10.92% |
| Wage / Income Gap ($) | 3,356 | 89.08¢ per $1 |
| Gini / Inequality Index | 3,356 | 0.42 |
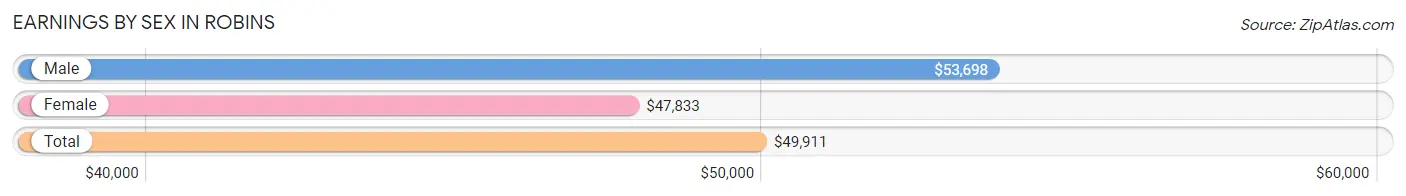
Earnings by Sex in Robins
Average Earnings in Robins are $49,911, $53,698 for men and $47,833 for women, a difference of 10.9%.
| Sex | Number | Average Earnings |
| Male | 1,039 (55.7%) | $53,698 |
| Female | 826 (44.3%) | $47,833 |
| Total | 1,865 (100.0%) | $49,911 |
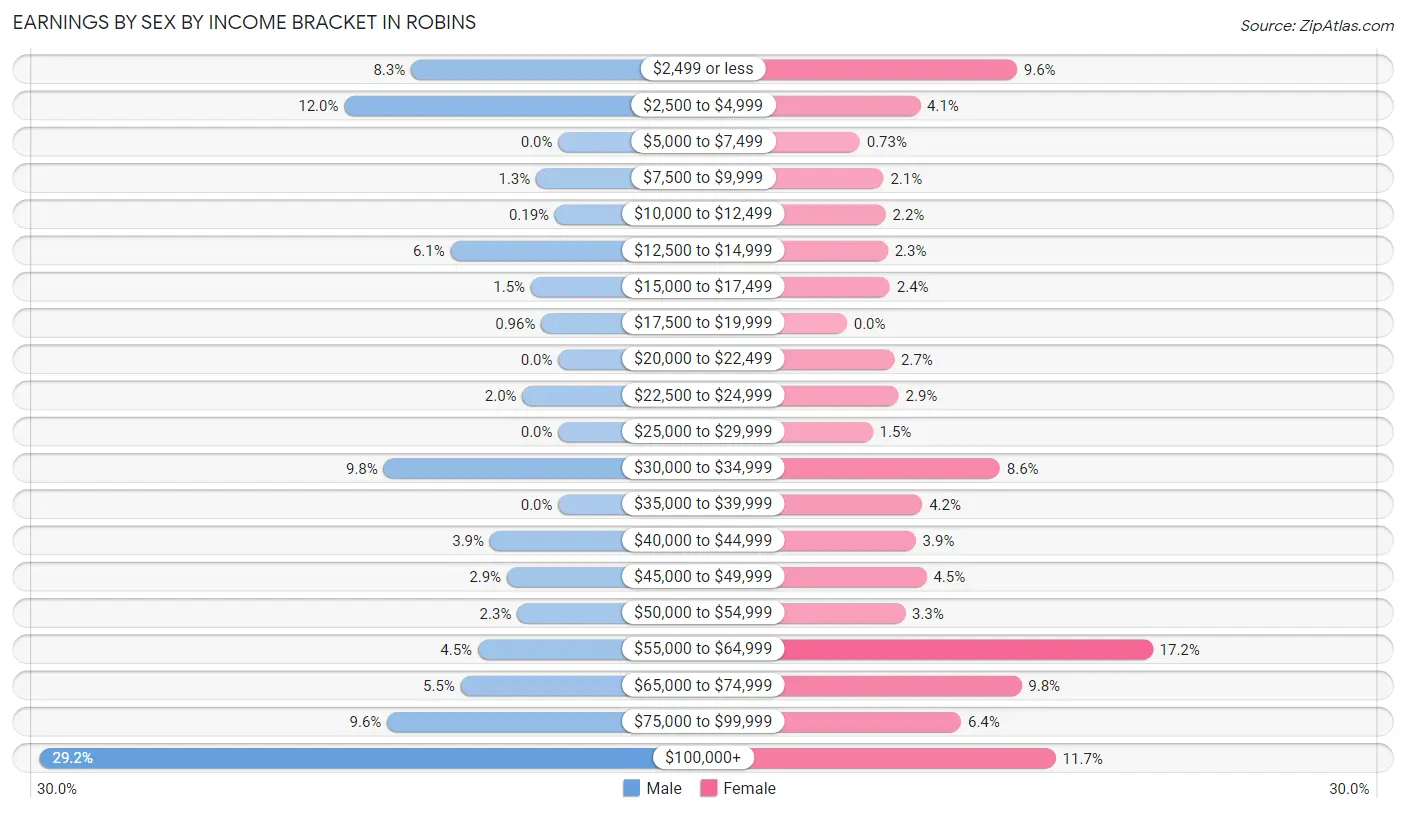
Earnings by Sex by Income Bracket in Robins
The most common earnings brackets in Robins are $100,000+ for men (303 | 29.2%) and $55,000 to $64,999 for women (142 | 17.2%).
| Income | Male | Female |
| $2,499 or less | 86 (8.3%) | 79 (9.6%) |
| $2,500 to $4,999 | 125 (12.0%) | 34 (4.1%) |
| $5,000 to $7,499 | 0 (0.0%) | 6 (0.7%) |
| $7,500 to $9,999 | 13 (1.3%) | 17 (2.1%) |
| $10,000 to $12,499 | 2 (0.2%) | 18 (2.2%) |
| $12,500 to $14,999 | 63 (6.1%) | 19 (2.3%) |
| $15,000 to $17,499 | 16 (1.5%) | 20 (2.4%) |
| $17,500 to $19,999 | 10 (1.0%) | 0 (0.0%) |
| $20,000 to $22,499 | 0 (0.0%) | 22 (2.7%) |
| $22,500 to $24,999 | 21 (2.0%) | 24 (2.9%) |
| $25,000 to $29,999 | 0 (0.0%) | 12 (1.5%) |
| $30,000 to $34,999 | 102 (9.8%) | 71 (8.6%) |
| $35,000 to $39,999 | 0 (0.0%) | 35 (4.2%) |
| $40,000 to $44,999 | 40 (3.8%) | 32 (3.9%) |
| $45,000 to $49,999 | 30 (2.9%) | 37 (4.5%) |
| $50,000 to $54,999 | 24 (2.3%) | 27 (3.3%) |
| $55,000 to $64,999 | 47 (4.5%) | 142 (17.2%) |
| $65,000 to $74,999 | 57 (5.5%) | 81 (9.8%) |
| $75,000 to $99,999 | 100 (9.6%) | 53 (6.4%) |
| $100,000+ | 303 (29.2%) | 97 (11.7%) |
| Total | 1,039 (100.0%) | 826 (100.0%) |
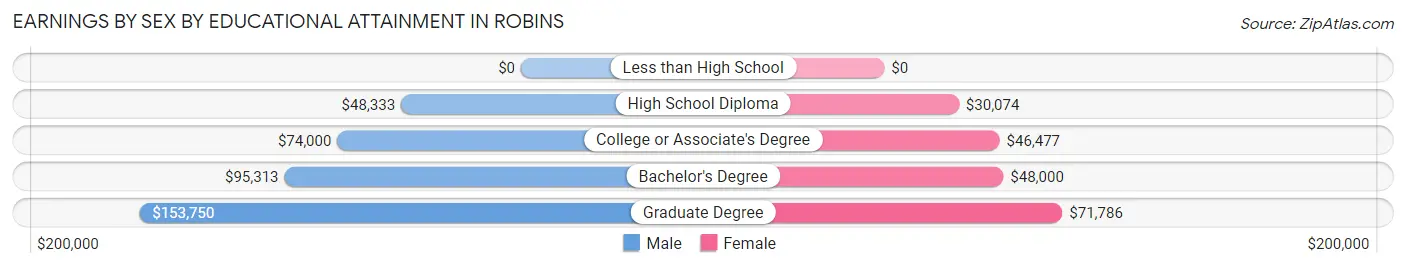
Earnings by Sex by Educational Attainment in Robins
Average earnings in Robins are $73,646 for men and $55,022 for women, a difference of 25.3%. Men with an educational attainment of graduate degree enjoy the highest average annual earnings of $153,750, while those with high school diploma education earn the least with $48,333. Women with an educational attainment of graduate degree earn the most with the average annual earnings of $71,786, while those with high school diploma education have the smallest earnings of $30,074.
| Educational Attainment | Male Income | Female Income |
| Less than High School | - | - |
| High School Diploma | $48,333 | $30,074 |
| College or Associate's Degree | $74,000 | $46,477 |
| Bachelor's Degree | $95,313 | $48,000 |
| Graduate Degree | $153,750 | $71,786 |
| Total | $73,646 | $55,022 |
Family Income in Robins
Family Income Brackets in Robins
According to the Robins family income data, there are 234 families falling into the $200,000+ income range, which is the most common income bracket and makes up 22.0% of all families.
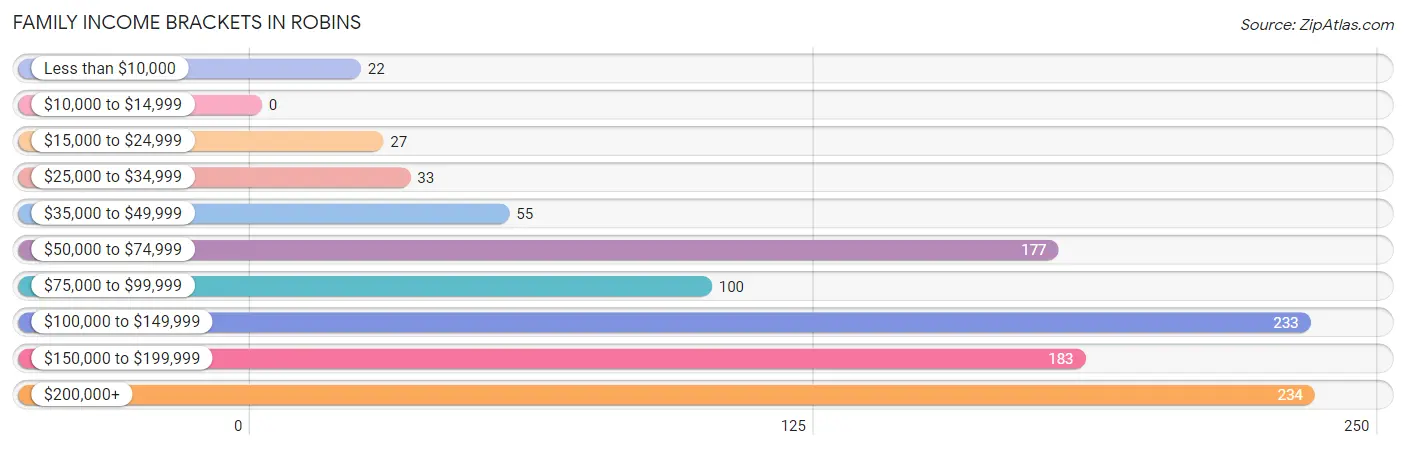
| Income Bracket | # Families | % Families |
| Less than $10,000 | 22 | 2.1% |
| $10,000 to $14,999 | 0 | 0.0% |
| $15,000 to $24,999 | 27 | 2.5% |
| $25,000 to $34,999 | 33 | 3.1% |
| $35,000 to $49,999 | 55 | 5.2% |
| $50,000 to $74,999 | 177 | 16.6% |
| $75,000 to $99,999 | 100 | 9.4% |
| $100,000 to $149,999 | 233 | 21.9% |
| $150,000 to $199,999 | 183 | 17.2% |
| $200,000+ | 234 | 22.0% |
Family Income by Famaliy Size in Robins
6-person families (26 | 2.4%) account for the highest median family income in Robins with $210,000 per family, while 2-person families (576 | 54.1%) have the highest median income of $55,625 per family member.
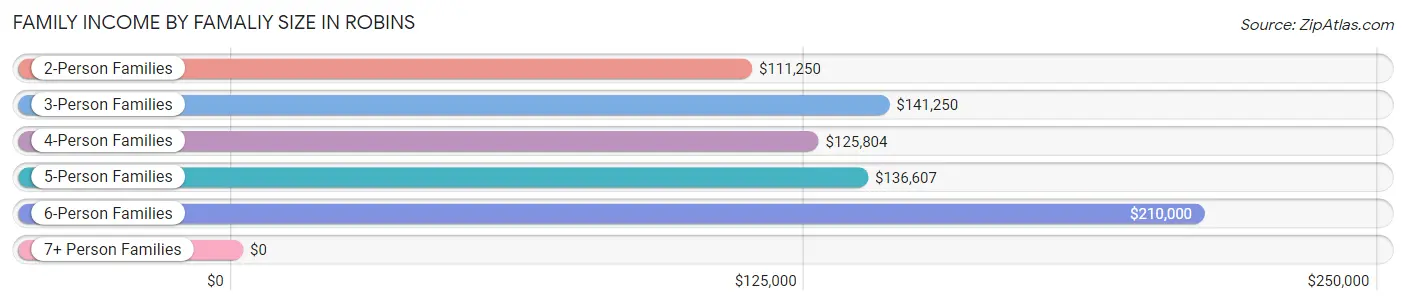
| Income Bracket | # Families | Median Income |
| 2-Person Families | 576 (54.1%) | $111,250 |
| 3-Person Families | 188 (17.7%) | $141,250 |
| 4-Person Families | 189 (17.8%) | $125,804 |
| 5-Person Families | 85 (8.0%) | $136,607 |
| 6-Person Families | 26 (2.4%) | $210,000 |
| 7+ Person Families | 0 (0.0%) | $0 |
| Total | 1,064 (100.0%) | $128,173 |
Family Income by Number of Earners in Robins
The median family income in Robins is $128,173, with families comprising 3+ earners (134) having the highest median family income of $168,333, while families with no earners (159) have the lowest median family income of $69,375, accounting for 12.6% and 14.9% of families, respectively.
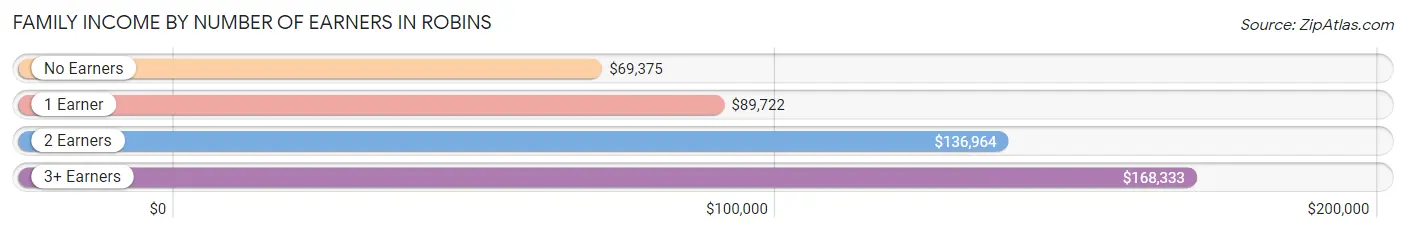
| Number of Earners | # Families | Median Income |
| No Earners | 159 (14.9%) | $69,375 |
| 1 Earner | 306 (28.8%) | $89,722 |
| 2 Earners | 465 (43.7%) | $136,964 |
| 3+ Earners | 134 (12.6%) | $168,333 |
| Total | 1,064 (100.0%) | $128,173 |
Household Income in Robins
Household Income Brackets in Robins
With 240 households falling in the category, the $200,000+ income range is the most frequent in Robins, accounting for 20.7% of all households.
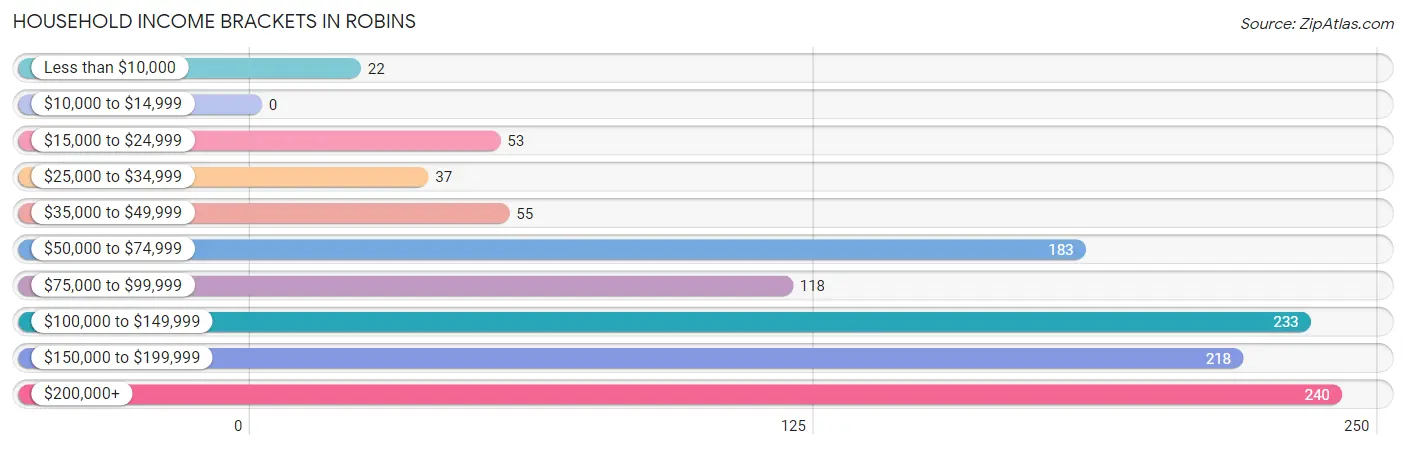
| Income Bracket | # Households | % Households |
| Less than $10,000 | 22 | 1.9% |
| $10,000 to $14,999 | 0 | 0.0% |
| $15,000 to $24,999 | 53 | 4.6% |
| $25,000 to $34,999 | 37 | 3.2% |
| $35,000 to $49,999 | 55 | 4.7% |
| $50,000 to $74,999 | 183 | 15.8% |
| $75,000 to $99,999 | 118 | 10.2% |
| $100,000 to $149,999 | 233 | 20.1% |
| $150,000 to $199,999 | 218 | 18.8% |
| $200,000+ | 240 | 20.7% |
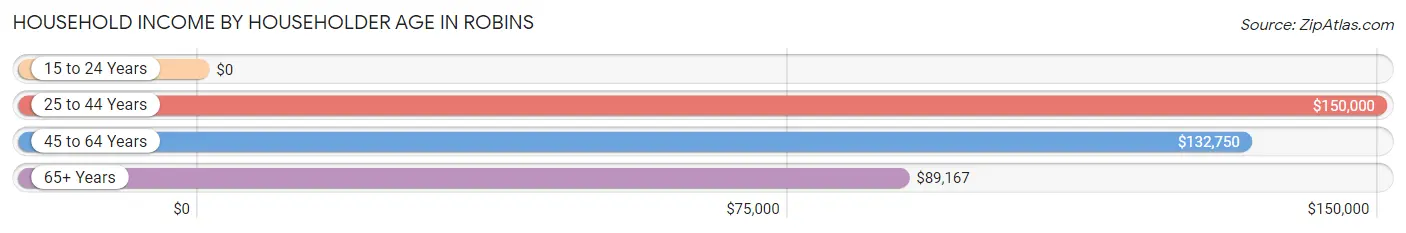
Household Income by Householder Age in Robins
The median household income in Robins is $127,443, with the highest median household income of $150,000 found in the 25 to 44 years age bracket for the primary householder. A total of 206 households (17.7%) fall into this category.
| Income Bracket | # Households | Median Income |
| 15 to 24 Years | 0 (0.0%) | $0 |
| 25 to 44 Years | 206 (17.7%) | $150,000 |
| 45 to 64 Years | 695 (59.9%) | $132,750 |
| 65+ Years | 260 (22.4%) | $89,167 |
| Total | 1,161 (100.0%) | $127,443 |
Poverty in Robins
Income Below Poverty by Sex and Age in Robins
With 11.9% poverty level for males and 3.4% for females among the residents of Robins, 16 and 17 year old males and 6 to 11 year old females are the most vulnerable to poverty, with 37 males (42.5%) and 36 females (22.8%) in their respective age groups living below the poverty level.
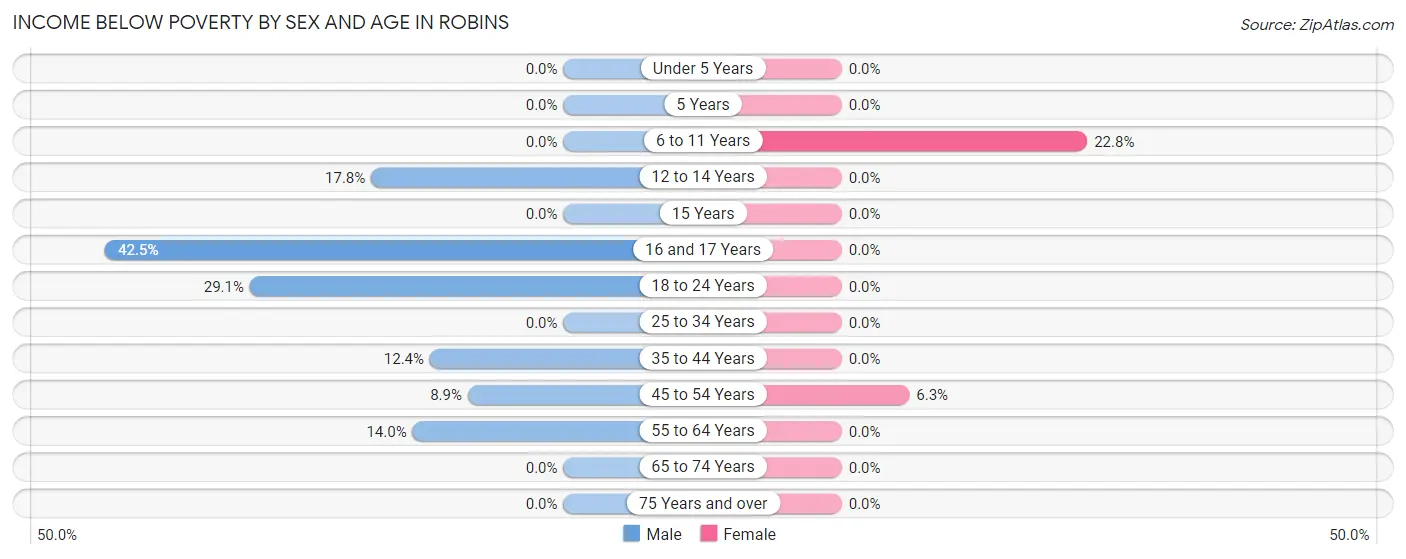
| Age Bracket | Male | Female |
| Under 5 Years | 0 (0.0%) | 0 (0.0%) |
| 5 Years | 0 (0.0%) | 0 (0.0%) |
| 6 to 11 Years | 0 (0.0%) | 36 (22.8%) |
| 12 to 14 Years | 33 (17.8%) | 0 (0.0%) |
| 15 Years | 0 (0.0%) | 0 (0.0%) |
| 16 and 17 Years | 37 (42.5%) | 0 (0.0%) |
| 18 to 24 Years | 39 (29.1%) | 0 (0.0%) |
| 25 to 34 Years | 0 (0.0%) | 0 (0.0%) |
| 35 to 44 Years | 27 (12.4%) | 0 (0.0%) |
| 45 to 54 Years | 22 (8.9%) | 18 (6.3%) |
| 55 to 64 Years | 49 (14.0%) | 0 (0.0%) |
| 65 to 74 Years | 0 (0.0%) | 0 (0.0%) |
| 75 Years and over | 0 (0.0%) | 0 (0.0%) |
| Total | 207 (11.9%) | 54 (3.4%) |
Income Above Poverty by Sex and Age in Robins
According to the poverty statistics in Robins, males aged under 5 years and females aged under 5 years are the age groups that are most secure financially, with 100.0% of males and 100.0% of females in these age groups living above the poverty line.
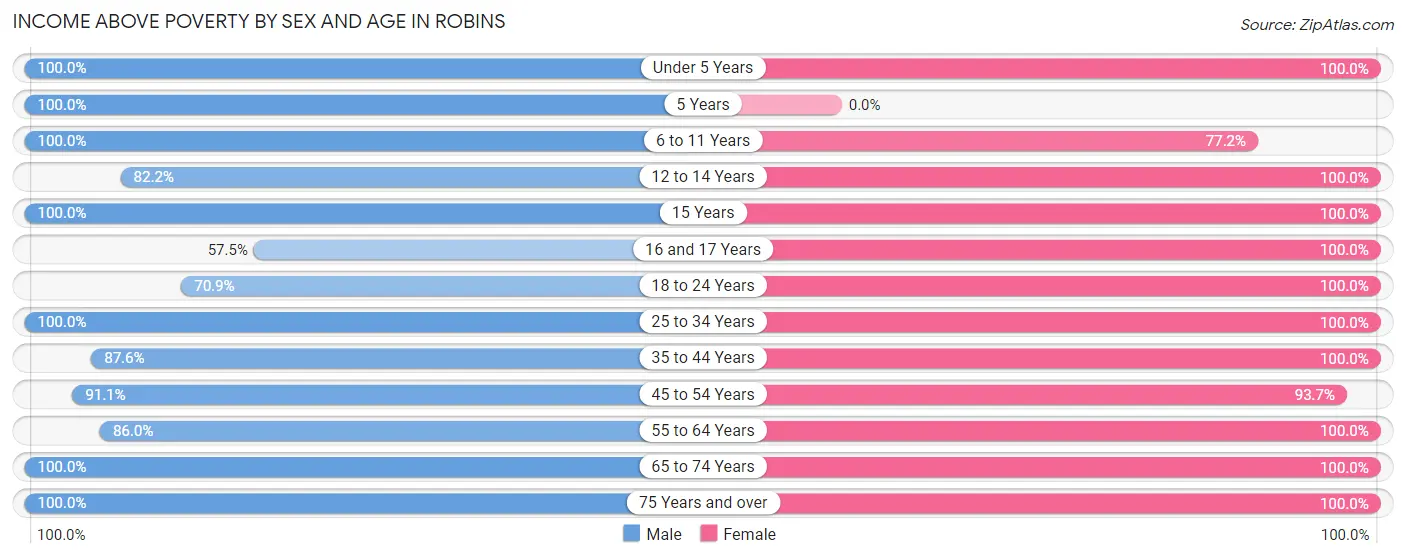
| Age Bracket | Male | Female |
| Under 5 Years | 48 (100.0%) | 64 (100.0%) |
| 5 Years | 25 (100.0%) | 0 (0.0%) |
| 6 to 11 Years | 79 (100.0%) | 122 (77.2%) |
| 12 to 14 Years | 152 (82.2%) | 92 (100.0%) |
| 15 Years | 6 (100.0%) | 58 (100.0%) |
| 16 and 17 Years | 50 (57.5%) | 42 (100.0%) |
| 18 to 24 Years | 95 (70.9%) | 67 (100.0%) |
| 25 to 34 Years | 78 (100.0%) | 118 (100.0%) |
| 35 to 44 Years | 191 (87.6%) | 187 (100.0%) |
| 45 to 54 Years | 226 (91.1%) | 269 (93.7%) |
| 55 to 64 Years | 301 (86.0%) | 265 (100.0%) |
| 65 to 74 Years | 196 (100.0%) | 182 (100.0%) |
| 75 Years and over | 81 (100.0%) | 82 (100.0%) |
| Total | 1,528 (88.1%) | 1,548 (96.6%) |
Income Below Poverty Among Married-Couple Families in Robins
The poverty statistics for married-couple families in Robins show that 1.8% or 16 of the total 891 families live below the poverty line. Families with no children have the highest poverty rate of 2.7%, comprising of 16 families. On the other hand, families with 1 or 2 children have the lowest poverty rate of 0.0%, which includes 0 families.
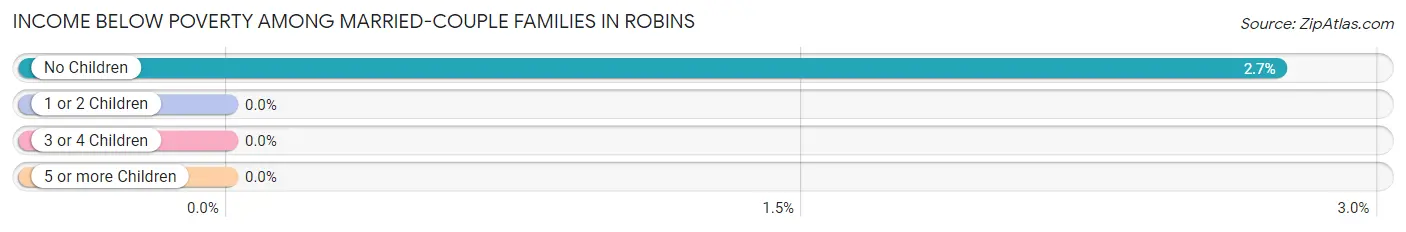
| Children | Above Poverty | Below Poverty |
| No Children | 569 (97.3%) | 16 (2.7%) |
| 1 or 2 Children | 239 (100.0%) | 0 (0.0%) |
| 3 or 4 Children | 67 (100.0%) | 0 (0.0%) |
| 5 or more Children | 0 (0.0%) | 0 (0.0%) |
| Total | 875 (98.2%) | 16 (1.8%) |
Income Below Poverty Among Single-Parent Households in Robins
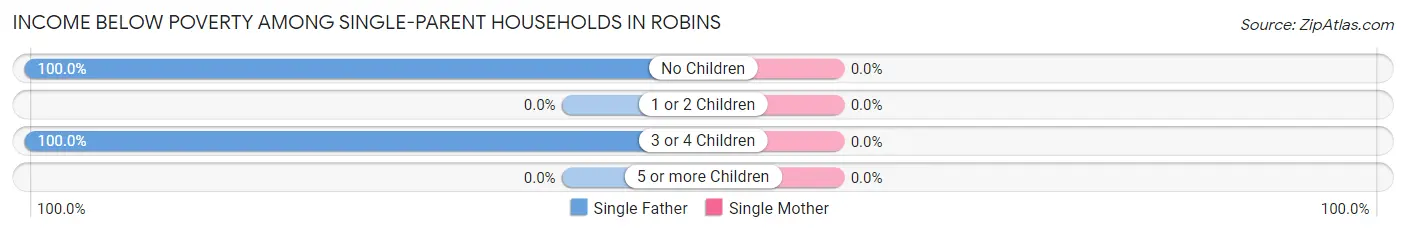
| Children | Single Father | Single Mother |
| No Children | 22 (100.0%) | 0 (0.0%) |
| 1 or 2 Children | 0 (0.0%) | 0 (0.0%) |
| 3 or 4 Children | 33 (100.0%) | 0 (0.0%) |
| 5 or more Children | 0 (0.0%) | 0 (0.0%) |
| Total | 55 (56.1%) | 0 (0.0%) |
Income Below Poverty Among Married-Couple vs Single-Parent Households in Robins
The poverty data for Robins shows that 16 of the married-couple family households (1.8%) and 55 of the single-parent households (31.8%) are living below the poverty level. Within the married-couple family households, those with no children have the highest poverty rate, with 16 households (2.7%) falling below the poverty line. Among the single-parent households, those with no children have the highest poverty rate, with 22 household (75.9%) living below poverty.
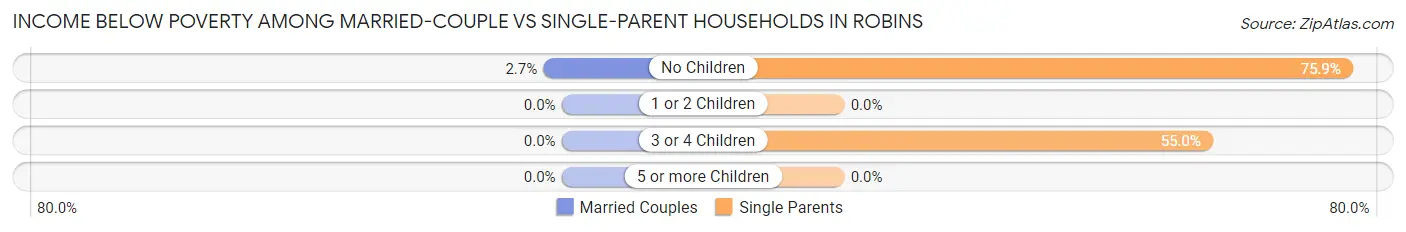
| Children | Married-Couple Families | Single-Parent Households |
| No Children | 16 (2.7%) | 22 (75.9%) |
| 1 or 2 Children | 0 (0.0%) | 0 (0.0%) |
| 3 or 4 Children | 0 (0.0%) | 33 (55.0%) |
| 5 or more Children | 0 (0.0%) | 0 (0.0%) |
| Total | 16 (1.8%) | 55 (31.8%) |
Race in Robins
The most populous races in Robins are White / Caucasian (3,251 | 96.9%), Asian (65 | 1.9%), and Hispanic or Latino (53 | 1.6%).
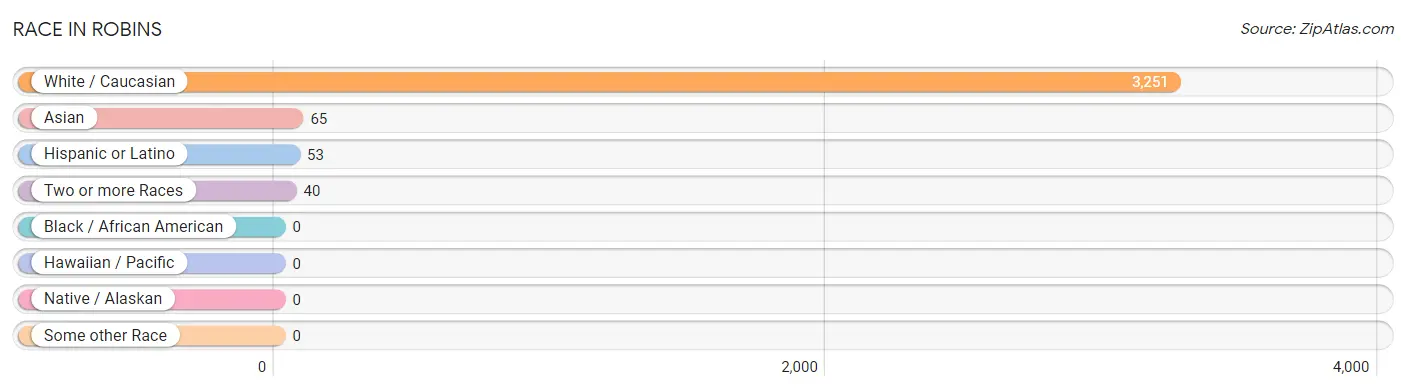
| Race | # Population | % Population |
| Asian | 65 | 1.9% |
| Black / African American | 0 | 0.0% |
| Hawaiian / Pacific | 0 | 0.0% |
| Hispanic or Latino | 53 | 1.6% |
| Native / Alaskan | 0 | 0.0% |
| White / Caucasian | 3,251 | 96.9% |
| Two or more Races | 40 | 1.2% |
| Some other Race | 0 | 0.0% |
| Total | 3,356 | 100.0% |
Ancestry in Robins
The most populous ancestries reported in Robins are German (1,697 | 50.6%), English (631 | 18.8%), Irish (346 | 10.3%), Czech (238 | 7.1%), and American (132 | 3.9%), together accounting for 90.7% of all Robins residents.
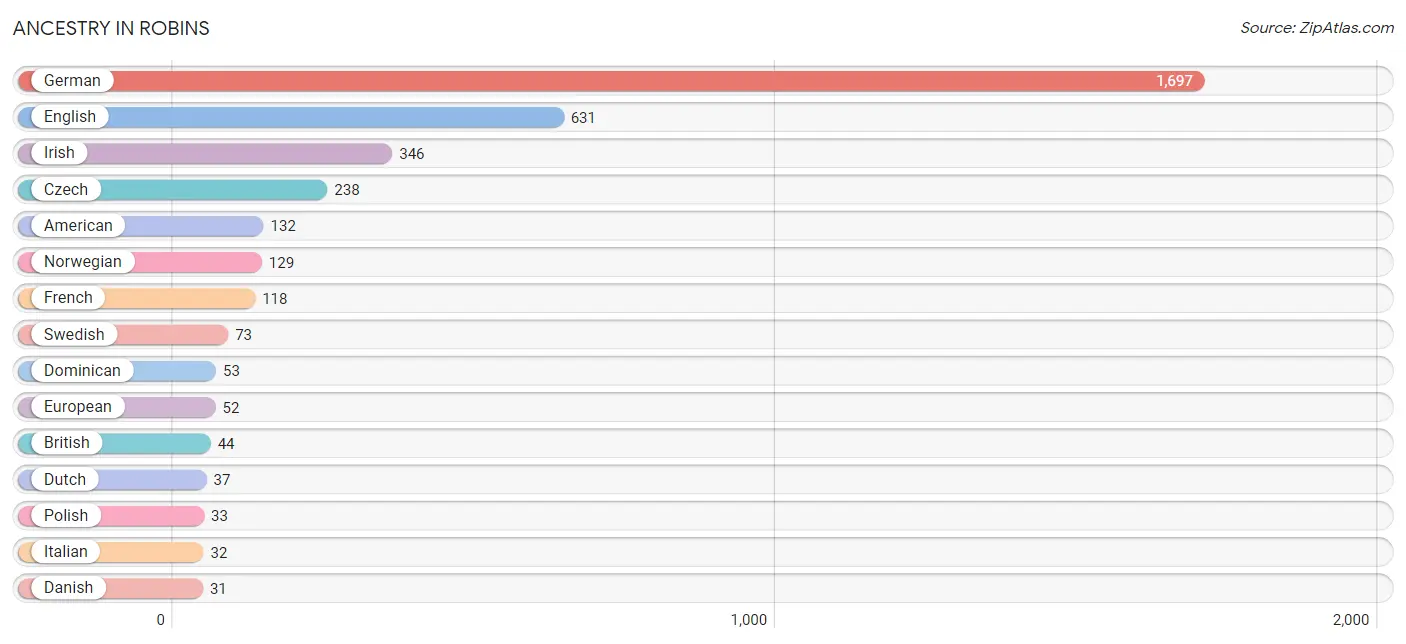
| Ancestry | # Population | % Population |
| American | 132 | 3.9% |
| British | 44 | 1.3% |
| Burmese | 10 | 0.3% |
| Canadian | 16 | 0.5% |
| Cherokee | 10 | 0.3% |
| Czech | 238 | 7.1% |
| Czechoslovakian | 18 | 0.5% |
| Danish | 31 | 0.9% |
| Dominican | 53 | 1.6% |
| Dutch | 37 | 1.1% |
| English | 631 | 18.8% |
| European | 52 | 1.5% |
| Finnish | 17 | 0.5% |
| French | 118 | 3.5% |
| French Canadian | 7 | 0.2% |
| German | 1,697 | 50.6% |
| Greek | 6 | 0.2% |
| Irish | 346 | 10.3% |
| Italian | 32 | 0.9% |
| Korean | 11 | 0.3% |
| Northern European | 5 | 0.2% |
| Norwegian | 129 | 3.8% |
| Polish | 33 | 1.0% |
| Scandinavian | 4 | 0.1% |
| Scotch-Irish | 28 | 0.8% |
| Scottish | 30 | 0.9% |
| Swedish | 73 | 2.2% |
| Thai | 26 | 0.8% |
| Welsh | 21 | 0.6% | View All 29 Rows |
Immigrants in Robins
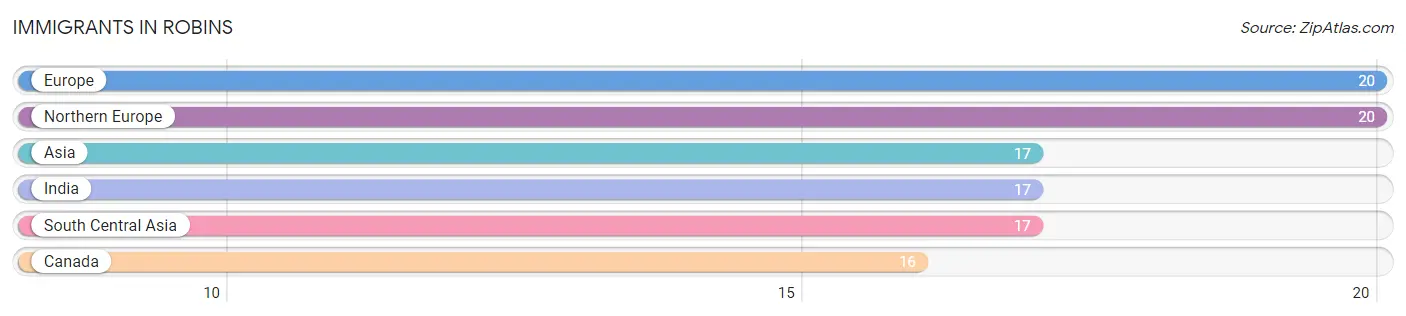
The most numerous immigrant groups reported in Robins came from Europe (20 | 0.6%), Northern Europe (20 | 0.6%), Asia (17 | 0.5%), India (17 | 0.5%), and South Central Asia (17 | 0.5%), together accounting for 2.7% of all Robins residents.
| Immigration Origin | # Population | % Population |
| Asia | 17 | 0.5% |
| Canada | 16 | 0.5% |
| Europe | 20 | 0.6% |
| India | 17 | 0.5% |
| Northern Europe | 20 | 0.6% |
| South Central Asia | 17 | 0.5% | View All 6 Rows |
Sex and Age in Robins
Sex and Age in Robins
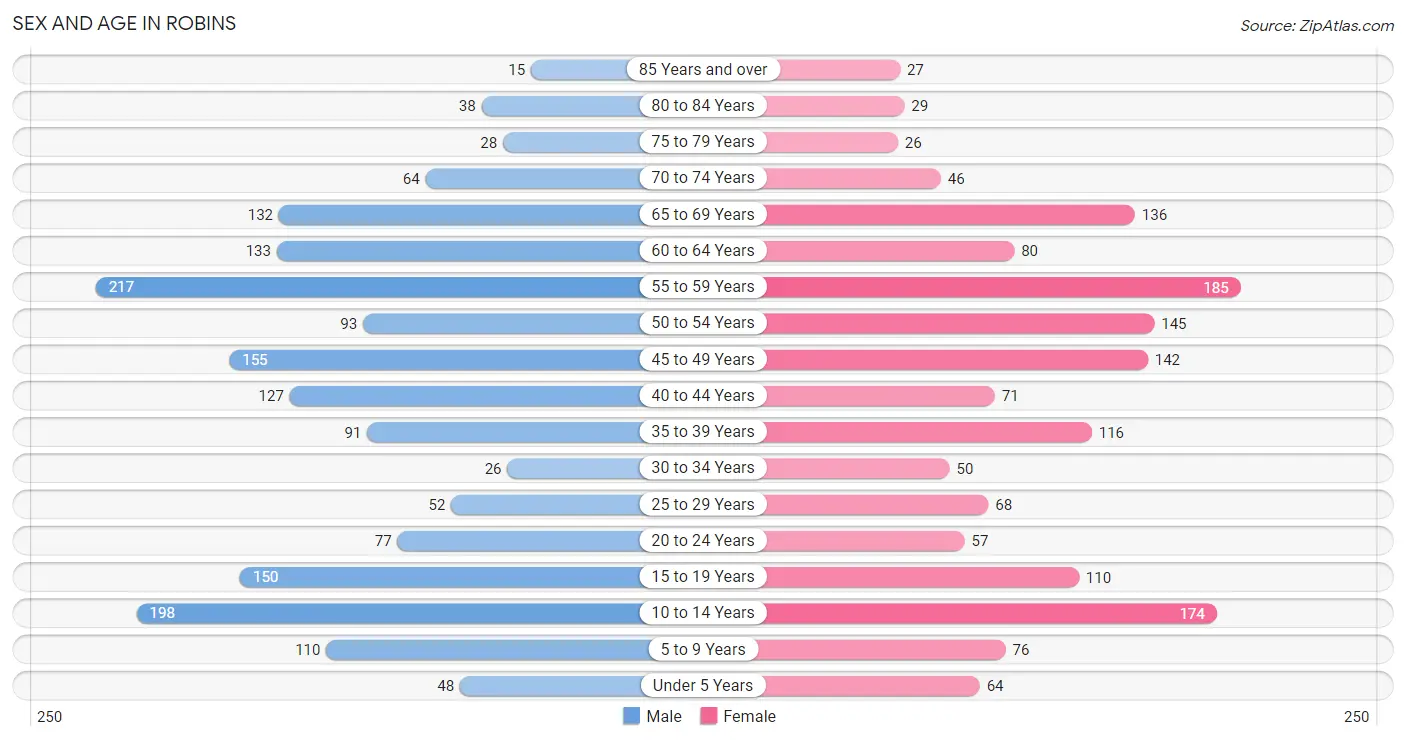
The most populous age groups in Robins are 55 to 59 Years (217 | 12.4%) for men and 55 to 59 Years (185 | 11.6%) for women.
| Age Bracket | Male | Female |
| Under 5 Years | 48 (2.7%) | 64 (4.0%) |
| 5 to 9 Years | 110 (6.3%) | 76 (4.7%) |
| 10 to 14 Years | 198 (11.3%) | 174 (10.9%) |
| 15 to 19 Years | 150 (8.6%) | 110 (6.9%) |
| 20 to 24 Years | 77 (4.4%) | 57 (3.6%) |
| 25 to 29 Years | 52 (3.0%) | 68 (4.2%) |
| 30 to 34 Years | 26 (1.5%) | 50 (3.1%) |
| 35 to 39 Years | 91 (5.2%) | 116 (7.2%) |
| 40 to 44 Years | 127 (7.2%) | 71 (4.4%) |
| 45 to 49 Years | 155 (8.8%) | 142 (8.9%) |
| 50 to 54 Years | 93 (5.3%) | 145 (9.0%) |
| 55 to 59 Years | 217 (12.4%) | 185 (11.6%) |
| 60 to 64 Years | 133 (7.6%) | 80 (5.0%) |
| 65 to 69 Years | 132 (7.5%) | 136 (8.5%) |
| 70 to 74 Years | 64 (3.6%) | 46 (2.9%) |
| 75 to 79 Years | 28 (1.6%) | 26 (1.6%) |
| 80 to 84 Years | 38 (2.2%) | 29 (1.8%) |
| 85 Years and over | 15 (0.9%) | 27 (1.7%) |
| Total | 1,754 (100.0%) | 1,602 (100.0%) |
Families and Households in Robins
Median Family Size in Robins
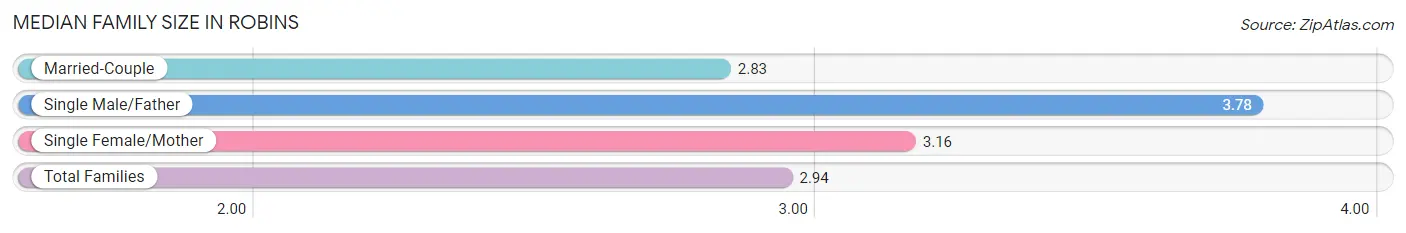
The median family size in Robins is 2.94 persons per family, with single male/father families (98 | 9.2%) accounting for the largest median family size of 3.78 persons per family. On the other hand, married-couple families (891 | 83.7%) represent the smallest median family size with 2.83 persons per family.
| Family Type | # Families | Family Size |
| Married-Couple | 891 (83.7%) | 2.83 |
| Single Male/Father | 98 (9.2%) | 3.78 |
| Single Female/Mother | 75 (7.0%) | 3.16 |
| Total Families | 1,064 (100.0%) | 2.94 |
Median Household Size in Robins
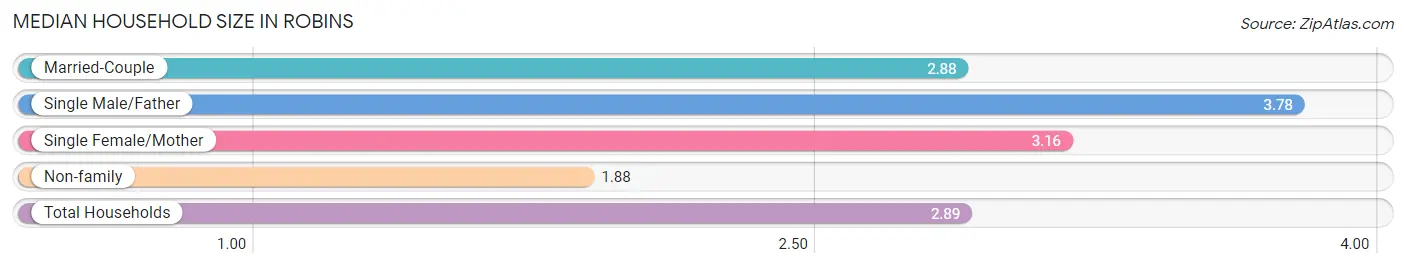
The median household size in Robins is 2.89 persons per household, with single male/father households (98 | 8.4%) accounting for the largest median household size of 3.78 persons per household. non-family households (97 | 8.4%) represent the smallest median household size with 1.88 persons per household.
| Household Type | # Households | Household Size |
| Married-Couple | 891 (76.7%) | 2.88 |
| Single Male/Father | 98 (8.4%) | 3.78 |
| Single Female/Mother | 75 (6.5%) | 3.16 |
| Non-family | 97 (8.4%) | 1.88 |
| Total Households | 1,161 (100.0%) | 2.89 |
Household Size by Marriage Status in Robins
Out of a total of 1,161 households in Robins, 1,064 (91.6%) are family households, while 97 (8.4%) are nonfamily households. The most numerous type of family households are 2-person households, comprising 576, and the most common type of nonfamily households are 1-person households, comprising 64.
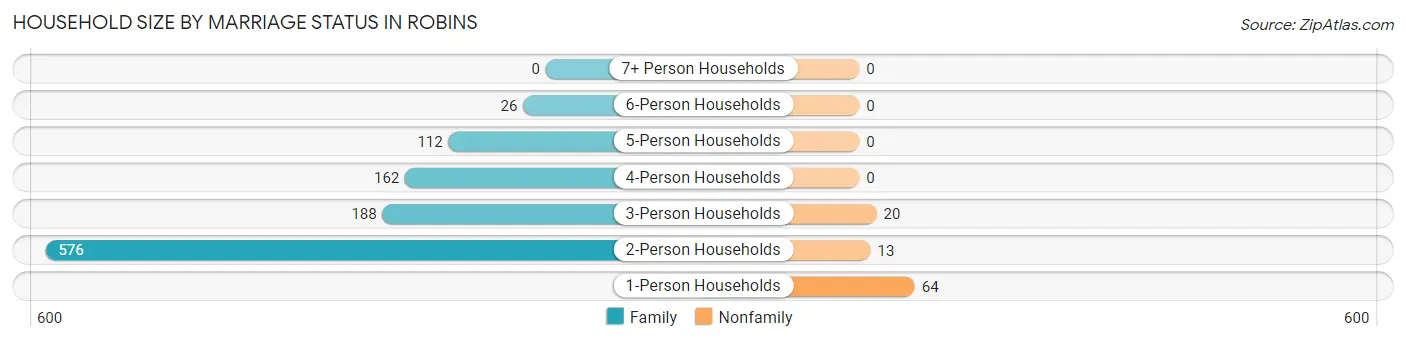
| Household Size | Family Households | Nonfamily Households |
| 1-Person Households | - | 64 (5.5%) |
| 2-Person Households | 576 (49.6%) | 13 (1.1%) |
| 3-Person Households | 188 (16.2%) | 20 (1.7%) |
| 4-Person Households | 162 (14.0%) | 0 (0.0%) |
| 5-Person Households | 112 (9.7%) | 0 (0.0%) |
| 6-Person Households | 26 (2.2%) | 0 (0.0%) |
| 7+ Person Households | 0 (0.0%) | 0 (0.0%) |
| Total | 1,064 (91.6%) | 97 (8.4%) |
Female Fertility in Robins
Fertility by Age in Robins
Average fertility rate in Robins is 78.0 births per 1,000 women. Women in the age bracket of 20 to 34 years have the highest fertility rate with 120.0 births per 1,000 women. Women in the age bracket of 35 to 50 years acount for 58.0% of all women with births.
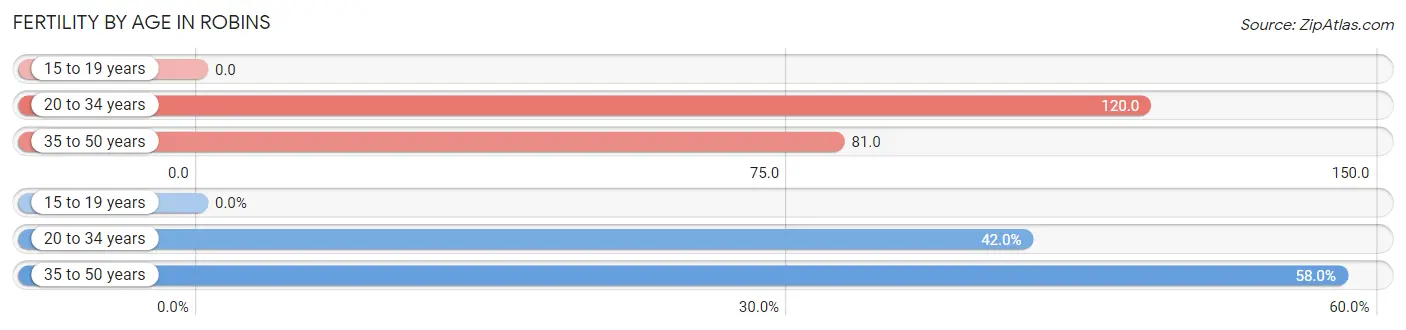
| Age Bracket | Women with Births | Births / 1,000 Women |
| 15 to 19 years | 0 (0.0%) | 0.0 |
| 20 to 34 years | 21 (42.0%) | 120.0 |
| 35 to 50 years | 29 (58.0%) | 81.0 |
| Total | 50 (100.0%) | 78.0 |
Fertility by Age by Marriage Status in Robins
58.0% of women with births (50) in Robins are married. The highest percentage of unmarried women with births falls into 35 to 50 years age bracket with 72.4% of them unmarried at the time of birth, while the lowest percentage of unmarried women with births belong to 20 to 34 years age bracket with 0.0% of them unmarried.
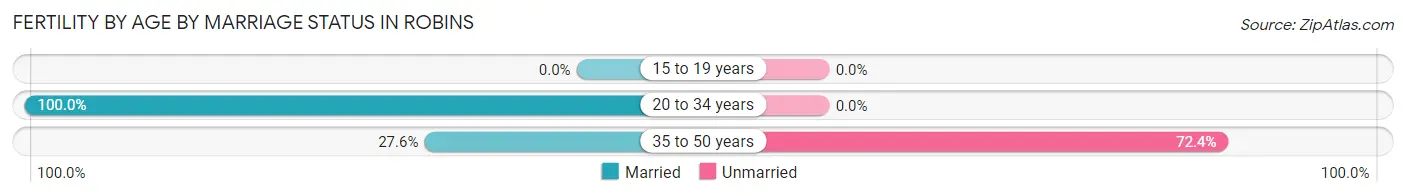
| Age Bracket | Married | Unmarried |
| 15 to 19 years | 0 (0.0%) | 0 (0.0%) |
| 20 to 34 years | 21 (100.0%) | 0 (0.0%) |
| 35 to 50 years | 8 (27.6%) | 21 (72.4%) |
| Total | 29 (58.0%) | 21 (42.0%) |
Fertility by Education in Robins
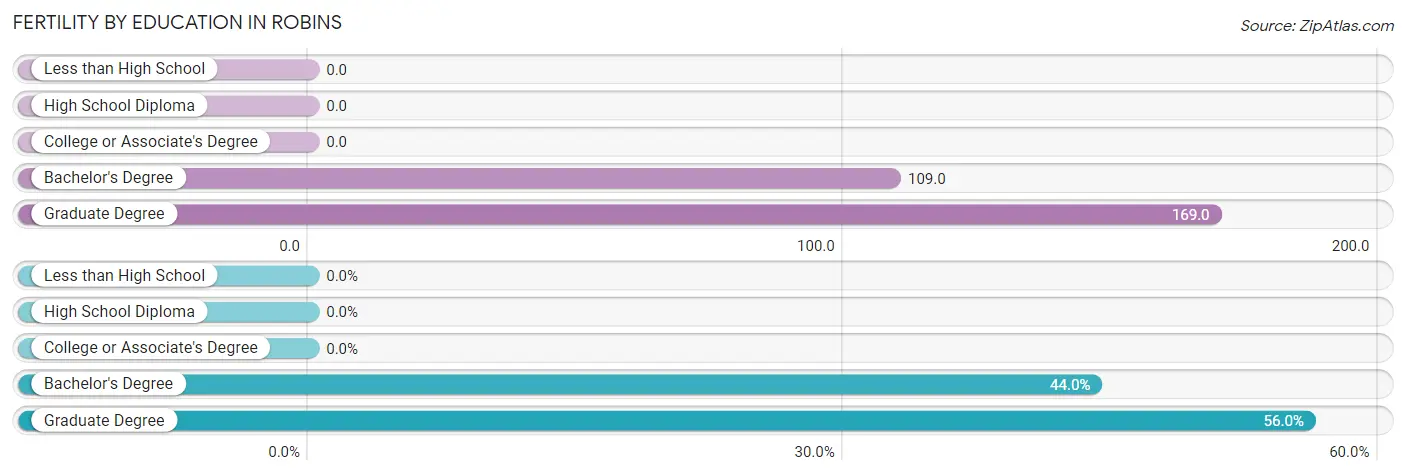
| Educational Attainment | Women with Births | Births / 1,000 Women |
| Less than High School | 0 (0.0%) | 0.0 |
| High School Diploma | 0 (0.0%) | 0.0 |
| College or Associate's Degree | 0 (0.0%) | 0.0 |
| Bachelor's Degree | 22 (44.0%) | 109.0 |
| Graduate Degree | 28 (56.0%) | 169.0 |
| Total | 50 (100.0%) | 78.0 |
Fertility by Education by Marriage Status in Robins
42.0% of women with births in Robins are unmarried. Women with the educational attainment of bachelor's degree are most likely to be married with 100.0% of them married at childbirth, while women with the educational attainment of graduate degree are least likely to be married with 75.0% of them unmarried at childbirth.
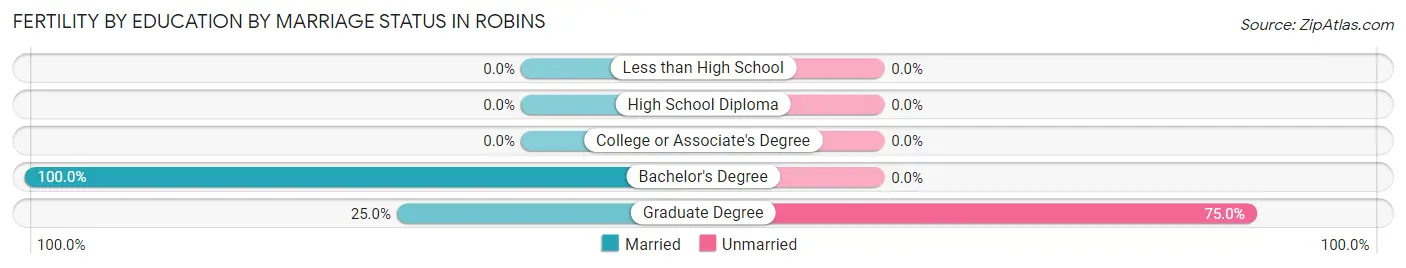
| Educational Attainment | Married | Unmarried |
| Less than High School | 0 (0.0%) | 0 (0.0%) |
| High School Diploma | 0 (0.0%) | 0 (0.0%) |
| College or Associate's Degree | 0 (0.0%) | 0 (0.0%) |
| Bachelor's Degree | 22 (100.0%) | 0 (0.0%) |
| Graduate Degree | 7 (25.0%) | 21 (75.0%) |
| Total | 29 (58.0%) | 21 (42.0%) |
Employment Characteristics in Robins
Employment by Class of Employer in Robins
Among the 1,529 employed individuals in Robins, private company employees (1,016 | 66.4%), not-for-profit organizations (146 | 9.6%), and local government employees (142 | 9.3%) make up the most common classes of employment.
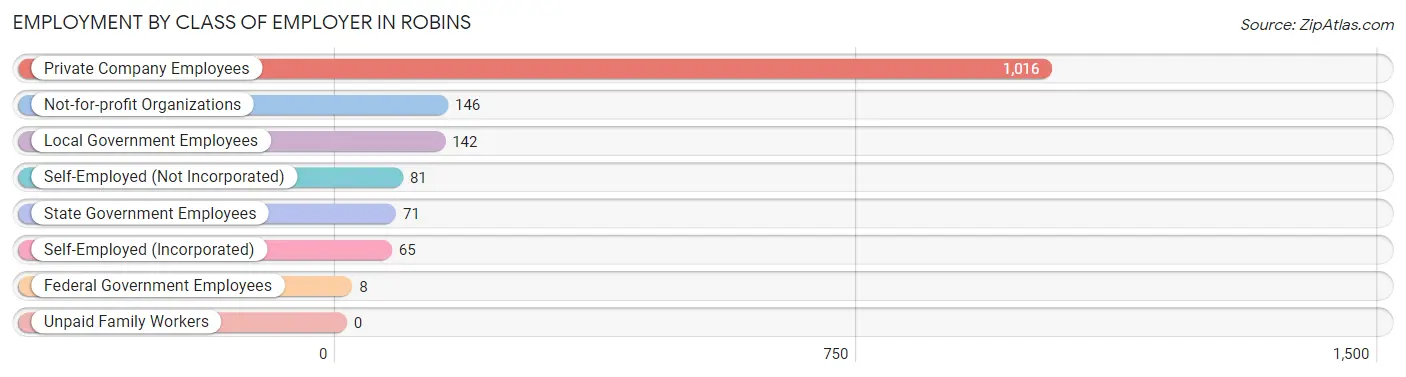
| Employer Class | # Employees | % Employees |
| Private Company Employees | 1,016 | 66.4% |
| Self-Employed (Incorporated) | 65 | 4.3% |
| Self-Employed (Not Incorporated) | 81 | 5.3% |
| Not-for-profit Organizations | 146 | 9.6% |
| Local Government Employees | 142 | 9.3% |
| State Government Employees | 71 | 4.6% |
| Federal Government Employees | 8 | 0.5% |
| Unpaid Family Workers | 0 | 0.0% |
| Total | 1,529 | 100.0% |
Employment Status by Age in Robins
According to the labor force statistics for Robins, out of the total population over 16 years of age (2,622), 64.4% or 1,689 individuals are in the labor force, with 6.8% or 115 of them unemployed. The age group with the highest labor force participation rate is 30 to 34 years, with 100.0% or 76 individuals in the labor force. Within the labor force, the 16 to 19 years age range has the highest percentage of unemployed individuals, with 32.5% or 40 of them being unemployed.
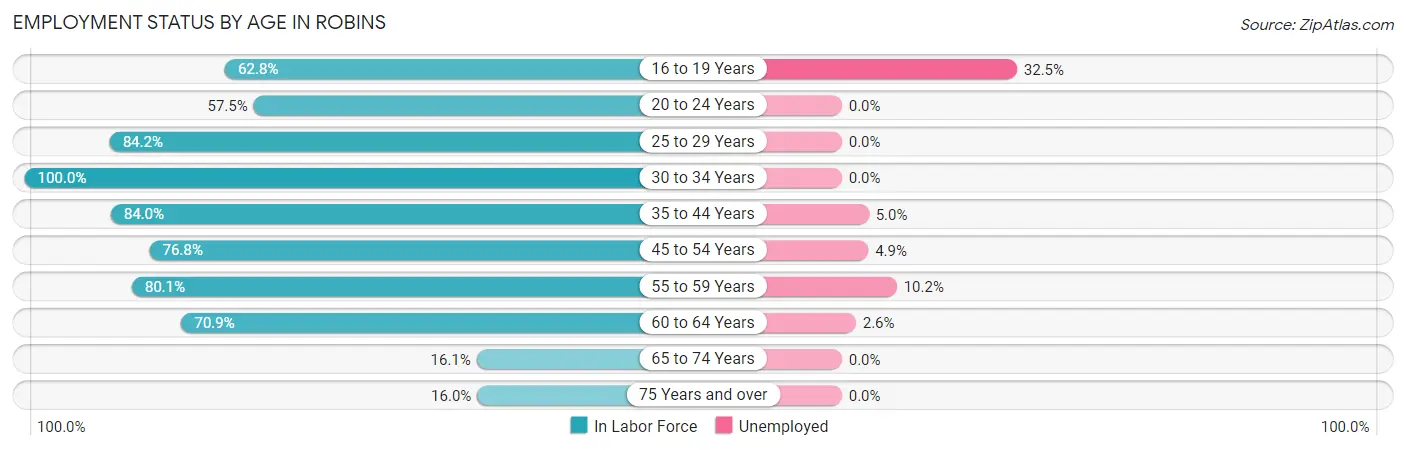
| Age Bracket | In Labor Force | Unemployed |
| 16 to 19 Years | 123 (62.8%) | 40 (32.5%) |
| 20 to 24 Years | 77 (57.5%) | 0 (0.0%) |
| 25 to 29 Years | 101 (84.2%) | 0 (0.0%) |
| 30 to 34 Years | 76 (100.0%) | 0 (0.0%) |
| 35 to 44 Years | 340 (84.0%) | 17 (5.0%) |
| 45 to 54 Years | 411 (76.8%) | 20 (4.9%) |
| 55 to 59 Years | 322 (80.1%) | 33 (10.2%) |
| 60 to 64 Years | 151 (70.9%) | 4 (2.6%) |
| 65 to 74 Years | 61 (16.1%) | 0 (0.0%) |
| 75 Years and over | 26 (16.0%) | 0 (0.0%) |
| Total | 1,689 (64.4%) | 115 (6.8%) |
Employment Status by Educational Attainment in Robins
According to labor force statistics for Robins, 80.0% of individuals (1,401) out of the total population between 25 and 64 years of age (1,751) are in the labor force, with 5.3% or 74 of them being unemployed. The group with the highest labor force participation rate are those with the educational attainment of less than high school, with 100.0% or 21 individuals in the labor force. Within the labor force, individuals with college / associate degree education have the highest percentage of unemployment, with 11.0% or 39 of them being unemployed.
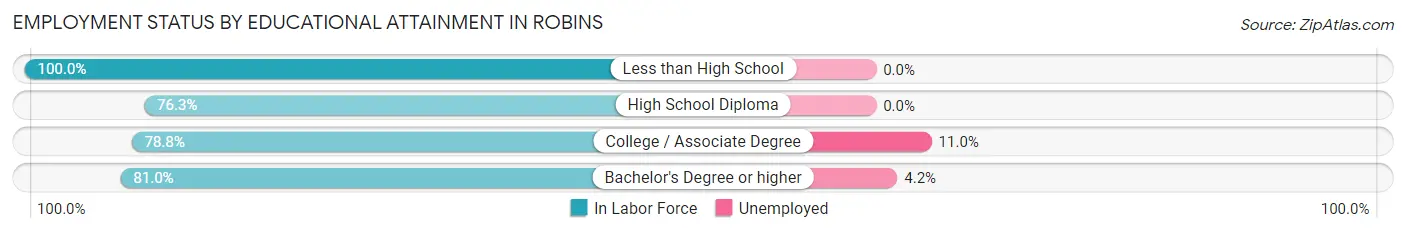
| Educational Attainment | In Labor Force | Unemployed |
| Less than High School | 21 (100.0%) | 0 (0.0%) |
| High School Diploma | 190 (76.3%) | 0 (0.0%) |
| College / Associate Degree | 356 (78.8%) | 50 (11.0%) |
| Bachelor's Degree or higher | 833 (81.0%) | 43 (4.2%) |
| Total | 1,401 (80.0%) | 93 (5.3%) |
Employment Occupations by Sex in Robins
Management, Business, Science and Arts Occupations
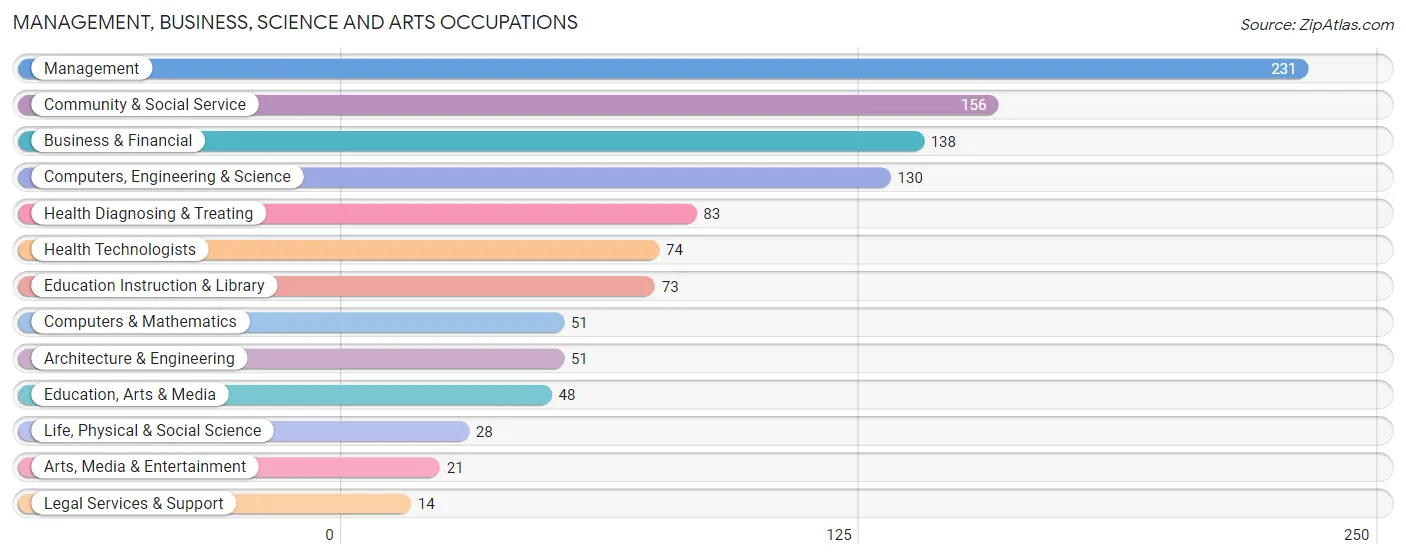
The most common Management, Business, Science and Arts occupations in Robins are Management (231 | 14.7%), Community & Social Service (156 | 9.9%), Business & Financial (138 | 8.8%), Computers, Engineering & Science (130 | 8.3%), and Health Diagnosing & Treating (83 | 5.3%).
Management, Business, Science and Arts Occupations by Sex
Within the Management, Business, Science and Arts occupations in Robins, the most male-oriented occupations are Computers & Mathematics (100.0%), Life, Physical & Social Science (78.6%), and Computers, Engineering & Science (73.9%), while the most female-oriented occupations are Education, Arts & Media (100.0%), Community & Social Service (82.1%), and Education Instruction & Library (79.4%).
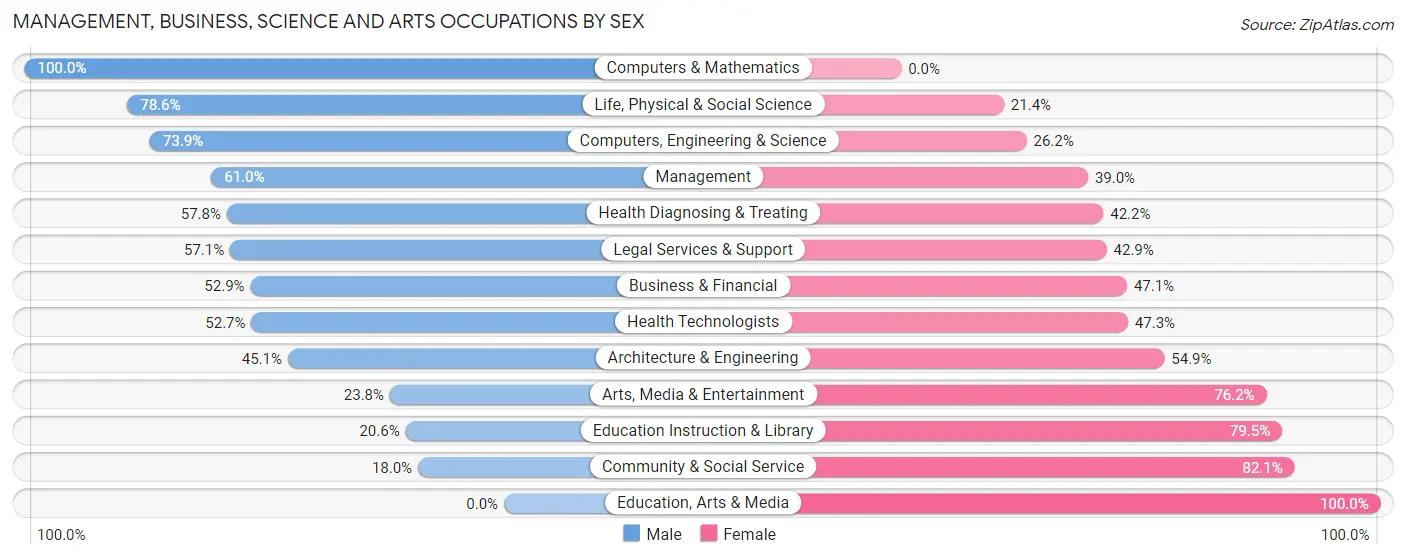
| Occupation | Male | Female |
| Management | 141 (61.0%) | 90 (39.0%) |
| Business & Financial | 73 (52.9%) | 65 (47.1%) |
| Computers, Engineering & Science | 96 (73.9%) | 34 (26.2%) |
| Computers & Mathematics | 51 (100.0%) | 0 (0.0%) |
| Architecture & Engineering | 23 (45.1%) | 28 (54.9%) |
| Life, Physical & Social Science | 22 (78.6%) | 6 (21.4%) |
| Community & Social Service | 28 (17.9%) | 128 (82.1%) |
| Education, Arts & Media | 0 (0.0%) | 48 (100.0%) |
| Legal Services & Support | 8 (57.1%) | 6 (42.9%) |
| Education Instruction & Library | 15 (20.5%) | 58 (79.4%) |
| Arts, Media & Entertainment | 5 (23.8%) | 16 (76.2%) |
| Health Diagnosing & Treating | 48 (57.8%) | 35 (42.2%) |
| Health Technologists | 39 (52.7%) | 35 (47.3%) |
| Total (Category) | 386 (52.3%) | 352 (47.7%) |
| Total (Overall) | 867 (55.1%) | 707 (44.9%) |
Services Occupations
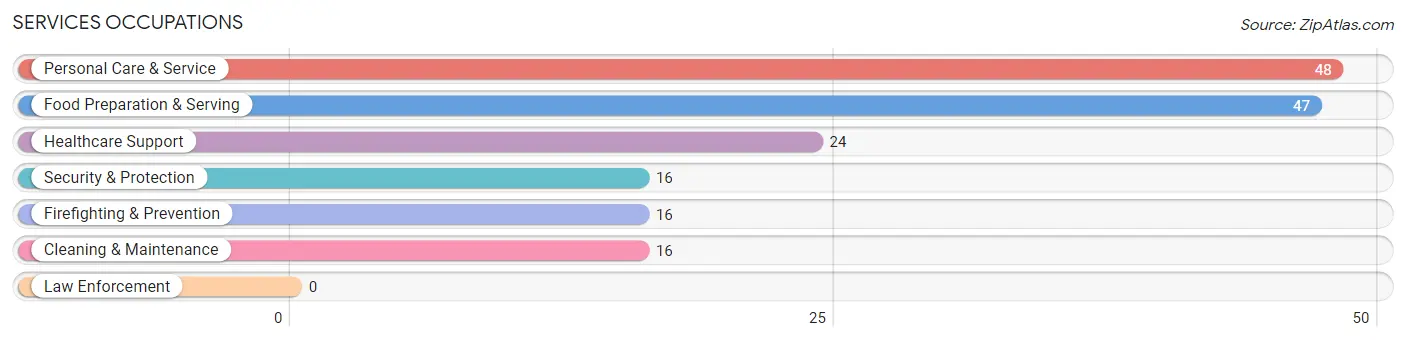
The most common Services occupations in Robins are Personal Care & Service (48 | 3.0%), Food Preparation & Serving (47 | 3.0%), Healthcare Support (24 | 1.5%), Security & Protection (16 | 1.0%), and Firefighting & Prevention (16 | 1.0%).
Services Occupations by Sex
Within the Services occupations in Robins, the most male-oriented occupations are Cleaning & Maintenance (100.0%), Healthcare Support (83.3%), and Food Preparation & Serving (12.8%), while the most female-oriented occupations are Security & Protection (100.0%), Firefighting & Prevention (100.0%), and Personal Care & Service (100.0%).
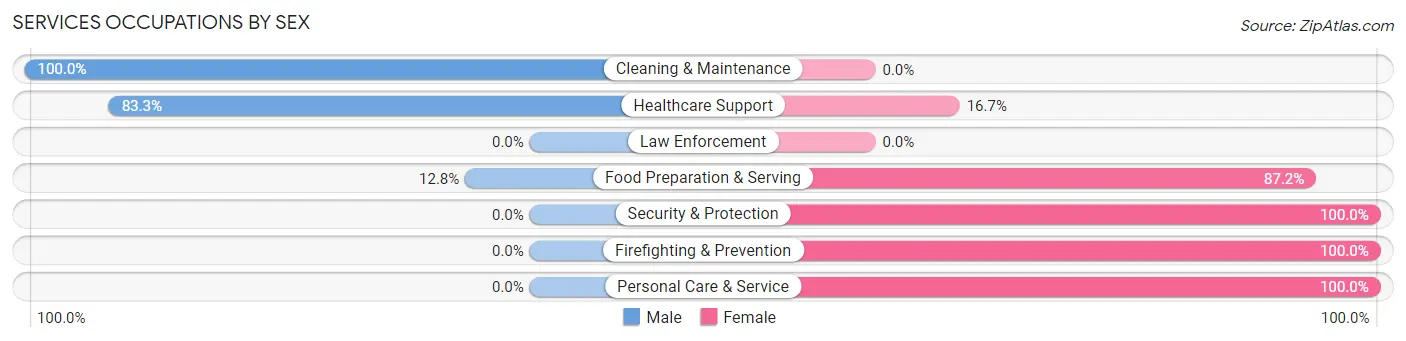
| Occupation | Male | Female |
| Healthcare Support | 20 (83.3%) | 4 (16.7%) |
| Security & Protection | 0 (0.0%) | 16 (100.0%) |
| Firefighting & Prevention | 0 (0.0%) | 16 (100.0%) |
| Law Enforcement | 0 (0.0%) | 0 (0.0%) |
| Food Preparation & Serving | 6 (12.8%) | 41 (87.2%) |
| Cleaning & Maintenance | 16 (100.0%) | 0 (0.0%) |
| Personal Care & Service | 0 (0.0%) | 48 (100.0%) |
| Total (Category) | 42 (27.8%) | 109 (72.2%) |
| Total (Overall) | 867 (55.1%) | 707 (44.9%) |
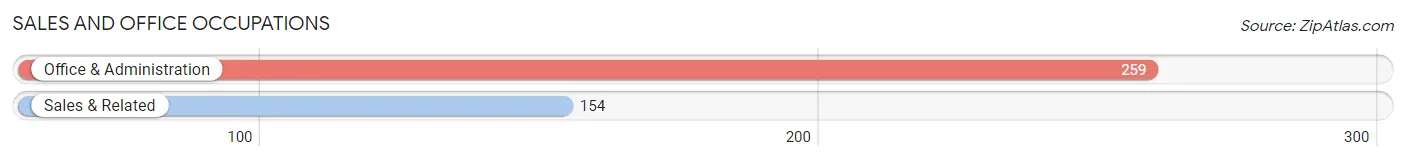
Sales and Office Occupations
The most common Sales and Office occupations in Robins are Office & Administration (259 | 16.5%), and Sales & Related (154 | 9.8%).
Sales and Office Occupations by Sex
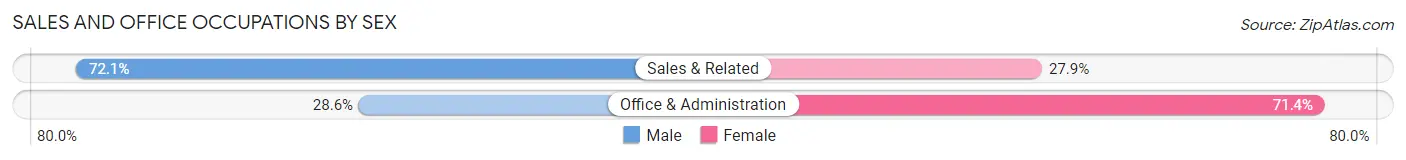
| Occupation | Male | Female |
| Sales & Related | 111 (72.1%) | 43 (27.9%) |
| Office & Administration | 74 (28.6%) | 185 (71.4%) |
| Total (Category) | 185 (44.8%) | 228 (55.2%) |
| Total (Overall) | 867 (55.1%) | 707 (44.9%) |
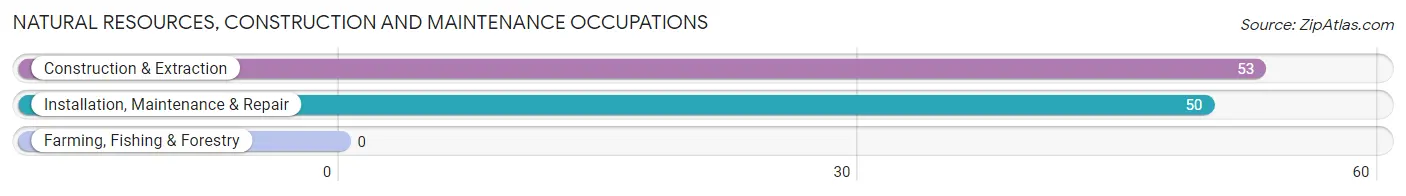
Natural Resources, Construction and Maintenance Occupations
The most common Natural Resources, Construction and Maintenance occupations in Robins are Construction & Extraction (53 | 3.4%), and Installation, Maintenance & Repair (50 | 3.2%).
Natural Resources, Construction and Maintenance Occupations by Sex
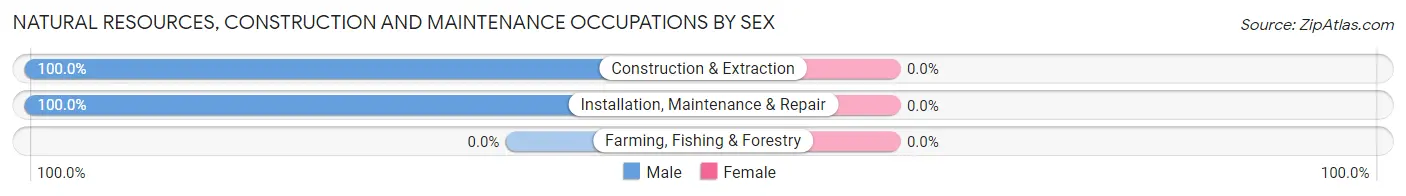
| Occupation | Male | Female |
| Farming, Fishing & Forestry | 0 (0.0%) | 0 (0.0%) |
| Construction & Extraction | 53 (100.0%) | 0 (0.0%) |
| Installation, Maintenance & Repair | 50 (100.0%) | 0 (0.0%) |
| Total (Category) | 103 (100.0%) | 0 (0.0%) |
| Total (Overall) | 867 (55.1%) | 707 (44.9%) |
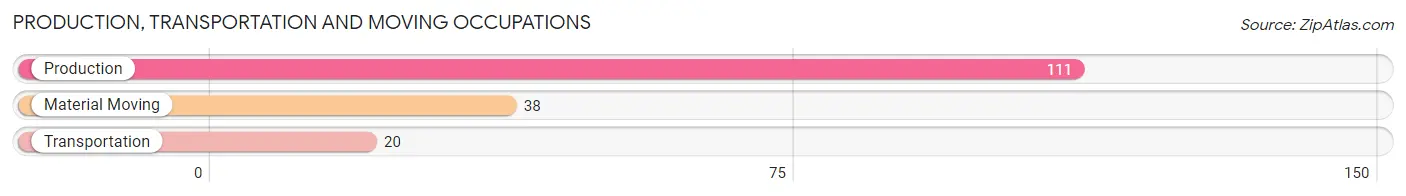
Production, Transportation and Moving Occupations
The most common Production, Transportation and Moving occupations in Robins are Production (111 | 7.0%), Material Moving (38 | 2.4%), and Transportation (20 | 1.3%).
Production, Transportation and Moving Occupations by Sex
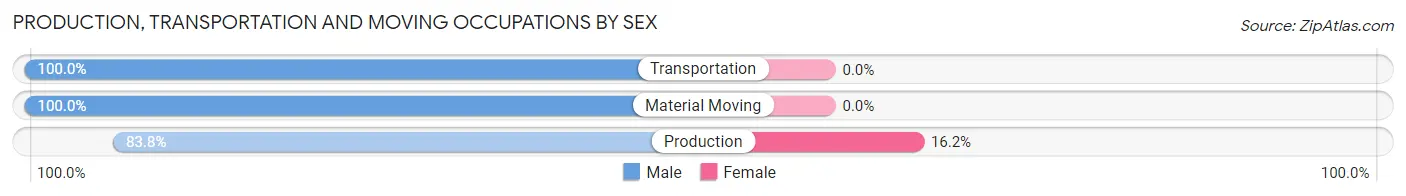
| Occupation | Male | Female |
| Production | 93 (83.8%) | 18 (16.2%) |
| Transportation | 20 (100.0%) | 0 (0.0%) |
| Material Moving | 38 (100.0%) | 0 (0.0%) |
| Total (Category) | 151 (89.3%) | 18 (10.6%) |
| Total (Overall) | 867 (55.1%) | 707 (44.9%) |
Employment Industries by Sex in Robins
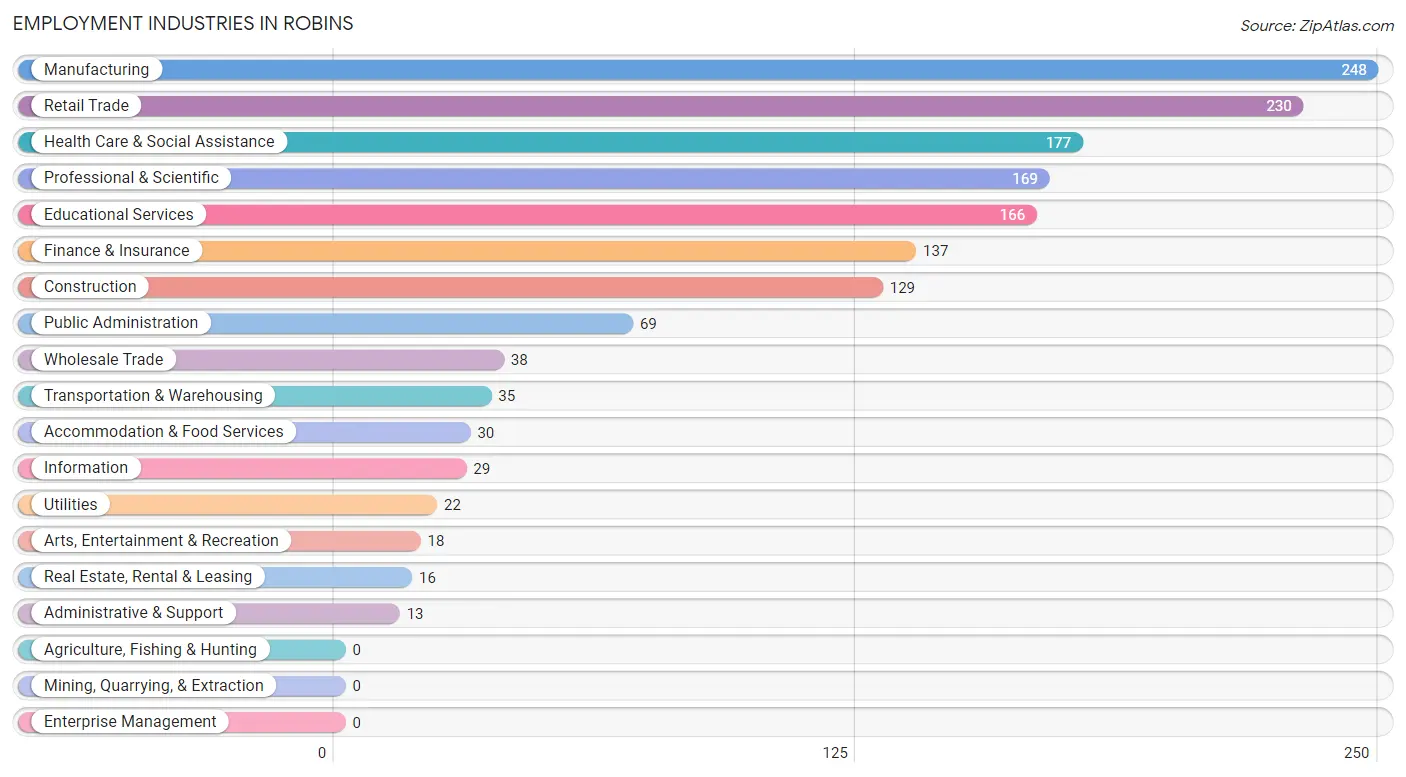
Employment Industries in Robins
The major employment industries in Robins include Manufacturing (248 | 15.8%), Retail Trade (230 | 14.6%), Health Care & Social Assistance (177 | 11.3%), Professional & Scientific (169 | 10.7%), and Educational Services (166 | 10.5%).
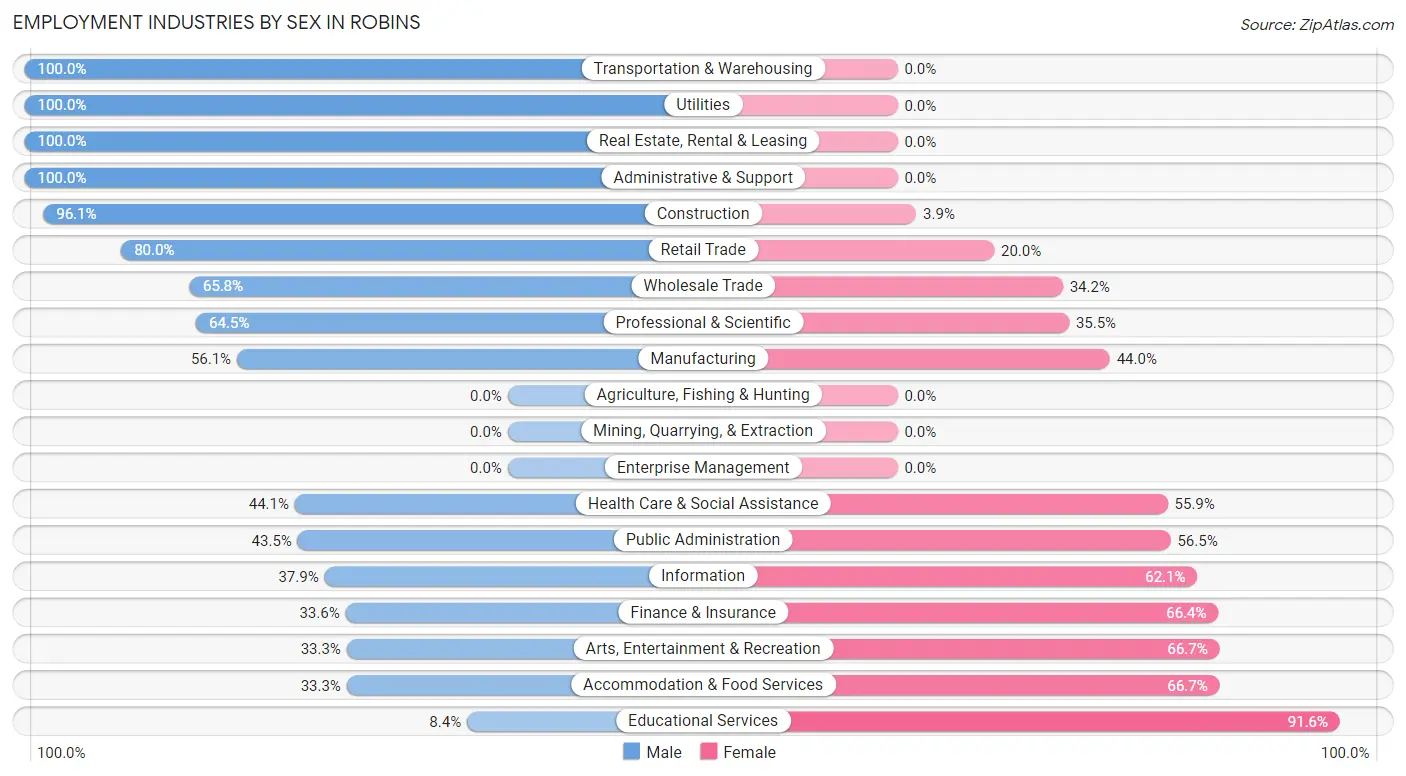
Employment Industries by Sex in Robins
The Robins industries that see more men than women are Transportation & Warehousing (100.0%), Utilities (100.0%), and Real Estate, Rental & Leasing (100.0%), whereas the industries that tend to have a higher number of women are Educational Services (91.6%), Arts, Entertainment & Recreation (66.7%), and Accommodation & Food Services (66.7%).
| Industry | Male | Female |
| Agriculture, Fishing & Hunting | 0 (0.0%) | 0 (0.0%) |
| Mining, Quarrying, & Extraction | 0 (0.0%) | 0 (0.0%) |
| Construction | 124 (96.1%) | 5 (3.9%) |
| Manufacturing | 139 (56.0%) | 109 (44.0%) |
| Wholesale Trade | 25 (65.8%) | 13 (34.2%) |
| Retail Trade | 184 (80.0%) | 46 (20.0%) |
| Transportation & Warehousing | 35 (100.0%) | 0 (0.0%) |
| Utilities | 22 (100.0%) | 0 (0.0%) |
| Information | 11 (37.9%) | 18 (62.1%) |
| Finance & Insurance | 46 (33.6%) | 91 (66.4%) |
| Real Estate, Rental & Leasing | 16 (100.0%) | 0 (0.0%) |
| Professional & Scientific | 109 (64.5%) | 60 (35.5%) |
| Enterprise Management | 0 (0.0%) | 0 (0.0%) |
| Administrative & Support | 13 (100.0%) | 0 (0.0%) |
| Educational Services | 14 (8.4%) | 152 (91.6%) |
| Health Care & Social Assistance | 78 (44.1%) | 99 (55.9%) |
| Arts, Entertainment & Recreation | 6 (33.3%) | 12 (66.7%) |
| Accommodation & Food Services | 10 (33.3%) | 20 (66.7%) |
| Public Administration | 30 (43.5%) | 39 (56.5%) |
| Total | 867 (55.1%) | 707 (44.9%) |
Education in Robins
School Enrollment in Robins
The most common levels of schooling among the 892 students in Robins are middle school (349 | 39.1%), high school (216 | 24.2%), and elementary school (150 | 16.8%).
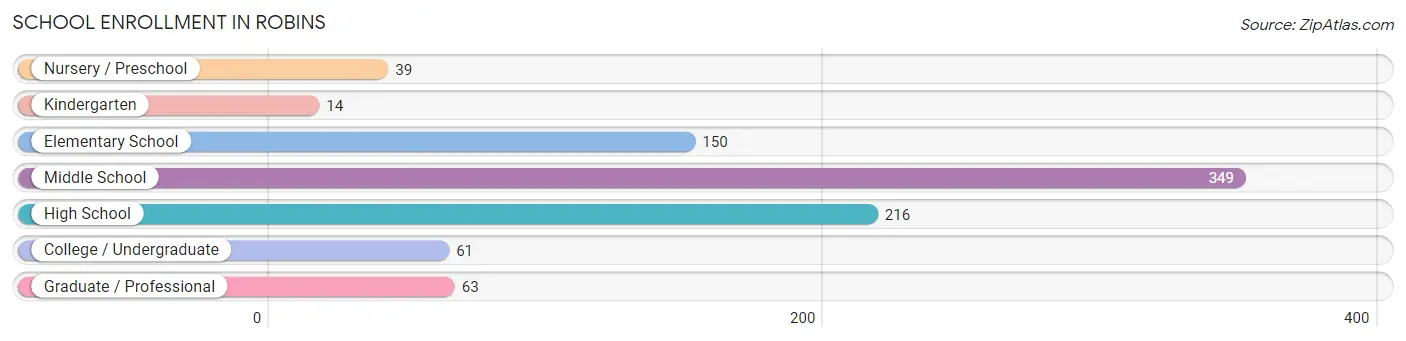
| School Level | # Students | % Students |
| Nursery / Preschool | 39 | 4.4% |
| Kindergarten | 14 | 1.6% |
| Elementary School | 150 | 16.8% |
| Middle School | 349 | 39.1% |
| High School | 216 | 24.2% |
| College / Undergraduate | 61 | 6.8% |
| Graduate / Professional | 63 | 7.1% |
| Total | 892 | 100.0% |
School Enrollment by Age by Funding Source in Robins
Out of a total of 892 students who are enrolled in schools in Robins, 230 (25.8%) attend a private institution, while the remaining 662 (74.2%) are enrolled in public schools. The age group of 18 to 19 year olds has the highest likelihood of being enrolled in private schools, with 16 (100.0% in the age bracket) enrolled. Conversely, the age group of 25 to 34 year olds has the lowest likelihood of being enrolled in a private school, with 15 (100.0% in the age bracket) attending a public institution.
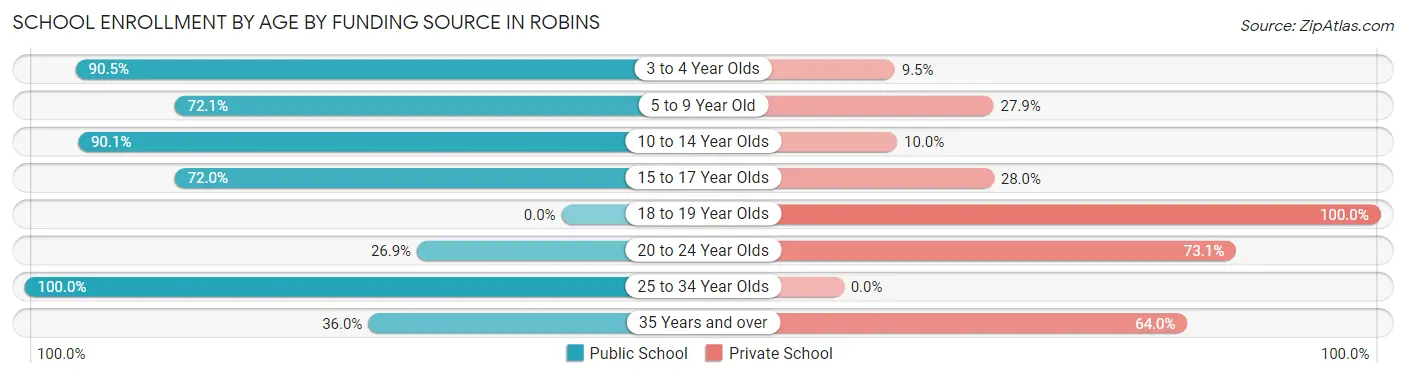
| Age Bracket | Public School | Private School |
| 3 to 4 Year Olds | 19 (90.5%) | 2 (9.5%) |
| 5 to 9 Year Old | 129 (72.1%) | 50 (27.9%) |
| 10 to 14 Year Olds | 335 (90.0%) | 37 (10.0%) |
| 15 to 17 Year Olds | 134 (72.0%) | 52 (28.0%) |
| 18 to 19 Year Olds | 0 (0.0%) | 16 (100.0%) |
| 20 to 24 Year Olds | 21 (26.9%) | 57 (73.1%) |
| 25 to 34 Year Olds | 15 (100.0%) | 0 (0.0%) |
| 35 Years and over | 9 (36.0%) | 16 (64.0%) |
| Total | 662 (74.2%) | 230 (25.8%) |
Educational Attainment by Field of Study in Robins
Business (347 | 26.6%), education (143 | 11.0%), engineering (141 | 10.8%), communications (141 | 10.8%), and arts & humanities (112 | 8.6%) are the most common fields of study among 1,305 individuals in Robins who have obtained a bachelor's degree or higher.
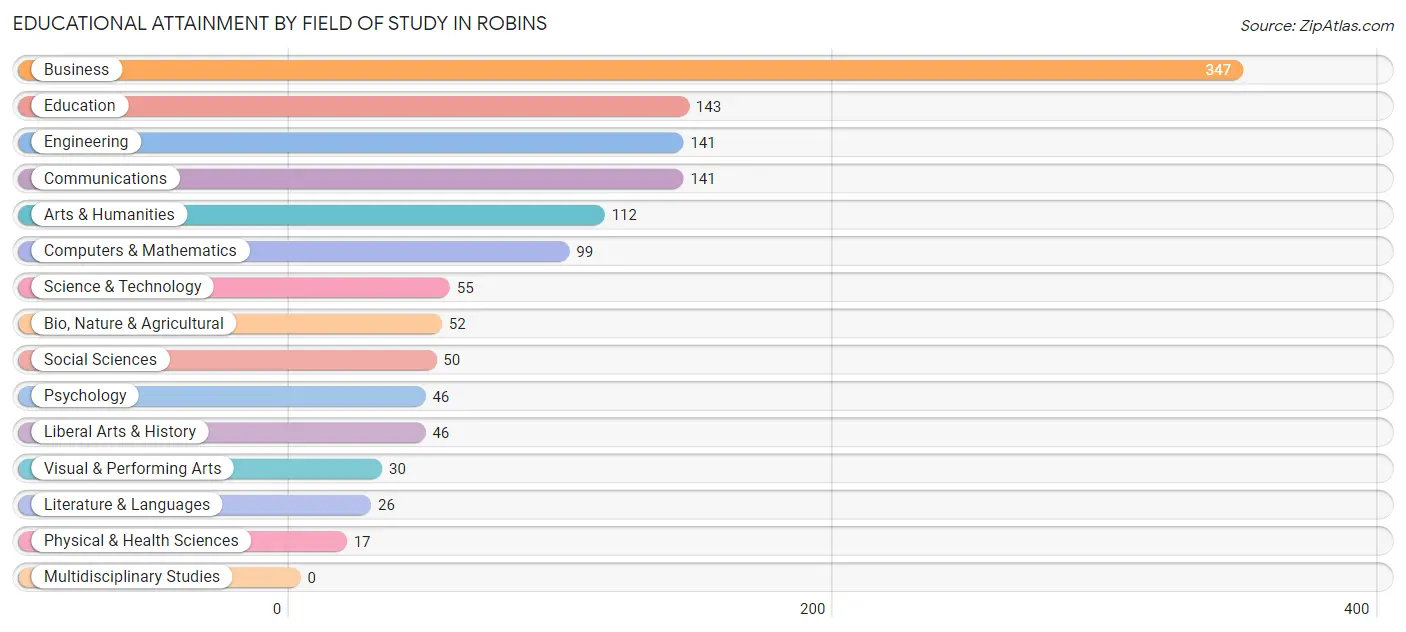
| Field of Study | # Graduates | % Graduates |
| Computers & Mathematics | 99 | 7.6% |
| Bio, Nature & Agricultural | 52 | 4.0% |
| Physical & Health Sciences | 17 | 1.3% |
| Psychology | 46 | 3.5% |
| Social Sciences | 50 | 3.8% |
| Engineering | 141 | 10.8% |
| Multidisciplinary Studies | 0 | 0.0% |
| Science & Technology | 55 | 4.2% |
| Business | 347 | 26.6% |
| Education | 143 | 11.0% |
| Literature & Languages | 26 | 2.0% |
| Liberal Arts & History | 46 | 3.5% |
| Visual & Performing Arts | 30 | 2.3% |
| Communications | 141 | 10.8% |
| Arts & Humanities | 112 | 8.6% |
| Total | 1,305 | 100.0% |
Transportation & Commute in Robins
Vehicle Availability by Sex in Robins
The most prevalent vehicle ownership categories in Robins are males with 2 vehicles (377, accounting for 43.7%) and females with 2 vehicles (250, making up 56.5%).
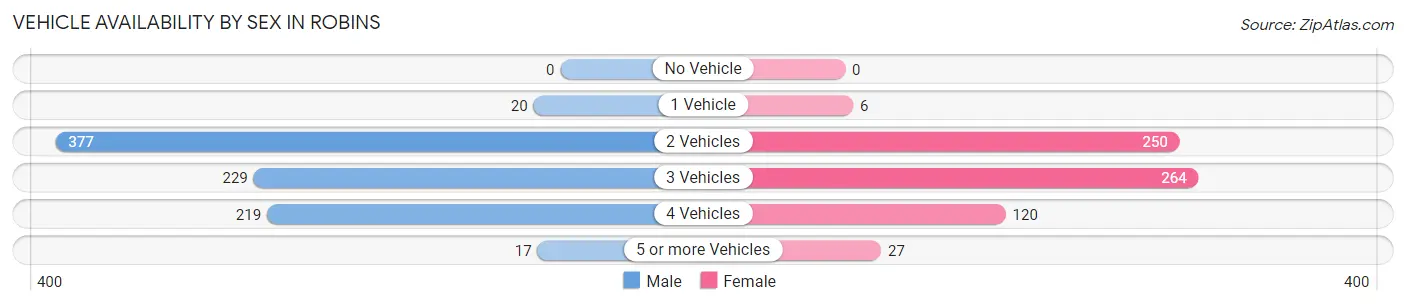
| Vehicles Available | Male | Female |
| No Vehicle | 0 (0.0%) | 0 (0.0%) |
| 1 Vehicle | 20 (2.3%) | 6 (0.9%) |
| 2 Vehicles | 377 (43.7%) | 250 (37.5%) |
| 3 Vehicles | 229 (26.6%) | 264 (39.6%) |
| 4 Vehicles | 219 (25.4%) | 120 (18.0%) |
| 5 or more Vehicles | 17 (2.0%) | 27 (4.1%) |
| Total | 862 (100.0%) | 667 (100.0%) |
Commute Time in Robins
The most frequently occuring commute durations in Robins are 10 to 14 minutes (396 commuters, 29.5%), 15 to 19 minutes (367 commuters, 27.4%), and 20 to 24 minutes (195 commuters, 14.5%).
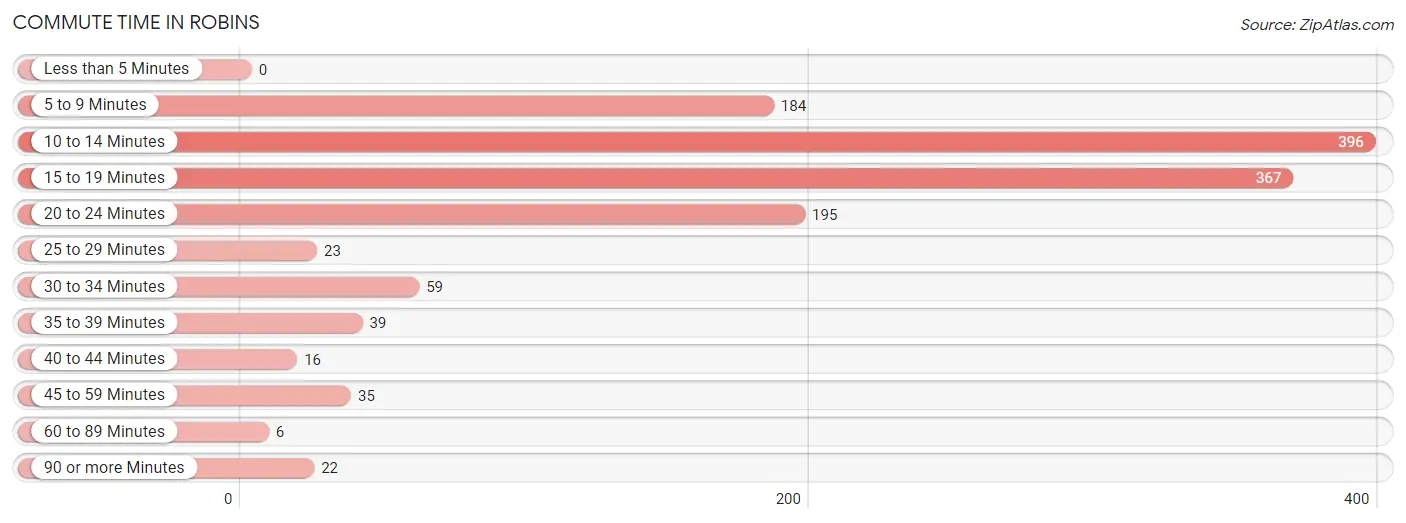
| Commute Time | # Commuters | % Commuters |
| Less than 5 Minutes | 0 | 0.0% |
| 5 to 9 Minutes | 184 | 13.7% |
| 10 to 14 Minutes | 396 | 29.5% |
| 15 to 19 Minutes | 367 | 27.4% |
| 20 to 24 Minutes | 195 | 14.5% |
| 25 to 29 Minutes | 23 | 1.7% |
| 30 to 34 Minutes | 59 | 4.4% |
| 35 to 39 Minutes | 39 | 2.9% |
| 40 to 44 Minutes | 16 | 1.2% |
| 45 to 59 Minutes | 35 | 2.6% |
| 60 to 89 Minutes | 6 | 0.4% |
| 90 or more Minutes | 22 | 1.6% |
Commute Time by Sex in Robins
The most common commute times in Robins are 10 to 14 minutes (211 commuters, 28.0%) for males and 10 to 14 minutes (185 commuters, 31.5%) for females.
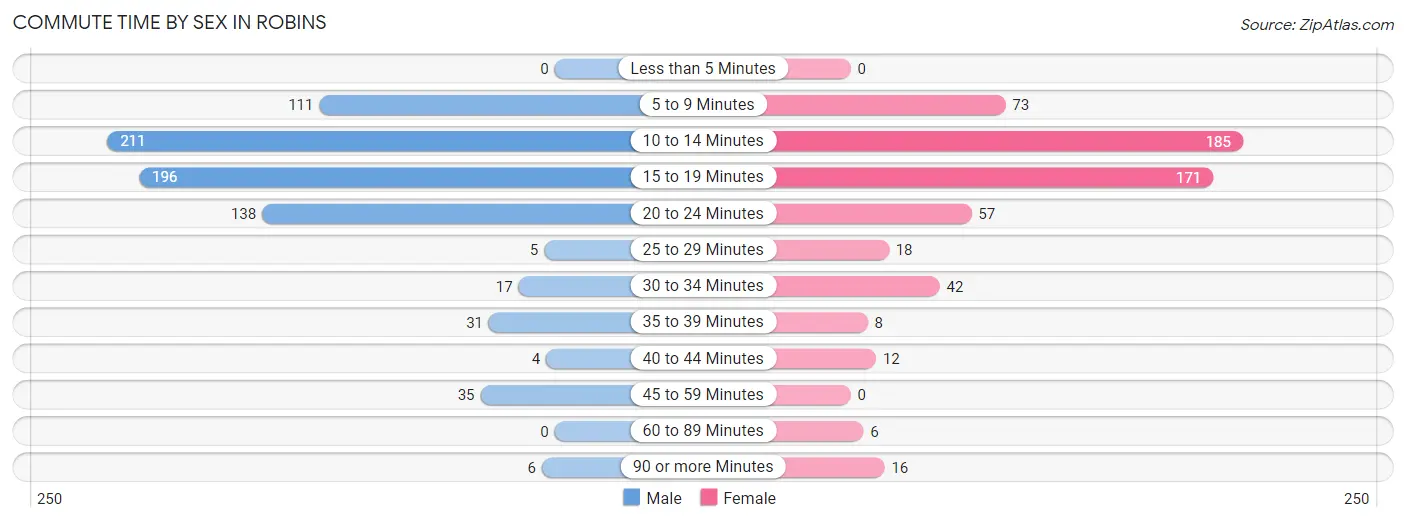
| Commute Time | Male | Female |
| Less than 5 Minutes | 0 (0.0%) | 0 (0.0%) |
| 5 to 9 Minutes | 111 (14.7%) | 73 (12.4%) |
| 10 to 14 Minutes | 211 (28.0%) | 185 (31.5%) |
| 15 to 19 Minutes | 196 (26.0%) | 171 (29.1%) |
| 20 to 24 Minutes | 138 (18.3%) | 57 (9.7%) |
| 25 to 29 Minutes | 5 (0.7%) | 18 (3.1%) |
| 30 to 34 Minutes | 17 (2.2%) | 42 (7.1%) |
| 35 to 39 Minutes | 31 (4.1%) | 8 (1.4%) |
| 40 to 44 Minutes | 4 (0.5%) | 12 (2.0%) |
| 45 to 59 Minutes | 35 (4.6%) | 0 (0.0%) |
| 60 to 89 Minutes | 0 (0.0%) | 6 (1.0%) |
| 90 or more Minutes | 6 (0.8%) | 16 (2.7%) |
Time of Departure to Work by Sex in Robins
The most frequent times of departure to work in Robins are 6:30 AM to 6:59 AM (155, 20.6%) for males and 7:30 AM to 7:59 AM (201, 34.2%) for females.
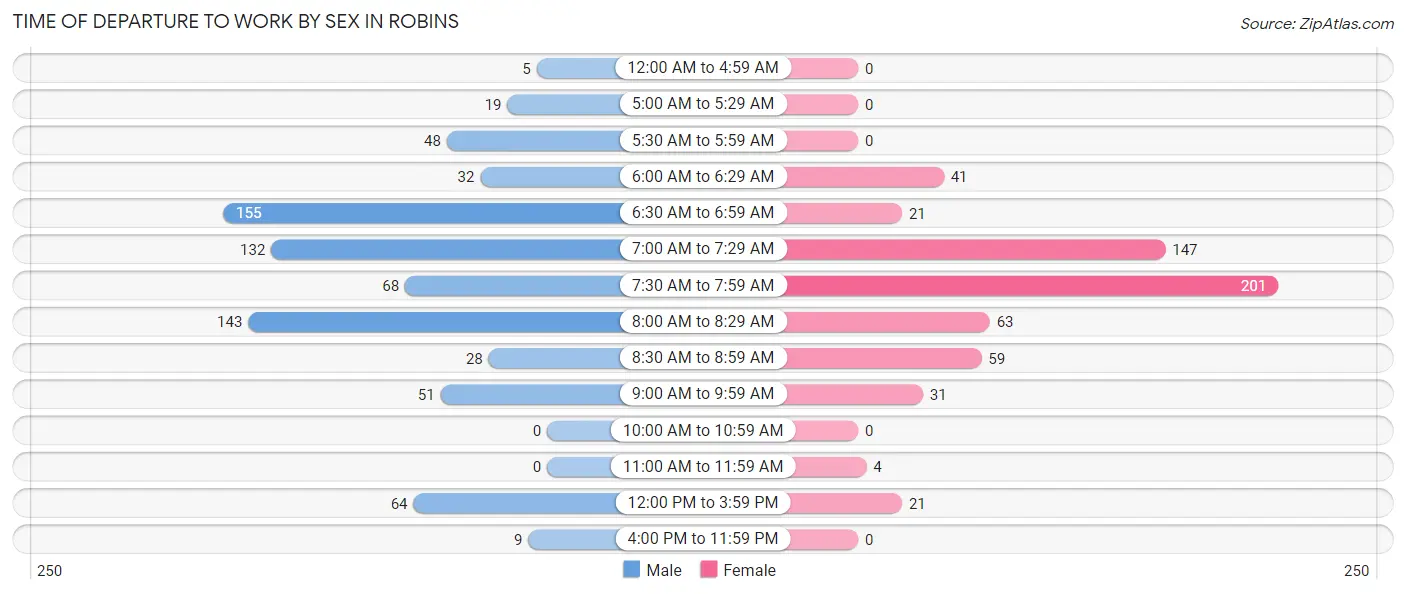
| Time of Departure | Male | Female |
| 12:00 AM to 4:59 AM | 5 (0.7%) | 0 (0.0%) |
| 5:00 AM to 5:29 AM | 19 (2.5%) | 0 (0.0%) |
| 5:30 AM to 5:59 AM | 48 (6.4%) | 0 (0.0%) |
| 6:00 AM to 6:29 AM | 32 (4.2%) | 41 (7.0%) |
| 6:30 AM to 6:59 AM | 155 (20.6%) | 21 (3.6%) |
| 7:00 AM to 7:29 AM | 132 (17.5%) | 147 (25.0%) |
| 7:30 AM to 7:59 AM | 68 (9.0%) | 201 (34.2%) |
| 8:00 AM to 8:29 AM | 143 (19.0%) | 63 (10.7%) |
| 8:30 AM to 8:59 AM | 28 (3.7%) | 59 (10.0%) |
| 9:00 AM to 9:59 AM | 51 (6.8%) | 31 (5.3%) |
| 10:00 AM to 10:59 AM | 0 (0.0%) | 0 (0.0%) |
| 11:00 AM to 11:59 AM | 0 (0.0%) | 4 (0.7%) |
| 12:00 PM to 3:59 PM | 64 (8.5%) | 21 (3.6%) |
| 4:00 PM to 11:59 PM | 9 (1.2%) | 0 (0.0%) |
| Total | 754 (100.0%) | 588 (100.0%) |
Housing Occupancy in Robins
Occupancy by Ownership in Robins
Of the total 1,161 dwellings in Robins, owner-occupied units account for 1,071 (92.2%), while renter-occupied units make up 90 (7.7%).
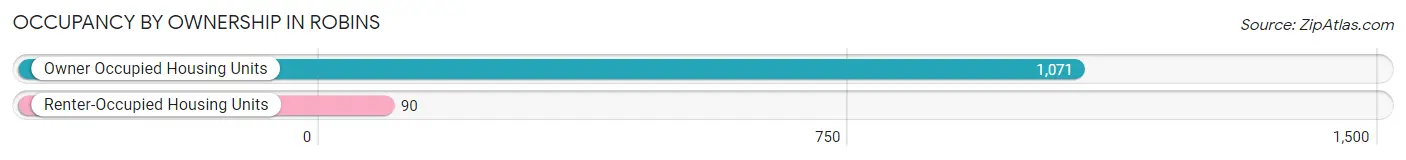
| Occupancy | # Housing Units | % Housing Units |
| Owner Occupied Housing Units | 1,071 | 92.2% |
| Renter-Occupied Housing Units | 90 | 7.7% |
| Total Occupied Housing Units | 1,161 | 100.0% |
Occupancy by Household Size in Robins
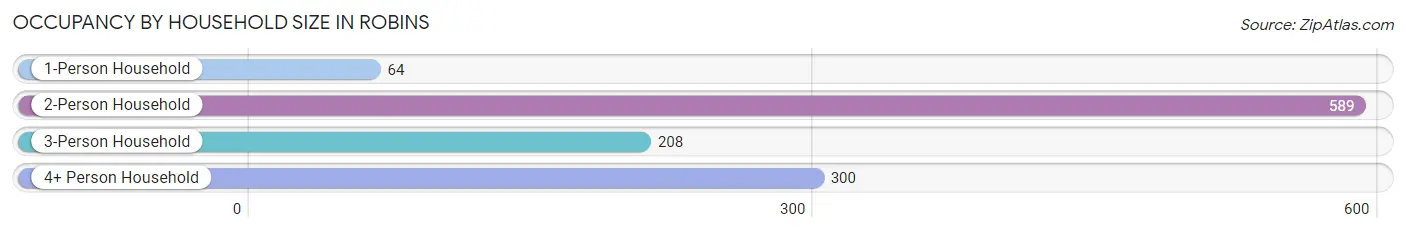
| Household Size | # Housing Units | % Housing Units |
| 1-Person Household | 64 | 5.5% |
| 2-Person Household | 589 | 50.7% |
| 3-Person Household | 208 | 17.9% |
| 4+ Person Household | 300 | 25.8% |
| Total Housing Units | 1,161 | 100.0% |
Occupancy by Ownership by Household Size in Robins
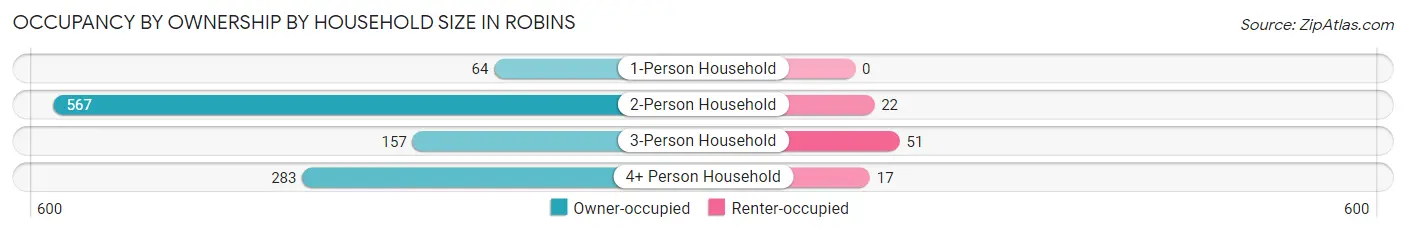
| Household Size | Owner-occupied | Renter-occupied |
| 1-Person Household | 64 (100.0%) | 0 (0.0%) |
| 2-Person Household | 567 (96.3%) | 22 (3.7%) |
| 3-Person Household | 157 (75.5%) | 51 (24.5%) |
| 4+ Person Household | 283 (94.3%) | 17 (5.7%) |
| Total Housing Units | 1,071 (92.2%) | 90 (7.7%) |
Occupancy by Educational Attainment in Robins
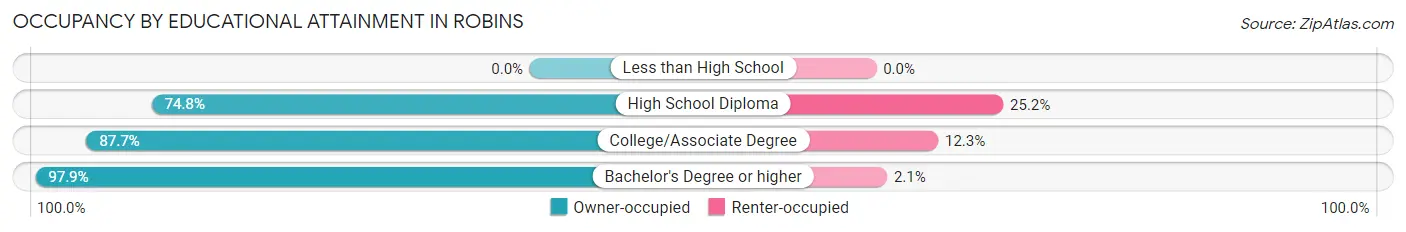
| Household Size | Owner-occupied | Renter-occupied |
| Less than High School | 0 (0.0%) | 0 (0.0%) |
| High School Diploma | 107 (74.8%) | 36 (25.2%) |
| College/Associate Degree | 279 (87.7%) | 39 (12.3%) |
| Bachelor's Degree or higher | 685 (97.9%) | 15 (2.1%) |
Occupancy by Age of Householder in Robins
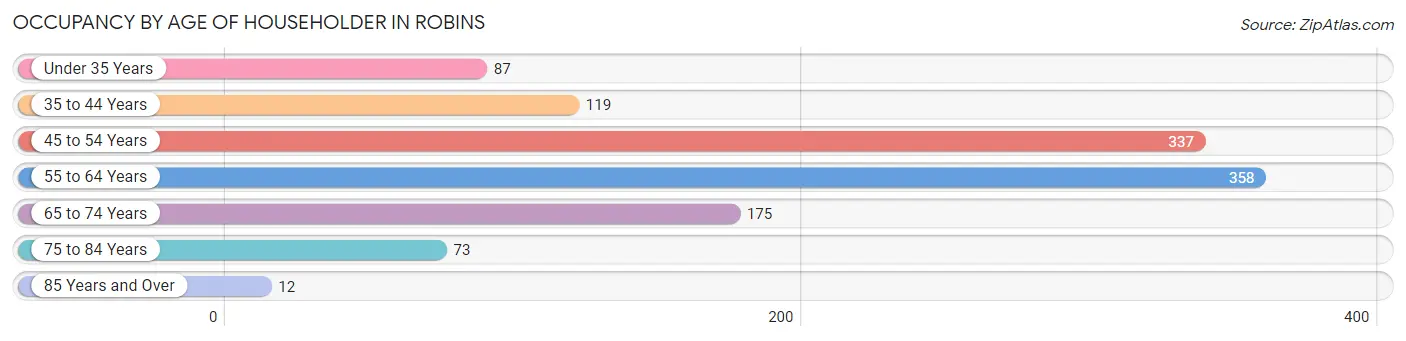
| Age Bracket | # Households | % Households |
| Under 35 Years | 87 | 7.5% |
| 35 to 44 Years | 119 | 10.2% |
| 45 to 54 Years | 337 | 29.0% |
| 55 to 64 Years | 358 | 30.8% |
| 65 to 74 Years | 175 | 15.1% |
| 75 to 84 Years | 73 | 6.3% |
| 85 Years and Over | 12 | 1.0% |
| Total | 1,161 | 100.0% |
Housing Finances in Robins
Median Income by Occupancy in Robins
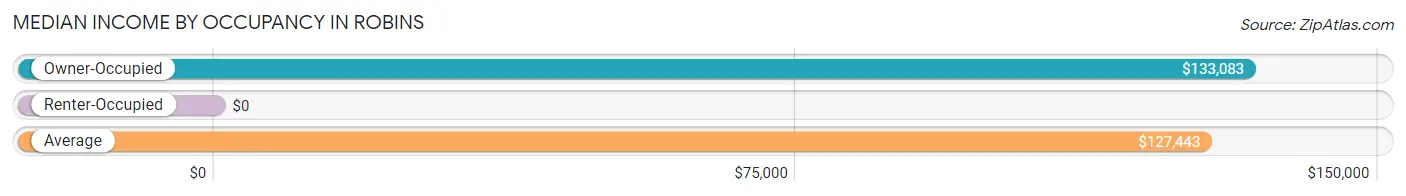
| Occupancy Type | # Households | Median Income |
| Owner-Occupied | 1,071 (92.2%) | $133,083 |
| Renter-Occupied | 90 (7.7%) | $0 |
| Average | 1,161 (100.0%) | $127,443 |
Occupancy by Householder Income Bracket in Robins
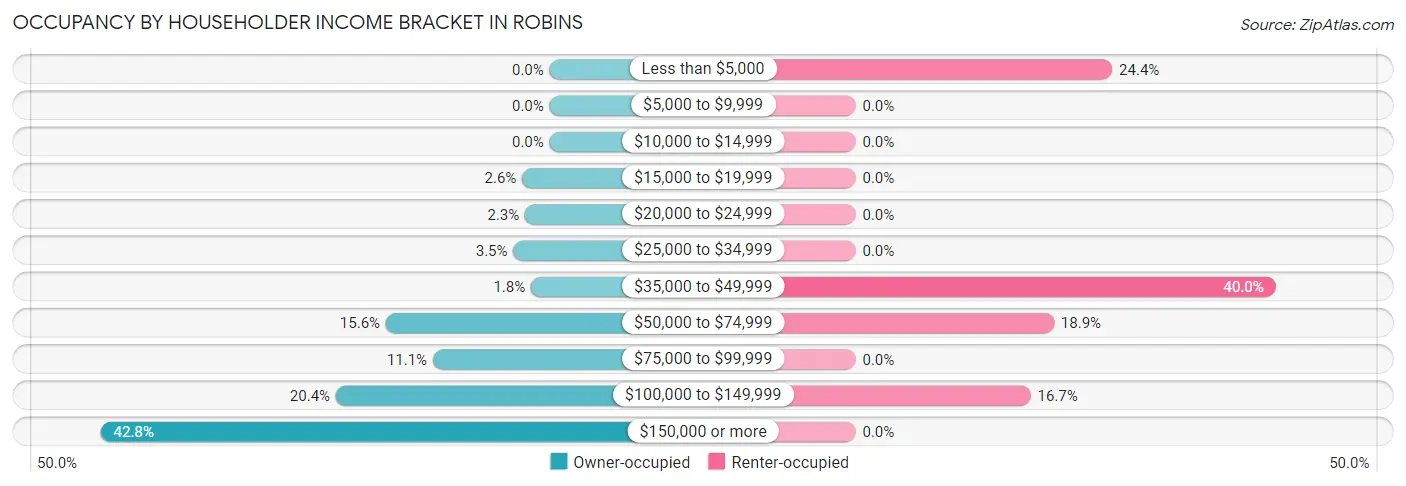
| Income Bracket | Owner-occupied | Renter-occupied |
| Less than $5,000 | 0 (0.0%) | 22 (24.4%) |
| $5,000 to $9,999 | 0 (0.0%) | 0 (0.0%) |
| $10,000 to $14,999 | 0 (0.0%) | 0 (0.0%) |
| $15,000 to $19,999 | 28 (2.6%) | 0 (0.0%) |
| $20,000 to $24,999 | 25 (2.3%) | 0 (0.0%) |
| $25,000 to $34,999 | 37 (3.5%) | 0 (0.0%) |
| $35,000 to $49,999 | 19 (1.8%) | 36 (40.0%) |
| $50,000 to $74,999 | 167 (15.6%) | 17 (18.9%) |
| $75,000 to $99,999 | 119 (11.1%) | 0 (0.0%) |
| $100,000 to $149,999 | 218 (20.3%) | 15 (16.7%) |
| $150,000 or more | 458 (42.8%) | 0 (0.0%) |
| Total | 1,071 (100.0%) | 90 (100.0%) |
Monthly Housing Cost Tiers in Robins
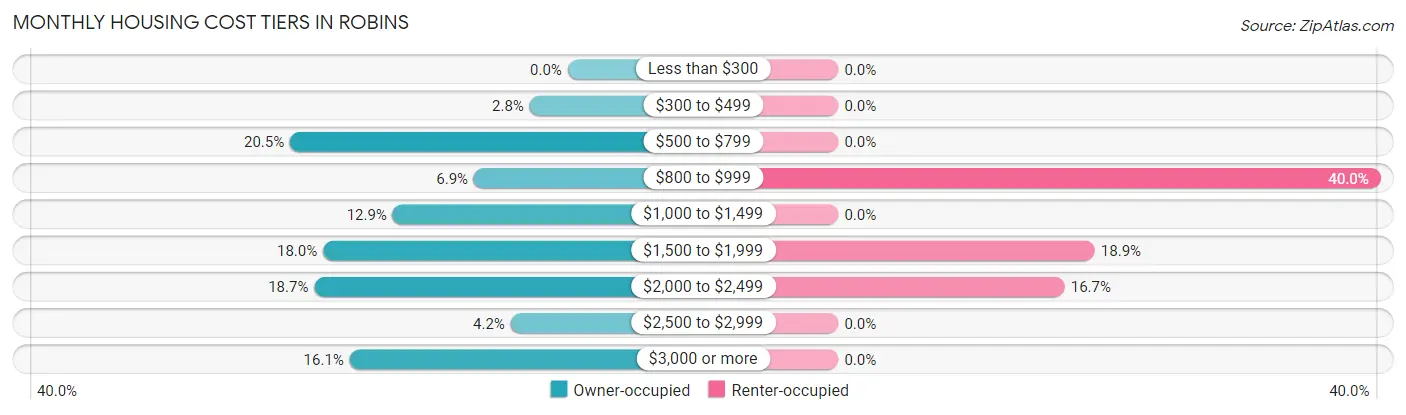
| Monthly Cost | Owner-occupied | Renter-occupied |
| Less than $300 | 0 (0.0%) | 0 (0.0%) |
| $300 to $499 | 30 (2.8%) | 0 (0.0%) |
| $500 to $799 | 219 (20.4%) | 0 (0.0%) |
| $800 to $999 | 74 (6.9%) | 36 (40.0%) |
| $1,000 to $1,499 | 138 (12.9%) | 0 (0.0%) |
| $1,500 to $1,999 | 193 (18.0%) | 17 (18.9%) |
| $2,000 to $2,499 | 200 (18.7%) | 15 (16.7%) |
| $2,500 to $2,999 | 45 (4.2%) | 0 (0.0%) |
| $3,000 or more | 172 (16.1%) | 0 (0.0%) |
| Total | 1,071 (100.0%) | 90 (100.0%) |
Physical Housing Characteristics in Robins
Housing Structures in Robins
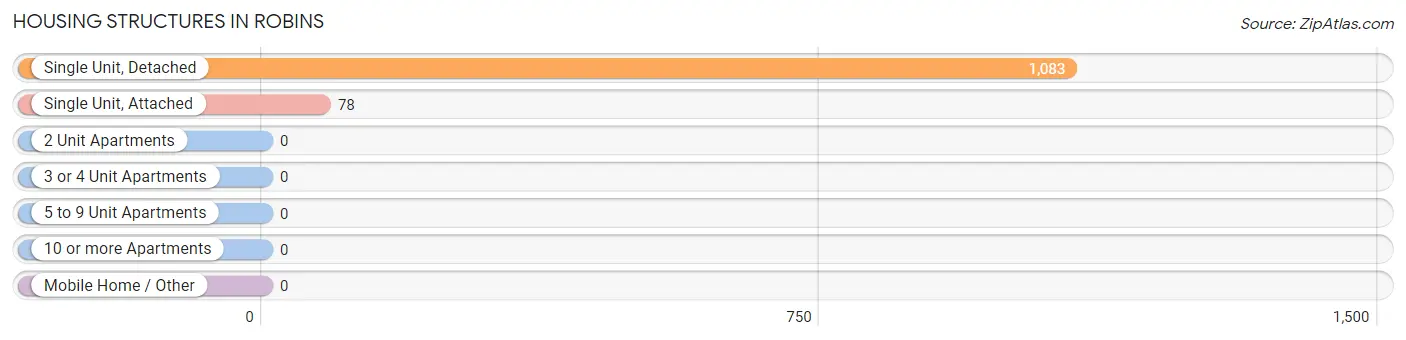
| Structure Type | # Housing Units | % Housing Units |
| Single Unit, Detached | 1,083 | 93.3% |
| Single Unit, Attached | 78 | 6.7% |
| 2 Unit Apartments | 0 | 0.0% |
| 3 or 4 Unit Apartments | 0 | 0.0% |
| 5 to 9 Unit Apartments | 0 | 0.0% |
| 10 or more Apartments | 0 | 0.0% |
| Mobile Home / Other | 0 | 0.0% |
| Total | 1,161 | 100.0% |
Housing Structures by Occupancy in Robins
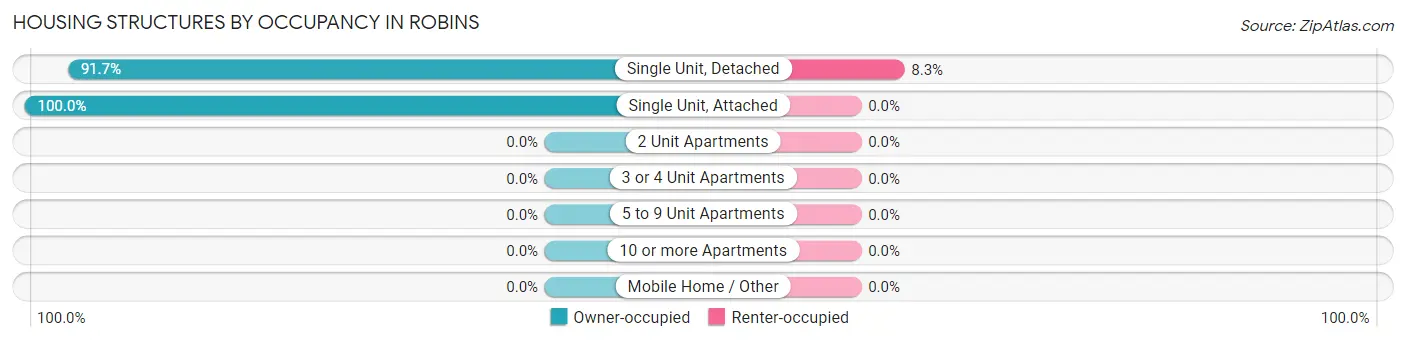
| Structure Type | Owner-occupied | Renter-occupied |
| Single Unit, Detached | 993 (91.7%) | 90 (8.3%) |
| Single Unit, Attached | 78 (100.0%) | 0 (0.0%) |
| 2 Unit Apartments | 0 (0.0%) | 0 (0.0%) |
| 3 or 4 Unit Apartments | 0 (0.0%) | 0 (0.0%) |
| 5 to 9 Unit Apartments | 0 (0.0%) | 0 (0.0%) |
| 10 or more Apartments | 0 (0.0%) | 0 (0.0%) |
| Mobile Home / Other | 0 (0.0%) | 0 (0.0%) |
| Total | 1,071 (92.2%) | 90 (7.7%) |
Housing Structures by Number of Rooms in Robins
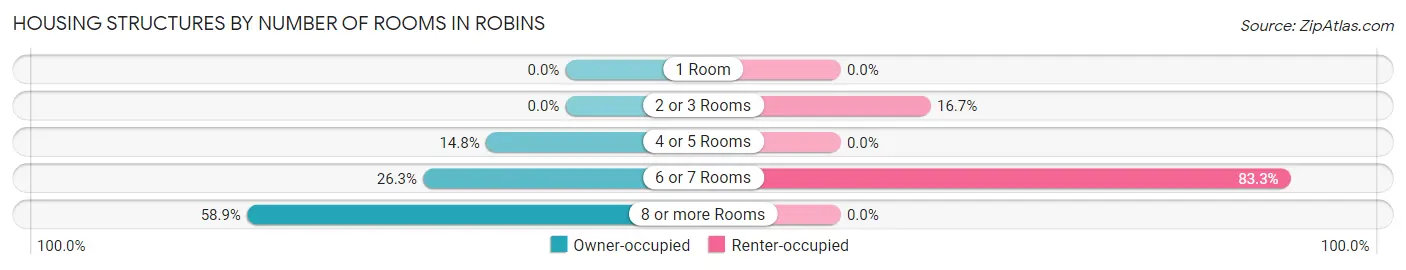
| Number of Rooms | Owner-occupied | Renter-occupied |
| 1 Room | 0 (0.0%) | 0 (0.0%) |
| 2 or 3 Rooms | 0 (0.0%) | 15 (16.7%) |
| 4 or 5 Rooms | 158 (14.7%) | 0 (0.0%) |
| 6 or 7 Rooms | 282 (26.3%) | 75 (83.3%) |
| 8 or more Rooms | 631 (58.9%) | 0 (0.0%) |
| Total | 1,071 (100.0%) | 90 (100.0%) |
Housing Structure by Heating Type in Robins
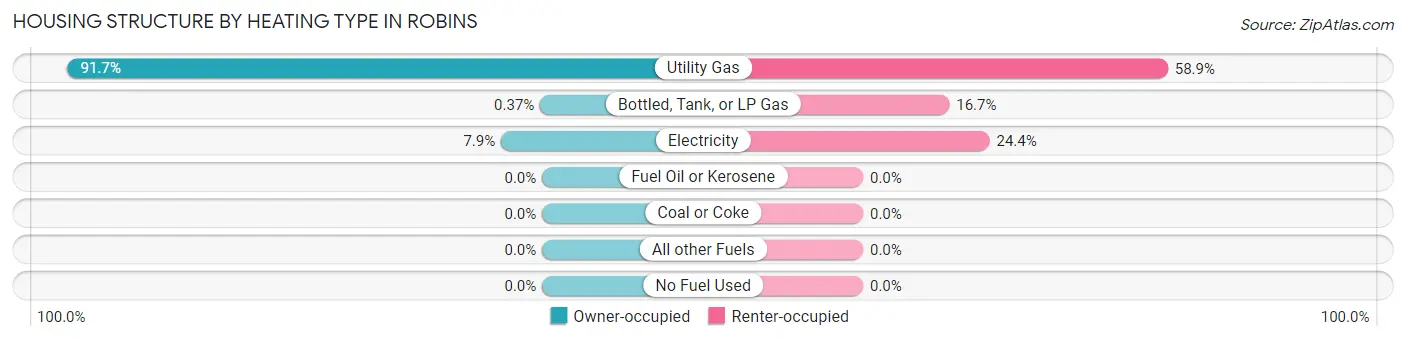
| Heating Type | Owner-occupied | Renter-occupied |
| Utility Gas | 982 (91.7%) | 53 (58.9%) |
| Bottled, Tank, or LP Gas | 4 (0.4%) | 15 (16.7%) |
| Electricity | 85 (7.9%) | 22 (24.4%) |
| Fuel Oil or Kerosene | 0 (0.0%) | 0 (0.0%) |
| Coal or Coke | 0 (0.0%) | 0 (0.0%) |
| All other Fuels | 0 (0.0%) | 0 (0.0%) |
| No Fuel Used | 0 (0.0%) | 0 (0.0%) |
| Total | 1,071 (100.0%) | 90 (100.0%) |
Household Vehicle Usage in Robins
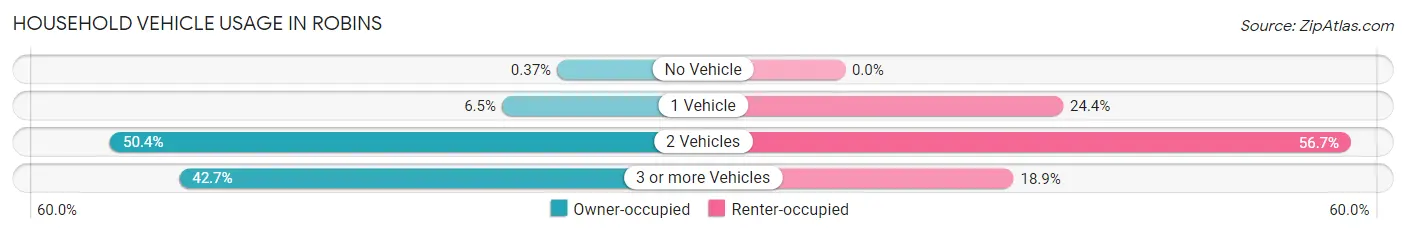
| Vehicles per Household | Owner-occupied | Renter-occupied |
| No Vehicle | 4 (0.4%) | 0 (0.0%) |
| 1 Vehicle | 70 (6.5%) | 22 (24.4%) |
| 2 Vehicles | 540 (50.4%) | 51 (56.7%) |
| 3 or more Vehicles | 457 (42.7%) | 17 (18.9%) |
| Total | 1,071 (100.0%) | 90 (100.0%) |
Real Estate & Mortgages in Robins
Real Estate and Mortgage Overview in Robins
| Characteristic | Without Mortgage | With Mortgage |
| Housing Units | 352 | 719 |
| Median Property Value | $315,800 | $357,700 |
| Median Household Income | $109,219 | $349 |
| Monthly Housing Costs | $702 | $172 |
| Real Estate Taxes | $4,592 | $0 |
Property Value by Mortgage Status in Robins
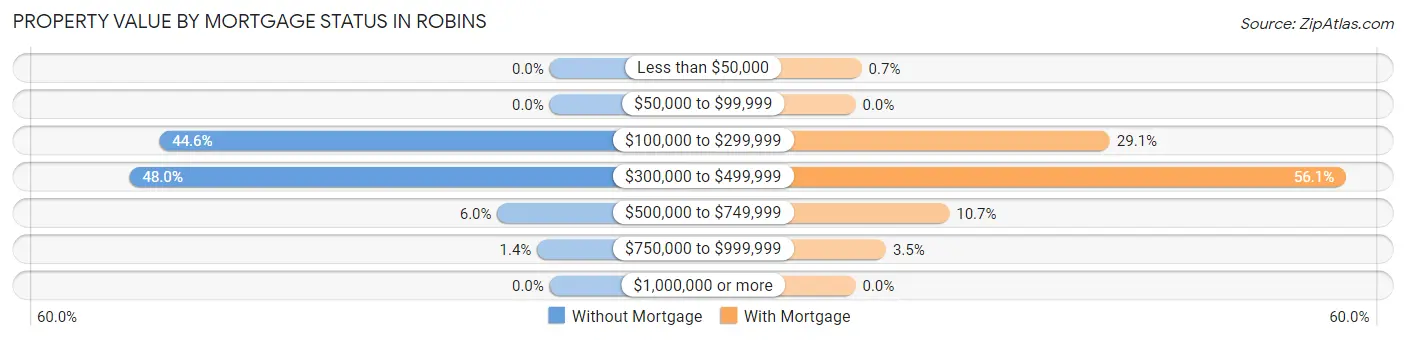
| Property Value | Without Mortgage | With Mortgage |
| Less than $50,000 | 0 (0.0%) | 5 (0.7%) |
| $50,000 to $99,999 | 0 (0.0%) | 0 (0.0%) |
| $100,000 to $299,999 | 157 (44.6%) | 209 (29.1%) |
| $300,000 to $499,999 | 169 (48.0%) | 403 (56.0%) |
| $500,000 to $749,999 | 21 (6.0%) | 77 (10.7%) |
| $750,000 to $999,999 | 5 (1.4%) | 25 (3.5%) |
| $1,000,000 or more | 0 (0.0%) | 0 (0.0%) |
| Total | 352 (100.0%) | 719 (100.0%) |
Household Income by Mortgage Status in Robins
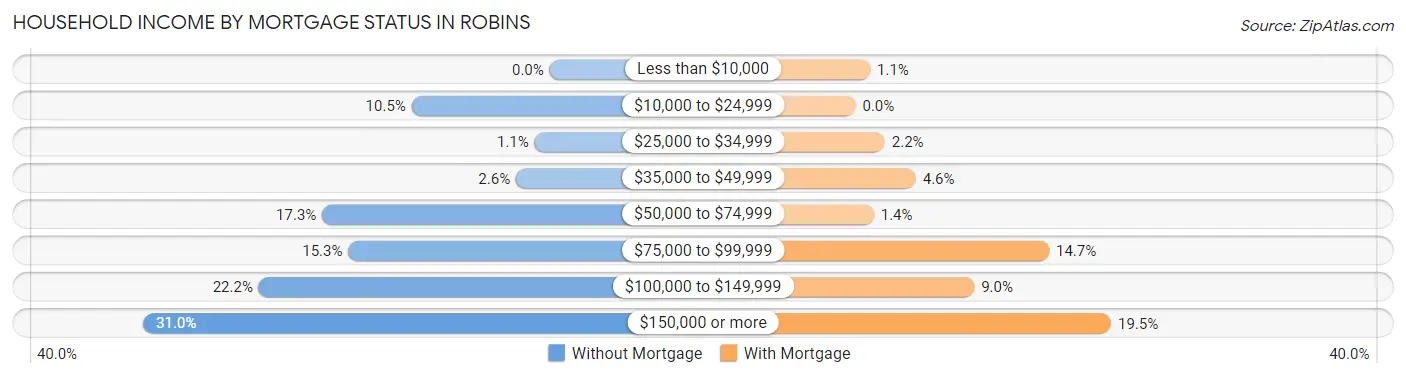
| Household Income | Without Mortgage | With Mortgage |
| Less than $10,000 | 0 (0.0%) | 8 (1.1%) |
| $10,000 to $24,999 | 37 (10.5%) | 0 (0.0%) |
| $25,000 to $34,999 | 4 (1.1%) | 16 (2.2%) |
| $35,000 to $49,999 | 9 (2.6%) | 33 (4.6%) |
| $50,000 to $74,999 | 61 (17.3%) | 10 (1.4%) |
| $75,000 to $99,999 | 54 (15.3%) | 106 (14.7%) |
| $100,000 to $149,999 | 78 (22.2%) | 65 (9.0%) |
| $150,000 or more | 109 (31.0%) | 140 (19.5%) |
| Total | 352 (100.0%) | 719 (100.0%) |
Property Value to Household Income Ratio in Robins
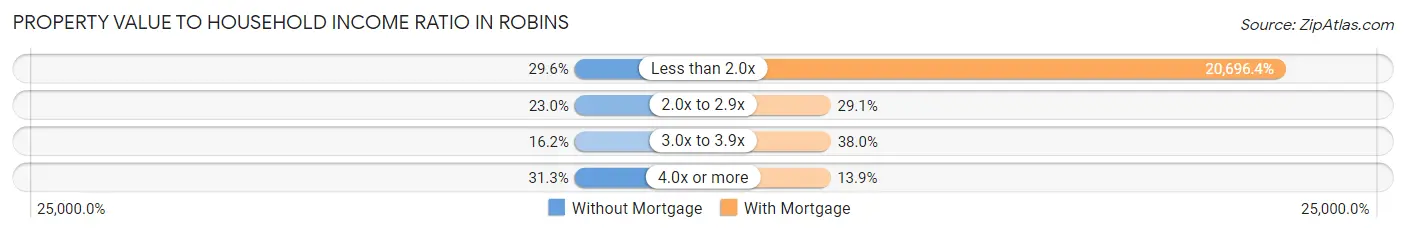
| Value-to-Income Ratio | Without Mortgage | With Mortgage |
| Less than 2.0x | 104 (29.5%) | 148,807 (20,696.4%) |
| 2.0x to 2.9x | 81 (23.0%) | 209 (29.1%) |
| 3.0x to 3.9x | 57 (16.2%) | 273 (38.0%) |
| 4.0x or more | 110 (31.2%) | 100 (13.9%) |
| Total | 352 (100.0%) | 719 (100.0%) |
Real Estate Taxes by Mortgage Status in Robins
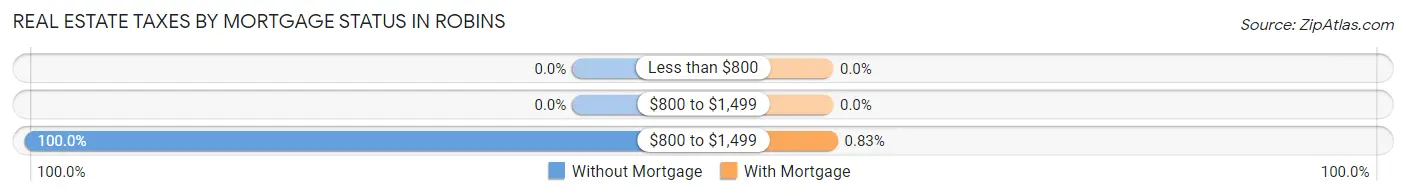
| Property Taxes | Without Mortgage | With Mortgage |
| Less than $800 | 0 (0.0%) | 0 (0.0%) |
| $800 to $1,499 | 0 (0.0%) | 0 (0.0%) |
| $800 to $1,499 | 352 (100.0%) | 6 (0.8%) |
| Total | 352 (100.0%) | 719 (100.0%) |
Health & Disability in Robins
Health Insurance Coverage by Age in Robins
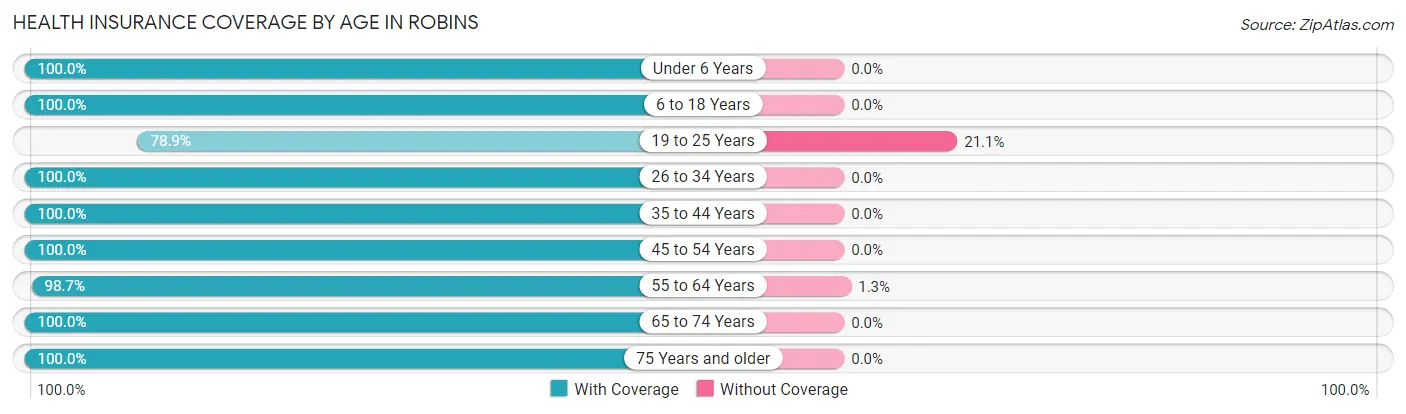
| Age Bracket | With Coverage | Without Coverage |
| Under 6 Years | 137 (100.0%) | 0 (0.0%) |
| 6 to 18 Years | 742 (100.0%) | 0 (0.0%) |
| 19 to 25 Years | 146 (78.9%) | 39 (21.1%) |
| 26 to 34 Years | 196 (100.0%) | 0 (0.0%) |
| 35 to 44 Years | 405 (100.0%) | 0 (0.0%) |
| 45 to 54 Years | 535 (100.0%) | 0 (0.0%) |
| 55 to 64 Years | 607 (98.7%) | 8 (1.3%) |
| 65 to 74 Years | 378 (100.0%) | 0 (0.0%) |
| 75 Years and older | 163 (100.0%) | 0 (0.0%) |
| Total | 3,309 (98.6%) | 47 (1.4%) |
Health Insurance Coverage by Citizenship Status in Robins
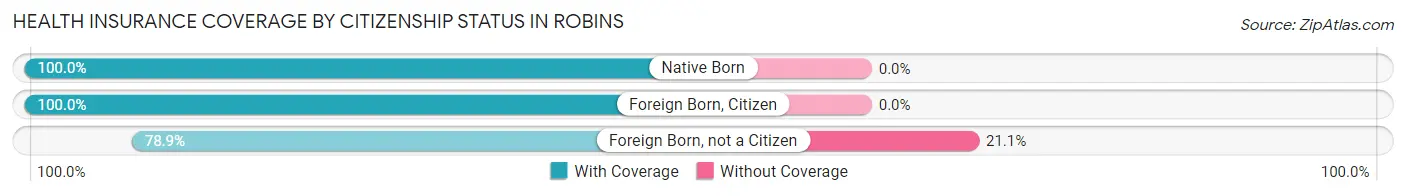
| Citizenship Status | With Coverage | Without Coverage |
| Native Born | 137 (100.0%) | 0 (0.0%) |
| Foreign Born, Citizen | 742 (100.0%) | 0 (0.0%) |
| Foreign Born, not a Citizen | 146 (78.9%) | 39 (21.1%) |
Health Insurance Coverage by Household Income in Robins
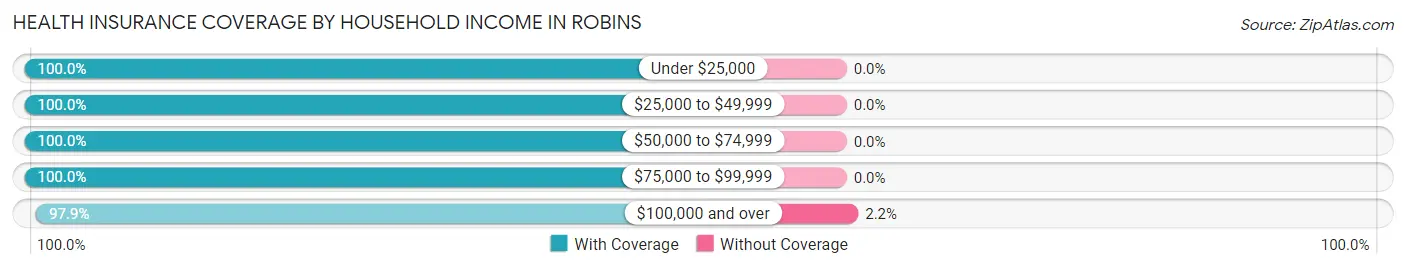
| Household Income | With Coverage | Without Coverage |
| Under $25,000 | 132 (100.0%) | 0 (0.0%) |
| $25,000 to $49,999 | 309 (100.0%) | 0 (0.0%) |
| $50,000 to $74,999 | 483 (100.0%) | 0 (0.0%) |
| $75,000 to $99,999 | 244 (100.0%) | 0 (0.0%) |
| $100,000 and over | 2,141 (97.9%) | 47 (2.1%) |
Public vs Private Health Insurance Coverage by Age in Robins
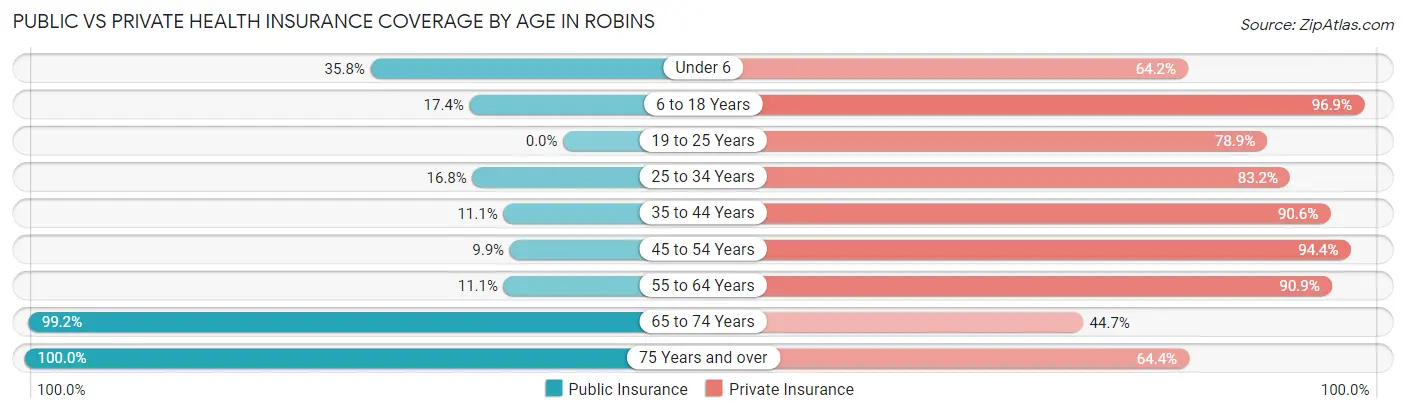
| Age Bracket | Public Insurance | Private Insurance |
| Under 6 | 49 (35.8%) | 88 (64.2%) |
| 6 to 18 Years | 129 (17.4%) | 719 (96.9%) |
| 19 to 25 Years | 0 (0.0%) | 146 (78.9%) |
| 25 to 34 Years | 33 (16.8%) | 163 (83.2%) |
| 35 to 44 Years | 45 (11.1%) | 367 (90.6%) |
| 45 to 54 Years | 53 (9.9%) | 505 (94.4%) |
| 55 to 64 Years | 68 (11.1%) | 559 (90.9%) |
| 65 to 74 Years | 375 (99.2%) | 169 (44.7%) |
| 75 Years and over | 163 (100.0%) | 105 (64.4%) |
| Total | 915 (27.3%) | 2,821 (84.1%) |
Disability Status by Sex by Age in Robins
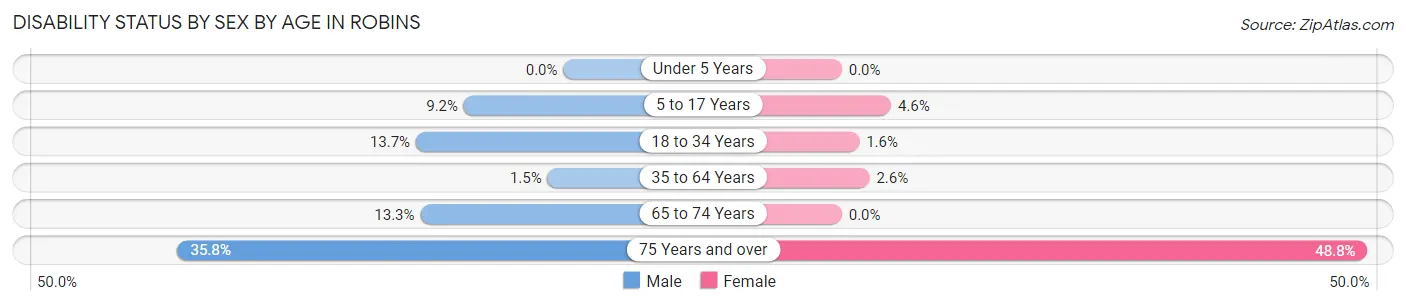
| Age Bracket | Male | Female |
| Under 5 Years | 0 (0.0%) | 0 (0.0%) |
| 5 to 17 Years | 37 (9.2%) | 16 (4.6%) |
| 18 to 34 Years | 29 (13.7%) | 3 (1.6%) |
| 35 to 64 Years | 12 (1.5%) | 19 (2.6%) |
| 65 to 74 Years | 26 (13.3%) | 0 (0.0%) |
| 75 Years and over | 29 (35.8%) | 40 (48.8%) |
Disability Class by Sex by Age in Robins
Disability Class: Hearing Difficulty
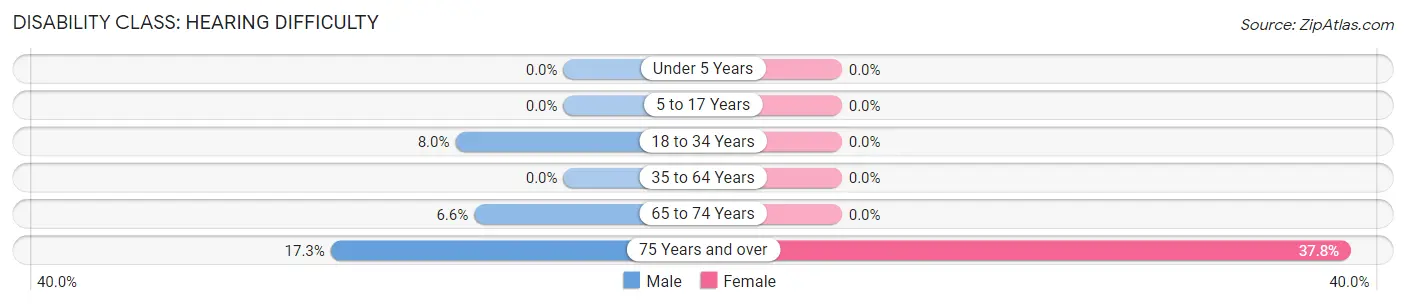
| Age Bracket | Male | Female |
| Under 5 Years | 0 (0.0%) | 0 (0.0%) |
| 5 to 17 Years | 0 (0.0%) | 0 (0.0%) |
| 18 to 34 Years | 17 (8.0%) | 0 (0.0%) |
| 35 to 64 Years | 0 (0.0%) | 0 (0.0%) |
| 65 to 74 Years | 13 (6.6%) | 0 (0.0%) |
| 75 Years and over | 14 (17.3%) | 31 (37.8%) |
Disability Class: Vision Difficulty
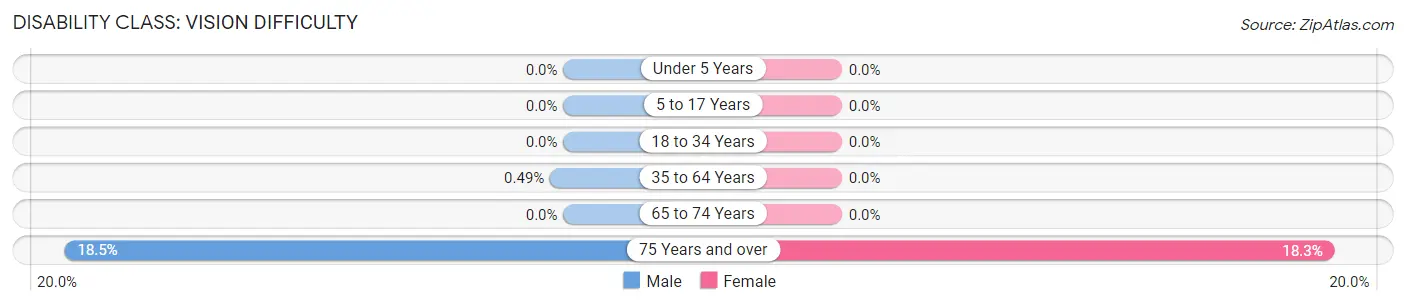
| Age Bracket | Male | Female |
| Under 5 Years | 0 (0.0%) | 0 (0.0%) |
| 5 to 17 Years | 0 (0.0%) | 0 (0.0%) |
| 18 to 34 Years | 0 (0.0%) | 0 (0.0%) |
| 35 to 64 Years | 4 (0.5%) | 0 (0.0%) |
| 65 to 74 Years | 0 (0.0%) | 0 (0.0%) |
| 75 Years and over | 15 (18.5%) | 15 (18.3%) |
Disability Class: Cognitive Difficulty
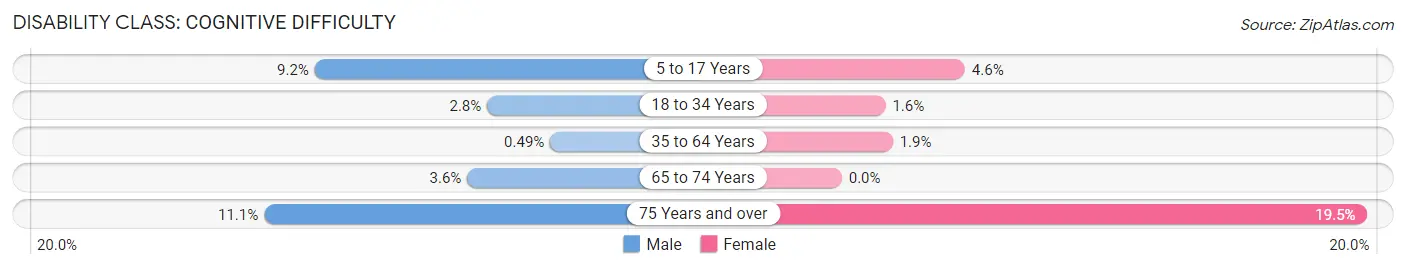
| Age Bracket | Male | Female |
| 5 to 17 Years | 37 (9.2%) | 16 (4.6%) |
| 18 to 34 Years | 6 (2.8%) | 3 (1.6%) |
| 35 to 64 Years | 4 (0.5%) | 14 (1.9%) |
| 65 to 74 Years | 7 (3.6%) | 0 (0.0%) |
| 75 Years and over | 9 (11.1%) | 16 (19.5%) |
Disability Class: Ambulatory Difficulty
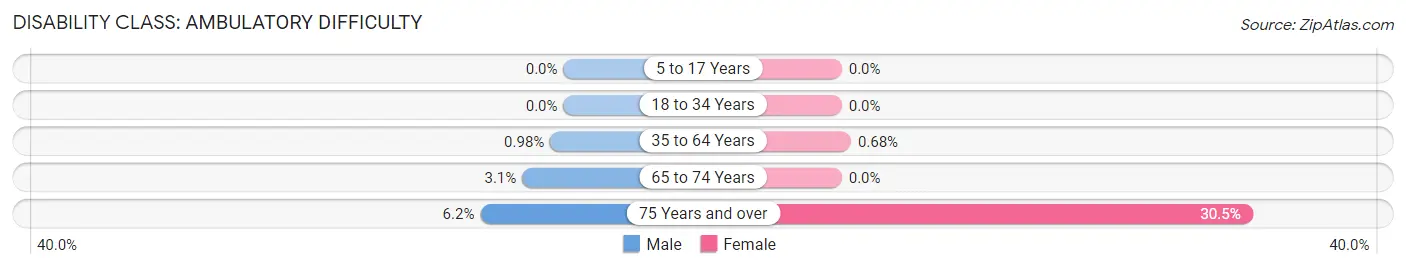
| Age Bracket | Male | Female |
| 5 to 17 Years | 0 (0.0%) | 0 (0.0%) |
| 18 to 34 Years | 0 (0.0%) | 0 (0.0%) |
| 35 to 64 Years | 8 (1.0%) | 5 (0.7%) |
| 65 to 74 Years | 6 (3.1%) | 0 (0.0%) |
| 75 Years and over | 5 (6.2%) | 25 (30.5%) |
Disability Class: Self-Care Difficulty
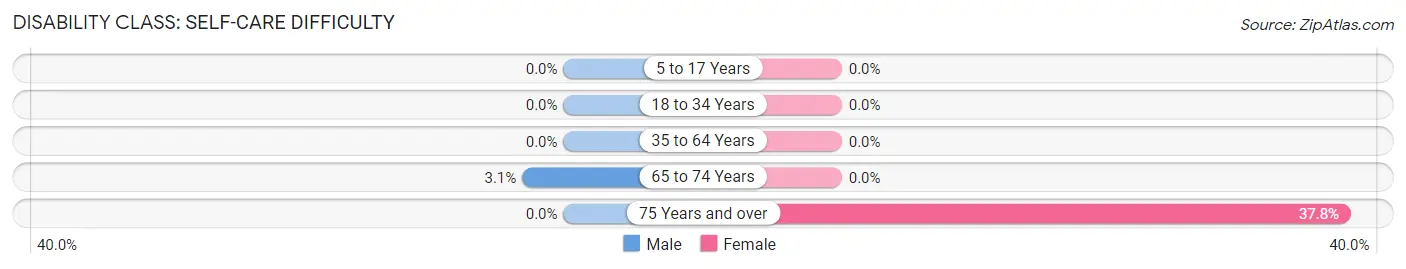
| Age Bracket | Male | Female |
| 5 to 17 Years | 0 (0.0%) | 0 (0.0%) |
| 18 to 34 Years | 0 (0.0%) | 0 (0.0%) |
| 35 to 64 Years | 0 (0.0%) | 0 (0.0%) |
| 65 to 74 Years | 6 (3.1%) | 0 (0.0%) |
| 75 Years and over | 0 (0.0%) | 31 (37.8%) |
Technology Access in Robins
Computing Device Access in Robins
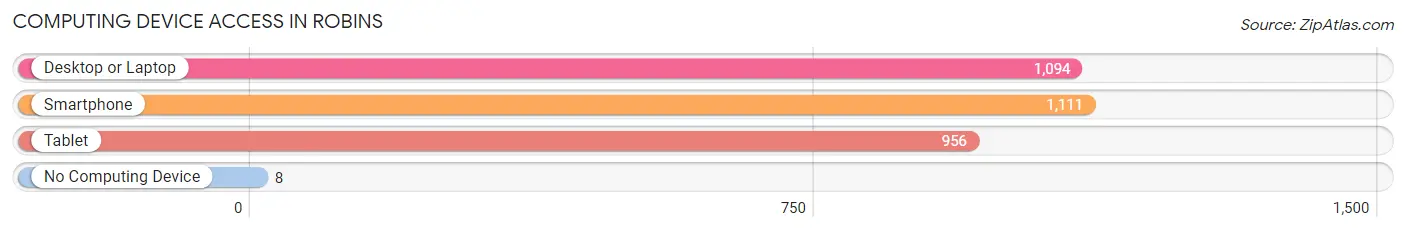
| Device Type | # Households | % Households |
| Desktop or Laptop | 1,094 | 94.2% |
| Smartphone | 1,111 | 95.7% |
| Tablet | 956 | 82.3% |
| No Computing Device | 8 | 0.7% |
| Total | 1,161 | 100.0% |
Internet Access in Robins
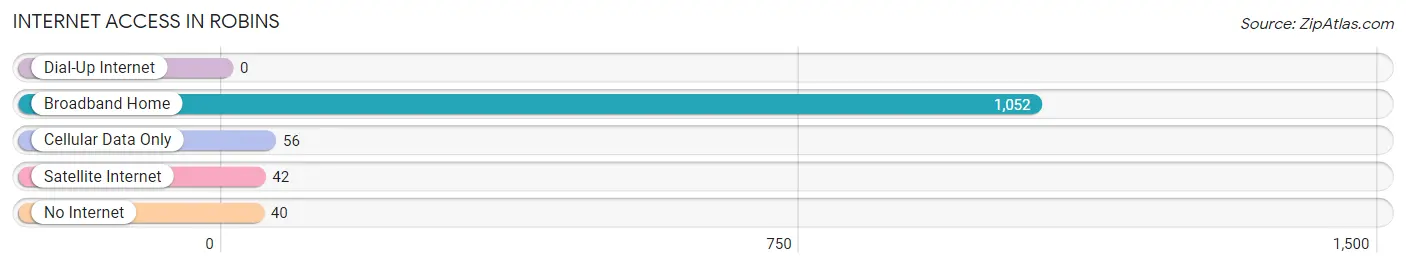
| Internet Type | # Households | % Households |
| Dial-Up Internet | 0 | 0.0% |
| Broadband Home | 1,052 | 90.6% |
| Cellular Data Only | 56 | 4.8% |
| Satellite Internet | 42 | 3.6% |
| No Internet | 40 | 3.5% |
| Total | 1,161 | 100.0% |
Robins Summary
Robins, Iowa is a small city located in Linn County, Iowa. It is part of the Cedar Rapids Metropolitan Statistical Area and has a population of approximately 4,000 people. The city was founded in 1872 and was named after the robin, a small bird that is native to the area.
Geography
Robins is located in the center of Linn County, Iowa, approximately 10 miles north of Cedar Rapids. The city is situated on the banks of the Cedar River, which flows through the city and provides a scenic backdrop. The city is surrounded by rolling hills and farmland, and is home to several parks and recreational areas.
The climate in Robins is typical of the Midwest, with hot summers and cold winters. The average temperature in the summer is around 75 degrees Fahrenheit, while the average temperature in the winter is around 25 degrees Fahrenheit. The city receives an average of 36 inches of precipitation per year, with most of it falling in the spring and summer months.
Economy
Robins has a strong and diverse economy. The city is home to several manufacturing companies, including a large paper mill and a plastics factory. The city also has a thriving retail sector, with several stores and restaurants located in the downtown area. The city is also home to a number of small businesses, including a number of professional services firms.
Robins is also home to a number of educational institutions, including a community college and a technical school. The city is also home to a number of healthcare facilities, including a hospital and several clinics.
Demographics
As of the 2010 census, the population of Robins was 4,000 people. The population is predominantly white, with approximately 90% of the population identifying as white. The median household income in Robins is $50,000, and the median age is 37 years old.
Robins is a diverse city, with a variety of cultures and backgrounds represented. The city is home to a large Hispanic population, as well as a growing African American population. The city also has a large number of immigrants, with many coming from Mexico, India, and other countries.
Robins is a small city with a big heart. The city is home to a number of parks and recreational areas, as well as a thriving economy and diverse population. The city is a great place to live, work, and play, and is a great example of the Midwest at its best.
Common Questions
What is Per Capita Income in Robins?
Per Capita income in Robins is $53,724.
What is the Median Family Income in Robins?
Median Family Income in Robins is $128,173.
What is the Median Household income in Robins?
Median Household Income in Robins is $127,443.
What is Income or Wage Gap in Robins?
Income or Wage Gap in Robins is 10.9%.
Women in Robins earn 89.1 cents for every dollar earned by a man.
What is Inequality or Gini Index in Robins?
Inequality or Gini Index in Robins is 0.42.
What is the Total Population of Robins?
Total Population of Robins is 3,356.
What is the Total Male Population of Robins?
Total Male Population of Robins is 1,754.
What is the Total Female Population of Robins?
Total Female Population of Robins is 1,602.
What is the Ratio of Males per 100 Females in Robins?
There are 109.49 Males per 100 Females in Robins.
What is the Ratio of Females per 100 Males in Robins?
There are 91.33 Females per 100 Males in Robins.
What is the Median Population Age in Robins?
Median Population Age in Robins is 45.2 Years.
What is the Average Family Size in Robins
Average Family Size in Robins is 2.9 People.
What is the Average Household Size in Robins
Average Household Size in Robins is 2.9 People.
How Large is the Labor Force in Robins?
There are 1,689 People in the Labor Forcein in Robins.
What is the Percentage of People in the Labor Force in Robins?
64.4% of People are in the Labor Force in Robins.
What is the Unemployment Rate in Robins?
Unemployment Rate in Robins is 6.8%.