Zip Codes with the Highest Percentage of Households with Income Above $100,000 in Urbandale, IA
RELATED REPORTS & OPTIONS
Household Income | $100k+
Urbandale
Compare Zip Codes
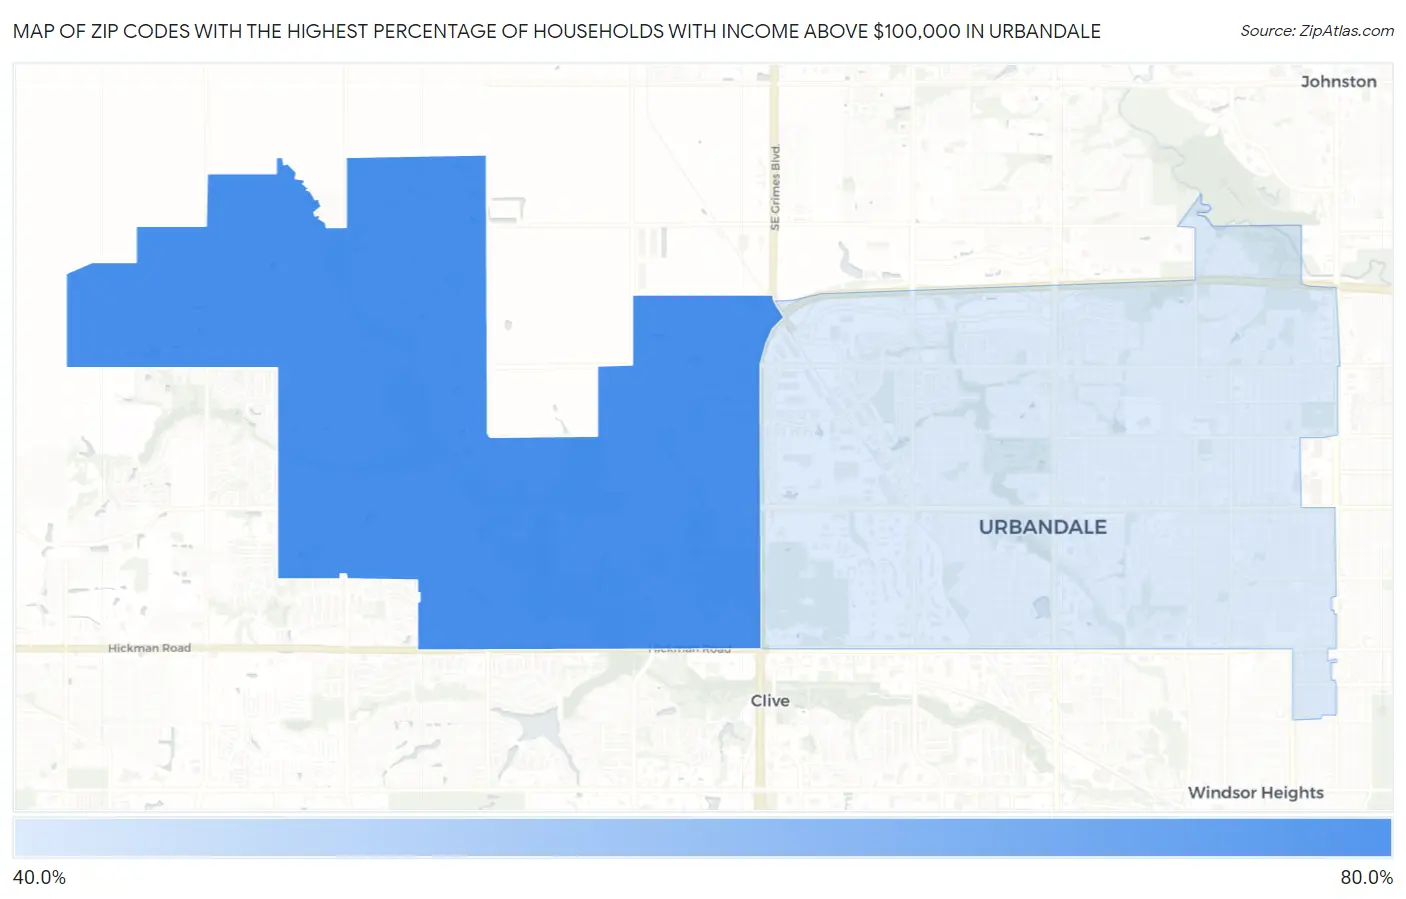
Map of Zip Codes with the Highest Percentage of Households with Income Above $100,000 in Urbandale
42.1%
79.7%
Zip Codes with the Highest Percentage of Households with Income Above $100,000 in Urbandale, IA
| Zip Code | Households with Income > $100k | vs State | vs National | |
| 1. | 50323 | 79.7% | 32.9%(+46.8)#1 | 37.3%(+42.4)#352 |
| 2. | 50322 | 42.1% | 32.9%(+9.20)#150 | 37.3%(+4.80)#7,841 |
1
Common Questions
What are the Top Zip Codes with the Highest Percentage of Households with Income Above $100,000 in Urbandale, IA?
Top Zip Codes with the Highest Percentage of Households with Income Above $100,000 in Urbandale, IA are:
What zip code has the Highest Percentage of Households with Income Above $100,000 in Urbandale, IA?
50323 has the Highest Percentage of Households with Income Above $100,000 in Urbandale, IA with 79.7%.
What is the Percentage of Households with Income Above $100,000 in Urbandale, IA?
Percentage of Households with Income Above $100,000 in Urbandale is 55.5%.
What is the Percentage of Households with Income Above $100,000 in Iowa?
Percentage of Households with Income Above $100,000 in Iowa is 32.9%.
What is the Percentage of Households with Income Above $100,000 in the United States?
Percentage of Households with Income Above $100,000 in the United States is 37.3%.