Carlisle, IA
Carlisle Map
Carlisle Overview
4,116
TOTAL POPULATION
2,044
MALE POPULATION
2,072
FEMALE POPULATION
98.65
MALES / 100 FEMALES
101.37
FEMALES / 100 MALES
37.7
MEDIAN AGE
3.1
AVG FAMILY SIZE
2.6
AVG HOUSEHOLD SIZE
$41,250
PER CAPITA INCOME
$105,982
AVG FAMILY INCOME
$94,214
AVG HOUSEHOLD INCOME
16.2%
WAGE / INCOME GAP [ % ]
83.8¢/ $1
WAGE / INCOME GAP [ $ ]
0.41
INEQUALITY / GINI INDEX
2,266
LABOR FORCE [ PEOPLE ]
71.6%
PERCENT IN LABOR FORCE
5.5%
UNEMPLOYMENT RATE
Carlisle Zip Codes
Carlisle Area Codes
Race in Carlisle
The most populous races in Carlisle are White / Caucasian (3,949 | 95.9%), Two or more Races (132 | 3.2%), and Hispanic or Latino (90 | 2.2%).
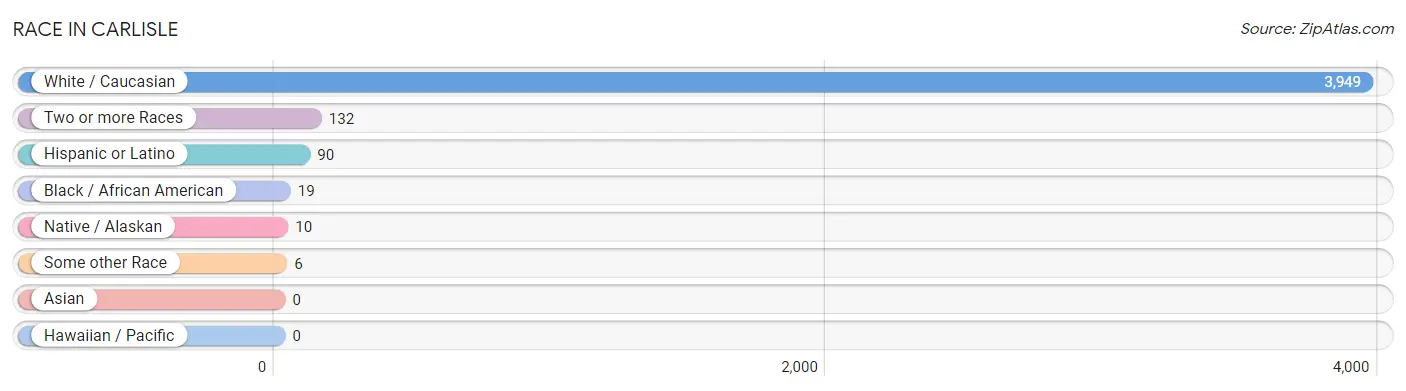
| Race | # Population | % Population |
| Asian | 0 | 0.0% |
| Black / African American | 19 | 0.5% |
| Hawaiian / Pacific | 0 | 0.0% |
| Hispanic or Latino | 90 | 2.2% |
| Native / Alaskan | 10 | 0.2% |
| White / Caucasian | 3,949 | 95.9% |
| Two or more Races | 132 | 3.2% |
| Some other Race | 6 | 0.2% |
| Total | 4,116 | 100.0% |
Ancestry in Carlisle
The most populous ancestries reported in Carlisle are German (894 | 21.7%), English (554 | 13.5%), Irish (485 | 11.8%), American (273 | 6.6%), and Scottish (224 | 5.4%), together accounting for 59.0% of all Carlisle residents.
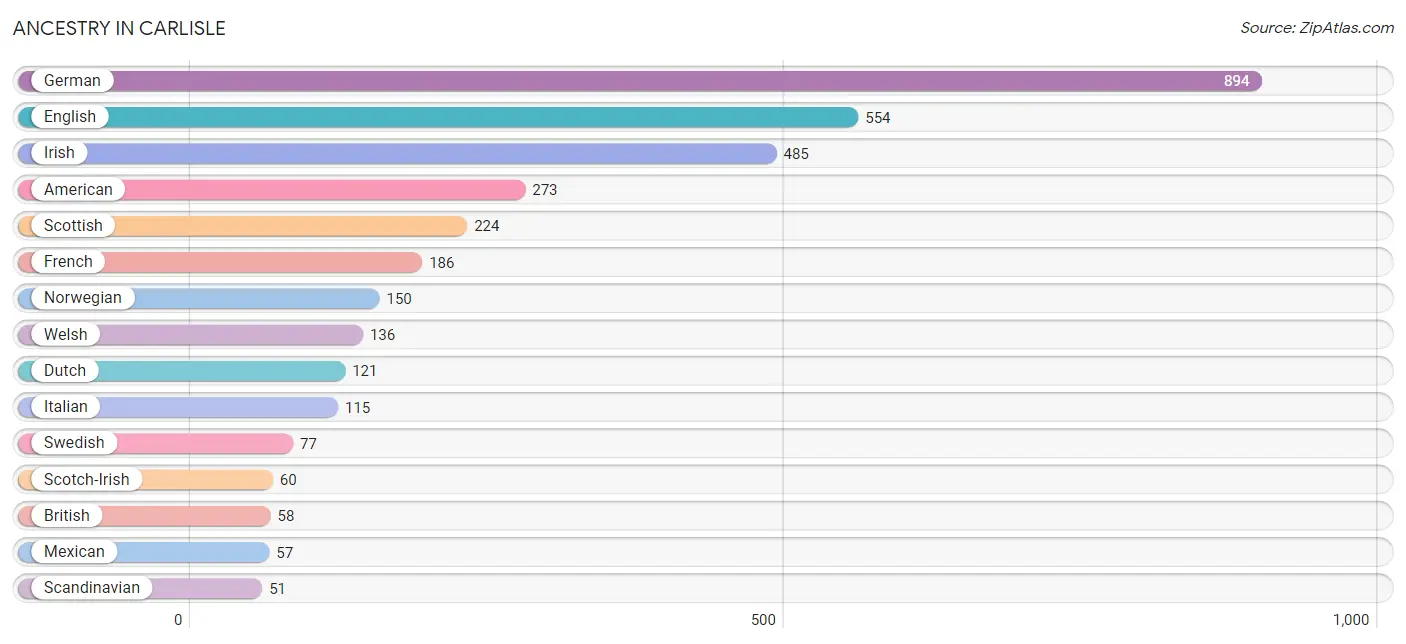
| Ancestry | # Population | % Population |
| American | 273 | 6.6% |
| Armenian | 13 | 0.3% |
| Australian | 6 | 0.2% |
| British | 58 | 1.4% |
| Canadian | 16 | 0.4% |
| Central American | 7 | 0.2% |
| Czech | 32 | 0.8% |
| Danish | 27 | 0.7% |
| Dutch | 121 | 2.9% |
| English | 554 | 13.5% |
| European | 31 | 0.7% |
| French | 186 | 4.5% |
| German | 894 | 21.7% |
| Guatemalan | 7 | 0.2% |
| Hungarian | 12 | 0.3% |
| Irish | 485 | 11.8% |
| Italian | 115 | 2.8% |
| Mexican | 57 | 1.4% |
| Mexican American Indian | 26 | 0.6% |
| Norwegian | 150 | 3.6% |
| Polish | 12 | 0.3% |
| Russian | 6 | 0.2% |
| Scandinavian | 51 | 1.2% |
| Scotch-Irish | 60 | 1.5% |
| Scottish | 224 | 5.4% |
| Shoshone | 5 | 0.1% |
| Spanish American | 16 | 0.4% |
| Swedish | 77 | 1.9% |
| Welsh | 136 | 3.3% |
| Yugoslavian | 4 | 0.1% | View All 30 Rows |
Immigrants in Carlisle
The most numerous immigrant groups reported in Carlisle came from Central America (15 | 0.4%), Latin America (15 | 0.4%), Mexico (8 | 0.2%), Guatemala (7 | 0.2%), and Bosnia and Herzegovina (4 | 0.1%), together accounting for 1.2% of all Carlisle residents.
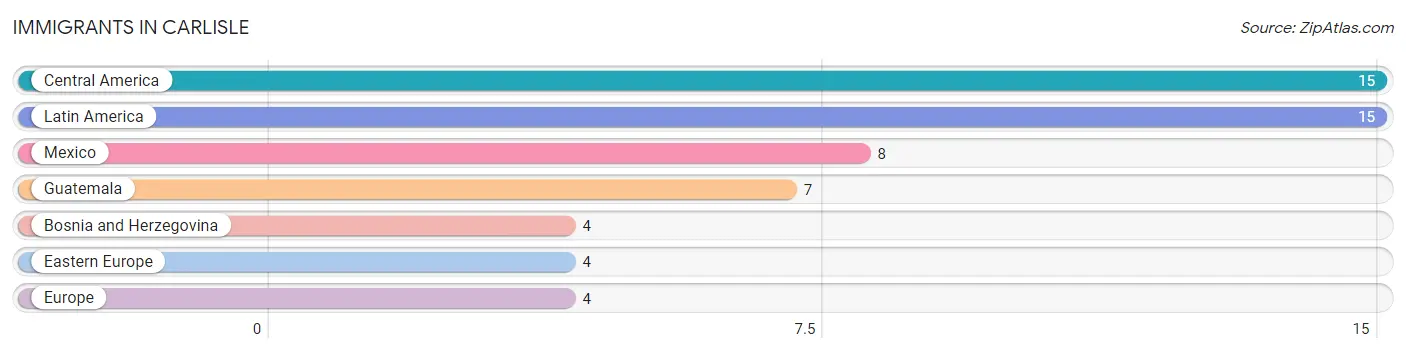
| Immigration Origin | # Population | % Population |
| Bosnia and Herzegovina | 4 | 0.1% |
| Central America | 15 | 0.4% |
| Eastern Europe | 4 | 0.1% |
| Europe | 4 | 0.1% |
| Guatemala | 7 | 0.2% |
| Latin America | 15 | 0.4% |
| Mexico | 8 | 0.2% | View All 7 Rows |
Sex and Age in Carlisle
Sex and Age in Carlisle
The most populous age groups in Carlisle are 35 to 39 Years (182 | 8.9%) for men and 45 to 49 Years (233 | 11.3%) for women.
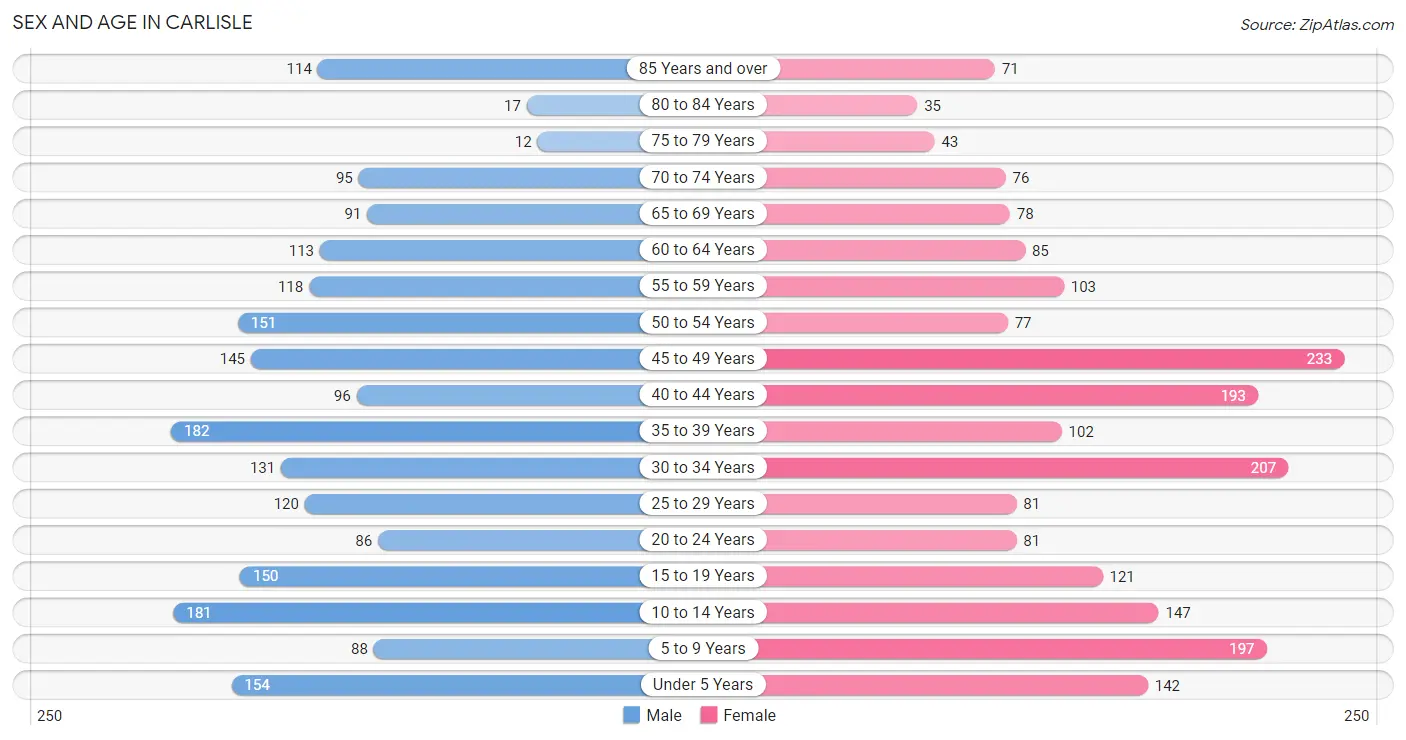
| Age Bracket | Male | Female |
| Under 5 Years | 154 (7.5%) | 142 (6.9%) |
| 5 to 9 Years | 88 (4.3%) | 197 (9.5%) |
| 10 to 14 Years | 181 (8.9%) | 147 (7.1%) |
| 15 to 19 Years | 150 (7.3%) | 121 (5.8%) |
| 20 to 24 Years | 86 (4.2%) | 81 (3.9%) |
| 25 to 29 Years | 120 (5.9%) | 81 (3.9%) |
| 30 to 34 Years | 131 (6.4%) | 207 (10.0%) |
| 35 to 39 Years | 182 (8.9%) | 102 (4.9%) |
| 40 to 44 Years | 96 (4.7%) | 193 (9.3%) |
| 45 to 49 Years | 145 (7.1%) | 233 (11.3%) |
| 50 to 54 Years | 151 (7.4%) | 77 (3.7%) |
| 55 to 59 Years | 118 (5.8%) | 103 (5.0%) |
| 60 to 64 Years | 113 (5.5%) | 85 (4.1%) |
| 65 to 69 Years | 91 (4.4%) | 78 (3.8%) |
| 70 to 74 Years | 95 (4.6%) | 76 (3.7%) |
| 75 to 79 Years | 12 (0.6%) | 43 (2.1%) |
| 80 to 84 Years | 17 (0.8%) | 35 (1.7%) |
| 85 Years and over | 114 (5.6%) | 71 (3.4%) |
| Total | 2,044 (100.0%) | 2,072 (100.0%) |
Families and Households in Carlisle
Median Family Size in Carlisle
The median family size in Carlisle is 3.08 persons per family, with married-couple families (790 | 71.2%) accounting for the largest median family size of 3.33 persons per family. On the other hand, single female/mother families (216 | 19.5%) represent the smallest median family size with 2.45 persons per family.
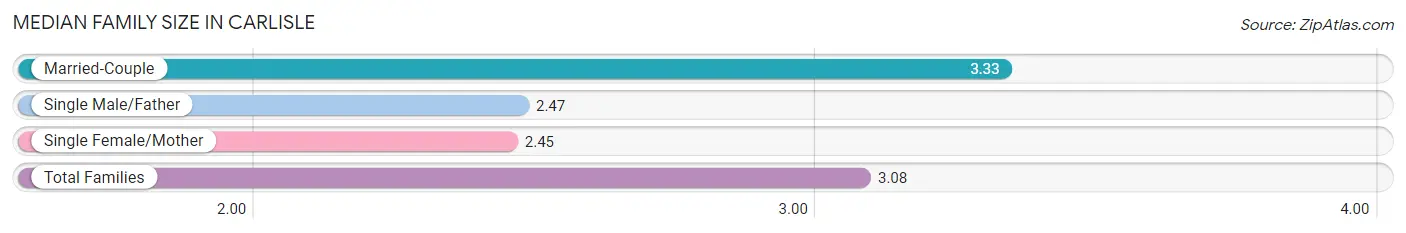
| Family Type | # Families | Family Size |
| Married-Couple | 790 (71.2%) | 3.33 |
| Single Male/Father | 103 (9.3%) | 2.47 |
| Single Female/Mother | 216 (19.5%) | 2.45 |
| Total Families | 1,109 (100.0%) | 3.08 |
Median Household Size in Carlisle
The median household size in Carlisle is 2.62 persons per household, with married-couple households (790 | 51.2%) accounting for the largest median household size of 3.33 persons per household. non-family households (433 | 28.1%) represent the smallest median household size with 1.20 persons per household.
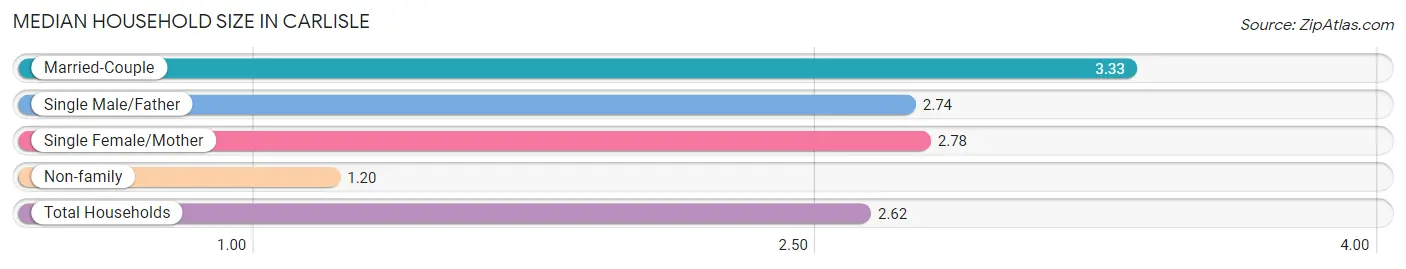
| Household Type | # Households | Household Size |
| Married-Couple | 790 (51.2%) | 3.33 |
| Single Male/Father | 103 (6.7%) | 2.74 |
| Single Female/Mother | 216 (14.0%) | 2.78 |
| Non-family | 433 (28.1%) | 1.20 |
| Total Households | 1,542 (100.0%) | 2.62 |
Household Size by Marriage Status in Carlisle
Out of a total of 1,542 households in Carlisle, 1,109 (71.9%) are family households, while 433 (28.1%) are nonfamily households. The most numerous type of family households are 2-person households, comprising 380, and the most common type of nonfamily households are 1-person households, comprising 337.
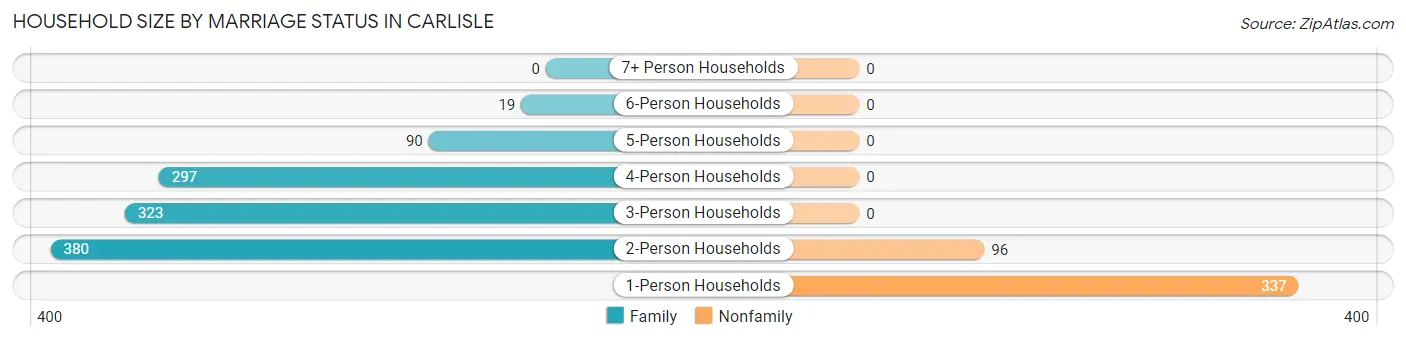
| Household Size | Family Households | Nonfamily Households |
| 1-Person Households | - | 337 (21.8%) |
| 2-Person Households | 380 (24.6%) | 96 (6.2%) |
| 3-Person Households | 323 (20.9%) | 0 (0.0%) |
| 4-Person Households | 297 (19.3%) | 0 (0.0%) |
| 5-Person Households | 90 (5.8%) | 0 (0.0%) |
| 6-Person Households | 19 (1.2%) | 0 (0.0%) |
| 7+ Person Households | 0 (0.0%) | 0 (0.0%) |
| Total | 1,109 (71.9%) | 433 (28.1%) |
Female Fertility in Carlisle
Fertility by Age in Carlisle
Average fertility rate in Carlisle is 91.0 births per 1,000 women. Women in the age bracket of 20 to 34 years have the highest fertility rate with 255.0 births per 1,000 women. Women in the age bracket of 20 to 34 years acount for 100.0% of all women with births.
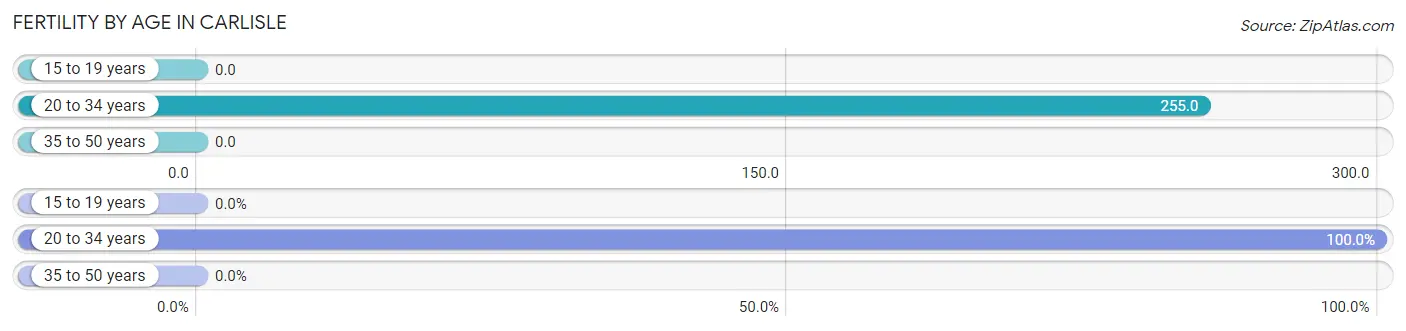
| Age Bracket | Women with Births | Births / 1,000 Women |
| 15 to 19 years | 0 (0.0%) | 0.0 |
| 20 to 34 years | 94 (100.0%) | 255.0 |
| 35 to 50 years | 0 (0.0%) | 0.0 |
| Total | 94 (100.0%) | 91.0 |
Fertility by Age by Marriage Status in Carlisle
96.8% of women with births (94) in Carlisle are married. The highest percentage of unmarried women with births falls into 20 to 34 years age bracket with 3.2% of them unmarried at the time of birth, while the lowest percentage of unmarried women with births belong to 20 to 34 years age bracket with 3.2% of them unmarried.
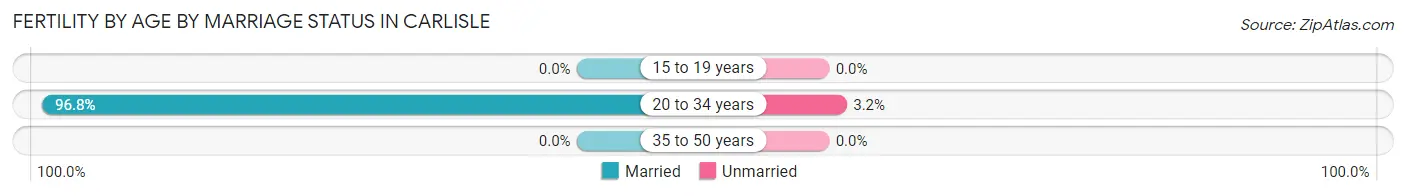
| Age Bracket | Married | Unmarried |
| 15 to 19 years | 0 (0.0%) | 0 (0.0%) |
| 20 to 34 years | 91 (96.8%) | 3 (3.2%) |
| 35 to 50 years | 0 (0.0%) | 0 (0.0%) |
| Total | 91 (96.8%) | 3 (3.2%) |
Fertility by Education in Carlisle
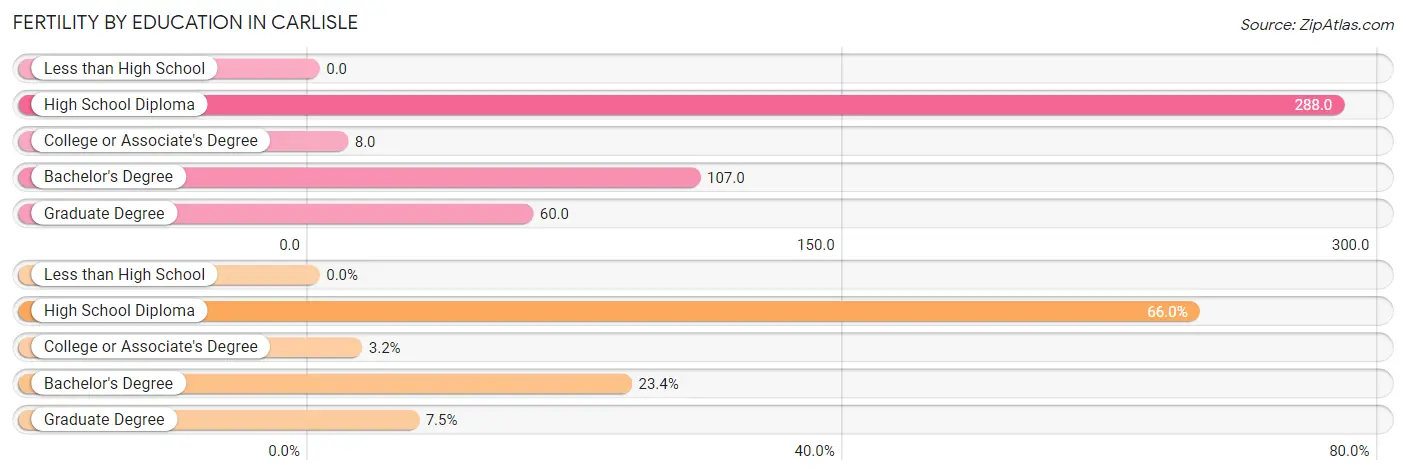
| Educational Attainment | Women with Births | Births / 1,000 Women |
| Less than High School | 0 (0.0%) | 0.0 |
| High School Diploma | 62 (66.0%) | 288.0 |
| College or Associate's Degree | 3 (3.2%) | 8.0 |
| Bachelor's Degree | 22 (23.4%) | 107.0 |
| Graduate Degree | 7 (7.4%) | 60.0 |
| Total | 94 (100.0%) | 91.0 |
Fertility by Education by Marriage Status in Carlisle
3.2% of women with births in Carlisle are unmarried. Women with the educational attainment of high school diploma are most likely to be married with 100.0% of them married at childbirth, while women with the educational attainment of college or associate's degree are least likely to be married with 100.0% of them unmarried at childbirth.
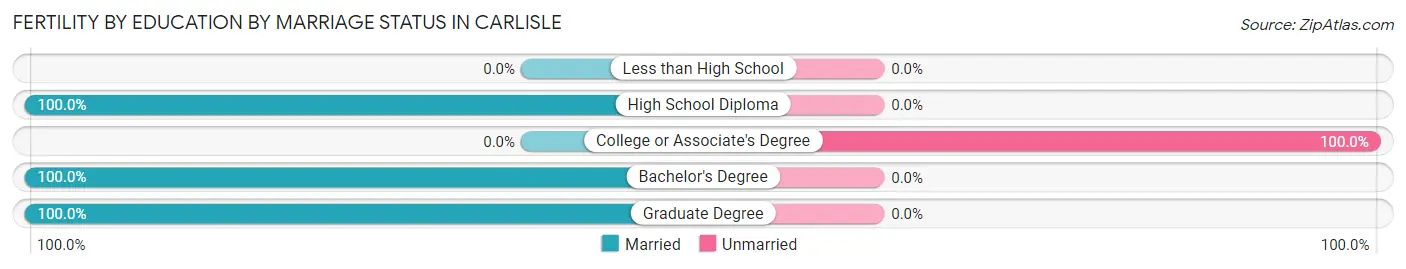
| Educational Attainment | Married | Unmarried |
| Less than High School | 0 (0.0%) | 0 (0.0%) |
| High School Diploma | 62 (100.0%) | 0 (0.0%) |
| College or Associate's Degree | 0 (0.0%) | 3 (100.0%) |
| Bachelor's Degree | 22 (100.0%) | 0 (0.0%) |
| Graduate Degree | 7 (100.0%) | 0 (0.0%) |
| Total | 91 (96.8%) | 3 (3.2%) |
Income in Carlisle
Income Overview in Carlisle
Per Capita Income in Carlisle is $41,250, while median incomes of families and households are $105,982 and $94,214 respectively.
| Characteristic | Number | Measure |
| Per Capita Income | 4,116 | $41,250 |
| Median Family Income | 1,109 | $105,982 |
| Mean Family Income | 1,109 | $122,592 |
| Median Household Income | 1,542 | $94,214 |
| Mean Household Income | 1,542 | $107,424 |
| Income Deficit | 1,109 | $0 |
| Wage / Income Gap (%) | 4,116 | 16.21% |
| Wage / Income Gap ($) | 4,116 | 83.79¢ per $1 |
| Gini / Inequality Index | 4,116 | 0.41 |
Earnings by Sex in Carlisle
Average Earnings in Carlisle are $50,350, $56,058 for men and $46,970 for women, a difference of 16.2%.
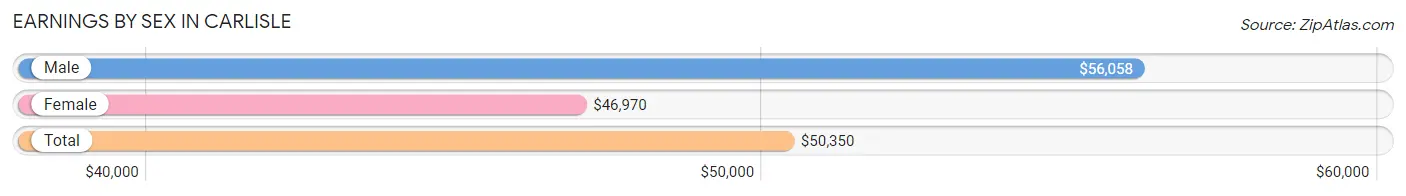
| Sex | Number | Average Earnings |
| Male | 1,213 (51.5%) | $56,058 |
| Female | 1,144 (48.5%) | $46,970 |
| Total | 2,357 (100.0%) | $50,350 |
Earnings by Sex by Income Bracket in Carlisle
The most common earnings brackets in Carlisle are $75,000 to $99,999 for men (188 | 15.5%) and $55,000 to $64,999 for women (172 | 15.0%).
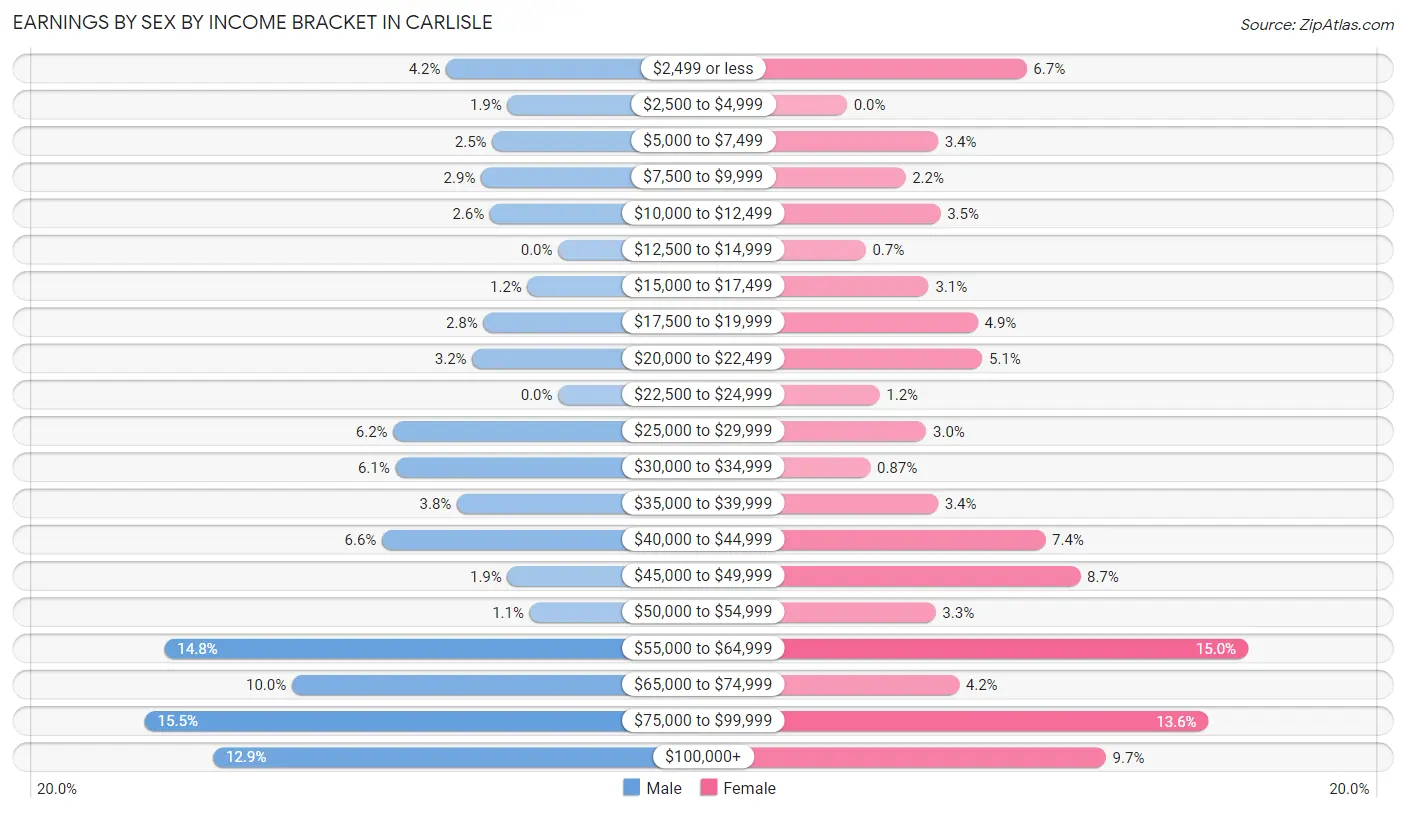
| Income | Male | Female |
| $2,499 or less | 51 (4.2%) | 77 (6.7%) |
| $2,500 to $4,999 | 23 (1.9%) | 0 (0.0%) |
| $5,000 to $7,499 | 30 (2.5%) | 39 (3.4%) |
| $7,500 to $9,999 | 35 (2.9%) | 25 (2.2%) |
| $10,000 to $12,499 | 31 (2.6%) | 40 (3.5%) |
| $12,500 to $14,999 | 0 (0.0%) | 8 (0.7%) |
| $15,000 to $17,499 | 14 (1.1%) | 35 (3.1%) |
| $17,500 to $19,999 | 34 (2.8%) | 56 (4.9%) |
| $20,000 to $22,499 | 39 (3.2%) | 58 (5.1%) |
| $22,500 to $24,999 | 0 (0.0%) | 14 (1.2%) |
| $25,000 to $29,999 | 75 (6.2%) | 34 (3.0%) |
| $30,000 to $34,999 | 74 (6.1%) | 10 (0.9%) |
| $35,000 to $39,999 | 46 (3.8%) | 39 (3.4%) |
| $40,000 to $44,999 | 80 (6.6%) | 85 (7.4%) |
| $45,000 to $49,999 | 23 (1.9%) | 100 (8.7%) |
| $50,000 to $54,999 | 13 (1.1%) | 38 (3.3%) |
| $55,000 to $64,999 | 179 (14.8%) | 172 (15.0%) |
| $65,000 to $74,999 | 121 (10.0%) | 48 (4.2%) |
| $75,000 to $99,999 | 188 (15.5%) | 155 (13.6%) |
| $100,000+ | 157 (12.9%) | 111 (9.7%) |
| Total | 1,213 (100.0%) | 1,144 (100.0%) |
Earnings by Sex by Educational Attainment in Carlisle
Average earnings in Carlisle are $58,381 for men and $53,750 for women, a difference of 7.9%. Men with an educational attainment of bachelor's degree enjoy the highest average annual earnings of $82,455, while those with less than high school education earn the least with $30,769. Women with an educational attainment of graduate degree earn the most with the average annual earnings of $79,395, while those with bachelor's degree education have the smallest earnings of $43,864.
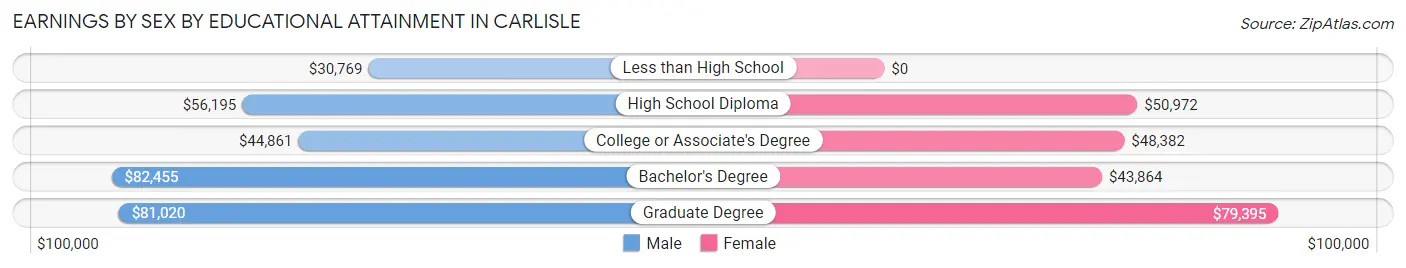
| Educational Attainment | Male Income | Female Income |
| Less than High School | $30,769 | $0 |
| High School Diploma | $56,195 | $50,972 |
| College or Associate's Degree | $44,861 | $48,382 |
| Bachelor's Degree | $82,455 | $43,864 |
| Graduate Degree | $81,020 | $79,395 |
| Total | $58,381 | $53,750 |
Family Income in Carlisle
Family Income Brackets in Carlisle
According to the Carlisle family income data, there are 403 families falling into the $100,000 to $149,999 income range, which is the most common income bracket and makes up 36.3% of all families.
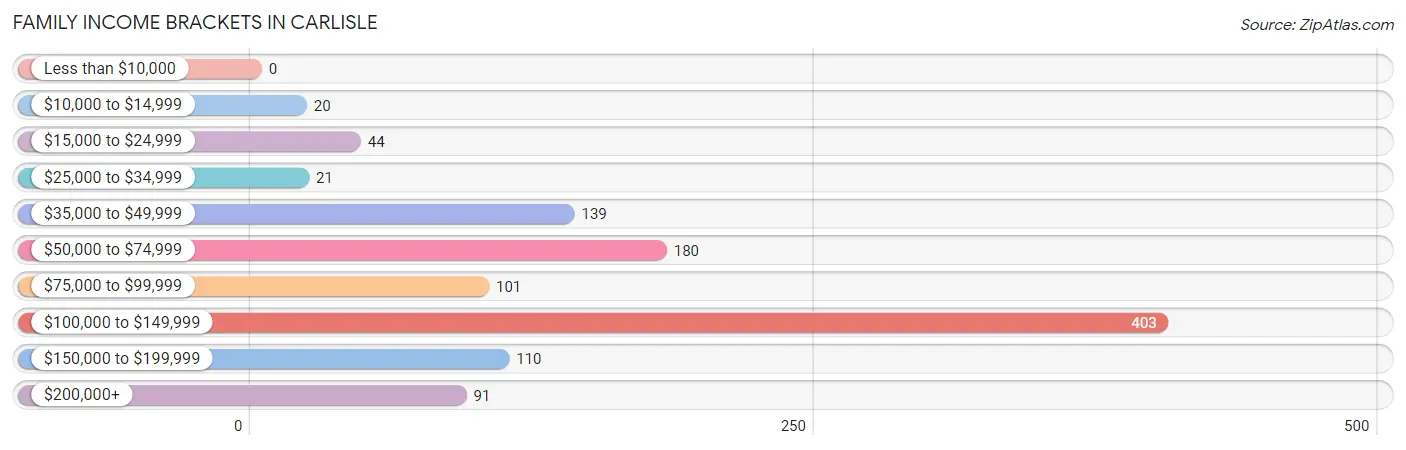
| Income Bracket | # Families | % Families |
| Less than $10,000 | 0 | 0.0% |
| $10,000 to $14,999 | 20 | 1.8% |
| $15,000 to $24,999 | 44 | 4.0% |
| $25,000 to $34,999 | 21 | 1.9% |
| $35,000 to $49,999 | 139 | 12.5% |
| $50,000 to $74,999 | 180 | 16.2% |
| $75,000 to $99,999 | 101 | 9.1% |
| $100,000 to $149,999 | 403 | 36.3% |
| $150,000 to $199,999 | 110 | 9.9% |
| $200,000+ | 91 | 8.2% |
Family Income by Famaliy Size in Carlisle
4-person families (277 | 25.0%) account for the highest median family income in Carlisle with $142,560 per family, while 2-person families (449 | 40.5%) have the highest median income of $39,812 per family member.
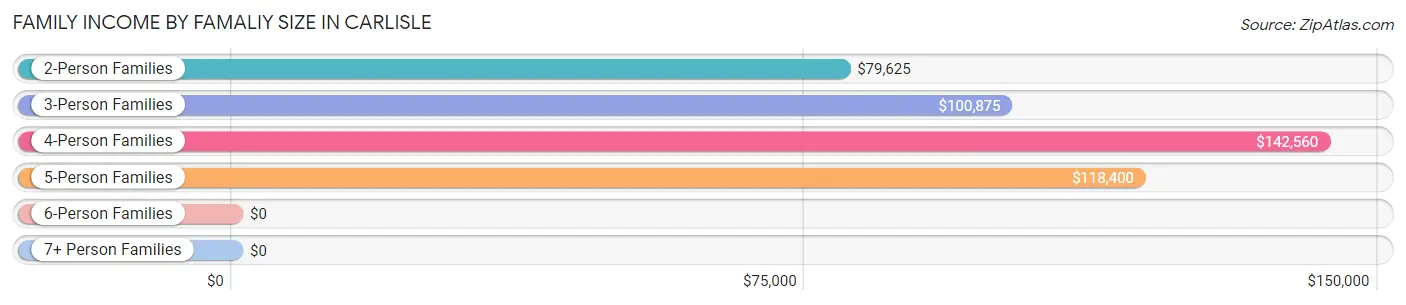
| Income Bracket | # Families | Median Income |
| 2-Person Families | 449 (40.5%) | $79,625 |
| 3-Person Families | 274 (24.7%) | $100,875 |
| 4-Person Families | 277 (25.0%) | $142,560 |
| 5-Person Families | 90 (8.1%) | $118,400 |
| 6-Person Families | 19 (1.7%) | $0 |
| 7+ Person Families | 0 (0.0%) | $0 |
| Total | 1,109 (100.0%) | $105,982 |
Family Income by Number of Earners in Carlisle
The median family income in Carlisle is $105,982, with families comprising 3+ earners (141) having the highest median family income of $135,956, while families with 1 earner (359) have the lowest median family income of $52,083, accounting for 12.7% and 32.4% of families, respectively.
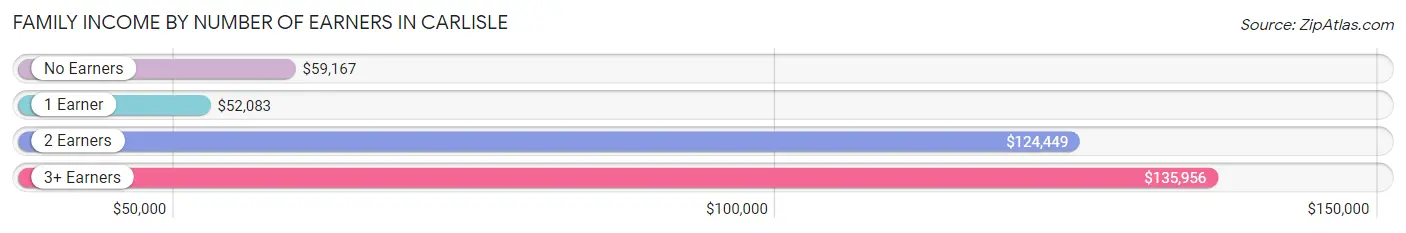
| Number of Earners | # Families | Median Income |
| No Earners | 36 (3.3%) | $59,167 |
| 1 Earner | 359 (32.4%) | $52,083 |
| 2 Earners | 573 (51.7%) | $124,449 |
| 3+ Earners | 141 (12.7%) | $135,956 |
| Total | 1,109 (100.0%) | $105,982 |
Household Income in Carlisle
Household Income Brackets in Carlisle
With 504 households falling in the category, the $100,000 to $149,999 income range is the most frequent in Carlisle, accounting for 32.7% of all households. In contrast, only 29 households (1.9%) fall into the $10,000 to $14,999 income bracket, making it the least populous group.
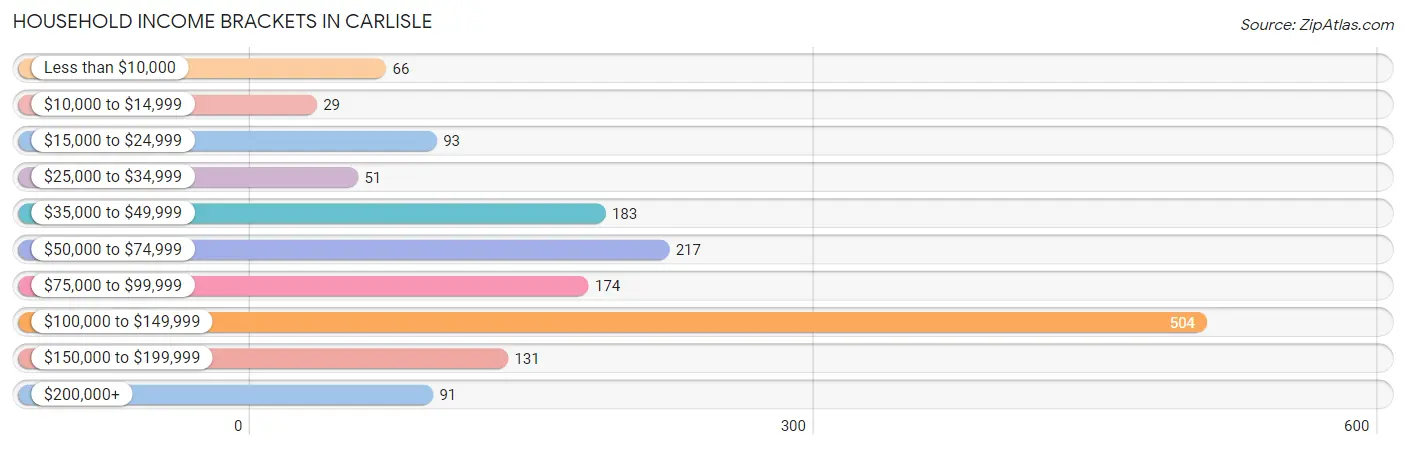
| Income Bracket | # Households | % Households |
| Less than $10,000 | 66 | 4.3% |
| $10,000 to $14,999 | 29 | 1.9% |
| $15,000 to $24,999 | 93 | 6.0% |
| $25,000 to $34,999 | 51 | 3.3% |
| $35,000 to $49,999 | 183 | 11.9% |
| $50,000 to $74,999 | 217 | 14.1% |
| $75,000 to $99,999 | 174 | 11.3% |
| $100,000 to $149,999 | 504 | 32.7% |
| $150,000 to $199,999 | 131 | 8.5% |
| $200,000+ | 91 | 5.9% |
Household Income by Householder Age in Carlisle
The median household income in Carlisle is $94,214, with the highest median household income of $122,989 found in the 45 to 64 years age bracket for the primary householder. A total of 519 households (33.7%) fall into this category. Meanwhile, the 15 to 24 years age bracket for the primary householder has the lowest median household income of $0, with 22 households (1.4%) in this group.
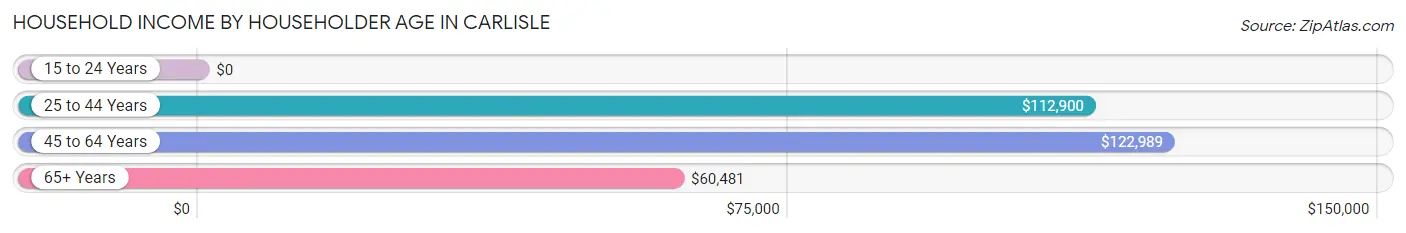
| Income Bracket | # Households | Median Income |
| 15 to 24 Years | 22 (1.4%) | $0 |
| 25 to 44 Years | 624 (40.5%) | $112,900 |
| 45 to 64 Years | 519 (33.7%) | $122,989 |
| 65+ Years | 377 (24.4%) | $60,481 |
| Total | 1,542 (100.0%) | $94,214 |
Poverty in Carlisle
Income Below Poverty by Sex and Age in Carlisle
With 4.5% poverty level for males and 7.0% for females among the residents of Carlisle, 12 to 14 year old males and 35 to 44 year old females are the most vulnerable to poverty, with 36 males (26.7%) and 69 females (23.4%) in their respective age groups living below the poverty level.
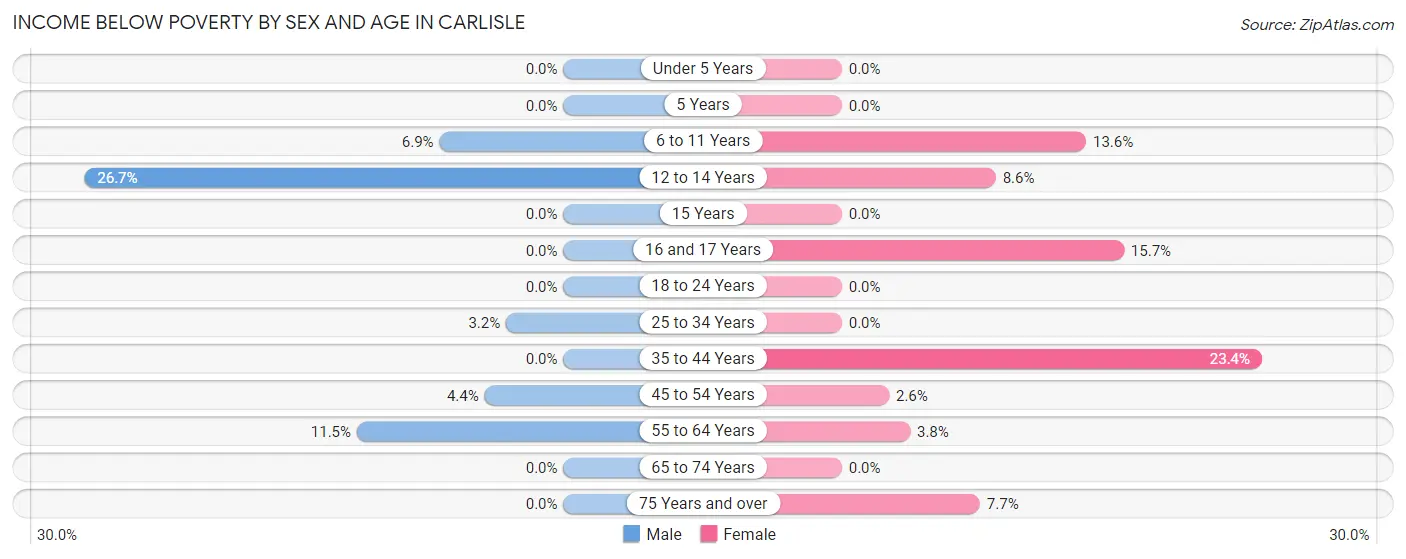
| Age Bracket | Male | Female |
| Under 5 Years | 0 (0.0%) | 0 (0.0%) |
| 5 Years | 0 (0.0%) | 0 (0.0%) |
| 6 to 11 Years | 6 (6.9%) | 31 (13.6%) |
| 12 to 14 Years | 36 (26.7%) | 6 (8.6%) |
| 15 Years | 0 (0.0%) | 0 (0.0%) |
| 16 and 17 Years | 0 (0.0%) | 11 (15.7%) |
| 18 to 24 Years | 0 (0.0%) | 0 (0.0%) |
| 25 to 34 Years | 8 (3.2%) | 0 (0.0%) |
| 35 to 44 Years | 0 (0.0%) | 69 (23.4%) |
| 45 to 54 Years | 13 (4.4%) | 8 (2.6%) |
| 55 to 64 Years | 26 (11.5%) | 7 (3.8%) |
| 65 to 74 Years | 0 (0.0%) | 0 (0.0%) |
| 75 Years and over | 0 (0.0%) | 10 (7.7%) |
| Total | 89 (4.5%) | 142 (7.0%) |
Income Above Poverty by Sex and Age in Carlisle
According to the poverty statistics in Carlisle, males aged under 5 years and females aged under 5 years are the age groups that are most secure financially, with 100.0% of males and 100.0% of females in these age groups living above the poverty line.
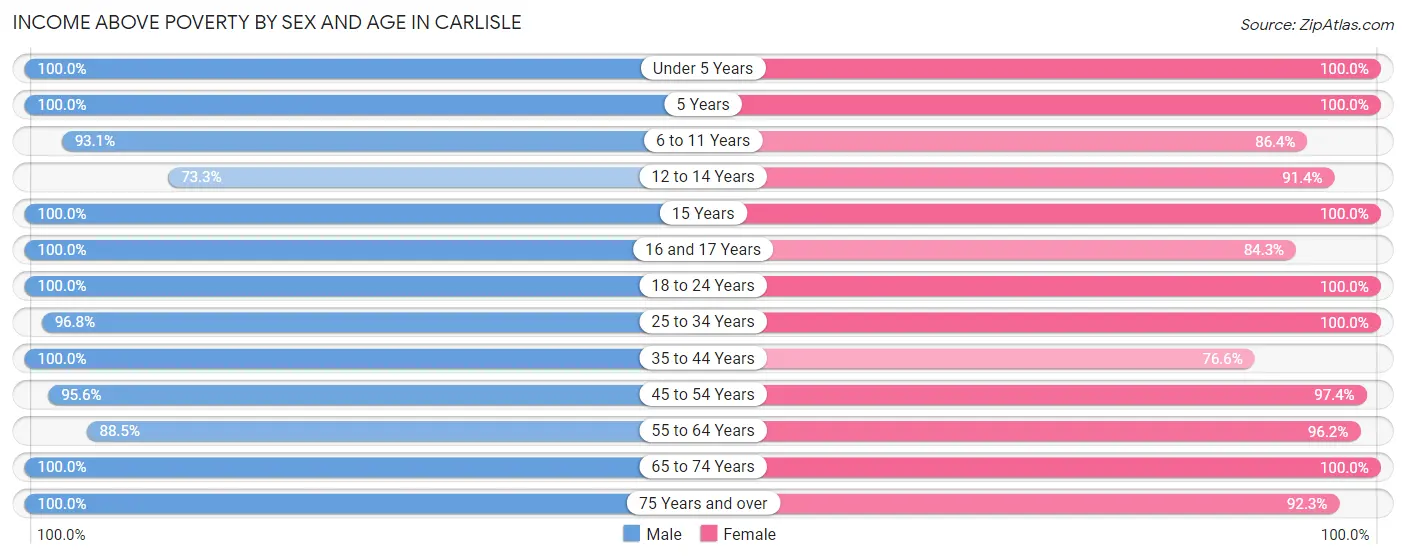
| Age Bracket | Male | Female |
| Under 5 Years | 154 (100.0%) | 142 (100.0%) |
| 5 Years | 47 (100.0%) | 46 (100.0%) |
| 6 to 11 Years | 81 (93.1%) | 197 (86.4%) |
| 12 to 14 Years | 99 (73.3%) | 64 (91.4%) |
| 15 Years | 15 (100.0%) | 27 (100.0%) |
| 16 and 17 Years | 45 (100.0%) | 59 (84.3%) |
| 18 to 24 Years | 176 (100.0%) | 105 (100.0%) |
| 25 to 34 Years | 243 (96.8%) | 288 (100.0%) |
| 35 to 44 Years | 278 (100.0%) | 226 (76.6%) |
| 45 to 54 Years | 283 (95.6%) | 296 (97.4%) |
| 55 to 64 Years | 200 (88.5%) | 177 (96.2%) |
| 65 to 74 Years | 177 (100.0%) | 154 (100.0%) |
| 75 Years and over | 105 (100.0%) | 120 (92.3%) |
| Total | 1,903 (95.5%) | 1,901 (93.0%) |
Income Below Poverty Among Married-Couple Families in Carlisle
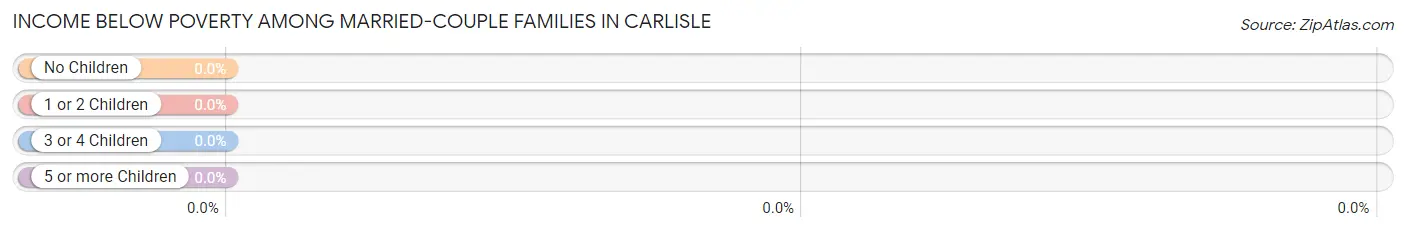
| Children | Above Poverty | Below Poverty |
| No Children | 348 (100.0%) | 0 (0.0%) |
| 1 or 2 Children | 357 (100.0%) | 0 (0.0%) |
| 3 or 4 Children | 85 (100.0%) | 0 (0.0%) |
| 5 or more Children | 0 (0.0%) | 0 (0.0%) |
| Total | 790 (100.0%) | 0 (0.0%) |
Income Below Poverty Among Single-Parent Households in Carlisle
According to the poverty data in Carlisle, 12.6% or 13 single-father households and 23.6% or 51 single-mother households are living below the poverty line. Among single-father households, those with 1 or 2 children have the highest poverty rate, with 13 households (34.2%) experiencing poverty. Likewise, among single-mother households, those with 1 or 2 children have the highest poverty rate, with 51 households (38.1%) falling below the poverty line.
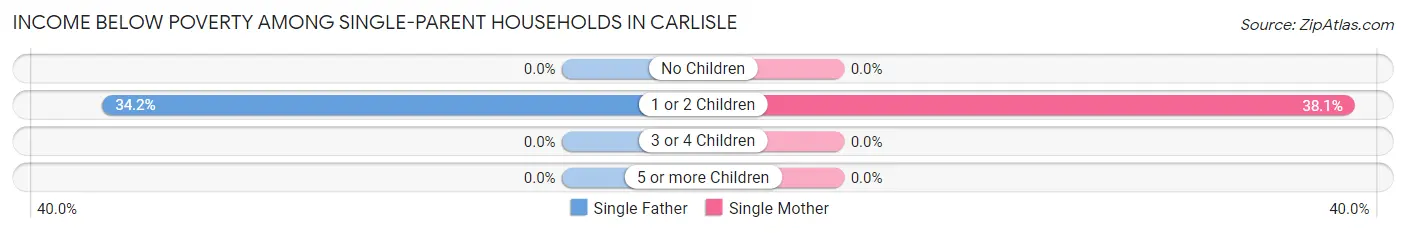
| Children | Single Father | Single Mother |
| No Children | 0 (0.0%) | 0 (0.0%) |
| 1 or 2 Children | 13 (34.2%) | 51 (38.1%) |
| 3 or 4 Children | 0 (0.0%) | 0 (0.0%) |
| 5 or more Children | 0 (0.0%) | 0 (0.0%) |
| Total | 13 (12.6%) | 51 (23.6%) |
Income Below Poverty Among Married-Couple vs Single-Parent Households in Carlisle
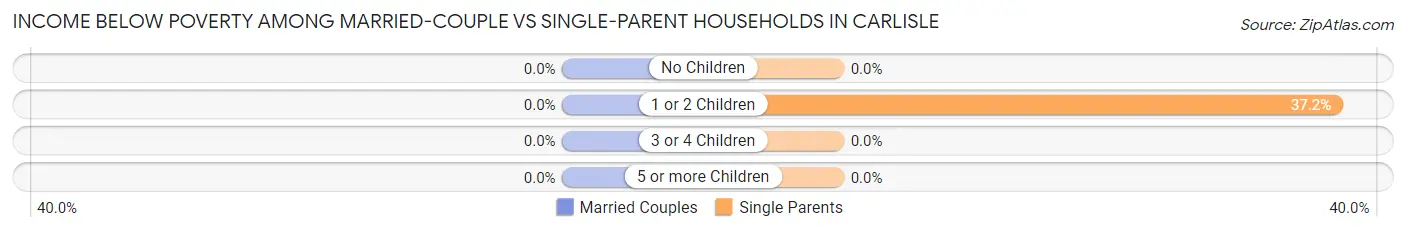
| Children | Married-Couple Families | Single-Parent Households |
| No Children | 0 (0.0%) | 0 (0.0%) |
| 1 or 2 Children | 0 (0.0%) | 64 (37.2%) |
| 3 or 4 Children | 0 (0.0%) | 0 (0.0%) |
| 5 or more Children | 0 (0.0%) | 0 (0.0%) |
| Total | 0 (0.0%) | 64 (20.1%) |
Employment Characteristics in Carlisle
Employment by Class of Employer in Carlisle
Among the 2,122 employed individuals in Carlisle, private company employees (1,535 | 72.3%), local government employees (196 | 9.2%), and not-for-profit organizations (141 | 6.6%) make up the most common classes of employment.
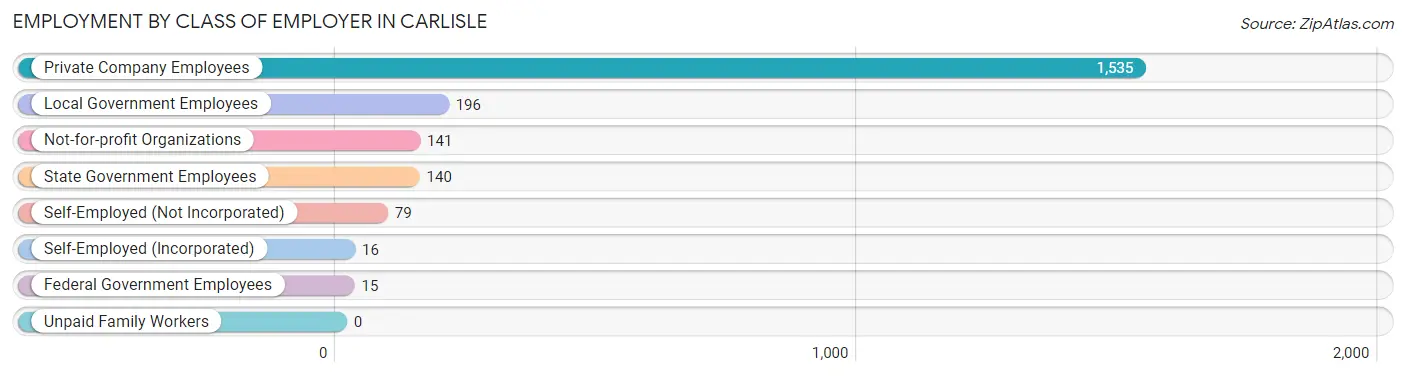
| Employer Class | # Employees | % Employees |
| Private Company Employees | 1,535 | 72.3% |
| Self-Employed (Incorporated) | 16 | 0.7% |
| Self-Employed (Not Incorporated) | 79 | 3.7% |
| Not-for-profit Organizations | 141 | 6.6% |
| Local Government Employees | 196 | 9.2% |
| State Government Employees | 140 | 6.6% |
| Federal Government Employees | 15 | 0.7% |
| Unpaid Family Workers | 0 | 0.0% |
| Total | 2,122 | 100.0% |
Employment Status by Age in Carlisle
According to the labor force statistics for Carlisle, out of the total population over 16 years of age (3,165), 71.6% or 2,266 individuals are in the labor force, with 5.5% or 125 of them unemployed. The age group with the highest labor force participation rate is 45 to 54 years, with 94.7% or 574 individuals in the labor force. Within the labor force, the 20 to 24 years age range has the highest percentage of unemployed individuals, with 14.3% or 17 of them being unemployed.
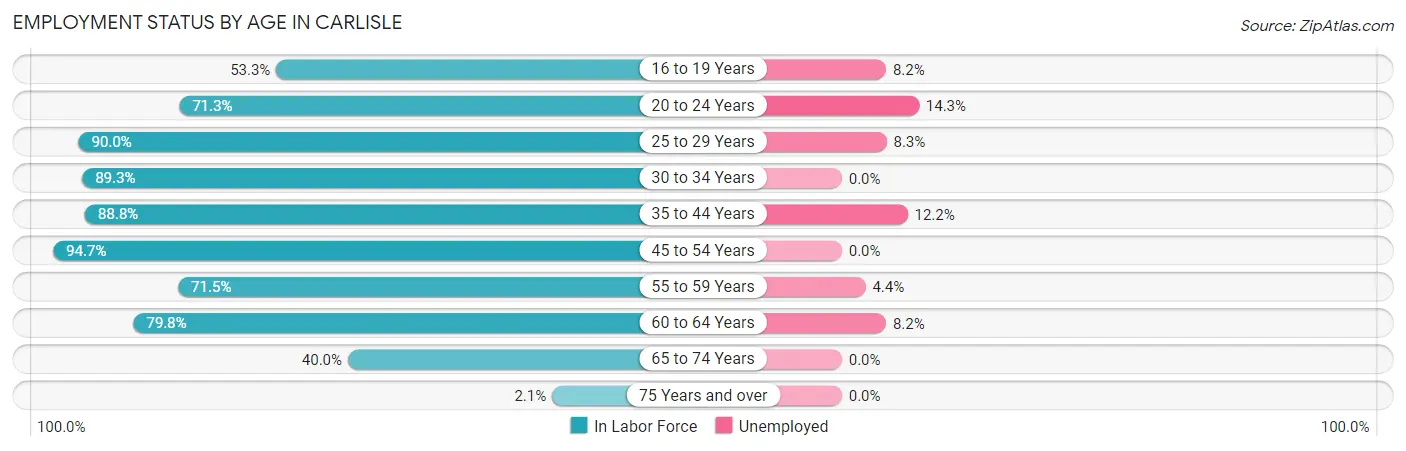
| Age Bracket | In Labor Force | Unemployed |
| 16 to 19 Years | 122 (53.3%) | 10 (8.2%) |
| 20 to 24 Years | 119 (71.3%) | 17 (14.3%) |
| 25 to 29 Years | 181 (90.0%) | 15 (8.3%) |
| 30 to 34 Years | 302 (89.3%) | 0 (0.0%) |
| 35 to 44 Years | 509 (88.8%) | 62 (12.2%) |
| 45 to 54 Years | 574 (94.7%) | 0 (0.0%) |
| 55 to 59 Years | 158 (71.5%) | 7 (4.4%) |
| 60 to 64 Years | 158 (79.8%) | 13 (8.2%) |
| 65 to 74 Years | 136 (40.0%) | 0 (0.0%) |
| 75 Years and over | 6 (2.1%) | 0 (0.0%) |
| Total | 2,266 (71.6%) | 125 (5.5%) |
Employment Status by Educational Attainment in Carlisle
According to labor force statistics for Carlisle, 88.1% of individuals (1,883) out of the total population between 25 and 64 years of age (2,137) are in the labor force, with 5.2% or 98 of them being unemployed. The group with the highest labor force participation rate are those with the educational attainment of college / associate degree, with 95.0% or 735 individuals in the labor force. Within the labor force, individuals with high school diploma education have the highest percentage of unemployment, with 13.3% or 70 of them being unemployed.
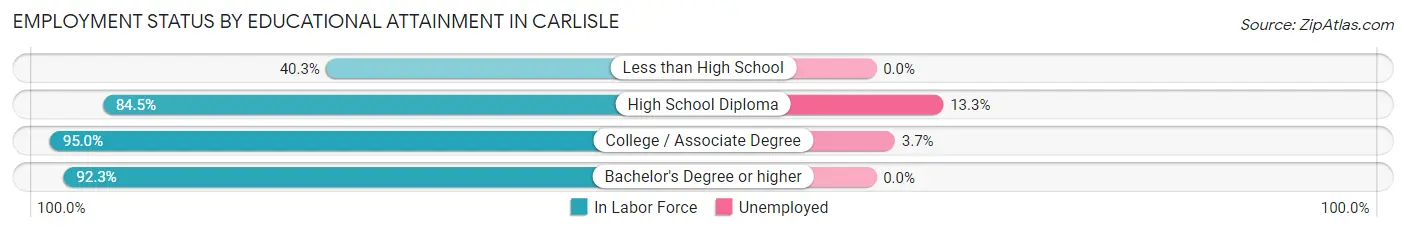
| Educational Attainment | In Labor Force | Unemployed |
| Less than High School | 48 (40.3%) | 0 (0.0%) |
| High School Diploma | 527 (84.5%) | 83 (13.3%) |
| College / Associate Degree | 735 (95.0%) | 29 (3.7%) |
| Bachelor's Degree or higher | 572 (92.3%) | 0 (0.0%) |
| Total | 1,883 (88.1%) | 111 (5.2%) |
Employment Occupations by Sex in Carlisle
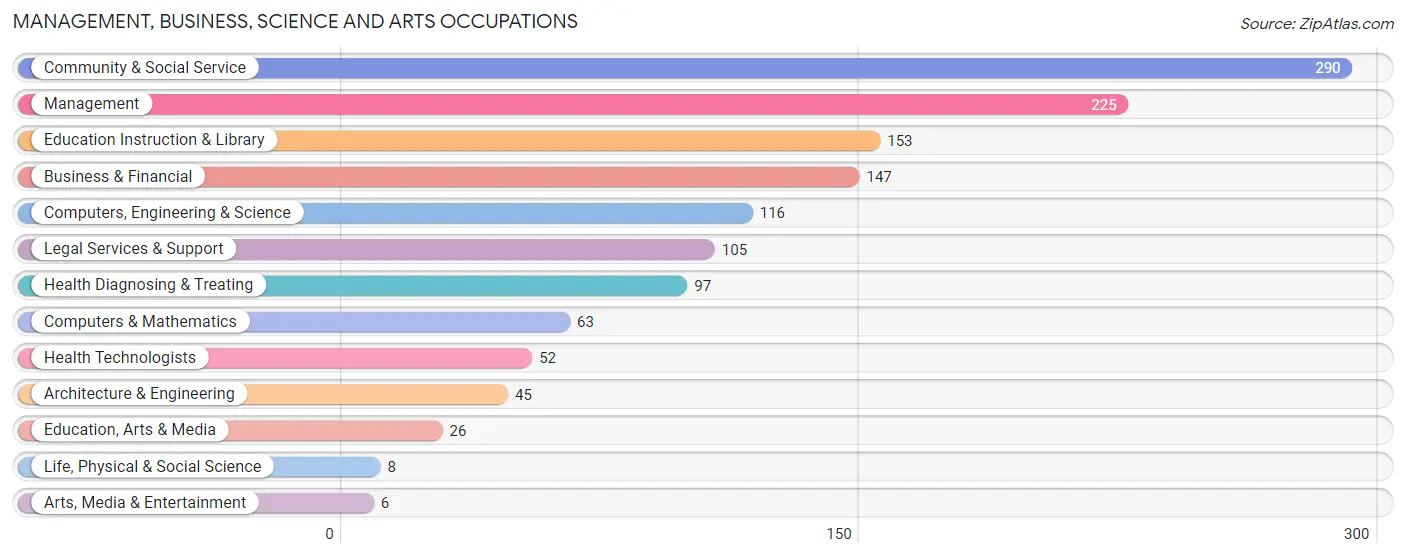
Management, Business, Science and Arts Occupations
The most common Management, Business, Science and Arts occupations in Carlisle are Community & Social Service (290 | 13.6%), Management (225 | 10.5%), Education Instruction & Library (153 | 7.1%), Business & Financial (147 | 6.9%), and Computers, Engineering & Science (116 | 5.4%).
Management, Business, Science and Arts Occupations by Sex
Within the Management, Business, Science and Arts occupations in Carlisle, the most male-oriented occupations are Architecture & Engineering (100.0%), Computers & Mathematics (90.5%), and Computers, Engineering & Science (87.9%), while the most female-oriented occupations are Life, Physical & Social Science (100.0%), Legal Services & Support (100.0%), and Arts, Media & Entertainment (100.0%).
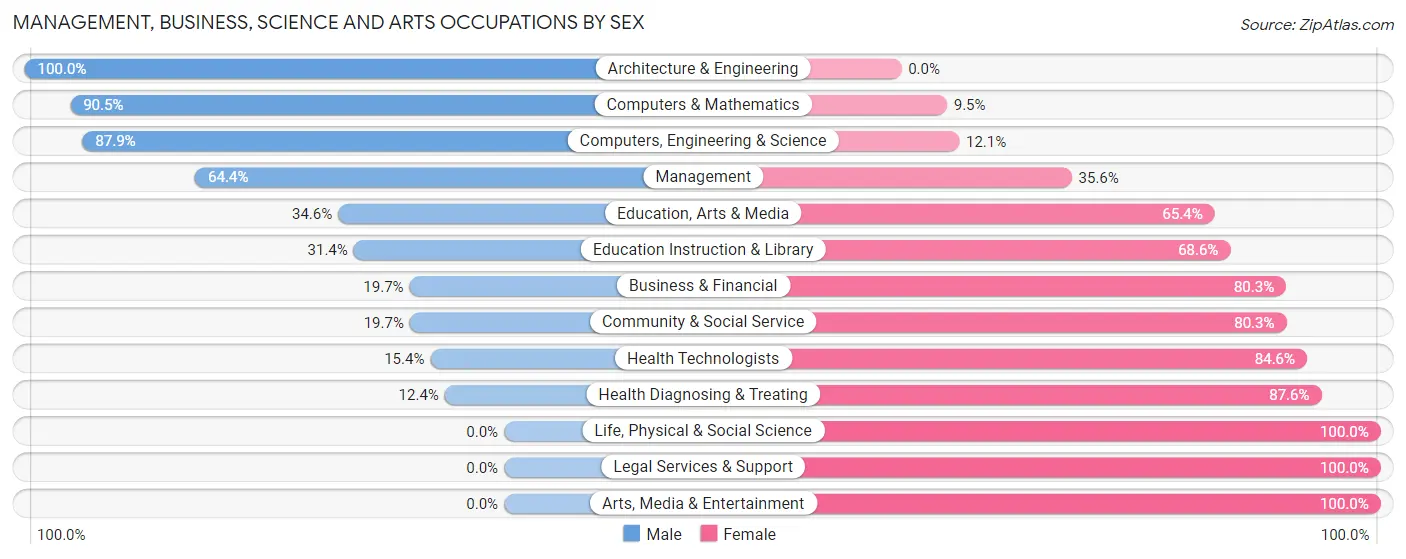
| Occupation | Male | Female |
| Management | 145 (64.4%) | 80 (35.6%) |
| Business & Financial | 29 (19.7%) | 118 (80.3%) |
| Computers, Engineering & Science | 102 (87.9%) | 14 (12.1%) |
| Computers & Mathematics | 57 (90.5%) | 6 (9.5%) |
| Architecture & Engineering | 45 (100.0%) | 0 (0.0%) |
| Life, Physical & Social Science | 0 (0.0%) | 8 (100.0%) |
| Community & Social Service | 57 (19.7%) | 233 (80.3%) |
| Education, Arts & Media | 9 (34.6%) | 17 (65.4%) |
| Legal Services & Support | 0 (0.0%) | 105 (100.0%) |
| Education Instruction & Library | 48 (31.4%) | 105 (68.6%) |
| Arts, Media & Entertainment | 0 (0.0%) | 6 (100.0%) |
| Health Diagnosing & Treating | 12 (12.4%) | 85 (87.6%) |
| Health Technologists | 8 (15.4%) | 44 (84.6%) |
| Total (Category) | 345 (39.4%) | 530 (60.6%) |
| Total (Overall) | 1,073 (50.1%) | 1,068 (49.9%) |
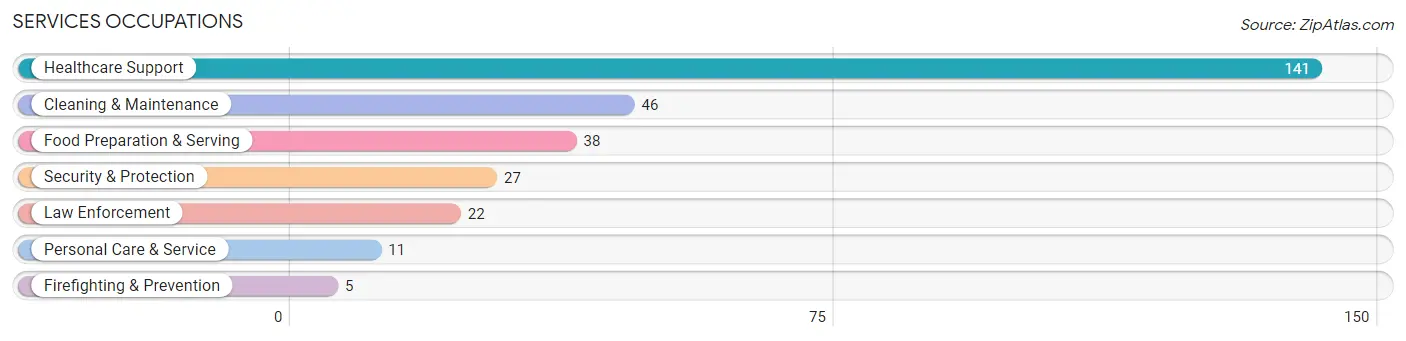
Services Occupations
The most common Services occupations in Carlisle are Healthcare Support (141 | 6.6%), Cleaning & Maintenance (46 | 2.1%), Food Preparation & Serving (38 | 1.8%), Security & Protection (27 | 1.3%), and Law Enforcement (22 | 1.0%).
Services Occupations by Sex
Within the Services occupations in Carlisle, the most male-oriented occupations are Security & Protection (100.0%), Firefighting & Prevention (100.0%), and Law Enforcement (100.0%), while the most female-oriented occupations are Healthcare Support (80.8%), Food Preparation & Serving (73.7%), and Cleaning & Maintenance (15.2%).
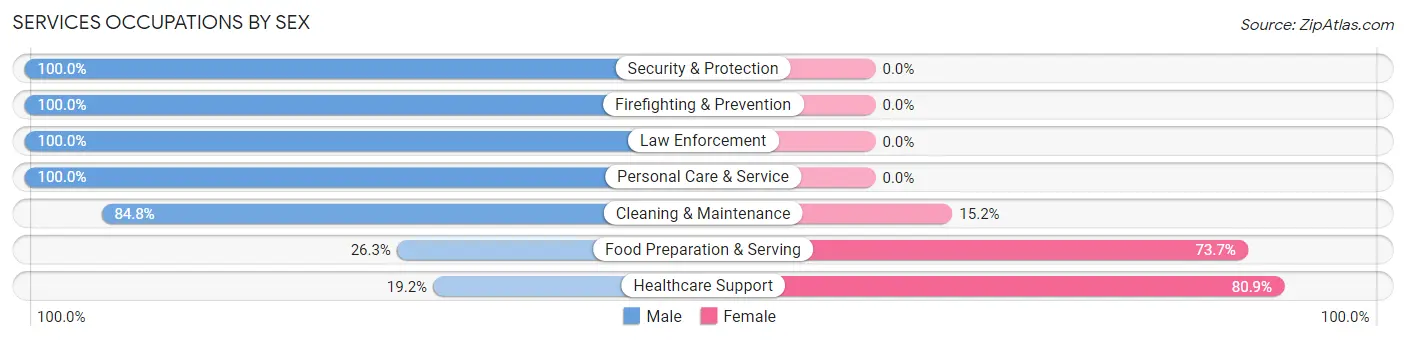
| Occupation | Male | Female |
| Healthcare Support | 27 (19.2%) | 114 (80.8%) |
| Security & Protection | 27 (100.0%) | 0 (0.0%) |
| Firefighting & Prevention | 5 (100.0%) | 0 (0.0%) |
| Law Enforcement | 22 (100.0%) | 0 (0.0%) |
| Food Preparation & Serving | 10 (26.3%) | 28 (73.7%) |
| Cleaning & Maintenance | 39 (84.8%) | 7 (15.2%) |
| Personal Care & Service | 11 (100.0%) | 0 (0.0%) |
| Total (Category) | 114 (43.3%) | 149 (56.7%) |
| Total (Overall) | 1,073 (50.1%) | 1,068 (49.9%) |
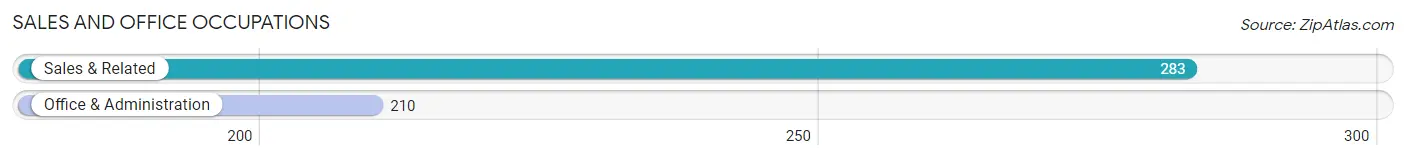
Sales and Office Occupations
The most common Sales and Office occupations in Carlisle are Sales & Related (283 | 13.2%), and Office & Administration (210 | 9.8%).
Sales and Office Occupations by Sex
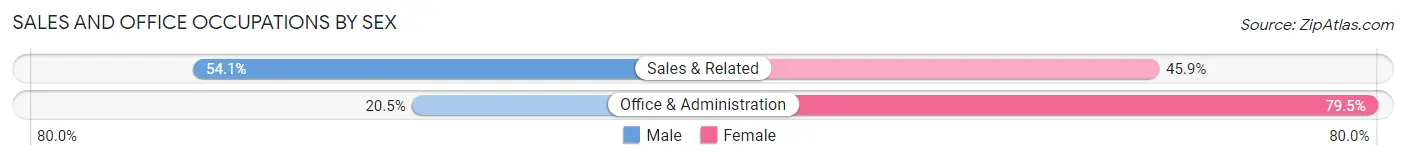
| Occupation | Male | Female |
| Sales & Related | 153 (54.1%) | 130 (45.9%) |
| Office & Administration | 43 (20.5%) | 167 (79.5%) |
| Total (Category) | 196 (39.8%) | 297 (60.2%) |
| Total (Overall) | 1,073 (50.1%) | 1,068 (49.9%) |
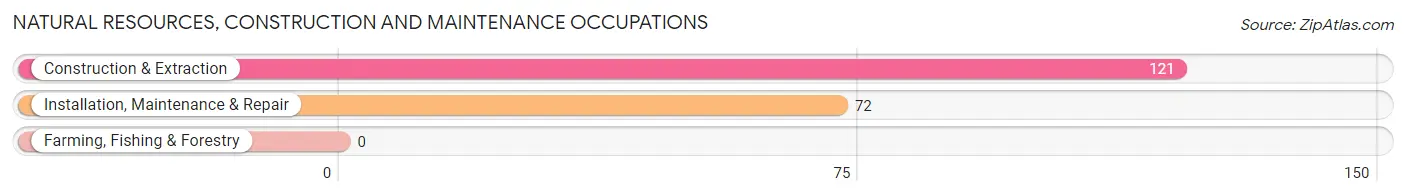
Natural Resources, Construction and Maintenance Occupations
The most common Natural Resources, Construction and Maintenance occupations in Carlisle are Construction & Extraction (121 | 5.7%), and Installation, Maintenance & Repair (72 | 3.4%).
Natural Resources, Construction and Maintenance Occupations by Sex
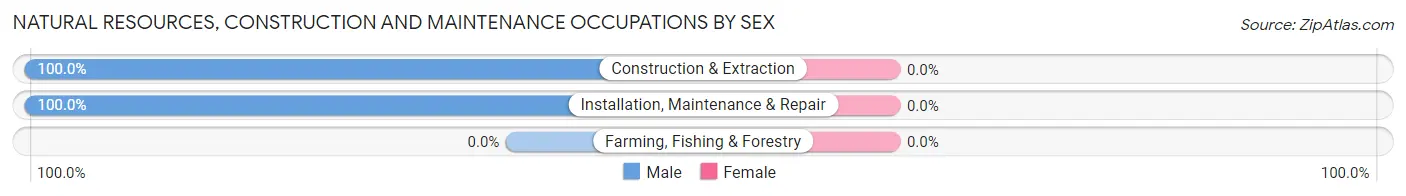
| Occupation | Male | Female |
| Farming, Fishing & Forestry | 0 (0.0%) | 0 (0.0%) |
| Construction & Extraction | 121 (100.0%) | 0 (0.0%) |
| Installation, Maintenance & Repair | 72 (100.0%) | 0 (0.0%) |
| Total (Category) | 193 (100.0%) | 0 (0.0%) |
| Total (Overall) | 1,073 (50.1%) | 1,068 (49.9%) |
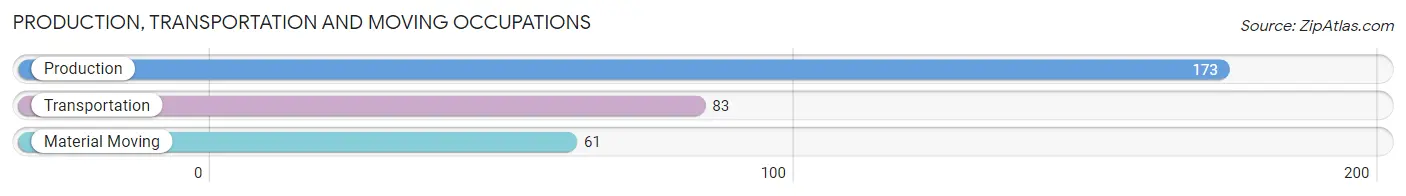
Production, Transportation and Moving Occupations
The most common Production, Transportation and Moving occupations in Carlisle are Production (173 | 8.1%), Transportation (83 | 3.9%), and Material Moving (61 | 2.9%).
Production, Transportation and Moving Occupations by Sex
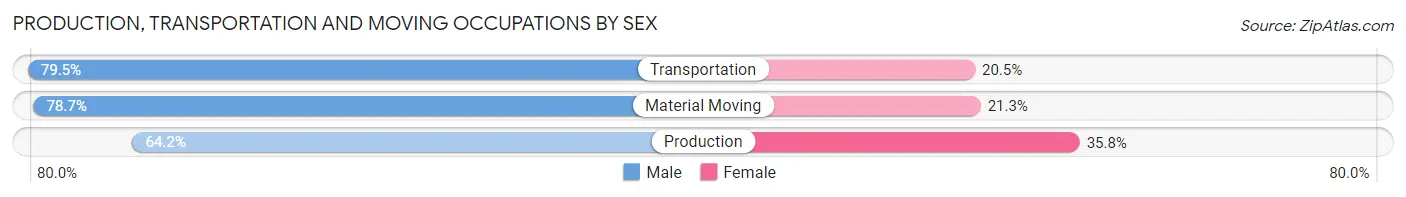
| Occupation | Male | Female |
| Production | 111 (64.2%) | 62 (35.8%) |
| Transportation | 66 (79.5%) | 17 (20.5%) |
| Material Moving | 48 (78.7%) | 13 (21.3%) |
| Total (Category) | 225 (71.0%) | 92 (29.0%) |
| Total (Overall) | 1,073 (50.1%) | 1,068 (49.9%) |
Employment Industries by Sex in Carlisle
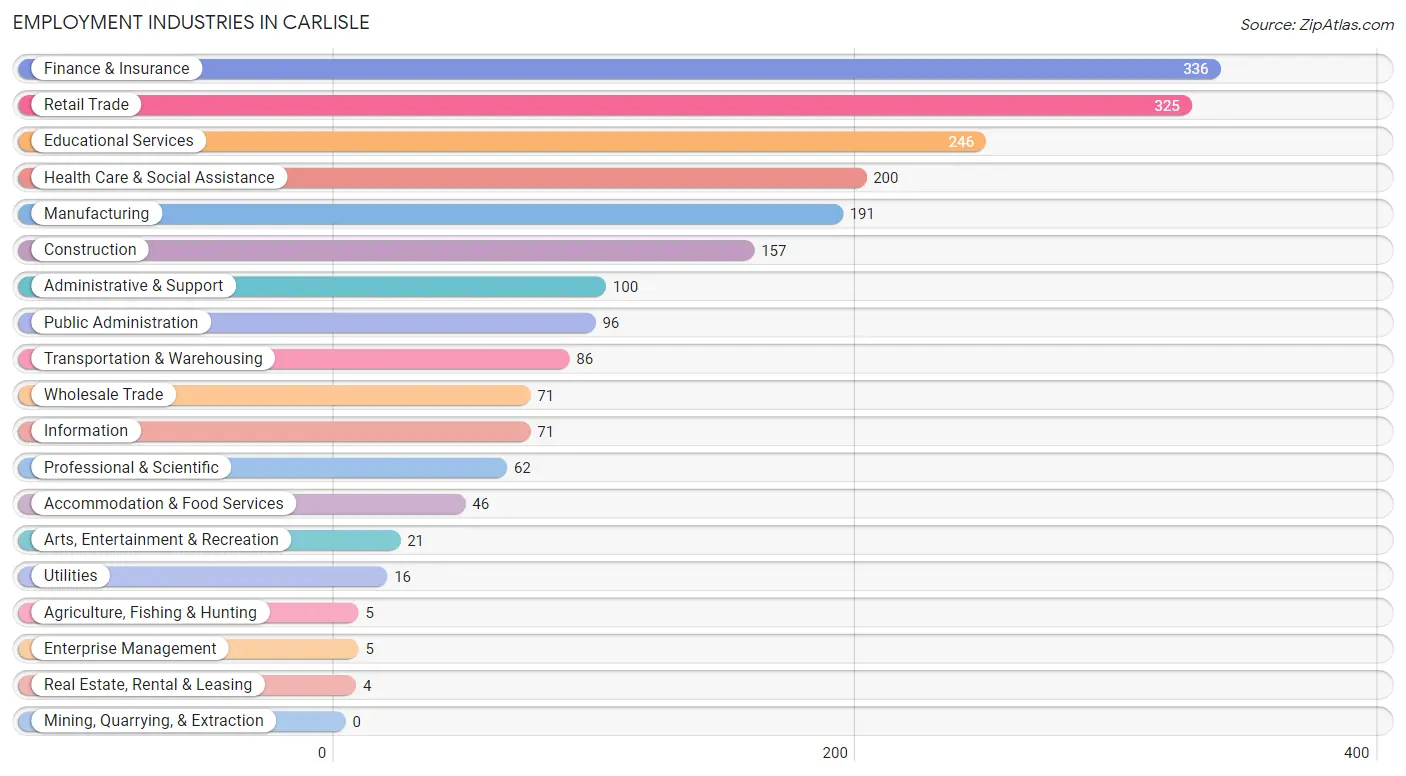
Employment Industries in Carlisle
The major employment industries in Carlisle include Finance & Insurance (336 | 15.7%), Retail Trade (325 | 15.2%), Educational Services (246 | 11.5%), Health Care & Social Assistance (200 | 9.3%), and Manufacturing (191 | 8.9%).
Employment Industries by Sex in Carlisle
The Carlisle industries that see more men than women are Agriculture, Fishing & Hunting (100.0%), Construction (100.0%), and Manufacturing (100.0%), whereas the industries that tend to have a higher number of women are Real Estate, Rental & Leasing (100.0%), Accommodation & Food Services (100.0%), and Health Care & Social Assistance (94.0%).
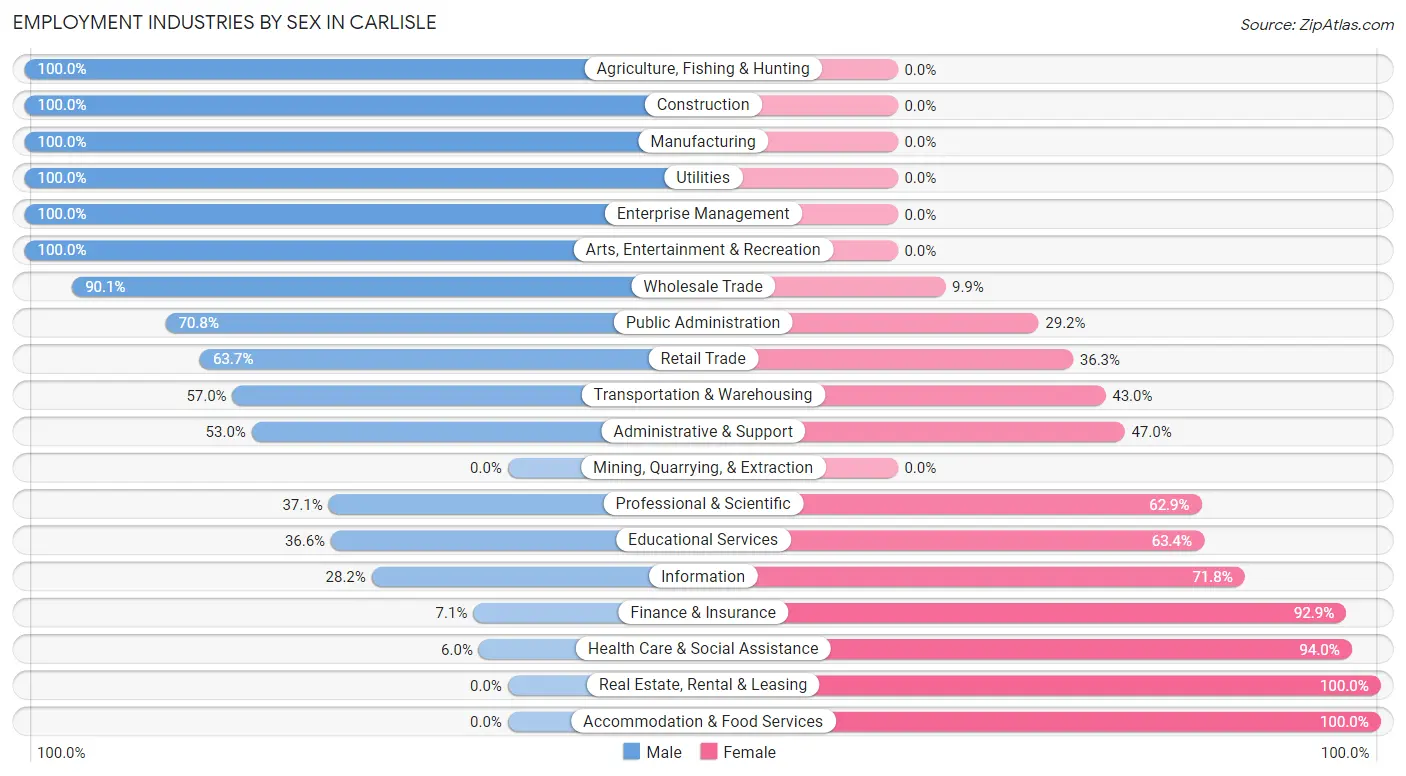
| Industry | Male | Female |
| Agriculture, Fishing & Hunting | 5 (100.0%) | 0 (0.0%) |
| Mining, Quarrying, & Extraction | 0 (0.0%) | 0 (0.0%) |
| Construction | 157 (100.0%) | 0 (0.0%) |
| Manufacturing | 191 (100.0%) | 0 (0.0%) |
| Wholesale Trade | 64 (90.1%) | 7 (9.9%) |
| Retail Trade | 207 (63.7%) | 118 (36.3%) |
| Transportation & Warehousing | 49 (57.0%) | 37 (43.0%) |
| Utilities | 16 (100.0%) | 0 (0.0%) |
| Information | 20 (28.2%) | 51 (71.8%) |
| Finance & Insurance | 24 (7.1%) | 312 (92.9%) |
| Real Estate, Rental & Leasing | 0 (0.0%) | 4 (100.0%) |
| Professional & Scientific | 23 (37.1%) | 39 (62.9%) |
| Enterprise Management | 5 (100.0%) | 0 (0.0%) |
| Administrative & Support | 53 (53.0%) | 47 (47.0%) |
| Educational Services | 90 (36.6%) | 156 (63.4%) |
| Health Care & Social Assistance | 12 (6.0%) | 188 (94.0%) |
| Arts, Entertainment & Recreation | 21 (100.0%) | 0 (0.0%) |
| Accommodation & Food Services | 0 (0.0%) | 46 (100.0%) |
| Public Administration | 68 (70.8%) | 28 (29.2%) |
| Total | 1,073 (50.1%) | 1,068 (49.9%) |
Education in Carlisle
School Enrollment in Carlisle
The most common levels of schooling among the 1,107 students in Carlisle are middle school (283 | 25.6%), elementary school (225 | 20.3%), and high school (195 | 17.6%).
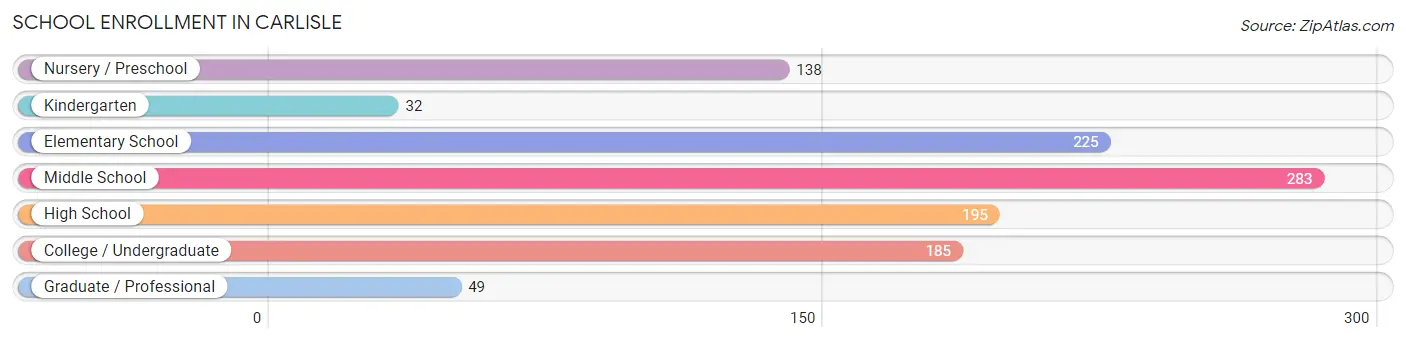
| School Level | # Students | % Students |
| Nursery / Preschool | 138 | 12.5% |
| Kindergarten | 32 | 2.9% |
| Elementary School | 225 | 20.3% |
| Middle School | 283 | 25.6% |
| High School | 195 | 17.6% |
| College / Undergraduate | 185 | 16.7% |
| Graduate / Professional | 49 | 4.4% |
| Total | 1,107 | 100.0% |
School Enrollment by Age by Funding Source in Carlisle
Out of a total of 1,107 students who are enrolled in schools in Carlisle, 79 (7.1%) attend a private institution, while the remaining 1,028 (92.9%) are enrolled in public schools. The age group of 35 years and over has the highest likelihood of being enrolled in private schools, with 12 (21.0% in the age bracket) enrolled. Conversely, the age group of 20 to 24 year olds has the lowest likelihood of being enrolled in a private school, with 78 (100.0% in the age bracket) attending a public institution.
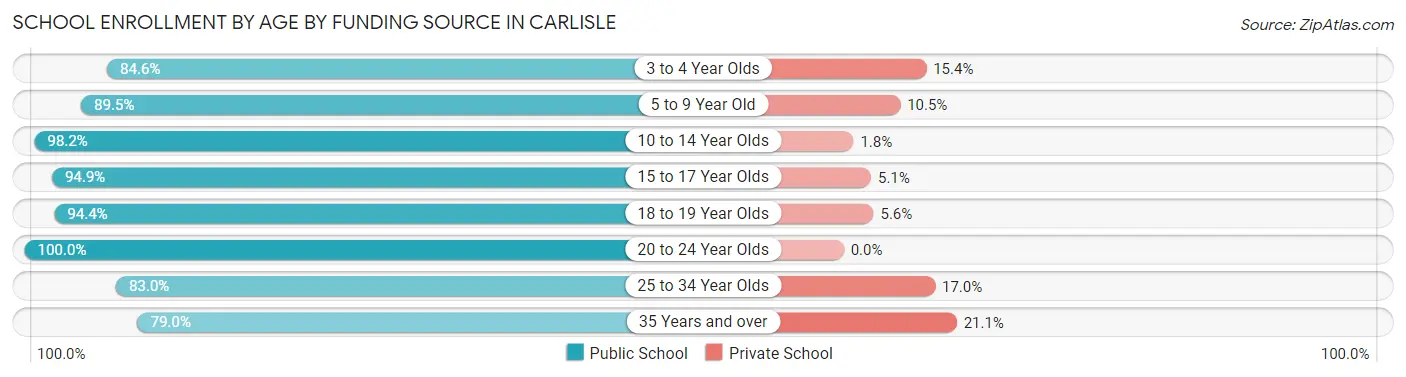
| Age Bracket | Public School | Private School |
| 3 to 4 Year Olds | 55 (84.6%) | 10 (15.4%) |
| 5 to 9 Year Old | 255 (89.5%) | 30 (10.5%) |
| 10 to 14 Year Olds | 322 (98.2%) | 6 (1.8%) |
| 15 to 17 Year Olds | 149 (94.9%) | 8 (5.1%) |
| 18 to 19 Year Olds | 85 (94.4%) | 5 (5.6%) |
| 20 to 24 Year Olds | 78 (100.0%) | 0 (0.0%) |
| 25 to 34 Year Olds | 39 (83.0%) | 8 (17.0%) |
| 35 Years and over | 45 (78.9%) | 12 (21.0%) |
| Total | 1,028 (92.9%) | 79 (7.1%) |
Educational Attainment by Field of Study in Carlisle
Education (274 | 29.6%), business (148 | 16.0%), arts & humanities (120 | 13.0%), physical & health sciences (80 | 8.6%), and bio, nature & agricultural (60 | 6.5%) are the most common fields of study among 926 individuals in Carlisle who have obtained a bachelor's degree or higher.
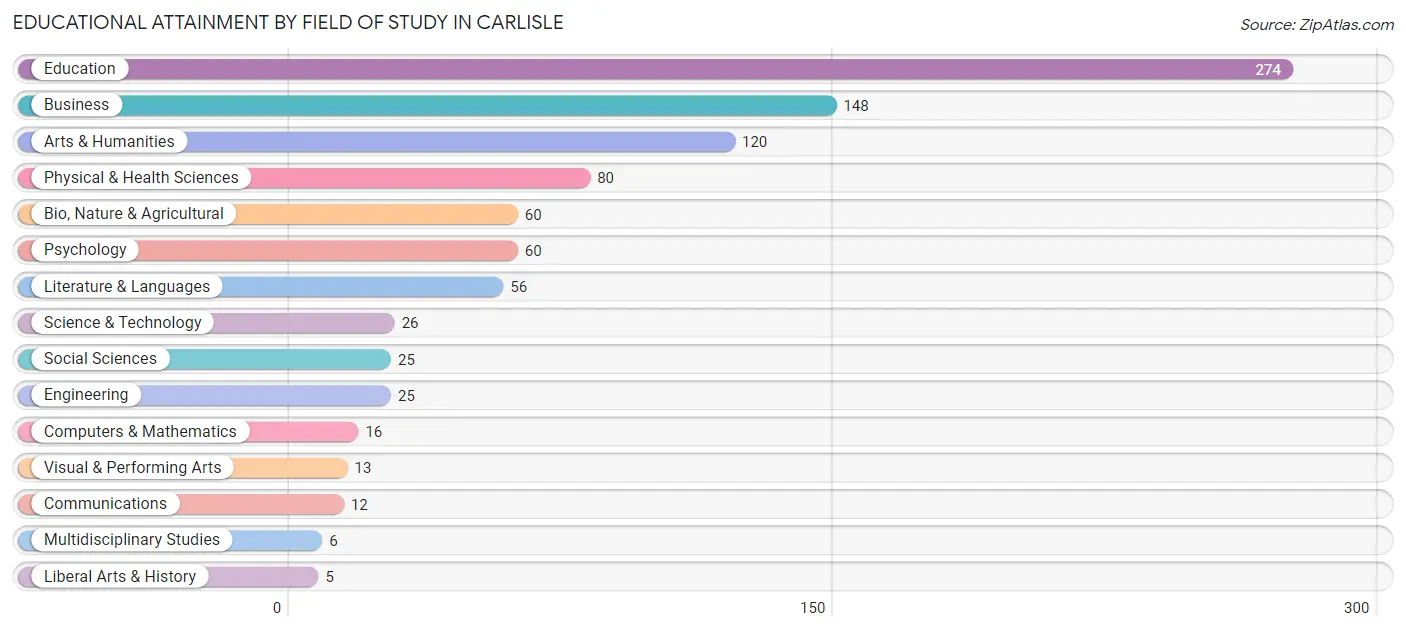
| Field of Study | # Graduates | % Graduates |
| Computers & Mathematics | 16 | 1.7% |
| Bio, Nature & Agricultural | 60 | 6.5% |
| Physical & Health Sciences | 80 | 8.6% |
| Psychology | 60 | 6.5% |
| Social Sciences | 25 | 2.7% |
| Engineering | 25 | 2.7% |
| Multidisciplinary Studies | 6 | 0.6% |
| Science & Technology | 26 | 2.8% |
| Business | 148 | 16.0% |
| Education | 274 | 29.6% |
| Literature & Languages | 56 | 6.0% |
| Liberal Arts & History | 5 | 0.5% |
| Visual & Performing Arts | 13 | 1.4% |
| Communications | 12 | 1.3% |
| Arts & Humanities | 120 | 13.0% |
| Total | 926 | 100.0% |
Transportation & Commute in Carlisle
Vehicle Availability by Sex in Carlisle
The most prevalent vehicle ownership categories in Carlisle are males with 2 vehicles (547, accounting for 51.7%) and females with 2 vehicles (430, making up 51.4%).
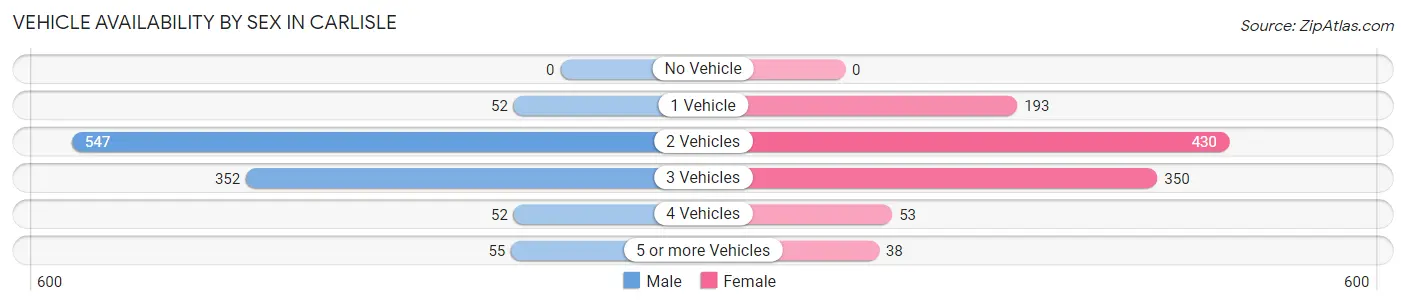
| Vehicles Available | Male | Female |
| No Vehicle | 0 (0.0%) | 0 (0.0%) |
| 1 Vehicle | 52 (4.9%) | 193 (18.1%) |
| 2 Vehicles | 547 (51.7%) | 430 (40.4%) |
| 3 Vehicles | 352 (33.3%) | 350 (32.9%) |
| 4 Vehicles | 52 (4.9%) | 53 (5.0%) |
| 5 or more Vehicles | 55 (5.2%) | 38 (3.6%) |
| Total | 1,058 (100.0%) | 1,064 (100.0%) |
Commute Time in Carlisle
The most frequently occuring commute durations in Carlisle are 20 to 24 minutes (444 commuters, 23.2%), 25 to 29 minutes (404 commuters, 21.1%), and 30 to 34 minutes (354 commuters, 18.5%).
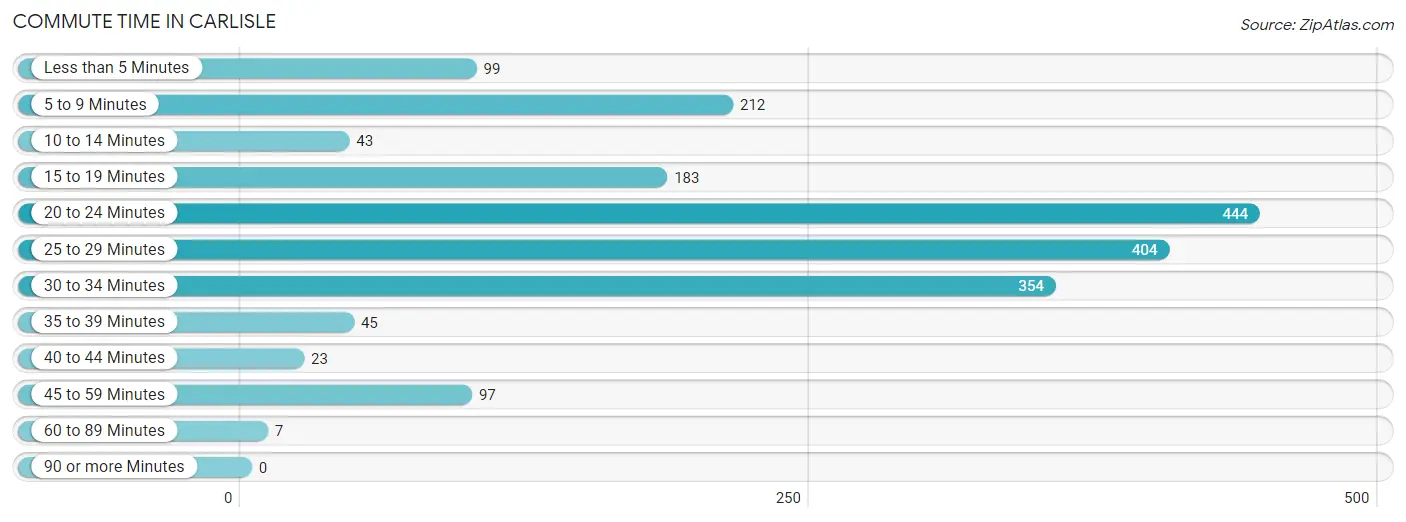
| Commute Time | # Commuters | % Commuters |
| Less than 5 Minutes | 99 | 5.2% |
| 5 to 9 Minutes | 212 | 11.1% |
| 10 to 14 Minutes | 43 | 2.2% |
| 15 to 19 Minutes | 183 | 9.6% |
| 20 to 24 Minutes | 444 | 23.2% |
| 25 to 29 Minutes | 404 | 21.1% |
| 30 to 34 Minutes | 354 | 18.5% |
| 35 to 39 Minutes | 45 | 2.4% |
| 40 to 44 Minutes | 23 | 1.2% |
| 45 to 59 Minutes | 97 | 5.1% |
| 60 to 89 Minutes | 7 | 0.4% |
| 90 or more Minutes | 0 | 0.0% |
Commute Time by Sex in Carlisle
The most common commute times in Carlisle are 20 to 24 minutes (348 commuters, 34.6%) for males and 25 to 29 minutes (260 commuters, 28.7%) for females.
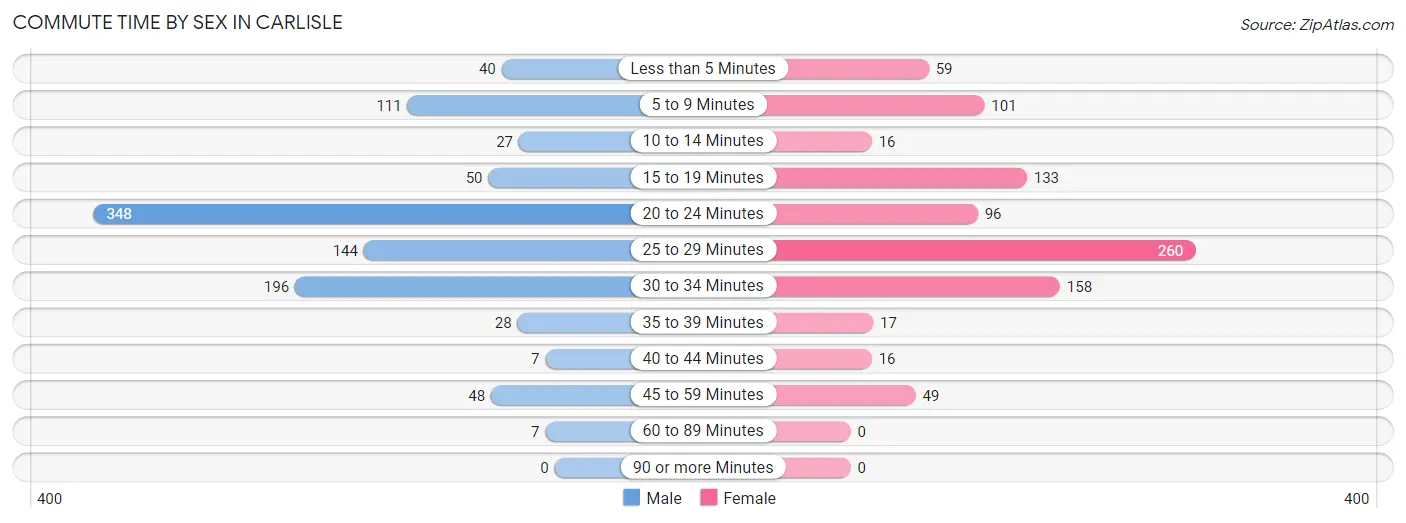
| Commute Time | Male | Female |
| Less than 5 Minutes | 40 (4.0%) | 59 (6.5%) |
| 5 to 9 Minutes | 111 (11.0%) | 101 (11.2%) |
| 10 to 14 Minutes | 27 (2.7%) | 16 (1.8%) |
| 15 to 19 Minutes | 50 (5.0%) | 133 (14.7%) |
| 20 to 24 Minutes | 348 (34.6%) | 96 (10.6%) |
| 25 to 29 Minutes | 144 (14.3%) | 260 (28.7%) |
| 30 to 34 Minutes | 196 (19.5%) | 158 (17.5%) |
| 35 to 39 Minutes | 28 (2.8%) | 17 (1.9%) |
| 40 to 44 Minutes | 7 (0.7%) | 16 (1.8%) |
| 45 to 59 Minutes | 48 (4.8%) | 49 (5.4%) |
| 60 to 89 Minutes | 7 (0.7%) | 0 (0.0%) |
| 90 or more Minutes | 0 (0.0%) | 0 (0.0%) |
Time of Departure to Work by Sex in Carlisle
The most frequent times of departure to work in Carlisle are 6:00 AM to 6:29 AM (291, 28.9%) for males and 7:30 AM to 7:59 AM (221, 24.4%) for females.
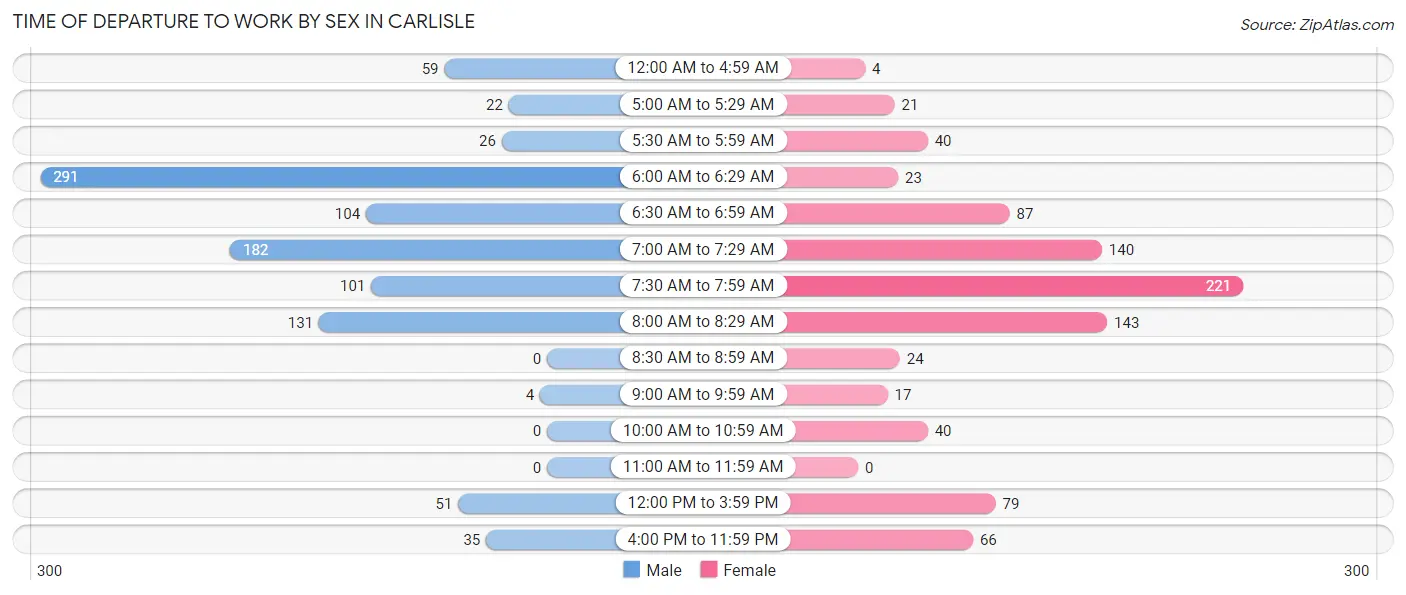
| Time of Departure | Male | Female |
| 12:00 AM to 4:59 AM | 59 (5.9%) | 4 (0.4%) |
| 5:00 AM to 5:29 AM | 22 (2.2%) | 21 (2.3%) |
| 5:30 AM to 5:59 AM | 26 (2.6%) | 40 (4.4%) |
| 6:00 AM to 6:29 AM | 291 (28.9%) | 23 (2.5%) |
| 6:30 AM to 6:59 AM | 104 (10.3%) | 87 (9.6%) |
| 7:00 AM to 7:29 AM | 182 (18.1%) | 140 (15.5%) |
| 7:30 AM to 7:59 AM | 101 (10.0%) | 221 (24.4%) |
| 8:00 AM to 8:29 AM | 131 (13.0%) | 143 (15.8%) |
| 8:30 AM to 8:59 AM | 0 (0.0%) | 24 (2.6%) |
| 9:00 AM to 9:59 AM | 4 (0.4%) | 17 (1.9%) |
| 10:00 AM to 10:59 AM | 0 (0.0%) | 40 (4.4%) |
| 11:00 AM to 11:59 AM | 0 (0.0%) | 0 (0.0%) |
| 12:00 PM to 3:59 PM | 51 (5.1%) | 79 (8.7%) |
| 4:00 PM to 11:59 PM | 35 (3.5%) | 66 (7.3%) |
| Total | 1,006 (100.0%) | 905 (100.0%) |
Housing Occupancy in Carlisle
Occupancy by Ownership in Carlisle
Of the total 1,542 dwellings in Carlisle, owner-occupied units account for 1,253 (81.3%), while renter-occupied units make up 289 (18.7%).
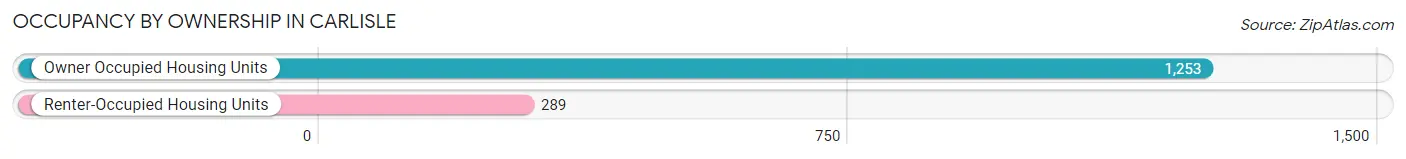
| Occupancy | # Housing Units | % Housing Units |
| Owner Occupied Housing Units | 1,253 | 81.3% |
| Renter-Occupied Housing Units | 289 | 18.7% |
| Total Occupied Housing Units | 1,542 | 100.0% |
Occupancy by Household Size in Carlisle
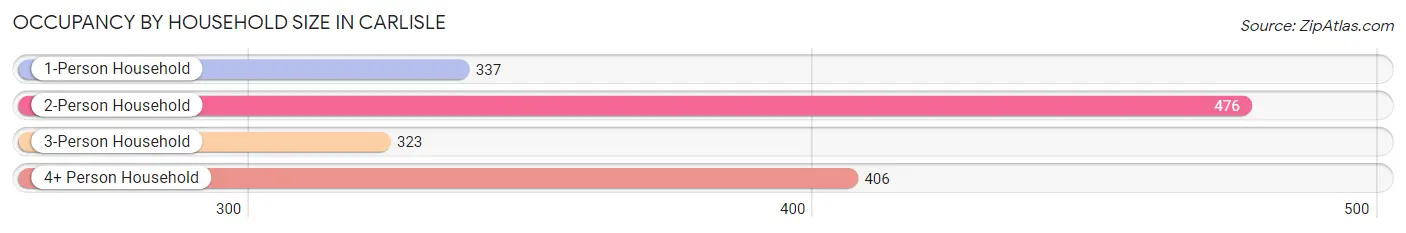
| Household Size | # Housing Units | % Housing Units |
| 1-Person Household | 337 | 21.8% |
| 2-Person Household | 476 | 30.9% |
| 3-Person Household | 323 | 20.9% |
| 4+ Person Household | 406 | 26.3% |
| Total Housing Units | 1,542 | 100.0% |
Occupancy by Ownership by Household Size in Carlisle
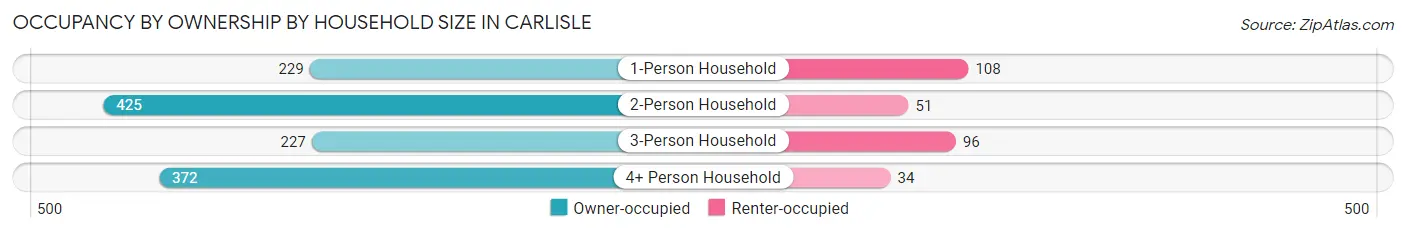
| Household Size | Owner-occupied | Renter-occupied |
| 1-Person Household | 229 (67.9%) | 108 (32.1%) |
| 2-Person Household | 425 (89.3%) | 51 (10.7%) |
| 3-Person Household | 227 (70.3%) | 96 (29.7%) |
| 4+ Person Household | 372 (91.6%) | 34 (8.4%) |
| Total Housing Units | 1,253 (81.3%) | 289 (18.7%) |
Occupancy by Educational Attainment in Carlisle
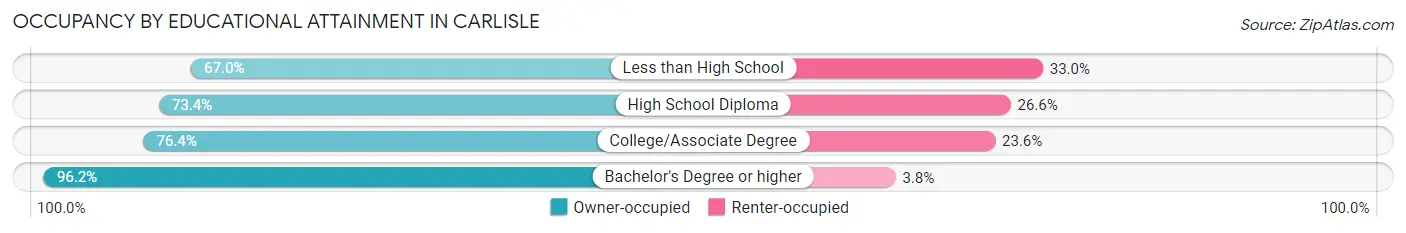
| Household Size | Owner-occupied | Renter-occupied |
| Less than High School | 73 (67.0%) | 36 (33.0%) |
| High School Diploma | 314 (73.4%) | 114 (26.6%) |
| College/Associate Degree | 389 (76.4%) | 120 (23.6%) |
| Bachelor's Degree or higher | 477 (96.2%) | 19 (3.8%) |
Occupancy by Age of Householder in Carlisle
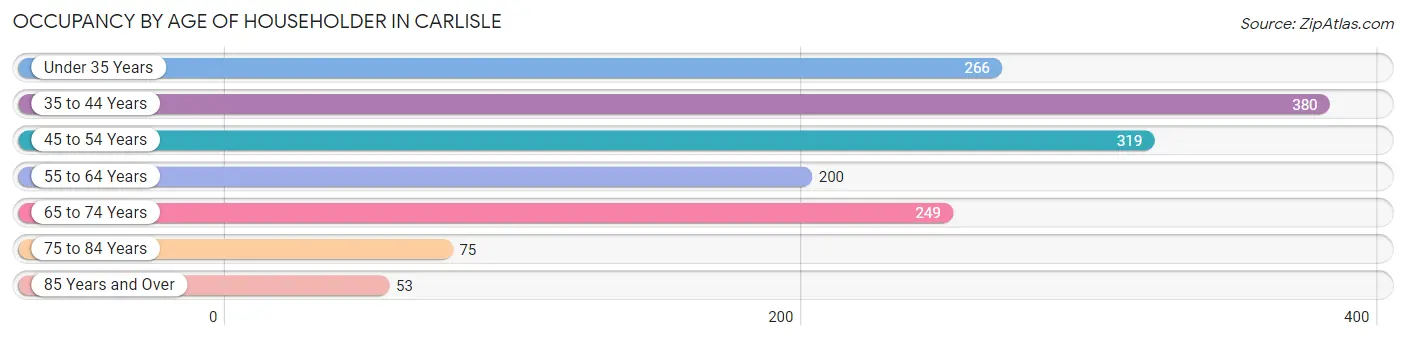
| Age Bracket | # Households | % Households |
| Under 35 Years | 266 | 17.2% |
| 35 to 44 Years | 380 | 24.6% |
| 45 to 54 Years | 319 | 20.7% |
| 55 to 64 Years | 200 | 13.0% |
| 65 to 74 Years | 249 | 16.2% |
| 75 to 84 Years | 75 | 4.9% |
| 85 Years and Over | 53 | 3.4% |
| Total | 1,542 | 100.0% |
Housing Finances in Carlisle
Median Income by Occupancy in Carlisle
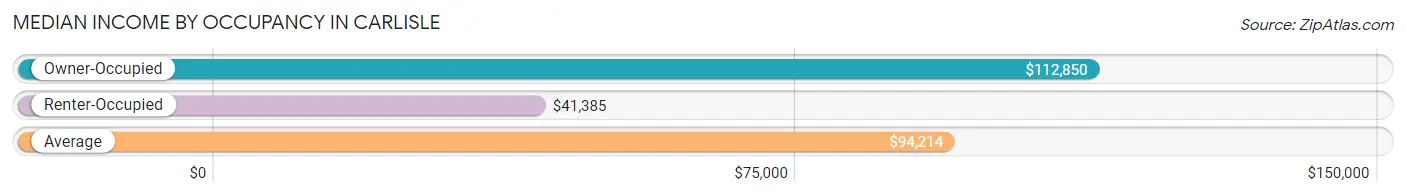
| Occupancy Type | # Households | Median Income |
| Owner-Occupied | 1,253 (81.3%) | $112,850 |
| Renter-Occupied | 289 (18.7%) | $41,385 |
| Average | 1,542 (100.0%) | $94,214 |
Occupancy by Householder Income Bracket in Carlisle
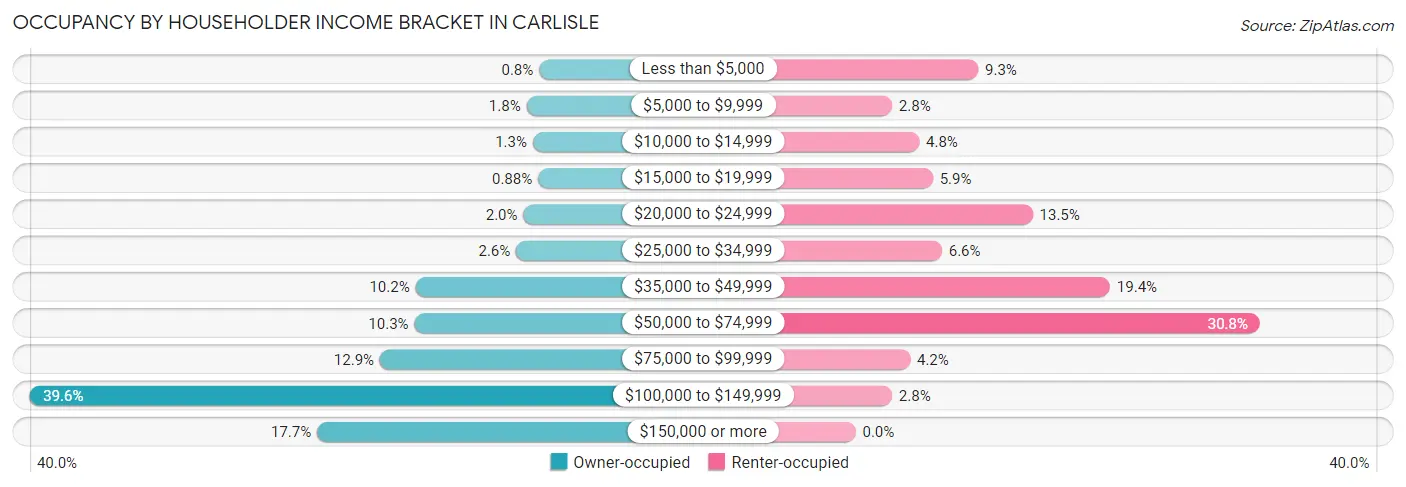
| Income Bracket | Owner-occupied | Renter-occupied |
| Less than $5,000 | 10 (0.8%) | 27 (9.3%) |
| $5,000 to $9,999 | 22 (1.8%) | 8 (2.8%) |
| $10,000 to $14,999 | 16 (1.3%) | 14 (4.8%) |
| $15,000 to $19,999 | 11 (0.9%) | 17 (5.9%) |
| $20,000 to $24,999 | 25 (2.0%) | 39 (13.5%) |
| $25,000 to $34,999 | 32 (2.5%) | 19 (6.6%) |
| $35,000 to $49,999 | 128 (10.2%) | 56 (19.4%) |
| $50,000 to $74,999 | 129 (10.3%) | 89 (30.8%) |
| $75,000 to $99,999 | 162 (12.9%) | 12 (4.2%) |
| $100,000 to $149,999 | 496 (39.6%) | 8 (2.8%) |
| $150,000 or more | 222 (17.7%) | 0 (0.0%) |
| Total | 1,253 (100.0%) | 289 (100.0%) |
Monthly Housing Cost Tiers in Carlisle
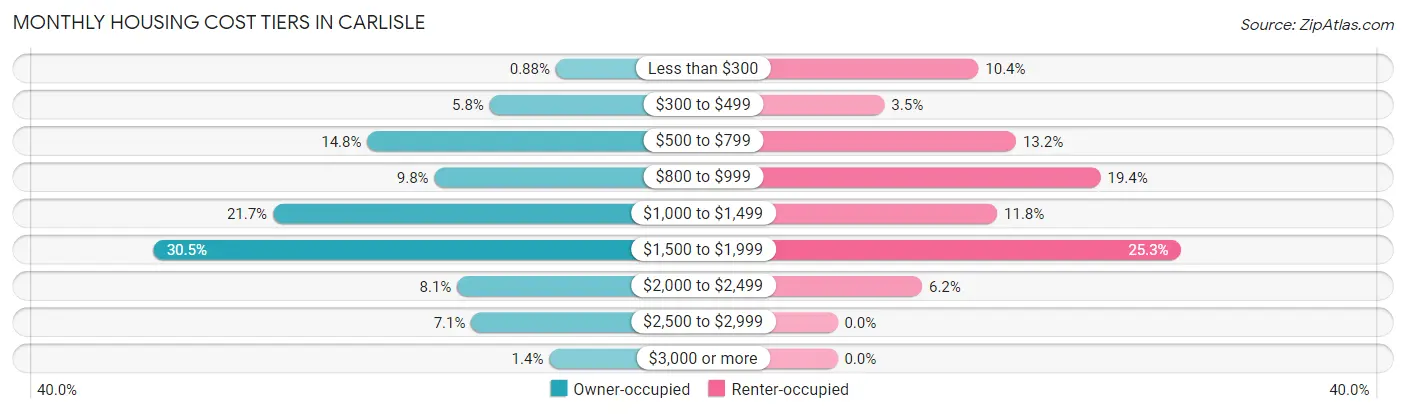
| Monthly Cost | Owner-occupied | Renter-occupied |
| Less than $300 | 11 (0.9%) | 30 (10.4%) |
| $300 to $499 | 72 (5.8%) | 10 (3.5%) |
| $500 to $799 | 185 (14.8%) | 38 (13.2%) |
| $800 to $999 | 123 (9.8%) | 56 (19.4%) |
| $1,000 to $1,499 | 272 (21.7%) | 34 (11.8%) |
| $1,500 to $1,999 | 382 (30.5%) | 73 (25.3%) |
| $2,000 to $2,499 | 102 (8.1%) | 18 (6.2%) |
| $2,500 to $2,999 | 89 (7.1%) | 0 (0.0%) |
| $3,000 or more | 17 (1.4%) | 0 (0.0%) |
| Total | 1,253 (100.0%) | 289 (100.0%) |
Physical Housing Characteristics in Carlisle
Housing Structures in Carlisle
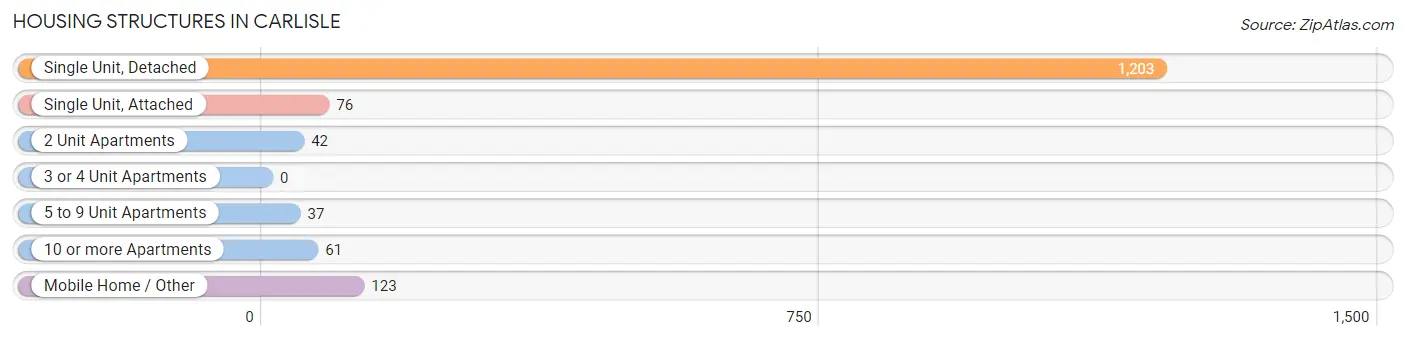
| Structure Type | # Housing Units | % Housing Units |
| Single Unit, Detached | 1,203 | 78.0% |
| Single Unit, Attached | 76 | 4.9% |
| 2 Unit Apartments | 42 | 2.7% |
| 3 or 4 Unit Apartments | 0 | 0.0% |
| 5 to 9 Unit Apartments | 37 | 2.4% |
| 10 or more Apartments | 61 | 4.0% |
| Mobile Home / Other | 123 | 8.0% |
| Total | 1,542 | 100.0% |
Housing Structures by Occupancy in Carlisle
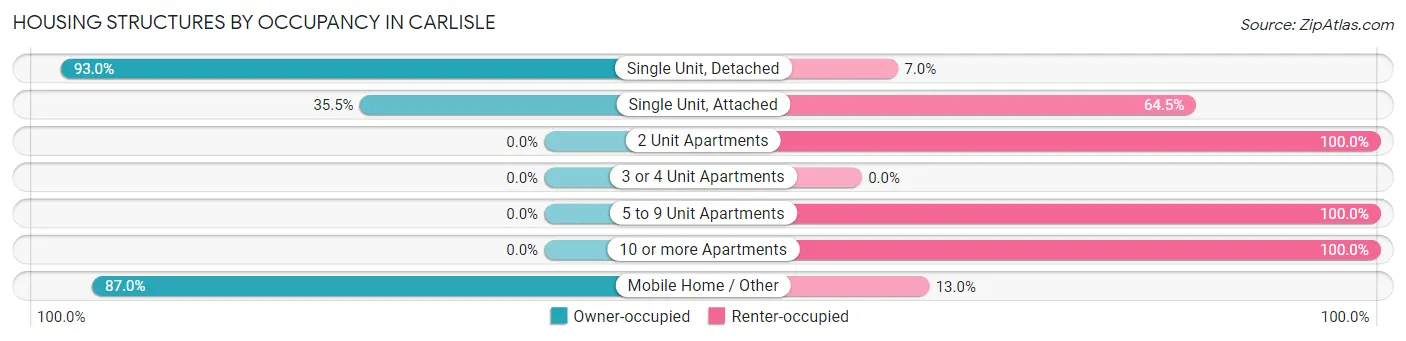
| Structure Type | Owner-occupied | Renter-occupied |
| Single Unit, Detached | 1,119 (93.0%) | 84 (7.0%) |
| Single Unit, Attached | 27 (35.5%) | 49 (64.5%) |
| 2 Unit Apartments | 0 (0.0%) | 42 (100.0%) |
| 3 or 4 Unit Apartments | 0 (0.0%) | 0 (0.0%) |
| 5 to 9 Unit Apartments | 0 (0.0%) | 37 (100.0%) |
| 10 or more Apartments | 0 (0.0%) | 61 (100.0%) |
| Mobile Home / Other | 107 (87.0%) | 16 (13.0%) |
| Total | 1,253 (81.3%) | 289 (18.7%) |
Housing Structures by Number of Rooms in Carlisle
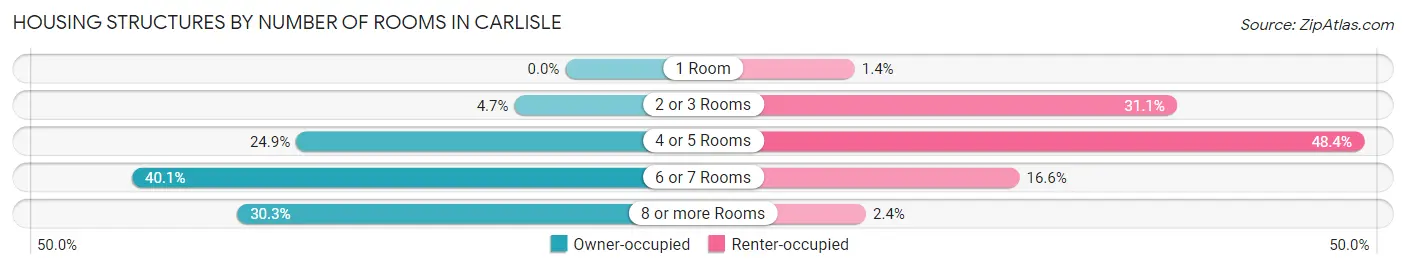
| Number of Rooms | Owner-occupied | Renter-occupied |
| 1 Room | 0 (0.0%) | 4 (1.4%) |
| 2 or 3 Rooms | 59 (4.7%) | 90 (31.1%) |
| 4 or 5 Rooms | 312 (24.9%) | 140 (48.4%) |
| 6 or 7 Rooms | 502 (40.1%) | 48 (16.6%) |
| 8 or more Rooms | 380 (30.3%) | 7 (2.4%) |
| Total | 1,253 (100.0%) | 289 (100.0%) |
Housing Structure by Heating Type in Carlisle
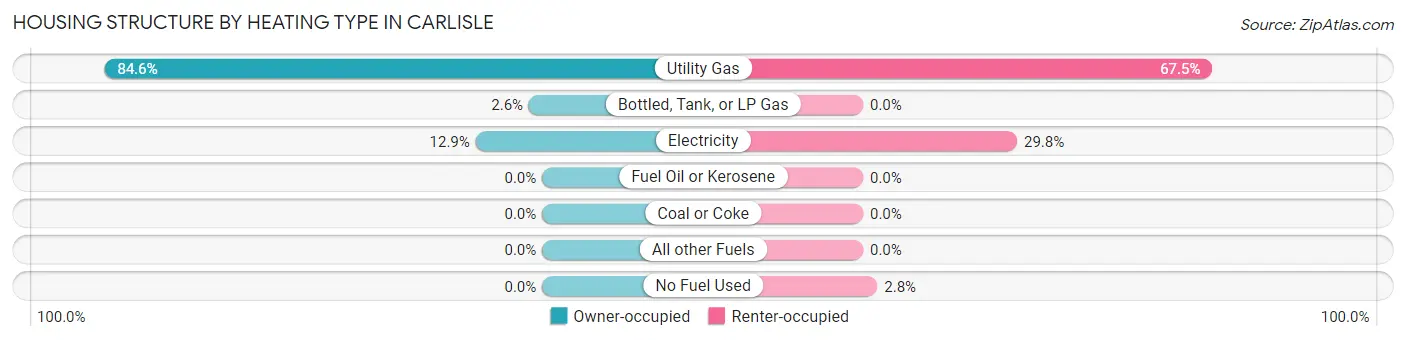
| Heating Type | Owner-occupied | Renter-occupied |
| Utility Gas | 1,060 (84.6%) | 195 (67.5%) |
| Bottled, Tank, or LP Gas | 32 (2.5%) | 0 (0.0%) |
| Electricity | 161 (12.9%) | 86 (29.8%) |
| Fuel Oil or Kerosene | 0 (0.0%) | 0 (0.0%) |
| Coal or Coke | 0 (0.0%) | 0 (0.0%) |
| All other Fuels | 0 (0.0%) | 0 (0.0%) |
| No Fuel Used | 0 (0.0%) | 8 (2.8%) |
| Total | 1,253 (100.0%) | 289 (100.0%) |
Household Vehicle Usage in Carlisle
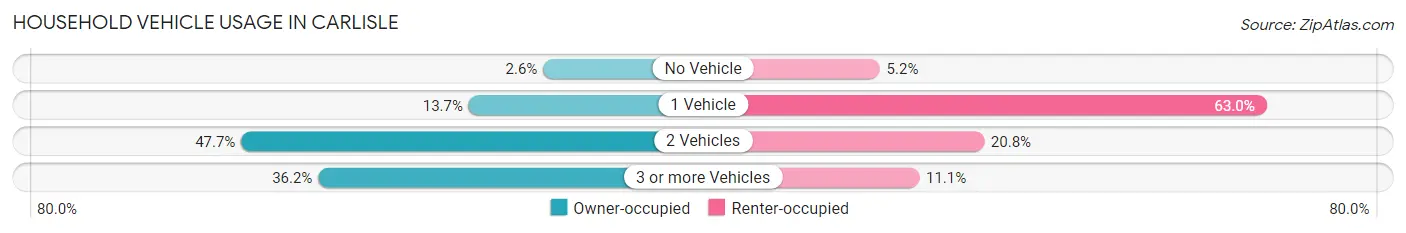
| Vehicles per Household | Owner-occupied | Renter-occupied |
| No Vehicle | 32 (2.5%) | 15 (5.2%) |
| 1 Vehicle | 171 (13.7%) | 182 (63.0%) |
| 2 Vehicles | 597 (47.6%) | 60 (20.8%) |
| 3 or more Vehicles | 453 (36.1%) | 32 (11.1%) |
| Total | 1,253 (100.0%) | 289 (100.0%) |
Real Estate & Mortgages in Carlisle
Real Estate and Mortgage Overview in Carlisle
| Characteristic | Without Mortgage | With Mortgage |
| Housing Units | 351 | 902 |
| Median Property Value | $148,100 | $195,700 |
| Median Household Income | $61,406 | $192 |
| Monthly Housing Costs | $590 | $17 |
| Real Estate Taxes | $2,264 | $45 |
Property Value by Mortgage Status in Carlisle
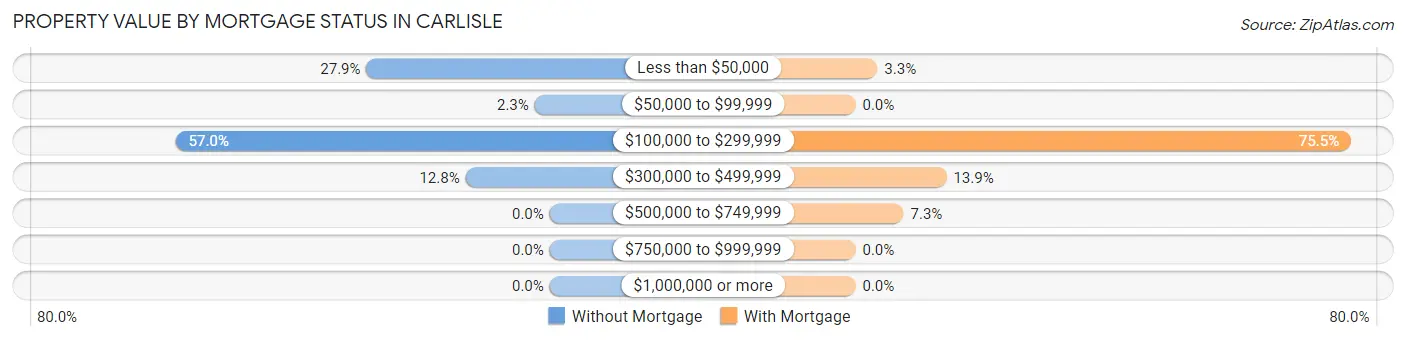
| Property Value | Without Mortgage | With Mortgage |
| Less than $50,000 | 98 (27.9%) | 30 (3.3%) |
| $50,000 to $99,999 | 8 (2.3%) | 0 (0.0%) |
| $100,000 to $299,999 | 200 (57.0%) | 681 (75.5%) |
| $300,000 to $499,999 | 45 (12.8%) | 125 (13.9%) |
| $500,000 to $749,999 | 0 (0.0%) | 66 (7.3%) |
| $750,000 to $999,999 | 0 (0.0%) | 0 (0.0%) |
| $1,000,000 or more | 0 (0.0%) | 0 (0.0%) |
| Total | 351 (100.0%) | 902 (100.0%) |
Household Income by Mortgage Status in Carlisle
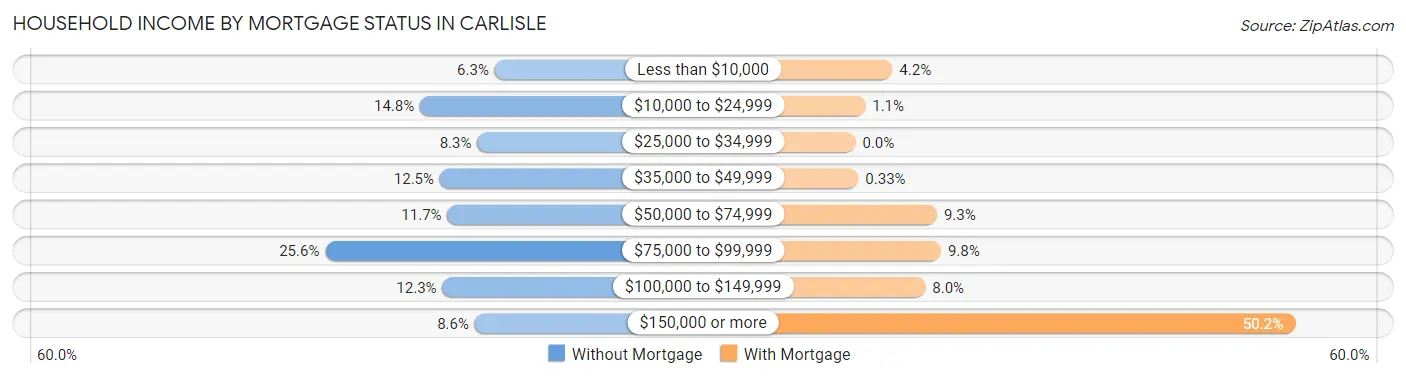
| Household Income | Without Mortgage | With Mortgage |
| Less than $10,000 | 22 (6.3%) | 38 (4.2%) |
| $10,000 to $24,999 | 52 (14.8%) | 10 (1.1%) |
| $25,000 to $34,999 | 29 (8.3%) | 0 (0.0%) |
| $35,000 to $49,999 | 44 (12.5%) | 3 (0.3%) |
| $50,000 to $74,999 | 41 (11.7%) | 84 (9.3%) |
| $75,000 to $99,999 | 90 (25.6%) | 88 (9.8%) |
| $100,000 to $149,999 | 43 (12.2%) | 72 (8.0%) |
| $150,000 or more | 30 (8.6%) | 453 (50.2%) |
| Total | 351 (100.0%) | 902 (100.0%) |
Property Value to Household Income Ratio in Carlisle
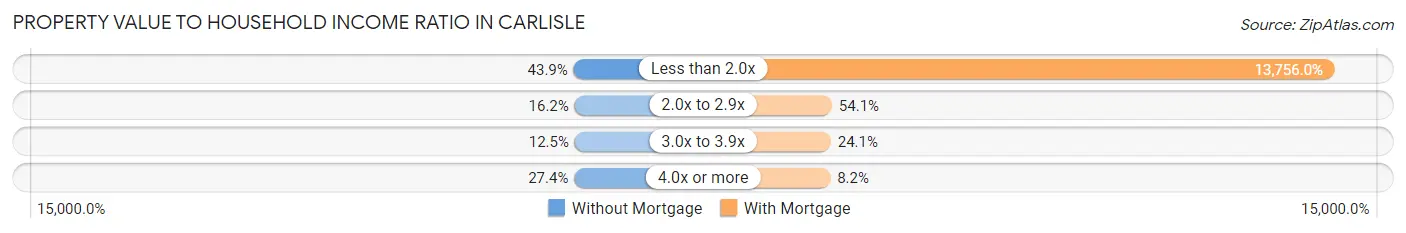
| Value-to-Income Ratio | Without Mortgage | With Mortgage |
| Less than 2.0x | 154 (43.9%) | 124,079 (13,756.0%) |
| 2.0x to 2.9x | 57 (16.2%) | 488 (54.1%) |
| 3.0x to 3.9x | 44 (12.5%) | 217 (24.1%) |
| 4.0x or more | 96 (27.4%) | 74 (8.2%) |
| Total | 351 (100.0%) | 902 (100.0%) |
Real Estate Taxes by Mortgage Status in Carlisle
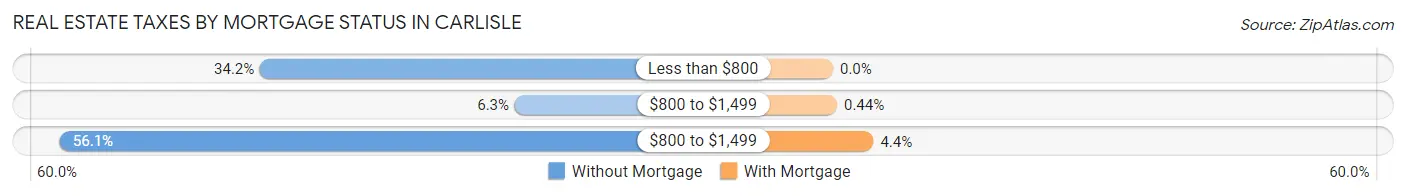
| Property Taxes | Without Mortgage | With Mortgage |
| Less than $800 | 120 (34.2%) | 0 (0.0%) |
| $800 to $1,499 | 22 (6.3%) | 4 (0.4%) |
| $800 to $1,499 | 197 (56.1%) | 40 (4.4%) |
| Total | 351 (100.0%) | 902 (100.0%) |
Health & Disability in Carlisle
Health Insurance Coverage by Age in Carlisle
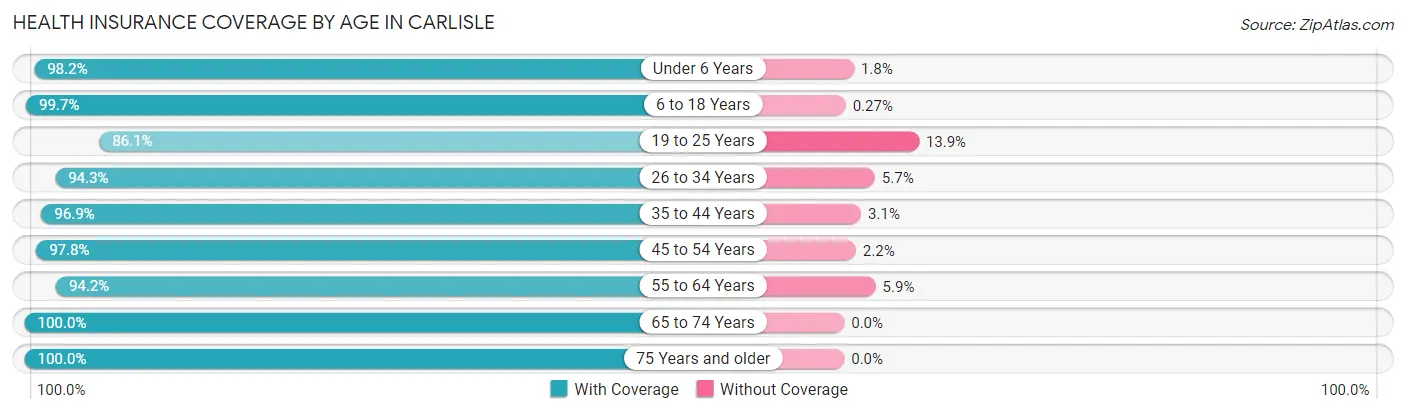
| Age Bracket | With Coverage | Without Coverage |
| Under 6 Years | 382 (98.2%) | 7 (1.8%) |
| 6 to 18 Years | 750 (99.7%) | 2 (0.3%) |
| 19 to 25 Years | 204 (86.1%) | 33 (13.9%) |
| 26 to 34 Years | 479 (94.3%) | 29 (5.7%) |
| 35 to 44 Years | 555 (96.9%) | 18 (3.1%) |
| 45 to 54 Years | 587 (97.8%) | 13 (2.2%) |
| 55 to 64 Years | 386 (94.2%) | 24 (5.9%) |
| 65 to 74 Years | 331 (100.0%) | 0 (0.0%) |
| 75 Years and older | 235 (100.0%) | 0 (0.0%) |
| Total | 3,909 (96.9%) | 126 (3.1%) |
Health Insurance Coverage by Citizenship Status in Carlisle
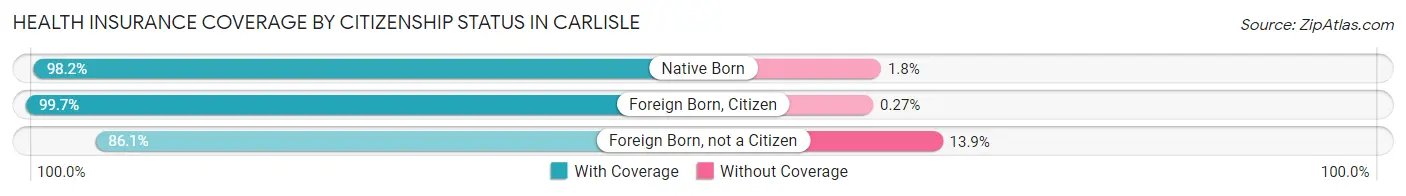
| Citizenship Status | With Coverage | Without Coverage |
| Native Born | 382 (98.2%) | 7 (1.8%) |
| Foreign Born, Citizen | 750 (99.7%) | 2 (0.3%) |
| Foreign Born, not a Citizen | 204 (86.1%) | 33 (13.9%) |
Health Insurance Coverage by Household Income in Carlisle
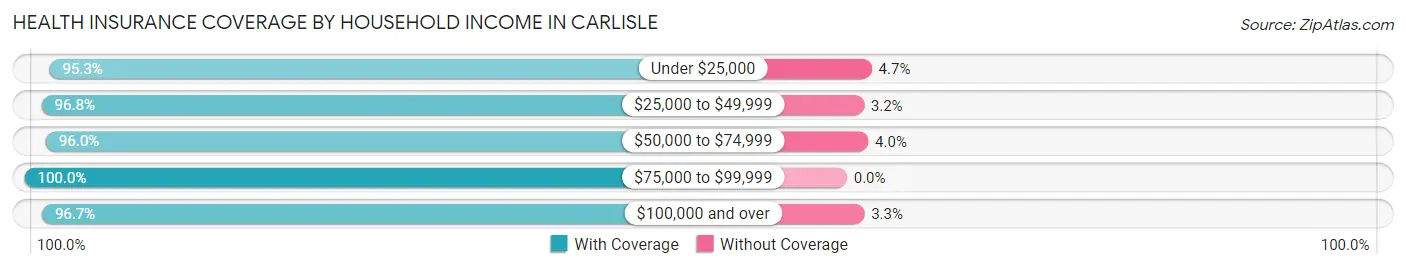
| Household Income | With Coverage | Without Coverage |
| Under $25,000 | 266 (95.3%) | 13 (4.7%) |
| $25,000 to $49,999 | 363 (96.8%) | 12 (3.2%) |
| $50,000 to $74,999 | 648 (96.0%) | 27 (4.0%) |
| $75,000 to $99,999 | 434 (100.0%) | 0 (0.0%) |
| $100,000 and over | 2,198 (96.7%) | 74 (3.3%) |
Public vs Private Health Insurance Coverage by Age in Carlisle
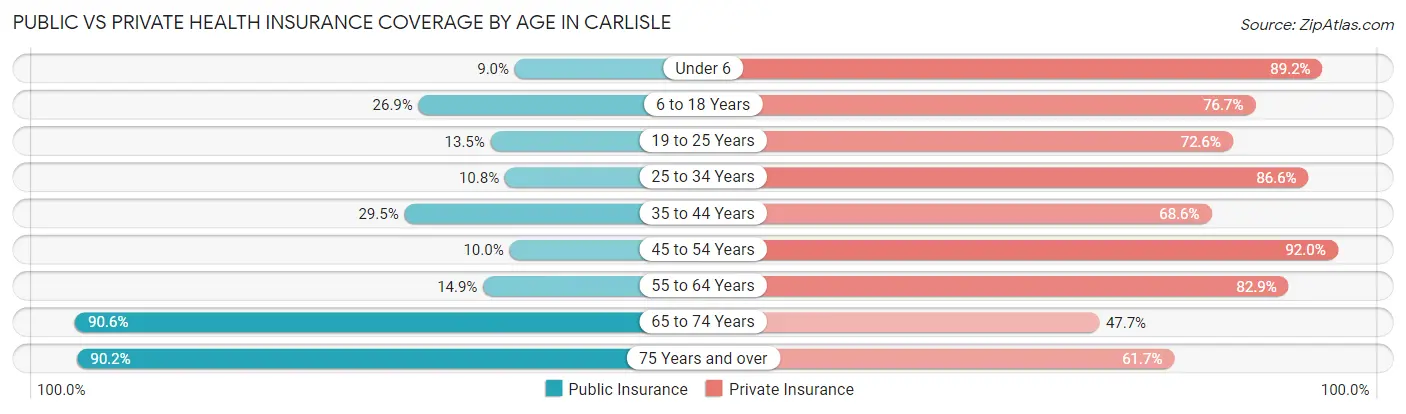
| Age Bracket | Public Insurance | Private Insurance |
| Under 6 | 35 (9.0%) | 347 (89.2%) |
| 6 to 18 Years | 202 (26.9%) | 577 (76.7%) |
| 19 to 25 Years | 32 (13.5%) | 172 (72.6%) |
| 25 to 34 Years | 55 (10.8%) | 440 (86.6%) |
| 35 to 44 Years | 169 (29.5%) | 393 (68.6%) |
| 45 to 54 Years | 60 (10.0%) | 552 (92.0%) |
| 55 to 64 Years | 61 (14.9%) | 340 (82.9%) |
| 65 to 74 Years | 300 (90.6%) | 158 (47.7%) |
| 75 Years and over | 212 (90.2%) | 145 (61.7%) |
| Total | 1,126 (27.9%) | 3,124 (77.4%) |
Disability Status by Sex by Age in Carlisle
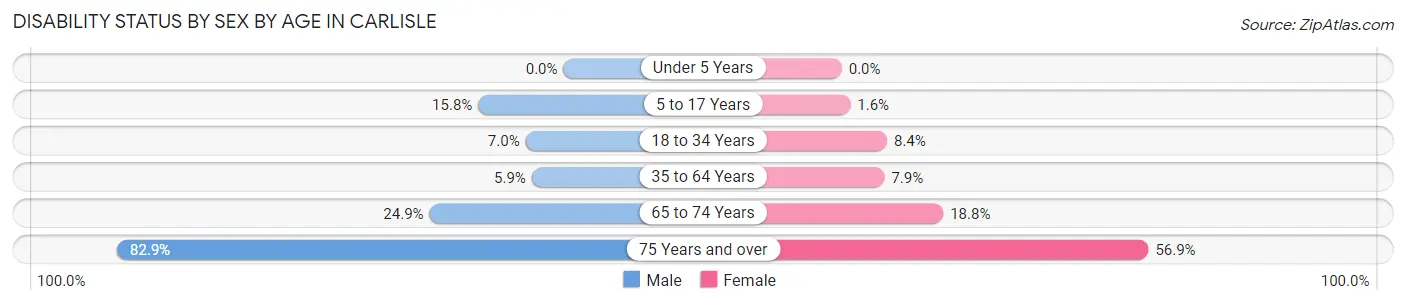
| Age Bracket | Male | Female |
| Under 5 Years | 0 (0.0%) | 0 (0.0%) |
| 5 to 17 Years | 52 (15.8%) | 7 (1.6%) |
| 18 to 34 Years | 30 (7.0%) | 33 (8.4%) |
| 35 to 64 Years | 47 (5.9%) | 62 (7.9%) |
| 65 to 74 Years | 44 (24.9%) | 29 (18.8%) |
| 75 Years and over | 87 (82.9%) | 74 (56.9%) |
Disability Class by Sex by Age in Carlisle
Disability Class: Hearing Difficulty
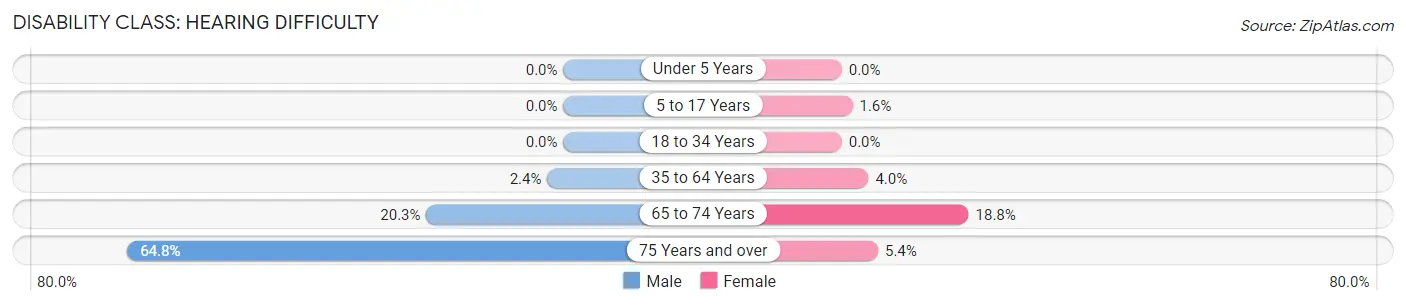
| Age Bracket | Male | Female |
| Under 5 Years | 0 (0.0%) | 0 (0.0%) |
| 5 to 17 Years | 0 (0.0%) | 7 (1.6%) |
| 18 to 34 Years | 0 (0.0%) | 0 (0.0%) |
| 35 to 64 Years | 19 (2.4%) | 31 (4.0%) |
| 65 to 74 Years | 36 (20.3%) | 29 (18.8%) |
| 75 Years and over | 68 (64.8%) | 7 (5.4%) |
Disability Class: Vision Difficulty
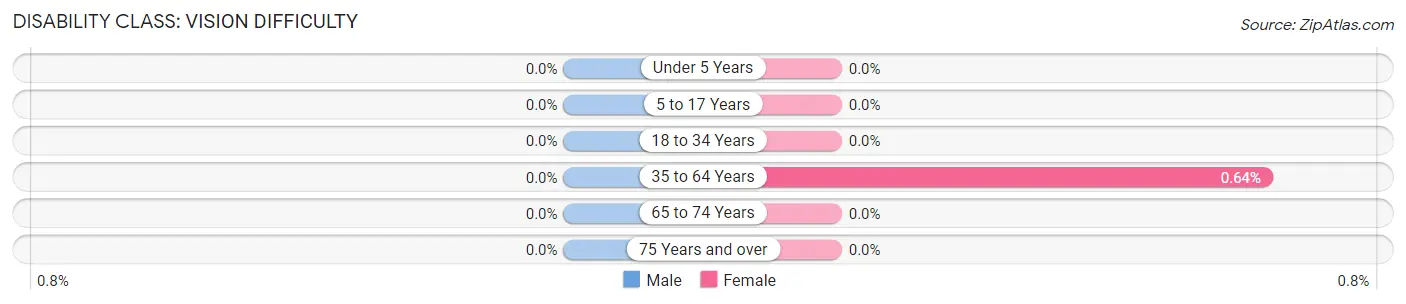
| Age Bracket | Male | Female |
| Under 5 Years | 0 (0.0%) | 0 (0.0%) |
| 5 to 17 Years | 0 (0.0%) | 0 (0.0%) |
| 18 to 34 Years | 0 (0.0%) | 0 (0.0%) |
| 35 to 64 Years | 0 (0.0%) | 5 (0.6%) |
| 65 to 74 Years | 0 (0.0%) | 0 (0.0%) |
| 75 Years and over | 0 (0.0%) | 0 (0.0%) |
Disability Class: Cognitive Difficulty
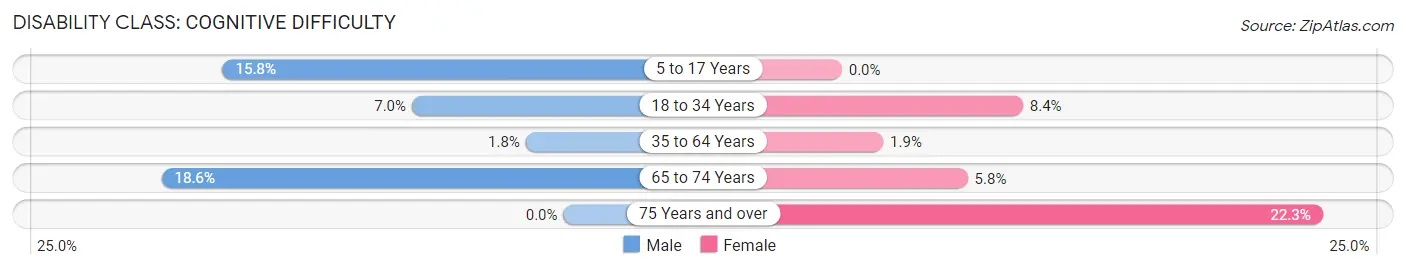
| Age Bracket | Male | Female |
| 5 to 17 Years | 52 (15.8%) | 0 (0.0%) |
| 18 to 34 Years | 30 (7.0%) | 33 (8.4%) |
| 35 to 64 Years | 14 (1.8%) | 15 (1.9%) |
| 65 to 74 Years | 33 (18.6%) | 9 (5.8%) |
| 75 Years and over | 0 (0.0%) | 29 (22.3%) |
Disability Class: Ambulatory Difficulty
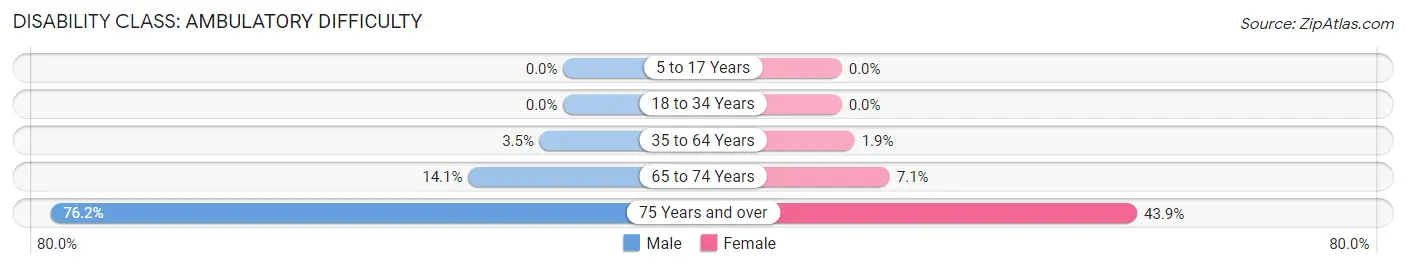
| Age Bracket | Male | Female |
| 5 to 17 Years | 0 (0.0%) | 0 (0.0%) |
| 18 to 34 Years | 0 (0.0%) | 0 (0.0%) |
| 35 to 64 Years | 28 (3.5%) | 15 (1.9%) |
| 65 to 74 Years | 25 (14.1%) | 11 (7.1%) |
| 75 Years and over | 80 (76.2%) | 57 (43.9%) |
Disability Class: Self-Care Difficulty
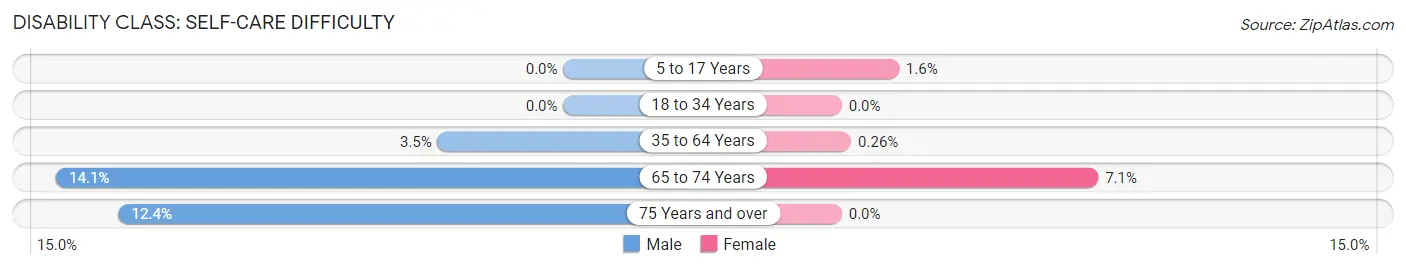
| Age Bracket | Male | Female |
| 5 to 17 Years | 0 (0.0%) | 7 (1.6%) |
| 18 to 34 Years | 0 (0.0%) | 0 (0.0%) |
| 35 to 64 Years | 28 (3.5%) | 2 (0.3%) |
| 65 to 74 Years | 25 (14.1%) | 11 (7.1%) |
| 75 Years and over | 13 (12.4%) | 0 (0.0%) |
Technology Access in Carlisle
Computing Device Access in Carlisle
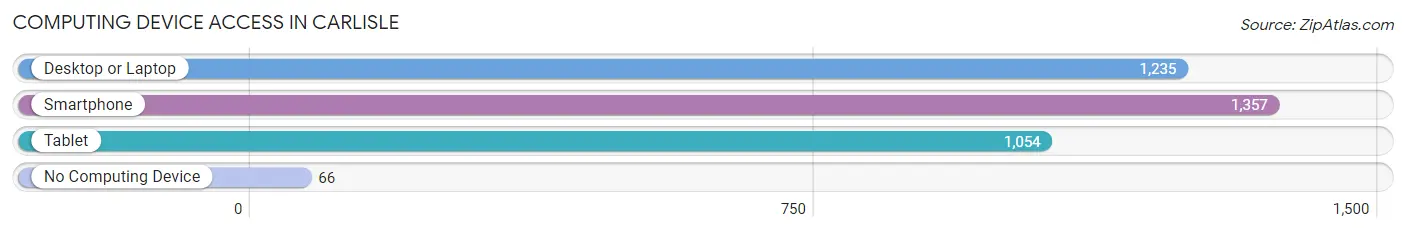
| Device Type | # Households | % Households |
| Desktop or Laptop | 1,235 | 80.1% |
| Smartphone | 1,357 | 88.0% |
| Tablet | 1,054 | 68.3% |
| No Computing Device | 66 | 4.3% |
| Total | 1,542 | 100.0% |
Internet Access in Carlisle
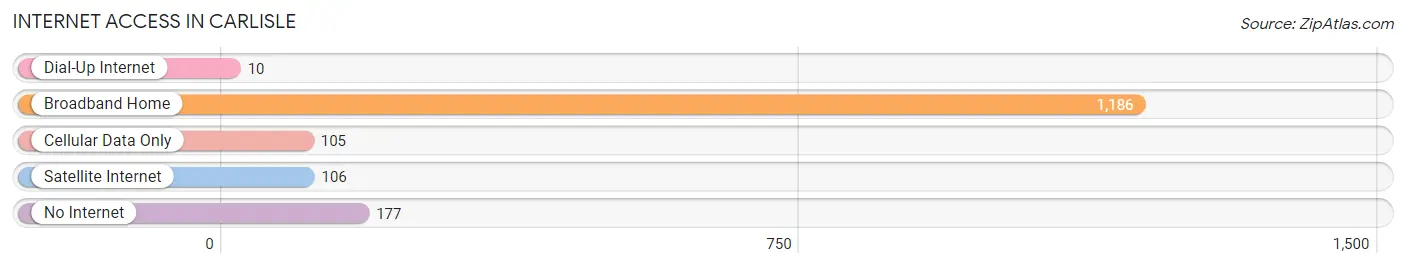
| Internet Type | # Households | % Households |
| Dial-Up Internet | 10 | 0.6% |
| Broadband Home | 1,186 | 76.9% |
| Cellular Data Only | 105 | 6.8% |
| Satellite Internet | 106 | 6.9% |
| No Internet | 177 | 11.5% |
| Total | 1,542 | 100.0% |
Carlisle Summary
History
The city of Carlisle, Iowa is located in Warren County, Iowa, and is a small town with a population of just over 2,000 people. The city was founded in 1856 by a group of settlers from Carlisle, Pennsylvania. The city was named after the Pennsylvania town, and the settlers brought with them the same values and traditions that they had in their hometown.
The city of Carlisle was originally a farming community, and the main crops grown were corn, wheat, and oats. The city was also home to a number of small businesses, including a general store, a blacksmith, and a hotel.
In the late 1800s, the city of Carlisle began to grow and develop. The railroad came to town in 1881, and this allowed for the transportation of goods and people to and from the city. This also allowed for the growth of the city’s economy, as it became a hub for trade and commerce.
In the early 1900s, the city of Carlisle began to experience a period of growth and development. The city was home to a number of businesses, including a bank, a newspaper, a movie theater, and a number of other businesses. The city also had a number of churches, schools, and other organizations.
The city of Carlisle experienced a period of decline in the mid-1900s, as the railroad industry began to decline and the city’s economy began to suffer. The city was also hit hard by the Great Depression, and many of the businesses in the city closed.
In the late 1900s, the city of Carlisle began to experience a period of revitalization. The city was able to attract new businesses, and the city’s economy began to improve. The city also began to attract new residents, and the population began to grow.
Today, the city of Carlisle is a thriving community. The city is home to a number of businesses, including a bank, a newspaper, a movie theater, and a number of other businesses. The city also has a number of churches, schools, and other organizations. The city is also home to a number of parks and recreational areas, and the city is a popular destination for tourists.
Geography
Carlisle is located in Warren County, Iowa, and is situated in the Des Moines metropolitan area. The city is located on the Des Moines River, and is bordered by the cities of Indianola, Norwalk, and Des Moines. The city is located in the Central Iowa region, and is approximately 30 miles south of Des Moines.
The city of Carlisle has a total area of 2.2 square miles, and is located at an elevation of 845 feet. The city is located in a flat, open area, and is surrounded by farmland. The city is located in a humid continental climate zone, and experiences hot summers and cold winters.
Economy
The economy of Carlisle is largely based on agriculture and manufacturing. The city is home to a number of agricultural businesses, including a number of grain elevators, feed mills, and other agricultural businesses. The city is also home to a number of manufacturing businesses, including a number of food processing plants, a furniture factory, and a number of other manufacturing businesses.
The city of Carlisle is also home to a number of retail businesses, including a number of restaurants, grocery stores, and other retail businesses. The city is also home to a number of service businesses, including a number of medical and dental offices, a number of law firms, and a number of other service businesses.
Demographics
As of the 2010 census, the city of Carlisle had a population of 2,072 people. The population of the city is predominantly white, with 95.3% of the population being white. The city also has a small Hispanic population, with 2.2% of the population being Hispanic. The city also has a small African American population, with 1.2% of the population being African American.
The median household income in the city of Carlisle is $50,945, and the median family income is $60,945. The city also has a poverty rate of 8.3%, which is lower than the national average. The city also has a high rate of homeownership, with 79.3% of the population owning their own homes.
Common Questions
What is the Total Population of Carlisle?
Total Population of Carlisle is 4,116.
What is the Total Male Population of Carlisle?
Total Male Population of Carlisle is 2,044.
What is the Total Female Population of Carlisle?
Total Female Population of Carlisle is 2,072.
What is the Ratio of Males per 100 Females in Carlisle?
There are 98.65 Males per 100 Females in Carlisle.
What is the Ratio of Females per 100 Males in Carlisle?
There are 101.37 Females per 100 Males in Carlisle.
What is the Median Population Age in Carlisle?
Median Population Age in Carlisle is 37.7 Years.
What is the Average Family Size in Carlisle
Average Family Size in Carlisle is 3.1 People.
What is the Average Household Size in Carlisle
Average Household Size in Carlisle is 2.6 People.
What is Per Capita Income in Carlisle?
Per Capita income in Carlisle is $41,250.
What is the Median Family Income in Carlisle?
Median Family Income in Carlisle is $105,982.
What is the Median Household income in Carlisle?
Median Household Income in Carlisle is $94,214.
What is Income or Wage Gap in Carlisle?
Income or Wage Gap in Carlisle is 16.2%.
Women in Carlisle earn 83.8 cents for every dollar earned by a man.
What is Inequality or Gini Index in Carlisle?
Inequality or Gini Index in Carlisle is 0.41.
How Large is the Labor Force in Carlisle?
There are 2,266 People in the Labor Forcein in Carlisle.
What is the Percentage of People in the Labor Force in Carlisle?
71.6% of People are in the Labor Force in Carlisle.
What is the Unemployment Rate in Carlisle?
Unemployment Rate in Carlisle is 5.5%.