Kelley, IA Map & Demographics
Kelley Map
Kelley Overview
$46,229
PER CAPITA INCOME
$87,917
AVG FAMILY INCOME
$103,750
AVG HOUSEHOLD INCOME
5.3%
WAGE / INCOME GAP [ % ]
94.7¢/ $1
WAGE / INCOME GAP [ $ ]
0.32
INEQUALITY / GINI INDEX
401
TOTAL POPULATION
229
MALE POPULATION
172
FEMALE POPULATION
133.14
MALES / 100 FEMALES
75.11
FEMALES / 100 MALES
32.5
MEDIAN AGE
2.8
AVG FAMILY SIZE
2.4
AVG HOUSEHOLD SIZE
290
LABOR FORCE [ PEOPLE ]
83.1%
PERCENT IN LABOR FORCE
1.4%
UNEMPLOYMENT RATE
Kelley Zip Codes
Kelley Area Codes
Income in Kelley
Income Overview in Kelley
Per Capita Income in Kelley is $46,229, while median incomes of families and households are $87,917 and $103,750 respectively.
| Characteristic | Number | Measure |
| Per Capita Income | 401 | $46,229 |
| Median Family Income | 79 | $87,917 |
| Mean Family Income | 79 | $107,520 |
| Median Household Income | 171 | $103,750 |
| Mean Household Income | 171 | $109,575 |
| Income Deficit | 79 | $0 |
| Wage / Income Gap (%) | 401 | 5.25% |
| Wage / Income Gap ($) | 401 | 94.75¢ per $1 |
| Gini / Inequality Index | 401 | 0.32 |
Earnings by Sex in Kelley
Average Earnings in Kelley are $51,650, $53,255 for men and $50,459 for women, a difference of 5.2%.
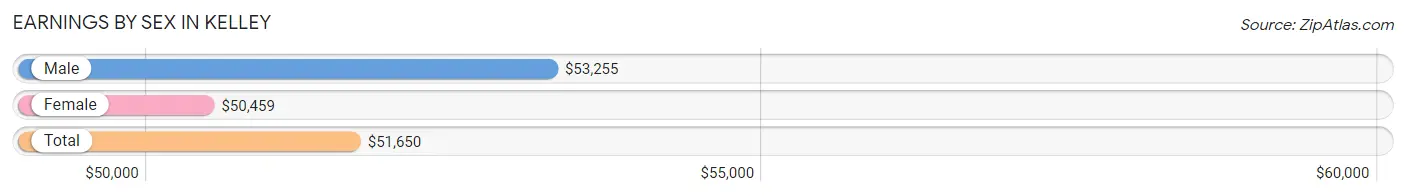
| Sex | Number | Average Earnings |
| Male | 171 (57.2%) | $53,255 |
| Female | 128 (42.8%) | $50,459 |
| Total | 299 (100.0%) | $51,650 |
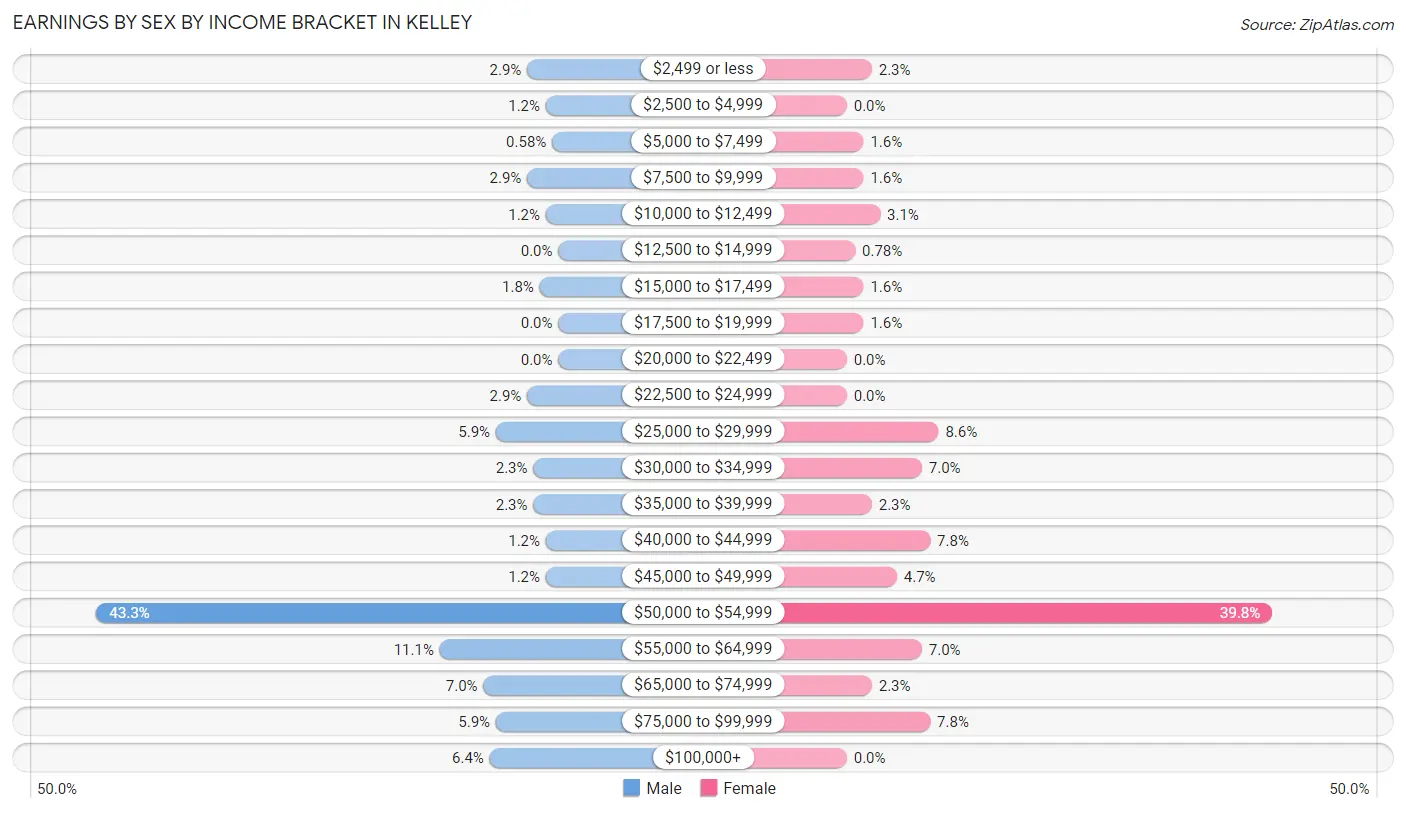
Earnings by Sex by Income Bracket in Kelley
The most common earnings brackets in Kelley are $50,000 to $54,999 for men (74 | 43.3%) and $50,000 to $54,999 for women (51 | 39.8%).
| Income | Male | Female |
| $2,499 or less | 5 (2.9%) | 3 (2.3%) |
| $2,500 to $4,999 | 2 (1.2%) | 0 (0.0%) |
| $5,000 to $7,499 | 1 (0.6%) | 2 (1.6%) |
| $7,500 to $9,999 | 5 (2.9%) | 2 (1.6%) |
| $10,000 to $12,499 | 2 (1.2%) | 4 (3.1%) |
| $12,500 to $14,999 | 0 (0.0%) | 1 (0.8%) |
| $15,000 to $17,499 | 3 (1.8%) | 2 (1.6%) |
| $17,500 to $19,999 | 0 (0.0%) | 2 (1.6%) |
| $20,000 to $22,499 | 0 (0.0%) | 0 (0.0%) |
| $22,500 to $24,999 | 5 (2.9%) | 0 (0.0%) |
| $25,000 to $29,999 | 10 (5.9%) | 11 (8.6%) |
| $30,000 to $34,999 | 4 (2.3%) | 9 (7.0%) |
| $35,000 to $39,999 | 4 (2.3%) | 3 (2.3%) |
| $40,000 to $44,999 | 2 (1.2%) | 10 (7.8%) |
| $45,000 to $49,999 | 2 (1.2%) | 6 (4.7%) |
| $50,000 to $54,999 | 74 (43.3%) | 51 (39.8%) |
| $55,000 to $64,999 | 19 (11.1%) | 9 (7.0%) |
| $65,000 to $74,999 | 12 (7.0%) | 3 (2.3%) |
| $75,000 to $99,999 | 10 (5.9%) | 10 (7.8%) |
| $100,000+ | 11 (6.4%) | 0 (0.0%) |
| Total | 171 (100.0%) | 128 (100.0%) |
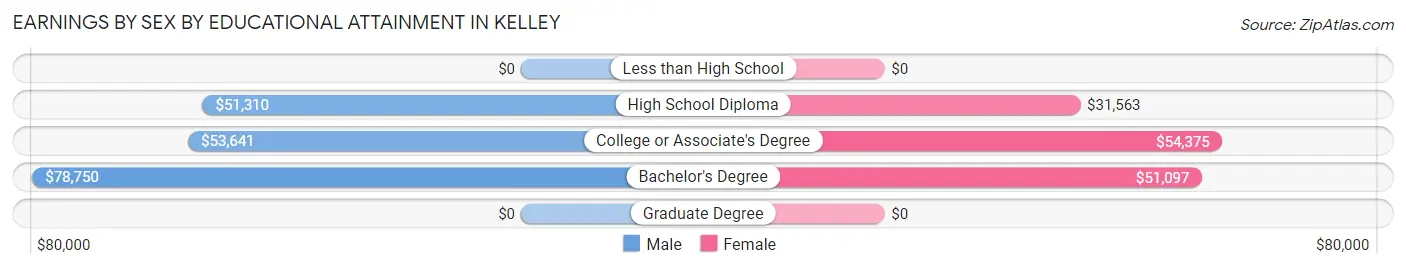
Earnings by Sex by Educational Attainment in Kelley
Average earnings in Kelley are $53,516 for men and $50,587 for women, a difference of 5.5%. Men with an educational attainment of bachelor's degree enjoy the highest average annual earnings of $78,750, while those with high school diploma education earn the least with $51,310. Women with an educational attainment of college or associate's degree earn the most with the average annual earnings of $54,375, while those with high school diploma education have the smallest earnings of $31,563.
| Educational Attainment | Male Income | Female Income |
| Less than High School | - | - |
| High School Diploma | $51,310 | $31,563 |
| College or Associate's Degree | $53,641 | $54,375 |
| Bachelor's Degree | $78,750 | $51,097 |
| Graduate Degree | - | - |
| Total | $53,516 | $50,587 |
Family Income in Kelley
Family Income Brackets in Kelley
According to the Kelley family income data, there are 20 families falling into the $75,000 to $99,999 income range, which is the most common income bracket and makes up 25.3% of all families.
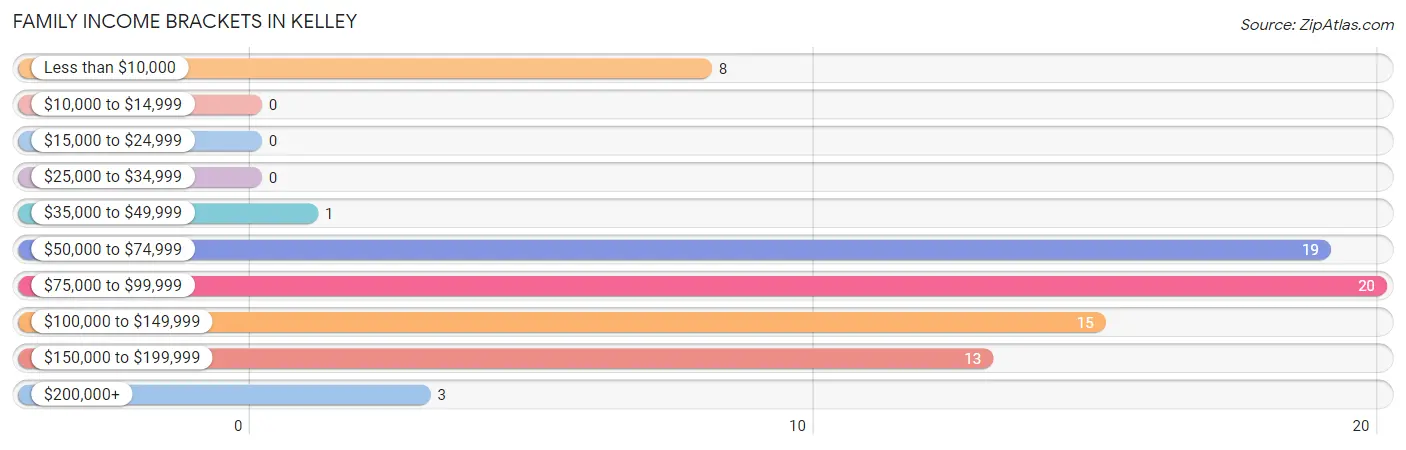
| Income Bracket | # Families | % Families |
| Less than $10,000 | 8 | 10.1% |
| $10,000 to $14,999 | 0 | 0.0% |
| $15,000 to $24,999 | 0 | 0.0% |
| $25,000 to $34,999 | 0 | 0.0% |
| $35,000 to $49,999 | 1 | 1.3% |
| $50,000 to $74,999 | 19 | 24.1% |
| $75,000 to $99,999 | 20 | 25.3% |
| $100,000 to $149,999 | 15 | 19.0% |
| $150,000 to $199,999 | 13 | 16.5% |
| $200,000+ | 3 | 3.8% |
Family Income by Famaliy Size in Kelley
3-person families (15 | 19.0%) account for the highest median family income in Kelley with $160,313 per family, while 3-person families (15 | 19.0%) have the highest median income of $53,438 per family member.
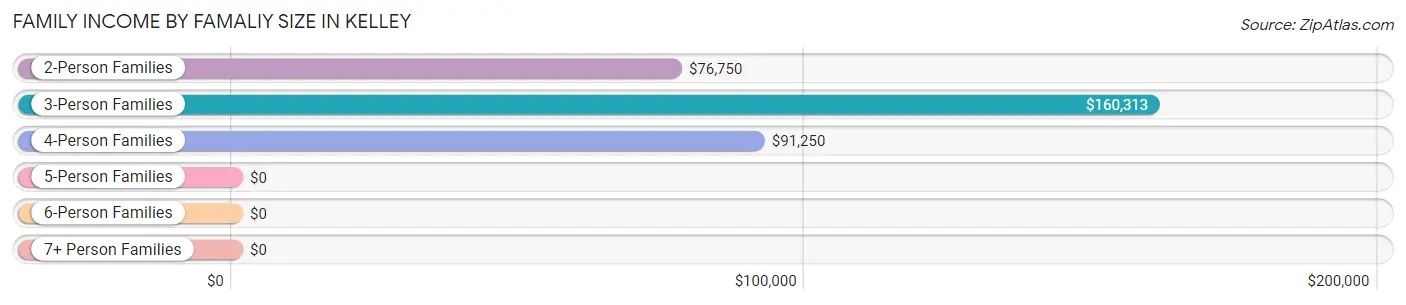
| Income Bracket | # Families | Median Income |
| 2-Person Families | 51 (64.6%) | $76,750 |
| 3-Person Families | 15 (19.0%) | $160,313 |
| 4-Person Families | 9 (11.4%) | $91,250 |
| 5-Person Families | 3 (3.8%) | $0 |
| 6-Person Families | 0 (0.0%) | $0 |
| 7+ Person Families | 1 (1.3%) | $0 |
| Total | 79 (100.0%) | $87,917 |
Family Income by Number of Earners in Kelley
The median family income in Kelley is $87,917, with families comprising 3+ earners (11) having the highest median family income of $161,563, while families with no earners (12) have the lowest median family income of $2,499, accounting for 13.9% and 15.2% of families, respectively.
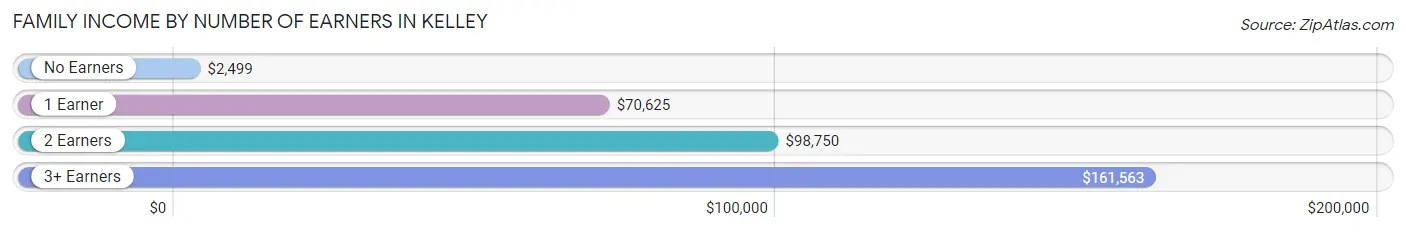
| Number of Earners | # Families | Median Income |
| No Earners | 12 (15.2%) | $2,499 |
| 1 Earner | 15 (19.0%) | $70,625 |
| 2 Earners | 41 (51.9%) | $98,750 |
| 3+ Earners | 11 (13.9%) | $161,563 |
| Total | 79 (100.0%) | $87,917 |
Household Income in Kelley
Household Income Brackets in Kelley
With 60 households falling in the category, the $150,000 to $199,999 income range is the most frequent in Kelley, accounting for 35.1% of all households. In contrast, only 1 households (0.6%) fall into the $10,000 to $14,999 income bracket, making it the least populous group.
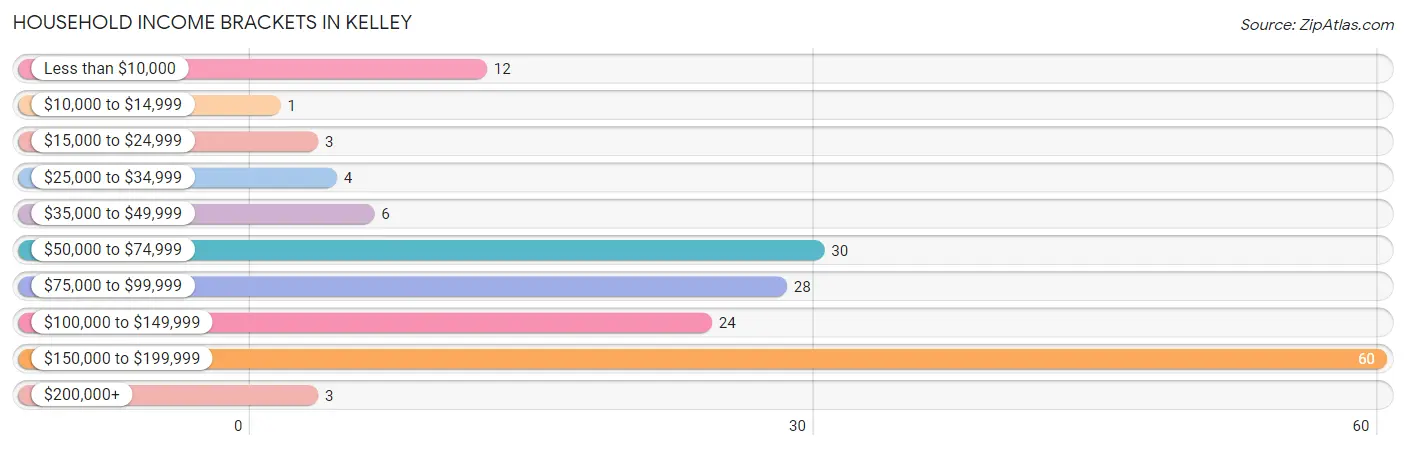
| Income Bracket | # Households | % Households |
| Less than $10,000 | 12 | 7.0% |
| $10,000 to $14,999 | 1 | 0.6% |
| $15,000 to $24,999 | 3 | 1.8% |
| $25,000 to $34,999 | 4 | 2.3% |
| $35,000 to $49,999 | 6 | 3.5% |
| $50,000 to $74,999 | 30 | 17.5% |
| $75,000 to $99,999 | 28 | 16.4% |
| $100,000 to $149,999 | 24 | 14.0% |
| $150,000 to $199,999 | 60 | 35.1% |
| $200,000+ | 3 | 1.8% |
Household Income by Householder Age in Kelley
The median household income in Kelley is $103,750, with the highest median household income of $157,500 found in the 25 to 44 years age bracket for the primary householder. A total of 104 households (60.8%) fall into this category. Meanwhile, the 65+ years age bracket for the primary householder has the lowest median household income of $70,938, with 23 households (13.5%) in this group.
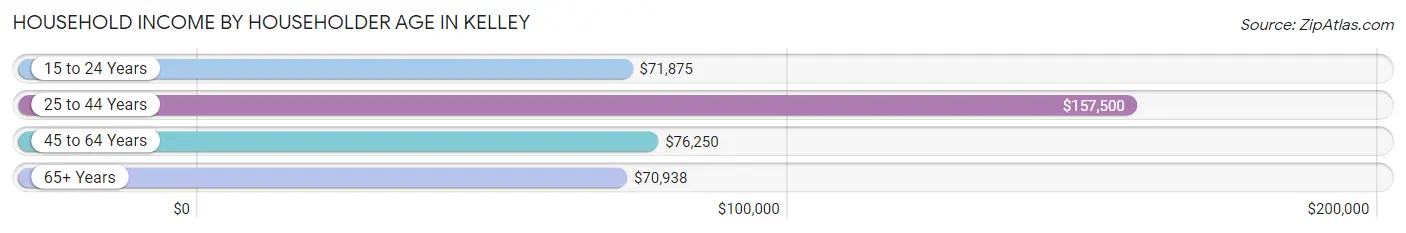
| Income Bracket | # Households | Median Income |
| 15 to 24 Years | 5 (2.9%) | $71,875 |
| 25 to 44 Years | 104 (60.8%) | $157,500 |
| 45 to 64 Years | 39 (22.8%) | $76,250 |
| 65+ Years | 23 (13.5%) | $70,938 |
| Total | 171 (100.0%) | $103,750 |
Poverty in Kelley
Income Below Poverty by Sex and Age in Kelley
With 9.3% poverty level for males and 10.5% for females among the residents of Kelley, 6 to 11 year old males and 55 to 64 year old females are the most vulnerable to poverty, with 15 males (62.5%) and 8 females (28.6%) in their respective age groups living below the poverty level.
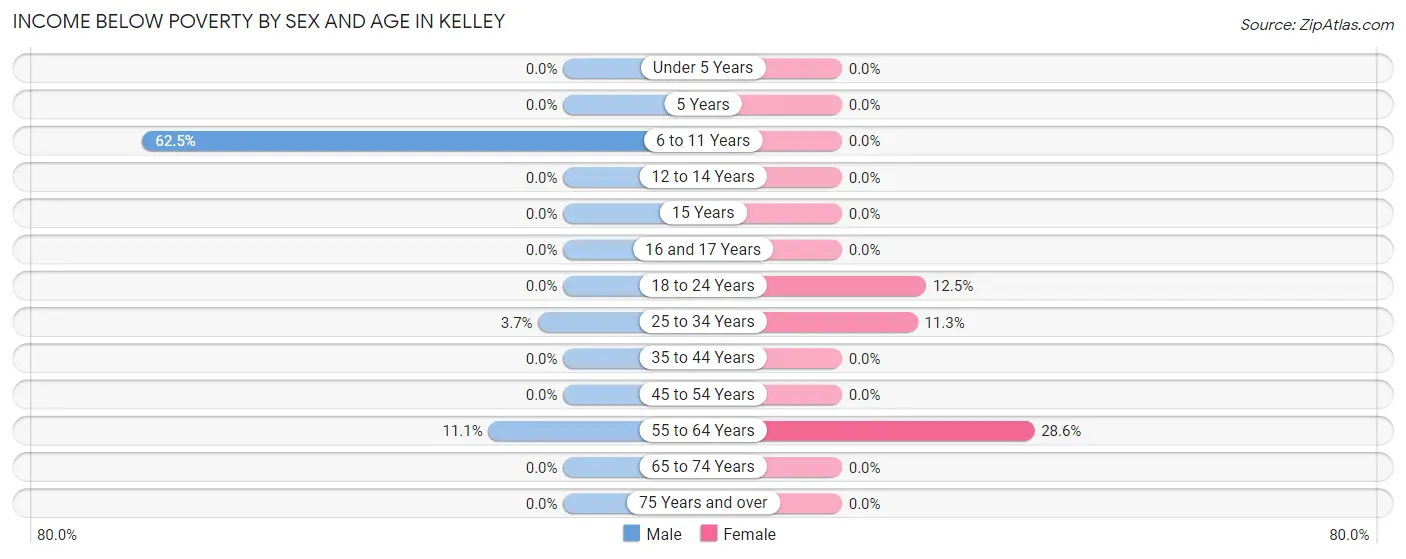
| Age Bracket | Male | Female |
| Under 5 Years | 0 (0.0%) | 0 (0.0%) |
| 5 Years | 0 (0.0%) | 0 (0.0%) |
| 6 to 11 Years | 15 (62.5%) | 0 (0.0%) |
| 12 to 14 Years | 0 (0.0%) | 0 (0.0%) |
| 15 Years | 0 (0.0%) | 0 (0.0%) |
| 16 and 17 Years | 0 (0.0%) | 0 (0.0%) |
| 18 to 24 Years | 0 (0.0%) | 1 (12.5%) |
| 25 to 34 Years | 4 (3.7%) | 9 (11.3%) |
| 35 to 44 Years | 0 (0.0%) | 0 (0.0%) |
| 45 to 54 Years | 0 (0.0%) | 0 (0.0%) |
| 55 to 64 Years | 2 (11.1%) | 8 (28.6%) |
| 65 to 74 Years | 0 (0.0%) | 0 (0.0%) |
| 75 Years and over | 0 (0.0%) | 0 (0.0%) |
| Total | 21 (9.3%) | 18 (10.5%) |
Income Above Poverty by Sex and Age in Kelley
According to the poverty statistics in Kelley, males aged under 5 years and females aged 6 to 11 years are the age groups that are most secure financially, with 100.0% of males and 100.0% of females in these age groups living above the poverty line.
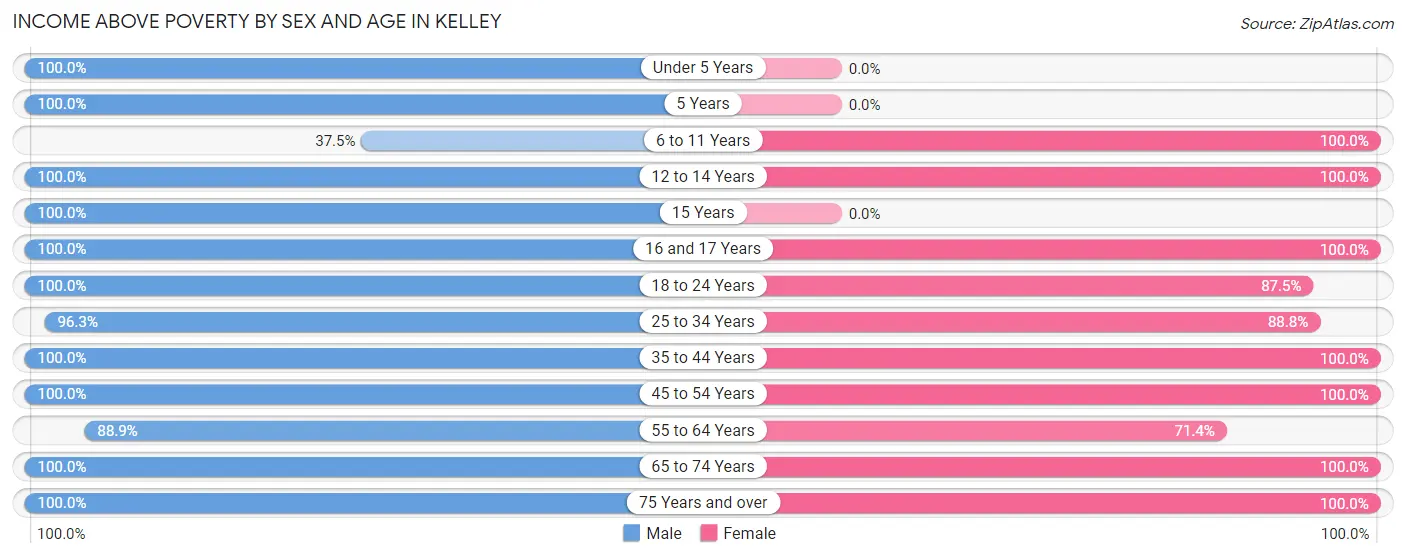
| Age Bracket | Male | Female |
| Under 5 Years | 9 (100.0%) | 0 (0.0%) |
| 5 Years | 1 (100.0%) | 0 (0.0%) |
| 6 to 11 Years | 9 (37.5%) | 4 (100.0%) |
| 12 to 14 Years | 7 (100.0%) | 1 (100.0%) |
| 15 Years | 2 (100.0%) | 0 (0.0%) |
| 16 and 17 Years | 6 (100.0%) | 1 (100.0%) |
| 18 to 24 Years | 5 (100.0%) | 7 (87.5%) |
| 25 to 34 Years | 104 (96.3%) | 71 (88.7%) |
| 35 to 44 Years | 25 (100.0%) | 14 (100.0%) |
| 45 to 54 Years | 8 (100.0%) | 17 (100.0%) |
| 55 to 64 Years | 16 (88.9%) | 20 (71.4%) |
| 65 to 74 Years | 6 (100.0%) | 6 (100.0%) |
| 75 Years and over | 6 (100.0%) | 13 (100.0%) |
| Total | 204 (90.7%) | 154 (89.5%) |
Income Below Poverty Among Married-Couple Families in Kelley
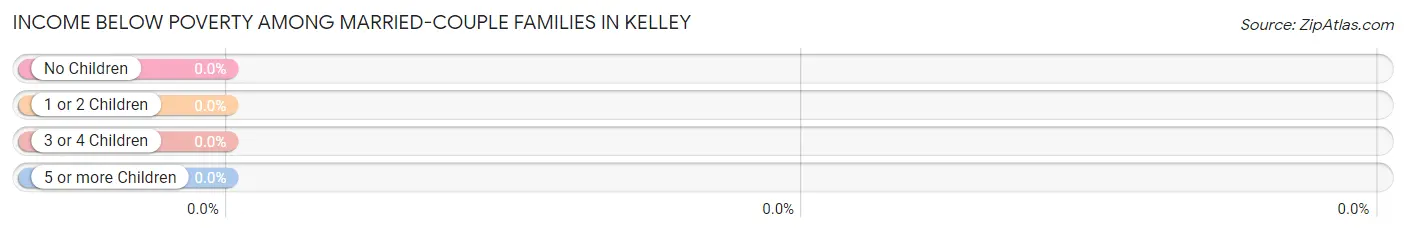
| Children | Above Poverty | Below Poverty |
| No Children | 36 (100.0%) | 0 (0.0%) |
| 1 or 2 Children | 14 (100.0%) | 0 (0.0%) |
| 3 or 4 Children | 3 (100.0%) | 0 (0.0%) |
| 5 or more Children | 0 (0.0%) | 0 (0.0%) |
| Total | 53 (100.0%) | 0 (0.0%) |
Income Below Poverty Among Single-Parent Households in Kelley
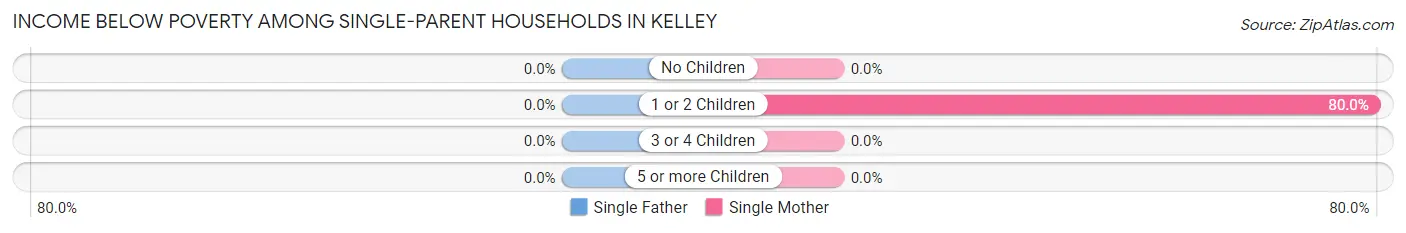
| Children | Single Father | Single Mother |
| No Children | 0 (0.0%) | 0 (0.0%) |
| 1 or 2 Children | 0 (0.0%) | 8 (80.0%) |
| 3 or 4 Children | 0 (0.0%) | 0 (0.0%) |
| 5 or more Children | 0 (0.0%) | 0 (0.0%) |
| Total | 0 (0.0%) | 8 (34.8%) |
Income Below Poverty Among Married-Couple vs Single-Parent Households in Kelley
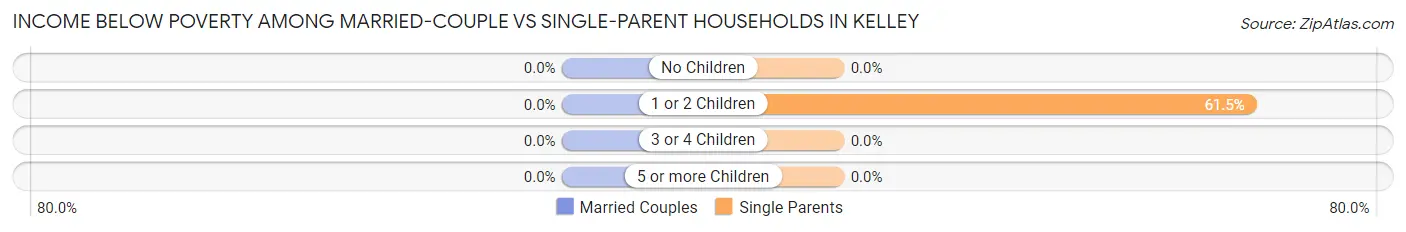
| Children | Married-Couple Families | Single-Parent Households |
| No Children | 0 (0.0%) | 0 (0.0%) |
| 1 or 2 Children | 0 (0.0%) | 8 (61.5%) |
| 3 or 4 Children | 0 (0.0%) | 0 (0.0%) |
| 5 or more Children | 0 (0.0%) | 0 (0.0%) |
| Total | 0 (0.0%) | 8 (30.8%) |
Race in Kelley
The most populous races in Kelley are White / Caucasian (359 | 89.5%), Black / African American (25 | 6.2%), and Two or more Races (17 | 4.2%).
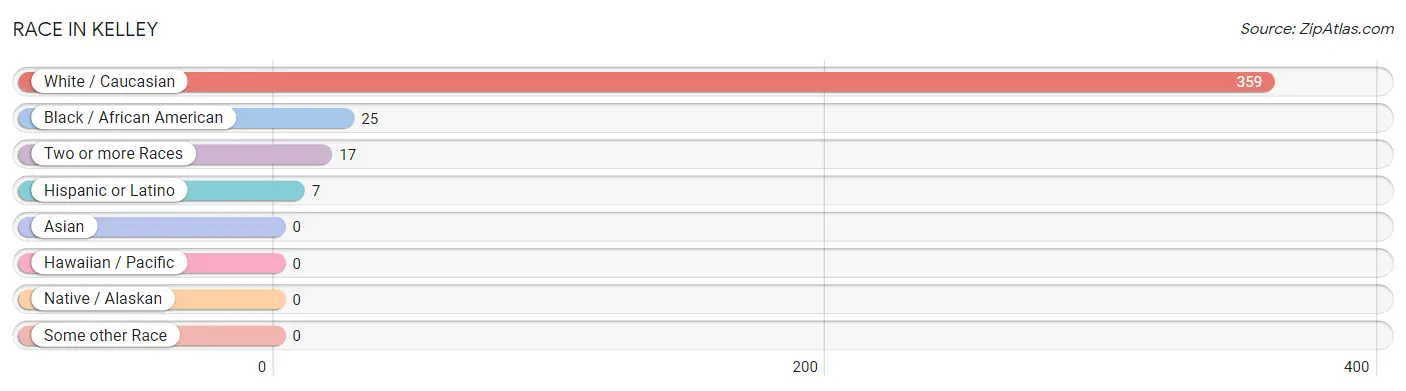
| Race | # Population | % Population |
| Asian | 0 | 0.0% |
| Black / African American | 25 | 6.2% |
| Hawaiian / Pacific | 0 | 0.0% |
| Hispanic or Latino | 7 | 1.8% |
| Native / Alaskan | 0 | 0.0% |
| White / Caucasian | 359 | 89.5% |
| Two or more Races | 17 | 4.2% |
| Some other Race | 0 | 0.0% |
| Total | 401 | 100.0% |
Ancestry in Kelley
The most populous ancestries reported in Kelley are German (131 | 32.7%), English (54 | 13.5%), Norwegian (48 | 12.0%), Irish (46 | 11.5%), and Swiss (17 | 4.2%), together accounting for 73.8% of all Kelley residents.
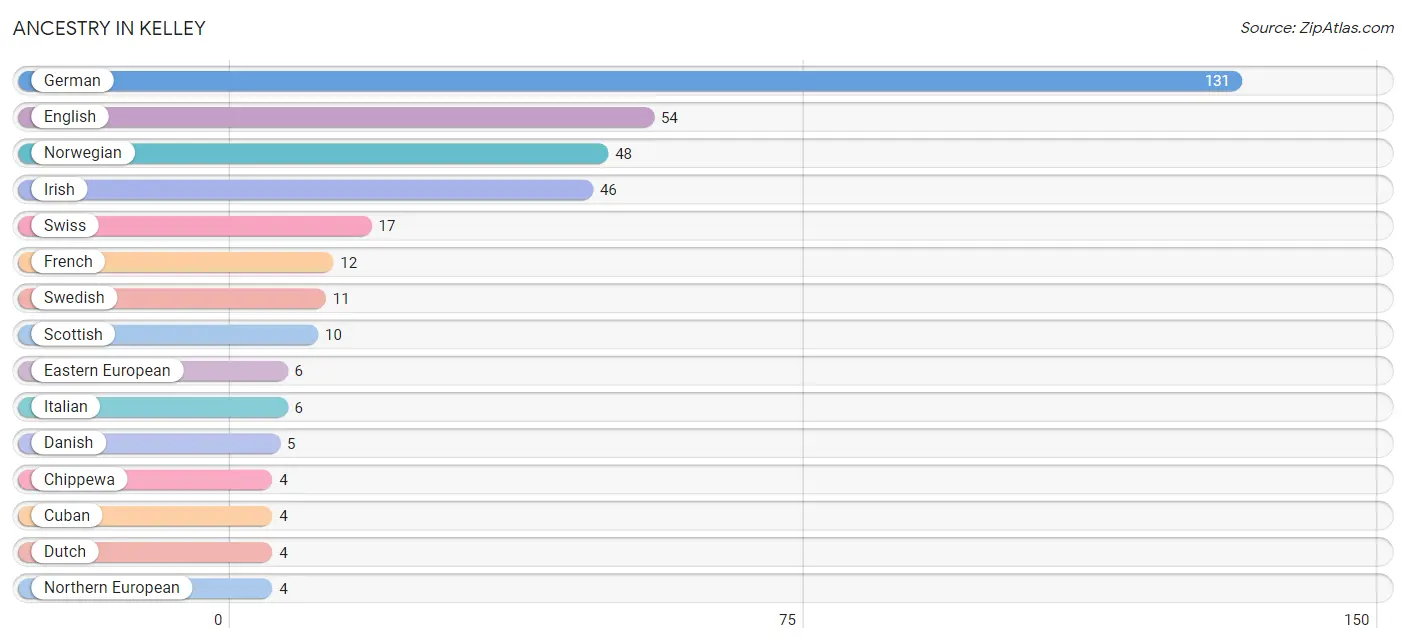
| Ancestry | # Population | % Population |
| African | 3 | 0.7% |
| American | 2 | 0.5% |
| Chippewa | 4 | 1.0% |
| Cuban | 4 | 1.0% |
| Czech | 3 | 0.7% |
| Czechoslovakian | 2 | 0.5% |
| Danish | 5 | 1.3% |
| Dutch | 4 | 1.0% |
| Eastern European | 6 | 1.5% |
| English | 54 | 13.5% |
| European | 2 | 0.5% |
| French | 12 | 3.0% |
| German | 131 | 32.7% |
| Irish | 46 | 11.5% |
| Italian | 6 | 1.5% |
| Northern European | 4 | 1.0% |
| Norwegian | 48 | 12.0% |
| Polish | 3 | 0.7% |
| Puerto Rican | 3 | 0.7% |
| Scottish | 10 | 2.5% |
| Subsaharan African | 3 | 0.7% |
| Swedish | 11 | 2.7% |
| Swiss | 17 | 4.2% |
| Welsh | 2 | 0.5% | View All 24 Rows |
Immigrants in Kelley

| Immigration Origin | # Population | % Population | View All 0 Rows |
Sex and Age in Kelley
Sex and Age in Kelley
The most populous age groups in Kelley are 30 to 34 Years (89 | 38.9%) for men and 25 to 29 Years (63 | 36.6%) for women.
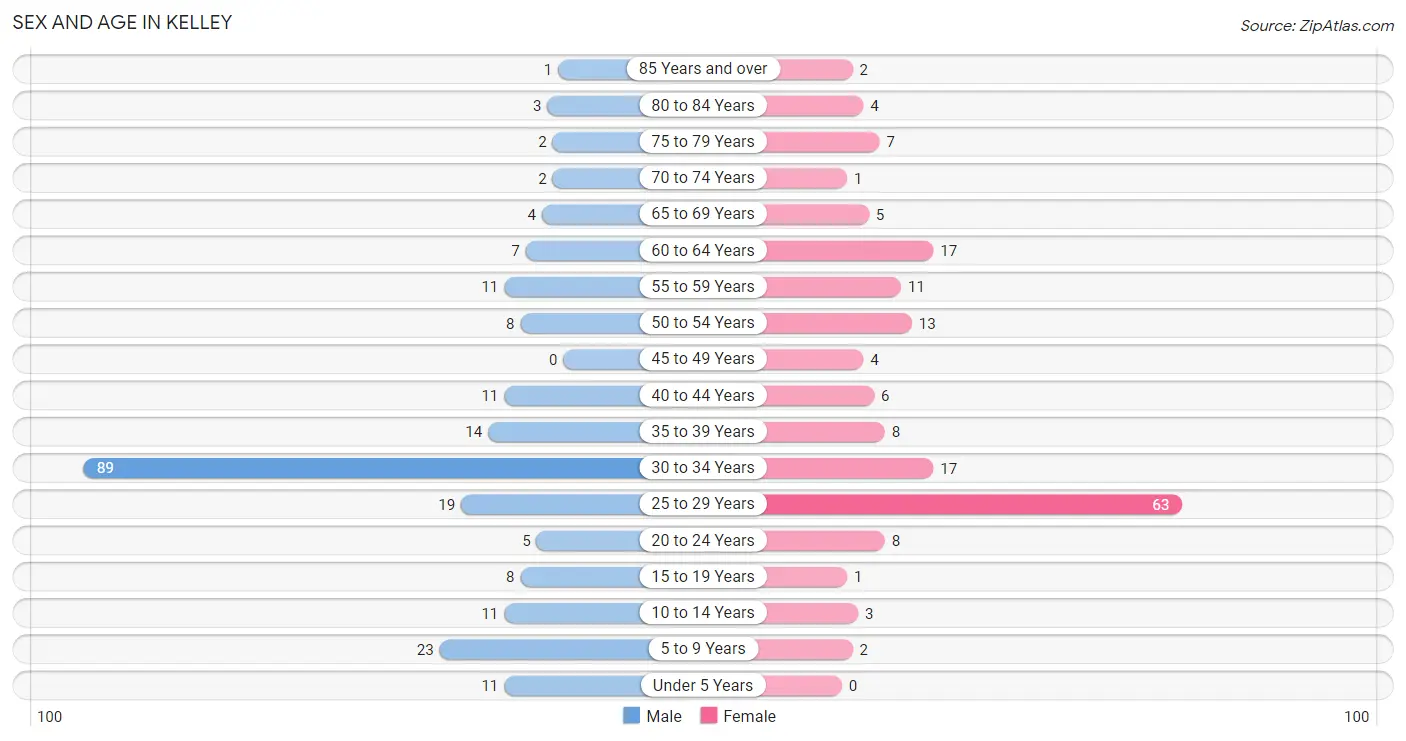
| Age Bracket | Male | Female |
| Under 5 Years | 11 (4.8%) | 0 (0.0%) |
| 5 to 9 Years | 23 (10.0%) | 2 (1.2%) |
| 10 to 14 Years | 11 (4.8%) | 3 (1.7%) |
| 15 to 19 Years | 8 (3.5%) | 1 (0.6%) |
| 20 to 24 Years | 5 (2.2%) | 8 (4.6%) |
| 25 to 29 Years | 19 (8.3%) | 63 (36.6%) |
| 30 to 34 Years | 89 (38.9%) | 17 (9.9%) |
| 35 to 39 Years | 14 (6.1%) | 8 (4.6%) |
| 40 to 44 Years | 11 (4.8%) | 6 (3.5%) |
| 45 to 49 Years | 0 (0.0%) | 4 (2.3%) |
| 50 to 54 Years | 8 (3.5%) | 13 (7.6%) |
| 55 to 59 Years | 11 (4.8%) | 11 (6.4%) |
| 60 to 64 Years | 7 (3.1%) | 17 (9.9%) |
| 65 to 69 Years | 4 (1.8%) | 5 (2.9%) |
| 70 to 74 Years | 2 (0.9%) | 1 (0.6%) |
| 75 to 79 Years | 2 (0.9%) | 7 (4.1%) |
| 80 to 84 Years | 3 (1.3%) | 4 (2.3%) |
| 85 Years and over | 1 (0.4%) | 2 (1.2%) |
| Total | 229 (100.0%) | 172 (100.0%) |
Families and Households in Kelley
Median Family Size in Kelley
The median family size in Kelley is 2.81 persons per family, with single female/mother families (23 | 29.1%) accounting for the largest median family size of 2.87 persons per family. On the other hand, single male/father families (3 | 3.8%) represent the smallest median family size with 2.00 persons per family.
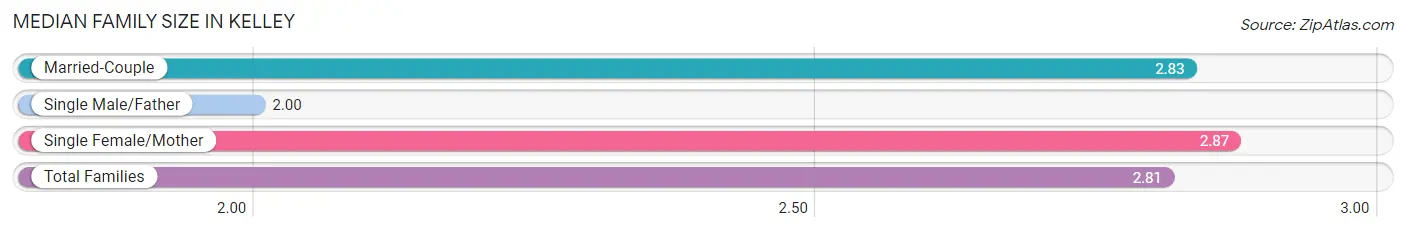
| Family Type | # Families | Family Size |
| Married-Couple | 53 (67.1%) | 2.83 |
| Single Male/Father | 3 (3.8%) | 2.00 |
| Single Female/Mother | 23 (29.1%) | 2.87 |
| Total Families | 79 (100.0%) | 2.81 |
Median Household Size in Kelley
The median household size in Kelley is 2.35 persons per household, with single male/father households (3 | 1.8%) accounting for the largest median household size of 3.33 persons per household. non-family households (92 | 53.8%) represent the smallest median household size with 1.88 persons per household.
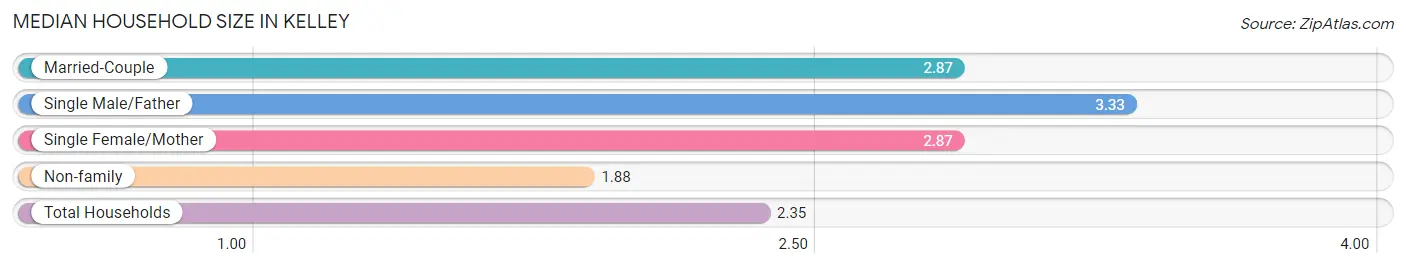
| Household Type | # Households | Household Size |
| Married-Couple | 53 (31.0%) | 2.87 |
| Single Male/Father | 3 (1.8%) | 3.33 |
| Single Female/Mother | 23 (13.5%) | 2.87 |
| Non-family | 92 (53.8%) | 1.88 |
| Total Households | 171 (100.0%) | 2.35 |
Household Size by Marriage Status in Kelley
Out of a total of 171 households in Kelley, 79 (46.2%) are family households, while 92 (53.8%) are nonfamily households. The most numerous type of family households are 2-person households, comprising 46, and the most common type of nonfamily households are 3-person households, comprising 50.
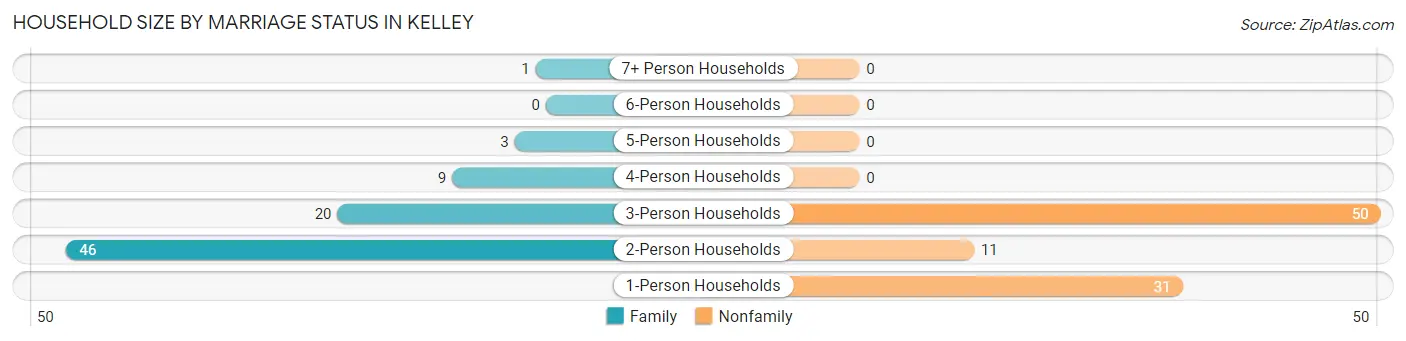
| Household Size | Family Households | Nonfamily Households |
| 1-Person Households | - | 31 (18.1%) |
| 2-Person Households | 46 (26.9%) | 11 (6.4%) |
| 3-Person Households | 20 (11.7%) | 50 (29.2%) |
| 4-Person Households | 9 (5.3%) | 0 (0.0%) |
| 5-Person Households | 3 (1.8%) | 0 (0.0%) |
| 6-Person Households | 0 (0.0%) | 0 (0.0%) |
| 7+ Person Households | 1 (0.6%) | 0 (0.0%) |
| Total | 79 (46.2%) | 92 (53.8%) |
Female Fertility in Kelley
Fertility by Age in Kelley
Average fertility rate in Kelley is 35.0 births per 1,000 women. Women in the age bracket of 20 to 34 years have the highest fertility rate with 45.0 births per 1,000 women. Women in the age bracket of 20 to 34 years acount for 100.0% of all women with births.
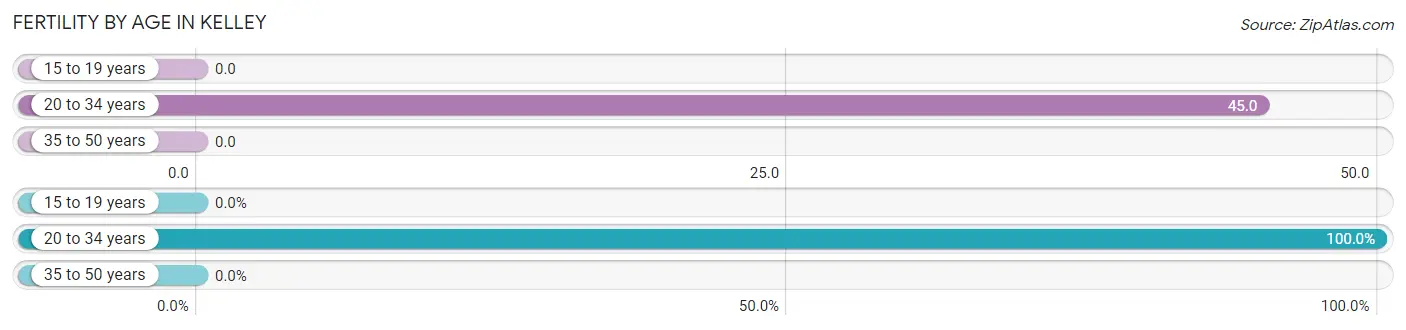
| Age Bracket | Women with Births | Births / 1,000 Women |
| 15 to 19 years | 0 (0.0%) | 0.0 |
| 20 to 34 years | 4 (100.0%) | 45.0 |
| 35 to 50 years | 0 (0.0%) | 0.0 |
| Total | 4 (100.0%) | 35.0 |
Fertility by Age by Marriage Status in Kelley
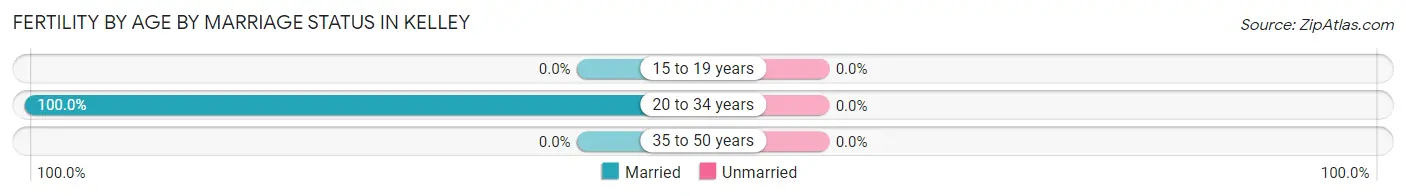
| Age Bracket | Married | Unmarried |
| 15 to 19 years | 0 (0.0%) | 0 (0.0%) |
| 20 to 34 years | 4 (100.0%) | 0 (0.0%) |
| 35 to 50 years | 0 (0.0%) | 0 (0.0%) |
| Total | 4 (100.0%) | 0 (0.0%) |
Fertility by Education in Kelley
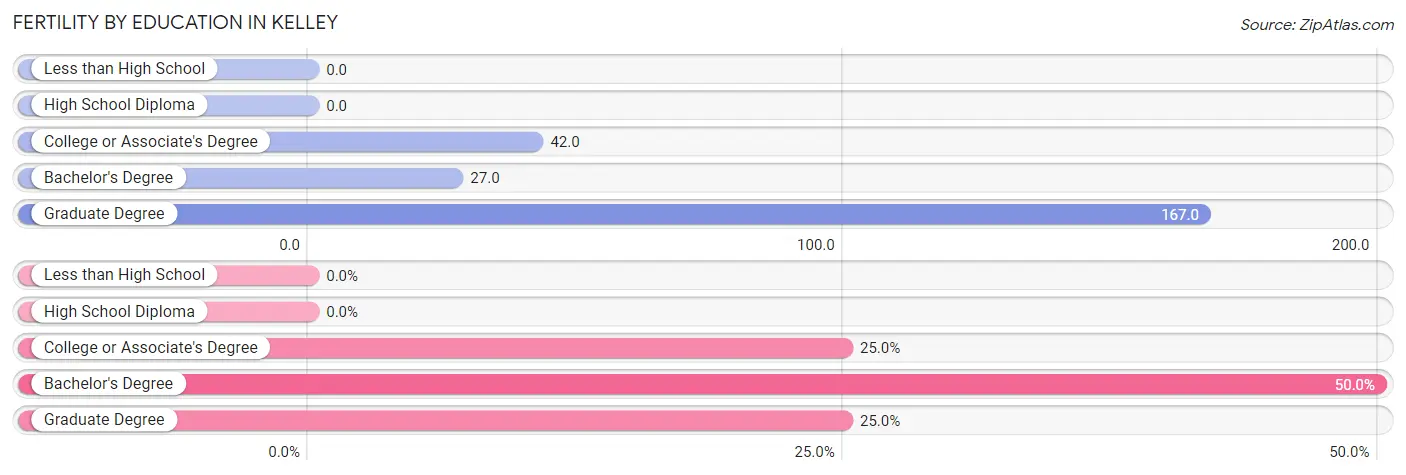
| Educational Attainment | Women with Births | Births / 1,000 Women |
| Less than High School | 0 (0.0%) | 0.0 |
| High School Diploma | 0 (0.0%) | 0.0 |
| College or Associate's Degree | 1 (25.0%) | 42.0 |
| Bachelor's Degree | 2 (50.0%) | 27.0 |
| Graduate Degree | 1 (25.0%) | 167.0 |
| Total | 4 (100.0%) | 35.0 |
Fertility by Education by Marriage Status in Kelley
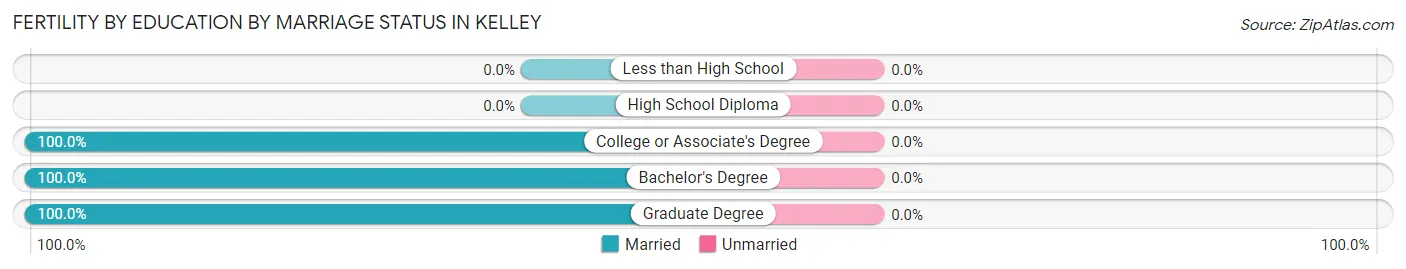
| Educational Attainment | Married | Unmarried |
| Less than High School | 0 (0.0%) | 0 (0.0%) |
| High School Diploma | 0 (0.0%) | 0 (0.0%) |
| College or Associate's Degree | 1 (100.0%) | 0 (0.0%) |
| Bachelor's Degree | 2 (100.0%) | 0 (0.0%) |
| Graduate Degree | 1 (100.0%) | 0 (0.0%) |
| Total | 4 (100.0%) | 0 (0.0%) |
Employment Characteristics in Kelley
Employment by Class of Employer in Kelley
Among the 281 employed individuals in Kelley, private company employees (245 | 87.2%), state government employees (13 | 4.6%), and self-employed (not incorporated) (9 | 3.2%) make up the most common classes of employment.
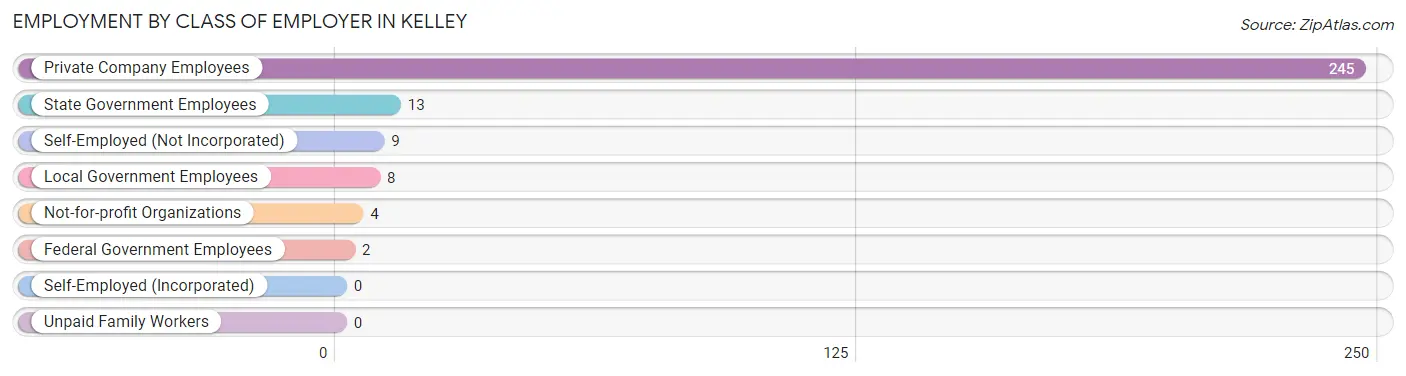
| Employer Class | # Employees | % Employees |
| Private Company Employees | 245 | 87.2% |
| Self-Employed (Incorporated) | 0 | 0.0% |
| Self-Employed (Not Incorporated) | 9 | 3.2% |
| Not-for-profit Organizations | 4 | 1.4% |
| Local Government Employees | 8 | 2.9% |
| State Government Employees | 13 | 4.6% |
| Federal Government Employees | 2 | 0.7% |
| Unpaid Family Workers | 0 | 0.0% |
| Total | 281 | 100.0% |
Employment Status by Age in Kelley
According to the labor force statistics for Kelley, out of the total population over 16 years of age (349), 83.1% or 290 individuals are in the labor force, with 1.4% or 4 of them unemployed. The age group with the highest labor force participation rate is 25 to 29 years, with 97.6% or 80 individuals in the labor force. Within the labor force, the 16 to 19 years age range has the highest percentage of unemployed individuals, with 16.7% or 1 of them being unemployed.
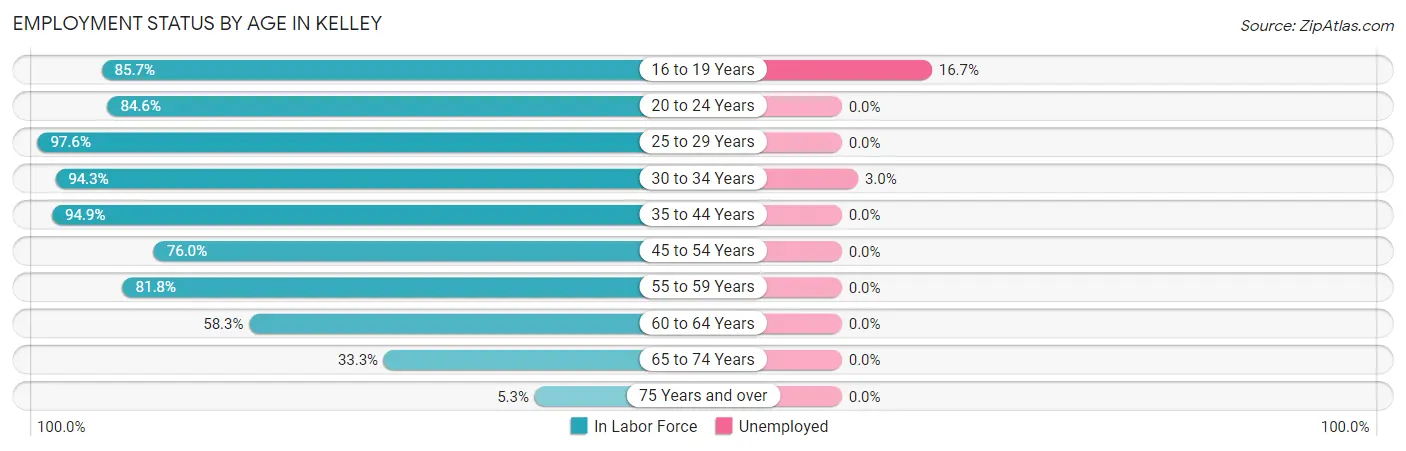
| Age Bracket | In Labor Force | Unemployed |
| 16 to 19 Years | 6 (85.7%) | 1 (16.7%) |
| 20 to 24 Years | 11 (84.6%) | 0 (0.0%) |
| 25 to 29 Years | 80 (97.6%) | 0 (0.0%) |
| 30 to 34 Years | 100 (94.3%) | 3 (3.0%) |
| 35 to 44 Years | 37 (94.9%) | 0 (0.0%) |
| 45 to 54 Years | 19 (76.0%) | 0 (0.0%) |
| 55 to 59 Years | 18 (81.8%) | 0 (0.0%) |
| 60 to 64 Years | 14 (58.3%) | 0 (0.0%) |
| 65 to 74 Years | 4 (33.3%) | 0 (0.0%) |
| 75 Years and over | 1 (5.3%) | 0 (0.0%) |
| Total | 290 (83.1%) | 4 (1.4%) |
Employment Status by Educational Attainment in Kelley
According to labor force statistics for Kelley, 89.9% of individuals (268) out of the total population between 25 and 64 years of age (298) are in the labor force, with 1.1% or 3 of them being unemployed. The group with the highest labor force participation rate are those with the educational attainment of less than high school, with 100.0% or 4 individuals in the labor force. Within the labor force, individuals with college / associate degree education have the highest percentage of unemployment, with 2.7% or 3 of them being unemployed.
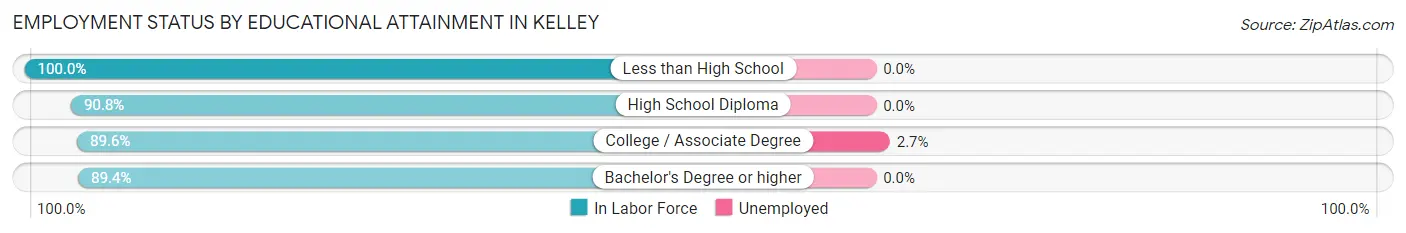
| Educational Attainment | In Labor Force | Unemployed |
| Less than High School | 4 (100.0%) | 0 (0.0%) |
| High School Diploma | 59 (90.8%) | 0 (0.0%) |
| College / Associate Degree | 112 (89.6%) | 3 (2.7%) |
| Bachelor's Degree or higher | 93 (89.4%) | 0 (0.0%) |
| Total | 268 (89.9%) | 3 (1.1%) |
Employment Occupations by Sex in Kelley
Management, Business, Science and Arts Occupations
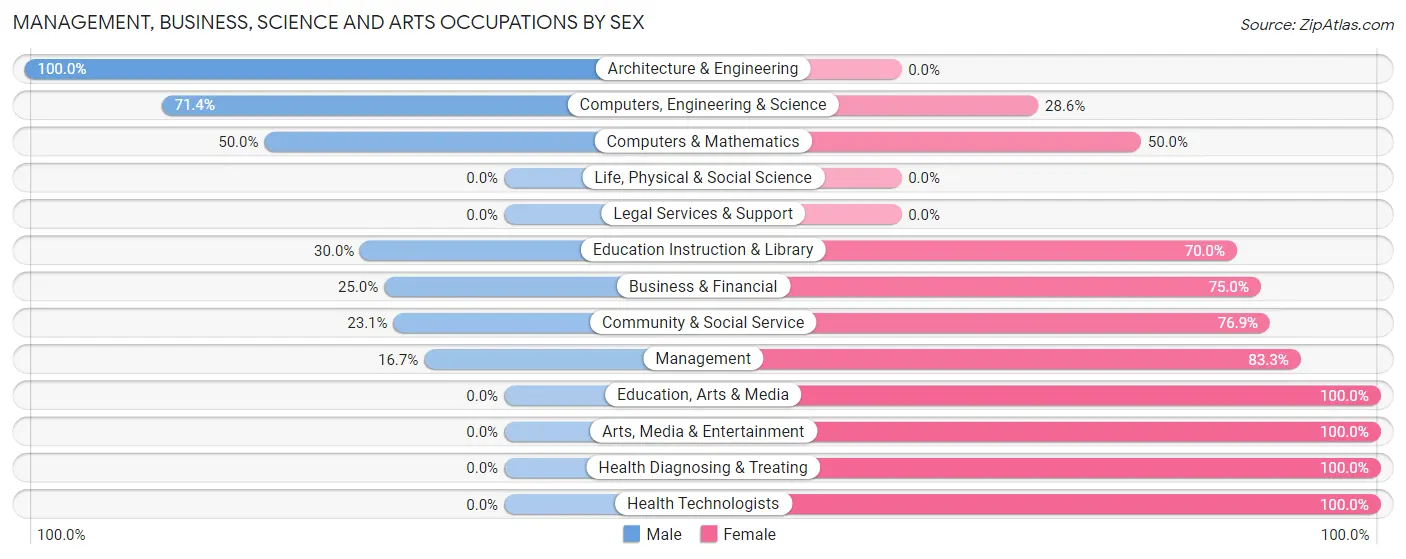
The most common Management, Business, Science and Arts occupations in Kelley are Management (60 | 21.0%), Business & Financial (16 | 5.6%), Computers, Engineering & Science (14 | 4.9%), Community & Social Service (13 | 4.5%), and Education Instruction & Library (10 | 3.5%).
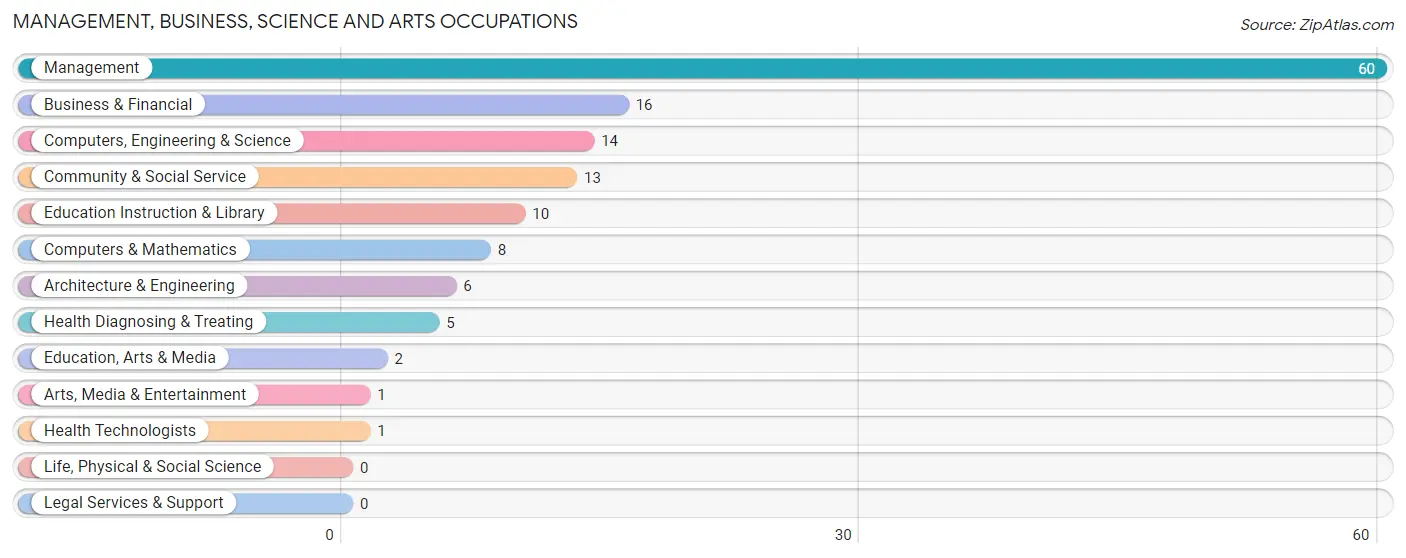
Management, Business, Science and Arts Occupations by Sex
Within the Management, Business, Science and Arts occupations in Kelley, the most male-oriented occupations are Architecture & Engineering (100.0%), Computers, Engineering & Science (71.4%), and Computers & Mathematics (50.0%), while the most female-oriented occupations are Education, Arts & Media (100.0%), Arts, Media & Entertainment (100.0%), and Health Diagnosing & Treating (100.0%).
| Occupation | Male | Female |
| Management | 10 (16.7%) | 50 (83.3%) |
| Business & Financial | 4 (25.0%) | 12 (75.0%) |
| Computers, Engineering & Science | 10 (71.4%) | 4 (28.6%) |
| Computers & Mathematics | 4 (50.0%) | 4 (50.0%) |
| Architecture & Engineering | 6 (100.0%) | 0 (0.0%) |
| Life, Physical & Social Science | 0 (0.0%) | 0 (0.0%) |
| Community & Social Service | 3 (23.1%) | 10 (76.9%) |
| Education, Arts & Media | 0 (0.0%) | 2 (100.0%) |
| Legal Services & Support | 0 (0.0%) | 0 (0.0%) |
| Education Instruction & Library | 3 (30.0%) | 7 (70.0%) |
| Arts, Media & Entertainment | 0 (0.0%) | 1 (100.0%) |
| Health Diagnosing & Treating | 0 (0.0%) | 5 (100.0%) |
| Health Technologists | 0 (0.0%) | 1 (100.0%) |
| Total (Category) | 27 (25.0%) | 81 (75.0%) |
| Total (Overall) | 168 (58.7%) | 118 (41.3%) |
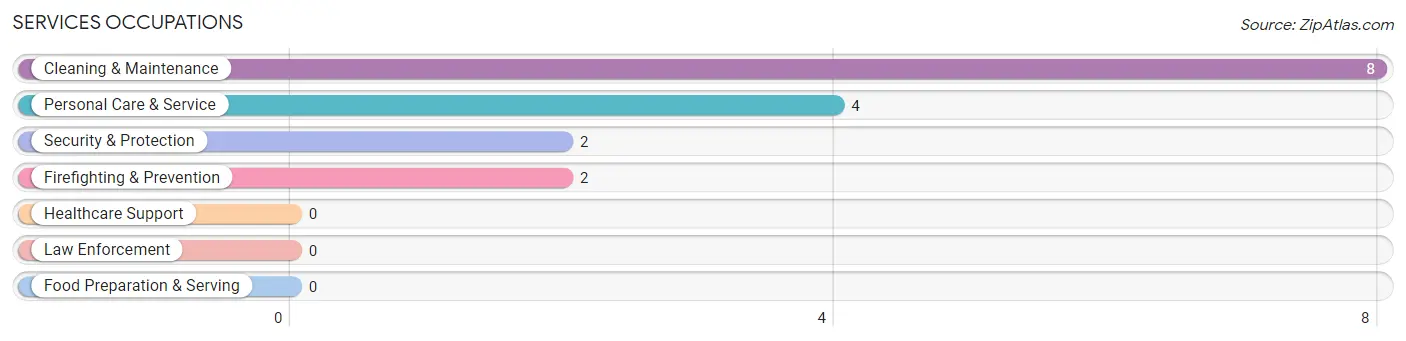
Services Occupations
The most common Services occupations in Kelley are Cleaning & Maintenance (8 | 2.8%), Personal Care & Service (4 | 1.4%), Security & Protection (2 | 0.7%), and Firefighting & Prevention (2 | 0.7%).
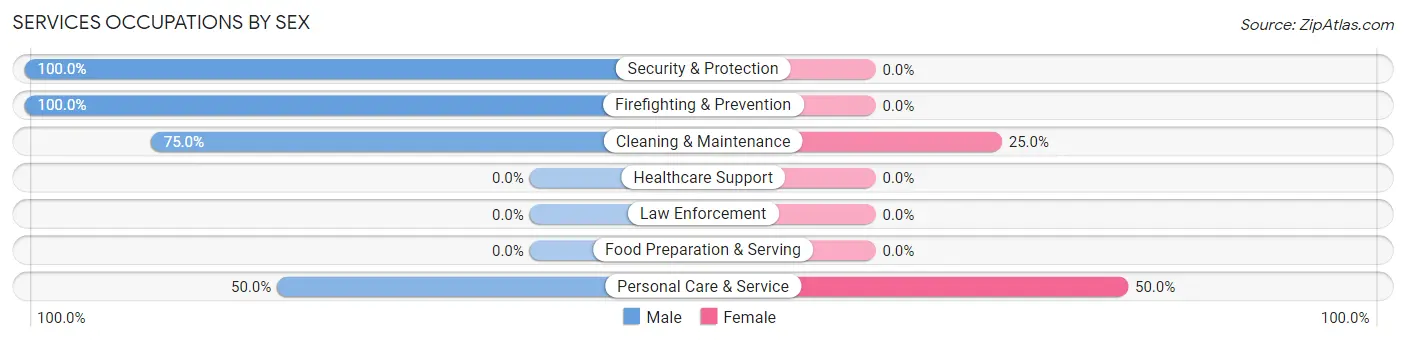
Services Occupations by Sex
Within the Services occupations in Kelley, the most male-oriented occupations are Security & Protection (100.0%), Firefighting & Prevention (100.0%), and Cleaning & Maintenance (75.0%), while the most female-oriented occupations are Personal Care & Service (50.0%), and Cleaning & Maintenance (25.0%).
| Occupation | Male | Female |
| Healthcare Support | 0 (0.0%) | 0 (0.0%) |
| Security & Protection | 2 (100.0%) | 0 (0.0%) |
| Firefighting & Prevention | 2 (100.0%) | 0 (0.0%) |
| Law Enforcement | 0 (0.0%) | 0 (0.0%) |
| Food Preparation & Serving | 0 (0.0%) | 0 (0.0%) |
| Cleaning & Maintenance | 6 (75.0%) | 2 (25.0%) |
| Personal Care & Service | 2 (50.0%) | 2 (50.0%) |
| Total (Category) | 10 (71.4%) | 4 (28.6%) |
| Total (Overall) | 168 (58.7%) | 118 (41.3%) |
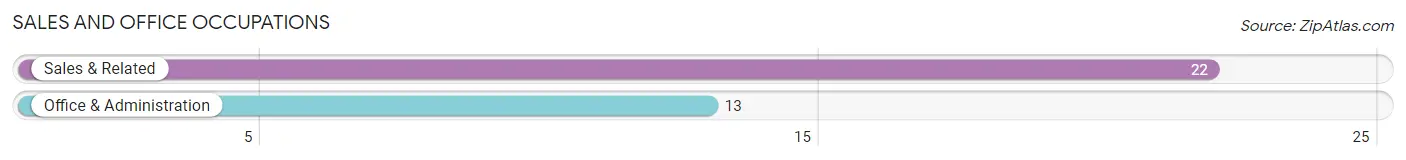
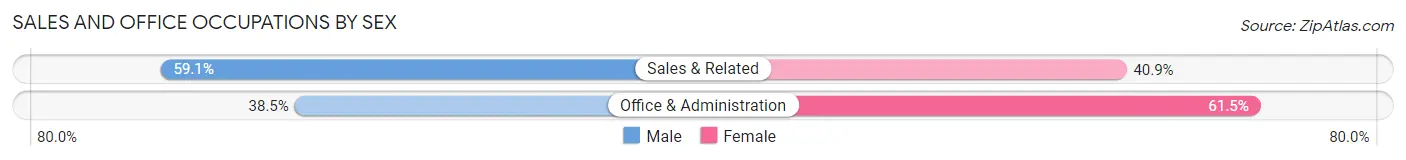
Sales and Office Occupations
The most common Sales and Office occupations in Kelley are Sales & Related (22 | 7.7%), and Office & Administration (13 | 4.5%).
Sales and Office Occupations by Sex
| Occupation | Male | Female |
| Sales & Related | 13 (59.1%) | 9 (40.9%) |
| Office & Administration | 5 (38.5%) | 8 (61.5%) |
| Total (Category) | 18 (51.4%) | 17 (48.6%) |
| Total (Overall) | 168 (58.7%) | 118 (41.3%) |
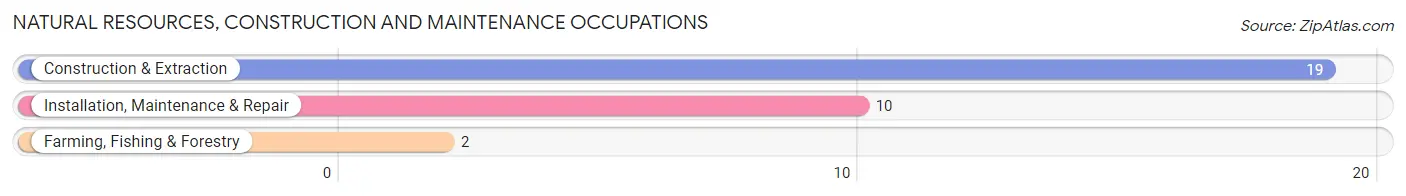
Natural Resources, Construction and Maintenance Occupations
The most common Natural Resources, Construction and Maintenance occupations in Kelley are Construction & Extraction (19 | 6.6%), Installation, Maintenance & Repair (10 | 3.5%), and Farming, Fishing & Forestry (2 | 0.7%).
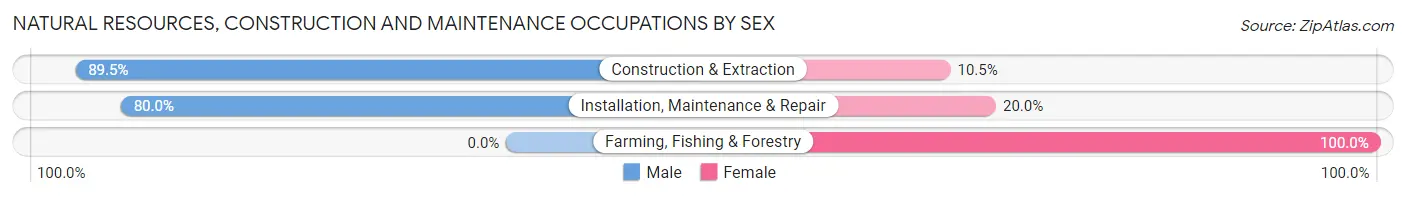
Natural Resources, Construction and Maintenance Occupations by Sex
| Occupation | Male | Female |
| Farming, Fishing & Forestry | 0 (0.0%) | 2 (100.0%) |
| Construction & Extraction | 17 (89.5%) | 2 (10.5%) |
| Installation, Maintenance & Repair | 8 (80.0%) | 2 (20.0%) |
| Total (Category) | 25 (80.6%) | 6 (19.4%) |
| Total (Overall) | 168 (58.7%) | 118 (41.3%) |
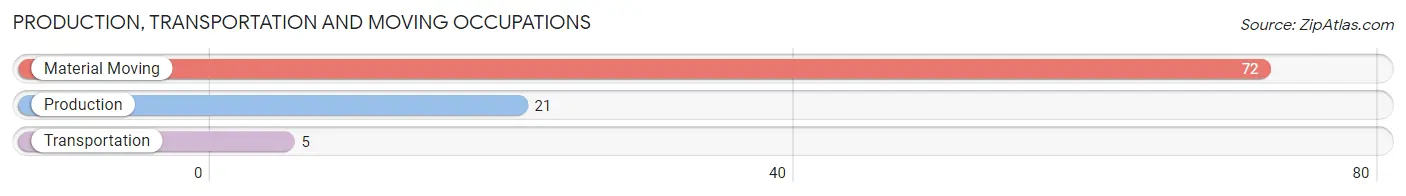
Production, Transportation and Moving Occupations
The most common Production, Transportation and Moving occupations in Kelley are Material Moving (72 | 25.2%), Production (21 | 7.3%), and Transportation (5 | 1.8%).
Production, Transportation and Moving Occupations by Sex
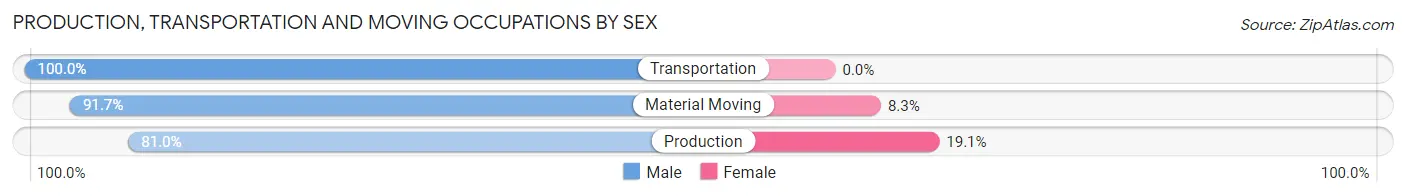
| Occupation | Male | Female |
| Production | 17 (80.9%) | 4 (19.1%) |
| Transportation | 5 (100.0%) | 0 (0.0%) |
| Material Moving | 66 (91.7%) | 6 (8.3%) |
| Total (Category) | 88 (89.8%) | 10 (10.2%) |
| Total (Overall) | 168 (58.7%) | 118 (41.3%) |
Employment Industries by Sex in Kelley
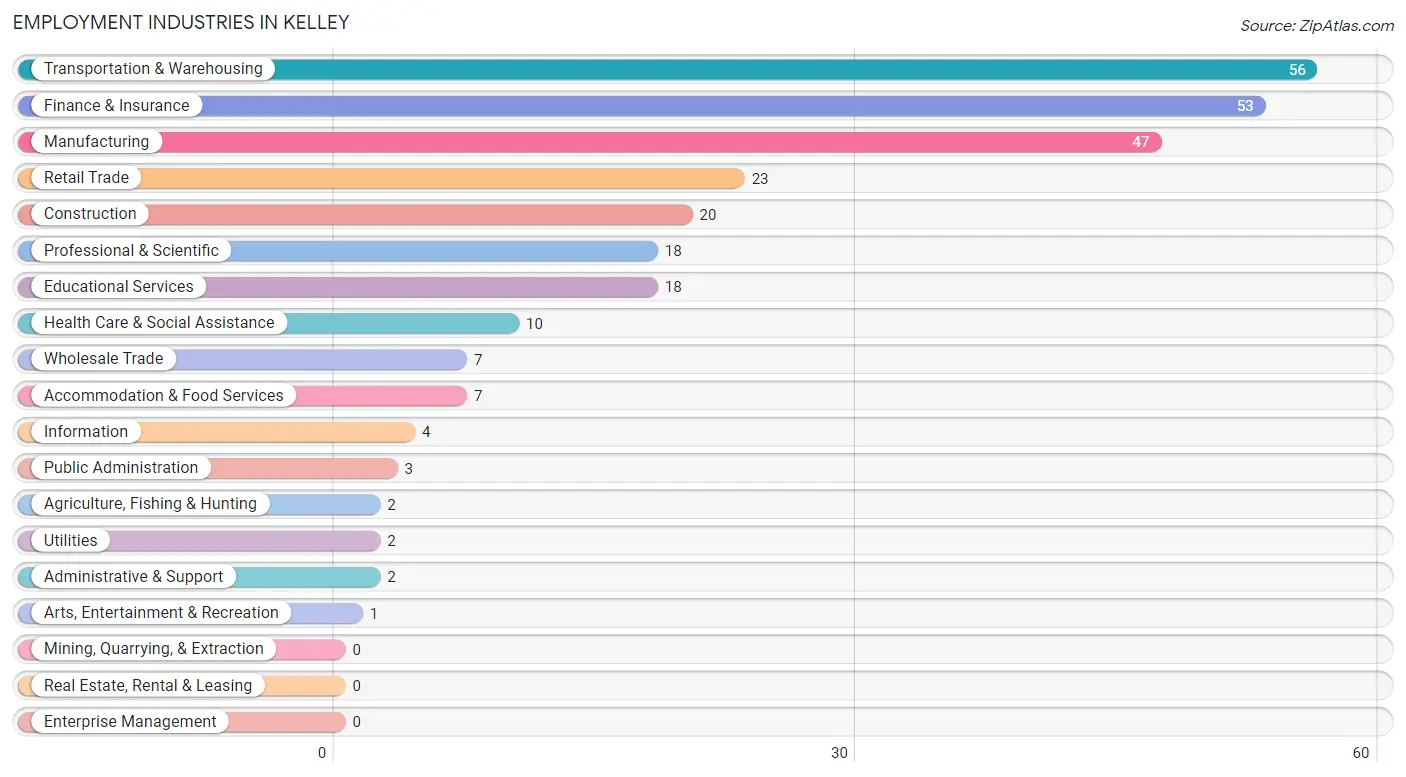
Employment Industries in Kelley
The major employment industries in Kelley include Transportation & Warehousing (56 | 19.6%), Finance & Insurance (53 | 18.5%), Manufacturing (47 | 16.4%), Retail Trade (23 | 8.0%), and Construction (20 | 7.0%).
Employment Industries by Sex in Kelley
The Kelley industries that see more men than women are Utilities (100.0%), Arts, Entertainment & Recreation (100.0%), and Accommodation & Food Services (100.0%), whereas the industries that tend to have a higher number of women are Agriculture, Fishing & Hunting (100.0%), Information (100.0%), and Administrative & Support (100.0%).
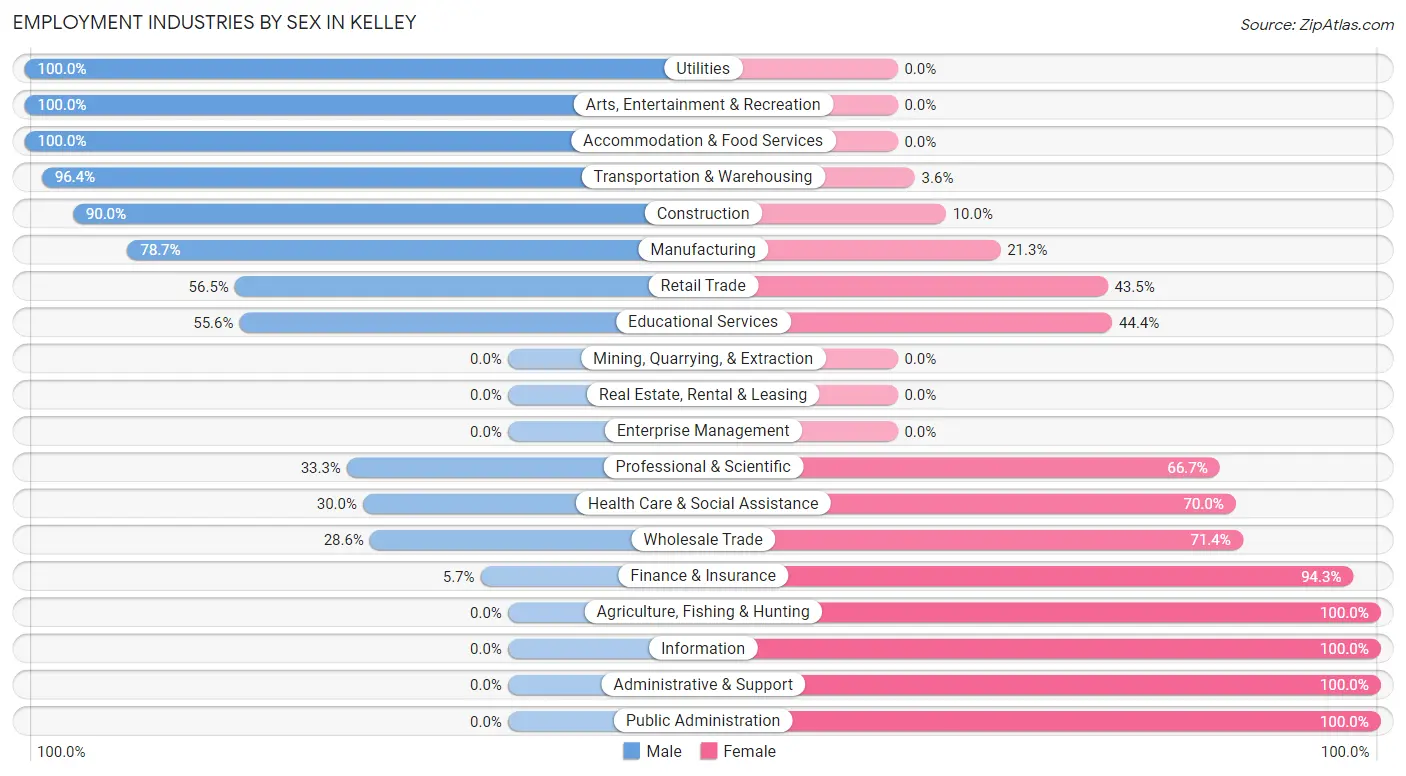
| Industry | Male | Female |
| Agriculture, Fishing & Hunting | 0 (0.0%) | 2 (100.0%) |
| Mining, Quarrying, & Extraction | 0 (0.0%) | 0 (0.0%) |
| Construction | 18 (90.0%) | 2 (10.0%) |
| Manufacturing | 37 (78.7%) | 10 (21.3%) |
| Wholesale Trade | 2 (28.6%) | 5 (71.4%) |
| Retail Trade | 13 (56.5%) | 10 (43.5%) |
| Transportation & Warehousing | 54 (96.4%) | 2 (3.6%) |
| Utilities | 2 (100.0%) | 0 (0.0%) |
| Information | 0 (0.0%) | 4 (100.0%) |
| Finance & Insurance | 3 (5.7%) | 50 (94.3%) |
| Real Estate, Rental & Leasing | 0 (0.0%) | 0 (0.0%) |
| Professional & Scientific | 6 (33.3%) | 12 (66.7%) |
| Enterprise Management | 0 (0.0%) | 0 (0.0%) |
| Administrative & Support | 0 (0.0%) | 2 (100.0%) |
| Educational Services | 10 (55.6%) | 8 (44.4%) |
| Health Care & Social Assistance | 3 (30.0%) | 7 (70.0%) |
| Arts, Entertainment & Recreation | 1 (100.0%) | 0 (0.0%) |
| Accommodation & Food Services | 7 (100.0%) | 0 (0.0%) |
| Public Administration | 0 (0.0%) | 3 (100.0%) |
| Total | 168 (58.7%) | 118 (41.3%) |
Education in Kelley
School Enrollment in Kelley
The most common levels of schooling among the 61 students in Kelley are elementary school (22 | 36.1%), middle school (12 | 19.7%), and college / undergraduate (10 | 16.4%).
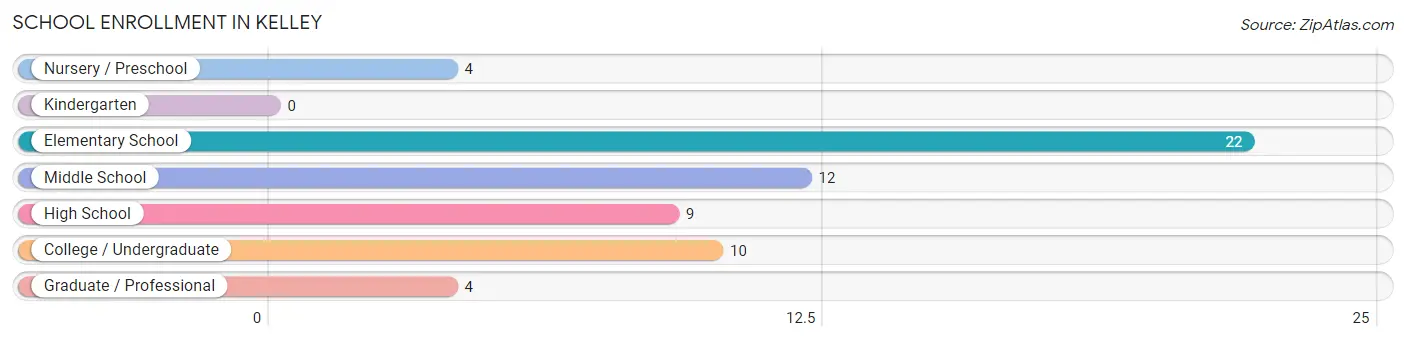
| School Level | # Students | % Students |
| Nursery / Preschool | 4 | 6.6% |
| Kindergarten | 0 | 0.0% |
| Elementary School | 22 | 36.1% |
| Middle School | 12 | 19.7% |
| High School | 9 | 14.7% |
| College / Undergraduate | 10 | 16.4% |
| Graduate / Professional | 4 | 6.6% |
| Total | 61 | 100.0% |
School Enrollment by Age by Funding Source in Kelley
Out of a total of 61 students who are enrolled in schools in Kelley, 15 (24.6%) attend a private institution, while the remaining 46 (75.4%) are enrolled in public schools. The age group of 5 to 9 year old has the highest likelihood of being enrolled in private schools, with 15 (62.5% in the age bracket) enrolled. Conversely, the age group of 3 to 4 year olds has the lowest likelihood of being enrolled in a private school, with 1 (100.0% in the age bracket) attending a public institution.
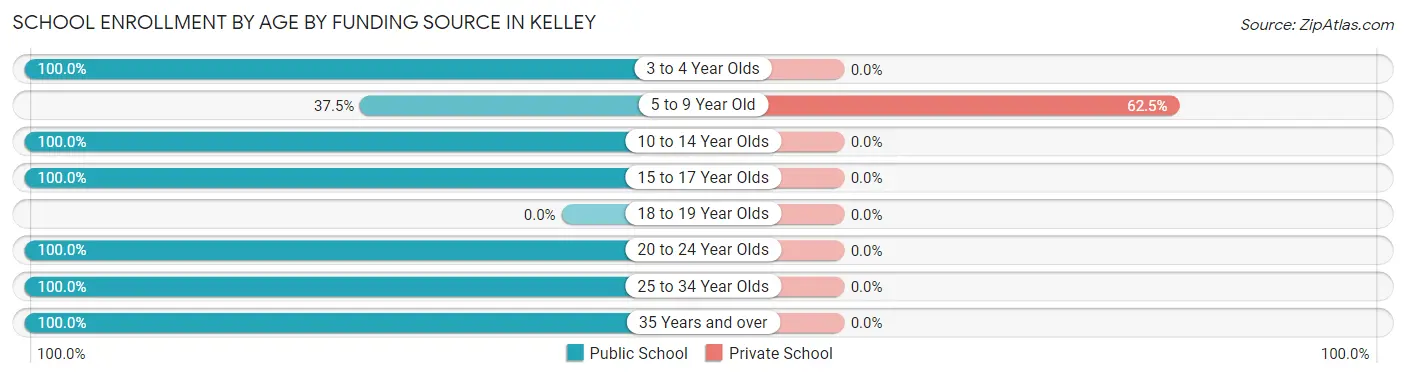
| Age Bracket | Public School | Private School |
| 3 to 4 Year Olds | 1 (100.0%) | 0 (0.0%) |
| 5 to 9 Year Old | 9 (37.5%) | 15 (62.5%) |
| 10 to 14 Year Olds | 13 (100.0%) | 0 (0.0%) |
| 15 to 17 Year Olds | 9 (100.0%) | 0 (0.0%) |
| 18 to 19 Year Olds | 0 (0.0%) | 0 (0.0%) |
| 20 to 24 Year Olds | 3 (100.0%) | 0 (0.0%) |
| 25 to 34 Year Olds | 9 (100.0%) | 0 (0.0%) |
| 35 Years and over | 2 (100.0%) | 0 (0.0%) |
| Total | 46 (75.4%) | 15 (24.6%) |
Educational Attainment by Field of Study in Kelley
Business (53 | 44.5%), bio, nature & agricultural (13 | 10.9%), education (12 | 10.1%), visual & performing arts (7 | 5.9%), and psychology (6 | 5.0%) are the most common fields of study among 119 individuals in Kelley who have obtained a bachelor's degree or higher.
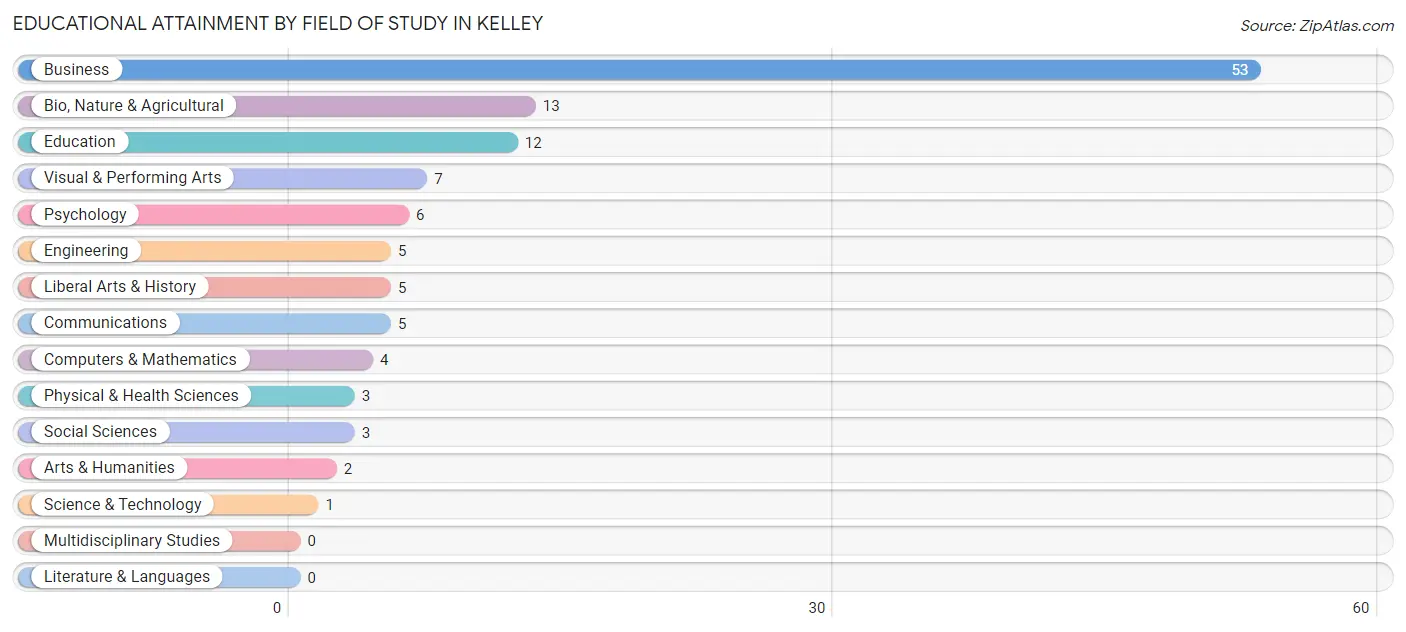
| Field of Study | # Graduates | % Graduates |
| Computers & Mathematics | 4 | 3.4% |
| Bio, Nature & Agricultural | 13 | 10.9% |
| Physical & Health Sciences | 3 | 2.5% |
| Psychology | 6 | 5.0% |
| Social Sciences | 3 | 2.5% |
| Engineering | 5 | 4.2% |
| Multidisciplinary Studies | 0 | 0.0% |
| Science & Technology | 1 | 0.8% |
| Business | 53 | 44.5% |
| Education | 12 | 10.1% |
| Literature & Languages | 0 | 0.0% |
| Liberal Arts & History | 5 | 4.2% |
| Visual & Performing Arts | 7 | 5.9% |
| Communications | 5 | 4.2% |
| Arts & Humanities | 2 | 1.7% |
| Total | 119 | 100.0% |
Transportation & Commute in Kelley
Vehicle Availability by Sex in Kelley
The most prevalent vehicle ownership categories in Kelley are males with 3 vehicles (90, accounting for 54.9%) and females with 3 vehicles (66, making up 76.9%).
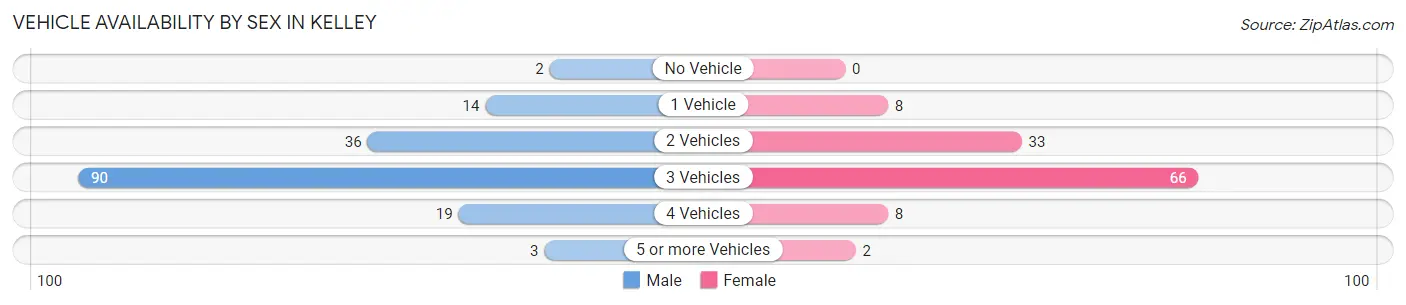
| Vehicles Available | Male | Female |
| No Vehicle | 2 (1.2%) | 0 (0.0%) |
| 1 Vehicle | 14 (8.5%) | 8 (6.8%) |
| 2 Vehicles | 36 (22.0%) | 33 (28.2%) |
| 3 Vehicles | 90 (54.9%) | 66 (56.4%) |
| 4 Vehicles | 19 (11.6%) | 8 (6.8%) |
| 5 or more Vehicles | 3 (1.8%) | 2 (1.7%) |
| Total | 164 (100.0%) | 117 (100.0%) |
Commute Time in Kelley
The most frequently occuring commute durations in Kelley are 15 to 19 minutes (82 commuters, 30.5%), 25 to 29 minutes (53 commuters, 19.7%), and 10 to 14 minutes (43 commuters, 16.0%).
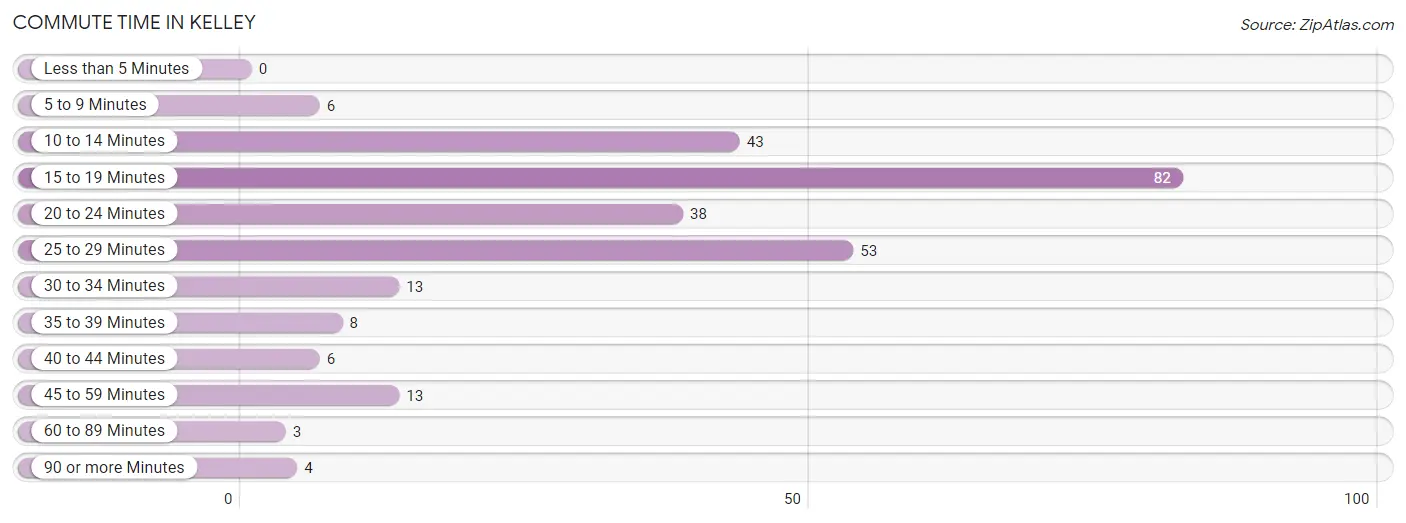
| Commute Time | # Commuters | % Commuters |
| Less than 5 Minutes | 0 | 0.0% |
| 5 to 9 Minutes | 6 | 2.2% |
| 10 to 14 Minutes | 43 | 16.0% |
| 15 to 19 Minutes | 82 | 30.5% |
| 20 to 24 Minutes | 38 | 14.1% |
| 25 to 29 Minutes | 53 | 19.7% |
| 30 to 34 Minutes | 13 | 4.8% |
| 35 to 39 Minutes | 8 | 3.0% |
| 40 to 44 Minutes | 6 | 2.2% |
| 45 to 59 Minutes | 13 | 4.8% |
| 60 to 89 Minutes | 3 | 1.1% |
| 90 or more Minutes | 4 | 1.5% |
Commute Time by Sex in Kelley
The most common commute times in Kelley are 25 to 29 minutes (45 commuters, 28.1%) for males and 15 to 19 minutes (57 commuters, 52.3%) for females.
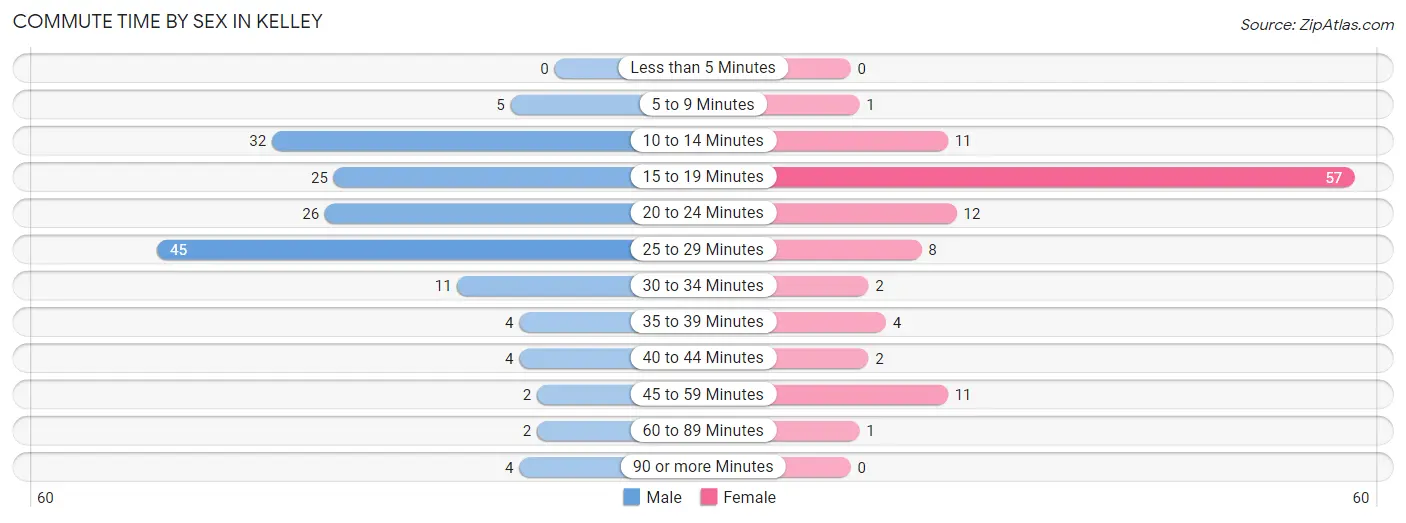
| Commute Time | Male | Female |
| Less than 5 Minutes | 0 (0.0%) | 0 (0.0%) |
| 5 to 9 Minutes | 5 (3.1%) | 1 (0.9%) |
| 10 to 14 Minutes | 32 (20.0%) | 11 (10.1%) |
| 15 to 19 Minutes | 25 (15.6%) | 57 (52.3%) |
| 20 to 24 Minutes | 26 (16.3%) | 12 (11.0%) |
| 25 to 29 Minutes | 45 (28.1%) | 8 (7.3%) |
| 30 to 34 Minutes | 11 (6.9%) | 2 (1.8%) |
| 35 to 39 Minutes | 4 (2.5%) | 4 (3.7%) |
| 40 to 44 Minutes | 4 (2.5%) | 2 (1.8%) |
| 45 to 59 Minutes | 2 (1.3%) | 11 (10.1%) |
| 60 to 89 Minutes | 2 (1.3%) | 1 (0.9%) |
| 90 or more Minutes | 4 (2.5%) | 0 (0.0%) |
Time of Departure to Work by Sex in Kelley
The most frequent times of departure to work in Kelley are 12:00 PM to 3:59 PM (47, 29.4%) for males and 7:30 AM to 7:59 AM (58, 53.2%) for females.
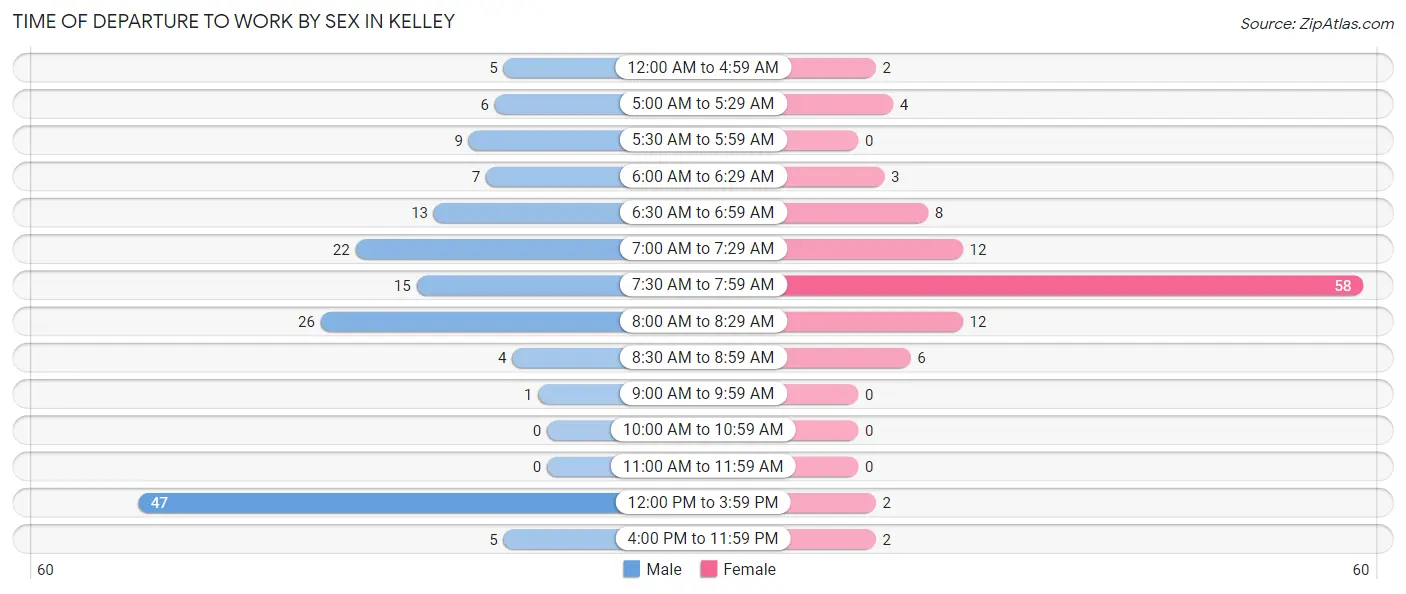
| Time of Departure | Male | Female |
| 12:00 AM to 4:59 AM | 5 (3.1%) | 2 (1.8%) |
| 5:00 AM to 5:29 AM | 6 (3.7%) | 4 (3.7%) |
| 5:30 AM to 5:59 AM | 9 (5.6%) | 0 (0.0%) |
| 6:00 AM to 6:29 AM | 7 (4.4%) | 3 (2.8%) |
| 6:30 AM to 6:59 AM | 13 (8.1%) | 8 (7.3%) |
| 7:00 AM to 7:29 AM | 22 (13.8%) | 12 (11.0%) |
| 7:30 AM to 7:59 AM | 15 (9.4%) | 58 (53.2%) |
| 8:00 AM to 8:29 AM | 26 (16.3%) | 12 (11.0%) |
| 8:30 AM to 8:59 AM | 4 (2.5%) | 6 (5.5%) |
| 9:00 AM to 9:59 AM | 1 (0.6%) | 0 (0.0%) |
| 10:00 AM to 10:59 AM | 0 (0.0%) | 0 (0.0%) |
| 11:00 AM to 11:59 AM | 0 (0.0%) | 0 (0.0%) |
| 12:00 PM to 3:59 PM | 47 (29.4%) | 2 (1.8%) |
| 4:00 PM to 11:59 PM | 5 (3.1%) | 2 (1.8%) |
| Total | 160 (100.0%) | 109 (100.0%) |
Housing Occupancy in Kelley
Occupancy by Ownership in Kelley
Of the total 171 dwellings in Kelley, owner-occupied units account for 97 (56.7%), while renter-occupied units make up 74 (43.3%).
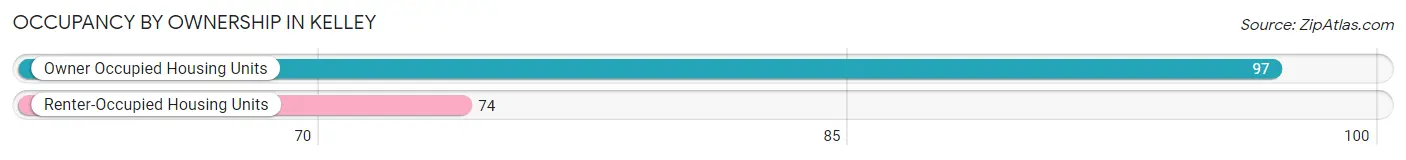
| Occupancy | # Housing Units | % Housing Units |
| Owner Occupied Housing Units | 97 | 56.7% |
| Renter-Occupied Housing Units | 74 | 43.3% |
| Total Occupied Housing Units | 171 | 100.0% |
Occupancy by Household Size in Kelley
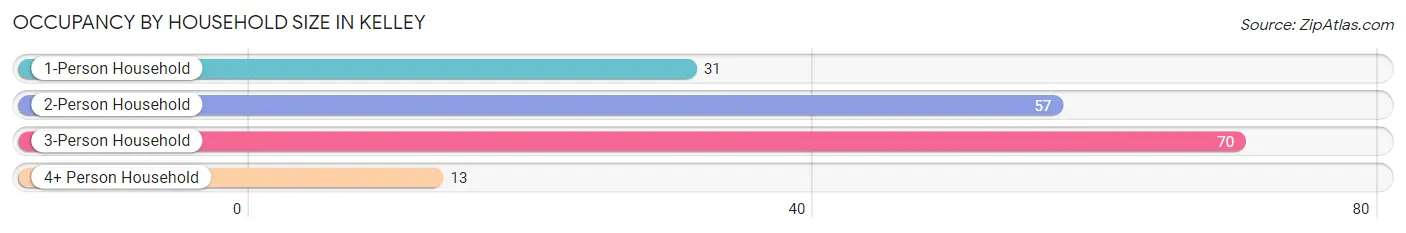
| Household Size | # Housing Units | % Housing Units |
| 1-Person Household | 31 | 18.1% |
| 2-Person Household | 57 | 33.3% |
| 3-Person Household | 70 | 40.9% |
| 4+ Person Household | 13 | 7.6% |
| Total Housing Units | 171 | 100.0% |
Occupancy by Ownership by Household Size in Kelley
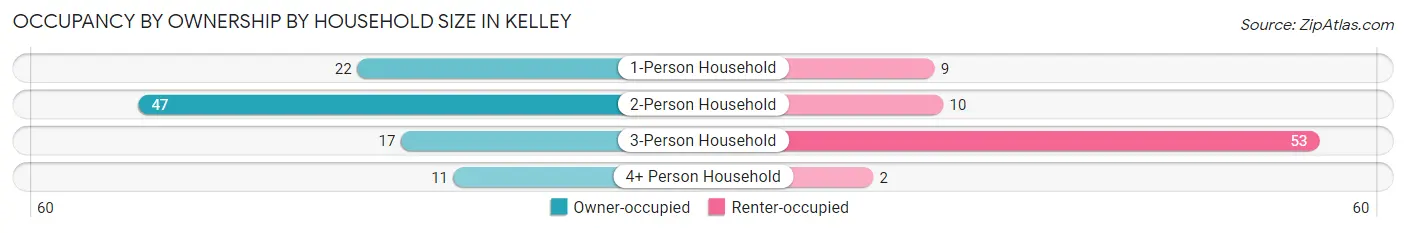
| Household Size | Owner-occupied | Renter-occupied |
| 1-Person Household | 22 (71.0%) | 9 (29.0%) |
| 2-Person Household | 47 (82.5%) | 10 (17.5%) |
| 3-Person Household | 17 (24.3%) | 53 (75.7%) |
| 4+ Person Household | 11 (84.6%) | 2 (15.4%) |
| Total Housing Units | 97 (56.7%) | 74 (43.3%) |
Occupancy by Educational Attainment in Kelley
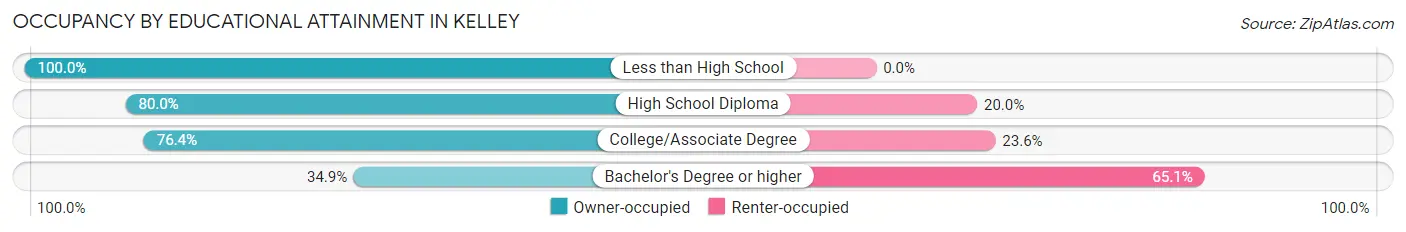
| Household Size | Owner-occupied | Renter-occupied |
| Less than High School | 5 (100.0%) | 0 (0.0%) |
| High School Diploma | 20 (80.0%) | 5 (20.0%) |
| College/Associate Degree | 42 (76.4%) | 13 (23.6%) |
| Bachelor's Degree or higher | 30 (34.9%) | 56 (65.1%) |
Occupancy by Age of Householder in Kelley
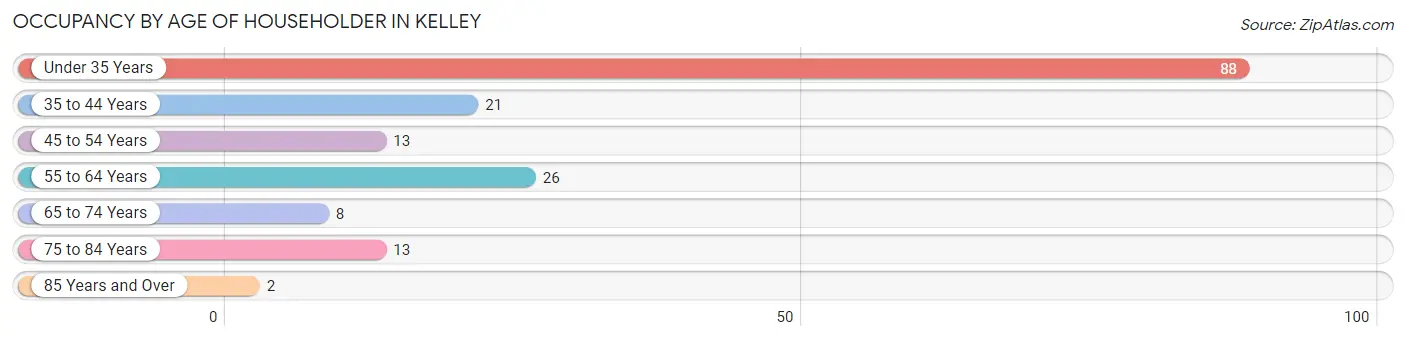
| Age Bracket | # Households | % Households |
| Under 35 Years | 88 | 51.5% |
| 35 to 44 Years | 21 | 12.3% |
| 45 to 54 Years | 13 | 7.6% |
| 55 to 64 Years | 26 | 15.2% |
| 65 to 74 Years | 8 | 4.7% |
| 75 to 84 Years | 13 | 7.6% |
| 85 Years and Over | 2 | 1.2% |
| Total | 171 | 100.0% |
Housing Finances in Kelley
Median Income by Occupancy in Kelley
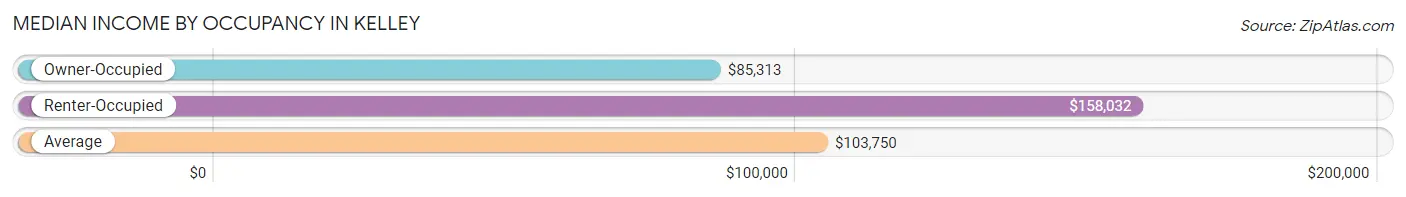
| Occupancy Type | # Households | Median Income |
| Owner-Occupied | 97 (56.7%) | $85,313 |
| Renter-Occupied | 74 (43.3%) | $158,032 |
| Average | 171 (100.0%) | $103,750 |
Occupancy by Householder Income Bracket in Kelley
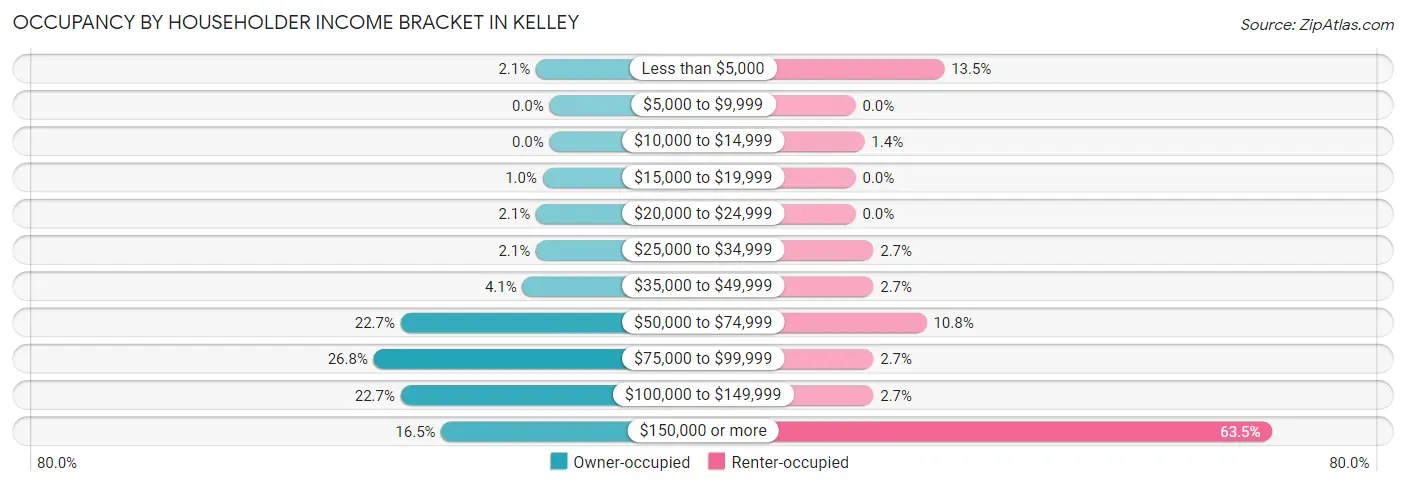
| Income Bracket | Owner-occupied | Renter-occupied |
| Less than $5,000 | 2 (2.1%) | 10 (13.5%) |
| $5,000 to $9,999 | 0 (0.0%) | 0 (0.0%) |
| $10,000 to $14,999 | 0 (0.0%) | 1 (1.3%) |
| $15,000 to $19,999 | 1 (1.0%) | 0 (0.0%) |
| $20,000 to $24,999 | 2 (2.1%) | 0 (0.0%) |
| $25,000 to $34,999 | 2 (2.1%) | 2 (2.7%) |
| $35,000 to $49,999 | 4 (4.1%) | 2 (2.7%) |
| $50,000 to $74,999 | 22 (22.7%) | 8 (10.8%) |
| $75,000 to $99,999 | 26 (26.8%) | 2 (2.7%) |
| $100,000 to $149,999 | 22 (22.7%) | 2 (2.7%) |
| $150,000 or more | 16 (16.5%) | 47 (63.5%) |
| Total | 97 (100.0%) | 74 (100.0%) |
Monthly Housing Cost Tiers in Kelley
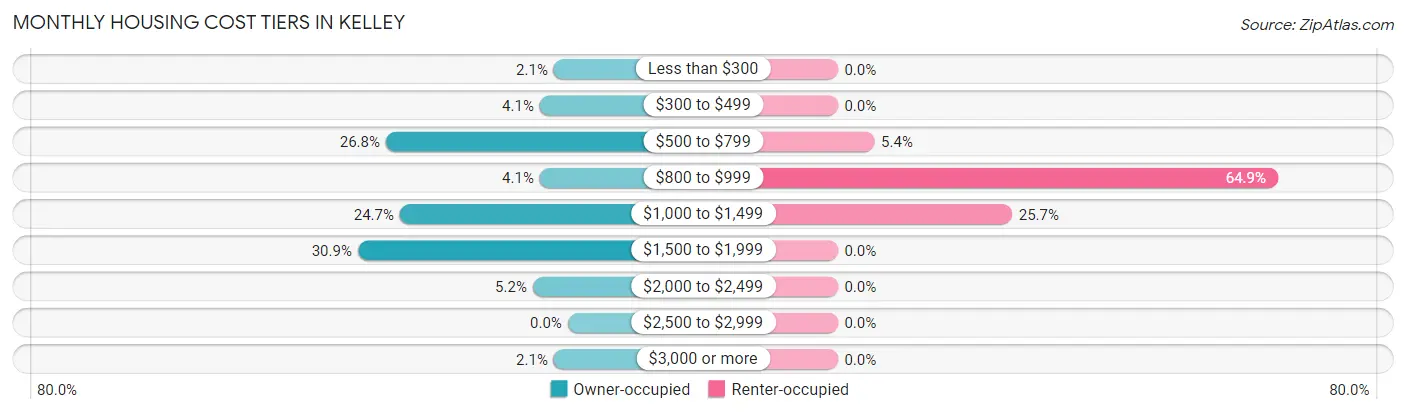
| Monthly Cost | Owner-occupied | Renter-occupied |
| Less than $300 | 2 (2.1%) | 0 (0.0%) |
| $300 to $499 | 4 (4.1%) | 0 (0.0%) |
| $500 to $799 | 26 (26.8%) | 4 (5.4%) |
| $800 to $999 | 4 (4.1%) | 48 (64.9%) |
| $1,000 to $1,499 | 24 (24.7%) | 19 (25.7%) |
| $1,500 to $1,999 | 30 (30.9%) | 0 (0.0%) |
| $2,000 to $2,499 | 5 (5.1%) | 0 (0.0%) |
| $2,500 to $2,999 | 0 (0.0%) | 0 (0.0%) |
| $3,000 or more | 2 (2.1%) | 0 (0.0%) |
| Total | 97 (100.0%) | 74 (100.0%) |
Physical Housing Characteristics in Kelley
Housing Structures in Kelley
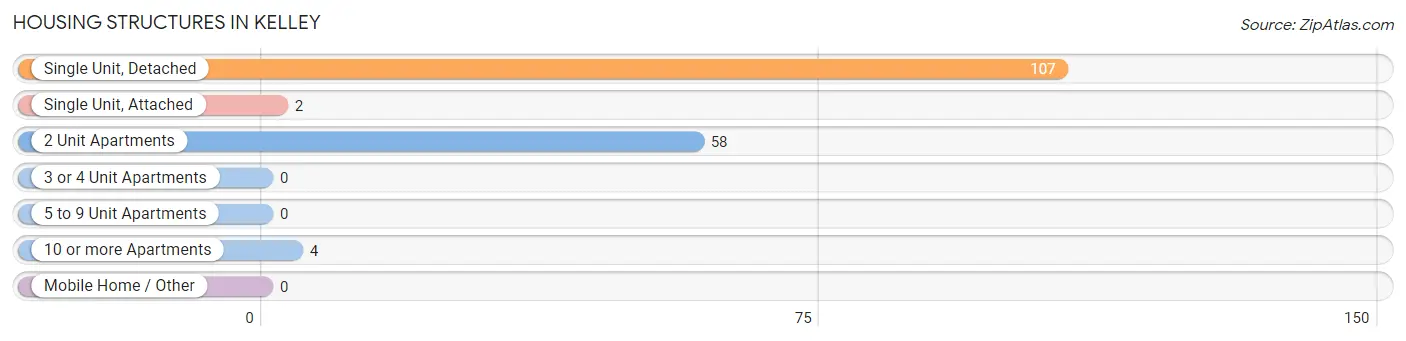
| Structure Type | # Housing Units | % Housing Units |
| Single Unit, Detached | 107 | 62.6% |
| Single Unit, Attached | 2 | 1.2% |
| 2 Unit Apartments | 58 | 33.9% |
| 3 or 4 Unit Apartments | 0 | 0.0% |
| 5 to 9 Unit Apartments | 0 | 0.0% |
| 10 or more Apartments | 4 | 2.3% |
| Mobile Home / Other | 0 | 0.0% |
| Total | 171 | 100.0% |
Housing Structures by Occupancy in Kelley
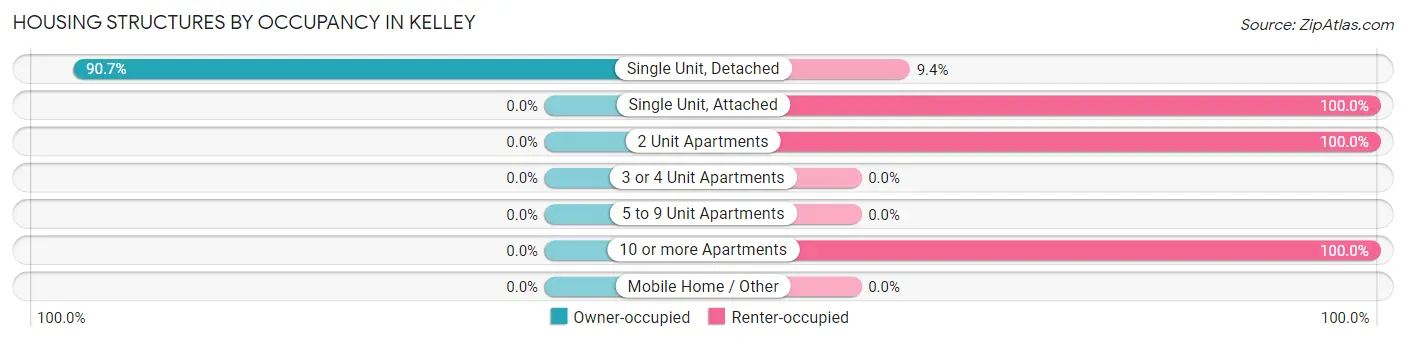
| Structure Type | Owner-occupied | Renter-occupied |
| Single Unit, Detached | 97 (90.6%) | 10 (9.3%) |
| Single Unit, Attached | 0 (0.0%) | 2 (100.0%) |
| 2 Unit Apartments | 0 (0.0%) | 58 (100.0%) |
| 3 or 4 Unit Apartments | 0 (0.0%) | 0 (0.0%) |
| 5 to 9 Unit Apartments | 0 (0.0%) | 0 (0.0%) |
| 10 or more Apartments | 0 (0.0%) | 4 (100.0%) |
| Mobile Home / Other | 0 (0.0%) | 0 (0.0%) |
| Total | 97 (56.7%) | 74 (43.3%) |
Housing Structures by Number of Rooms in Kelley
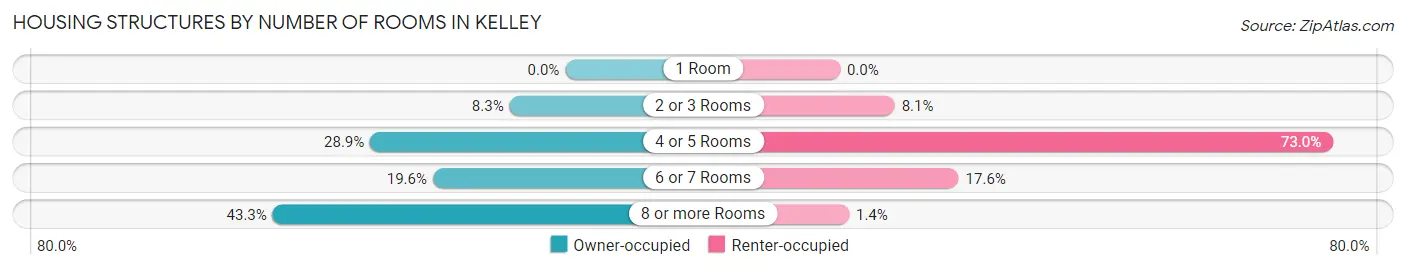
| Number of Rooms | Owner-occupied | Renter-occupied |
| 1 Room | 0 (0.0%) | 0 (0.0%) |
| 2 or 3 Rooms | 8 (8.3%) | 6 (8.1%) |
| 4 or 5 Rooms | 28 (28.9%) | 54 (73.0%) |
| 6 or 7 Rooms | 19 (19.6%) | 13 (17.6%) |
| 8 or more Rooms | 42 (43.3%) | 1 (1.3%) |
| Total | 97 (100.0%) | 74 (100.0%) |
Housing Structure by Heating Type in Kelley
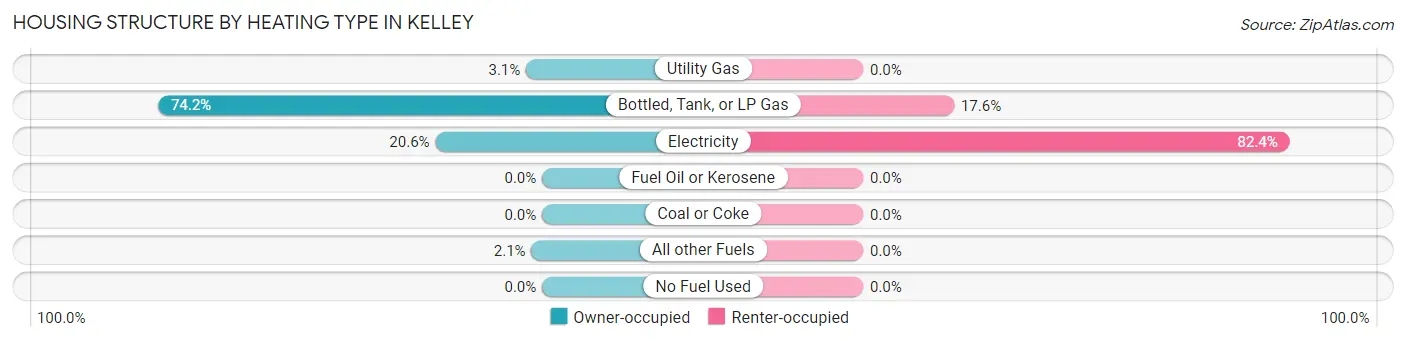
| Heating Type | Owner-occupied | Renter-occupied |
| Utility Gas | 3 (3.1%) | 0 (0.0%) |
| Bottled, Tank, or LP Gas | 72 (74.2%) | 13 (17.6%) |
| Electricity | 20 (20.6%) | 61 (82.4%) |
| Fuel Oil or Kerosene | 0 (0.0%) | 0 (0.0%) |
| Coal or Coke | 0 (0.0%) | 0 (0.0%) |
| All other Fuels | 2 (2.1%) | 0 (0.0%) |
| No Fuel Used | 0 (0.0%) | 0 (0.0%) |
| Total | 97 (100.0%) | 74 (100.0%) |
Household Vehicle Usage in Kelley
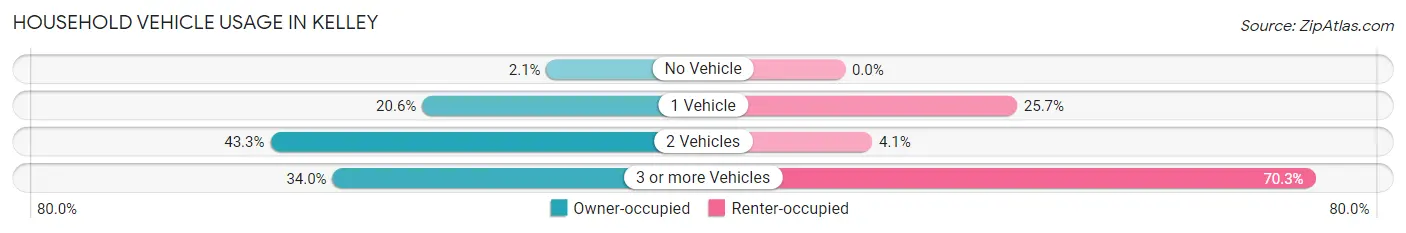
| Vehicles per Household | Owner-occupied | Renter-occupied |
| No Vehicle | 2 (2.1%) | 0 (0.0%) |
| 1 Vehicle | 20 (20.6%) | 19 (25.7%) |
| 2 Vehicles | 42 (43.3%) | 3 (4.1%) |
| 3 or more Vehicles | 33 (34.0%) | 52 (70.3%) |
| Total | 97 (100.0%) | 74 (100.0%) |
Real Estate & Mortgages in Kelley
Real Estate and Mortgage Overview in Kelley
| Characteristic | Without Mortgage | With Mortgage |
| Housing Units | 28 | 69 |
| Median Property Value | $208,300 | $185,200 |
| Median Household Income | $72,500 | $15 |
| Monthly Housing Costs | $670 | $2 |
| Real Estate Taxes | $2,357 | $0 |
Property Value by Mortgage Status in Kelley
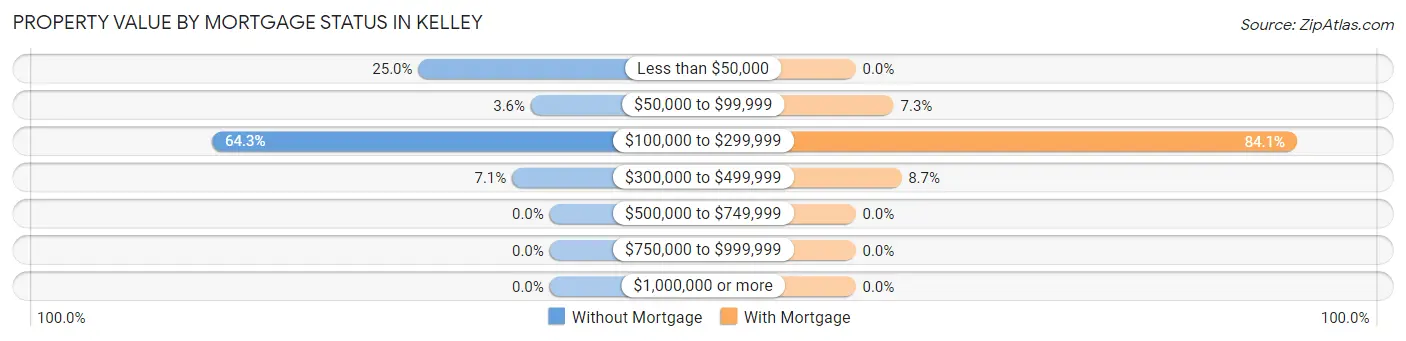
| Property Value | Without Mortgage | With Mortgage |
| Less than $50,000 | 7 (25.0%) | 0 (0.0%) |
| $50,000 to $99,999 | 1 (3.6%) | 5 (7.2%) |
| $100,000 to $299,999 | 18 (64.3%) | 58 (84.1%) |
| $300,000 to $499,999 | 2 (7.1%) | 6 (8.7%) |
| $500,000 to $749,999 | 0 (0.0%) | 0 (0.0%) |
| $750,000 to $999,999 | 0 (0.0%) | 0 (0.0%) |
| $1,000,000 or more | 0 (0.0%) | 0 (0.0%) |
| Total | 28 (100.0%) | 69 (100.0%) |
Household Income by Mortgage Status in Kelley
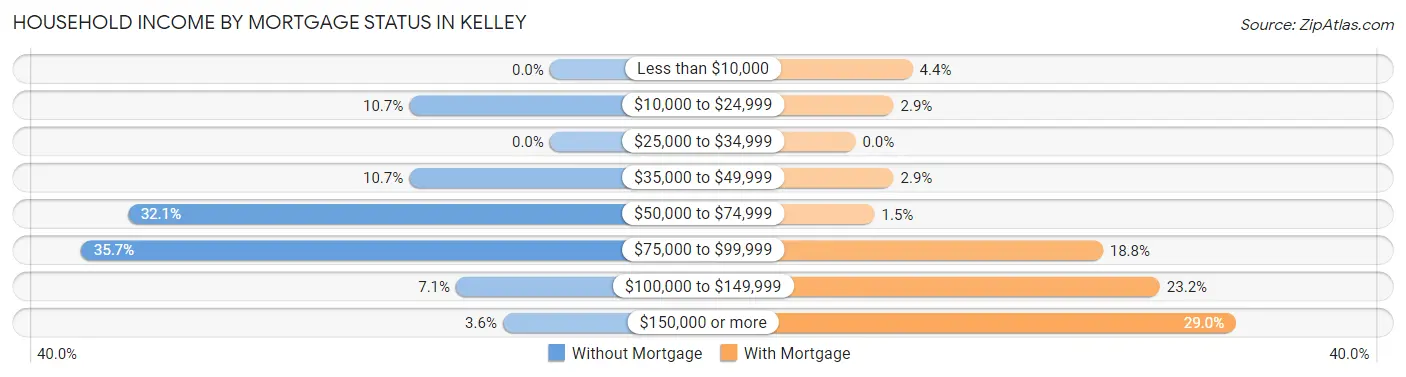
| Household Income | Without Mortgage | With Mortgage |
| Less than $10,000 | 0 (0.0%) | 3 (4.3%) |
| $10,000 to $24,999 | 3 (10.7%) | 2 (2.9%) |
| $25,000 to $34,999 | 0 (0.0%) | 0 (0.0%) |
| $35,000 to $49,999 | 3 (10.7%) | 2 (2.9%) |
| $50,000 to $74,999 | 9 (32.1%) | 1 (1.5%) |
| $75,000 to $99,999 | 10 (35.7%) | 13 (18.8%) |
| $100,000 to $149,999 | 2 (7.1%) | 16 (23.2%) |
| $150,000 or more | 1 (3.6%) | 20 (29.0%) |
| Total | 28 (100.0%) | 69 (100.0%) |
Property Value to Household Income Ratio in Kelley
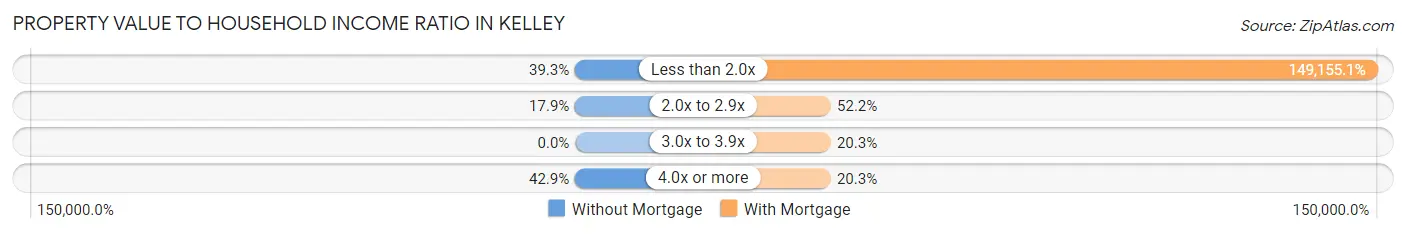
| Value-to-Income Ratio | Without Mortgage | With Mortgage |
| Less than 2.0x | 11 (39.3%) | 102,917 (149,155.1%) |
| 2.0x to 2.9x | 5 (17.9%) | 36 (52.2%) |
| 3.0x to 3.9x | 0 (0.0%) | 14 (20.3%) |
| 4.0x or more | 12 (42.9%) | 14 (20.3%) |
| Total | 28 (100.0%) | 69 (100.0%) |
Real Estate Taxes by Mortgage Status in Kelley
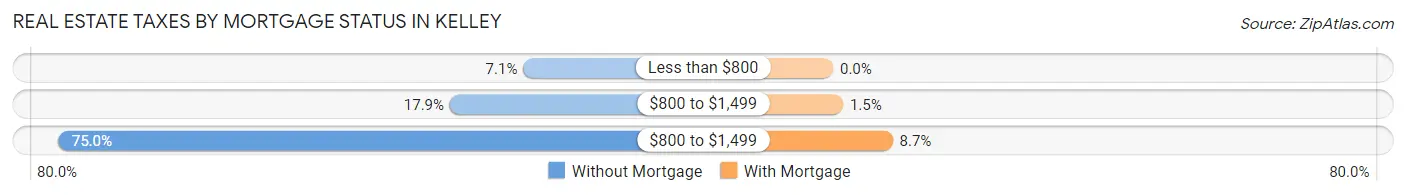
| Property Taxes | Without Mortgage | With Mortgage |
| Less than $800 | 2 (7.1%) | 0 (0.0%) |
| $800 to $1,499 | 5 (17.9%) | 1 (1.5%) |
| $800 to $1,499 | 21 (75.0%) | 6 (8.7%) |
| Total | 28 (100.0%) | 69 (100.0%) |
Health & Disability in Kelley
Health Insurance Coverage by Age in Kelley
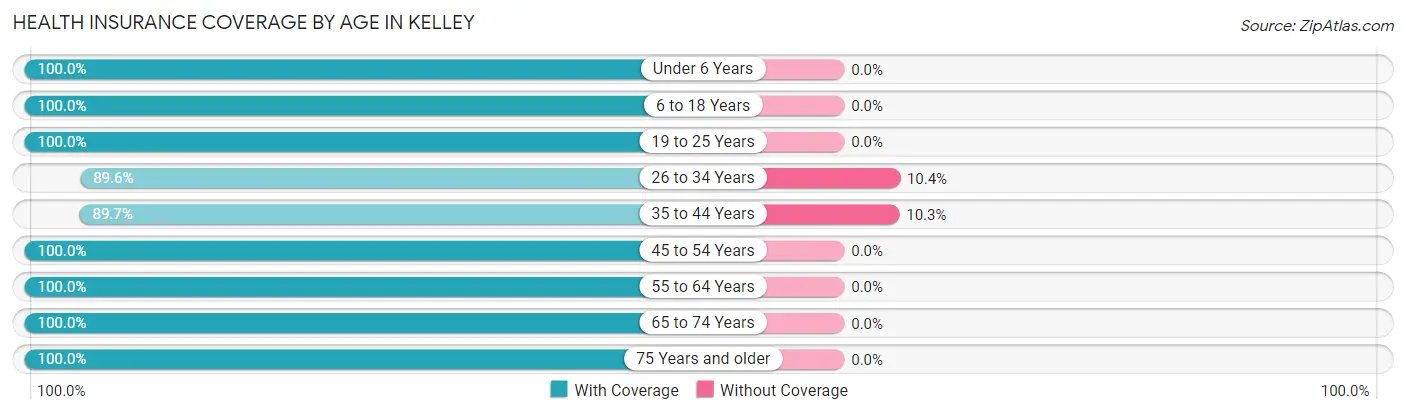
| Age Bracket | With Coverage | Without Coverage |
| Under 6 Years | 14 (100.0%) | 0 (0.0%) |
| 6 to 18 Years | 45 (100.0%) | 0 (0.0%) |
| 19 to 25 Years | 18 (100.0%) | 0 (0.0%) |
| 26 to 34 Years | 164 (89.6%) | 19 (10.4%) |
| 35 to 44 Years | 35 (89.7%) | 4 (10.3%) |
| 45 to 54 Years | 25 (100.0%) | 0 (0.0%) |
| 55 to 64 Years | 46 (100.0%) | 0 (0.0%) |
| 65 to 74 Years | 12 (100.0%) | 0 (0.0%) |
| 75 Years and older | 19 (100.0%) | 0 (0.0%) |
| Total | 378 (94.3%) | 23 (5.7%) |
Health Insurance Coverage by Citizenship Status in Kelley
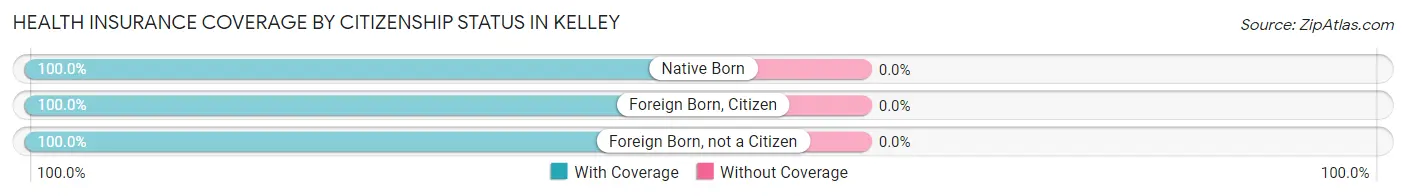
| Citizenship Status | With Coverage | Without Coverage |
| Native Born | 14 (100.0%) | 0 (0.0%) |
| Foreign Born, Citizen | 45 (100.0%) | 0 (0.0%) |
| Foreign Born, not a Citizen | 18 (100.0%) | 0 (0.0%) |
Health Insurance Coverage by Household Income in Kelley
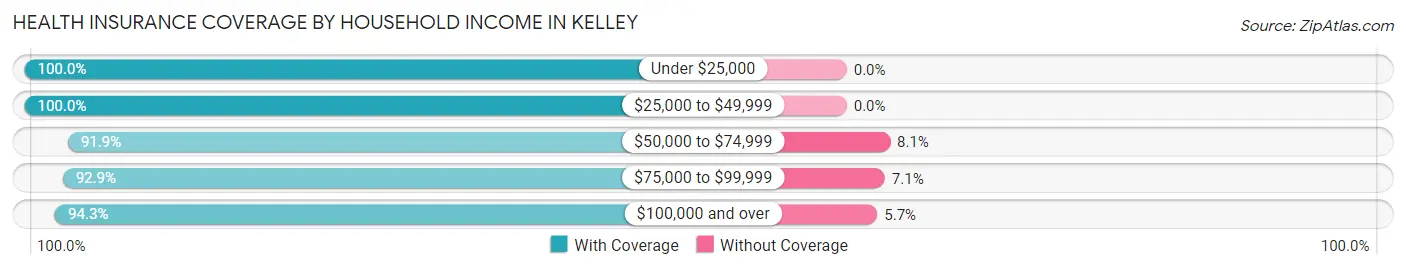
| Household Income | With Coverage | Without Coverage |
| Under $25,000 | 31 (100.0%) | 0 (0.0%) |
| $25,000 to $49,999 | 13 (100.0%) | 0 (0.0%) |
| $50,000 to $74,999 | 68 (91.9%) | 6 (8.1%) |
| $75,000 to $99,999 | 52 (92.9%) | 4 (7.1%) |
| $100,000 and over | 214 (94.3%) | 13 (5.7%) |
Public vs Private Health Insurance Coverage by Age in Kelley
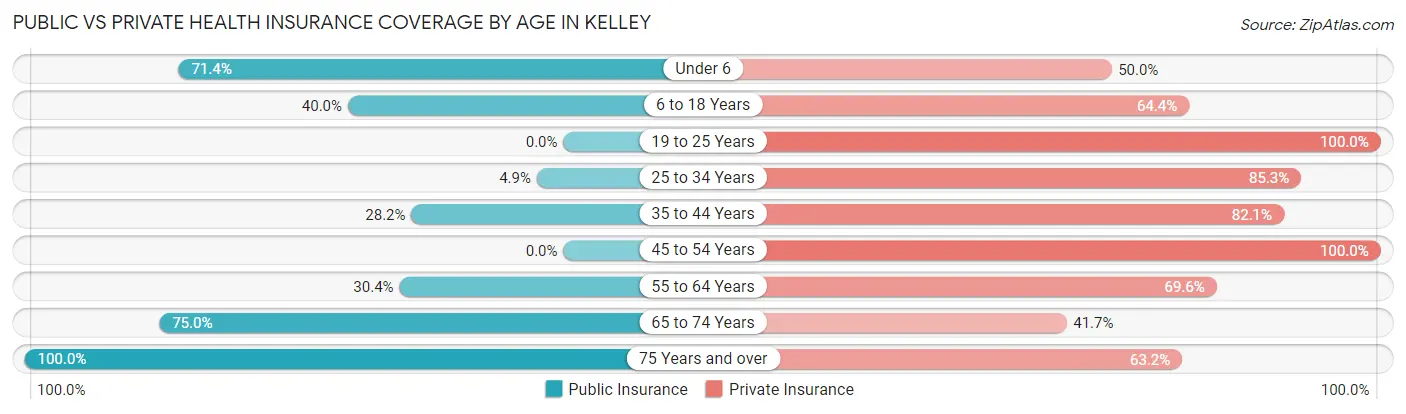
| Age Bracket | Public Insurance | Private Insurance |
| Under 6 | 10 (71.4%) | 7 (50.0%) |
| 6 to 18 Years | 18 (40.0%) | 29 (64.4%) |
| 19 to 25 Years | 0 (0.0%) | 18 (100.0%) |
| 25 to 34 Years | 9 (4.9%) | 156 (85.3%) |
| 35 to 44 Years | 11 (28.2%) | 32 (82.1%) |
| 45 to 54 Years | 0 (0.0%) | 25 (100.0%) |
| 55 to 64 Years | 14 (30.4%) | 32 (69.6%) |
| 65 to 74 Years | 9 (75.0%) | 5 (41.7%) |
| 75 Years and over | 19 (100.0%) | 12 (63.2%) |
| Total | 90 (22.4%) | 316 (78.8%) |
Disability Status by Sex by Age in Kelley
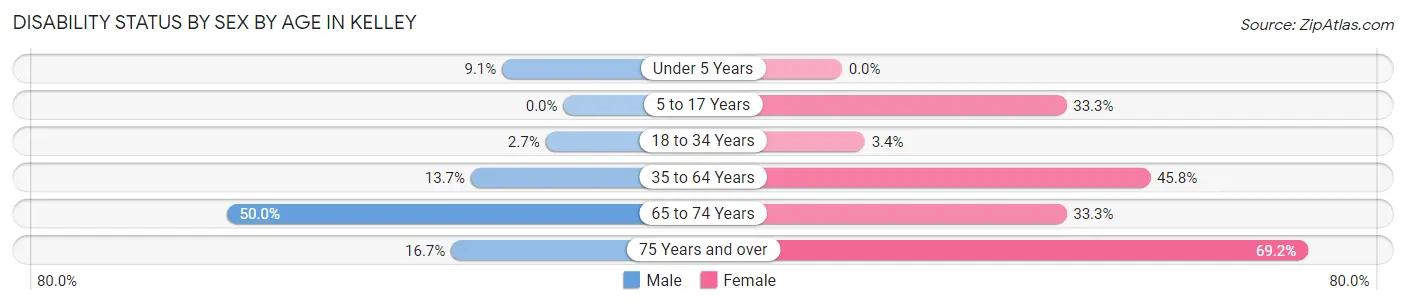
| Age Bracket | Male | Female |
| Under 5 Years | 1 (9.1%) | 0 (0.0%) |
| 5 to 17 Years | 0 (0.0%) | 2 (33.3%) |
| 18 to 34 Years | 3 (2.6%) | 3 (3.4%) |
| 35 to 64 Years | 7 (13.7%) | 27 (45.8%) |
| 65 to 74 Years | 3 (50.0%) | 2 (33.3%) |
| 75 Years and over | 1 (16.7%) | 9 (69.2%) |
Disability Class by Sex by Age in Kelley
Disability Class: Hearing Difficulty
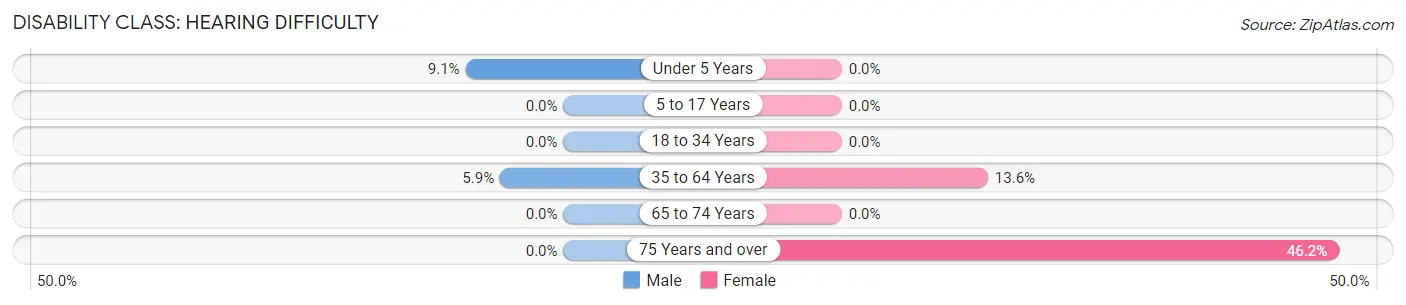
| Age Bracket | Male | Female |
| Under 5 Years | 1 (9.1%) | 0 (0.0%) |
| 5 to 17 Years | 0 (0.0%) | 0 (0.0%) |
| 18 to 34 Years | 0 (0.0%) | 0 (0.0%) |
| 35 to 64 Years | 3 (5.9%) | 8 (13.6%) |
| 65 to 74 Years | 0 (0.0%) | 0 (0.0%) |
| 75 Years and over | 0 (0.0%) | 6 (46.2%) |
Disability Class: Vision Difficulty
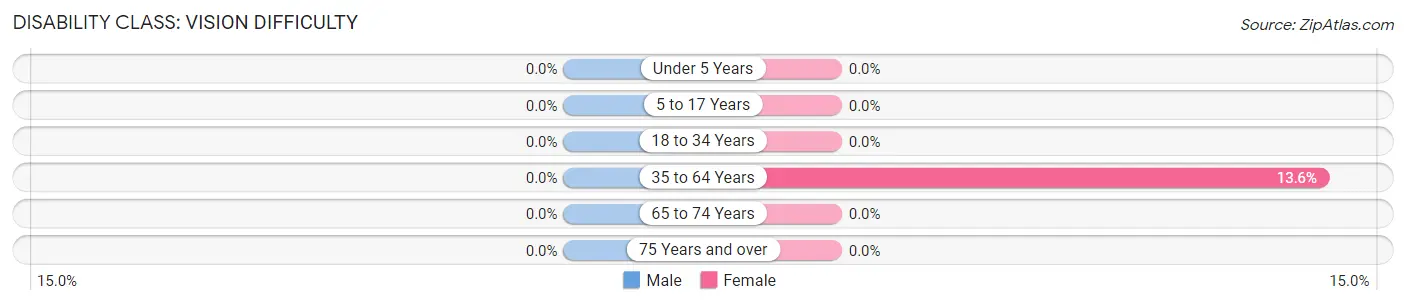
| Age Bracket | Male | Female |
| Under 5 Years | 0 (0.0%) | 0 (0.0%) |
| 5 to 17 Years | 0 (0.0%) | 0 (0.0%) |
| 18 to 34 Years | 0 (0.0%) | 0 (0.0%) |
| 35 to 64 Years | 0 (0.0%) | 8 (13.6%) |
| 65 to 74 Years | 0 (0.0%) | 0 (0.0%) |
| 75 Years and over | 0 (0.0%) | 0 (0.0%) |
Disability Class: Cognitive Difficulty
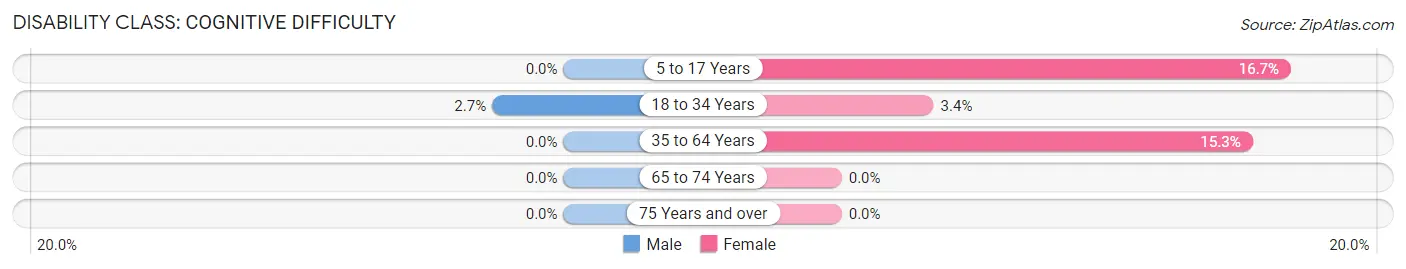
| Age Bracket | Male | Female |
| 5 to 17 Years | 0 (0.0%) | 1 (16.7%) |
| 18 to 34 Years | 3 (2.6%) | 3 (3.4%) |
| 35 to 64 Years | 0 (0.0%) | 9 (15.2%) |
| 65 to 74 Years | 0 (0.0%) | 0 (0.0%) |
| 75 Years and over | 0 (0.0%) | 0 (0.0%) |
Disability Class: Ambulatory Difficulty
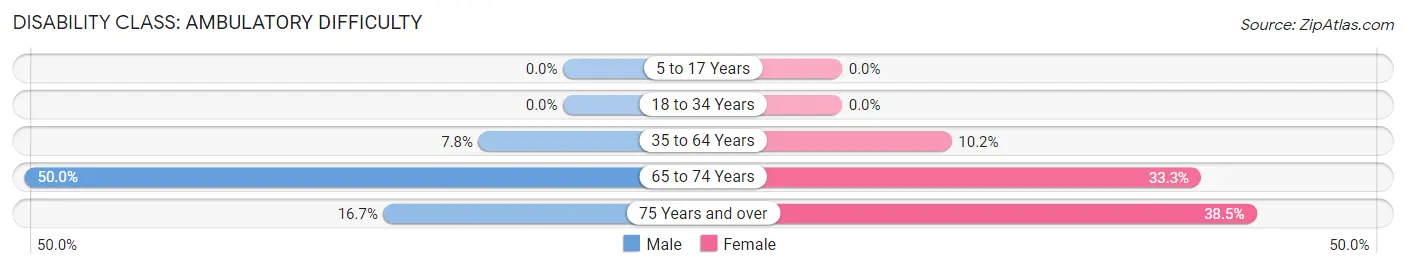
| Age Bracket | Male | Female |
| 5 to 17 Years | 0 (0.0%) | 0 (0.0%) |
| 18 to 34 Years | 0 (0.0%) | 0 (0.0%) |
| 35 to 64 Years | 4 (7.8%) | 6 (10.2%) |
| 65 to 74 Years | 3 (50.0%) | 2 (33.3%) |
| 75 Years and over | 1 (16.7%) | 5 (38.5%) |
Disability Class: Self-Care Difficulty
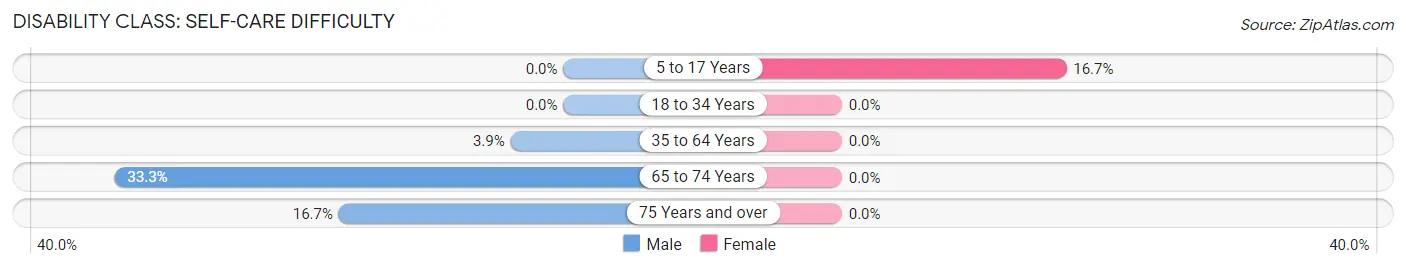
| Age Bracket | Male | Female |
| 5 to 17 Years | 0 (0.0%) | 1 (16.7%) |
| 18 to 34 Years | 0 (0.0%) | 0 (0.0%) |
| 35 to 64 Years | 2 (3.9%) | 0 (0.0%) |
| 65 to 74 Years | 2 (33.3%) | 0 (0.0%) |
| 75 Years and over | 1 (16.7%) | 0 (0.0%) |
Technology Access in Kelley
Computing Device Access in Kelley
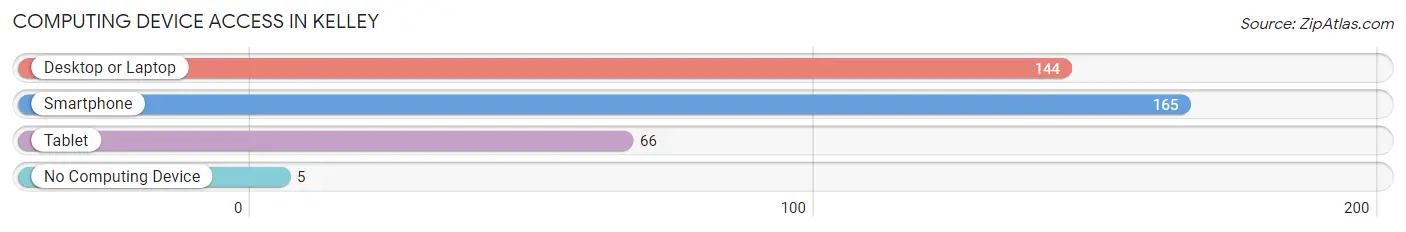
| Device Type | # Households | % Households |
| Desktop or Laptop | 144 | 84.2% |
| Smartphone | 165 | 96.5% |
| Tablet | 66 | 38.6% |
| No Computing Device | 5 | 2.9% |
| Total | 171 | 100.0% |
Internet Access in Kelley
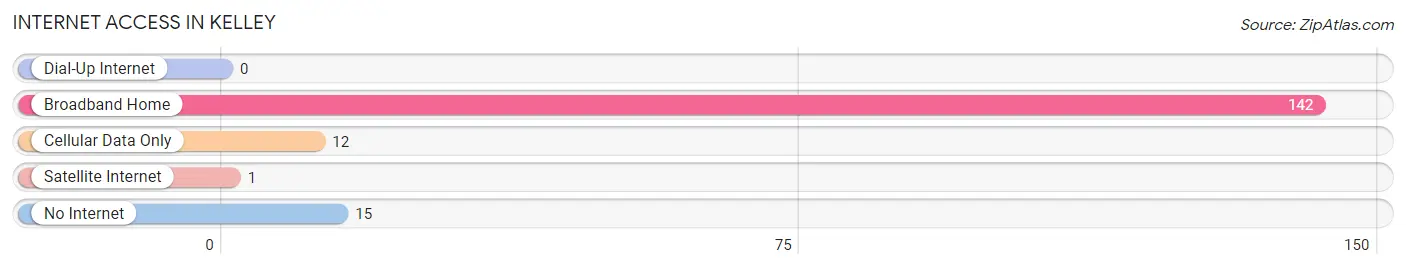
| Internet Type | # Households | % Households |
| Dial-Up Internet | 0 | 0.0% |
| Broadband Home | 142 | 83.0% |
| Cellular Data Only | 12 | 7.0% |
| Satellite Internet | 1 | 0.6% |
| No Internet | 15 | 8.8% |
| Total | 171 | 100.0% |
Kelley Summary
Kelley, Iowa is a small town located in Story County, Iowa. It is situated in the center of the state, approximately 30 miles north of Des Moines. The town was founded in 1881 and has a population of approximately 1,000 people.
Kelley is a rural community with a strong agricultural heritage. The town is surrounded by rolling hills and farmland, and is home to a variety of crops, including corn, soybeans, and hay. The town is also home to a number of small businesses, including a grocery store, a hardware store, and a few restaurants.
Kelley has a rich history that dates back to the early 1800s. The town was originally settled by a group of German immigrants who were looking for a place to call home. The town was named after a local farmer, John Kelley, who was one of the first settlers in the area.
Kelley has a strong sense of community and is home to a variety of organizations and events. The town hosts an annual Fourth of July celebration, as well as a variety of other events throughout the year. The town also has a number of churches, including the United Methodist Church, the Lutheran Church, and the Catholic Church.
Kelley is a great place to live and work. The town has a low cost of living and a variety of job opportunities. The town is also home to a number of schools, including Kelley Elementary School, Kelley Middle School, and Kelley High School.
Kelley is a great place to raise a family. The town has a variety of parks and recreational activities, including a swimming pool, a skate park, and a variety of sports fields. The town also has a number of churches and other organizations that provide a variety of activities for children and adults.
Kelley is a great place to visit. The town is home to a variety of attractions, including the Kelley Historical Museum, the Kelley Public Library, and the Kelley Arts Center. The town also has a variety of restaurants and shops, as well as a variety of outdoor activities.
Kelley is a great place to call home. The town has a strong sense of community and is home to a variety of organizations and events. The town also has a low cost of living and a variety of job opportunities. The town is also home to a number of schools, churches, and other organizations that provide a variety of activities for children and adults.
Common Questions
What is Per Capita Income in Kelley?
Per Capita income in Kelley is $46,229.
What is the Median Family Income in Kelley?
Median Family Income in Kelley is $87,917.
What is the Median Household income in Kelley?
Median Household Income in Kelley is $103,750.
What is Income or Wage Gap in Kelley?
Income or Wage Gap in Kelley is 5.3%.
Women in Kelley earn 94.7 cents for every dollar earned by a man.
What is Inequality or Gini Index in Kelley?
Inequality or Gini Index in Kelley is 0.32.
What is the Total Population of Kelley?
Total Population of Kelley is 401.
What is the Total Male Population of Kelley?
Total Male Population of Kelley is 229.
What is the Total Female Population of Kelley?
Total Female Population of Kelley is 172.
What is the Ratio of Males per 100 Females in Kelley?
There are 133.14 Males per 100 Females in Kelley.
What is the Ratio of Females per 100 Males in Kelley?
There are 75.11 Females per 100 Males in Kelley.
What is the Median Population Age in Kelley?
Median Population Age in Kelley is 32.5 Years.
What is the Average Family Size in Kelley
Average Family Size in Kelley is 2.8 People.
What is the Average Household Size in Kelley
Average Household Size in Kelley is 2.4 People.
How Large is the Labor Force in Kelley?
There are 290 People in the Labor Forcein in Kelley.
What is the Percentage of People in the Labor Force in Kelley?
83.1% of People are in the Labor Force in Kelley.
What is the Unemployment Rate in Kelley?
Unemployment Rate in Kelley is 1.4%.