Lawton, IA Map & Demographics
Lawton Map
Lawton Overview
$34,940
PER CAPITA INCOME
$113,021
AVG FAMILY INCOME
$86,607
AVG HOUSEHOLD INCOME
36.3%
WAGE / INCOME GAP [ % ]
63.7¢/ $1
WAGE / INCOME GAP [ $ ]
$9,307
FAMILY INCOME DEFICIT
0.36
INEQUALITY / GINI INDEX
1,021
TOTAL POPULATION
484
MALE POPULATION
537
FEMALE POPULATION
90.13
MALES / 100 FEMALES
110.95
FEMALES / 100 MALES
37.3
MEDIAN AGE
3.2
AVG FAMILY SIZE
2.7
AVG HOUSEHOLD SIZE
563
LABOR FORCE [ PEOPLE ]
72.5%
PERCENT IN LABOR FORCE
1.8%
UNEMPLOYMENT RATE
Lawton Zip Codes
Lawton Area Codes
Income in Lawton
Income Overview in Lawton
Per Capita Income in Lawton is $34,940, while median incomes of families and households are $113,021 and $86,607 respectively.
| Characteristic | Number | Measure |
| Per Capita Income | 1,021 | $34,940 |
| Median Family Income | 272 | $113,021 |
| Mean Family Income | 272 | $112,737 |
| Median Household Income | 378 | $86,607 |
| Mean Household Income | 378 | $94,694 |
| Income Deficit | 272 | $9,307 |
| Wage / Income Gap (%) | 1,021 | 36.28% |
| Wage / Income Gap ($) | 1,021 | 63.72¢ per $1 |
| Gini / Inequality Index | 1,021 | 0.36 |
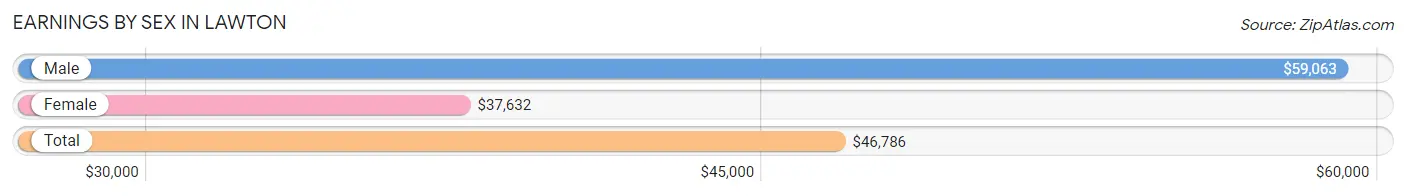
Earnings by Sex in Lawton
Average Earnings in Lawton are $46,786, $59,063 for men and $37,632 for women, a difference of 36.3%.
| Sex | Number | Average Earnings |
| Male | 262 (45.2%) | $59,063 |
| Female | 318 (54.8%) | $37,632 |
| Total | 580 (100.0%) | $46,786 |
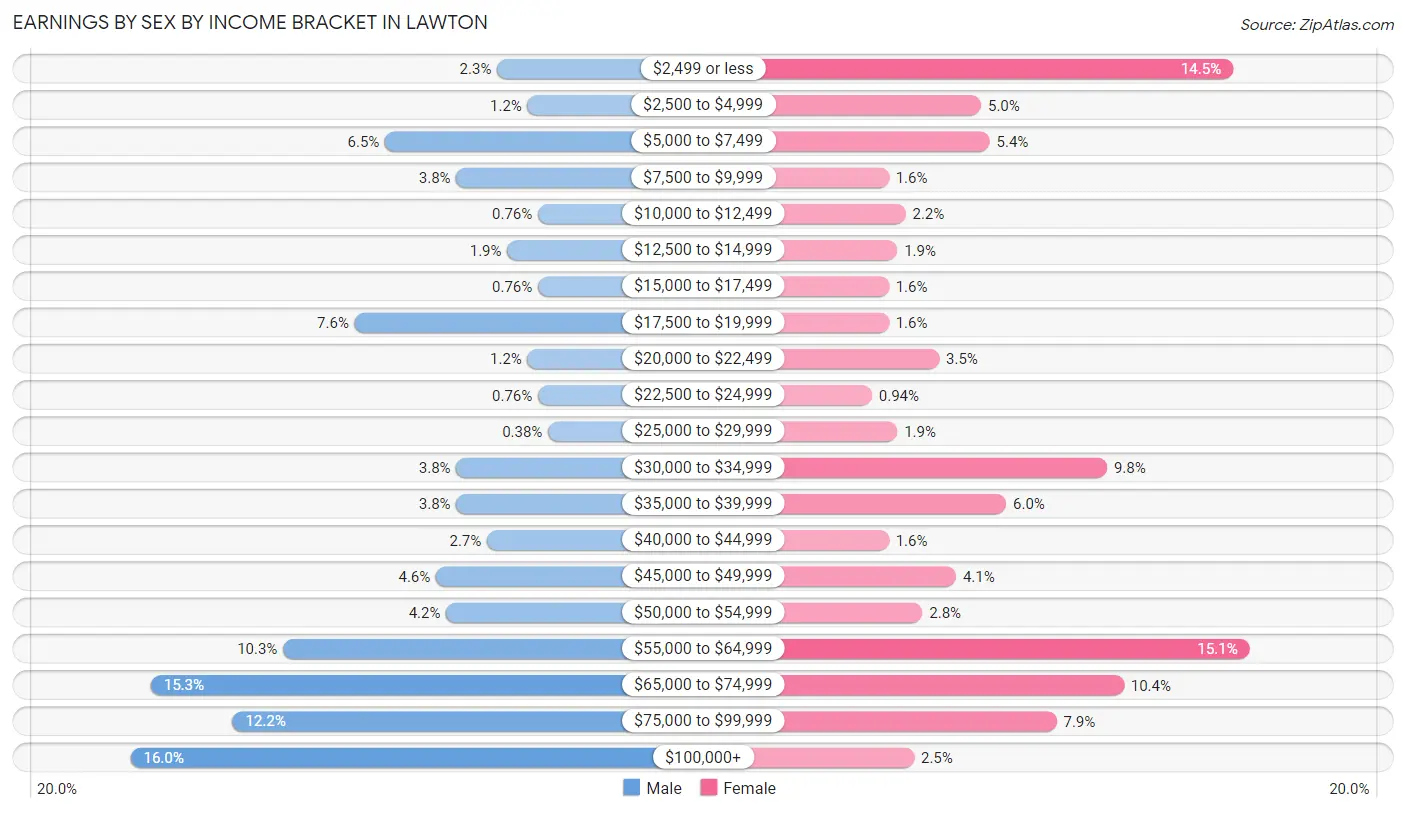
Earnings by Sex by Income Bracket in Lawton
The most common earnings brackets in Lawton are $100,000+ for men (42 | 16.0%) and $55,000 to $64,999 for women (48 | 15.1%).
| Income | Male | Female |
| $2,499 or less | 6 (2.3%) | 46 (14.5%) |
| $2,500 to $4,999 | 3 (1.1%) | 16 (5.0%) |
| $5,000 to $7,499 | 17 (6.5%) | 17 (5.3%) |
| $7,500 to $9,999 | 10 (3.8%) | 5 (1.6%) |
| $10,000 to $12,499 | 2 (0.8%) | 7 (2.2%) |
| $12,500 to $14,999 | 5 (1.9%) | 6 (1.9%) |
| $15,000 to $17,499 | 2 (0.8%) | 5 (1.6%) |
| $17,500 to $19,999 | 20 (7.6%) | 5 (1.6%) |
| $20,000 to $22,499 | 3 (1.1%) | 11 (3.5%) |
| $22,500 to $24,999 | 2 (0.8%) | 3 (0.9%) |
| $25,000 to $29,999 | 1 (0.4%) | 6 (1.9%) |
| $30,000 to $34,999 | 10 (3.8%) | 31 (9.8%) |
| $35,000 to $39,999 | 10 (3.8%) | 19 (6.0%) |
| $40,000 to $44,999 | 7 (2.7%) | 5 (1.6%) |
| $45,000 to $49,999 | 12 (4.6%) | 13 (4.1%) |
| $50,000 to $54,999 | 11 (4.2%) | 9 (2.8%) |
| $55,000 to $64,999 | 27 (10.3%) | 48 (15.1%) |
| $65,000 to $74,999 | 40 (15.3%) | 33 (10.4%) |
| $75,000 to $99,999 | 32 (12.2%) | 25 (7.9%) |
| $100,000+ | 42 (16.0%) | 8 (2.5%) |
| Total | 262 (100.0%) | 318 (100.0%) |
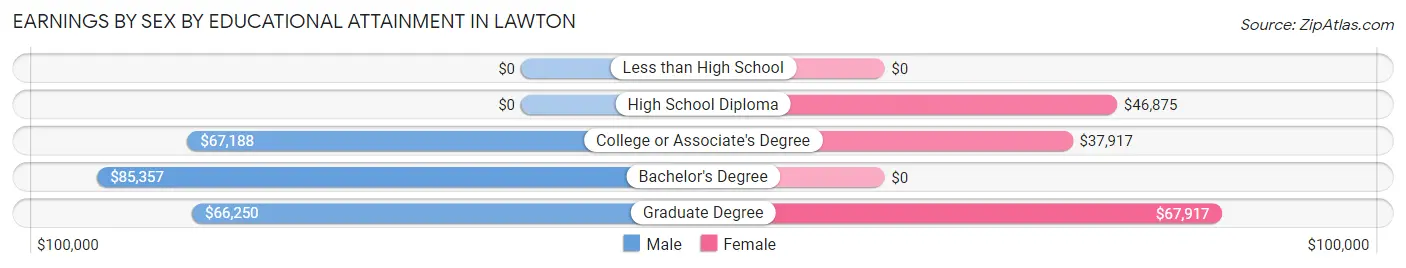
Earnings by Sex by Educational Attainment in Lawton
Average earnings in Lawton are $61,818 for men and $47,969 for women, a difference of 22.4%. Men with an educational attainment of bachelor's degree enjoy the highest average annual earnings of $85,357, while those with graduate degree education earn the least with $66,250. Women with an educational attainment of graduate degree earn the most with the average annual earnings of $67,917, while those with college or associate's degree education have the smallest earnings of $37,917.
| Educational Attainment | Male Income | Female Income |
| Less than High School | - | - |
| High School Diploma | - | - |
| College or Associate's Degree | $67,188 | $37,917 |
| Bachelor's Degree | $85,357 | $0 |
| Graduate Degree | $66,250 | $67,917 |
| Total | $61,818 | $47,969 |
Family Income in Lawton
Family Income Brackets in Lawton
According to the Lawton family income data, there are 101 families falling into the $100,000 to $149,999 income range, which is the most common income bracket and makes up 37.1% of all families.
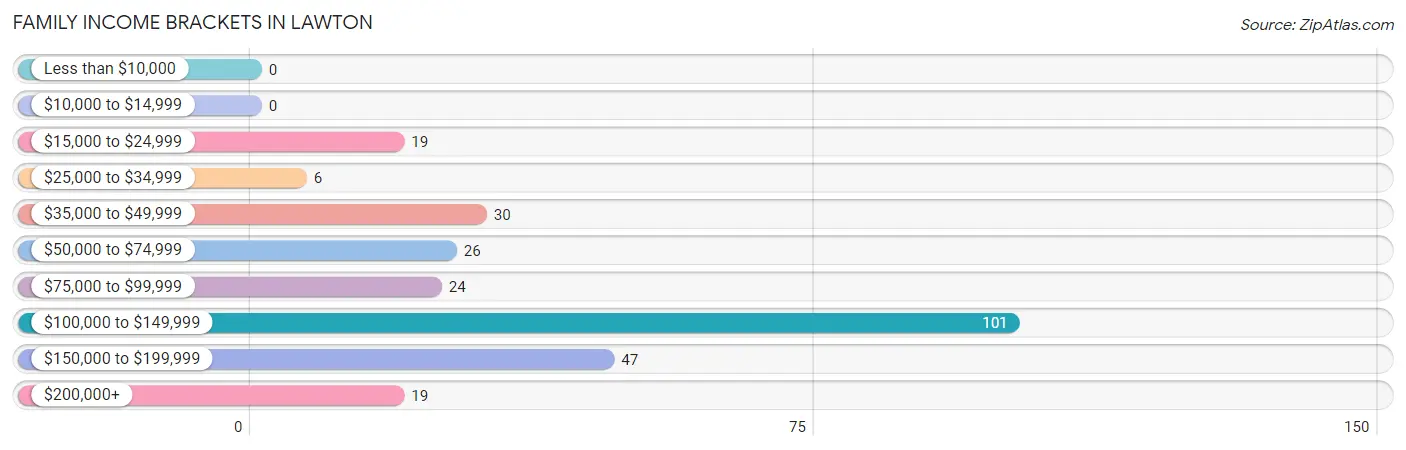
| Income Bracket | # Families | % Families |
| Less than $10,000 | 0 | 0.0% |
| $10,000 to $14,999 | 0 | 0.0% |
| $15,000 to $24,999 | 19 | 7.0% |
| $25,000 to $34,999 | 6 | 2.2% |
| $35,000 to $49,999 | 30 | 11.0% |
| $50,000 to $74,999 | 26 | 9.6% |
| $75,000 to $99,999 | 24 | 8.8% |
| $100,000 to $149,999 | 101 | 37.1% |
| $150,000 to $199,999 | 47 | 17.3% |
| $200,000+ | 19 | 7.0% |
Family Income by Famaliy Size in Lawton
3-person families (35 | 12.9%) account for the highest median family income in Lawton with $141,250 per family, while 2-person families (122 | 44.9%) have the highest median income of $53,750 per family member.
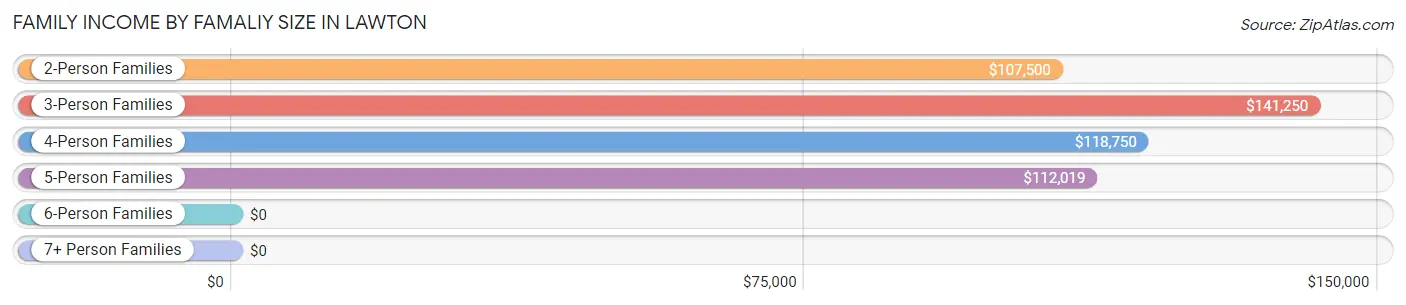
| Income Bracket | # Families | Median Income |
| 2-Person Families | 122 (44.9%) | $107,500 |
| 3-Person Families | 35 (12.9%) | $141,250 |
| 4-Person Families | 57 (21.0%) | $118,750 |
| 5-Person Families | 39 (14.3%) | $112,019 |
| 6-Person Families | 16 (5.9%) | $0 |
| 7+ Person Families | 3 (1.1%) | $0 |
| Total | 272 (100.0%) | $113,021 |
Family Income by Number of Earners in Lawton
The median family income in Lawton is $113,021, with families comprising 3+ earners (51) having the highest median family income of $180,179, while families with no earners (34) have the lowest median family income of $50,000, accounting for 18.8% and 12.5% of families, respectively.
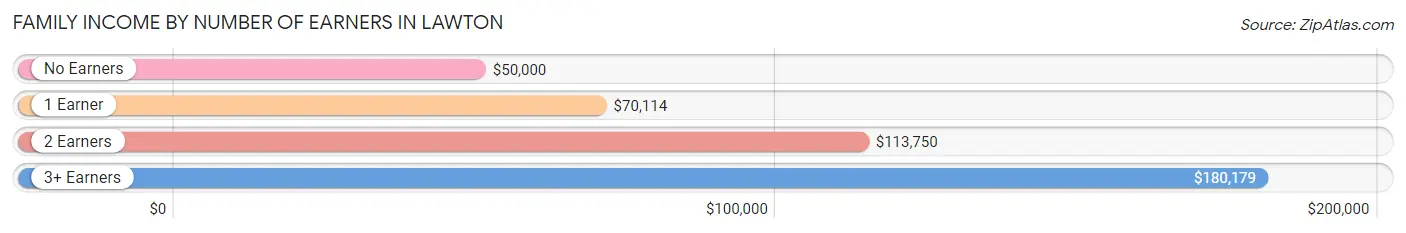
| Number of Earners | # Families | Median Income |
| No Earners | 34 (12.5%) | $50,000 |
| 1 Earner | 43 (15.8%) | $70,114 |
| 2 Earners | 144 (52.9%) | $113,750 |
| 3+ Earners | 51 (18.8%) | $180,179 |
| Total | 272 (100.0%) | $113,021 |
Household Income in Lawton
Household Income Brackets in Lawton
With 104 households falling in the category, the $100,000 to $149,999 income range is the most frequent in Lawton, accounting for 27.5% of all households.
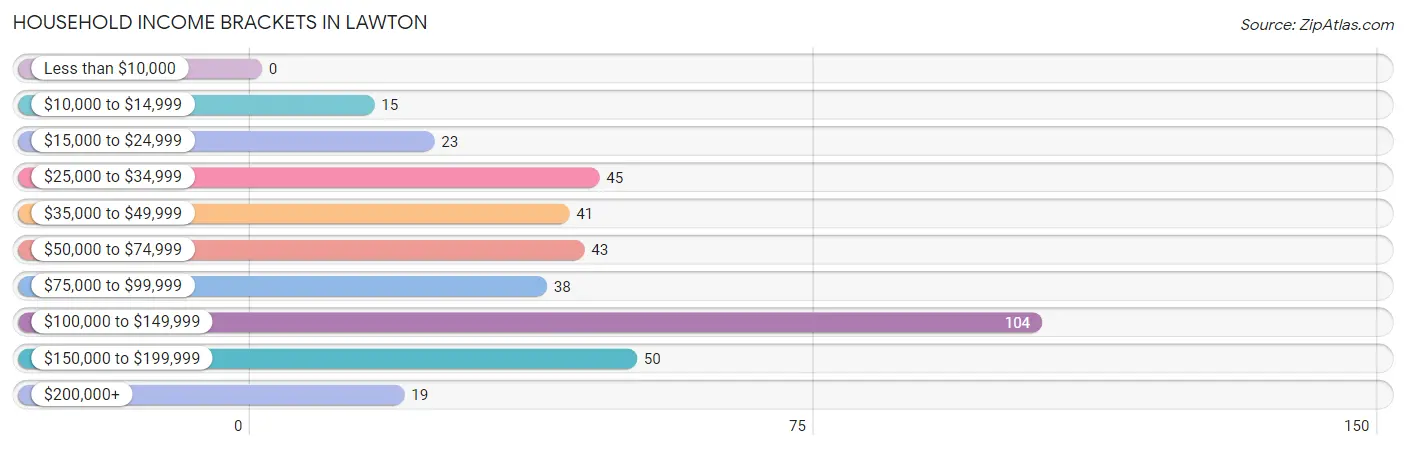
| Income Bracket | # Households | % Households |
| Less than $10,000 | 0 | 0.0% |
| $10,000 to $14,999 | 15 | 4.0% |
| $15,000 to $24,999 | 23 | 6.1% |
| $25,000 to $34,999 | 45 | 11.9% |
| $35,000 to $49,999 | 41 | 10.8% |
| $50,000 to $74,999 | 43 | 11.4% |
| $75,000 to $99,999 | 38 | 10.1% |
| $100,000 to $149,999 | 104 | 27.5% |
| $150,000 to $199,999 | 50 | 13.2% |
| $200,000+ | 19 | 5.0% |
Household Income by Householder Age in Lawton
The median household income in Lawton is $86,607, with the highest median household income of $111,833 found in the 25 to 44 years age bracket for the primary householder. A total of 142 households (37.6%) fall into this category. Meanwhile, the 15 to 24 years age bracket for the primary householder has the lowest median household income of $0, with 3 households (0.8%) in this group.
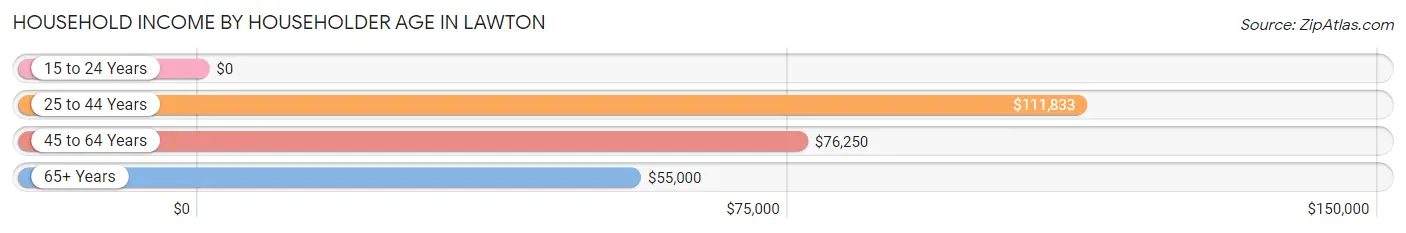
| Income Bracket | # Households | Median Income |
| 15 to 24 Years | 3 (0.8%) | $0 |
| 25 to 44 Years | 142 (37.6%) | $111,833 |
| 45 to 64 Years | 131 (34.7%) | $76,250 |
| 65+ Years | 102 (27.0%) | $55,000 |
| Total | 378 (100.0%) | $86,607 |
Poverty in Lawton
Income Below Poverty by Sex and Age in Lawton
With 9.1% poverty level for males and 6.9% for females among the residents of Lawton, 75 year old and over males and 18 to 24 year old females are the most vulnerable to poverty, with 7 males (25.9%) and 7 females (17.9%) in their respective age groups living below the poverty level.
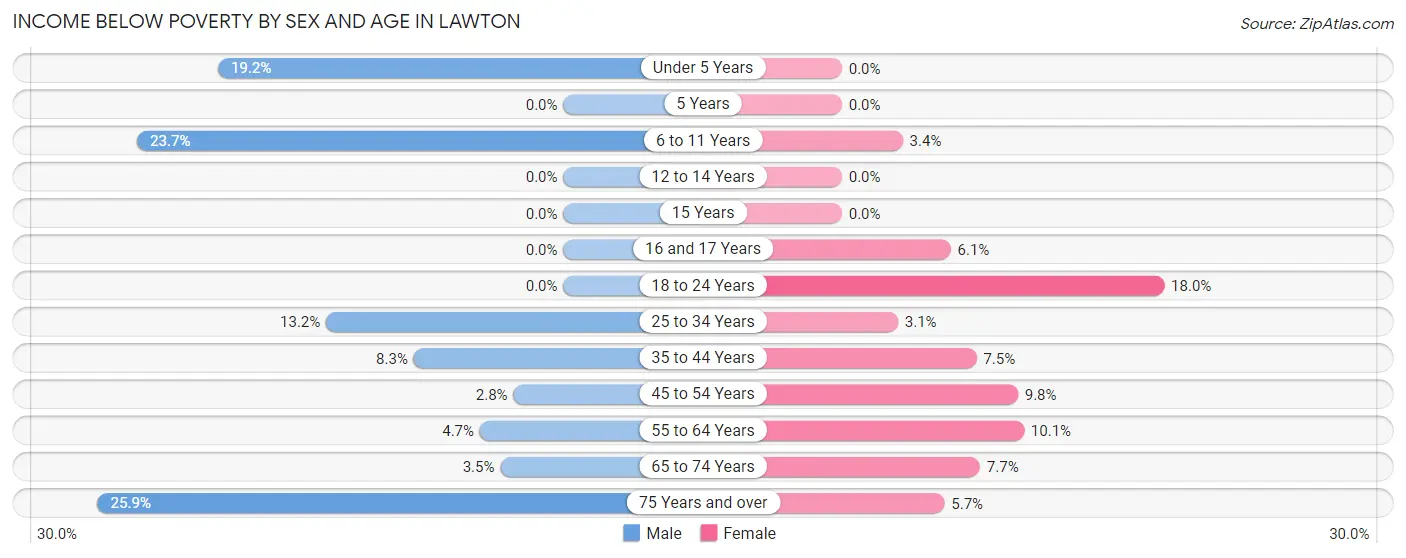
| Age Bracket | Male | Female |
| Under 5 Years | 5 (19.2%) | 0 (0.0%) |
| 5 Years | 0 (0.0%) | 0 (0.0%) |
| 6 to 11 Years | 14 (23.7%) | 2 (3.4%) |
| 12 to 14 Years | 0 (0.0%) | 0 (0.0%) |
| 15 Years | 0 (0.0%) | 0 (0.0%) |
| 16 and 17 Years | 0 (0.0%) | 2 (6.1%) |
| 18 to 24 Years | 0 (0.0%) | 7 (17.9%) |
| 25 to 34 Years | 7 (13.2%) | 2 (3.1%) |
| 35 to 44 Years | 5 (8.3%) | 6 (7.5%) |
| 45 to 54 Years | 2 (2.8%) | 5 (9.8%) |
| 55 to 64 Years | 2 (4.6%) | 7 (10.1%) |
| 65 to 74 Years | 2 (3.5%) | 4 (7.7%) |
| 75 Years and over | 7 (25.9%) | 2 (5.7%) |
| Total | 44 (9.1%) | 37 (6.9%) |
Income Above Poverty by Sex and Age in Lawton
According to the poverty statistics in Lawton, males aged 5 years and females aged under 5 years are the age groups that are most secure financially, with 100.0% of males and 100.0% of females in these age groups living above the poverty line.
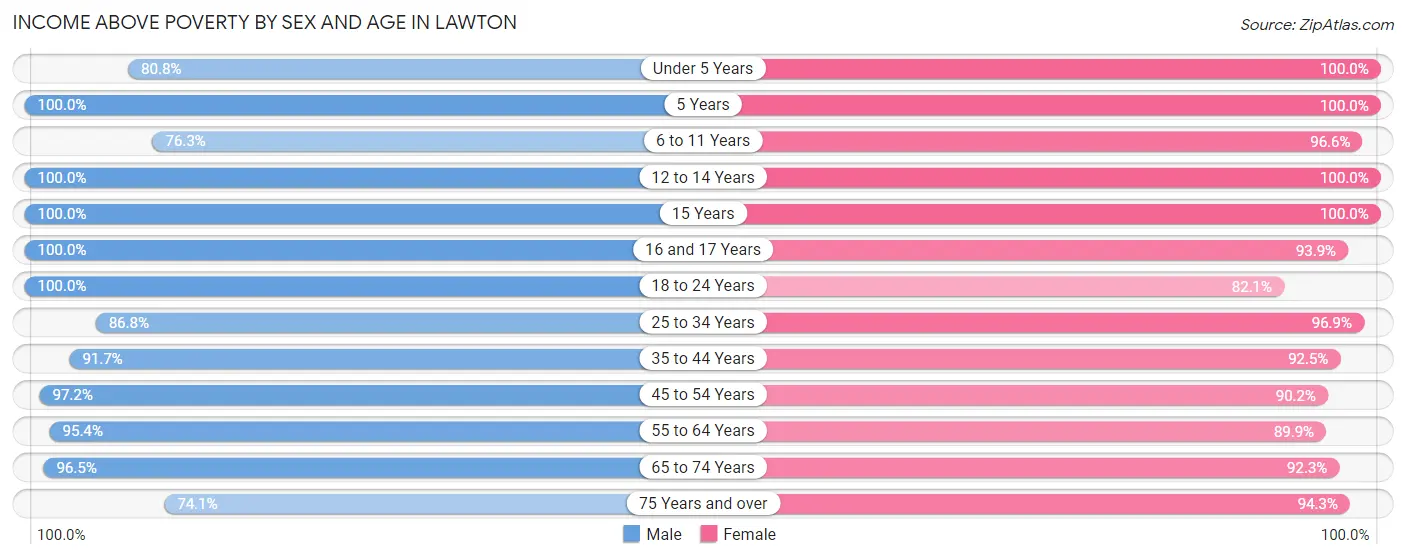
| Age Bracket | Male | Female |
| Under 5 Years | 21 (80.8%) | 17 (100.0%) |
| 5 Years | 11 (100.0%) | 12 (100.0%) |
| 6 to 11 Years | 45 (76.3%) | 57 (96.6%) |
| 12 to 14 Years | 20 (100.0%) | 25 (100.0%) |
| 15 Years | 14 (100.0%) | 1 (100.0%) |
| 16 and 17 Years | 17 (100.0%) | 31 (93.9%) |
| 18 to 24 Years | 25 (100.0%) | 32 (82.1%) |
| 25 to 34 Years | 46 (86.8%) | 62 (96.9%) |
| 35 to 44 Years | 55 (91.7%) | 74 (92.5%) |
| 45 to 54 Years | 70 (97.2%) | 46 (90.2%) |
| 55 to 64 Years | 41 (95.4%) | 62 (89.9%) |
| 65 to 74 Years | 55 (96.5%) | 48 (92.3%) |
| 75 Years and over | 20 (74.1%) | 33 (94.3%) |
| Total | 440 (90.9%) | 500 (93.1%) |
Income Below Poverty Among Married-Couple Families in Lawton
The poverty statistics for married-couple families in Lawton show that 5.6% or 14 of the total 251 families live below the poverty line. Families with 3 or 4 children have the highest poverty rate of 18.6%, comprising of 8 families. On the other hand, families with 1 or 2 children have the lowest poverty rate of 0.0%, which includes 0 families.
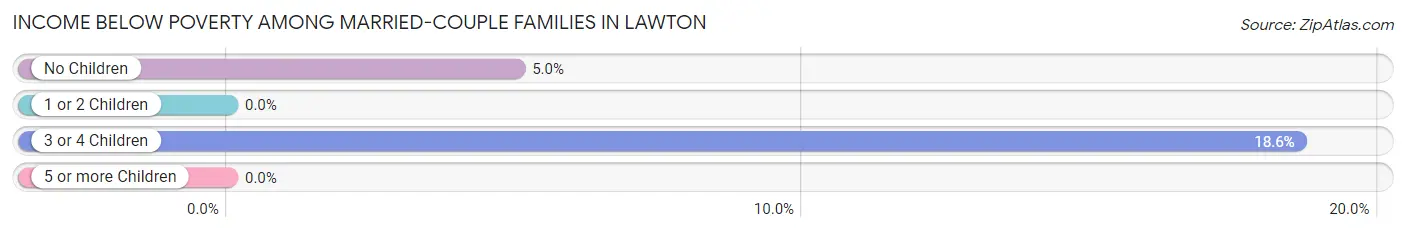
| Children | Above Poverty | Below Poverty |
| No Children | 114 (95.0%) | 6 (5.0%) |
| 1 or 2 Children | 85 (100.0%) | 0 (0.0%) |
| 3 or 4 Children | 35 (81.4%) | 8 (18.6%) |
| 5 or more Children | 3 (100.0%) | 0 (0.0%) |
| Total | 237 (94.4%) | 14 (5.6%) |
Income Below Poverty Among Single-Parent Households in Lawton
| Children | Single Father | Single Mother |
| No Children | 0 (0.0%) | 0 (0.0%) |
| 1 or 2 Children | 0 (0.0%) | 0 (0.0%) |
| 3 or 4 Children | 0 (0.0%) | 0 (0.0%) |
| 5 or more Children | 0 (0.0%) | 0 (0.0%) |
| Total | 0 (0.0%) | 0 (0.0%) |
Income Below Poverty Among Married-Couple vs Single-Parent Households in Lawton
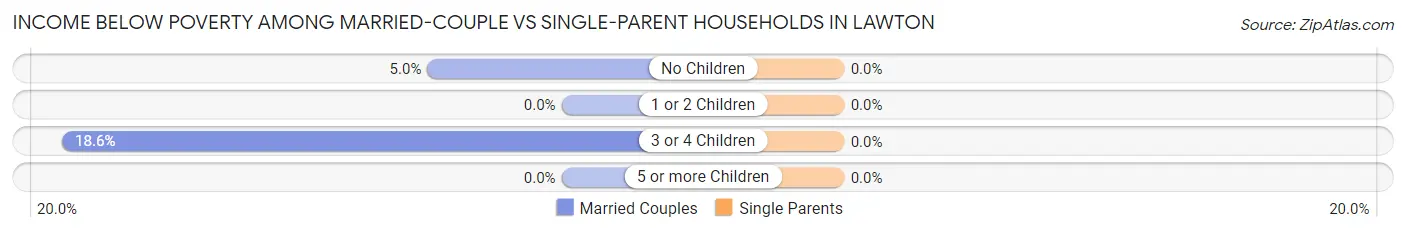
| Children | Married-Couple Families | Single-Parent Households |
| No Children | 6 (5.0%) | 0 (0.0%) |
| 1 or 2 Children | 0 (0.0%) | 0 (0.0%) |
| 3 or 4 Children | 8 (18.6%) | 0 (0.0%) |
| 5 or more Children | 0 (0.0%) | 0 (0.0%) |
| Total | 14 (5.6%) | 0 (0.0%) |
Race in Lawton
The most populous races in Lawton are White / Caucasian (1,001 | 98.0%), Hispanic or Latino (20 | 2.0%), and Two or more Races (9 | 0.9%).
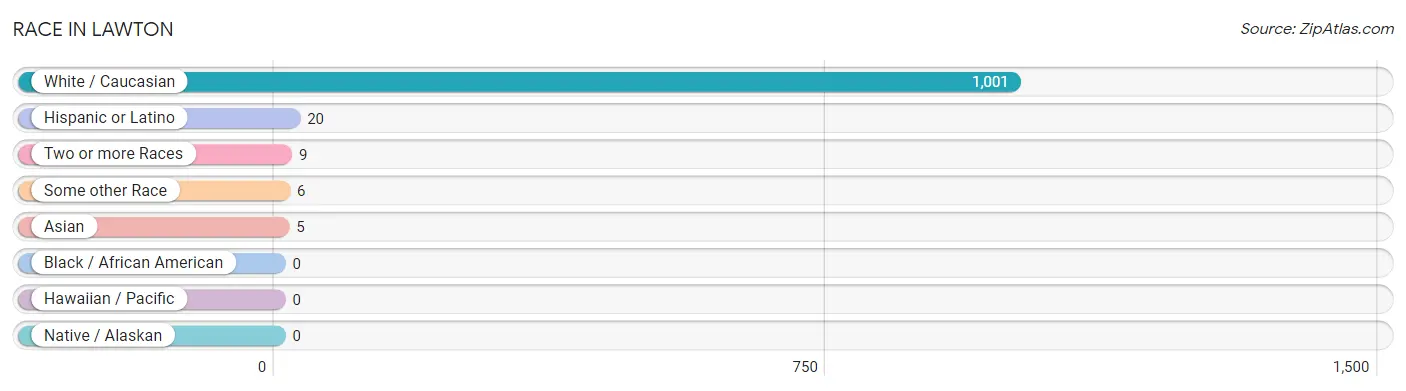
| Race | # Population | % Population |
| Asian | 5 | 0.5% |
| Black / African American | 0 | 0.0% |
| Hawaiian / Pacific | 0 | 0.0% |
| Hispanic or Latino | 20 | 2.0% |
| Native / Alaskan | 0 | 0.0% |
| White / Caucasian | 1,001 | 98.0% |
| Two or more Races | 9 | 0.9% |
| Some other Race | 6 | 0.6% |
| Total | 1,021 | 100.0% |
Ancestry in Lawton
The most populous ancestries reported in Lawton are German (438 | 42.9%), Irish (116 | 11.4%), English (92 | 9.0%), Swedish (50 | 4.9%), and American (49 | 4.8%), together accounting for 73.0% of all Lawton residents.
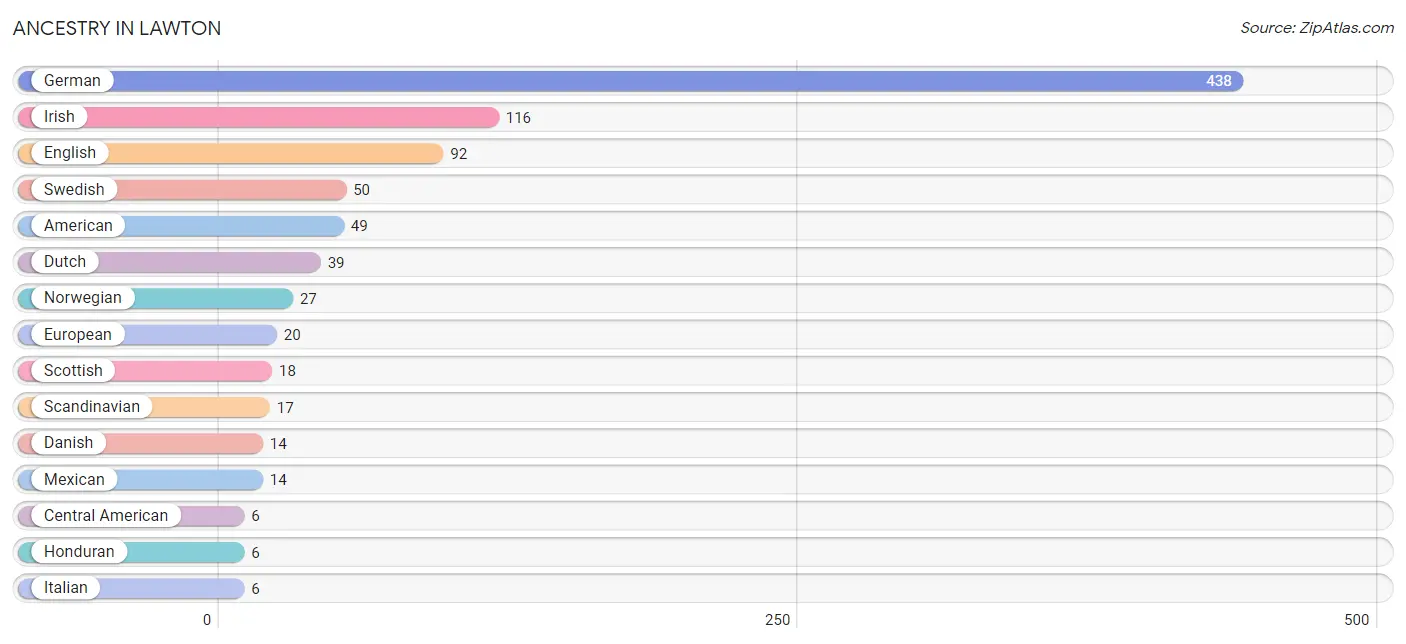
| Ancestry | # Population | % Population |
| American | 49 | 4.8% |
| Burmese | 3 | 0.3% |
| Central American | 6 | 0.6% |
| Chickasaw | 2 | 0.2% |
| Czech | 2 | 0.2% |
| Danish | 14 | 1.4% |
| Dutch | 39 | 3.8% |
| English | 92 | 9.0% |
| European | 20 | 2.0% |
| French | 5 | 0.5% |
| French Canadian | 2 | 0.2% |
| German | 438 | 42.9% |
| Honduran | 6 | 0.6% |
| Hungarian | 3 | 0.3% |
| Irish | 116 | 11.4% |
| Italian | 6 | 0.6% |
| Lithuanian | 2 | 0.2% |
| Luxembourger | 3 | 0.3% |
| Mexican | 14 | 1.4% |
| Northern European | 5 | 0.5% |
| Norwegian | 27 | 2.6% |
| Polish | 4 | 0.4% |
| Scandinavian | 17 | 1.7% |
| Scotch-Irish | 2 | 0.2% |
| Scottish | 18 | 1.8% |
| Sioux | 2 | 0.2% |
| Swedish | 50 | 4.9% |
| Vietnamese | 2 | 0.2% |
| Welsh | 2 | 0.2% | View All 29 Rows |
Immigrants in Lawton
The most numerous immigrant groups reported in Lawton came from Asia (5 | 0.5%), Eastern Asia (3 | 0.3%), Korea (3 | 0.3%), Bangladesh (2 | 0.2%), and Europe (2 | 0.2%), together accounting for 1.5% of all Lawton residents.
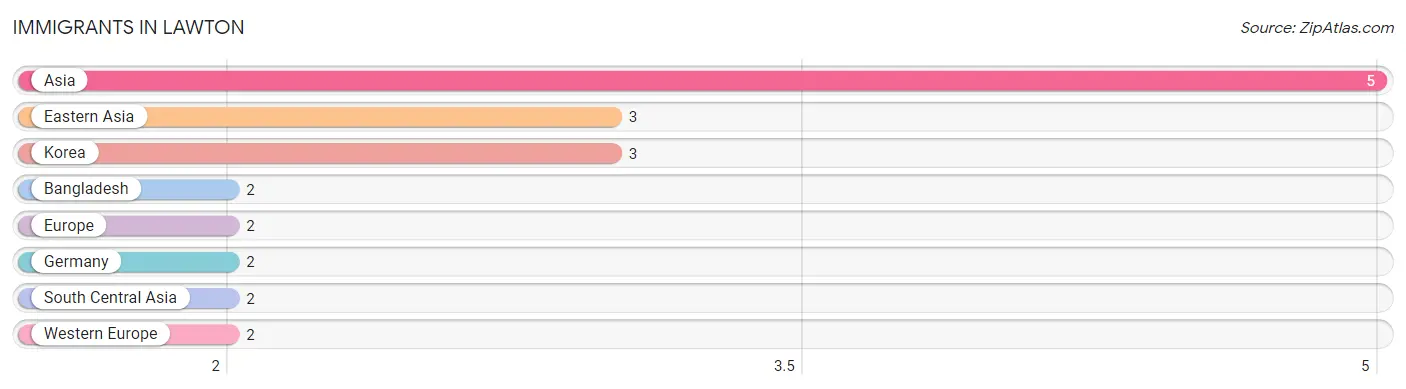
| Immigration Origin | # Population | % Population |
| Asia | 5 | 0.5% |
| Bangladesh | 2 | 0.2% |
| Eastern Asia | 3 | 0.3% |
| Europe | 2 | 0.2% |
| Germany | 2 | 0.2% |
| Korea | 3 | 0.3% |
| South Central Asia | 2 | 0.2% |
| Western Europe | 2 | 0.2% | View All 8 Rows |
Sex and Age in Lawton
Sex and Age in Lawton
The most populous age groups in Lawton are 5 to 9 Years (48 | 9.9%) for men and 10 to 14 Years (51 | 9.5%) for women.
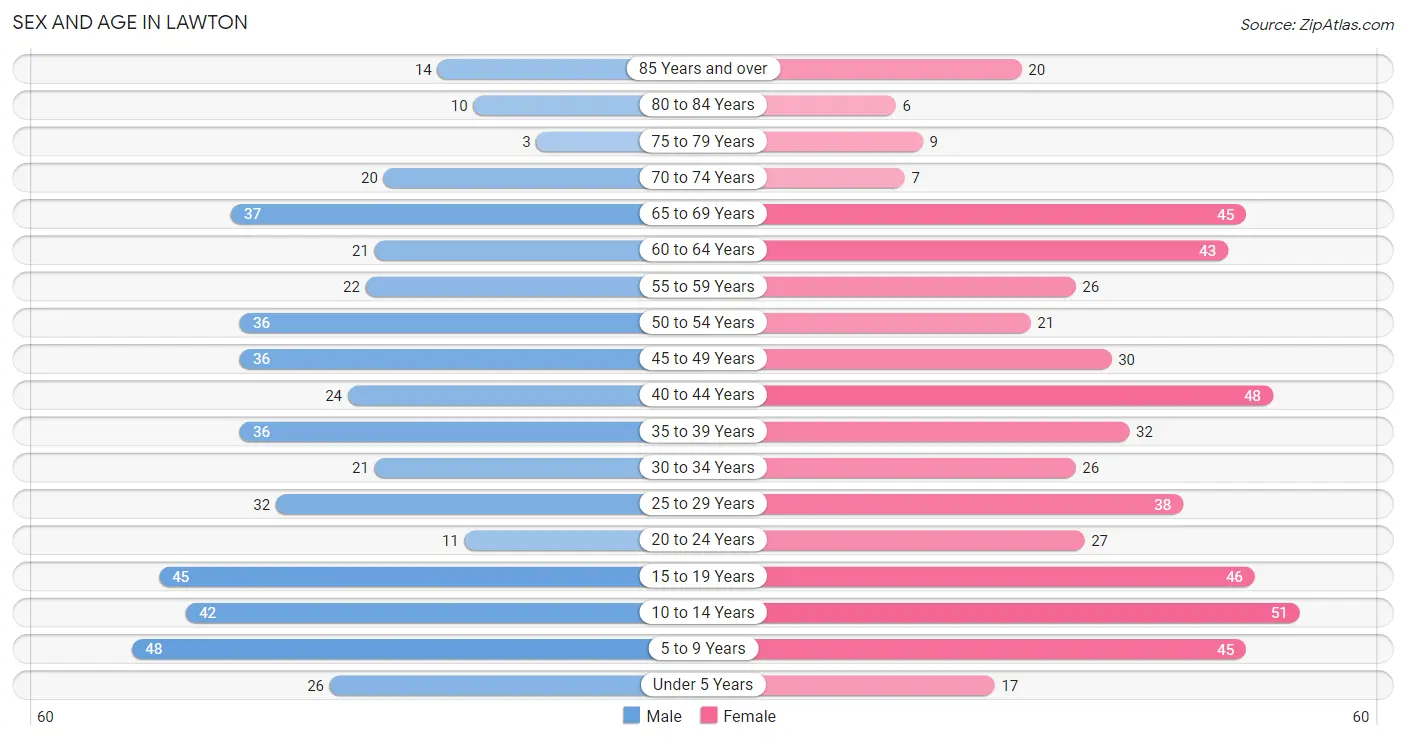
| Age Bracket | Male | Female |
| Under 5 Years | 26 (5.4%) | 17 (3.2%) |
| 5 to 9 Years | 48 (9.9%) | 45 (8.4%) |
| 10 to 14 Years | 42 (8.7%) | 51 (9.5%) |
| 15 to 19 Years | 45 (9.3%) | 46 (8.6%) |
| 20 to 24 Years | 11 (2.3%) | 27 (5.0%) |
| 25 to 29 Years | 32 (6.6%) | 38 (7.1%) |
| 30 to 34 Years | 21 (4.3%) | 26 (4.8%) |
| 35 to 39 Years | 36 (7.4%) | 32 (6.0%) |
| 40 to 44 Years | 24 (5.0%) | 48 (8.9%) |
| 45 to 49 Years | 36 (7.4%) | 30 (5.6%) |
| 50 to 54 Years | 36 (7.4%) | 21 (3.9%) |
| 55 to 59 Years | 22 (4.5%) | 26 (4.8%) |
| 60 to 64 Years | 21 (4.3%) | 43 (8.0%) |
| 65 to 69 Years | 37 (7.6%) | 45 (8.4%) |
| 70 to 74 Years | 20 (4.1%) | 7 (1.3%) |
| 75 to 79 Years | 3 (0.6%) | 9 (1.7%) |
| 80 to 84 Years | 10 (2.1%) | 6 (1.1%) |
| 85 Years and over | 14 (2.9%) | 20 (3.7%) |
| Total | 484 (100.0%) | 537 (100.0%) |
Families and Households in Lawton
Median Family Size in Lawton
The median family size in Lawton is 3.25 persons per family, with married-couple families (251 | 92.3%) accounting for the largest median family size of 3.29 persons per family. On the other hand, single female/mother families (14 | 5.1%) represent the smallest median family size with 2.57 persons per family.
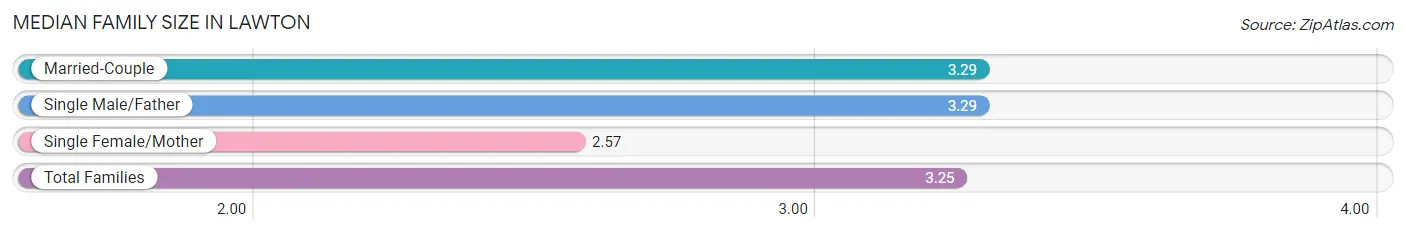
| Family Type | # Families | Family Size |
| Married-Couple | 251 (92.3%) | 3.29 |
| Single Male/Father | 7 (2.6%) | 3.29 |
| Single Female/Mother | 14 (5.1%) | 2.57 |
| Total Families | 272 (100.0%) | 3.25 |
Median Household Size in Lawton
The median household size in Lawton is 2.69 persons per household, with single male/father households (7 | 1.8%) accounting for the largest median household size of 4.43 persons per household. non-family households (106 | 28.0%) represent the smallest median household size with 1.10 persons per household.
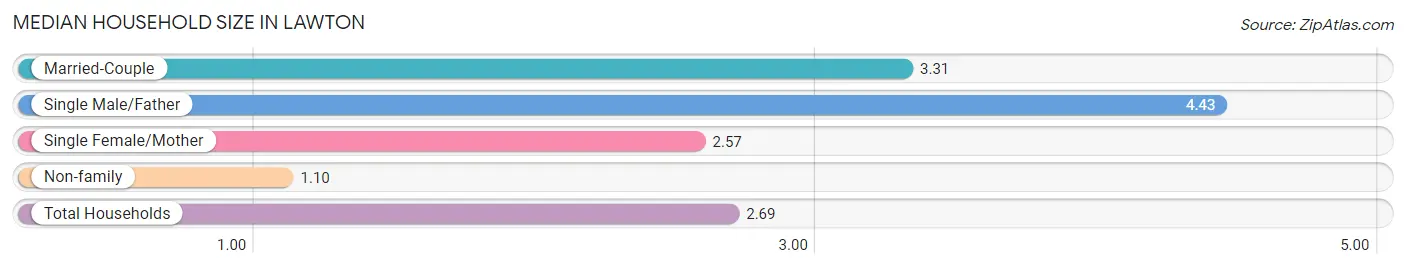
| Household Type | # Households | Household Size |
| Married-Couple | 251 (66.4%) | 3.31 |
| Single Male/Father | 7 (1.8%) | 4.43 |
| Single Female/Mother | 14 (3.7%) | 2.57 |
| Non-family | 106 (28.0%) | 1.10 |
| Total Households | 378 (100.0%) | 2.69 |
Household Size by Marriage Status in Lawton
Out of a total of 378 households in Lawton, 272 (72.0%) are family households, while 106 (28.0%) are nonfamily households. The most numerous type of family households are 2-person households, comprising 115, and the most common type of nonfamily households are 1-person households, comprising 94.
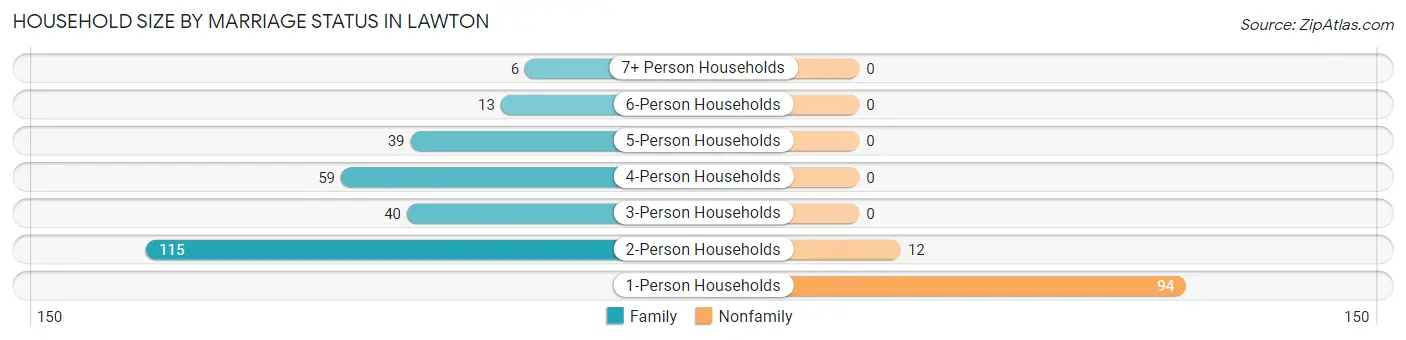
| Household Size | Family Households | Nonfamily Households |
| 1-Person Households | - | 94 (24.9%) |
| 2-Person Households | 115 (30.4%) | 12 (3.2%) |
| 3-Person Households | 40 (10.6%) | 0 (0.0%) |
| 4-Person Households | 59 (15.6%) | 0 (0.0%) |
| 5-Person Households | 39 (10.3%) | 0 (0.0%) |
| 6-Person Households | 13 (3.4%) | 0 (0.0%) |
| 7+ Person Households | 6 (1.6%) | 0 (0.0%) |
| Total | 272 (72.0%) | 106 (28.0%) |
Female Fertility in Lawton
Fertility by Age in Lawton
Average fertility rate in Lawton is 51.0 births per 1,000 women. Women in the age bracket of 20 to 34 years have the highest fertility rate with 77.0 births per 1,000 women. Women in the age bracket of 20 to 34 years acount for 53.8% of all women with births.
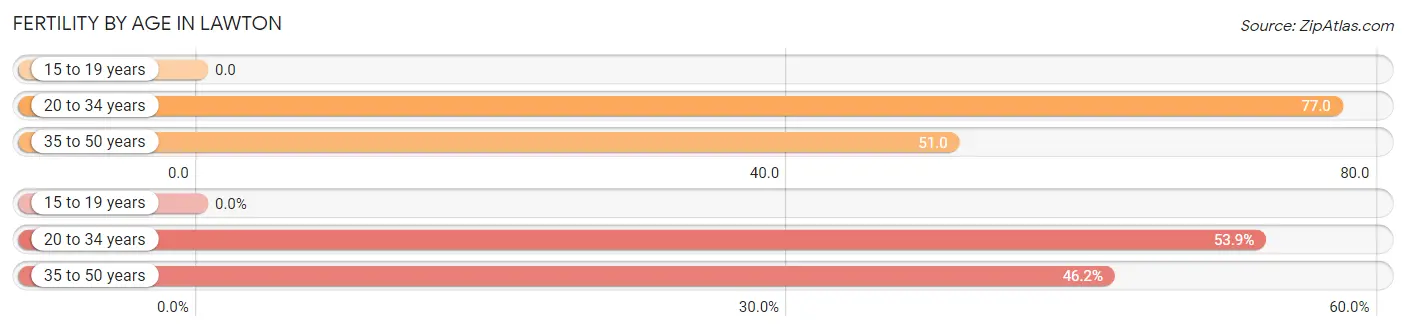
| Age Bracket | Women with Births | Births / 1,000 Women |
| 15 to 19 years | 0 (0.0%) | 0.0 |
| 20 to 34 years | 7 (53.8%) | 77.0 |
| 35 to 50 years | 6 (46.2%) | 51.0 |
| Total | 13 (100.0%) | 51.0 |
Fertility by Age by Marriage Status in Lawton
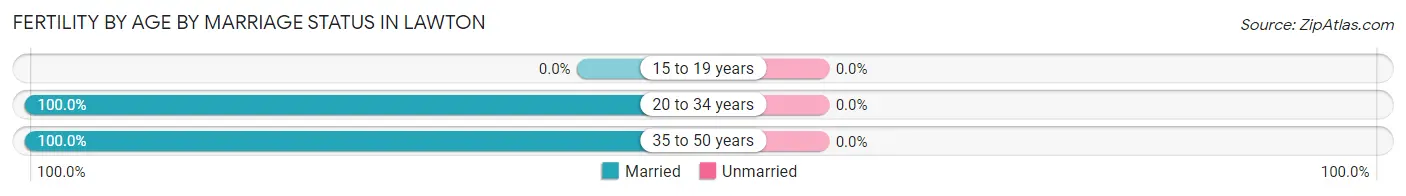
| Age Bracket | Married | Unmarried |
| 15 to 19 years | 0 (0.0%) | 0 (0.0%) |
| 20 to 34 years | 7 (100.0%) | 0 (0.0%) |
| 35 to 50 years | 6 (100.0%) | 0 (0.0%) |
| Total | 13 (100.0%) | 0 (0.0%) |
Fertility by Education in Lawton
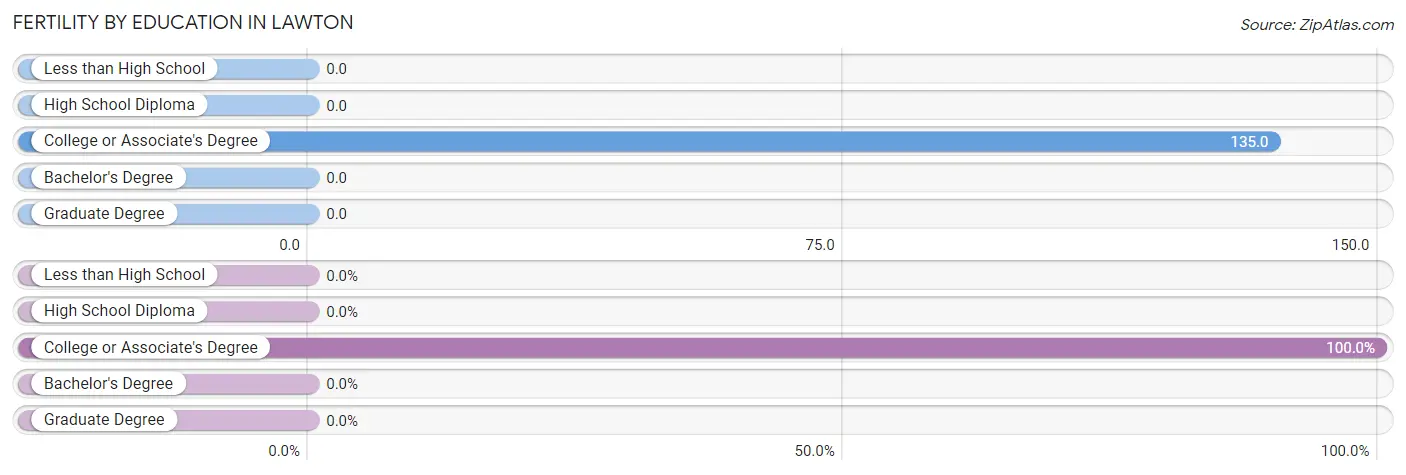
| Educational Attainment | Women with Births | Births / 1,000 Women |
| Less than High School | 0 (0.0%) | 0.0 |
| High School Diploma | 0 (0.0%) | 0.0 |
| College or Associate's Degree | 13 (100.0%) | 135.0 |
| Bachelor's Degree | 0 (0.0%) | 0.0 |
| Graduate Degree | 0 (0.0%) | 0.0 |
| Total | 13 (100.0%) | 51.0 |
Fertility by Education by Marriage Status in Lawton
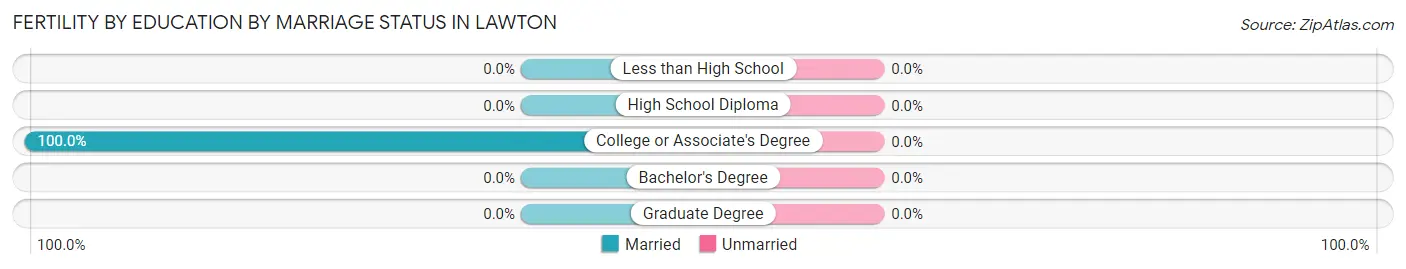
| Educational Attainment | Married | Unmarried |
| Less than High School | 0 (0.0%) | 0 (0.0%) |
| High School Diploma | 0 (0.0%) | 0 (0.0%) |
| College or Associate's Degree | 13 (100.0%) | 0 (0.0%) |
| Bachelor's Degree | 0 (0.0%) | 0 (0.0%) |
| Graduate Degree | 0 (0.0%) | 0 (0.0%) |
| Total | 13 (100.0%) | 0 (0.0%) |
Employment Characteristics in Lawton
Employment by Class of Employer in Lawton
Among the 549 employed individuals in Lawton, private company employees (375 | 68.3%), local government employees (84 | 15.3%), and not-for-profit organizations (31 | 5.7%) make up the most common classes of employment.
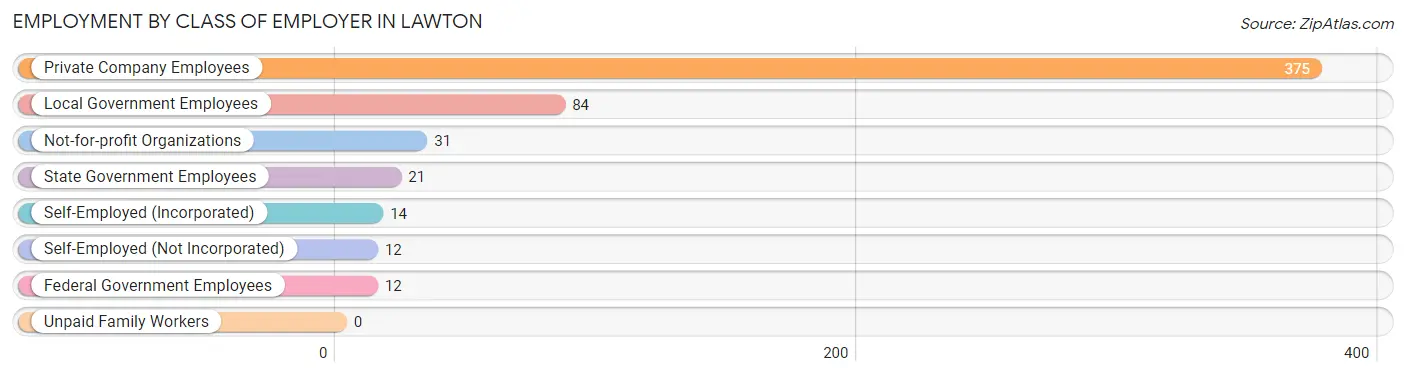
| Employer Class | # Employees | % Employees |
| Private Company Employees | 375 | 68.3% |
| Self-Employed (Incorporated) | 14 | 2.5% |
| Self-Employed (Not Incorporated) | 12 | 2.2% |
| Not-for-profit Organizations | 31 | 5.7% |
| Local Government Employees | 84 | 15.3% |
| State Government Employees | 21 | 3.8% |
| Federal Government Employees | 12 | 2.2% |
| Unpaid Family Workers | 0 | 0.0% |
| Total | 549 | 100.0% |
Employment Status by Age in Lawton
According to the labor force statistics for Lawton, out of the total population over 16 years of age (777), 72.5% or 563 individuals are in the labor force, with 1.8% or 10 of them unemployed. The age group with the highest labor force participation rate is 25 to 29 years, with 97.1% or 68 individuals in the labor force. Within the labor force, the 20 to 24 years age range has the highest percentage of unemployed individuals, with 17.1% or 6 of them being unemployed.
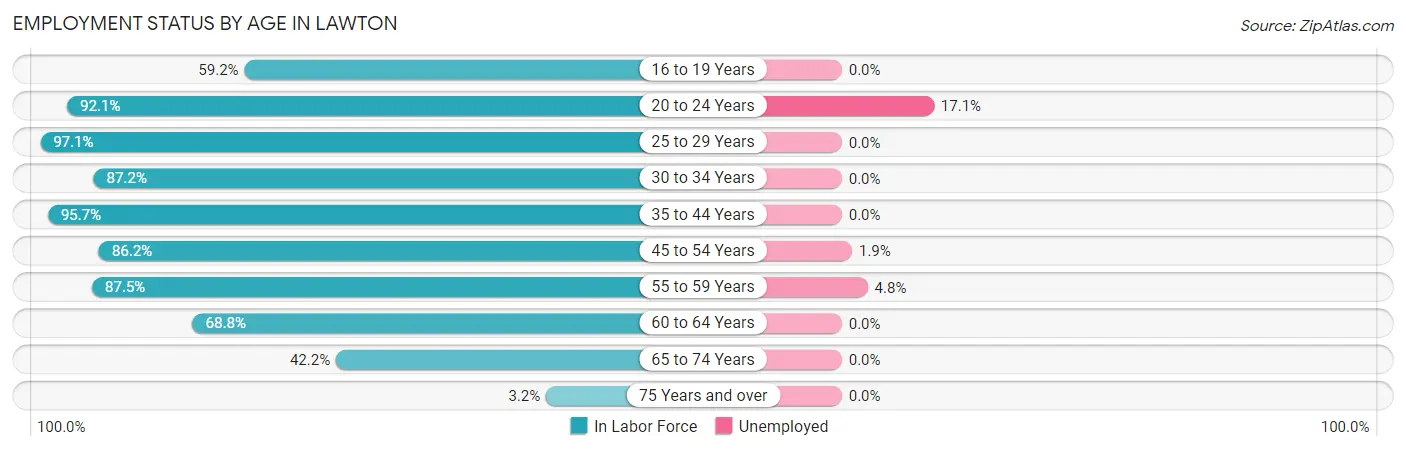
| Age Bracket | In Labor Force | Unemployed |
| 16 to 19 Years | 45 (59.2%) | 0 (0.0%) |
| 20 to 24 Years | 35 (92.1%) | 6 (17.1%) |
| 25 to 29 Years | 68 (97.1%) | 0 (0.0%) |
| 30 to 34 Years | 41 (87.2%) | 0 (0.0%) |
| 35 to 44 Years | 134 (95.7%) | 0 (0.0%) |
| 45 to 54 Years | 106 (86.2%) | 2 (1.9%) |
| 55 to 59 Years | 42 (87.5%) | 2 (4.8%) |
| 60 to 64 Years | 44 (68.8%) | 0 (0.0%) |
| 65 to 74 Years | 46 (42.2%) | 0 (0.0%) |
| 75 Years and over | 2 (3.2%) | 0 (0.0%) |
| Total | 563 (72.5%) | 10 (1.8%) |
Employment Status by Educational Attainment in Lawton
According to labor force statistics for Lawton, 88.4% of individuals (435) out of the total population between 25 and 64 years of age (492) are in the labor force, with 0.9% or 4 of them being unemployed. The group with the highest labor force participation rate are those with the educational attainment of high school diploma, with 94.5% or 86 individuals in the labor force. Within the labor force, individuals with high school diploma education have the highest percentage of unemployment, with 4.7% or 4 of them being unemployed.
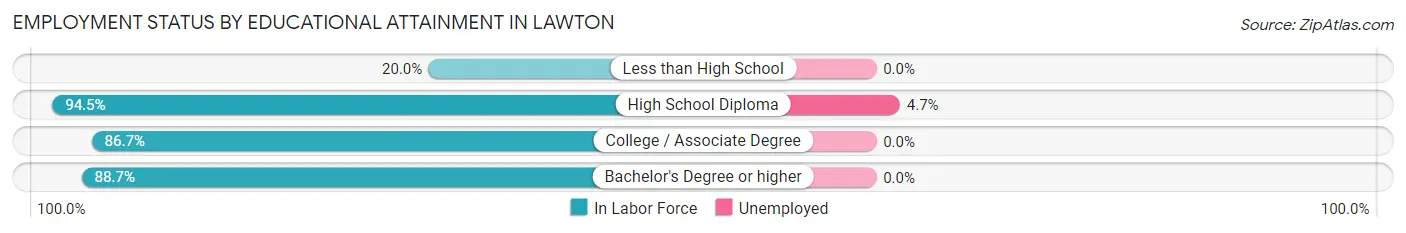
| Educational Attainment | In Labor Force | Unemployed |
| Less than High School | 1 (20.0%) | 0 (0.0%) |
| High School Diploma | 86 (94.5%) | 4 (4.7%) |
| College / Associate Degree | 143 (86.7%) | 0 (0.0%) |
| Bachelor's Degree or higher | 205 (88.7%) | 0 (0.0%) |
| Total | 435 (88.4%) | 4 (0.9%) |
Employment Occupations by Sex in Lawton
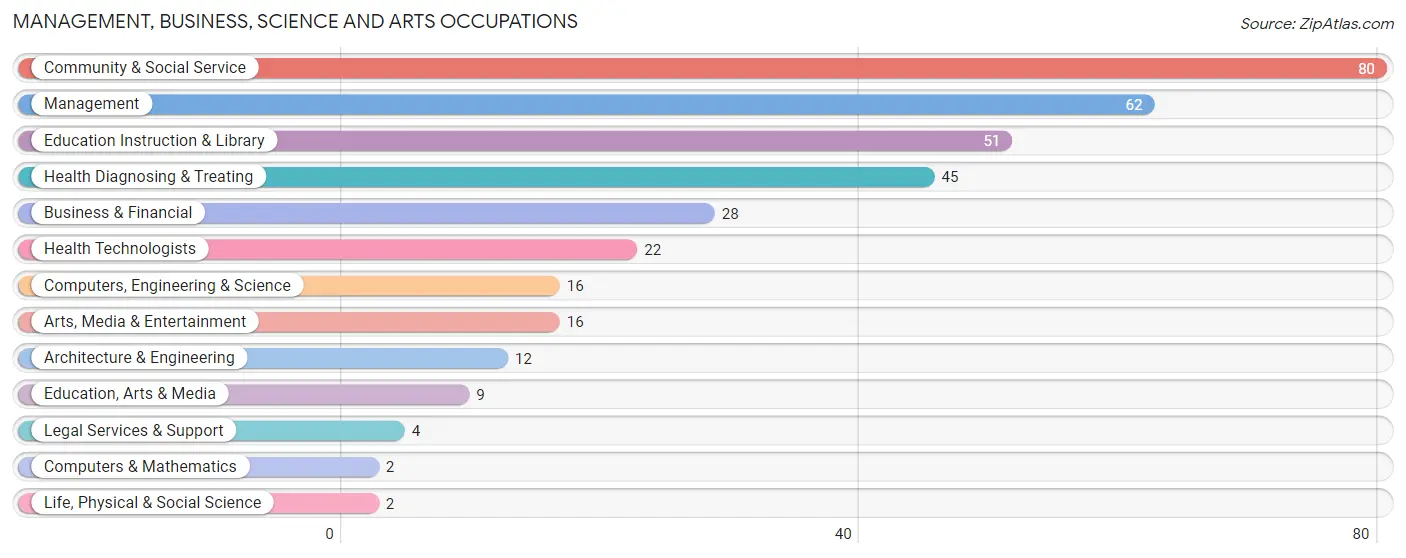
Management, Business, Science and Arts Occupations
The most common Management, Business, Science and Arts occupations in Lawton are Community & Social Service (80 | 14.5%), Management (62 | 11.2%), Education Instruction & Library (51 | 9.2%), Health Diagnosing & Treating (45 | 8.1%), and Business & Financial (28 | 5.1%).
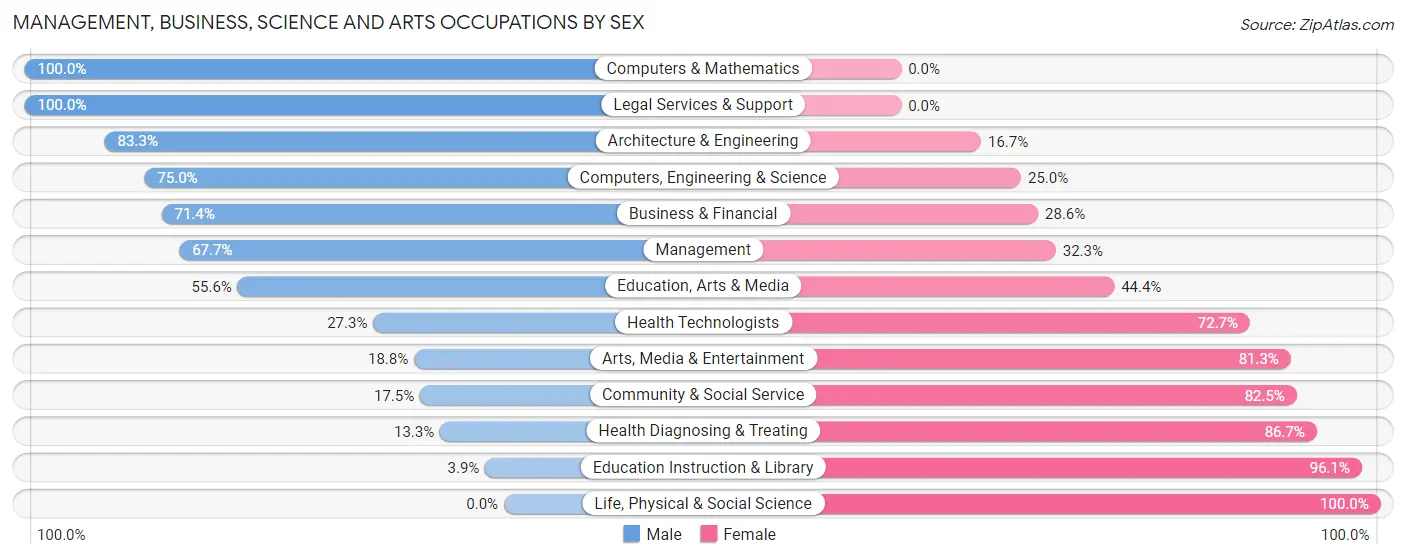
Management, Business, Science and Arts Occupations by Sex
Within the Management, Business, Science and Arts occupations in Lawton, the most male-oriented occupations are Computers & Mathematics (100.0%), Legal Services & Support (100.0%), and Architecture & Engineering (83.3%), while the most female-oriented occupations are Life, Physical & Social Science (100.0%), Education Instruction & Library (96.1%), and Health Diagnosing & Treating (86.7%).
| Occupation | Male | Female |
| Management | 42 (67.7%) | 20 (32.3%) |
| Business & Financial | 20 (71.4%) | 8 (28.6%) |
| Computers, Engineering & Science | 12 (75.0%) | 4 (25.0%) |
| Computers & Mathematics | 2 (100.0%) | 0 (0.0%) |
| Architecture & Engineering | 10 (83.3%) | 2 (16.7%) |
| Life, Physical & Social Science | 0 (0.0%) | 2 (100.0%) |
| Community & Social Service | 14 (17.5%) | 66 (82.5%) |
| Education, Arts & Media | 5 (55.6%) | 4 (44.4%) |
| Legal Services & Support | 4 (100.0%) | 0 (0.0%) |
| Education Instruction & Library | 2 (3.9%) | 49 (96.1%) |
| Arts, Media & Entertainment | 3 (18.8%) | 13 (81.2%) |
| Health Diagnosing & Treating | 6 (13.3%) | 39 (86.7%) |
| Health Technologists | 6 (27.3%) | 16 (72.7%) |
| Total (Category) | 94 (40.7%) | 137 (59.3%) |
| Total (Overall) | 248 (44.9%) | 305 (55.1%) |
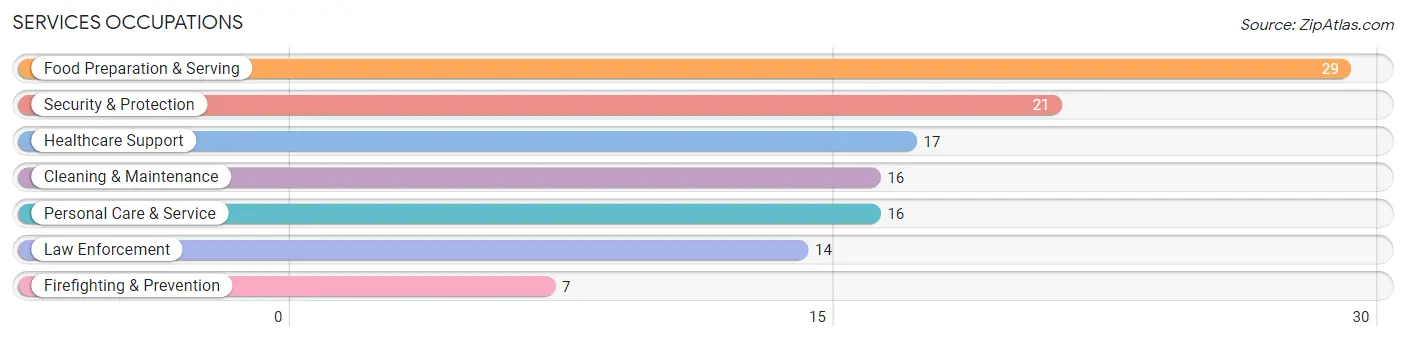
Services Occupations
The most common Services occupations in Lawton are Food Preparation & Serving (29 | 5.2%), Security & Protection (21 | 3.8%), Healthcare Support (17 | 3.1%), Cleaning & Maintenance (16 | 2.9%), and Personal Care & Service (16 | 2.9%).
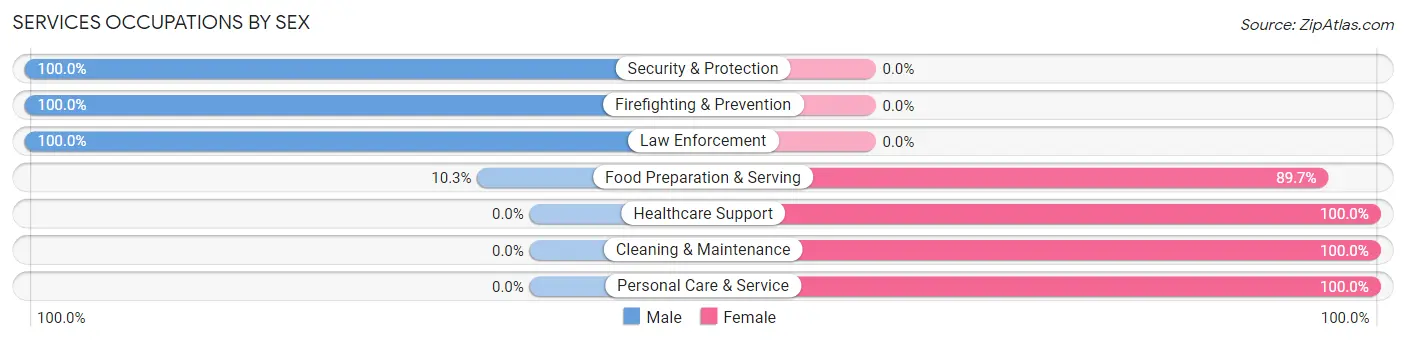
Services Occupations by Sex
Within the Services occupations in Lawton, the most male-oriented occupations are Security & Protection (100.0%), Firefighting & Prevention (100.0%), and Law Enforcement (100.0%), while the most female-oriented occupations are Healthcare Support (100.0%), Cleaning & Maintenance (100.0%), and Personal Care & Service (100.0%).
| Occupation | Male | Female |
| Healthcare Support | 0 (0.0%) | 17 (100.0%) |
| Security & Protection | 21 (100.0%) | 0 (0.0%) |
| Firefighting & Prevention | 7 (100.0%) | 0 (0.0%) |
| Law Enforcement | 14 (100.0%) | 0 (0.0%) |
| Food Preparation & Serving | 3 (10.3%) | 26 (89.7%) |
| Cleaning & Maintenance | 0 (0.0%) | 16 (100.0%) |
| Personal Care & Service | 0 (0.0%) | 16 (100.0%) |
| Total (Category) | 24 (24.2%) | 75 (75.8%) |
| Total (Overall) | 248 (44.9%) | 305 (55.1%) |
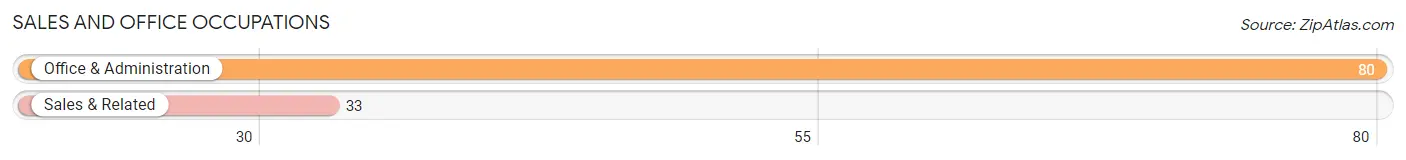
Sales and Office Occupations
The most common Sales and Office occupations in Lawton are Office & Administration (80 | 14.5%), and Sales & Related (33 | 6.0%).
Sales and Office Occupations by Sex
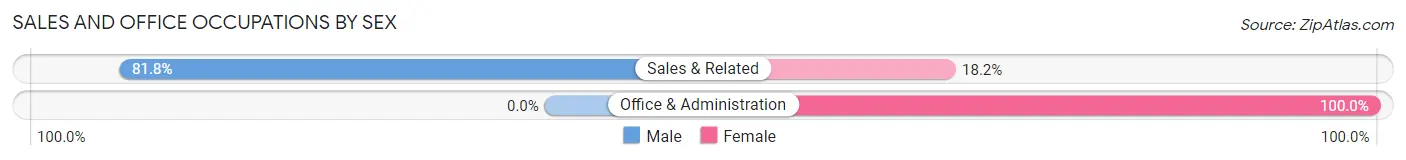
| Occupation | Male | Female |
| Sales & Related | 27 (81.8%) | 6 (18.2%) |
| Office & Administration | 0 (0.0%) | 80 (100.0%) |
| Total (Category) | 27 (23.9%) | 86 (76.1%) |
| Total (Overall) | 248 (44.9%) | 305 (55.1%) |
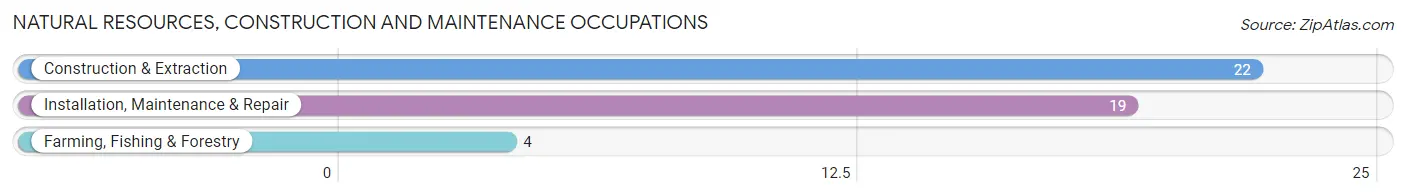
Natural Resources, Construction and Maintenance Occupations
The most common Natural Resources, Construction and Maintenance occupations in Lawton are Construction & Extraction (22 | 4.0%), Installation, Maintenance & Repair (19 | 3.4%), and Farming, Fishing & Forestry (4 | 0.7%).
Natural Resources, Construction and Maintenance Occupations by Sex
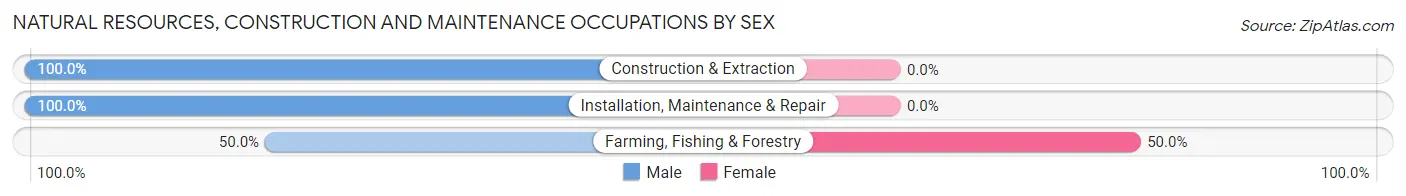
| Occupation | Male | Female |
| Farming, Fishing & Forestry | 2 (50.0%) | 2 (50.0%) |
| Construction & Extraction | 22 (100.0%) | 0 (0.0%) |
| Installation, Maintenance & Repair | 19 (100.0%) | 0 (0.0%) |
| Total (Category) | 43 (95.6%) | 2 (4.4%) |
| Total (Overall) | 248 (44.9%) | 305 (55.1%) |
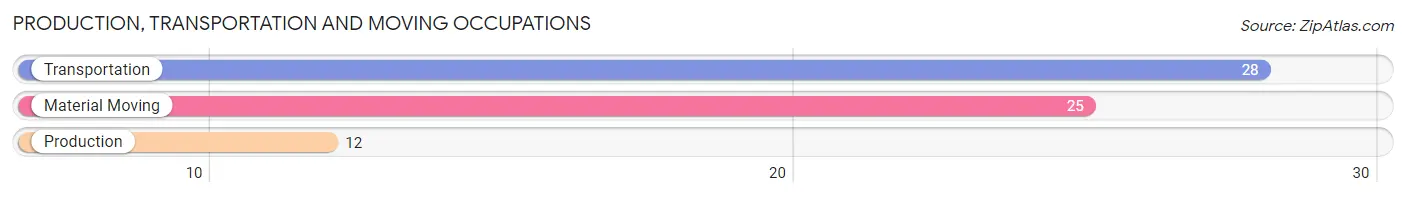
Production, Transportation and Moving Occupations
The most common Production, Transportation and Moving occupations in Lawton are Transportation (28 | 5.1%), Material Moving (25 | 4.5%), and Production (12 | 2.2%).
Production, Transportation and Moving Occupations by Sex
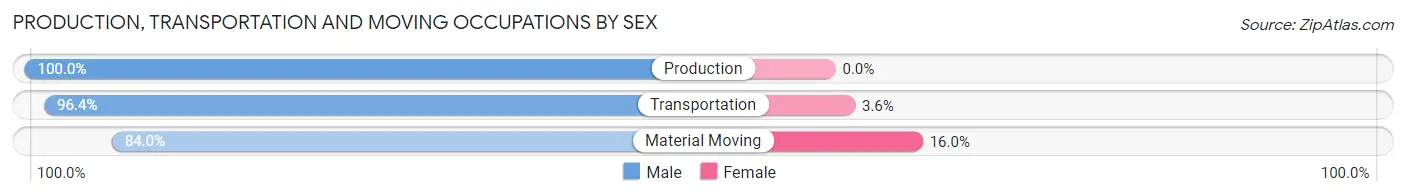
| Occupation | Male | Female |
| Production | 12 (100.0%) | 0 (0.0%) |
| Transportation | 27 (96.4%) | 1 (3.6%) |
| Material Moving | 21 (84.0%) | 4 (16.0%) |
| Total (Category) | 60 (92.3%) | 5 (7.7%) |
| Total (Overall) | 248 (44.9%) | 305 (55.1%) |
Employment Industries by Sex in Lawton
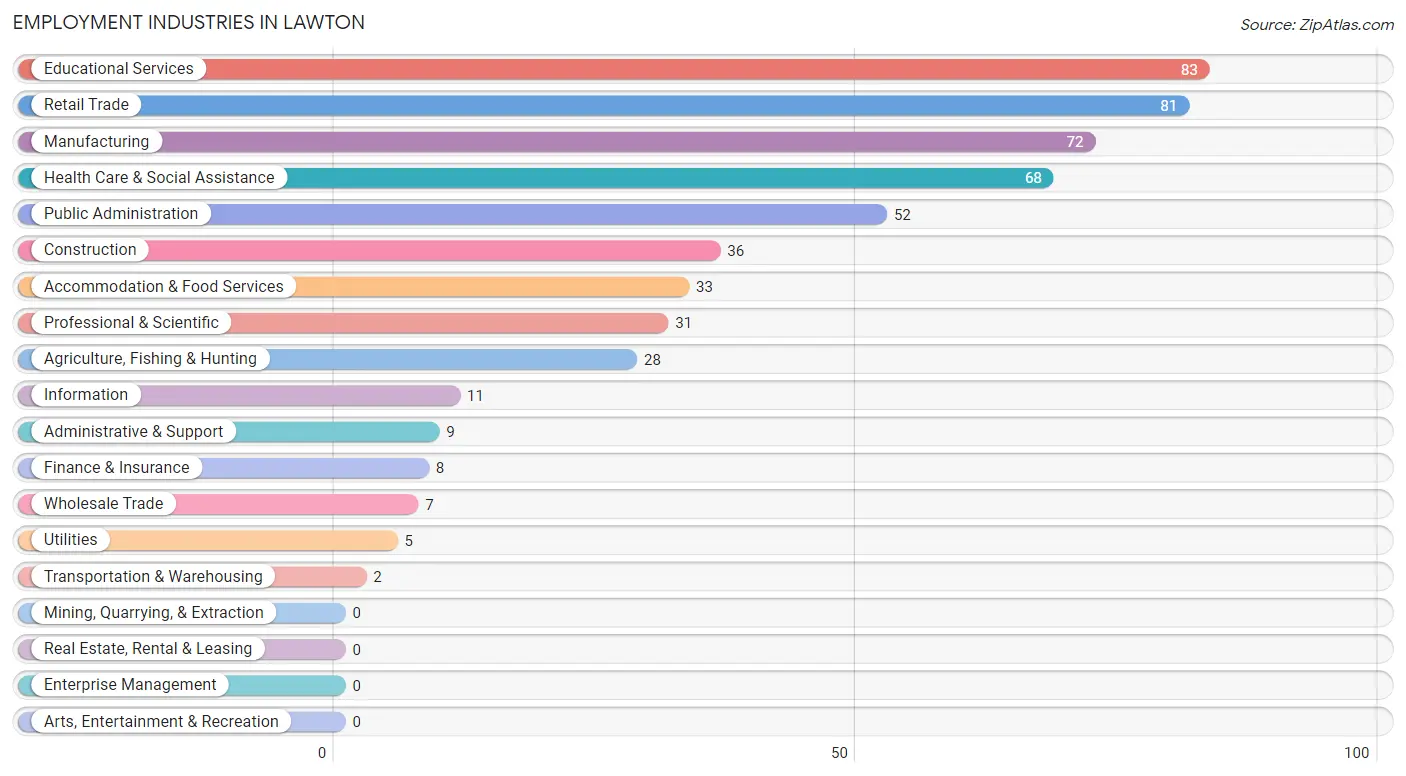
Employment Industries in Lawton
The major employment industries in Lawton include Educational Services (83 | 15.0%), Retail Trade (81 | 14.6%), Manufacturing (72 | 13.0%), Health Care & Social Assistance (68 | 12.3%), and Public Administration (52 | 9.4%).
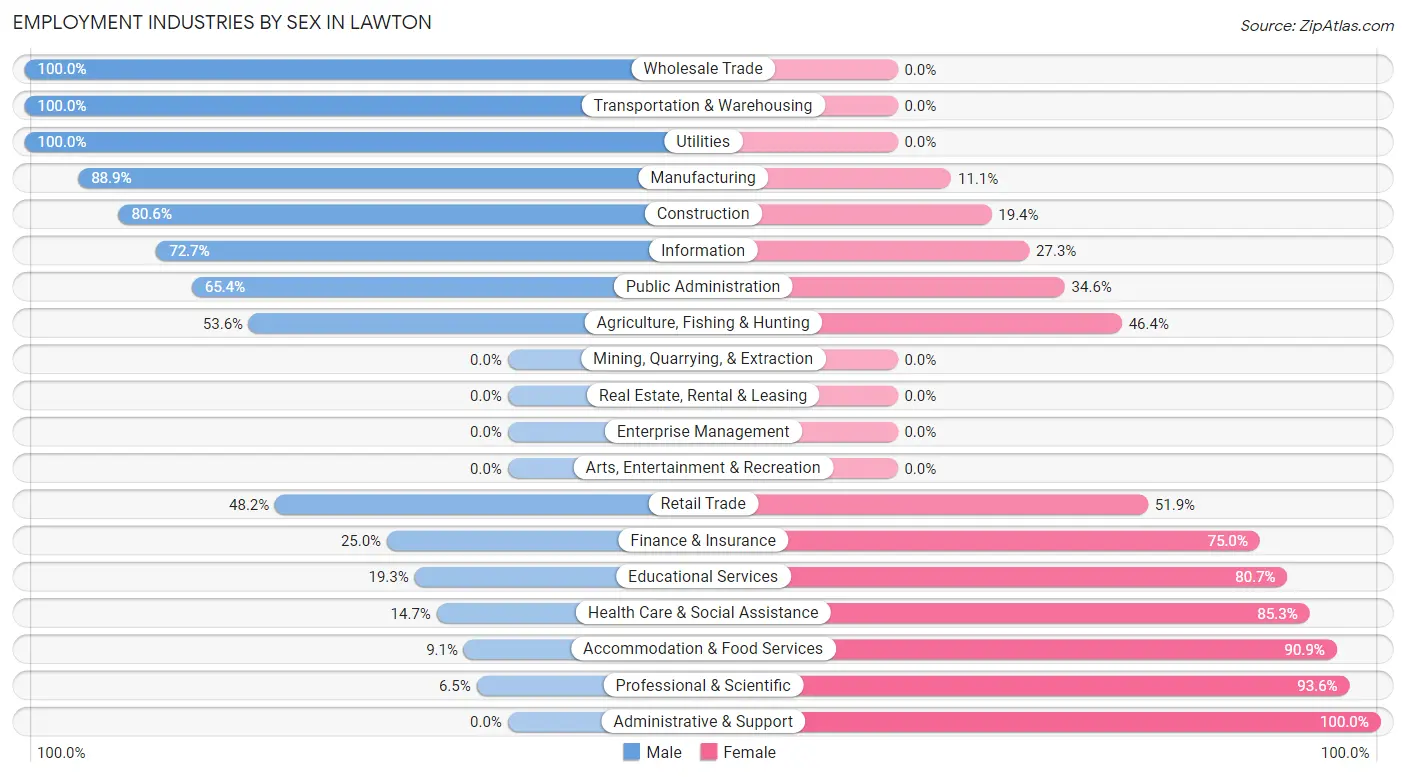
Employment Industries by Sex in Lawton
The Lawton industries that see more men than women are Wholesale Trade (100.0%), Transportation & Warehousing (100.0%), and Utilities (100.0%), whereas the industries that tend to have a higher number of women are Administrative & Support (100.0%), Professional & Scientific (93.5%), and Accommodation & Food Services (90.9%).
| Industry | Male | Female |
| Agriculture, Fishing & Hunting | 15 (53.6%) | 13 (46.4%) |
| Mining, Quarrying, & Extraction | 0 (0.0%) | 0 (0.0%) |
| Construction | 29 (80.6%) | 7 (19.4%) |
| Manufacturing | 64 (88.9%) | 8 (11.1%) |
| Wholesale Trade | 7 (100.0%) | 0 (0.0%) |
| Retail Trade | 39 (48.1%) | 42 (51.8%) |
| Transportation & Warehousing | 2 (100.0%) | 0 (0.0%) |
| Utilities | 5 (100.0%) | 0 (0.0%) |
| Information | 8 (72.7%) | 3 (27.3%) |
| Finance & Insurance | 2 (25.0%) | 6 (75.0%) |
| Real Estate, Rental & Leasing | 0 (0.0%) | 0 (0.0%) |
| Professional & Scientific | 2 (6.5%) | 29 (93.5%) |
| Enterprise Management | 0 (0.0%) | 0 (0.0%) |
| Administrative & Support | 0 (0.0%) | 9 (100.0%) |
| Educational Services | 16 (19.3%) | 67 (80.7%) |
| Health Care & Social Assistance | 10 (14.7%) | 58 (85.3%) |
| Arts, Entertainment & Recreation | 0 (0.0%) | 0 (0.0%) |
| Accommodation & Food Services | 3 (9.1%) | 30 (90.9%) |
| Public Administration | 34 (65.4%) | 18 (34.6%) |
| Total | 248 (44.9%) | 305 (55.1%) |
Education in Lawton
School Enrollment in Lawton
The most common levels of schooling among the 323 students in Lawton are high school (81 | 25.1%), elementary school (74 | 22.9%), and middle school (60 | 18.6%).
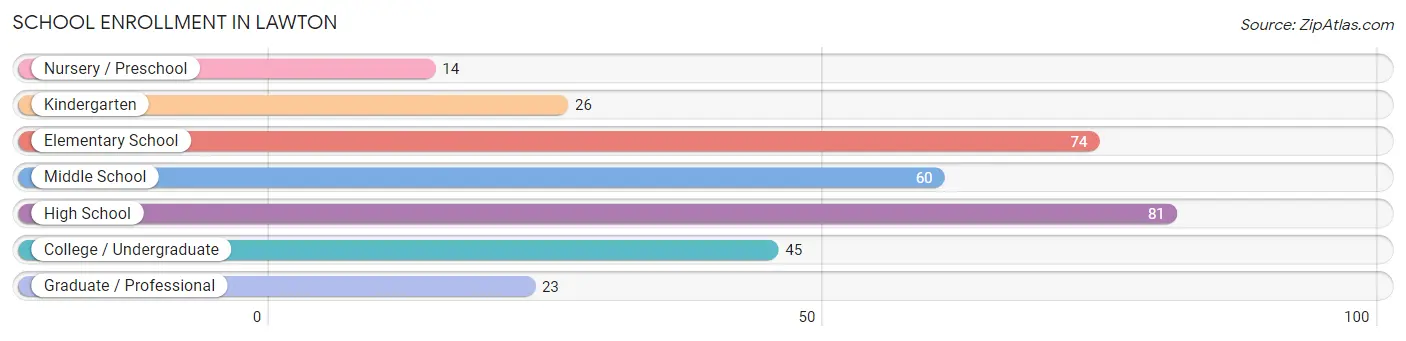
| School Level | # Students | % Students |
| Nursery / Preschool | 14 | 4.3% |
| Kindergarten | 26 | 8.1% |
| Elementary School | 74 | 22.9% |
| Middle School | 60 | 18.6% |
| High School | 81 | 25.1% |
| College / Undergraduate | 45 | 13.9% |
| Graduate / Professional | 23 | 7.1% |
| Total | 323 | 100.0% |
School Enrollment by Age by Funding Source in Lawton
Out of a total of 323 students who are enrolled in schools in Lawton, 20 (6.2%) attend a private institution, while the remaining 303 (93.8%) are enrolled in public schools. The age group of 35 years and over has the highest likelihood of being enrolled in private schools, with 12 (54.5% in the age bracket) enrolled. Conversely, the age group of 5 to 9 year old has the lowest likelihood of being enrolled in a private school, with 91 (100.0% in the age bracket) attending a public institution.
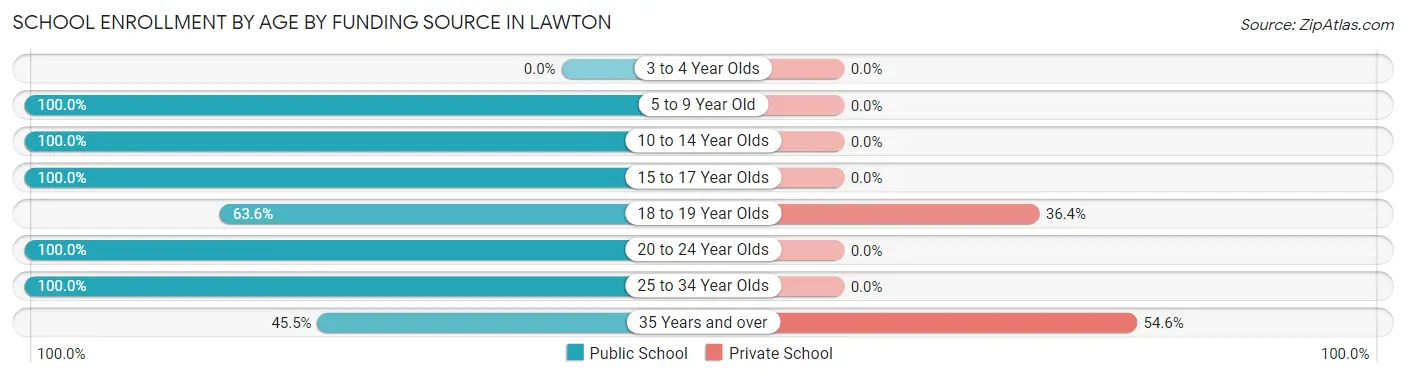
| Age Bracket | Public School | Private School |
| 3 to 4 Year Olds | 0 (0.0%) | 0 (0.0%) |
| 5 to 9 Year Old | 91 (100.0%) | 0 (0.0%) |
| 10 to 14 Year Olds | 91 (100.0%) | 0 (0.0%) |
| 15 to 17 Year Olds | 65 (100.0%) | 0 (0.0%) |
| 18 to 19 Year Olds | 14 (63.6%) | 8 (36.4%) |
| 20 to 24 Year Olds | 16 (100.0%) | 0 (0.0%) |
| 25 to 34 Year Olds | 16 (100.0%) | 0 (0.0%) |
| 35 Years and over | 10 (45.5%) | 12 (54.5%) |
| Total | 303 (93.8%) | 20 (6.2%) |
Educational Attainment by Field of Study in Lawton
Science & technology (65 | 24.1%), business (53 | 19.6%), education (47 | 17.4%), bio, nature & agricultural (20 | 7.4%), and arts & humanities (19 | 7.0%) are the most common fields of study among 270 individuals in Lawton who have obtained a bachelor's degree or higher.
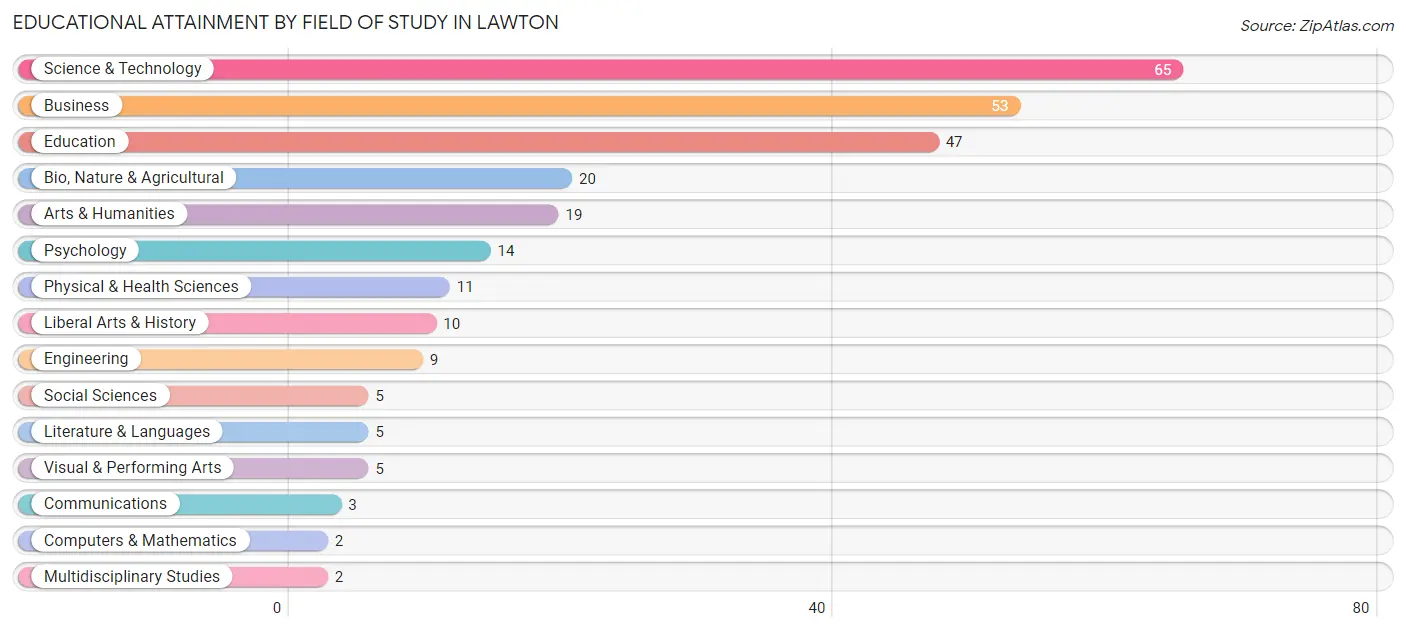
| Field of Study | # Graduates | % Graduates |
| Computers & Mathematics | 2 | 0.7% |
| Bio, Nature & Agricultural | 20 | 7.4% |
| Physical & Health Sciences | 11 | 4.1% |
| Psychology | 14 | 5.2% |
| Social Sciences | 5 | 1.8% |
| Engineering | 9 | 3.3% |
| Multidisciplinary Studies | 2 | 0.7% |
| Science & Technology | 65 | 24.1% |
| Business | 53 | 19.6% |
| Education | 47 | 17.4% |
| Literature & Languages | 5 | 1.8% |
| Liberal Arts & History | 10 | 3.7% |
| Visual & Performing Arts | 5 | 1.8% |
| Communications | 3 | 1.1% |
| Arts & Humanities | 19 | 7.0% |
| Total | 270 | 100.0% |
Transportation & Commute in Lawton
Vehicle Availability by Sex in Lawton
The most prevalent vehicle ownership categories in Lawton are males with 2 vehicles (90, accounting for 37.0%) and females with 2 vehicles (100, making up 29.7%).
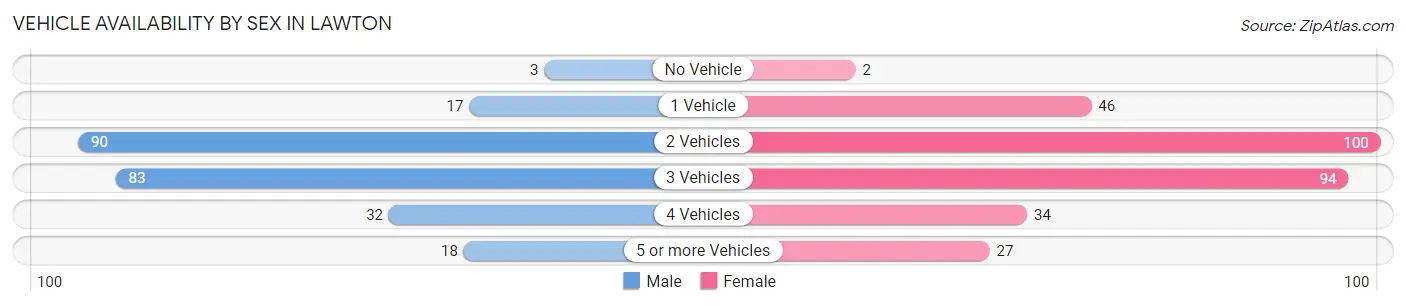
| Vehicles Available | Male | Female |
| No Vehicle | 3 (1.2%) | 2 (0.7%) |
| 1 Vehicle | 17 (7.0%) | 46 (15.2%) |
| 2 Vehicles | 90 (37.0%) | 100 (33.0%) |
| 3 Vehicles | 83 (34.2%) | 94 (31.0%) |
| 4 Vehicles | 32 (13.2%) | 34 (11.2%) |
| 5 or more Vehicles | 18 (7.4%) | 27 (8.9%) |
| Total | 243 (100.0%) | 303 (100.0%) |
Commute Time in Lawton
The most frequently occuring commute durations in Lawton are 20 to 24 minutes (126 commuters, 23.5%), 15 to 19 minutes (124 commuters, 23.2%), and 10 to 14 minutes (91 commuters, 17.0%).
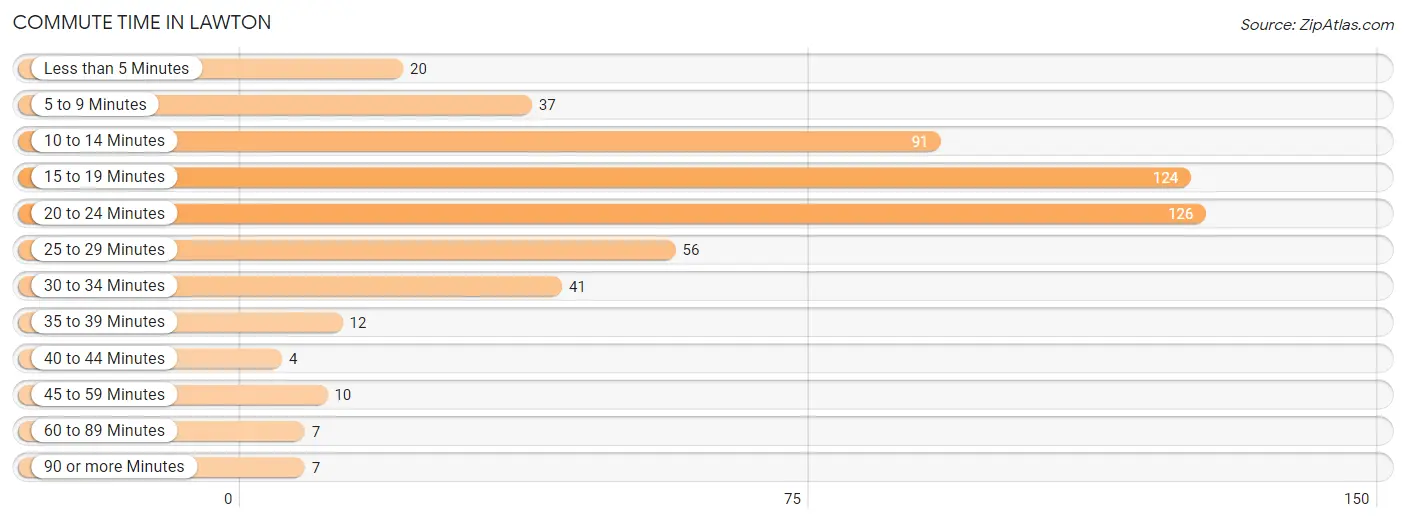
| Commute Time | # Commuters | % Commuters |
| Less than 5 Minutes | 20 | 3.7% |
| 5 to 9 Minutes | 37 | 6.9% |
| 10 to 14 Minutes | 91 | 17.0% |
| 15 to 19 Minutes | 124 | 23.2% |
| 20 to 24 Minutes | 126 | 23.5% |
| 25 to 29 Minutes | 56 | 10.5% |
| 30 to 34 Minutes | 41 | 7.7% |
| 35 to 39 Minutes | 12 | 2.2% |
| 40 to 44 Minutes | 4 | 0.7% |
| 45 to 59 Minutes | 10 | 1.9% |
| 60 to 89 Minutes | 7 | 1.3% |
| 90 or more Minutes | 7 | 1.3% |
Commute Time by Sex in Lawton
The most common commute times in Lawton are 20 to 24 minutes (80 commuters, 33.3%) for males and 15 to 19 minutes (72 commuters, 24.4%) for females.
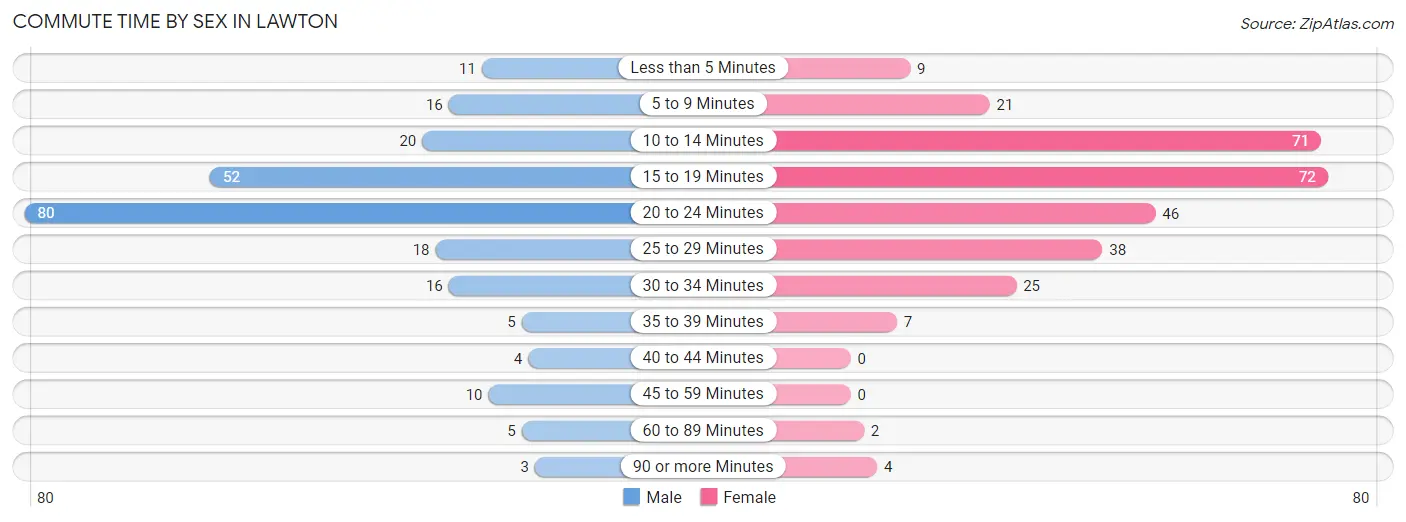
| Commute Time | Male | Female |
| Less than 5 Minutes | 11 (4.6%) | 9 (3.0%) |
| 5 to 9 Minutes | 16 (6.7%) | 21 (7.1%) |
| 10 to 14 Minutes | 20 (8.3%) | 71 (24.1%) |
| 15 to 19 Minutes | 52 (21.7%) | 72 (24.4%) |
| 20 to 24 Minutes | 80 (33.3%) | 46 (15.6%) |
| 25 to 29 Minutes | 18 (7.5%) | 38 (12.9%) |
| 30 to 34 Minutes | 16 (6.7%) | 25 (8.5%) |
| 35 to 39 Minutes | 5 (2.1%) | 7 (2.4%) |
| 40 to 44 Minutes | 4 (1.7%) | 0 (0.0%) |
| 45 to 59 Minutes | 10 (4.2%) | 0 (0.0%) |
| 60 to 89 Minutes | 5 (2.1%) | 2 (0.7%) |
| 90 or more Minutes | 3 (1.3%) | 4 (1.4%) |
Time of Departure to Work by Sex in Lawton
The most frequent times of departure to work in Lawton are 6:30 AM to 6:59 AM (55, 22.9%) for males and 7:00 AM to 7:29 AM (80, 27.1%) for females.
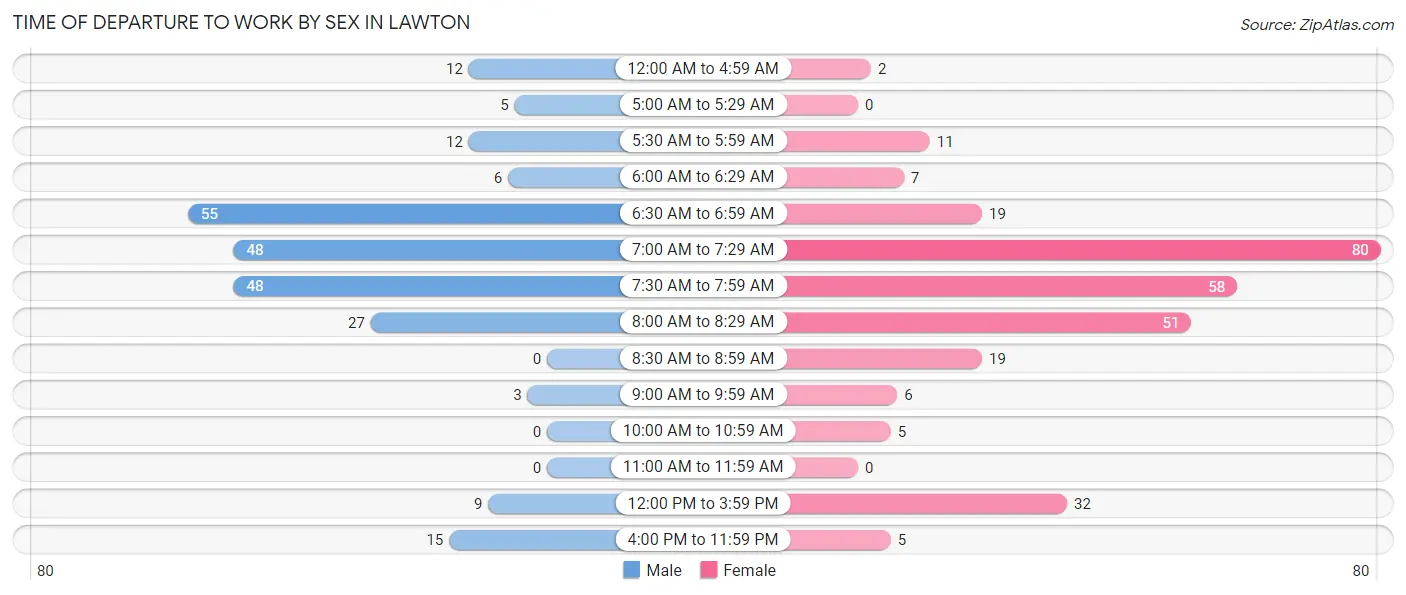
| Time of Departure | Male | Female |
| 12:00 AM to 4:59 AM | 12 (5.0%) | 2 (0.7%) |
| 5:00 AM to 5:29 AM | 5 (2.1%) | 0 (0.0%) |
| 5:30 AM to 5:59 AM | 12 (5.0%) | 11 (3.7%) |
| 6:00 AM to 6:29 AM | 6 (2.5%) | 7 (2.4%) |
| 6:30 AM to 6:59 AM | 55 (22.9%) | 19 (6.4%) |
| 7:00 AM to 7:29 AM | 48 (20.0%) | 80 (27.1%) |
| 7:30 AM to 7:59 AM | 48 (20.0%) | 58 (19.7%) |
| 8:00 AM to 8:29 AM | 27 (11.3%) | 51 (17.3%) |
| 8:30 AM to 8:59 AM | 0 (0.0%) | 19 (6.4%) |
| 9:00 AM to 9:59 AM | 3 (1.3%) | 6 (2.0%) |
| 10:00 AM to 10:59 AM | 0 (0.0%) | 5 (1.7%) |
| 11:00 AM to 11:59 AM | 0 (0.0%) | 0 (0.0%) |
| 12:00 PM to 3:59 PM | 9 (3.7%) | 32 (10.8%) |
| 4:00 PM to 11:59 PM | 15 (6.2%) | 5 (1.7%) |
| Total | 240 (100.0%) | 295 (100.0%) |
Housing Occupancy in Lawton
Occupancy by Ownership in Lawton
Of the total 378 dwellings in Lawton, owner-occupied units account for 301 (79.6%), while renter-occupied units make up 77 (20.4%).
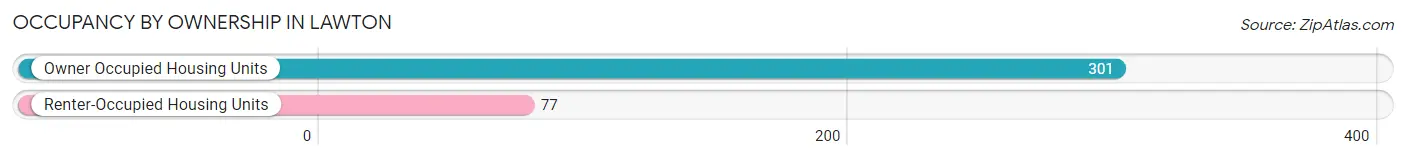
| Occupancy | # Housing Units | % Housing Units |
| Owner Occupied Housing Units | 301 | 79.6% |
| Renter-Occupied Housing Units | 77 | 20.4% |
| Total Occupied Housing Units | 378 | 100.0% |
Occupancy by Household Size in Lawton
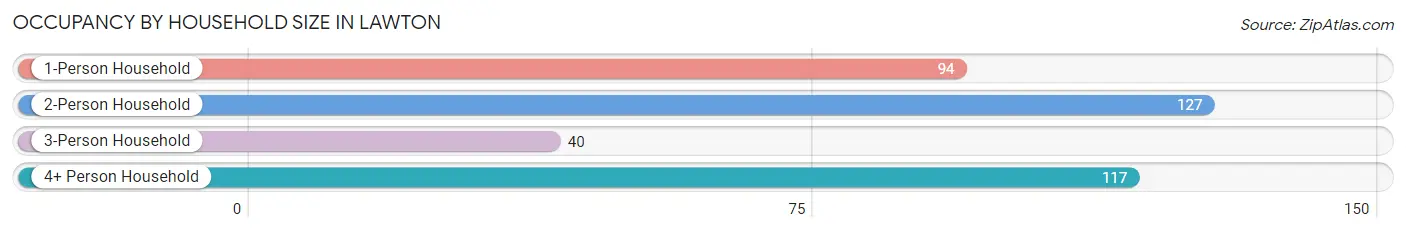
| Household Size | # Housing Units | % Housing Units |
| 1-Person Household | 94 | 24.9% |
| 2-Person Household | 127 | 33.6% |
| 3-Person Household | 40 | 10.6% |
| 4+ Person Household | 117 | 30.9% |
| Total Housing Units | 378 | 100.0% |
Occupancy by Ownership by Household Size in Lawton
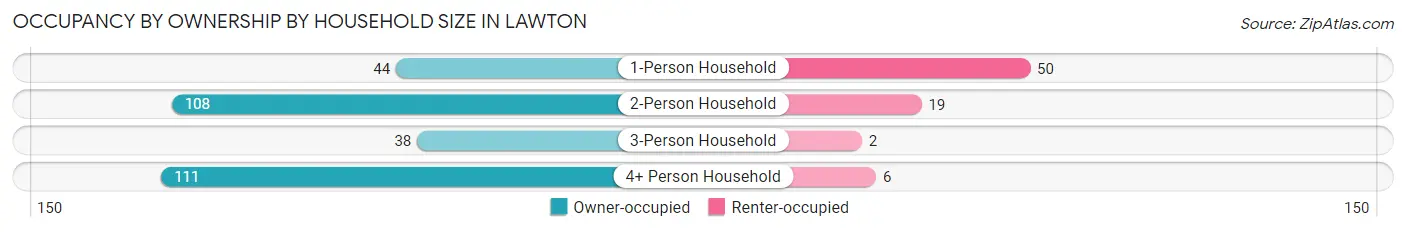
| Household Size | Owner-occupied | Renter-occupied |
| 1-Person Household | 44 (46.8%) | 50 (53.2%) |
| 2-Person Household | 108 (85.0%) | 19 (15.0%) |
| 3-Person Household | 38 (95.0%) | 2 (5.0%) |
| 4+ Person Household | 111 (94.9%) | 6 (5.1%) |
| Total Housing Units | 301 (79.6%) | 77 (20.4%) |
Occupancy by Educational Attainment in Lawton
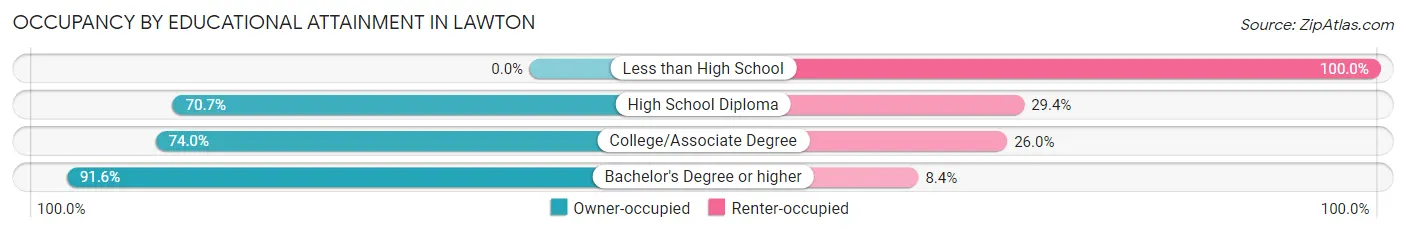
| Household Size | Owner-occupied | Renter-occupied |
| Less than High School | 0 (0.0%) | 4 (100.0%) |
| High School Diploma | 65 (70.7%) | 27 (29.3%) |
| College/Associate Degree | 94 (74.0%) | 33 (26.0%) |
| Bachelor's Degree or higher | 142 (91.6%) | 13 (8.4%) |
Occupancy by Age of Householder in Lawton
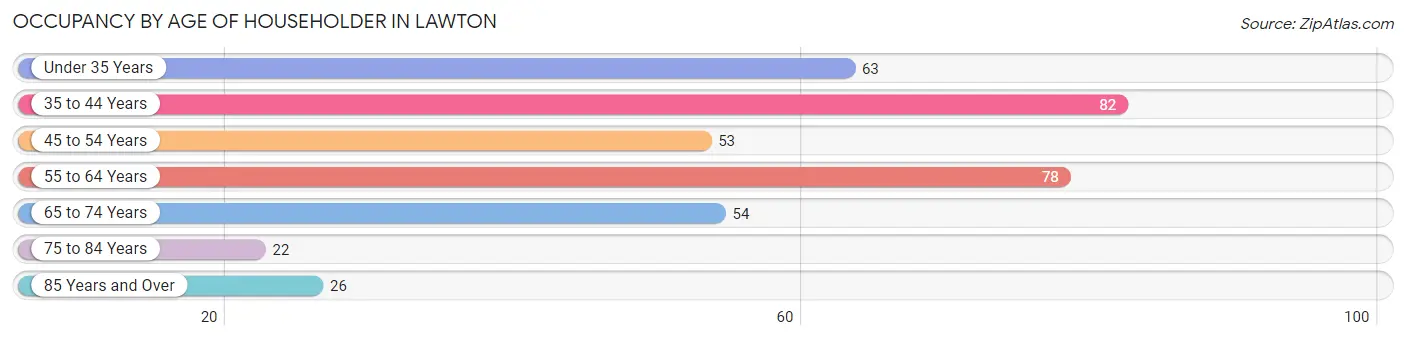
| Age Bracket | # Households | % Households |
| Under 35 Years | 63 | 16.7% |
| 35 to 44 Years | 82 | 21.7% |
| 45 to 54 Years | 53 | 14.0% |
| 55 to 64 Years | 78 | 20.6% |
| 65 to 74 Years | 54 | 14.3% |
| 75 to 84 Years | 22 | 5.8% |
| 85 Years and Over | 26 | 6.9% |
| Total | 378 | 100.0% |
Housing Finances in Lawton
Median Income by Occupancy in Lawton
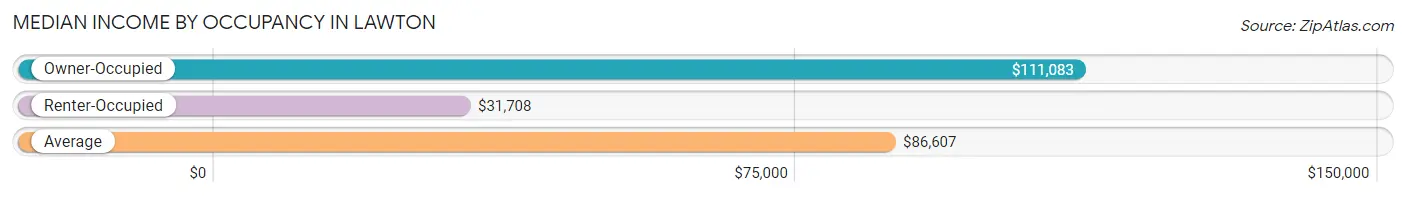
| Occupancy Type | # Households | Median Income |
| Owner-Occupied | 301 (79.6%) | $111,083 |
| Renter-Occupied | 77 (20.4%) | $31,708 |
| Average | 378 (100.0%) | $86,607 |
Occupancy by Householder Income Bracket in Lawton
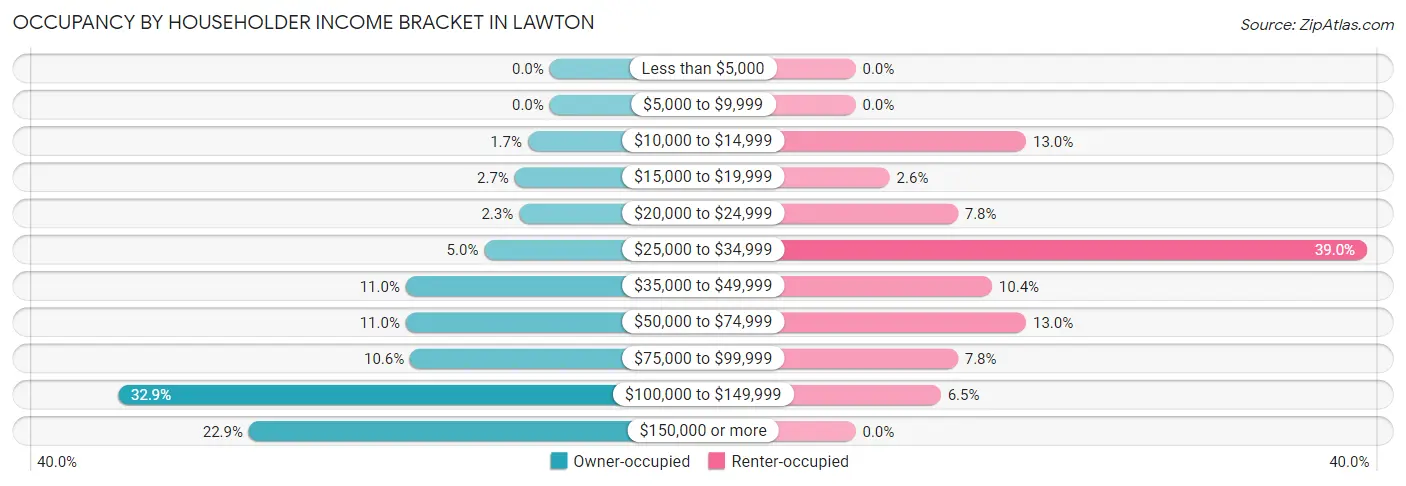
| Income Bracket | Owner-occupied | Renter-occupied |
| Less than $5,000 | 0 (0.0%) | 0 (0.0%) |
| $5,000 to $9,999 | 0 (0.0%) | 0 (0.0%) |
| $10,000 to $14,999 | 5 (1.7%) | 10 (13.0%) |
| $15,000 to $19,999 | 8 (2.7%) | 2 (2.6%) |
| $20,000 to $24,999 | 7 (2.3%) | 6 (7.8%) |
| $25,000 to $34,999 | 15 (5.0%) | 30 (39.0%) |
| $35,000 to $49,999 | 33 (11.0%) | 8 (10.4%) |
| $50,000 to $74,999 | 33 (11.0%) | 10 (13.0%) |
| $75,000 to $99,999 | 32 (10.6%) | 6 (7.8%) |
| $100,000 to $149,999 | 99 (32.9%) | 5 (6.5%) |
| $150,000 or more | 69 (22.9%) | 0 (0.0%) |
| Total | 301 (100.0%) | 77 (100.0%) |
Monthly Housing Cost Tiers in Lawton
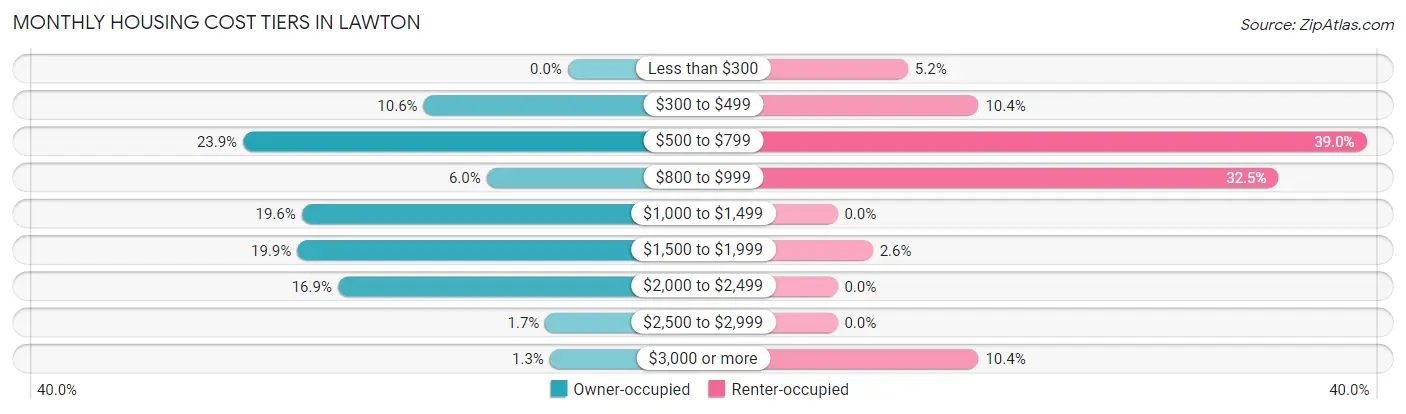
| Monthly Cost | Owner-occupied | Renter-occupied |
| Less than $300 | 0 (0.0%) | 4 (5.2%) |
| $300 to $499 | 32 (10.6%) | 8 (10.4%) |
| $500 to $799 | 72 (23.9%) | 30 (39.0%) |
| $800 to $999 | 18 (6.0%) | 25 (32.5%) |
| $1,000 to $1,499 | 59 (19.6%) | 0 (0.0%) |
| $1,500 to $1,999 | 60 (19.9%) | 2 (2.6%) |
| $2,000 to $2,499 | 51 (16.9%) | 0 (0.0%) |
| $2,500 to $2,999 | 5 (1.7%) | 0 (0.0%) |
| $3,000 or more | 4 (1.3%) | 8 (10.4%) |
| Total | 301 (100.0%) | 77 (100.0%) |
Physical Housing Characteristics in Lawton
Housing Structures in Lawton
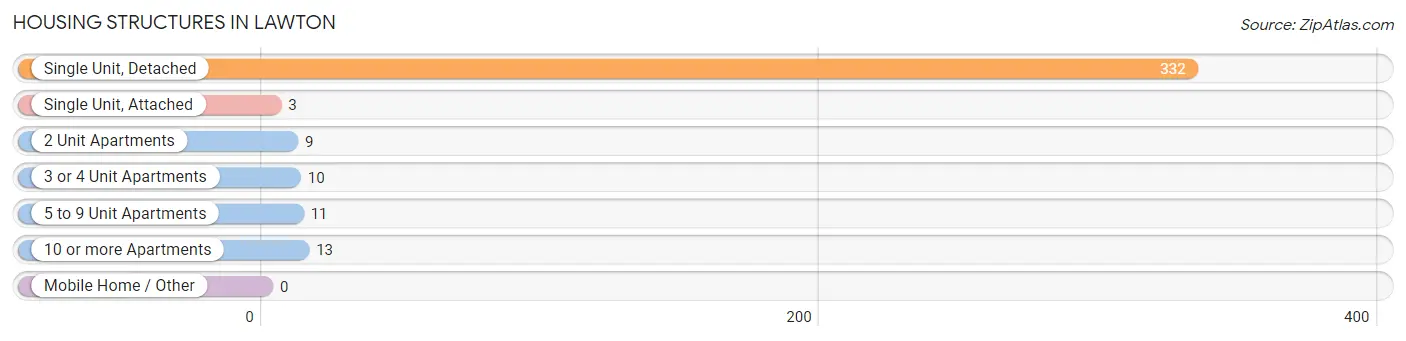
| Structure Type | # Housing Units | % Housing Units |
| Single Unit, Detached | 332 | 87.8% |
| Single Unit, Attached | 3 | 0.8% |
| 2 Unit Apartments | 9 | 2.4% |
| 3 or 4 Unit Apartments | 10 | 2.6% |
| 5 to 9 Unit Apartments | 11 | 2.9% |
| 10 or more Apartments | 13 | 3.4% |
| Mobile Home / Other | 0 | 0.0% |
| Total | 378 | 100.0% |
Housing Structures by Occupancy in Lawton
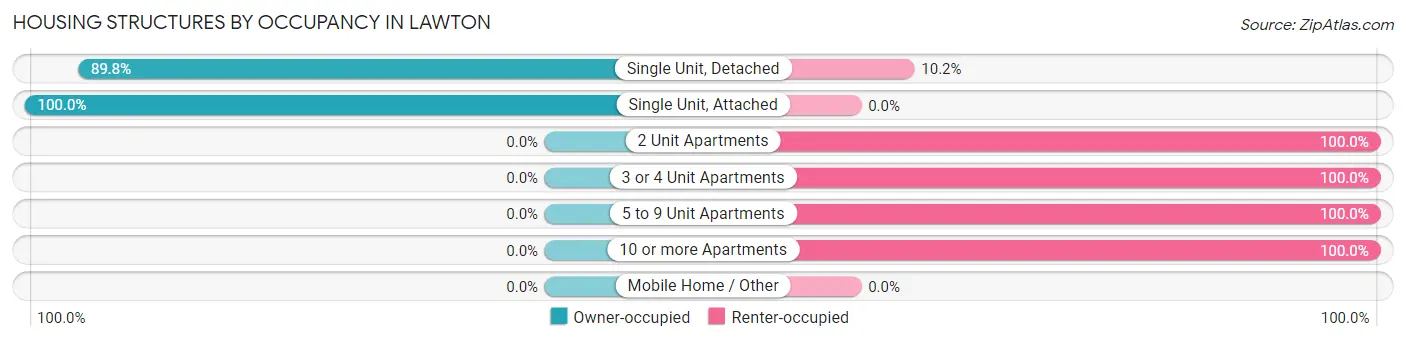
| Structure Type | Owner-occupied | Renter-occupied |
| Single Unit, Detached | 298 (89.8%) | 34 (10.2%) |
| Single Unit, Attached | 3 (100.0%) | 0 (0.0%) |
| 2 Unit Apartments | 0 (0.0%) | 9 (100.0%) |
| 3 or 4 Unit Apartments | 0 (0.0%) | 10 (100.0%) |
| 5 to 9 Unit Apartments | 0 (0.0%) | 11 (100.0%) |
| 10 or more Apartments | 0 (0.0%) | 13 (100.0%) |
| Mobile Home / Other | 0 (0.0%) | 0 (0.0%) |
| Total | 301 (79.6%) | 77 (20.4%) |
Housing Structures by Number of Rooms in Lawton
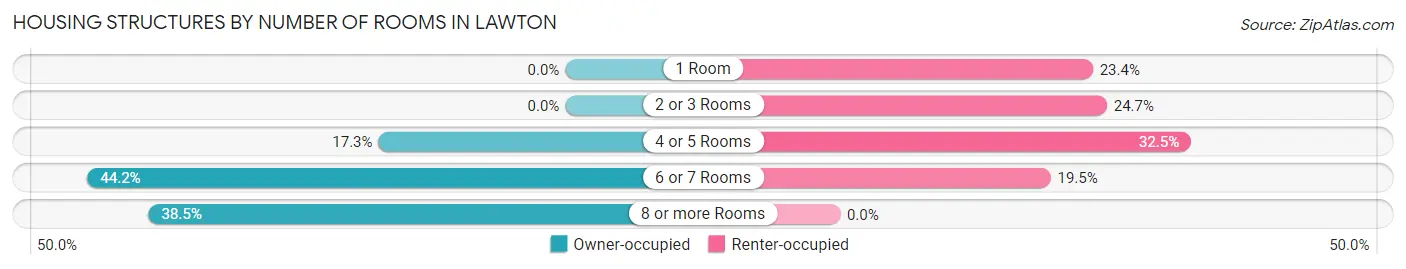
| Number of Rooms | Owner-occupied | Renter-occupied |
| 1 Room | 0 (0.0%) | 18 (23.4%) |
| 2 or 3 Rooms | 0 (0.0%) | 19 (24.7%) |
| 4 or 5 Rooms | 52 (17.3%) | 25 (32.5%) |
| 6 or 7 Rooms | 133 (44.2%) | 15 (19.5%) |
| 8 or more Rooms | 116 (38.5%) | 0 (0.0%) |
| Total | 301 (100.0%) | 77 (100.0%) |
Housing Structure by Heating Type in Lawton
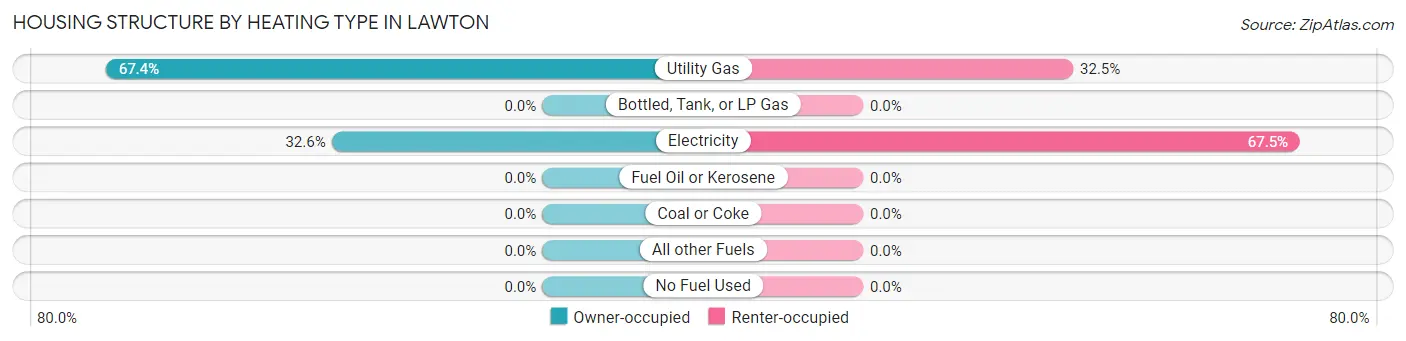
| Heating Type | Owner-occupied | Renter-occupied |
| Utility Gas | 203 (67.4%) | 25 (32.5%) |
| Bottled, Tank, or LP Gas | 0 (0.0%) | 0 (0.0%) |
| Electricity | 98 (32.6%) | 52 (67.5%) |
| Fuel Oil or Kerosene | 0 (0.0%) | 0 (0.0%) |
| Coal or Coke | 0 (0.0%) | 0 (0.0%) |
| All other Fuels | 0 (0.0%) | 0 (0.0%) |
| No Fuel Used | 0 (0.0%) | 0 (0.0%) |
| Total | 301 (100.0%) | 77 (100.0%) |
Household Vehicle Usage in Lawton
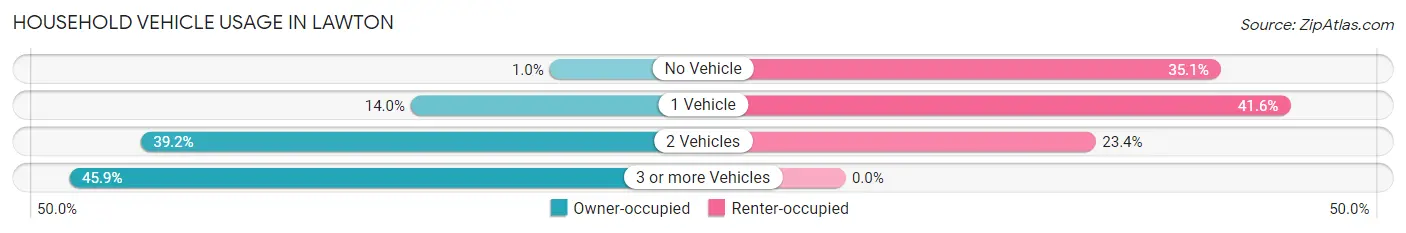
| Vehicles per Household | Owner-occupied | Renter-occupied |
| No Vehicle | 3 (1.0%) | 27 (35.1%) |
| 1 Vehicle | 42 (14.0%) | 32 (41.6%) |
| 2 Vehicles | 118 (39.2%) | 18 (23.4%) |
| 3 or more Vehicles | 138 (45.9%) | 0 (0.0%) |
| Total | 301 (100.0%) | 77 (100.0%) |
Real Estate & Mortgages in Lawton
Real Estate and Mortgage Overview in Lawton
| Characteristic | Without Mortgage | With Mortgage |
| Housing Units | 91 | 210 |
| Median Property Value | $251,900 | $240,500 |
| Median Household Income | $56,250 | $65 |
| Monthly Housing Costs | $584 | $4 |
| Real Estate Taxes | $3,090 | $0 |
Property Value by Mortgage Status in Lawton
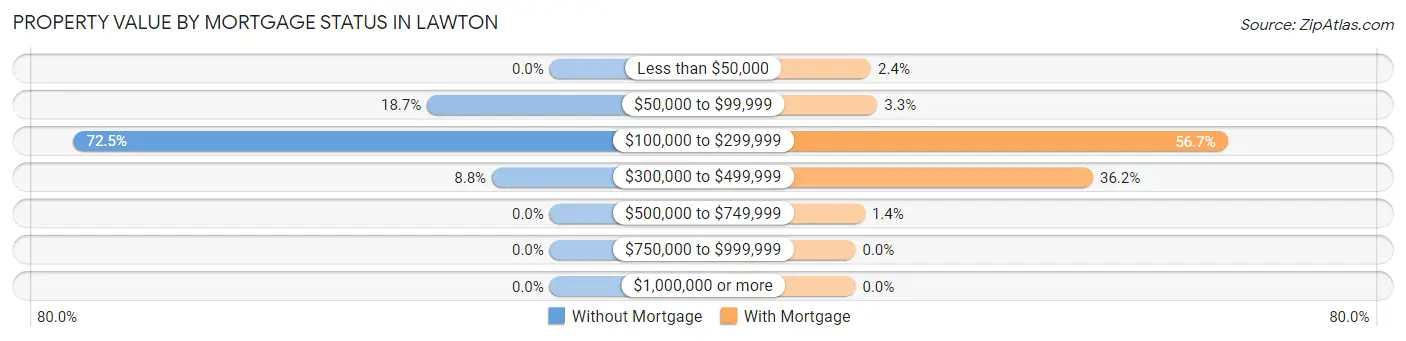
| Property Value | Without Mortgage | With Mortgage |
| Less than $50,000 | 0 (0.0%) | 5 (2.4%) |
| $50,000 to $99,999 | 17 (18.7%) | 7 (3.3%) |
| $100,000 to $299,999 | 66 (72.5%) | 119 (56.7%) |
| $300,000 to $499,999 | 8 (8.8%) | 76 (36.2%) |
| $500,000 to $749,999 | 0 (0.0%) | 3 (1.4%) |
| $750,000 to $999,999 | 0 (0.0%) | 0 (0.0%) |
| $1,000,000 or more | 0 (0.0%) | 0 (0.0%) |
| Total | 91 (100.0%) | 210 (100.0%) |
Household Income by Mortgage Status in Lawton
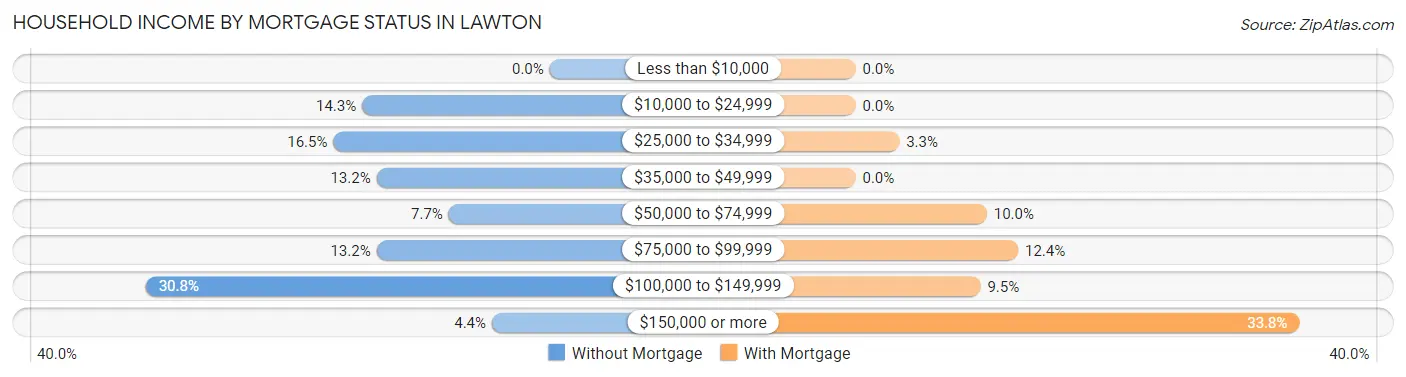
| Household Income | Without Mortgage | With Mortgage |
| Less than $10,000 | 0 (0.0%) | 0 (0.0%) |
| $10,000 to $24,999 | 13 (14.3%) | 0 (0.0%) |
| $25,000 to $34,999 | 15 (16.5%) | 7 (3.3%) |
| $35,000 to $49,999 | 12 (13.2%) | 0 (0.0%) |
| $50,000 to $74,999 | 7 (7.7%) | 21 (10.0%) |
| $75,000 to $99,999 | 12 (13.2%) | 26 (12.4%) |
| $100,000 to $149,999 | 28 (30.8%) | 20 (9.5%) |
| $150,000 or more | 4 (4.4%) | 71 (33.8%) |
| Total | 91 (100.0%) | 210 (100.0%) |
Property Value to Household Income Ratio in Lawton
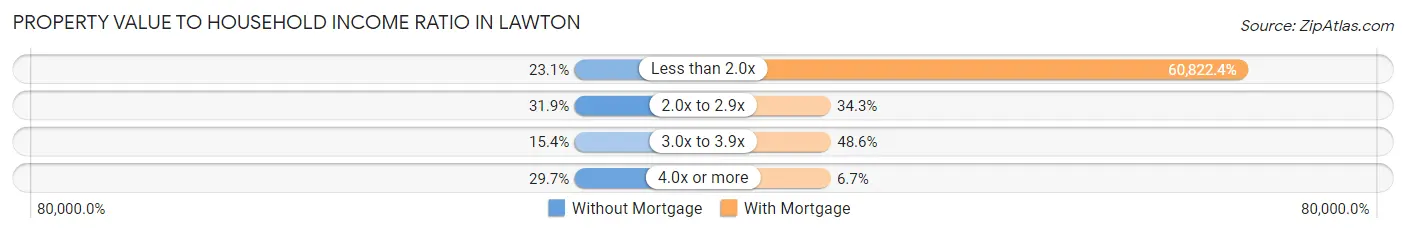
| Value-to-Income Ratio | Without Mortgage | With Mortgage |
| Less than 2.0x | 21 (23.1%) | 127,727 (60,822.4%) |
| 2.0x to 2.9x | 29 (31.9%) | 72 (34.3%) |
| 3.0x to 3.9x | 14 (15.4%) | 102 (48.6%) |
| 4.0x or more | 27 (29.7%) | 14 (6.7%) |
| Total | 91 (100.0%) | 210 (100.0%) |
Real Estate Taxes by Mortgage Status in Lawton
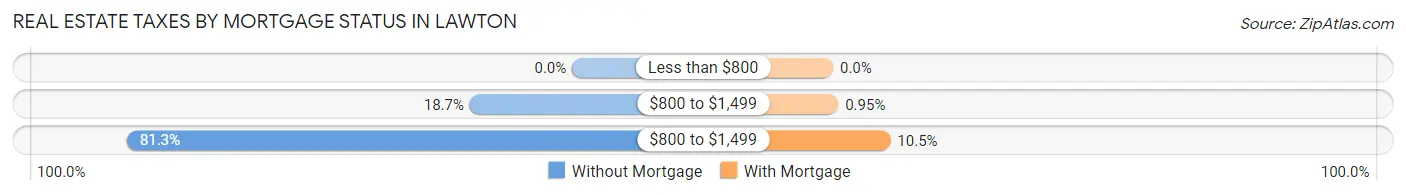
| Property Taxes | Without Mortgage | With Mortgage |
| Less than $800 | 0 (0.0%) | 0 (0.0%) |
| $800 to $1,499 | 17 (18.7%) | 2 (0.9%) |
| $800 to $1,499 | 74 (81.3%) | 22 (10.5%) |
| Total | 91 (100.0%) | 210 (100.0%) |
Health & Disability in Lawton
Health Insurance Coverage by Age in Lawton
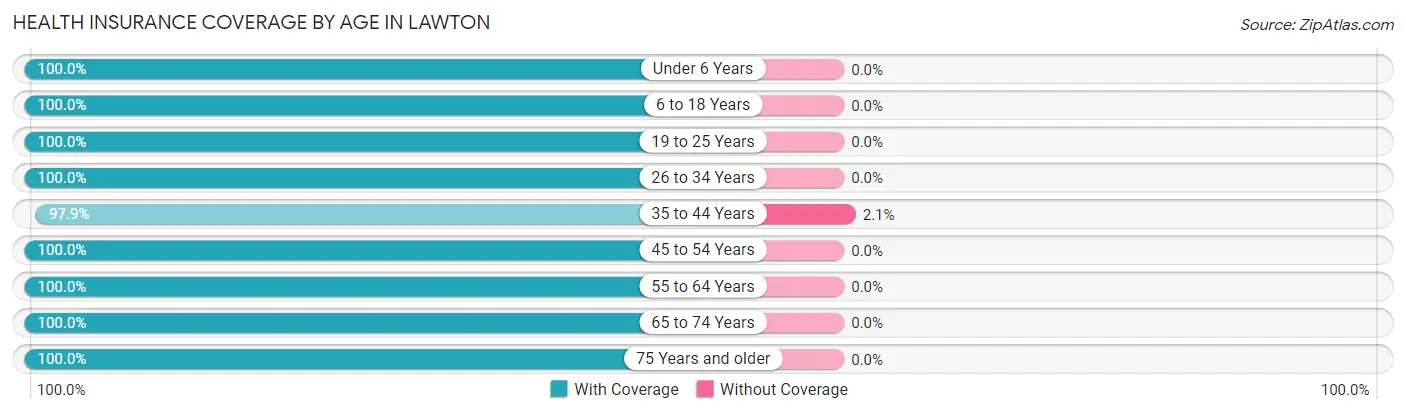
| Age Bracket | With Coverage | Without Coverage |
| Under 6 Years | 66 (100.0%) | 0 (0.0%) |
| 6 to 18 Years | 236 (100.0%) | 0 (0.0%) |
| 19 to 25 Years | 75 (100.0%) | 0 (0.0%) |
| 26 to 34 Years | 98 (100.0%) | 0 (0.0%) |
| 35 to 44 Years | 137 (97.9%) | 3 (2.1%) |
| 45 to 54 Years | 123 (100.0%) | 0 (0.0%) |
| 55 to 64 Years | 112 (100.0%) | 0 (0.0%) |
| 65 to 74 Years | 109 (100.0%) | 0 (0.0%) |
| 75 Years and older | 62 (100.0%) | 0 (0.0%) |
| Total | 1,018 (99.7%) | 3 (0.3%) |
Health Insurance Coverage by Citizenship Status in Lawton
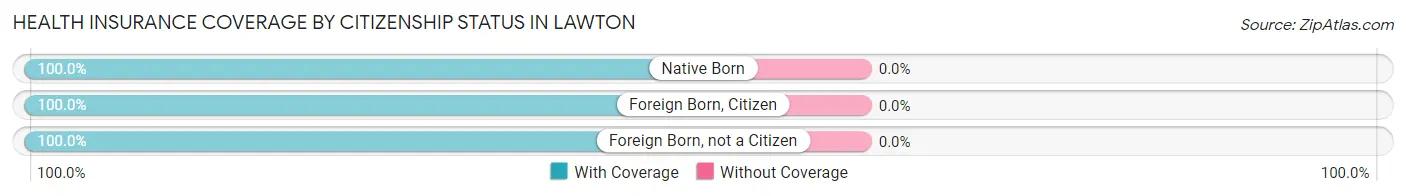
| Citizenship Status | With Coverage | Without Coverage |
| Native Born | 66 (100.0%) | 0 (0.0%) |
| Foreign Born, Citizen | 236 (100.0%) | 0 (0.0%) |
| Foreign Born, not a Citizen | 75 (100.0%) | 0 (0.0%) |
Health Insurance Coverage by Household Income in Lawton
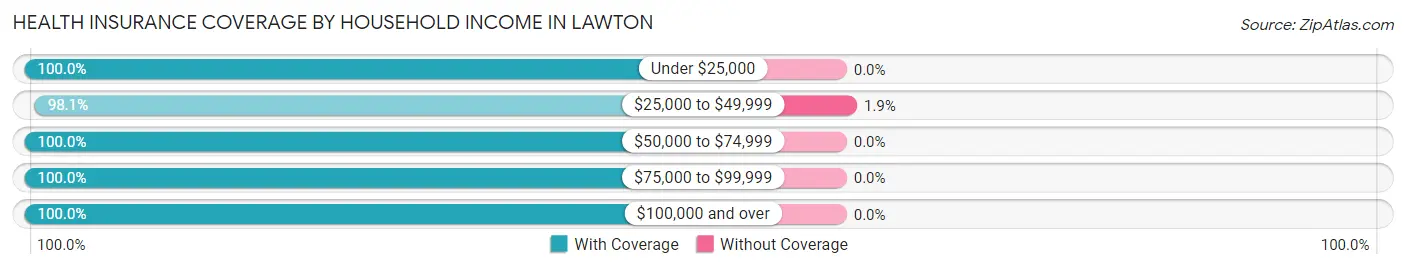
| Household Income | With Coverage | Without Coverage |
| Under $25,000 | 83 (100.0%) | 0 (0.0%) |
| $25,000 to $49,999 | 153 (98.1%) | 3 (1.9%) |
| $50,000 to $74,999 | 94 (100.0%) | 0 (0.0%) |
| $75,000 to $99,999 | 110 (100.0%) | 0 (0.0%) |
| $100,000 and over | 573 (100.0%) | 0 (0.0%) |
Public vs Private Health Insurance Coverage by Age in Lawton
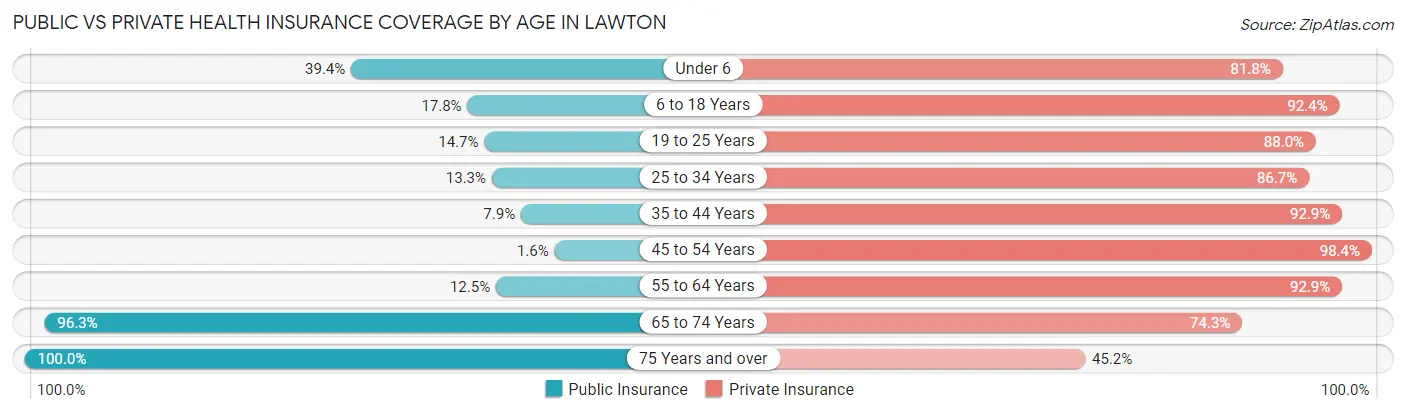
| Age Bracket | Public Insurance | Private Insurance |
| Under 6 | 26 (39.4%) | 54 (81.8%) |
| 6 to 18 Years | 42 (17.8%) | 218 (92.4%) |
| 19 to 25 Years | 11 (14.7%) | 66 (88.0%) |
| 25 to 34 Years | 13 (13.3%) | 85 (86.7%) |
| 35 to 44 Years | 11 (7.9%) | 130 (92.9%) |
| 45 to 54 Years | 2 (1.6%) | 121 (98.4%) |
| 55 to 64 Years | 14 (12.5%) | 104 (92.9%) |
| 65 to 74 Years | 105 (96.3%) | 81 (74.3%) |
| 75 Years and over | 62 (100.0%) | 28 (45.2%) |
| Total | 286 (28.0%) | 887 (86.9%) |
Disability Status by Sex by Age in Lawton
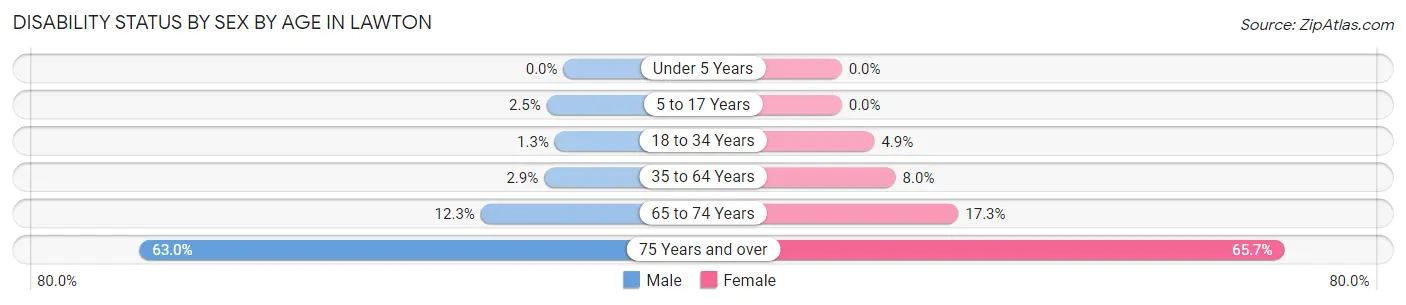
| Age Bracket | Male | Female |
| Under 5 Years | 0 (0.0%) | 0 (0.0%) |
| 5 to 17 Years | 3 (2.5%) | 0 (0.0%) |
| 18 to 34 Years | 1 (1.3%) | 5 (4.9%) |
| 35 to 64 Years | 5 (2.9%) | 16 (8.0%) |
| 65 to 74 Years | 7 (12.3%) | 9 (17.3%) |
| 75 Years and over | 17 (63.0%) | 23 (65.7%) |
Disability Class by Sex by Age in Lawton
Disability Class: Hearing Difficulty
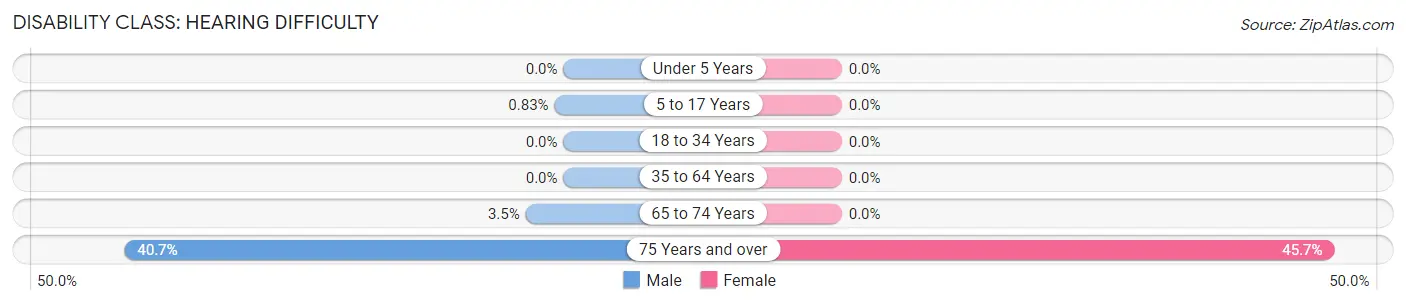
| Age Bracket | Male | Female |
| Under 5 Years | 0 (0.0%) | 0 (0.0%) |
| 5 to 17 Years | 1 (0.8%) | 0 (0.0%) |
| 18 to 34 Years | 0 (0.0%) | 0 (0.0%) |
| 35 to 64 Years | 0 (0.0%) | 0 (0.0%) |
| 65 to 74 Years | 2 (3.5%) | 0 (0.0%) |
| 75 Years and over | 11 (40.7%) | 16 (45.7%) |
Disability Class: Vision Difficulty
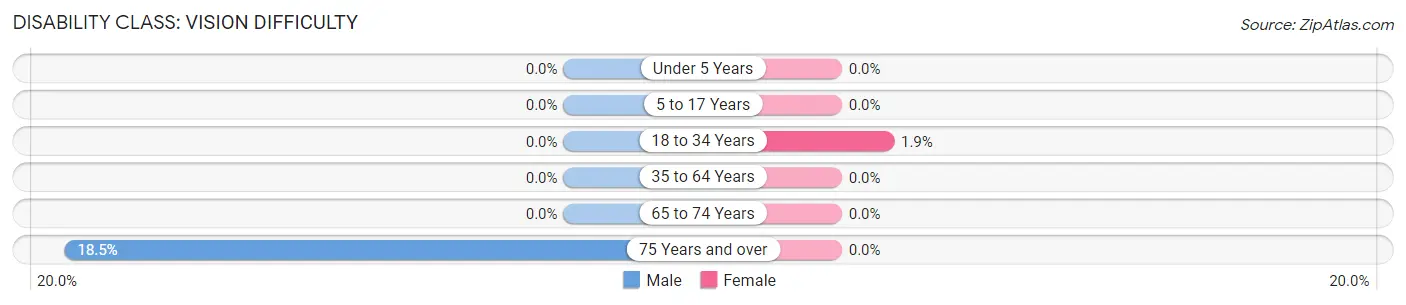
| Age Bracket | Male | Female |
| Under 5 Years | 0 (0.0%) | 0 (0.0%) |
| 5 to 17 Years | 0 (0.0%) | 0 (0.0%) |
| 18 to 34 Years | 0 (0.0%) | 2 (1.9%) |
| 35 to 64 Years | 0 (0.0%) | 0 (0.0%) |
| 65 to 74 Years | 0 (0.0%) | 0 (0.0%) |
| 75 Years and over | 5 (18.5%) | 0 (0.0%) |
Disability Class: Cognitive Difficulty
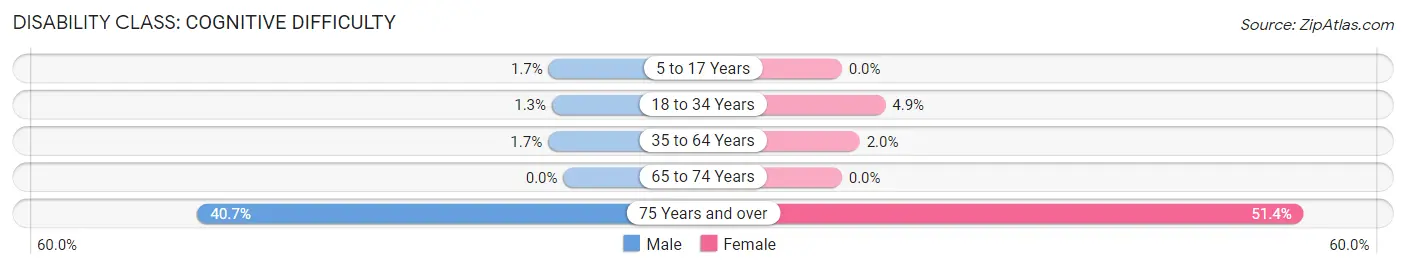
| Age Bracket | Male | Female |
| 5 to 17 Years | 2 (1.7%) | 0 (0.0%) |
| 18 to 34 Years | 1 (1.3%) | 5 (4.9%) |
| 35 to 64 Years | 3 (1.7%) | 4 (2.0%) |
| 65 to 74 Years | 0 (0.0%) | 0 (0.0%) |
| 75 Years and over | 11 (40.7%) | 18 (51.4%) |
Disability Class: Ambulatory Difficulty
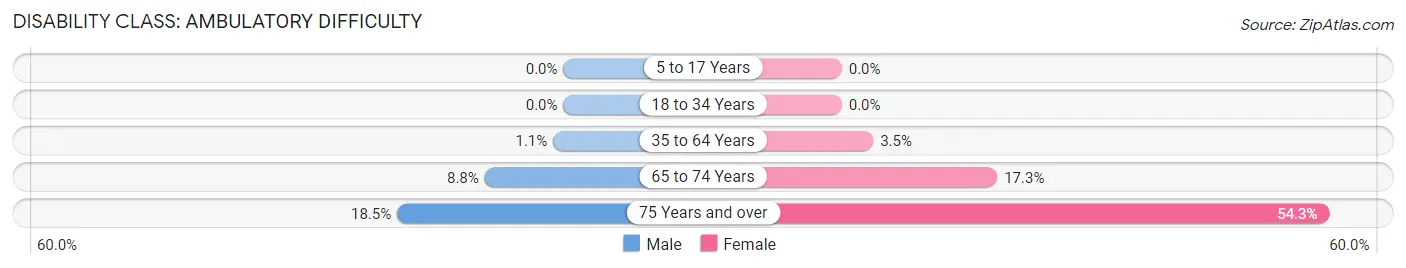
| Age Bracket | Male | Female |
| 5 to 17 Years | 0 (0.0%) | 0 (0.0%) |
| 18 to 34 Years | 0 (0.0%) | 0 (0.0%) |
| 35 to 64 Years | 2 (1.1%) | 7 (3.5%) |
| 65 to 74 Years | 5 (8.8%) | 9 (17.3%) |
| 75 Years and over | 5 (18.5%) | 19 (54.3%) |
Disability Class: Self-Care Difficulty
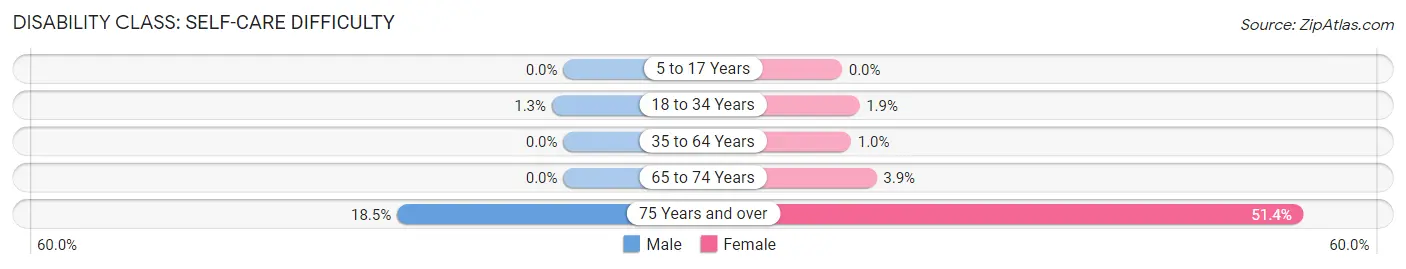
| Age Bracket | Male | Female |
| 5 to 17 Years | 0 (0.0%) | 0 (0.0%) |
| 18 to 34 Years | 1 (1.3%) | 2 (1.9%) |
| 35 to 64 Years | 0 (0.0%) | 2 (1.0%) |
| 65 to 74 Years | 0 (0.0%) | 2 (3.8%) |
| 75 Years and over | 5 (18.5%) | 18 (51.4%) |
Technology Access in Lawton
Computing Device Access in Lawton
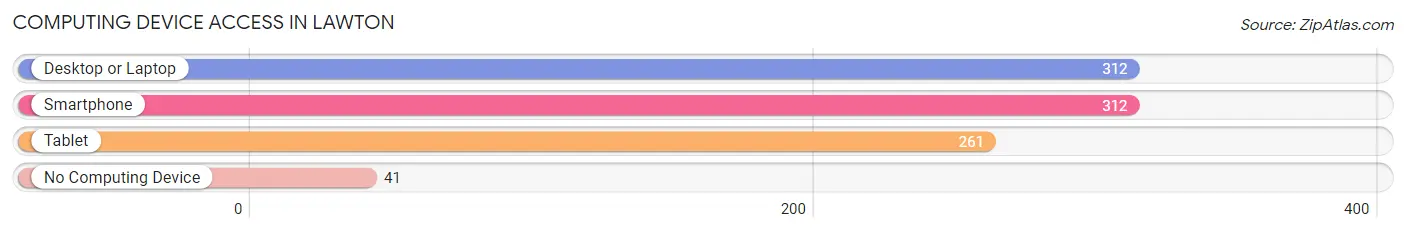
| Device Type | # Households | % Households |
| Desktop or Laptop | 312 | 82.5% |
| Smartphone | 312 | 82.5% |
| Tablet | 261 | 69.1% |
| No Computing Device | 41 | 10.8% |
| Total | 378 | 100.0% |
Internet Access in Lawton
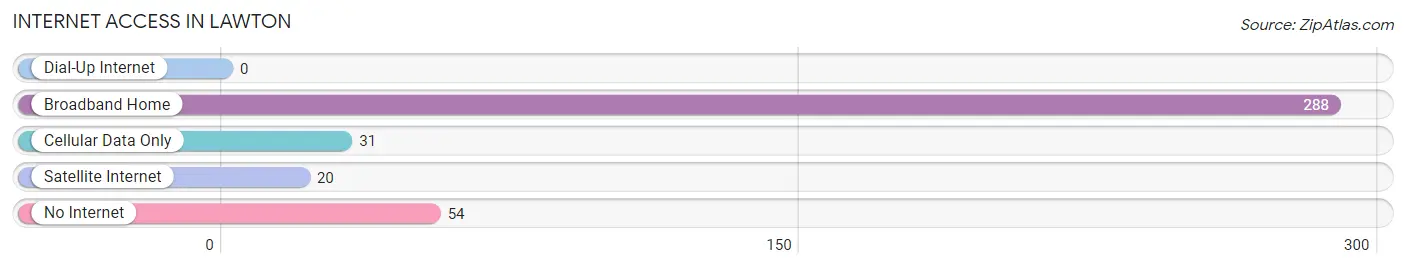
| Internet Type | # Households | % Households |
| Dial-Up Internet | 0 | 0.0% |
| Broadband Home | 288 | 76.2% |
| Cellular Data Only | 31 | 8.2% |
| Satellite Internet | 20 | 5.3% |
| No Internet | 54 | 14.3% |
| Total | 378 | 100.0% |
Lawton Summary
History
The city of Lawton, Iowa is located in Woodbury County and is part of the Sioux City metropolitan area. The city was founded in 1856 by a group of settlers from Ohio and was originally named “Lawtonville” after one of the settlers, William Lawton. The city was officially incorporated in 1876 and the name was shortened to Lawton.
The city of Lawton has a rich history of industry and agriculture. In the late 1800s, the city was home to a number of businesses, including a flour mill, a sawmill, a brickyard, and a creamery. The city also had a number of farms, which produced a variety of crops, including corn, wheat, oats, and hay.
In the early 1900s, Lawton began to experience a period of growth and development. The city was home to a number of businesses, including a bank, a hotel, a newspaper, and a variety of stores. The city also had a number of churches, schools, and other civic organizations.
In the mid-1900s, Lawton experienced a period of decline. Many of the businesses and industries that had been located in the city closed or moved away. The population of the city also began to decline, as many of the residents moved away in search of better opportunities.
Geography
Lawton is located in Woodbury County, Iowa, in the northwest corner of the state. The city is situated on the banks of the Big Sioux River, which flows through the city. The city is located approximately 10 miles south of Sioux City and is part of the Sioux City metropolitan area.
The city of Lawton has a total area of 2.2 square miles, all of which is land. The city is located at an elevation of 1,072 feet above sea level. The climate in Lawton is classified as humid continental, with hot summers and cold winters.
Economy
The economy of Lawton is largely based on agriculture and manufacturing. The city is home to a number of farms, which produce a variety of crops, including corn, wheat, oats, and hay. The city also has a number of manufacturing businesses, which produce a variety of products, including furniture, clothing, and food products.
The city is also home to a number of retail businesses, including grocery stores, restaurants, and other shops. The city also has a number of service businesses, including banks, insurance companies, and other professional services.
Demographics
As of the 2010 census, the population of Lawton was 1,845. The racial makeup of the city was 94.3% White, 0.7% African American, 0.3% Native American, 0.2% Asian, 0.1% Pacific Islander, and 4.4% from other races. The median household income in Lawton was $41,250, and the median family income was $50,000.
The city of Lawton is served by the Lawton Community School District. The district has one elementary school, one middle school, and one high school. The city is also home to a number of private schools, including a Catholic school and a Lutheran school.
Conclusion
Lawton, Iowa is a small city located in Woodbury County. The city has a rich history of industry and agriculture, and is home to a number of businesses and farms. The city has a total area of 2.2 square miles, and the population was 1,845 as of the 2010 census. The economy of Lawton is largely based on agriculture and manufacturing, and the city is served by the Lawton Community School District.
Common Questions
What is Per Capita Income in Lawton?
Per Capita income in Lawton is $34,940.
What is the Median Family Income in Lawton?
Median Family Income in Lawton is $113,021.
What is the Median Household income in Lawton?
Median Household Income in Lawton is $86,607.
What is Income or Wage Gap in Lawton?
Income or Wage Gap in Lawton is 36.3%.
Women in Lawton earn 63.7 cents for every dollar earned by a man.
What is Family Income Deficit in Lawton?
Family Income Deficit in Lawton is $9,307.
Families that are below poverty line in Lawton earn $9,307 less on average than the poverty threshold level.
What is Inequality or Gini Index in Lawton?
Inequality or Gini Index in Lawton is 0.36.
What is the Total Population of Lawton?
Total Population of Lawton is 1,021.
What is the Total Male Population of Lawton?
Total Male Population of Lawton is 484.
What is the Total Female Population of Lawton?
Total Female Population of Lawton is 537.
What is the Ratio of Males per 100 Females in Lawton?
There are 90.13 Males per 100 Females in Lawton.
What is the Ratio of Females per 100 Males in Lawton?
There are 110.95 Females per 100 Males in Lawton.
What is the Median Population Age in Lawton?
Median Population Age in Lawton is 37.3 Years.
What is the Average Family Size in Lawton
Average Family Size in Lawton is 3.2 People.
What is the Average Household Size in Lawton
Average Household Size in Lawton is 2.7 People.
How Large is the Labor Force in Lawton?
There are 563 People in the Labor Forcein in Lawton.
What is the Percentage of People in the Labor Force in Lawton?
72.5% of People are in the Labor Force in Lawton.
What is the Unemployment Rate in Lawton?
Unemployment Rate in Lawton is 1.8%.