Florala, AL Map & Demographics
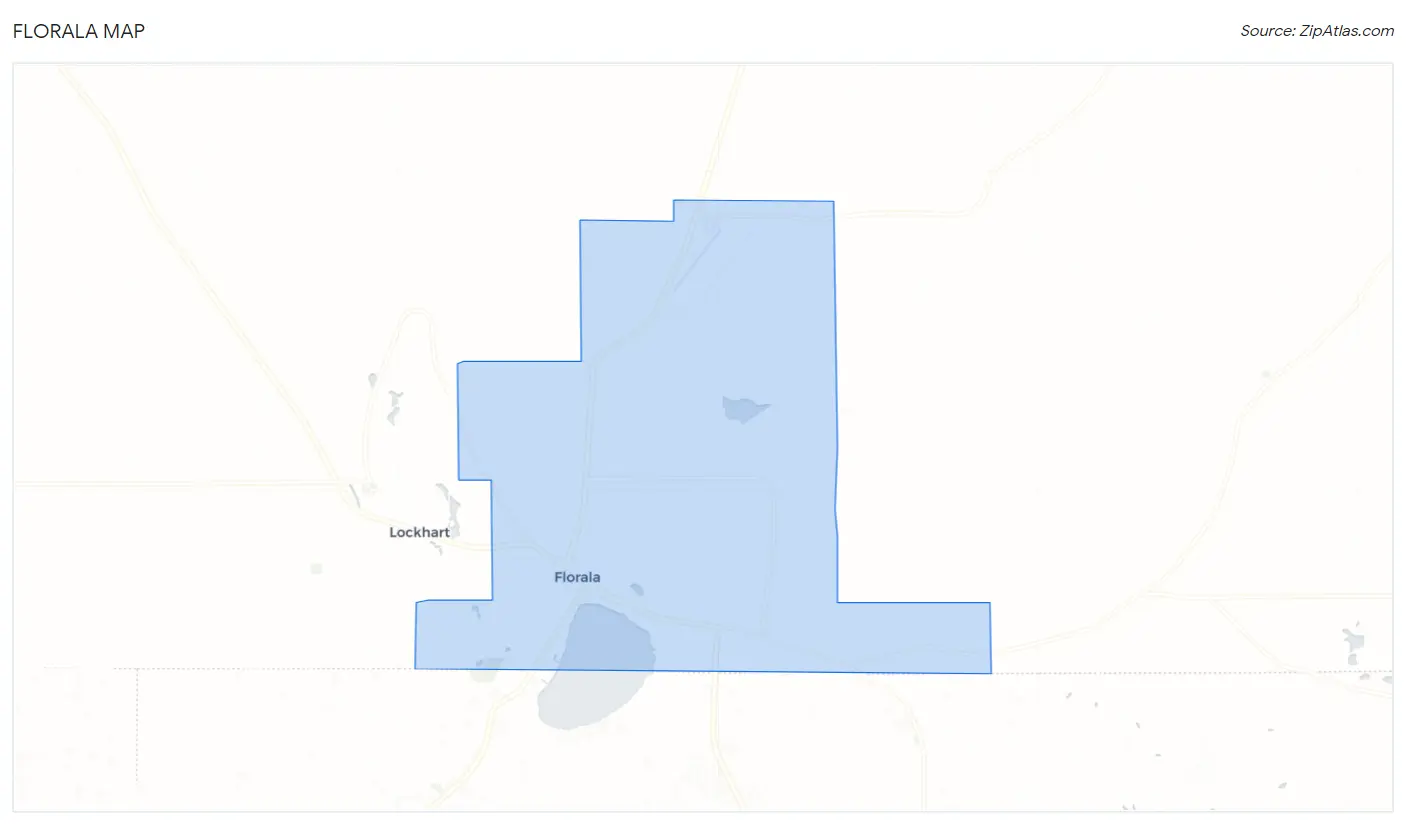
Florala Map
Florala Overview
$24,824
PER CAPITA INCOME
$64,833
AVG FAMILY INCOME
$30,313
AVG HOUSEHOLD INCOME
37.8%
WAGE / INCOME GAP [ % ]
62.2¢/ $1
WAGE / INCOME GAP [ $ ]
0.58
INEQUALITY / GINI INDEX
1,745
TOTAL POPULATION
860
MALE POPULATION
885
FEMALE POPULATION
97.18
MALES / 100 FEMALES
102.91
FEMALES / 100 MALES
53.1
MEDIAN AGE
4.0
AVG FAMILY SIZE
2.5
AVG HOUSEHOLD SIZE
634
LABOR FORCE [ PEOPLE ]
41.8%
PERCENT IN LABOR FORCE
2.6%
UNEMPLOYMENT RATE
Florala Zip Codes
Florala Area Codes
Income in Florala
Income Overview in Florala
Per Capita Income in Florala is $24,824, while median incomes of families and households are $64,833 and $30,313 respectively.
| Characteristic | Number | Measure |
| Per Capita Income | 1,745 | $24,824 |
| Median Family Income | 292 | $64,833 |
| Mean Family Income | 292 | $61,495 |
| Median Household Income | 667 | $30,313 |
| Mean Household Income | 667 | $54,652 |
| Income Deficit | 292 | $0 |
| Wage / Income Gap (%) | 1,745 | 37.83% |
| Wage / Income Gap ($) | 1,745 | 62.17¢ per $1 |
| Gini / Inequality Index | 1,745 | 0.58 |
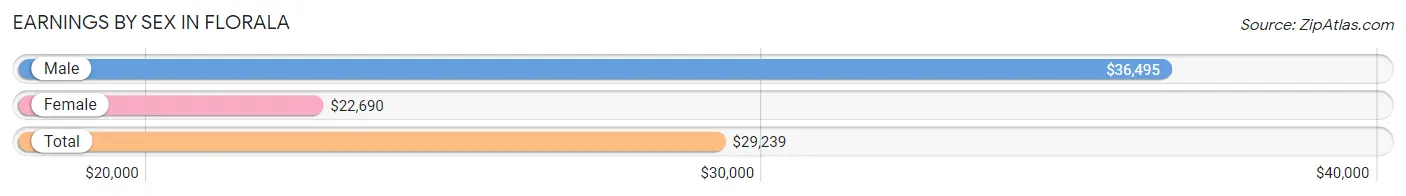
Earnings by Sex in Florala
Average Earnings in Florala are $29,239, $36,495 for men and $22,690 for women, a difference of 37.8%.
| Sex | Number | Average Earnings |
| Male | 377 (58.7%) | $36,495 |
| Female | 265 (41.3%) | $22,690 |
| Total | 642 (100.0%) | $29,239 |
Earnings by Sex by Income Bracket in Florala
The most common earnings brackets in Florala are $50,000 to $54,999 for men (91 | 24.1%) and $22,500 to $24,999 for women (46 | 17.4%).
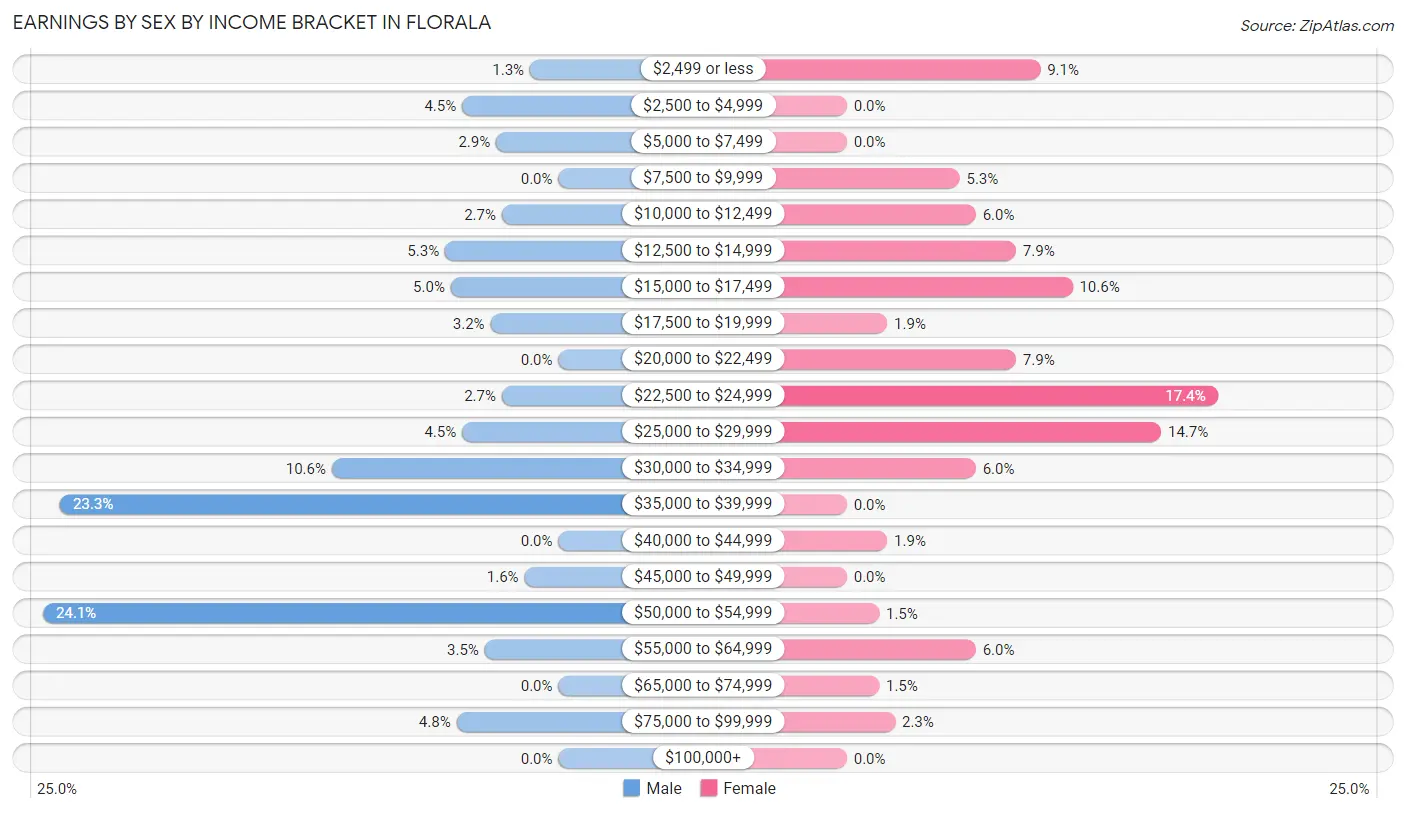
| Income | Male | Female |
| $2,499 or less | 5 (1.3%) | 24 (9.1%) |
| $2,500 to $4,999 | 17 (4.5%) | 0 (0.0%) |
| $5,000 to $7,499 | 11 (2.9%) | 0 (0.0%) |
| $7,500 to $9,999 | 0 (0.0%) | 14 (5.3%) |
| $10,000 to $12,499 | 10 (2.6%) | 16 (6.0%) |
| $12,500 to $14,999 | 20 (5.3%) | 21 (7.9%) |
| $15,000 to $17,499 | 19 (5.0%) | 28 (10.6%) |
| $17,500 to $19,999 | 12 (3.2%) | 5 (1.9%) |
| $20,000 to $22,499 | 0 (0.0%) | 21 (7.9%) |
| $22,500 to $24,999 | 10 (2.6%) | 46 (17.4%) |
| $25,000 to $29,999 | 17 (4.5%) | 39 (14.7%) |
| $30,000 to $34,999 | 40 (10.6%) | 16 (6.0%) |
| $35,000 to $39,999 | 88 (23.3%) | 0 (0.0%) |
| $40,000 to $44,999 | 0 (0.0%) | 5 (1.9%) |
| $45,000 to $49,999 | 6 (1.6%) | 0 (0.0%) |
| $50,000 to $54,999 | 91 (24.1%) | 4 (1.5%) |
| $55,000 to $64,999 | 13 (3.5%) | 16 (6.0%) |
| $65,000 to $74,999 | 0 (0.0%) | 4 (1.5%) |
| $75,000 to $99,999 | 18 (4.8%) | 6 (2.3%) |
| $100,000+ | 0 (0.0%) | 0 (0.0%) |
| Total | 377 (100.0%) | 265 (100.0%) |
Earnings by Sex by Educational Attainment in Florala
Average earnings in Florala are $37,255 for men and $23,288 for women, a difference of 37.5%. Men with an educational attainment of college or associate's degree enjoy the highest average annual earnings of $49,167, while those with less than high school education earn the least with $27,917. Women with an educational attainment of high school diploma earn the most with the average annual earnings of $23,681, while those with college or associate's degree education have the smallest earnings of $23,375.
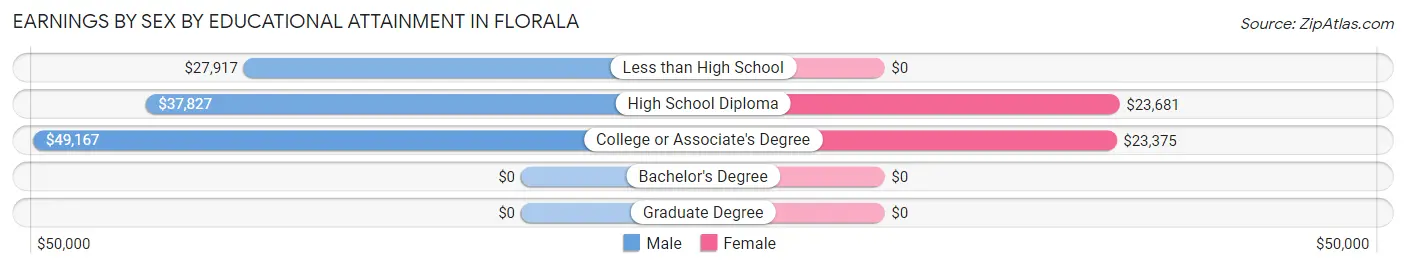
| Educational Attainment | Male Income | Female Income |
| Less than High School | $27,917 | $0 |
| High School Diploma | $37,827 | $23,681 |
| College or Associate's Degree | $49,167 | $23,375 |
| Bachelor's Degree | - | - |
| Graduate Degree | - | - |
| Total | $37,255 | $23,288 |
Family Income in Florala
Family Income Brackets in Florala
According to the Florala family income data, there are 92 families falling into the $75,000 to $99,999 income range, which is the most common income bracket and makes up 31.5% of all families.
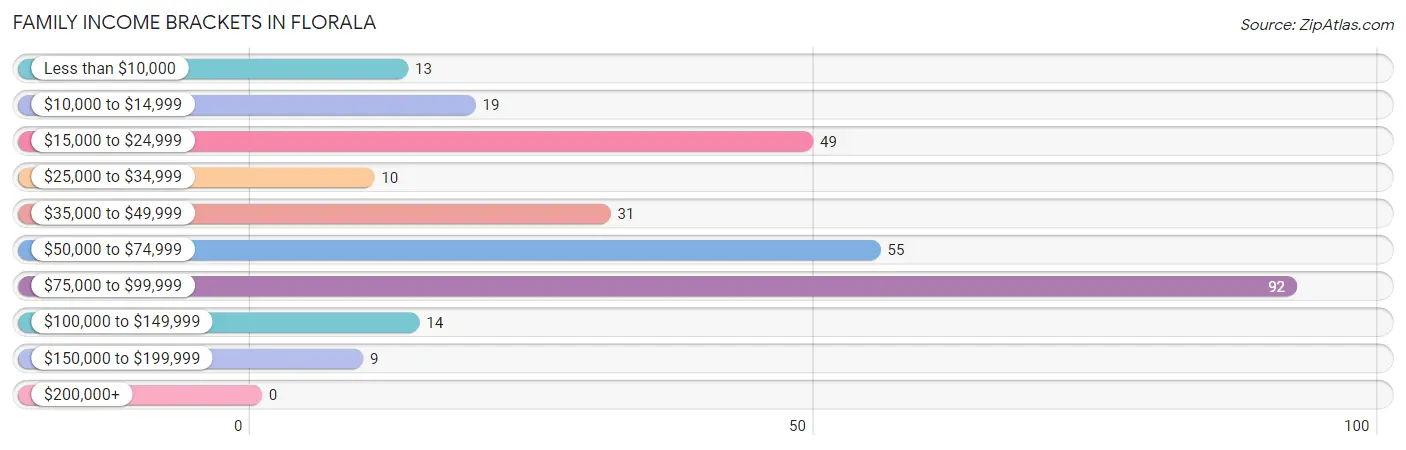
| Income Bracket | # Families | % Families |
| Less than $10,000 | 13 | 4.5% |
| $10,000 to $14,999 | 19 | 6.5% |
| $15,000 to $24,999 | 49 | 16.8% |
| $25,000 to $34,999 | 10 | 3.4% |
| $35,000 to $49,999 | 31 | 10.6% |
| $50,000 to $74,999 | 55 | 18.8% |
| $75,000 to $99,999 | 92 | 31.5% |
| $100,000 to $149,999 | 14 | 4.8% |
| $150,000 to $199,999 | 9 | 3.1% |
| $200,000+ | 0 | 0.0% |
Family Income by Famaliy Size in Florala
5-person families (81 | 27.7%) account for the highest median family income in Florala with $97,669 per family, while 2-person families (147 | 50.3%) have the highest median income of $21,914 per family member.
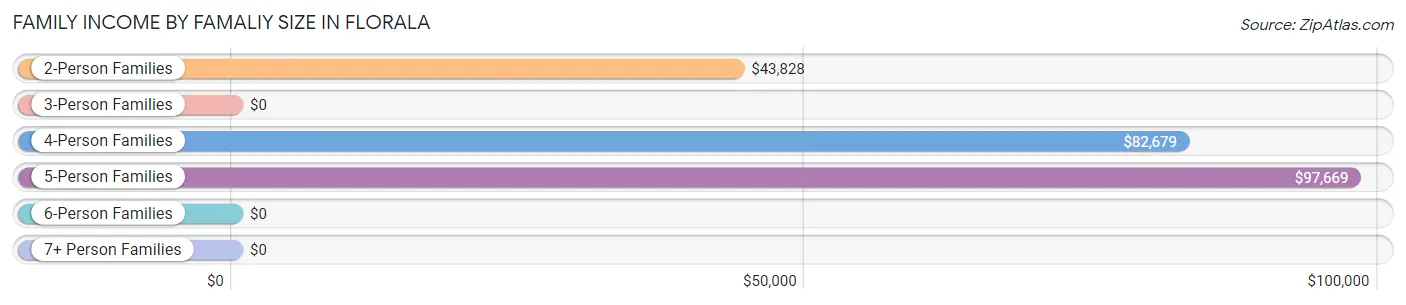
| Income Bracket | # Families | Median Income |
| 2-Person Families | 147 (50.3%) | $43,828 |
| 3-Person Families | 41 (14.0%) | $0 |
| 4-Person Families | 23 (7.9%) | $82,679 |
| 5-Person Families | 81 (27.7%) | $97,669 |
| 6-Person Families | 0 (0.0%) | $0 |
| 7+ Person Families | 0 (0.0%) | $0 |
| Total | 292 (100.0%) | $64,833 |
Family Income by Number of Earners in Florala
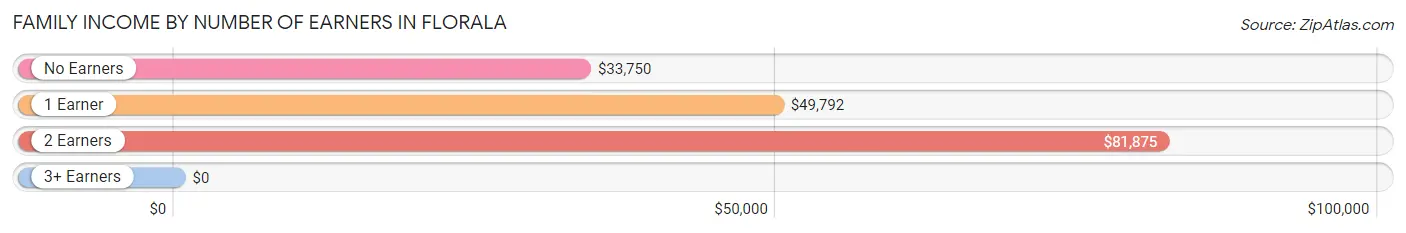
| Number of Earners | # Families | Median Income |
| No Earners | 96 (32.9%) | $33,750 |
| 1 Earner | 73 (25.0%) | $49,792 |
| 2 Earners | 98 (33.6%) | $81,875 |
| 3+ Earners | 25 (8.6%) | $0 |
| Total | 292 (100.0%) | $64,833 |
Household Income in Florala
Household Income Brackets in Florala
With 152 households falling in the category, the $10,000 to $14,999 income range is the most frequent in Florala, accounting for 22.8% of all households. In contrast, only 9 households (1.3%) fall into the $150,000 to $199,999 income bracket, making it the least populous group.
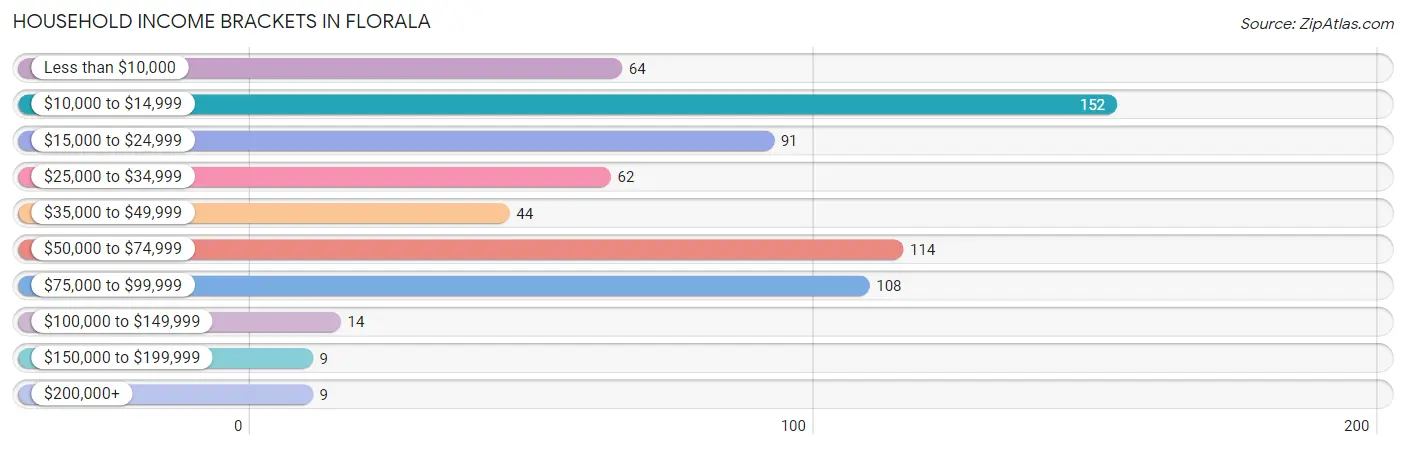
| Income Bracket | # Households | % Households |
| Less than $10,000 | 64 | 9.6% |
| $10,000 to $14,999 | 152 | 22.8% |
| $15,000 to $24,999 | 91 | 13.6% |
| $25,000 to $34,999 | 62 | 9.3% |
| $35,000 to $49,999 | 44 | 6.6% |
| $50,000 to $74,999 | 114 | 17.1% |
| $75,000 to $99,999 | 108 | 16.2% |
| $100,000 to $149,999 | 14 | 2.1% |
| $150,000 to $199,999 | 9 | 1.3% |
| $200,000+ | 9 | 1.3% |
Household Income by Householder Age in Florala
The median household income in Florala is $30,313, with the highest median household income of $43,875 found in the 45 to 64 years age bracket for the primary householder. A total of 291 households (43.6%) fall into this category. Meanwhile, the 15 to 24 years age bracket for the primary householder has the lowest median household income of $0, with 6 households (0.9%) in this group.
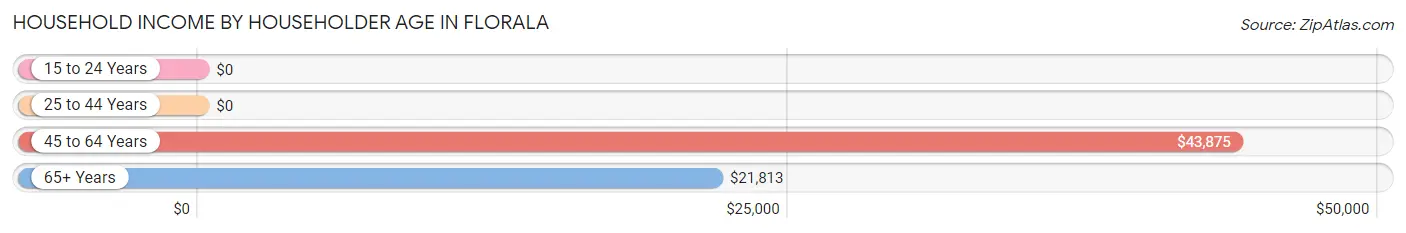
| Income Bracket | # Households | Median Income |
| 15 to 24 Years | 6 (0.9%) | $0 |
| 25 to 44 Years | 97 (14.5%) | $0 |
| 45 to 64 Years | 291 (43.6%) | $43,875 |
| 65+ Years | 273 (40.9%) | $21,813 |
| Total | 667 (100.0%) | $30,313 |
Poverty in Florala
Income Below Poverty by Sex and Age in Florala
With 29.7% poverty level for males and 32.4% for females among the residents of Florala, 75 year old and over males and 5 year old females are the most vulnerable to poverty, with 74 males (56.9%) and 16 females (100.0%) in their respective age groups living below the poverty level.
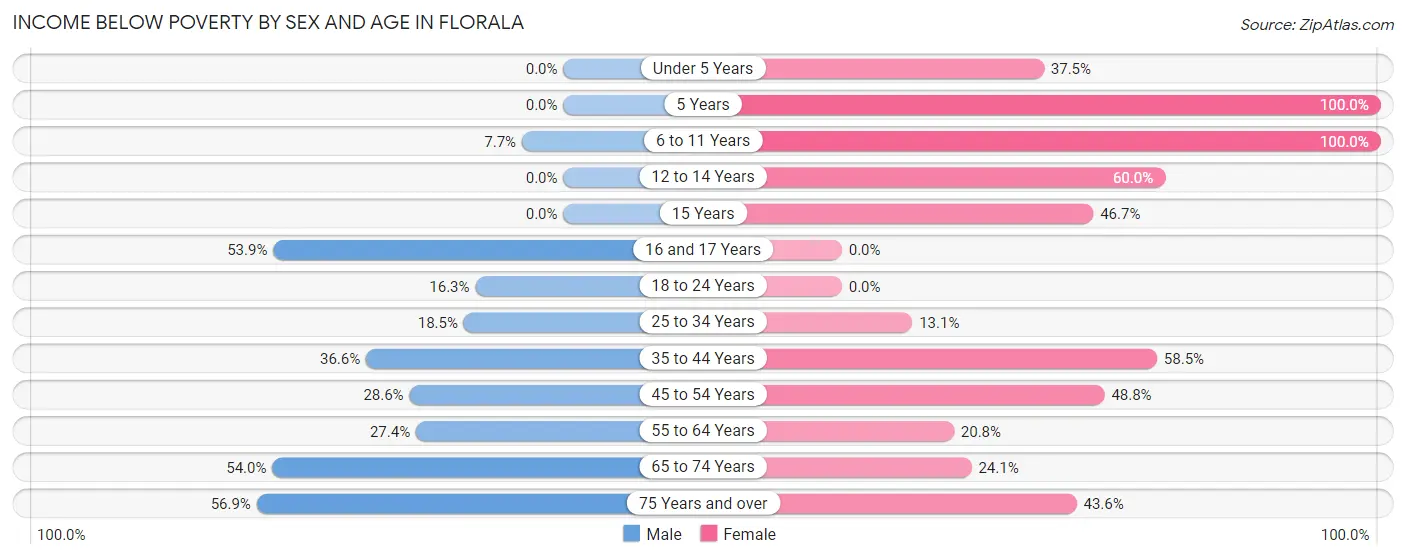
| Age Bracket | Male | Female |
| Under 5 Years | 0 (0.0%) | 6 (37.5%) |
| 5 Years | 0 (0.0%) | 16 (100.0%) |
| 6 to 11 Years | 7 (7.7%) | 19 (100.0%) |
| 12 to 14 Years | 0 (0.0%) | 15 (60.0%) |
| 15 Years | 0 (0.0%) | 7 (46.7%) |
| 16 and 17 Years | 7 (53.8%) | 0 (0.0%) |
| 18 to 24 Years | 8 (16.3%) | 0 (0.0%) |
| 25 to 34 Years | 34 (18.5%) | 17 (13.1%) |
| 35 to 44 Years | 26 (36.6%) | 31 (58.5%) |
| 45 to 54 Years | 18 (28.6%) | 39 (48.7%) |
| 55 to 64 Years | 32 (27.4%) | 47 (20.8%) |
| 65 to 74 Years | 47 (54.0%) | 26 (24.1%) |
| 75 Years and over | 74 (56.9%) | 61 (43.6%) |
| Total | 253 (29.7%) | 284 (32.4%) |
Income Above Poverty by Sex and Age in Florala
According to the poverty statistics in Florala, males aged under 5 years and females aged 16 and 17 years are the age groups that are most secure financially, with 100.0% of males and 100.0% of females in these age groups living above the poverty line.
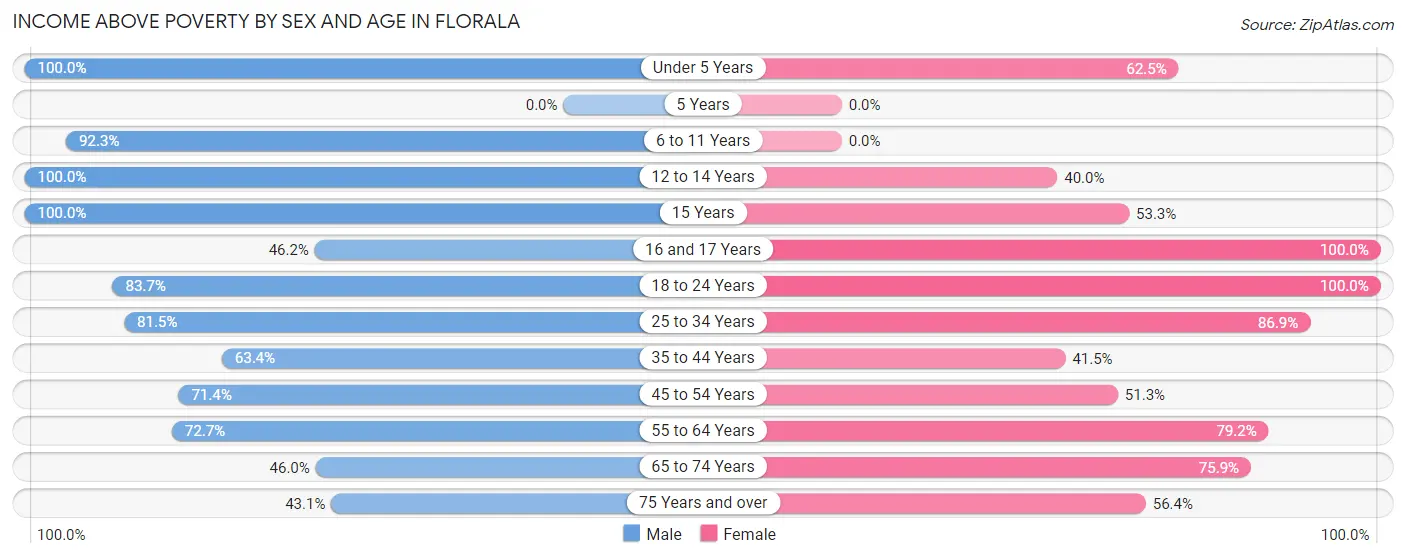
| Age Bracket | Male | Female |
| Under 5 Years | 33 (100.0%) | 10 (62.5%) |
| 5 Years | 0 (0.0%) | 0 (0.0%) |
| 6 to 11 Years | 84 (92.3%) | 0 (0.0%) |
| 12 to 14 Years | 7 (100.0%) | 10 (40.0%) |
| 15 Years | 7 (100.0%) | 8 (53.3%) |
| 16 and 17 Years | 6 (46.2%) | 10 (100.0%) |
| 18 to 24 Years | 41 (83.7%) | 38 (100.0%) |
| 25 to 34 Years | 150 (81.5%) | 113 (86.9%) |
| 35 to 44 Years | 45 (63.4%) | 22 (41.5%) |
| 45 to 54 Years | 45 (71.4%) | 41 (51.2%) |
| 55 to 64 Years | 85 (72.7%) | 179 (79.2%) |
| 65 to 74 Years | 40 (46.0%) | 82 (75.9%) |
| 75 Years and over | 56 (43.1%) | 79 (56.4%) |
| Total | 599 (70.3%) | 592 (67.6%) |
Income Below Poverty Among Married-Couple Families in Florala
The poverty statistics for married-couple families in Florala show that 8.4% or 13 of the total 154 families live below the poverty line. Families with 3 or 4 children have the highest poverty rate of 100.0%, comprising of 8 families. On the other hand, families with 1 or 2 children have the lowest poverty rate of 0.0%, which includes 0 families.
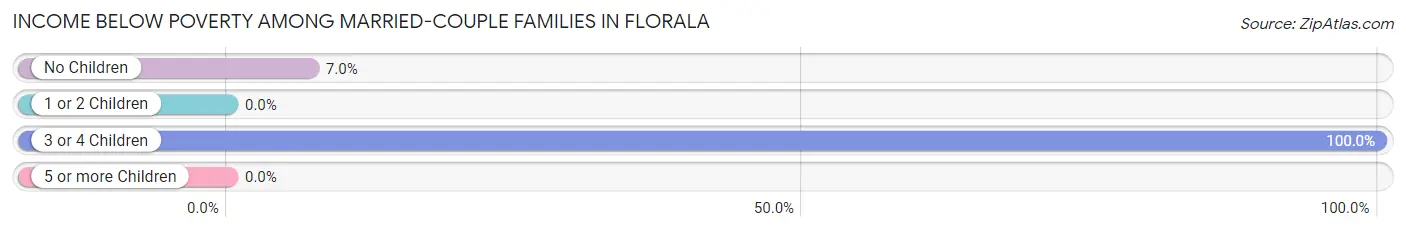
| Children | Above Poverty | Below Poverty |
| No Children | 66 (93.0%) | 5 (7.0%) |
| 1 or 2 Children | 75 (100.0%) | 0 (0.0%) |
| 3 or 4 Children | 0 (0.0%) | 8 (100.0%) |
| 5 or more Children | 0 (0.0%) | 0 (0.0%) |
| Total | 141 (91.6%) | 13 (8.4%) |
Income Below Poverty Among Single-Parent Households in Florala
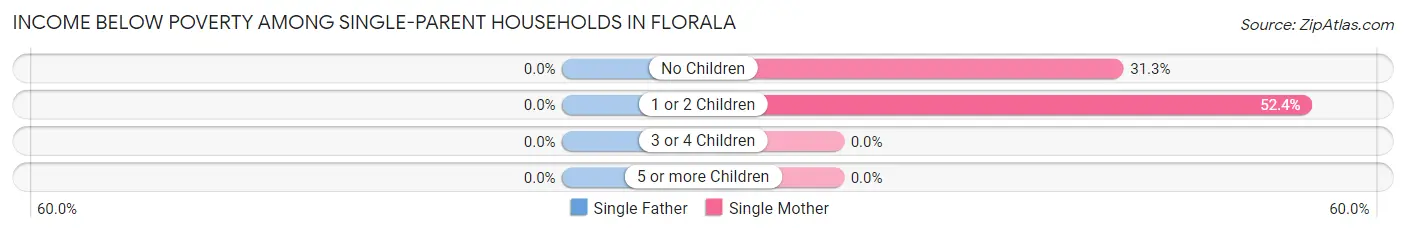
| Children | Single Father | Single Mother |
| No Children | 0 (0.0%) | 20 (31.2%) |
| 1 or 2 Children | 0 (0.0%) | 33 (52.4%) |
| 3 or 4 Children | 0 (0.0%) | 0 (0.0%) |
| 5 or more Children | 0 (0.0%) | 0 (0.0%) |
| Total | 0 (0.0%) | 53 (41.7%) |
Income Below Poverty Among Married-Couple vs Single-Parent Households in Florala
The poverty data for Florala shows that 13 of the married-couple family households (8.4%) and 53 of the single-parent households (38.4%) are living below the poverty level. Within the married-couple family households, those with 3 or 4 children have the highest poverty rate, with 8 households (100.0%) falling below the poverty line. Among the single-parent households, those with 1 or 2 children have the highest poverty rate, with 33 household (52.4%) living below poverty.
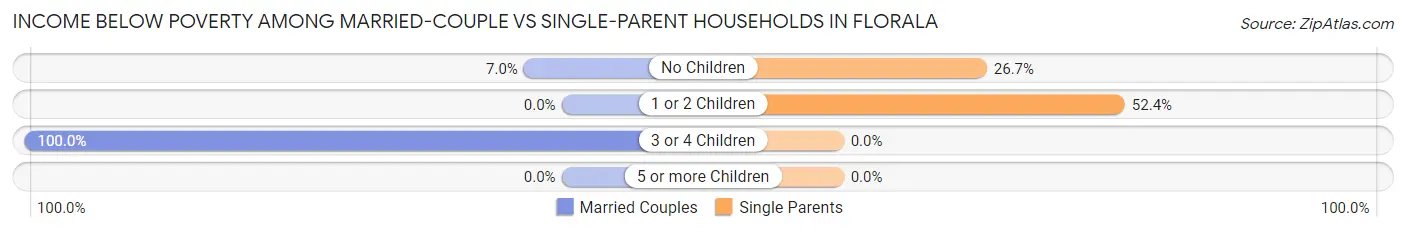
| Children | Married-Couple Families | Single-Parent Households |
| No Children | 5 (7.0%) | 20 (26.7%) |
| 1 or 2 Children | 0 (0.0%) | 33 (52.4%) |
| 3 or 4 Children | 8 (100.0%) | 0 (0.0%) |
| 5 or more Children | 0 (0.0%) | 0 (0.0%) |
| Total | 13 (8.4%) | 53 (38.4%) |
Race in Florala
The most populous races in Florala are White / Caucasian (1,230 | 70.5%), Black / African American (459 | 26.3%), and Two or more Races (39 | 2.2%).
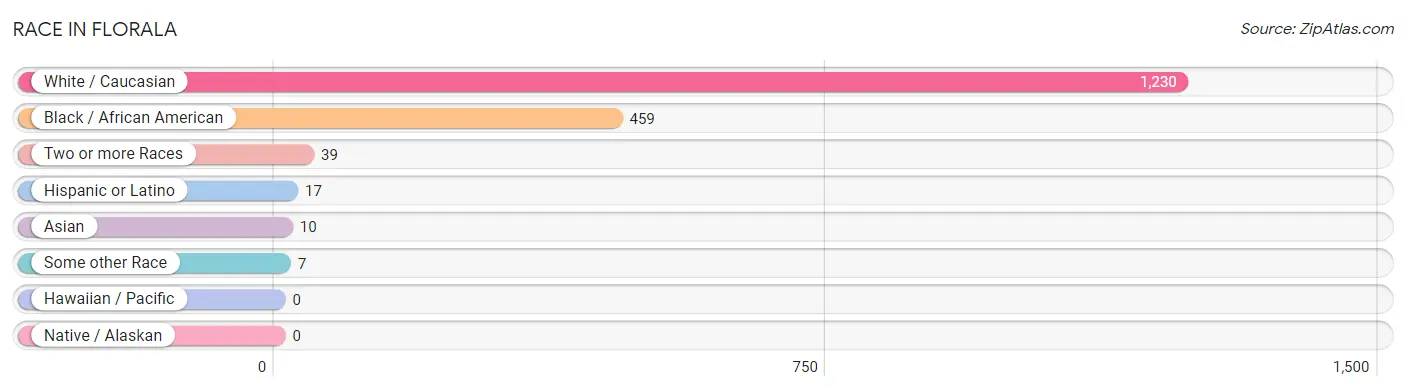
| Race | # Population | % Population |
| Asian | 10 | 0.6% |
| Black / African American | 459 | 26.3% |
| Hawaiian / Pacific | 0 | 0.0% |
| Hispanic or Latino | 17 | 1.0% |
| Native / Alaskan | 0 | 0.0% |
| White / Caucasian | 1,230 | 70.5% |
| Two or more Races | 39 | 2.2% |
| Some other Race | 7 | 0.4% |
| Total | 1,745 | 100.0% |
Ancestry in Florala
The most populous ancestries reported in Florala are American (437 | 25.0%), Irish (126 | 7.2%), English (42 | 2.4%), Scotch-Irish (26 | 1.5%), and Cherokee (24 | 1.4%), together accounting for 37.5% of all Florala residents.
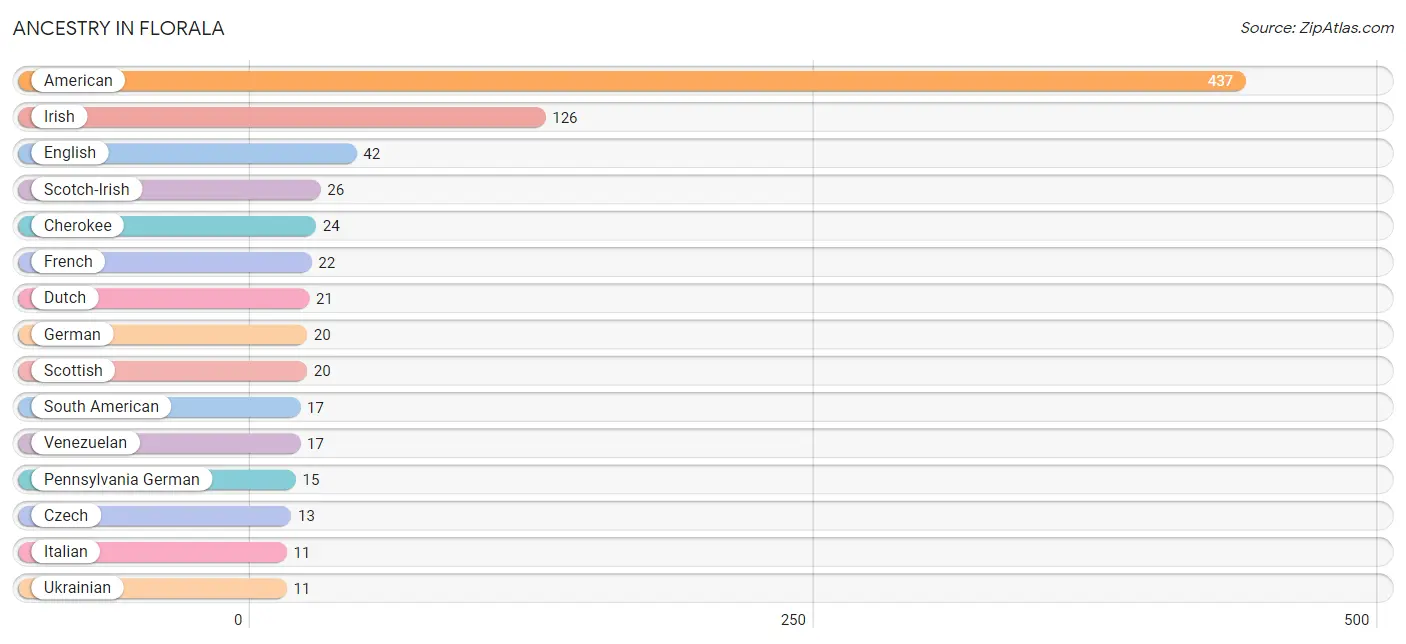
| Ancestry | # Population | % Population |
| American | 437 | 25.0% |
| Cherokee | 24 | 1.4% |
| Czech | 13 | 0.7% |
| Dutch | 21 | 1.2% |
| English | 42 | 2.4% |
| French | 22 | 1.3% |
| German | 20 | 1.1% |
| Irish | 126 | 7.2% |
| Italian | 11 | 0.6% |
| Korean | 10 | 0.6% |
| Pennsylvania German | 15 | 0.9% |
| Scotch-Irish | 26 | 1.5% |
| Scottish | 20 | 1.1% |
| South American | 17 | 1.0% |
| Ukrainian | 11 | 0.6% |
| Venezuelan | 17 | 1.0% | View All 16 Rows |
Immigrants in Florala
The most numerous immigrant groups reported in Florala came from Asia (10 | 0.6%), Philippines (10 | 0.6%), South Eastern Asia (10 | 0.6%), Latin America (7 | 0.4%), and South America (7 | 0.4%), together accounting for 2.5% of all Florala residents.
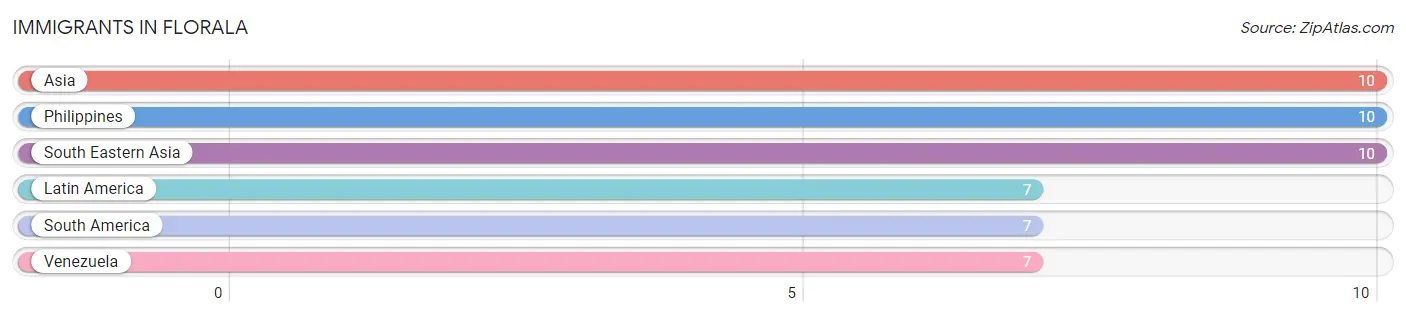
| Immigration Origin | # Population | % Population |
| Asia | 10 | 0.6% |
| Latin America | 7 | 0.4% |
| Philippines | 10 | 0.6% |
| South America | 7 | 0.4% |
| South Eastern Asia | 10 | 0.6% |
| Venezuela | 7 | 0.4% | View All 6 Rows |
Sex and Age in Florala
Sex and Age in Florala
The most populous age groups in Florala are 30 to 34 Years (158 | 18.4%) for men and 55 to 59 Years (176 | 19.9%) for women.
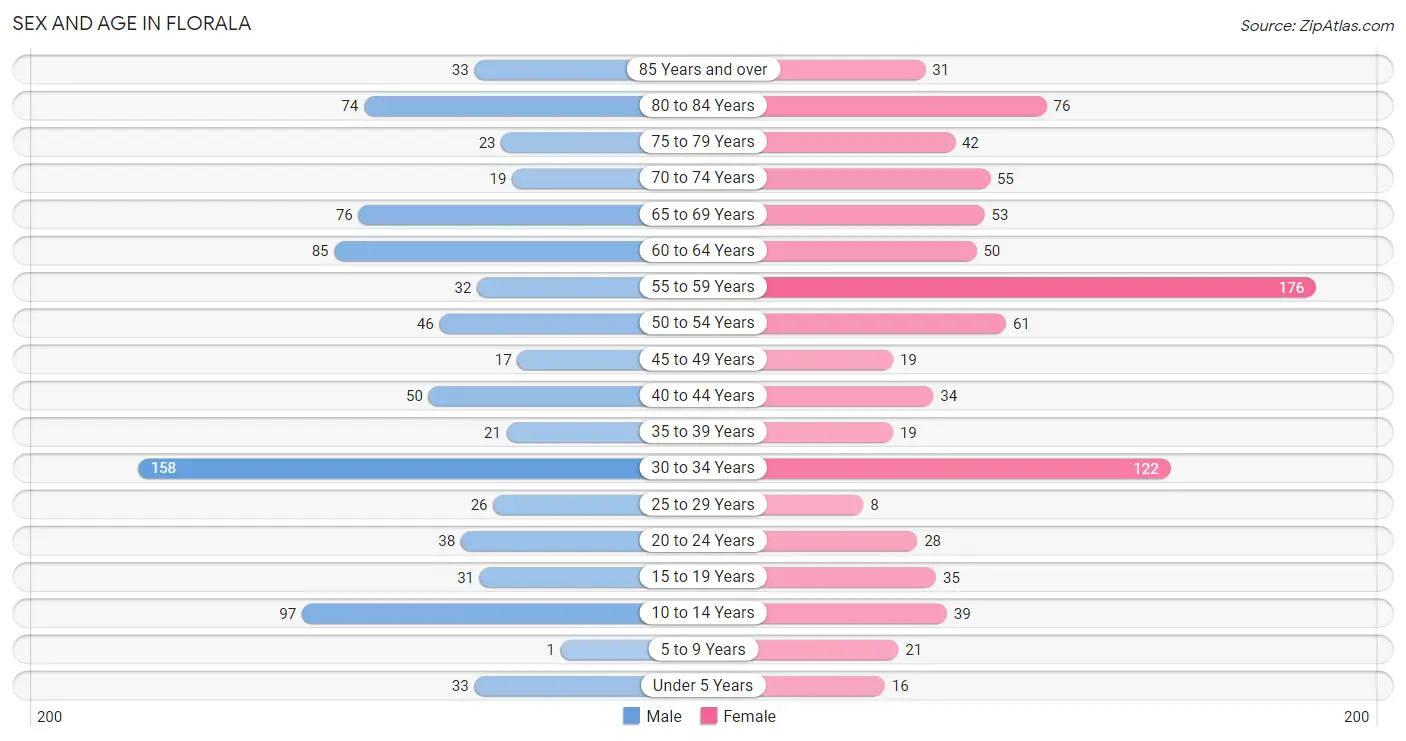
| Age Bracket | Male | Female |
| Under 5 Years | 33 (3.8%) | 16 (1.8%) |
| 5 to 9 Years | 1 (0.1%) | 21 (2.4%) |
| 10 to 14 Years | 97 (11.3%) | 39 (4.4%) |
| 15 to 19 Years | 31 (3.6%) | 35 (4.0%) |
| 20 to 24 Years | 38 (4.4%) | 28 (3.2%) |
| 25 to 29 Years | 26 (3.0%) | 8 (0.9%) |
| 30 to 34 Years | 158 (18.4%) | 122 (13.8%) |
| 35 to 39 Years | 21 (2.4%) | 19 (2.1%) |
| 40 to 44 Years | 50 (5.8%) | 34 (3.8%) |
| 45 to 49 Years | 17 (2.0%) | 19 (2.1%) |
| 50 to 54 Years | 46 (5.3%) | 61 (6.9%) |
| 55 to 59 Years | 32 (3.7%) | 176 (19.9%) |
| 60 to 64 Years | 85 (9.9%) | 50 (5.7%) |
| 65 to 69 Years | 76 (8.8%) | 53 (6.0%) |
| 70 to 74 Years | 19 (2.2%) | 55 (6.2%) |
| 75 to 79 Years | 23 (2.7%) | 42 (4.8%) |
| 80 to 84 Years | 74 (8.6%) | 76 (8.6%) |
| 85 Years and over | 33 (3.8%) | 31 (3.5%) |
| Total | 860 (100.0%) | 885 (100.0%) |
Families and Households in Florala
Median Family Size in Florala
The median family size in Florala is 3.97 persons per family, with single female/mother families (127 | 43.5%) accounting for the largest median family size of 4.24 persons per family. On the other hand, single male/father families (11 | 3.8%) represent the smallest median family size with 1.91 persons per family.
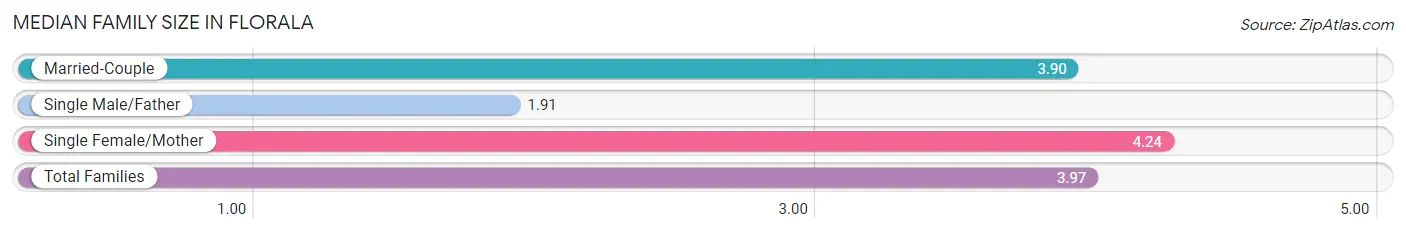
| Family Type | # Families | Family Size |
| Married-Couple | 154 (52.7%) | 3.90 |
| Single Male/Father | 11 (3.8%) | 1.91 |
| Single Female/Mother | 127 (43.5%) | 4.24 |
| Total Families | 292 (100.0%) | 3.97 |
Median Household Size in Florala
The median household size in Florala is 2.49 persons per household, with single female/mother households (127 | 19.0%) accounting for the largest median household size of 4.39 persons per household. non-family households (375 | 56.2%) represent the smallest median household size with 1.26 persons per household.
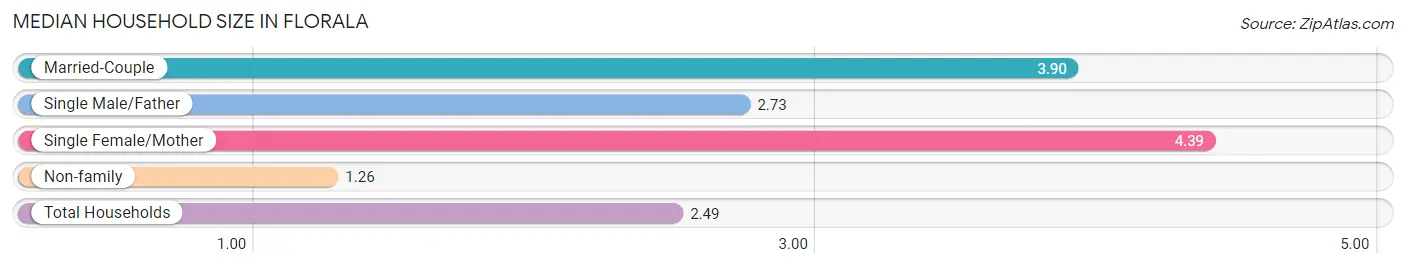
| Household Type | # Households | Household Size |
| Married-Couple | 154 (23.1%) | 3.90 |
| Single Male/Father | 11 (1.7%) | 2.73 |
| Single Female/Mother | 127 (19.0%) | 4.39 |
| Non-family | 375 (56.2%) | 1.26 |
| Total Households | 667 (100.0%) | 2.49 |
Household Size by Marriage Status in Florala
Out of a total of 667 households in Florala, 292 (43.8%) are family households, while 375 (56.2%) are nonfamily households. The most numerous type of family households are 2-person households, comprising 131, and the most common type of nonfamily households are 1-person households, comprising 337.
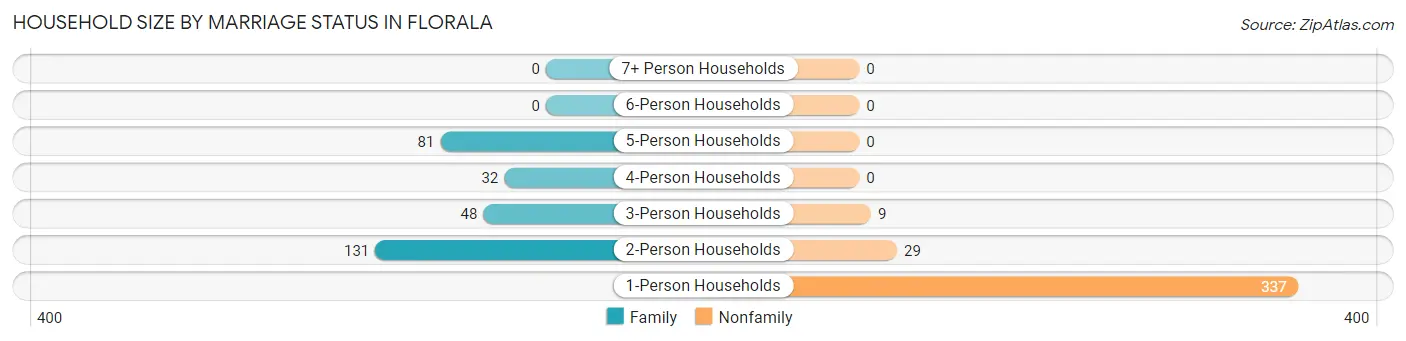
| Household Size | Family Households | Nonfamily Households |
| 1-Person Households | - | 337 (50.5%) |
| 2-Person Households | 131 (19.6%) | 29 (4.3%) |
| 3-Person Households | 48 (7.2%) | 9 (1.3%) |
| 4-Person Households | 32 (4.8%) | 0 (0.0%) |
| 5-Person Households | 81 (12.1%) | 0 (0.0%) |
| 6-Person Households | 0 (0.0%) | 0 (0.0%) |
| 7+ Person Households | 0 (0.0%) | 0 (0.0%) |
| Total | 292 (43.8%) | 375 (56.2%) |
Female Fertility in Florala
Fertility by Age in Florala
Average fertility rate in Florala is 68.0 births per 1,000 women. Women in the age bracket of 20 to 34 years have the highest fertility rate with 120.0 births per 1,000 women. Women in the age bracket of 20 to 34 years acount for 100.0% of all women with births.
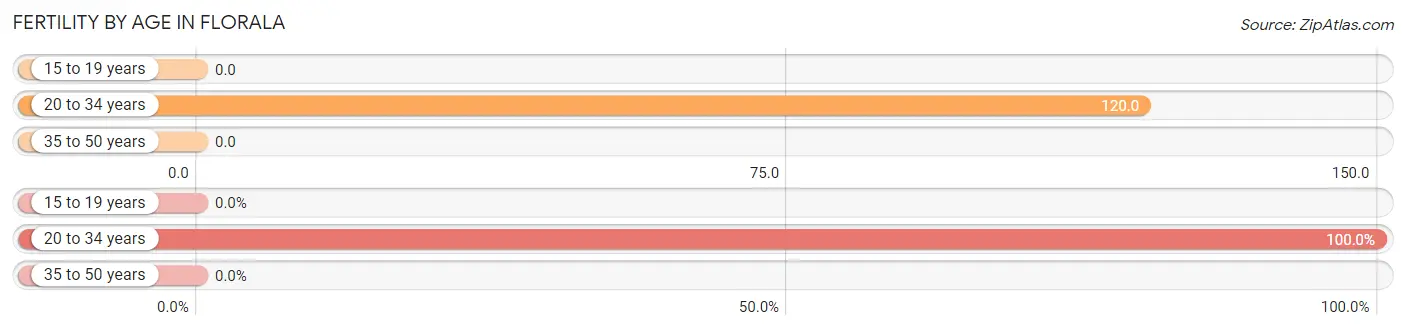
| Age Bracket | Women with Births | Births / 1,000 Women |
| 15 to 19 years | 0 (0.0%) | 0.0 |
| 20 to 34 years | 19 (100.0%) | 120.0 |
| 35 to 50 years | 0 (0.0%) | 0.0 |
| Total | 19 (100.0%) | 68.0 |
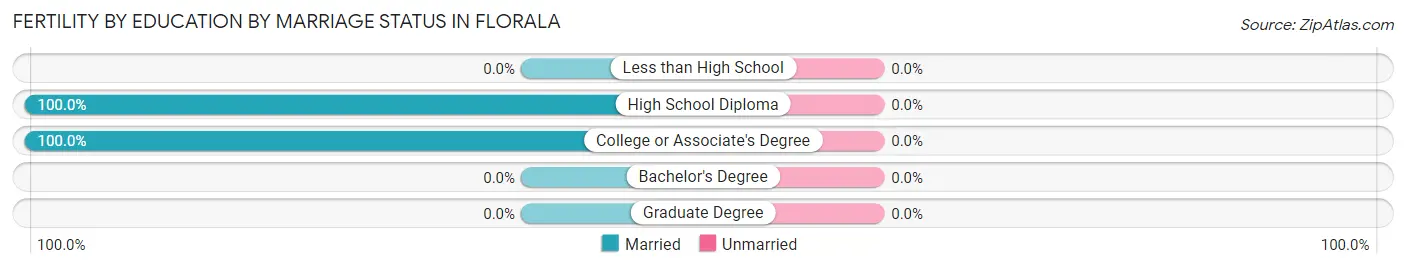
Fertility by Age by Marriage Status in Florala
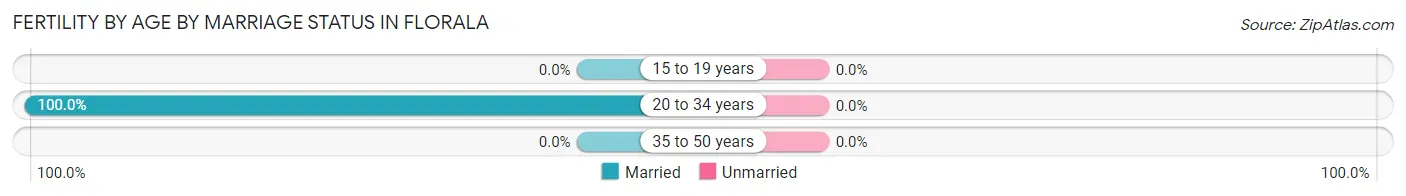
| Age Bracket | Married | Unmarried |
| 15 to 19 years | 0 (0.0%) | 0 (0.0%) |
| 20 to 34 years | 19 (100.0%) | 0 (0.0%) |
| 35 to 50 years | 0 (0.0%) | 0 (0.0%) |
| Total | 19 (100.0%) | 0 (0.0%) |
Fertility by Education in Florala
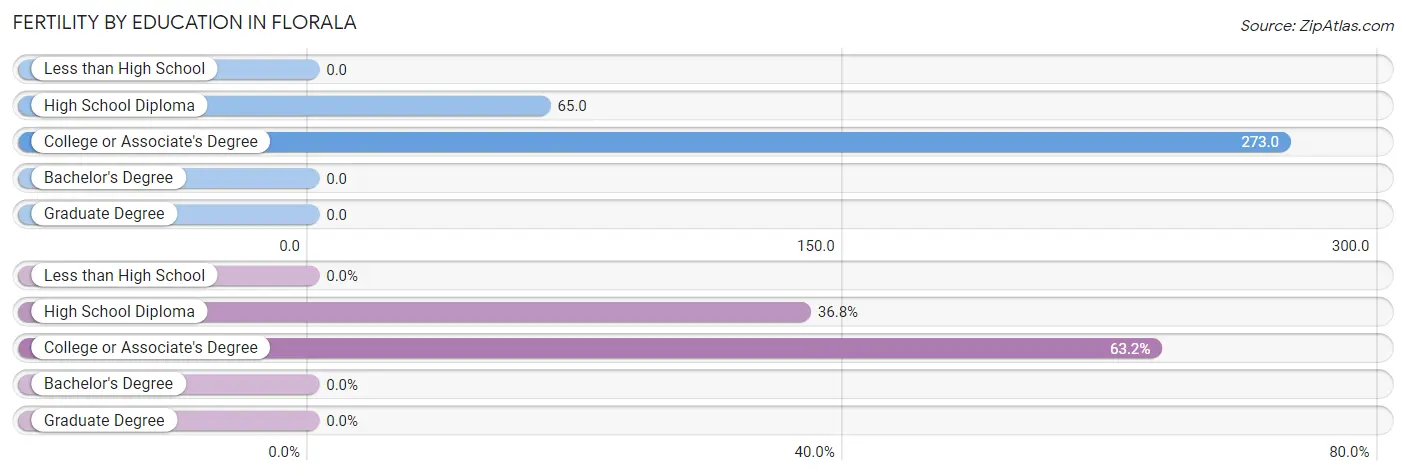
| Educational Attainment | Women with Births | Births / 1,000 Women |
| Less than High School | 0 (0.0%) | 0.0 |
| High School Diploma | 7 (36.8%) | 65.0 |
| College or Associate's Degree | 12 (63.2%) | 273.0 |
| Bachelor's Degree | 0 (0.0%) | 0.0 |
| Graduate Degree | 0 (0.0%) | 0.0 |
| Total | 19 (100.0%) | 68.0 |
Fertility by Education by Marriage Status in Florala
| Educational Attainment | Married | Unmarried |
| Less than High School | 0 (0.0%) | 0 (0.0%) |
| High School Diploma | 7 (100.0%) | 0 (0.0%) |
| College or Associate's Degree | 12 (100.0%) | 0 (0.0%) |
| Bachelor's Degree | 0 (0.0%) | 0 (0.0%) |
| Graduate Degree | 0 (0.0%) | 0 (0.0%) |
| Total | 19 (100.0%) | 0 (0.0%) |
Employment Characteristics in Florala
Employment by Class of Employer in Florala
Among the 612 employed individuals in Florala, private company employees (409 | 66.8%), local government employees (88 | 14.4%), and federal government employees (70 | 11.4%) make up the most common classes of employment.
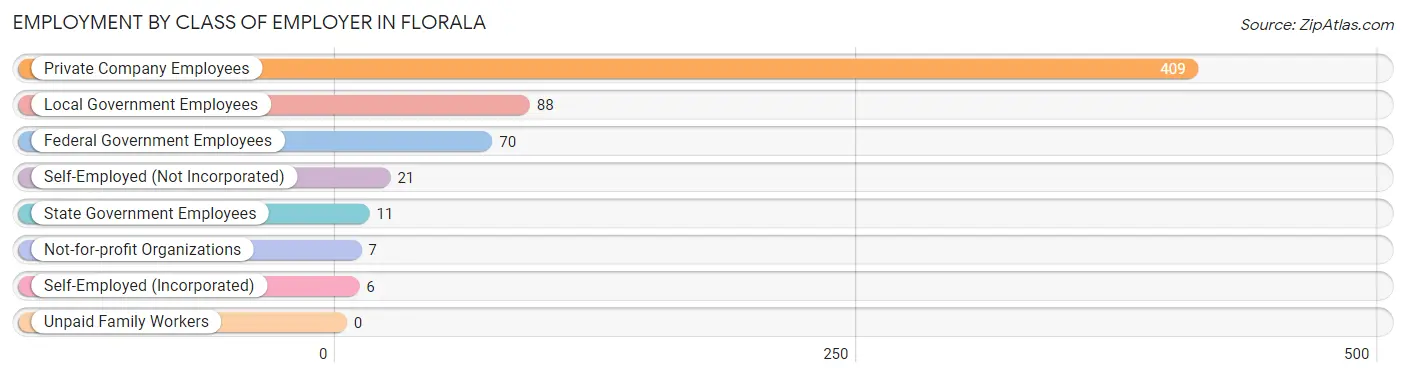
| Employer Class | # Employees | % Employees |
| Private Company Employees | 409 | 66.8% |
| Self-Employed (Incorporated) | 6 | 1.0% |
| Self-Employed (Not Incorporated) | 21 | 3.4% |
| Not-for-profit Organizations | 7 | 1.1% |
| Local Government Employees | 88 | 14.4% |
| State Government Employees | 11 | 1.8% |
| Federal Government Employees | 70 | 11.4% |
| Unpaid Family Workers | 0 | 0.0% |
| Total | 612 | 100.0% |
Employment Status by Age in Florala
According to the labor force statistics for Florala, out of the total population over 16 years of age (1,516), 41.8% or 634 individuals are in the labor force, with 2.6% or 16 of them unemployed. The age group with the highest labor force participation rate is 25 to 29 years, with 100.0% or 34 individuals in the labor force. Within the labor force, the 35 to 44 years age range has the highest percentage of unemployed individuals, with 22.2% or 16 of them being unemployed.
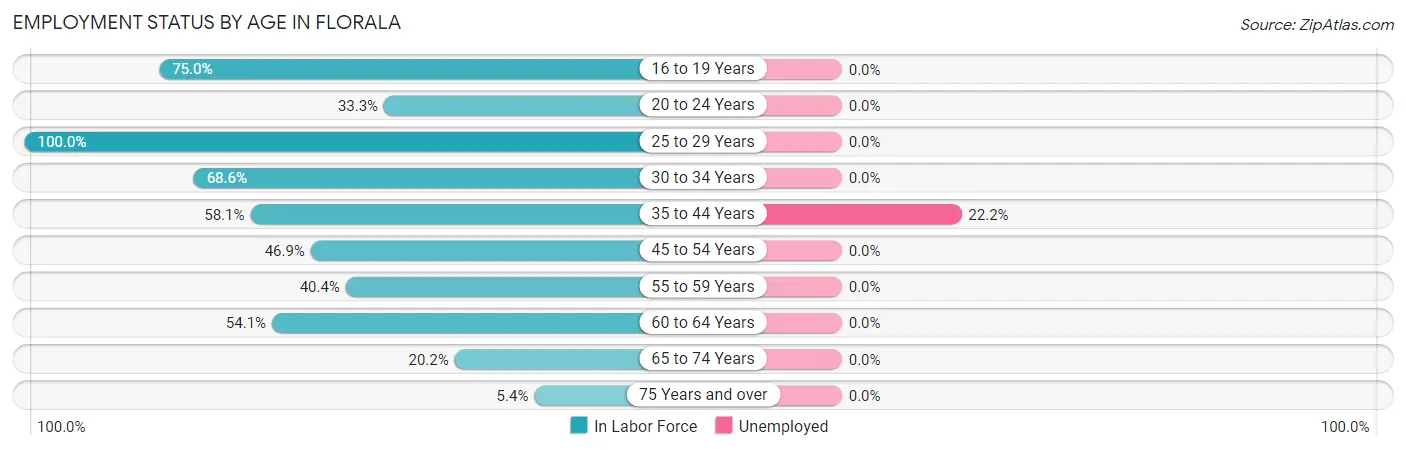
| Age Bracket | In Labor Force | Unemployed |
| 16 to 19 Years | 33 (75.0%) | 0 (0.0%) |
| 20 to 24 Years | 22 (33.3%) | 0 (0.0%) |
| 25 to 29 Years | 34 (100.0%) | 0 (0.0%) |
| 30 to 34 Years | 192 (68.6%) | 0 (0.0%) |
| 35 to 44 Years | 72 (58.1%) | 16 (22.2%) |
| 45 to 54 Years | 67 (46.9%) | 0 (0.0%) |
| 55 to 59 Years | 84 (40.4%) | 0 (0.0%) |
| 60 to 64 Years | 73 (54.1%) | 0 (0.0%) |
| 65 to 74 Years | 41 (20.2%) | 0 (0.0%) |
| 75 Years and over | 15 (5.4%) | 0 (0.0%) |
| Total | 634 (41.8%) | 16 (2.6%) |
Employment Status by Educational Attainment in Florala
According to labor force statistics for Florala, 56.5% of individuals (522) out of the total population between 25 and 64 years of age (924) are in the labor force, with 3.1% or 16 of them being unemployed. The group with the highest labor force participation rate are those with the educational attainment of high school diploma, with 66.1% or 238 individuals in the labor force. Within the labor force, individuals with college / associate degree education have the highest percentage of unemployment, with 7.8% or 16 of them being unemployed.
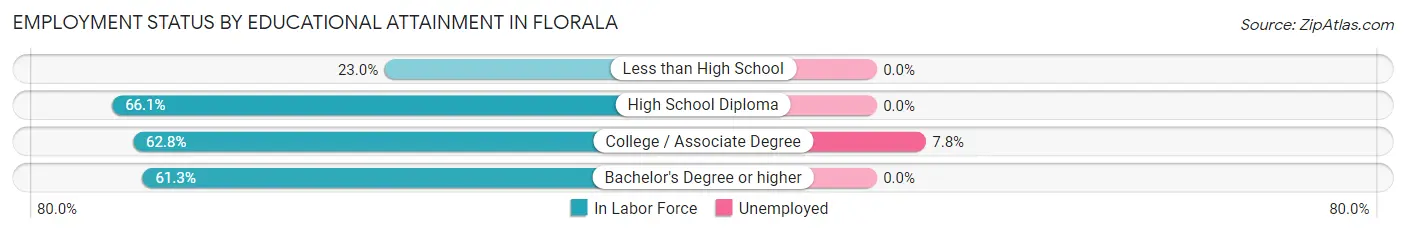
| Educational Attainment | In Labor Force | Unemployed |
| Less than High School | 40 (23.0%) | 0 (0.0%) |
| High School Diploma | 238 (66.1%) | 0 (0.0%) |
| College / Associate Degree | 206 (62.8%) | 26 (7.8%) |
| Bachelor's Degree or higher | 38 (61.3%) | 0 (0.0%) |
| Total | 522 (56.5%) | 29 (3.1%) |
Employment Occupations by Sex in Florala
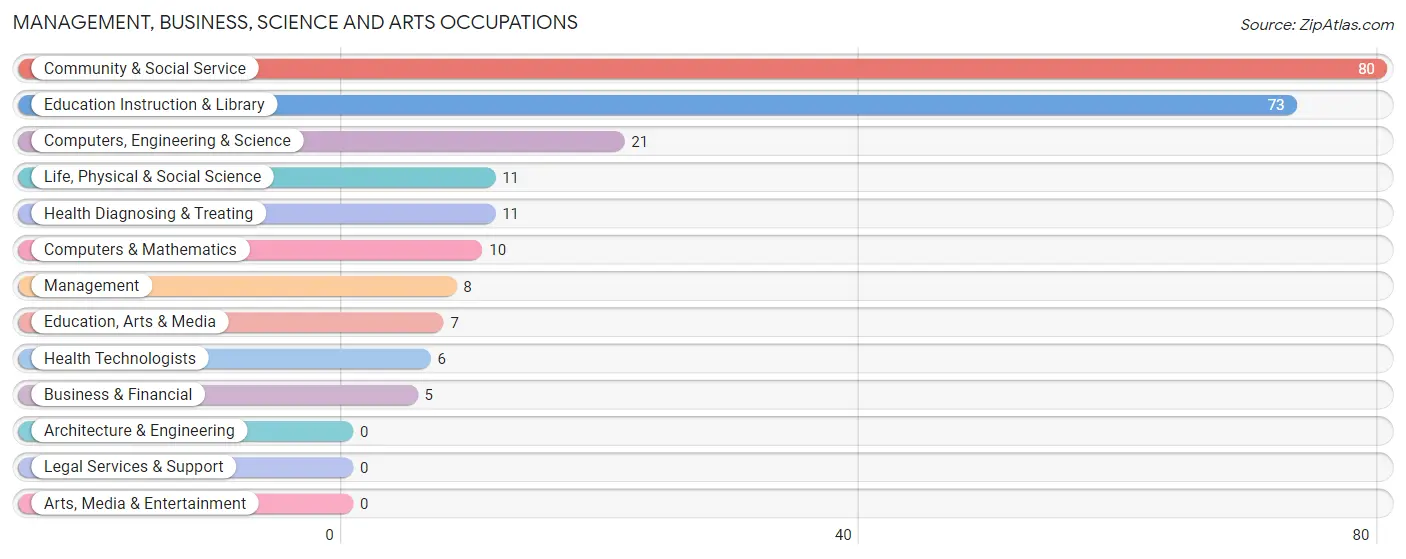
Management, Business, Science and Arts Occupations
The most common Management, Business, Science and Arts occupations in Florala are Community & Social Service (80 | 13.1%), Education Instruction & Library (73 | 11.9%), Computers, Engineering & Science (21 | 3.4%), Life, Physical & Social Science (11 | 1.8%), and Health Diagnosing & Treating (11 | 1.8%).
Management, Business, Science and Arts Occupations by Sex
Within the Management, Business, Science and Arts occupations in Florala, the most male-oriented occupations are Management (100.0%), Computers, Engineering & Science (100.0%), and Computers & Mathematics (100.0%), while the most female-oriented occupations are Business & Financial (100.0%), Health Diagnosing & Treating (100.0%), and Health Technologists (100.0%).
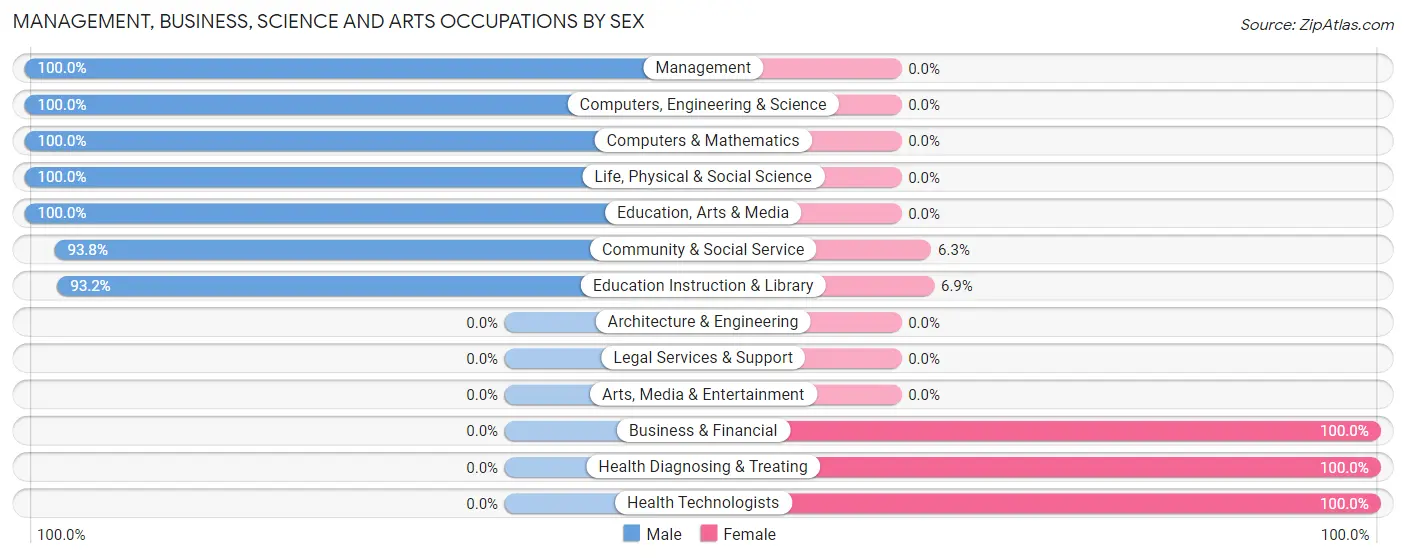
| Occupation | Male | Female |
| Management | 8 (100.0%) | 0 (0.0%) |
| Business & Financial | 0 (0.0%) | 5 (100.0%) |
| Computers, Engineering & Science | 21 (100.0%) | 0 (0.0%) |
| Computers & Mathematics | 10 (100.0%) | 0 (0.0%) |
| Architecture & Engineering | 0 (0.0%) | 0 (0.0%) |
| Life, Physical & Social Science | 11 (100.0%) | 0 (0.0%) |
| Community & Social Service | 75 (93.8%) | 5 (6.2%) |
| Education, Arts & Media | 7 (100.0%) | 0 (0.0%) |
| Legal Services & Support | 0 (0.0%) | 0 (0.0%) |
| Education Instruction & Library | 68 (93.1%) | 5 (6.9%) |
| Arts, Media & Entertainment | 0 (0.0%) | 0 (0.0%) |
| Health Diagnosing & Treating | 0 (0.0%) | 11 (100.0%) |
| Health Technologists | 0 (0.0%) | 6 (100.0%) |
| Total (Category) | 104 (83.2%) | 21 (16.8%) |
| Total (Overall) | 371 (60.7%) | 240 (39.3%) |
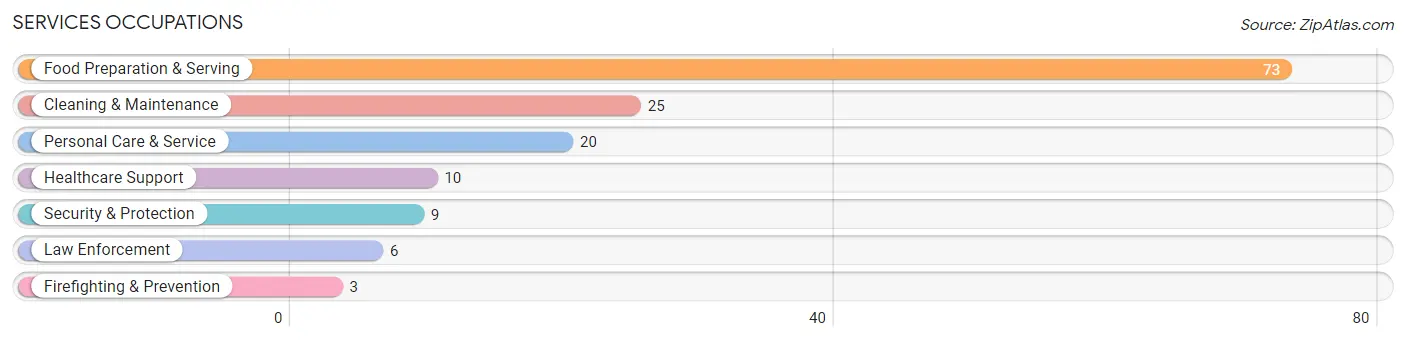
Services Occupations
The most common Services occupations in Florala are Food Preparation & Serving (73 | 11.9%), Cleaning & Maintenance (25 | 4.1%), Personal Care & Service (20 | 3.3%), Healthcare Support (10 | 1.6%), and Security & Protection (9 | 1.5%).
Services Occupations by Sex
Within the Services occupations in Florala, the most male-oriented occupations are Law Enforcement (100.0%), Security & Protection (66.7%), and Food Preparation & Serving (30.1%), while the most female-oriented occupations are Healthcare Support (100.0%), Firefighting & Prevention (100.0%), and Cleaning & Maintenance (100.0%).
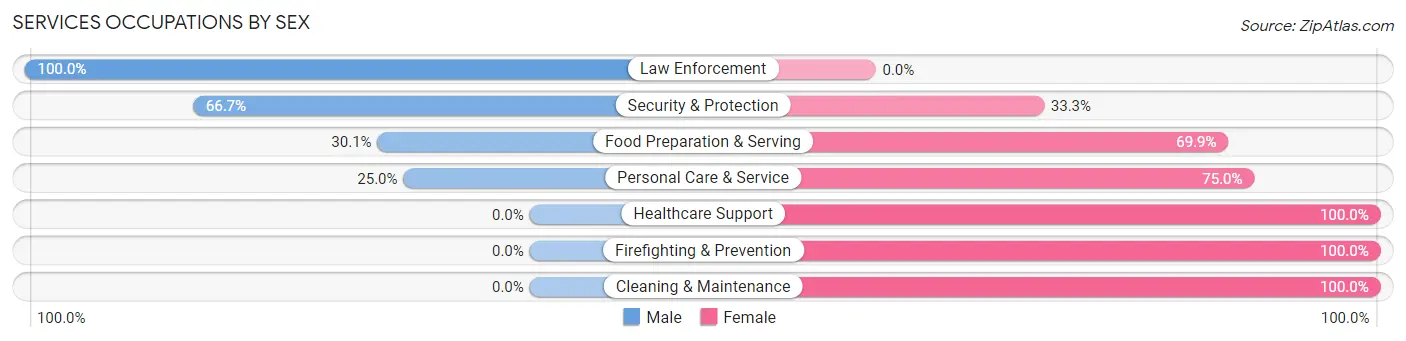
| Occupation | Male | Female |
| Healthcare Support | 0 (0.0%) | 10 (100.0%) |
| Security & Protection | 6 (66.7%) | 3 (33.3%) |
| Firefighting & Prevention | 0 (0.0%) | 3 (100.0%) |
| Law Enforcement | 6 (100.0%) | 0 (0.0%) |
| Food Preparation & Serving | 22 (30.1%) | 51 (69.9%) |
| Cleaning & Maintenance | 0 (0.0%) | 25 (100.0%) |
| Personal Care & Service | 5 (25.0%) | 15 (75.0%) |
| Total (Category) | 33 (24.1%) | 104 (75.9%) |
| Total (Overall) | 371 (60.7%) | 240 (39.3%) |
Sales and Office Occupations
The most common Sales and Office occupations in Florala are Office & Administration (44 | 7.2%), and Sales & Related (35 | 5.7%).
Sales and Office Occupations by Sex
| Occupation | Male | Female |
| Sales & Related | 0 (0.0%) | 35 (100.0%) |
| Office & Administration | 5 (11.4%) | 39 (88.6%) |
| Total (Category) | 5 (6.3%) | 74 (93.7%) |
| Total (Overall) | 371 (60.7%) | 240 (39.3%) |
Natural Resources, Construction and Maintenance Occupations
The most common Natural Resources, Construction and Maintenance occupations in Florala are Construction & Extraction (43 | 7.0%), and Installation, Maintenance & Repair (7 | 1.1%).
Natural Resources, Construction and Maintenance Occupations by Sex
| Occupation | Male | Female |
| Farming, Fishing & Forestry | 0 (0.0%) | 0 (0.0%) |
| Construction & Extraction | 34 (79.1%) | 9 (20.9%) |
| Installation, Maintenance & Repair | 7 (100.0%) | 0 (0.0%) |
| Total (Category) | 41 (82.0%) | 9 (18.0%) |
| Total (Overall) | 371 (60.7%) | 240 (39.3%) |
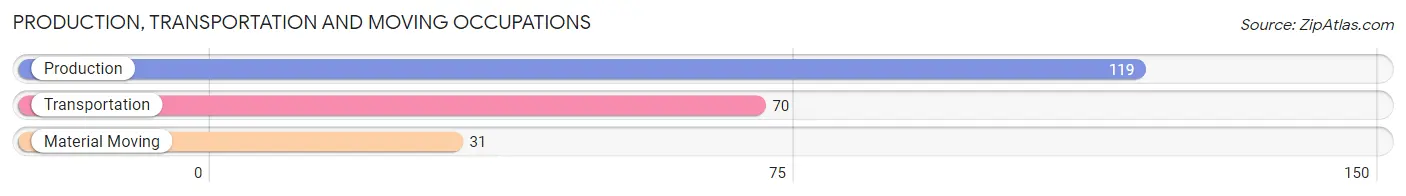
Production, Transportation and Moving Occupations
The most common Production, Transportation and Moving occupations in Florala are Production (119 | 19.5%), Transportation (70 | 11.5%), and Material Moving (31 | 5.1%).
Production, Transportation and Moving Occupations by Sex
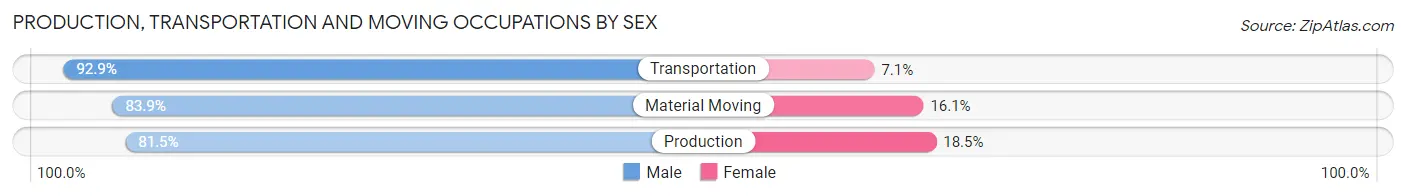
| Occupation | Male | Female |
| Production | 97 (81.5%) | 22 (18.5%) |
| Transportation | 65 (92.9%) | 5 (7.1%) |
| Material Moving | 26 (83.9%) | 5 (16.1%) |
| Total (Category) | 188 (85.5%) | 32 (14.5%) |
| Total (Overall) | 371 (60.7%) | 240 (39.3%) |
Employment Industries by Sex in Florala
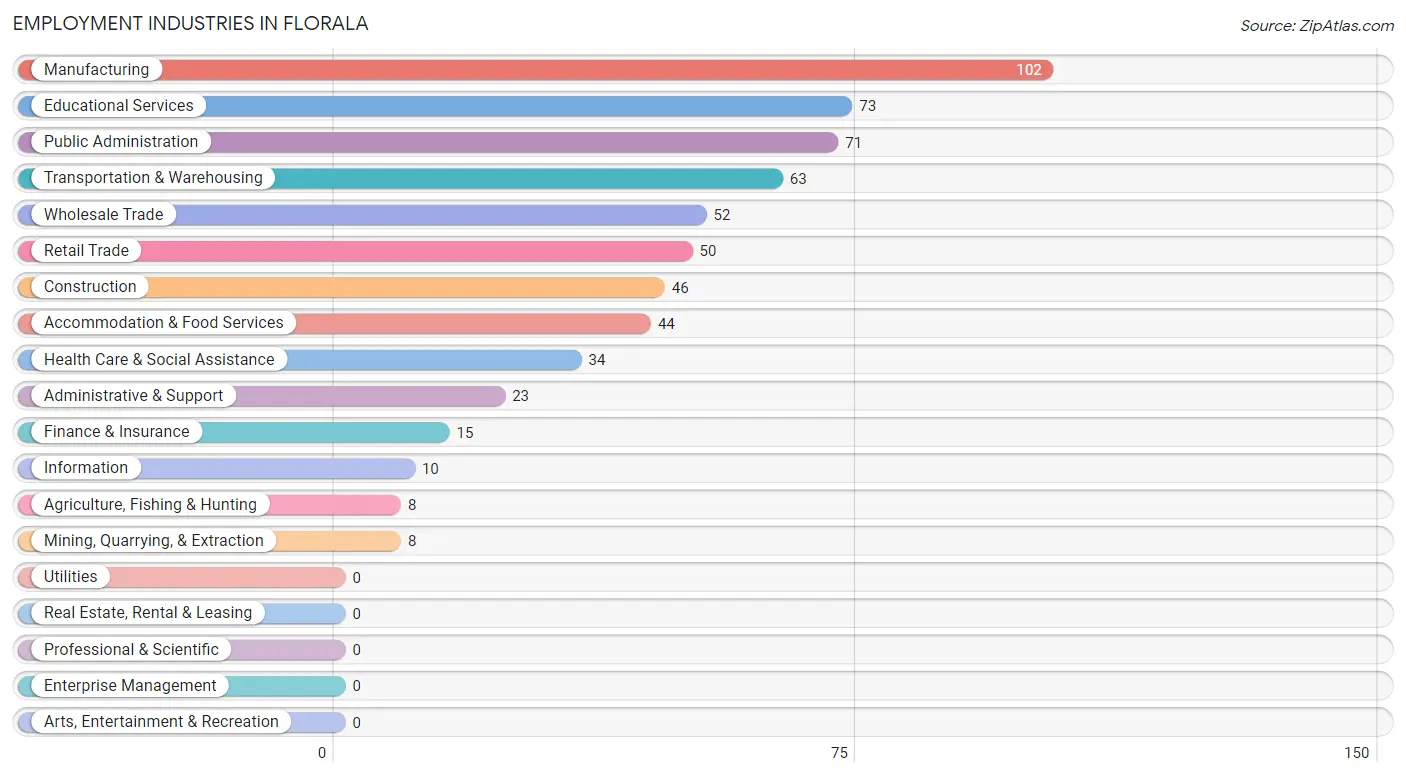
Employment Industries in Florala
The major employment industries in Florala include Manufacturing (102 | 16.7%), Educational Services (73 | 11.9%), Public Administration (71 | 11.6%), Transportation & Warehousing (63 | 10.3%), and Wholesale Trade (52 | 8.5%).
Employment Industries by Sex in Florala
The Florala industries that see more men than women are Agriculture, Fishing & Hunting (100.0%), Mining, Quarrying, & Extraction (100.0%), and Educational Services (93.1%), whereas the industries that tend to have a higher number of women are Information (100.0%), Finance & Insurance (100.0%), and Health Care & Social Assistance (100.0%).
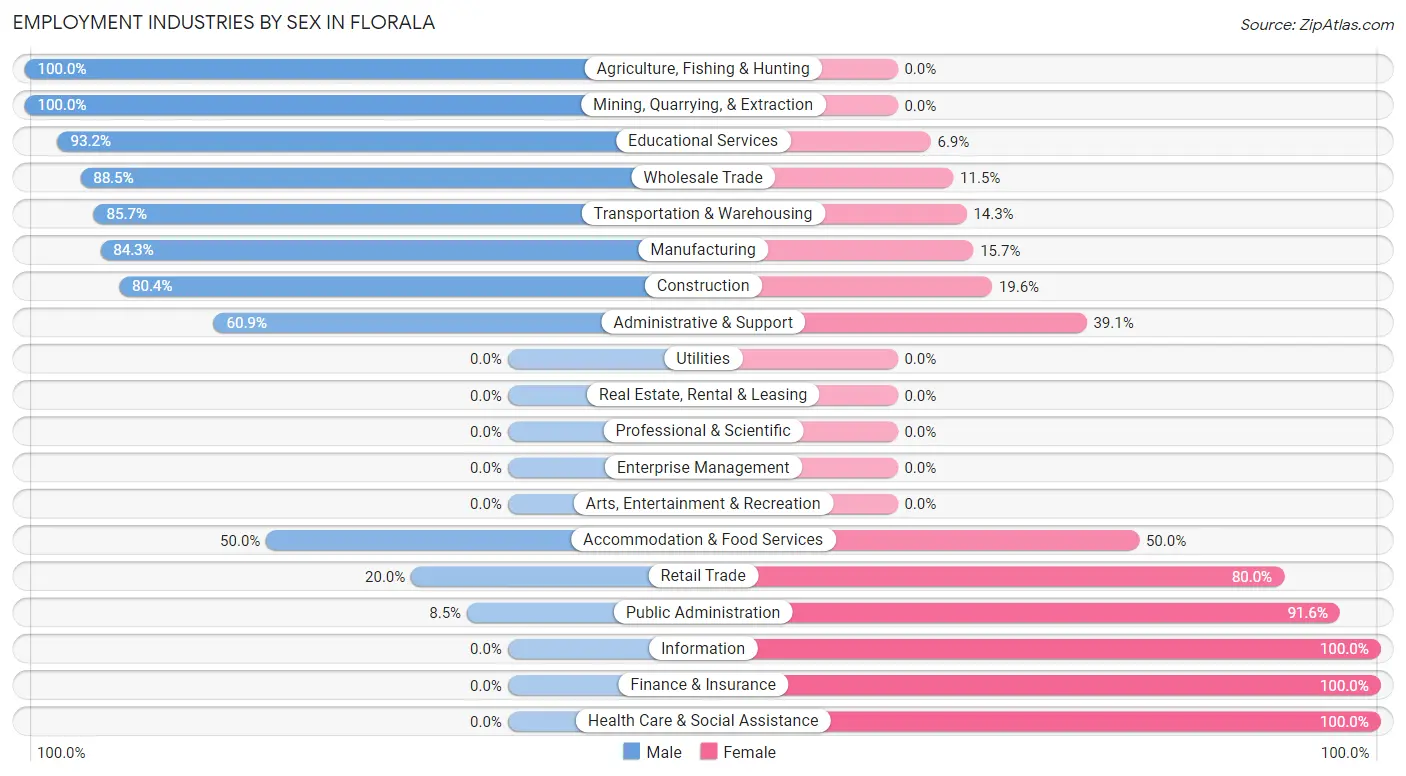
| Industry | Male | Female |
| Agriculture, Fishing & Hunting | 8 (100.0%) | 0 (0.0%) |
| Mining, Quarrying, & Extraction | 8 (100.0%) | 0 (0.0%) |
| Construction | 37 (80.4%) | 9 (19.6%) |
| Manufacturing | 86 (84.3%) | 16 (15.7%) |
| Wholesale Trade | 46 (88.5%) | 6 (11.5%) |
| Retail Trade | 10 (20.0%) | 40 (80.0%) |
| Transportation & Warehousing | 54 (85.7%) | 9 (14.3%) |
| Utilities | 0 (0.0%) | 0 (0.0%) |
| Information | 0 (0.0%) | 10 (100.0%) |
| Finance & Insurance | 0 (0.0%) | 15 (100.0%) |
| Real Estate, Rental & Leasing | 0 (0.0%) | 0 (0.0%) |
| Professional & Scientific | 0 (0.0%) | 0 (0.0%) |
| Enterprise Management | 0 (0.0%) | 0 (0.0%) |
| Administrative & Support | 14 (60.9%) | 9 (39.1%) |
| Educational Services | 68 (93.1%) | 5 (6.9%) |
| Health Care & Social Assistance | 0 (0.0%) | 34 (100.0%) |
| Arts, Entertainment & Recreation | 0 (0.0%) | 0 (0.0%) |
| Accommodation & Food Services | 22 (50.0%) | 22 (50.0%) |
| Public Administration | 6 (8.5%) | 65 (91.5%) |
| Total | 371 (60.7%) | 240 (39.3%) |
Education in Florala
School Enrollment in Florala
The most common levels of schooling among the 293 students in Florala are elementary school (73 | 24.9%), graduate / professional (68 | 23.2%), and middle school (63 | 21.5%).
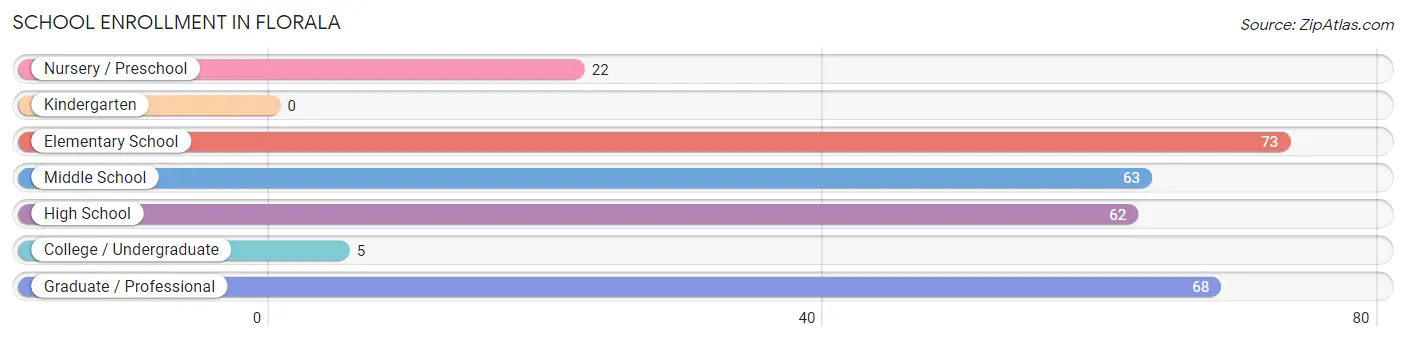
| School Level | # Students | % Students |
| Nursery / Preschool | 22 | 7.5% |
| Kindergarten | 0 | 0.0% |
| Elementary School | 73 | 24.9% |
| Middle School | 63 | 21.5% |
| High School | 62 | 21.2% |
| College / Undergraduate | 5 | 1.7% |
| Graduate / Professional | 68 | 23.2% |
| Total | 293 | 100.0% |
School Enrollment by Age by Funding Source in Florala
Out of a total of 293 students who are enrolled in schools in Florala, 59 (20.1%) attend a private institution, while the remaining 234 (79.9%) are enrolled in public schools. The age group of 35 years and over has the highest likelihood of being enrolled in private schools, with 5 (100.0% in the age bracket) enrolled. Conversely, the age group of 3 to 4 year olds has the lowest likelihood of being enrolled in a private school, with 6 (100.0% in the age bracket) attending a public institution.
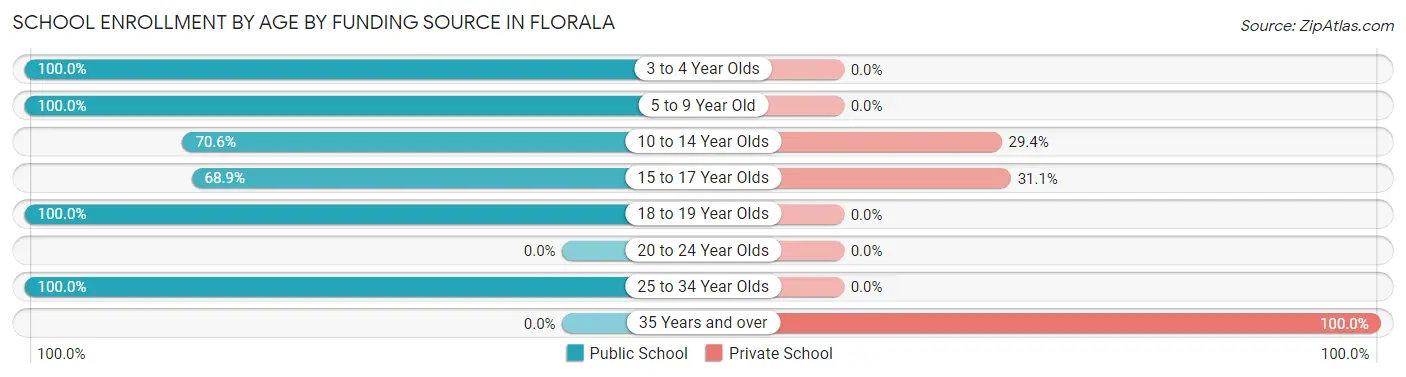
| Age Bracket | Public School | Private School |
| 3 to 4 Year Olds | 6 (100.0%) | 0 (0.0%) |
| 5 to 9 Year Old | 22 (100.0%) | 0 (0.0%) |
| 10 to 14 Year Olds | 96 (70.6%) | 40 (29.4%) |
| 15 to 17 Year Olds | 31 (68.9%) | 14 (31.1%) |
| 18 to 19 Year Olds | 11 (100.0%) | 0 (0.0%) |
| 20 to 24 Year Olds | 0 (0.0%) | 0 (0.0%) |
| 25 to 34 Year Olds | 68 (100.0%) | 0 (0.0%) |
| 35 Years and over | 0 (0.0%) | 5 (100.0%) |
| Total | 234 (79.9%) | 59 (20.1%) |
Educational Attainment by Field of Study in Florala
Education (30 | 31.6%), business (25 | 26.3%), psychology (22 | 23.2%), liberal arts & history (7 | 7.4%), and science & technology (6 | 6.3%) are the most common fields of study among 95 individuals in Florala who have obtained a bachelor's degree or higher.
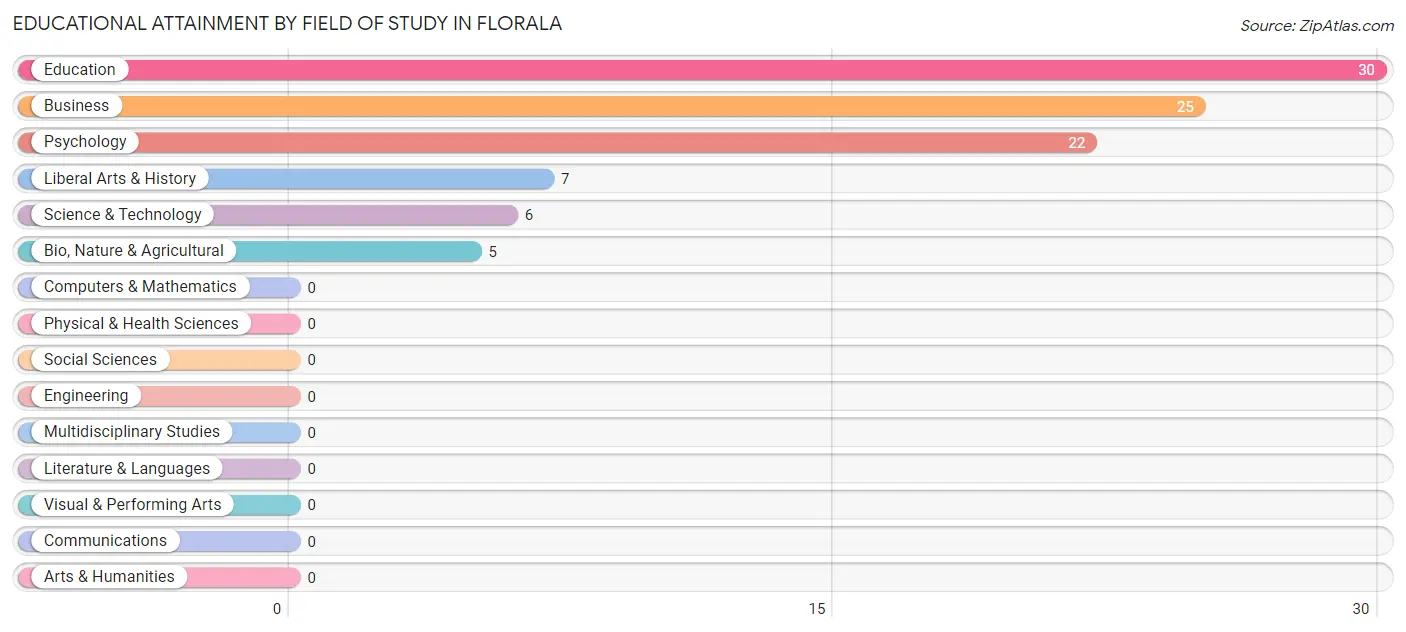
| Field of Study | # Graduates | % Graduates |
| Computers & Mathematics | 0 | 0.0% |
| Bio, Nature & Agricultural | 5 | 5.3% |
| Physical & Health Sciences | 0 | 0.0% |
| Psychology | 22 | 23.2% |
| Social Sciences | 0 | 0.0% |
| Engineering | 0 | 0.0% |
| Multidisciplinary Studies | 0 | 0.0% |
| Science & Technology | 6 | 6.3% |
| Business | 25 | 26.3% |
| Education | 30 | 31.6% |
| Literature & Languages | 0 | 0.0% |
| Liberal Arts & History | 7 | 7.4% |
| Visual & Performing Arts | 0 | 0.0% |
| Communications | 0 | 0.0% |
| Arts & Humanities | 0 | 0.0% |
| Total | 95 | 100.0% |
Transportation & Commute in Florala
Vehicle Availability by Sex in Florala
The most prevalent vehicle ownership categories in Florala are males with 2 vehicles (125, accounting for 33.5%) and females with 2 vehicles (129, making up 53.2%).
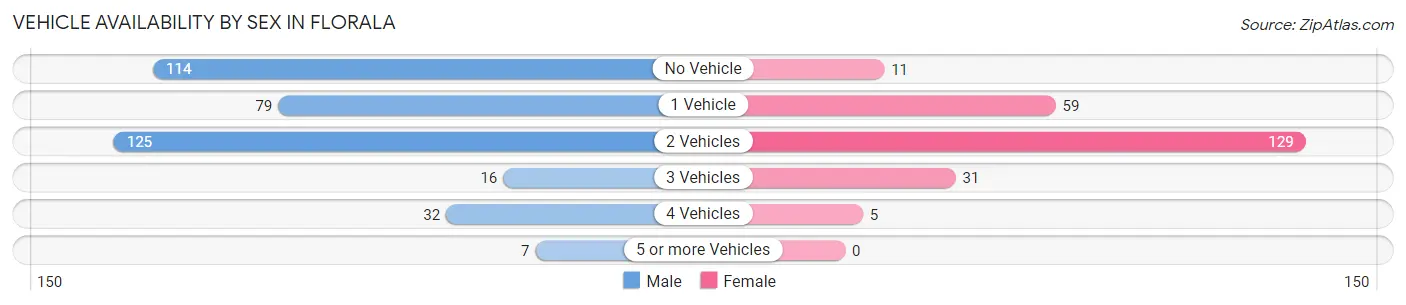
| Vehicles Available | Male | Female |
| No Vehicle | 114 (30.6%) | 11 (4.7%) |
| 1 Vehicle | 79 (21.2%) | 59 (25.1%) |
| 2 Vehicles | 125 (33.5%) | 129 (54.9%) |
| 3 Vehicles | 16 (4.3%) | 31 (13.2%) |
| 4 Vehicles | 32 (8.6%) | 5 (2.1%) |
| 5 or more Vehicles | 7 (1.9%) | 0 (0.0%) |
| Total | 373 (100.0%) | 235 (100.0%) |
Commute Time in Florala
The most frequently occuring commute durations in Florala are 30 to 34 minutes (114 commuters, 18.9%), 40 to 44 minutes (90 commuters, 14.9%), and 10 to 14 minutes (67 commuters, 11.1%).
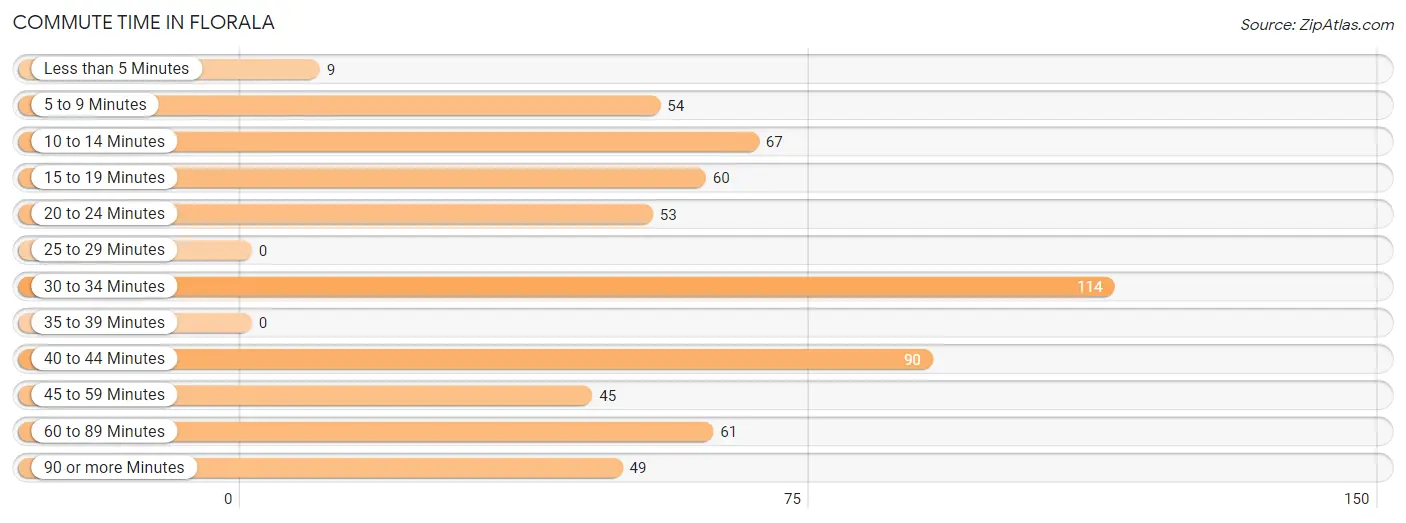
| Commute Time | # Commuters | % Commuters |
| Less than 5 Minutes | 9 | 1.5% |
| 5 to 9 Minutes | 54 | 9.0% |
| 10 to 14 Minutes | 67 | 11.1% |
| 15 to 19 Minutes | 60 | 10.0% |
| 20 to 24 Minutes | 53 | 8.8% |
| 25 to 29 Minutes | 0 | 0.0% |
| 30 to 34 Minutes | 114 | 18.9% |
| 35 to 39 Minutes | 0 | 0.0% |
| 40 to 44 Minutes | 90 | 14.9% |
| 45 to 59 Minutes | 45 | 7.5% |
| 60 to 89 Minutes | 61 | 10.1% |
| 90 or more Minutes | 49 | 8.1% |
Commute Time by Sex in Florala
The most common commute times in Florala are 40 to 44 minutes (85 commuters, 22.6%) for males and 30 to 34 minutes (96 commuters, 42.7%) for females.
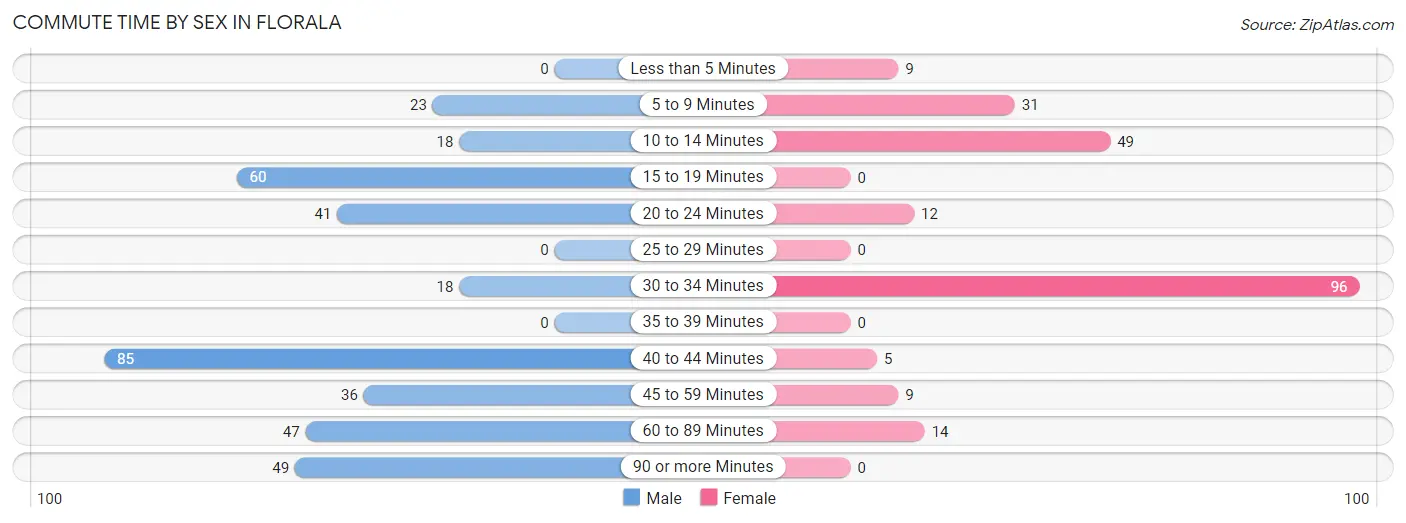
| Commute Time | Male | Female |
| Less than 5 Minutes | 0 (0.0%) | 9 (4.0%) |
| 5 to 9 Minutes | 23 (6.1%) | 31 (13.8%) |
| 10 to 14 Minutes | 18 (4.8%) | 49 (21.8%) |
| 15 to 19 Minutes | 60 (15.9%) | 0 (0.0%) |
| 20 to 24 Minutes | 41 (10.9%) | 12 (5.3%) |
| 25 to 29 Minutes | 0 (0.0%) | 0 (0.0%) |
| 30 to 34 Minutes | 18 (4.8%) | 96 (42.7%) |
| 35 to 39 Minutes | 0 (0.0%) | 0 (0.0%) |
| 40 to 44 Minutes | 85 (22.6%) | 5 (2.2%) |
| 45 to 59 Minutes | 36 (9.6%) | 9 (4.0%) |
| 60 to 89 Minutes | 47 (12.5%) | 14 (6.2%) |
| 90 or more Minutes | 49 (13.0%) | 0 (0.0%) |
Time of Departure to Work by Sex in Florala
The most frequent times of departure to work in Florala are 8:00 AM to 8:29 AM (83, 22.0%) for males and 7:30 AM to 7:59 AM (62, 27.6%) for females.
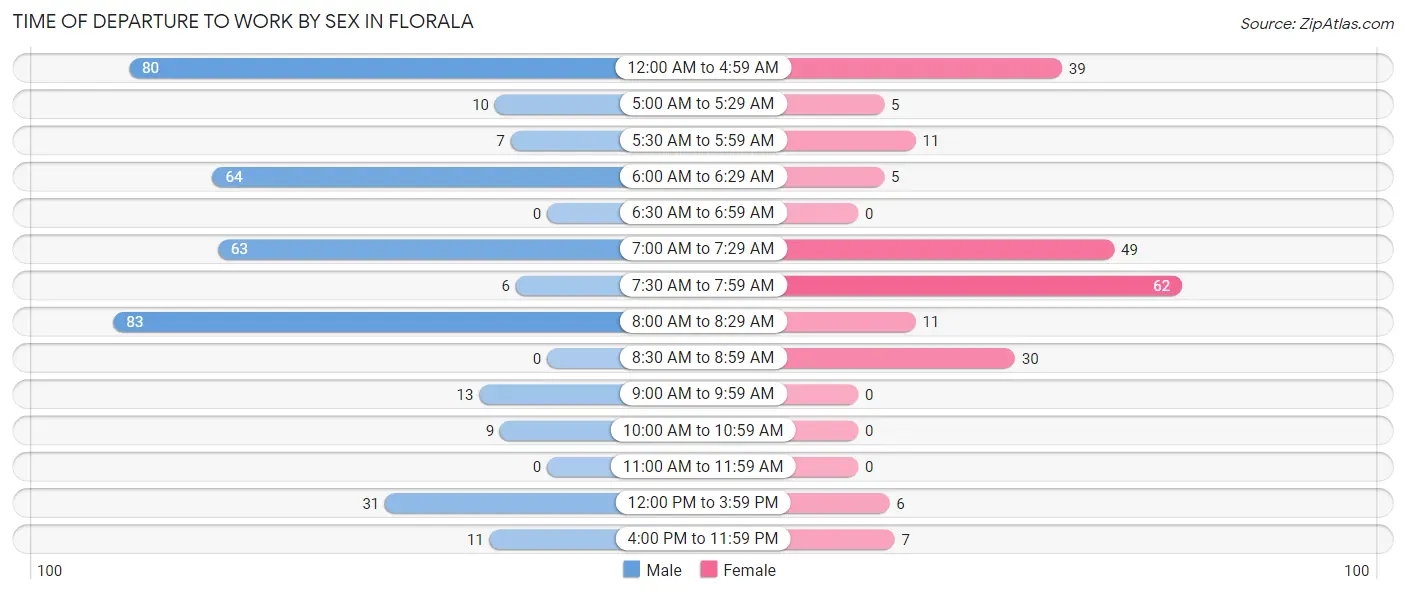
| Time of Departure | Male | Female |
| 12:00 AM to 4:59 AM | 80 (21.2%) | 39 (17.3%) |
| 5:00 AM to 5:29 AM | 10 (2.6%) | 5 (2.2%) |
| 5:30 AM to 5:59 AM | 7 (1.9%) | 11 (4.9%) |
| 6:00 AM to 6:29 AM | 64 (17.0%) | 5 (2.2%) |
| 6:30 AM to 6:59 AM | 0 (0.0%) | 0 (0.0%) |
| 7:00 AM to 7:29 AM | 63 (16.7%) | 49 (21.8%) |
| 7:30 AM to 7:59 AM | 6 (1.6%) | 62 (27.6%) |
| 8:00 AM to 8:29 AM | 83 (22.0%) | 11 (4.9%) |
| 8:30 AM to 8:59 AM | 0 (0.0%) | 30 (13.3%) |
| 9:00 AM to 9:59 AM | 13 (3.5%) | 0 (0.0%) |
| 10:00 AM to 10:59 AM | 9 (2.4%) | 0 (0.0%) |
| 11:00 AM to 11:59 AM | 0 (0.0%) | 0 (0.0%) |
| 12:00 PM to 3:59 PM | 31 (8.2%) | 6 (2.7%) |
| 4:00 PM to 11:59 PM | 11 (2.9%) | 7 (3.1%) |
| Total | 377 (100.0%) | 225 (100.0%) |
Housing Occupancy in Florala
Occupancy by Ownership in Florala
Of the total 667 dwellings in Florala, owner-occupied units account for 339 (50.8%), while renter-occupied units make up 328 (49.2%).
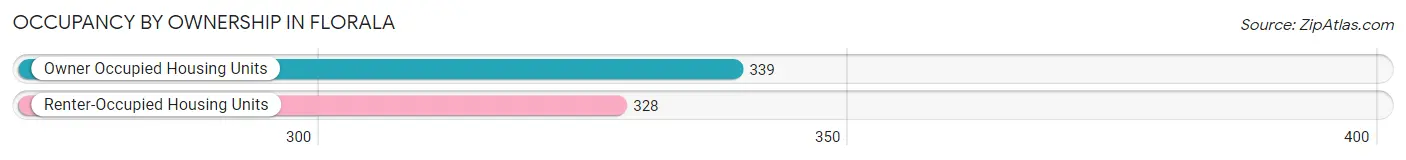
| Occupancy | # Housing Units | % Housing Units |
| Owner Occupied Housing Units | 339 | 50.8% |
| Renter-Occupied Housing Units | 328 | 49.2% |
| Total Occupied Housing Units | 667 | 100.0% |
Occupancy by Household Size in Florala
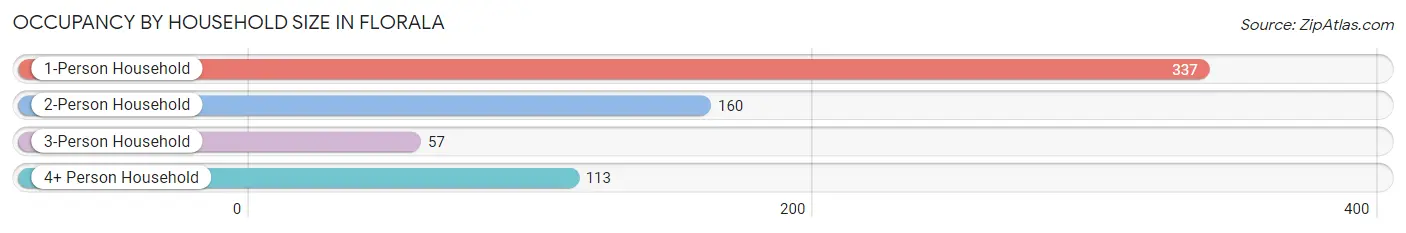
| Household Size | # Housing Units | % Housing Units |
| 1-Person Household | 337 | 50.5% |
| 2-Person Household | 160 | 24.0% |
| 3-Person Household | 57 | 8.6% |
| 4+ Person Household | 113 | 16.9% |
| Total Housing Units | 667 | 100.0% |
Occupancy by Ownership by Household Size in Florala
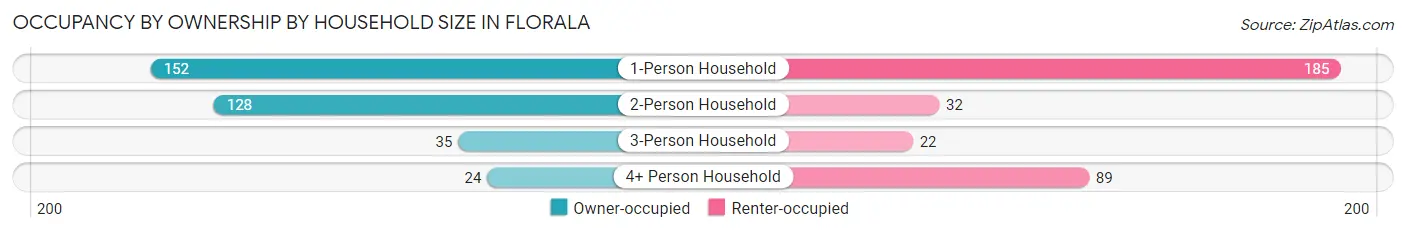
| Household Size | Owner-occupied | Renter-occupied |
| 1-Person Household | 152 (45.1%) | 185 (54.9%) |
| 2-Person Household | 128 (80.0%) | 32 (20.0%) |
| 3-Person Household | 35 (61.4%) | 22 (38.6%) |
| 4+ Person Household | 24 (21.2%) | 89 (78.8%) |
| Total Housing Units | 339 (50.8%) | 328 (49.2%) |
Occupancy by Educational Attainment in Florala
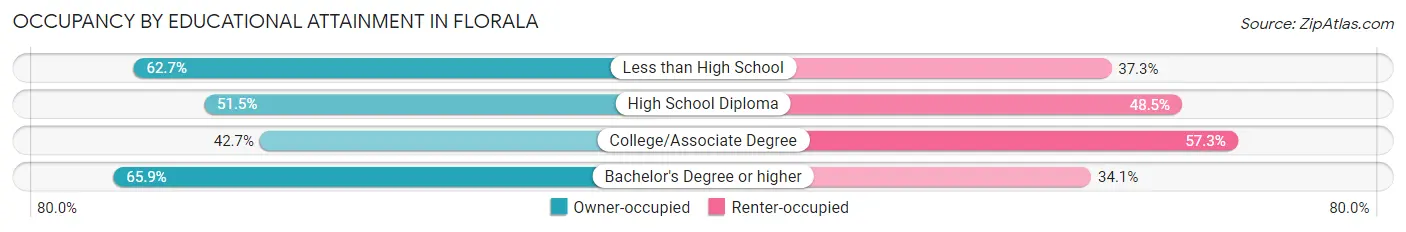
| Household Size | Owner-occupied | Renter-occupied |
| Less than High School | 74 (62.7%) | 44 (37.3%) |
| High School Diploma | 119 (51.5%) | 112 (48.5%) |
| College/Associate Degree | 117 (42.7%) | 157 (57.3%) |
| Bachelor's Degree or higher | 29 (65.9%) | 15 (34.1%) |
Occupancy by Age of Householder in Florala
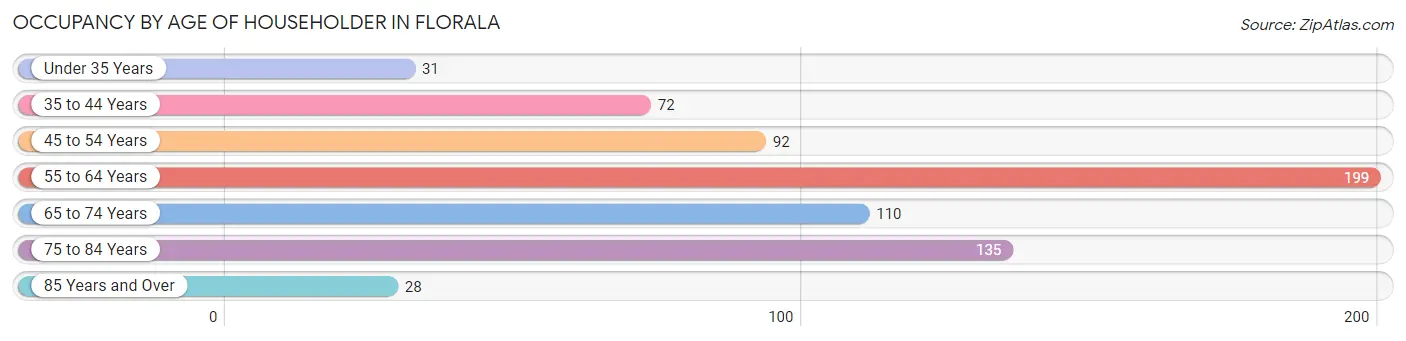
| Age Bracket | # Households | % Households |
| Under 35 Years | 31 | 4.6% |
| 35 to 44 Years | 72 | 10.8% |
| 45 to 54 Years | 92 | 13.8% |
| 55 to 64 Years | 199 | 29.8% |
| 65 to 74 Years | 110 | 16.5% |
| 75 to 84 Years | 135 | 20.2% |
| 85 Years and Over | 28 | 4.2% |
| Total | 667 | 100.0% |
Housing Finances in Florala
Median Income by Occupancy in Florala
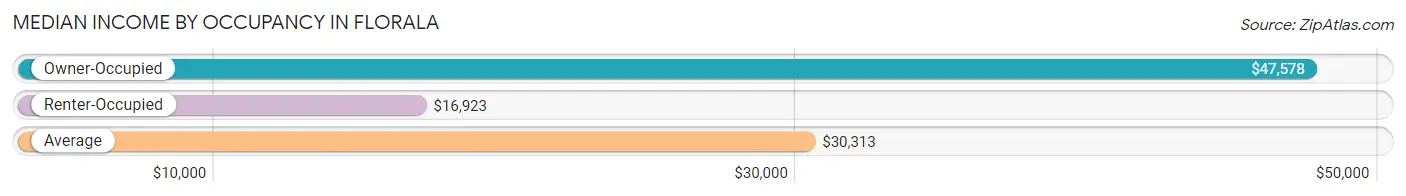
| Occupancy Type | # Households | Median Income |
| Owner-Occupied | 339 (50.8%) | $47,578 |
| Renter-Occupied | 328 (49.2%) | $16,923 |
| Average | 667 (100.0%) | $30,313 |
Occupancy by Householder Income Bracket in Florala
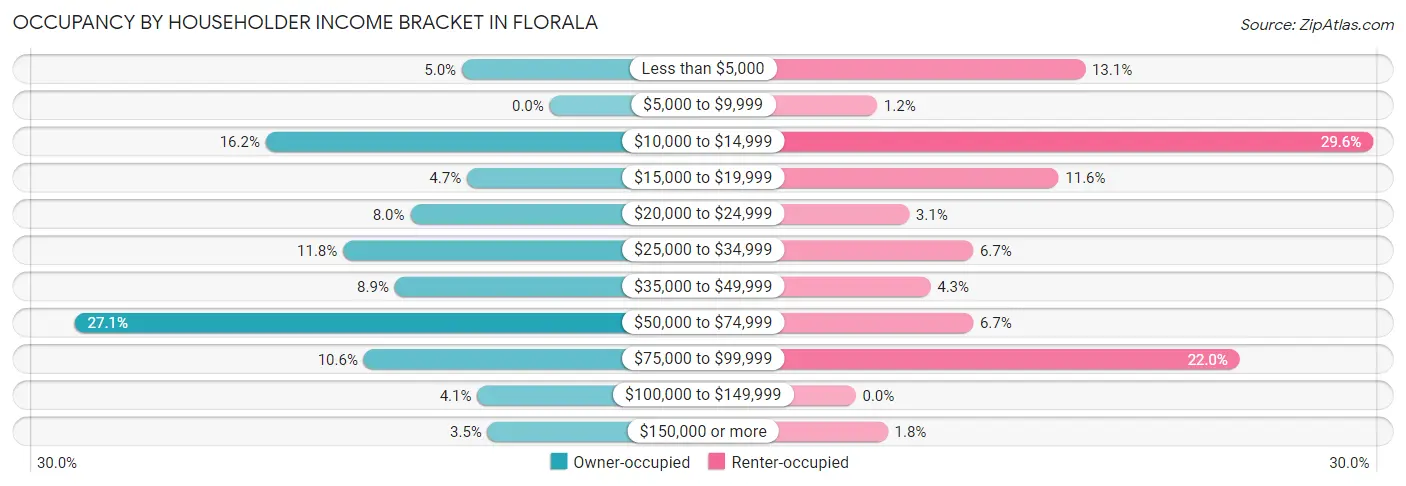
| Income Bracket | Owner-occupied | Renter-occupied |
| Less than $5,000 | 17 (5.0%) | 43 (13.1%) |
| $5,000 to $9,999 | 0 (0.0%) | 4 (1.2%) |
| $10,000 to $14,999 | 55 (16.2%) | 97 (29.6%) |
| $15,000 to $19,999 | 16 (4.7%) | 38 (11.6%) |
| $20,000 to $24,999 | 27 (8.0%) | 10 (3.0%) |
| $25,000 to $34,999 | 40 (11.8%) | 22 (6.7%) |
| $35,000 to $49,999 | 30 (8.8%) | 14 (4.3%) |
| $50,000 to $74,999 | 92 (27.1%) | 22 (6.7%) |
| $75,000 to $99,999 | 36 (10.6%) | 72 (22.0%) |
| $100,000 to $149,999 | 14 (4.1%) | 0 (0.0%) |
| $150,000 or more | 12 (3.5%) | 6 (1.8%) |
| Total | 339 (100.0%) | 328 (100.0%) |
Monthly Housing Cost Tiers in Florala
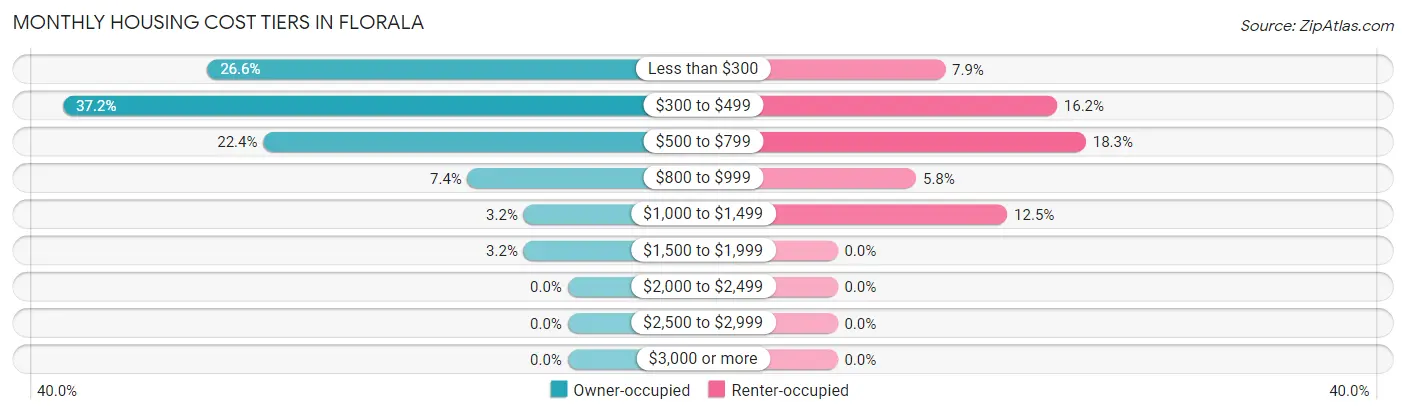
| Monthly Cost | Owner-occupied | Renter-occupied |
| Less than $300 | 90 (26.6%) | 26 (7.9%) |
| $300 to $499 | 126 (37.2%) | 53 (16.2%) |
| $500 to $799 | 76 (22.4%) | 60 (18.3%) |
| $800 to $999 | 25 (7.4%) | 19 (5.8%) |
| $1,000 to $1,499 | 11 (3.2%) | 41 (12.5%) |
| $1,500 to $1,999 | 11 (3.2%) | 0 (0.0%) |
| $2,000 to $2,499 | 0 (0.0%) | 0 (0.0%) |
| $2,500 to $2,999 | 0 (0.0%) | 0 (0.0%) |
| $3,000 or more | 0 (0.0%) | 0 (0.0%) |
| Total | 339 (100.0%) | 328 (100.0%) |
Physical Housing Characteristics in Florala
Housing Structures in Florala
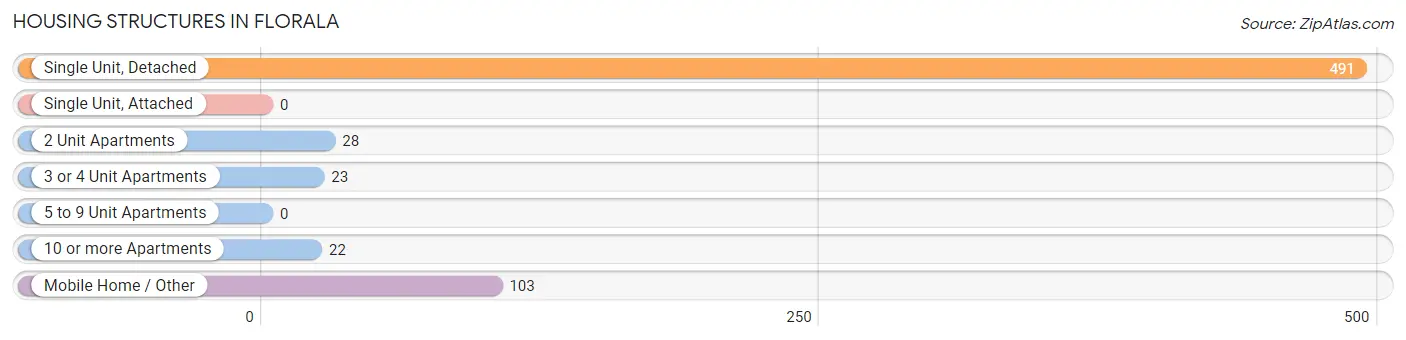
| Structure Type | # Housing Units | % Housing Units |
| Single Unit, Detached | 491 | 73.6% |
| Single Unit, Attached | 0 | 0.0% |
| 2 Unit Apartments | 28 | 4.2% |
| 3 or 4 Unit Apartments | 23 | 3.5% |
| 5 to 9 Unit Apartments | 0 | 0.0% |
| 10 or more Apartments | 22 | 3.3% |
| Mobile Home / Other | 103 | 15.4% |
| Total | 667 | 100.0% |
Housing Structures by Occupancy in Florala
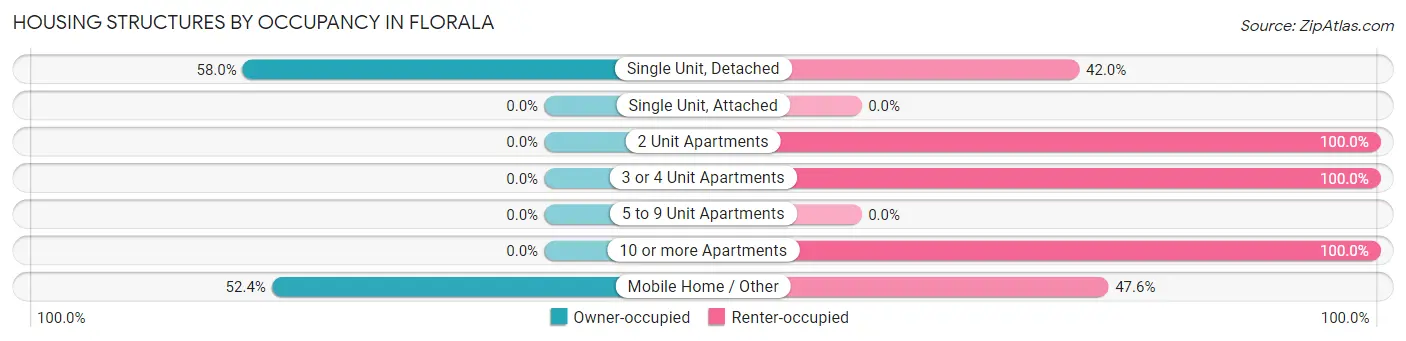
| Structure Type | Owner-occupied | Renter-occupied |
| Single Unit, Detached | 285 (58.0%) | 206 (42.0%) |
| Single Unit, Attached | 0 (0.0%) | 0 (0.0%) |
| 2 Unit Apartments | 0 (0.0%) | 28 (100.0%) |
| 3 or 4 Unit Apartments | 0 (0.0%) | 23 (100.0%) |
| 5 to 9 Unit Apartments | 0 (0.0%) | 0 (0.0%) |
| 10 or more Apartments | 0 (0.0%) | 22 (100.0%) |
| Mobile Home / Other | 54 (52.4%) | 49 (47.6%) |
| Total | 339 (50.8%) | 328 (49.2%) |
Housing Structures by Number of Rooms in Florala
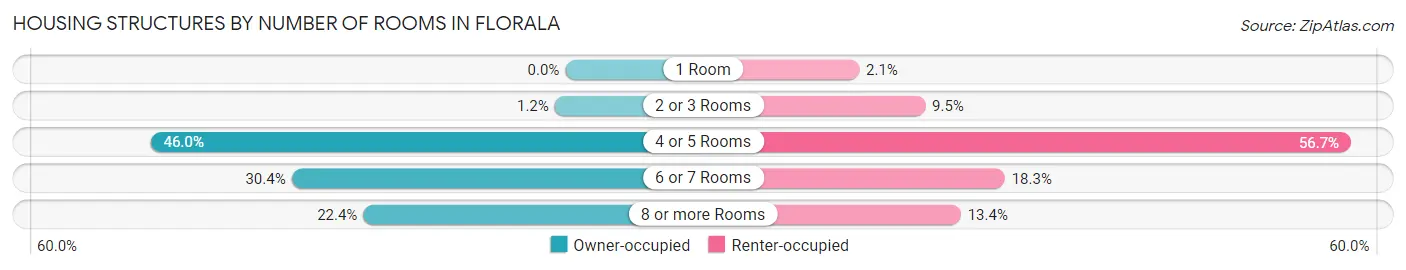
| Number of Rooms | Owner-occupied | Renter-occupied |
| 1 Room | 0 (0.0%) | 7 (2.1%) |
| 2 or 3 Rooms | 4 (1.2%) | 31 (9.5%) |
| 4 or 5 Rooms | 156 (46.0%) | 186 (56.7%) |
| 6 or 7 Rooms | 103 (30.4%) | 60 (18.3%) |
| 8 or more Rooms | 76 (22.4%) | 44 (13.4%) |
| Total | 339 (100.0%) | 328 (100.0%) |
Housing Structure by Heating Type in Florala
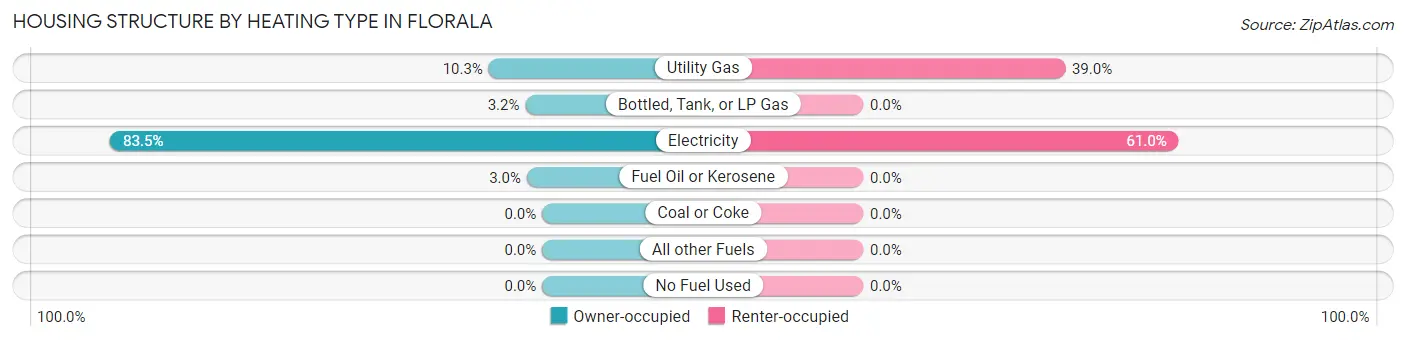
| Heating Type | Owner-occupied | Renter-occupied |
| Utility Gas | 35 (10.3%) | 128 (39.0%) |
| Bottled, Tank, or LP Gas | 11 (3.2%) | 0 (0.0%) |
| Electricity | 283 (83.5%) | 200 (61.0%) |
| Fuel Oil or Kerosene | 10 (2.9%) | 0 (0.0%) |
| Coal or Coke | 0 (0.0%) | 0 (0.0%) |
| All other Fuels | 0 (0.0%) | 0 (0.0%) |
| No Fuel Used | 0 (0.0%) | 0 (0.0%) |
| Total | 339 (100.0%) | 328 (100.0%) |
Household Vehicle Usage in Florala
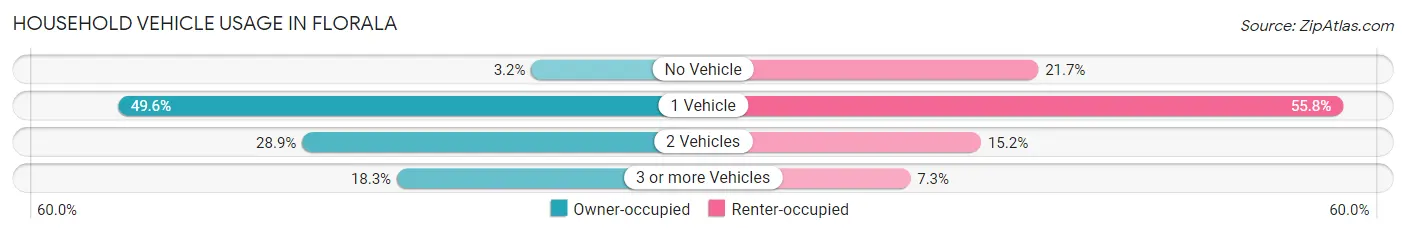
| Vehicles per Household | Owner-occupied | Renter-occupied |
| No Vehicle | 11 (3.2%) | 71 (21.6%) |
| 1 Vehicle | 168 (49.6%) | 183 (55.8%) |
| 2 Vehicles | 98 (28.9%) | 50 (15.2%) |
| 3 or more Vehicles | 62 (18.3%) | 24 (7.3%) |
| Total | 339 (100.0%) | 328 (100.0%) |
Real Estate & Mortgages in Florala
Real Estate and Mortgage Overview in Florala
| Characteristic | Without Mortgage | With Mortgage |
| Housing Units | 263 | 76 |
| Median Property Value | $100,600 | $94,500 |
| Median Household Income | $48,203 | $3 |
| Monthly Housing Costs | $406 | $0 |
| Real Estate Taxes | $239 | $9 |
Property Value by Mortgage Status in Florala
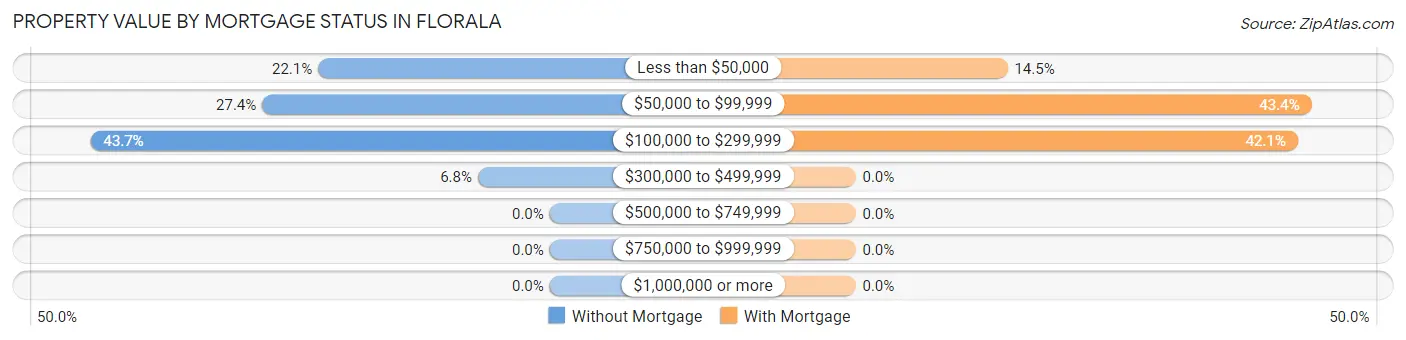
| Property Value | Without Mortgage | With Mortgage |
| Less than $50,000 | 58 (22.1%) | 11 (14.5%) |
| $50,000 to $99,999 | 72 (27.4%) | 33 (43.4%) |
| $100,000 to $299,999 | 115 (43.7%) | 32 (42.1%) |
| $300,000 to $499,999 | 18 (6.8%) | 0 (0.0%) |
| $500,000 to $749,999 | 0 (0.0%) | 0 (0.0%) |
| $750,000 to $999,999 | 0 (0.0%) | 0 (0.0%) |
| $1,000,000 or more | 0 (0.0%) | 0 (0.0%) |
| Total | 263 (100.0%) | 76 (100.0%) |
Household Income by Mortgage Status in Florala
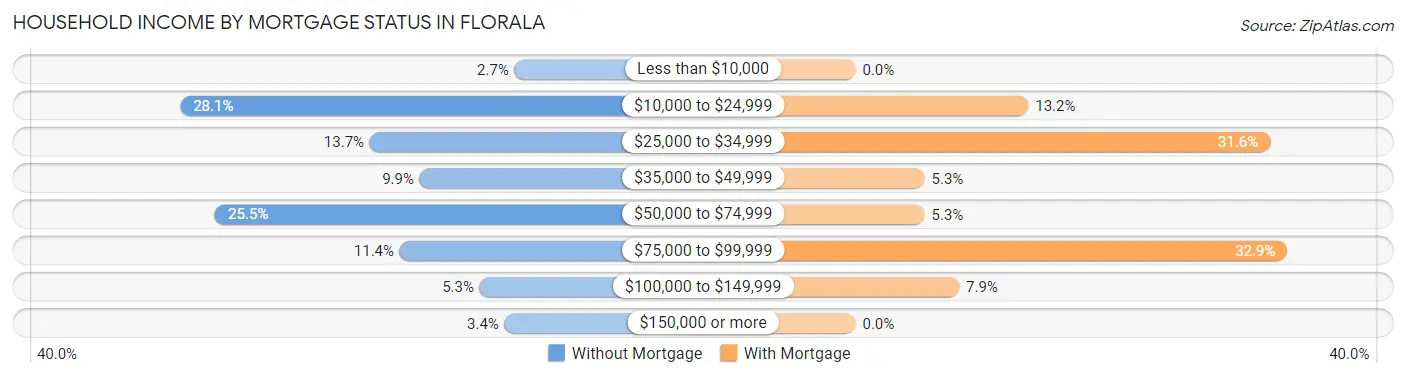
| Household Income | Without Mortgage | With Mortgage |
| Less than $10,000 | 7 (2.7%) | 0 (0.0%) |
| $10,000 to $24,999 | 74 (28.1%) | 10 (13.2%) |
| $25,000 to $34,999 | 36 (13.7%) | 24 (31.6%) |
| $35,000 to $49,999 | 26 (9.9%) | 4 (5.3%) |
| $50,000 to $74,999 | 67 (25.5%) | 4 (5.3%) |
| $75,000 to $99,999 | 30 (11.4%) | 25 (32.9%) |
| $100,000 to $149,999 | 14 (5.3%) | 6 (7.9%) |
| $150,000 or more | 9 (3.4%) | 0 (0.0%) |
| Total | 263 (100.0%) | 76 (100.0%) |
Property Value to Household Income Ratio in Florala
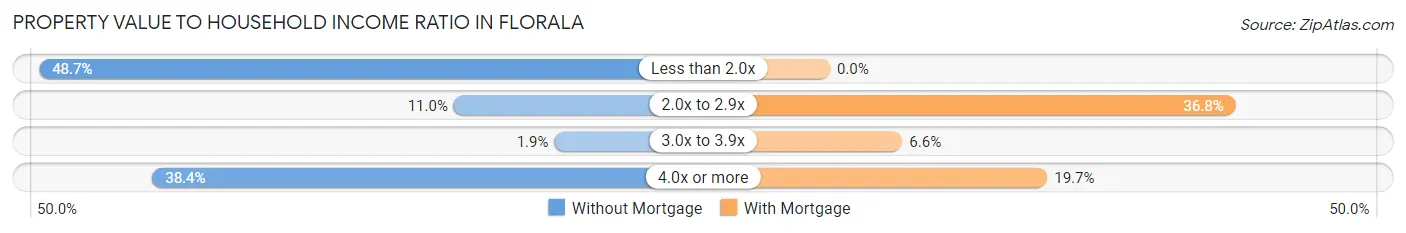
| Value-to-Income Ratio | Without Mortgage | With Mortgage |
| Less than 2.0x | 128 (48.7%) | 0 (0.0%) |
| 2.0x to 2.9x | 29 (11.0%) | 28 (36.8%) |
| 3.0x to 3.9x | 5 (1.9%) | 5 (6.6%) |
| 4.0x or more | 101 (38.4%) | 15 (19.7%) |
| Total | 263 (100.0%) | 76 (100.0%) |
Real Estate Taxes by Mortgage Status in Florala
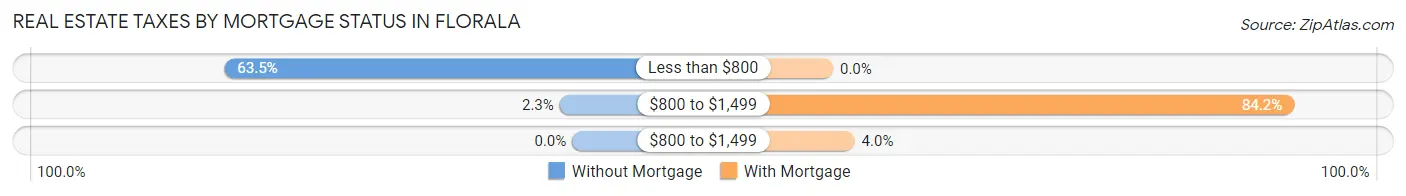
| Property Taxes | Without Mortgage | With Mortgage |
| Less than $800 | 167 (63.5%) | 0 (0.0%) |
| $800 to $1,499 | 6 (2.3%) | 64 (84.2%) |
| $800 to $1,499 | 0 (0.0%) | 3 (4.0%) |
| Total | 263 (100.0%) | 76 (100.0%) |
Health & Disability in Florala
Health Insurance Coverage by Age in Florala
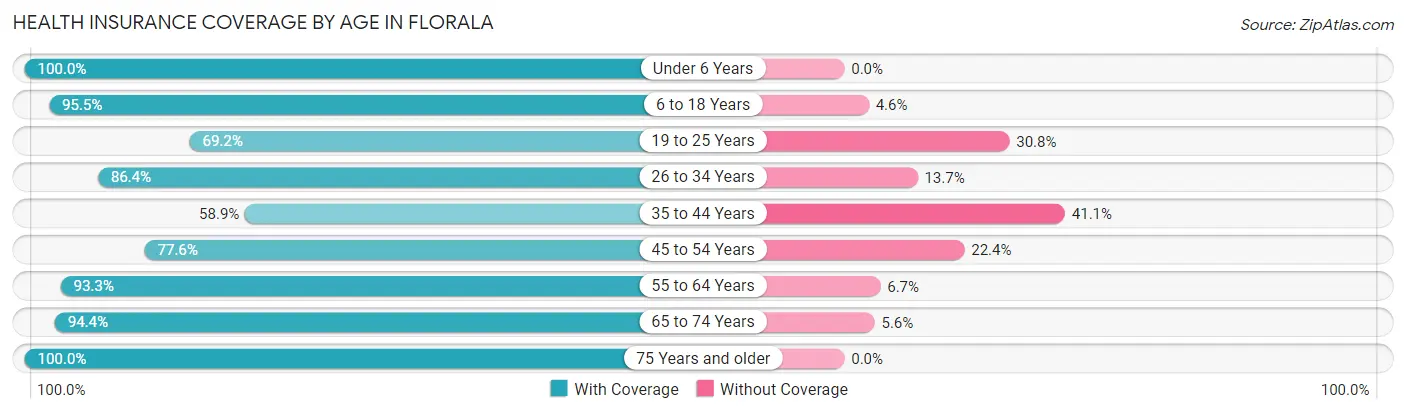
| Age Bracket | With Coverage | Without Coverage |
| Under 6 Years | 65 (100.0%) | 0 (0.0%) |
| 6 to 18 Years | 189 (95.5%) | 9 (4.5%) |
| 19 to 25 Years | 63 (69.2%) | 28 (30.8%) |
| 26 to 34 Years | 253 (86.4%) | 40 (13.7%) |
| 35 to 44 Years | 73 (58.9%) | 51 (41.1%) |
| 45 to 54 Years | 111 (77.6%) | 32 (22.4%) |
| 55 to 64 Years | 320 (93.3%) | 23 (6.7%) |
| 65 to 74 Years | 184 (94.4%) | 11 (5.6%) |
| 75 Years and older | 270 (100.0%) | 0 (0.0%) |
| Total | 1,528 (88.7%) | 194 (11.3%) |
Health Insurance Coverage by Citizenship Status in Florala
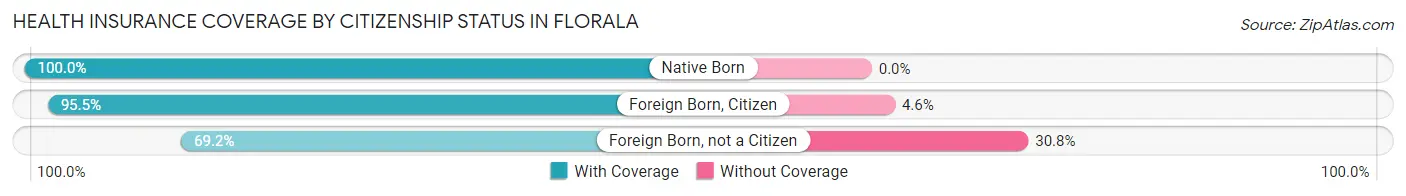
| Citizenship Status | With Coverage | Without Coverage |
| Native Born | 65 (100.0%) | 0 (0.0%) |
| Foreign Born, Citizen | 189 (95.5%) | 9 (4.5%) |
| Foreign Born, not a Citizen | 63 (69.2%) | 28 (30.8%) |
Health Insurance Coverage by Household Income in Florala
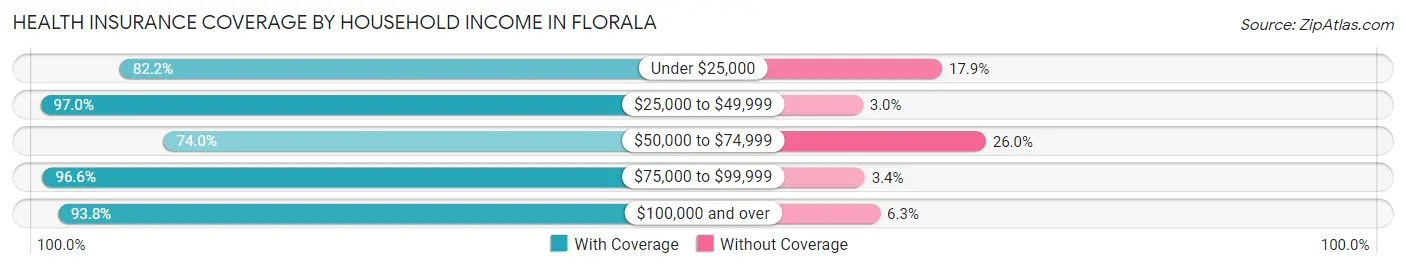
| Household Income | With Coverage | Without Coverage |
| Under $25,000 | 382 (82.2%) | 83 (17.8%) |
| $25,000 to $49,999 | 226 (97.0%) | 7 (3.0%) |
| $50,000 to $74,999 | 196 (74.0%) | 69 (26.0%) |
| $75,000 to $99,999 | 544 (96.6%) | 19 (3.4%) |
| $100,000 and over | 120 (93.8%) | 8 (6.2%) |
Public vs Private Health Insurance Coverage by Age in Florala
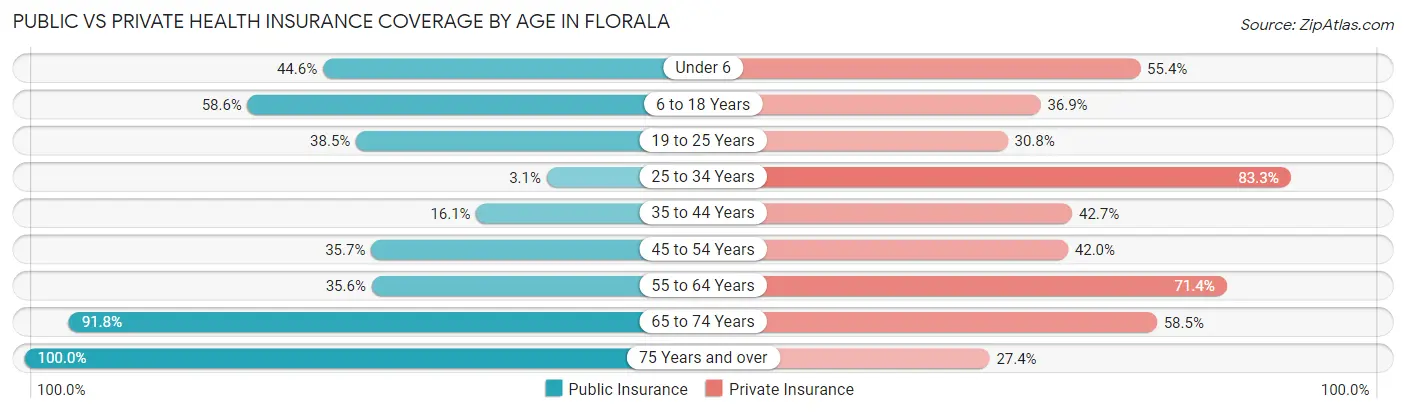
| Age Bracket | Public Insurance | Private Insurance |
| Under 6 | 29 (44.6%) | 36 (55.4%) |
| 6 to 18 Years | 116 (58.6%) | 73 (36.9%) |
| 19 to 25 Years | 35 (38.5%) | 28 (30.8%) |
| 25 to 34 Years | 9 (3.1%) | 244 (83.3%) |
| 35 to 44 Years | 20 (16.1%) | 53 (42.7%) |
| 45 to 54 Years | 51 (35.7%) | 60 (42.0%) |
| 55 to 64 Years | 122 (35.6%) | 245 (71.4%) |
| 65 to 74 Years | 179 (91.8%) | 114 (58.5%) |
| 75 Years and over | 270 (100.0%) | 74 (27.4%) |
| Total | 831 (48.3%) | 927 (53.8%) |
Disability Status by Sex by Age in Florala
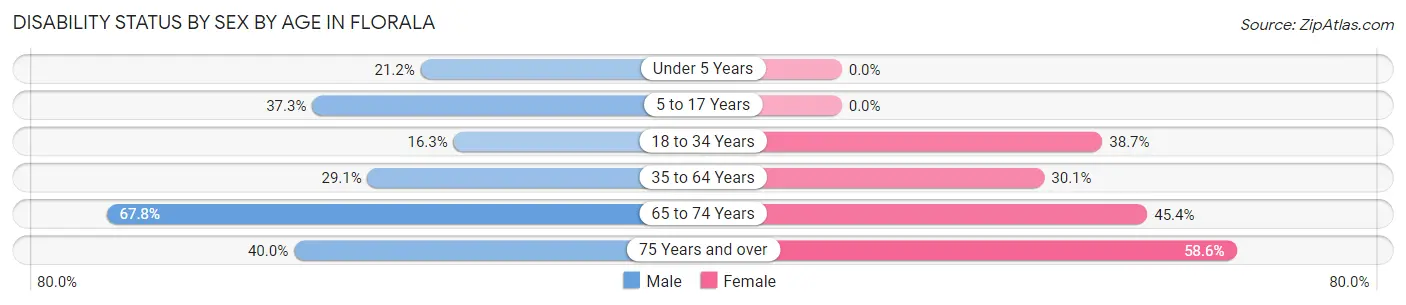
| Age Bracket | Male | Female |
| Under 5 Years | 7 (21.2%) | 0 (0.0%) |
| 5 to 17 Years | 44 (37.3%) | 0 (0.0%) |
| 18 to 34 Years | 37 (16.3%) | 65 (38.7%) |
| 35 to 64 Years | 73 (29.1%) | 108 (30.1%) |
| 65 to 74 Years | 59 (67.8%) | 49 (45.4%) |
| 75 Years and over | 52 (40.0%) | 82 (58.6%) |
Disability Class by Sex by Age in Florala
Disability Class: Hearing Difficulty
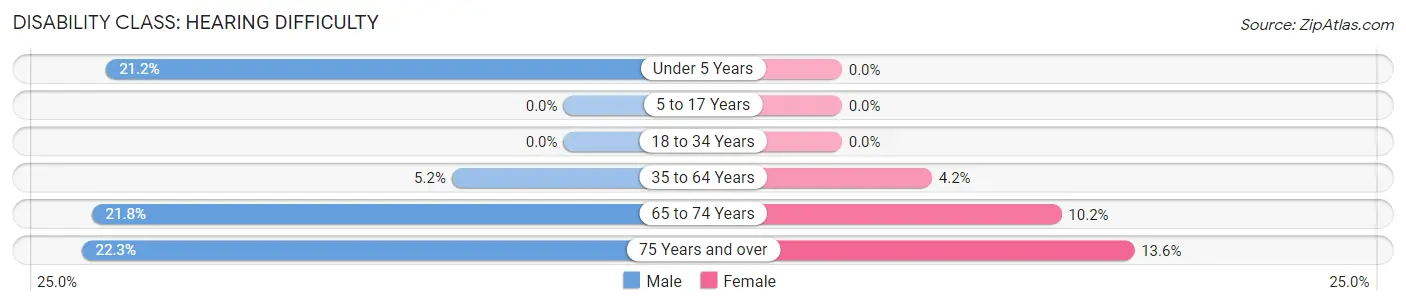
| Age Bracket | Male | Female |
| Under 5 Years | 7 (21.2%) | 0 (0.0%) |
| 5 to 17 Years | 0 (0.0%) | 0 (0.0%) |
| 18 to 34 Years | 0 (0.0%) | 0 (0.0%) |
| 35 to 64 Years | 13 (5.2%) | 15 (4.2%) |
| 65 to 74 Years | 19 (21.8%) | 11 (10.2%) |
| 75 Years and over | 29 (22.3%) | 19 (13.6%) |
Disability Class: Vision Difficulty
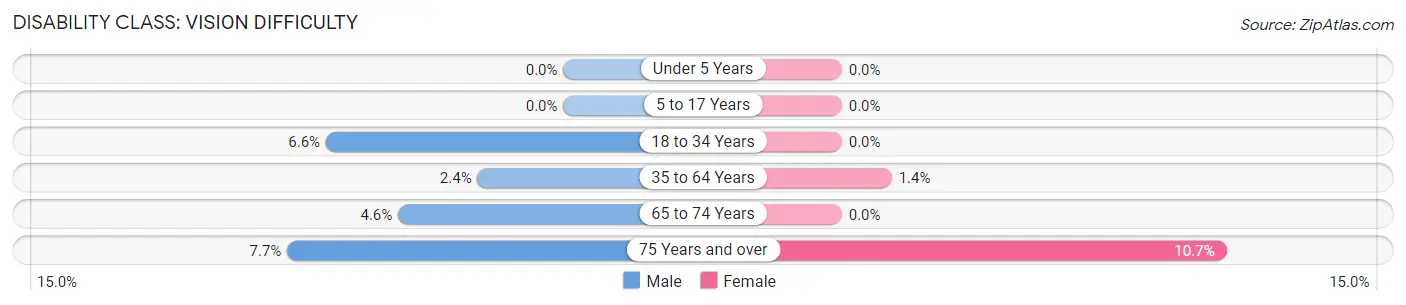
| Age Bracket | Male | Female |
| Under 5 Years | 0 (0.0%) | 0 (0.0%) |
| 5 to 17 Years | 0 (0.0%) | 0 (0.0%) |
| 18 to 34 Years | 15 (6.6%) | 0 (0.0%) |
| 35 to 64 Years | 6 (2.4%) | 5 (1.4%) |
| 65 to 74 Years | 4 (4.6%) | 0 (0.0%) |
| 75 Years and over | 10 (7.7%) | 15 (10.7%) |
Disability Class: Cognitive Difficulty
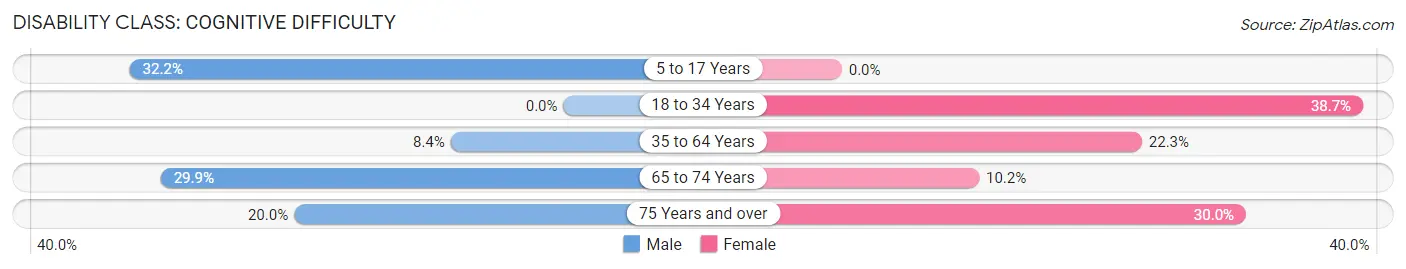
| Age Bracket | Male | Female |
| 5 to 17 Years | 38 (32.2%) | 0 (0.0%) |
| 18 to 34 Years | 0 (0.0%) | 65 (38.7%) |
| 35 to 64 Years | 21 (8.4%) | 80 (22.3%) |
| 65 to 74 Years | 26 (29.9%) | 11 (10.2%) |
| 75 Years and over | 26 (20.0%) | 42 (30.0%) |
Disability Class: Ambulatory Difficulty
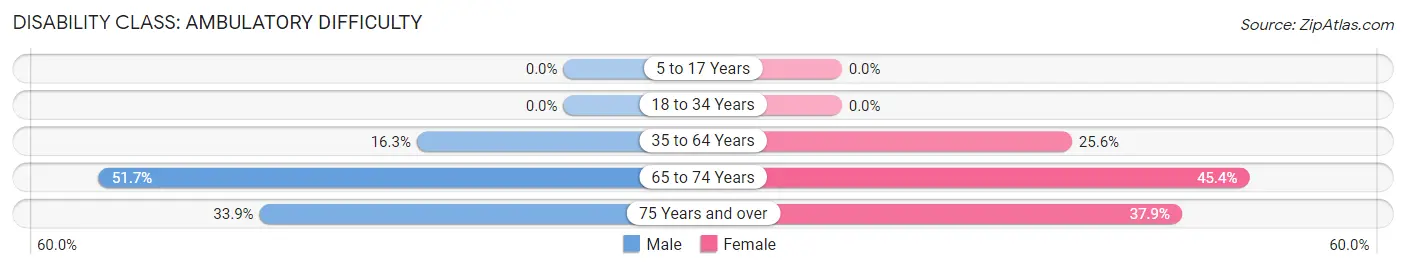
| Age Bracket | Male | Female |
| 5 to 17 Years | 0 (0.0%) | 0 (0.0%) |
| 18 to 34 Years | 0 (0.0%) | 0 (0.0%) |
| 35 to 64 Years | 41 (16.3%) | 92 (25.6%) |
| 65 to 74 Years | 45 (51.7%) | 49 (45.4%) |
| 75 Years and over | 44 (33.9%) | 53 (37.9%) |
Disability Class: Self-Care Difficulty
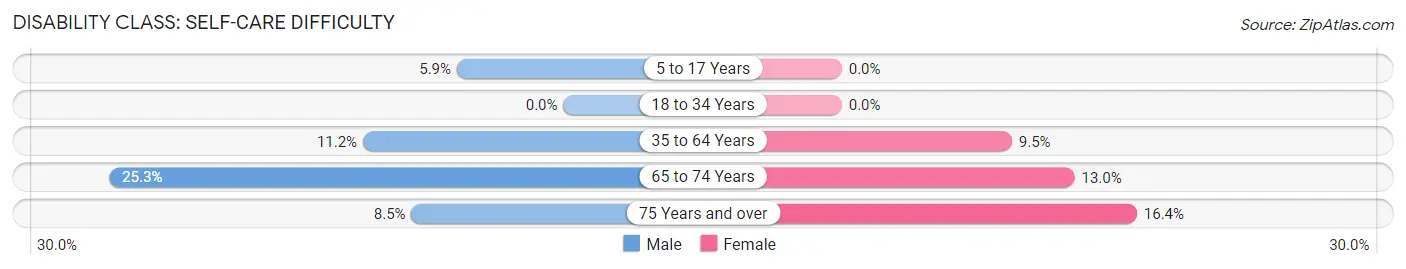
| Age Bracket | Male | Female |
| 5 to 17 Years | 7 (5.9%) | 0 (0.0%) |
| 18 to 34 Years | 0 (0.0%) | 0 (0.0%) |
| 35 to 64 Years | 28 (11.2%) | 34 (9.5%) |
| 65 to 74 Years | 22 (25.3%) | 14 (13.0%) |
| 75 Years and over | 11 (8.5%) | 23 (16.4%) |
Technology Access in Florala
Computing Device Access in Florala
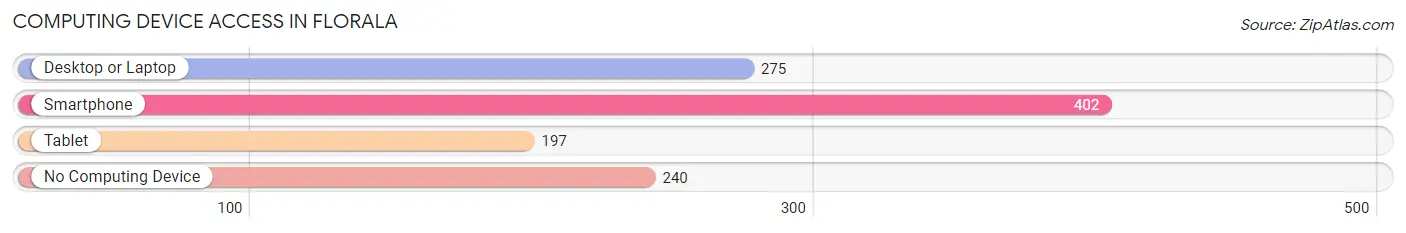
| Device Type | # Households | % Households |
| Desktop or Laptop | 275 | 41.2% |
| Smartphone | 402 | 60.3% |
| Tablet | 197 | 29.5% |
| No Computing Device | 240 | 36.0% |
| Total | 667 | 100.0% |
Internet Access in Florala
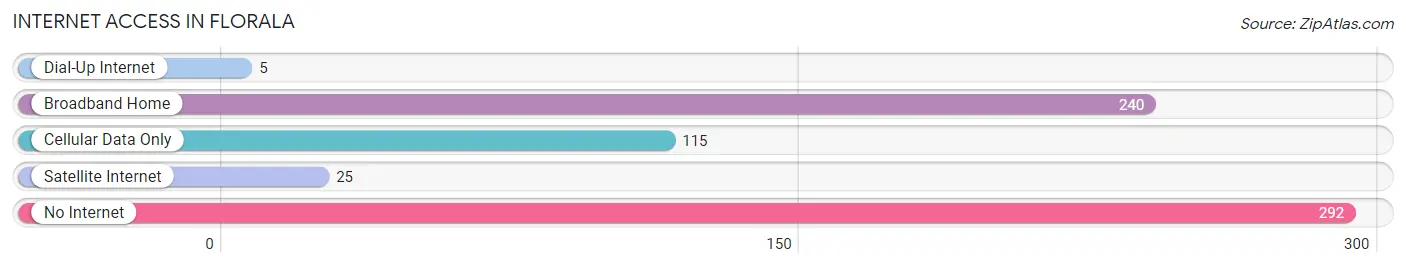
| Internet Type | # Households | % Households |
| Dial-Up Internet | 5 | 0.7% |
| Broadband Home | 240 | 36.0% |
| Cellular Data Only | 115 | 17.2% |
| Satellite Internet | 25 | 3.7% |
| No Internet | 292 | 43.8% |
| Total | 667 | 100.0% |
Florala Summary
History
The city of Florala, Alabama is located in the southeastern corner of the state, near the Florida border. It is part of Covington County and is the county seat. The city was founded in 1881 and was named after the nearby Florala Lake. The lake was named after the daughter of a local Native American chief.
The city was originally a small farming community, but it began to grow in the early 1900s when the railroad came through. The railroad brought new businesses and industries to the area, and the population began to grow. The city was incorporated in 1909 and by the 1920s, it had become a thriving small town.
The city continued to grow throughout the 20th century, and by the 2000 census, the population had reached 2,945. The city is still a small town, but it has become a popular tourist destination due to its proximity to the Florida border and its many outdoor activities.
Geography
Florala is located in the southeastern corner of Alabama, near the Florida border. It is part of Covington County and is the county seat. The city is situated on the banks of the Choctawhatchee River, which flows into the nearby Lake Jackson. The city is surrounded by forests and rolling hills, and it is located in the Gulf Coastal Plain region of the state.
The climate in Florala is humid subtropical, with hot, humid summers and mild winters. The average annual temperature is around 70 degrees Fahrenheit, and the average annual precipitation is around 50 inches.
Economy
The economy of Florala is largely based on agriculture and tourism. The city is home to several farms, and the surrounding area is known for its production of cotton, peanuts, and other crops. The city is also home to several manufacturing companies, including a paper mill and a furniture factory.
Tourism is an important part of the local economy, as the city is located near the Florida border and is a popular destination for outdoor activities. The city is home to several parks and recreational areas, including the Florala State Park. The city also hosts several festivals and events throughout the year, including the annual Florala Festival.
Demographics
As of the 2000 census, the population of Florala was 2,945. The racial makeup of the city was 79.3% White, 19.2% African American, 0.3% Native American, 0.2% Asian, 0.1% Pacific Islander, and 0.9% from other races. Hispanic or Latino of any race were 1.2% of the population.
The median income for a household in the city was $25,938, and the median income for a family was $31,250. The per capita income for the city was $14,945. About 17.2% of families and 20.2% of the population were below the poverty line, including 28.3% of those under age 18 and 16.2% of those age 65 or over.
Common Questions
What is Per Capita Income in Florala?
Per Capita income in Florala is $24,824.
What is the Median Family Income in Florala?
Median Family Income in Florala is $64,833.
What is the Median Household income in Florala?
Median Household Income in Florala is $30,313.
What is Income or Wage Gap in Florala?
Income or Wage Gap in Florala is 37.8%.
Women in Florala earn 62.2 cents for every dollar earned by a man.
What is Inequality or Gini Index in Florala?
Inequality or Gini Index in Florala is 0.58.
What is the Total Population of Florala?
Total Population of Florala is 1,745.
What is the Total Male Population of Florala?
Total Male Population of Florala is 860.
What is the Total Female Population of Florala?
Total Female Population of Florala is 885.
What is the Ratio of Males per 100 Females in Florala?
There are 97.18 Males per 100 Females in Florala.
What is the Ratio of Females per 100 Males in Florala?
There are 102.91 Females per 100 Males in Florala.
What is the Median Population Age in Florala?
Median Population Age in Florala is 53.1 Years.
What is the Average Family Size in Florala
Average Family Size in Florala is 4.0 People.
What is the Average Household Size in Florala
Average Household Size in Florala is 2.5 People.
How Large is the Labor Force in Florala?
There are 634 People in the Labor Forcein in Florala.
What is the Percentage of People in the Labor Force in Florala?
41.8% of People are in the Labor Force in Florala.
What is the Unemployment Rate in Florala?
Unemployment Rate in Florala is 2.6%.