Sand Rock, AL Map & Demographics
Sand Rock Map
Sand Rock Overview
$32,841
PER CAPITA INCOME
$73,750
AVG FAMILY INCOME
$68,438
AVG HOUSEHOLD INCOME
15.6%
WAGE / INCOME GAP [ % ]
84.4¢/ $1
WAGE / INCOME GAP [ $ ]
0.37
INEQUALITY / GINI INDEX
720
TOTAL POPULATION
434
MALE POPULATION
286
FEMALE POPULATION
151.75
MALES / 100 FEMALES
65.90
FEMALES / 100 MALES
47.0
MEDIAN AGE
3.2
AVG FAMILY SIZE
2.7
AVG HOUSEHOLD SIZE
296
LABOR FORCE [ PEOPLE ]
48.8%
PERCENT IN LABOR FORCE
4.7%
UNEMPLOYMENT RATE
Sand Rock Area Codes
Income in Sand Rock
Income Overview in Sand Rock
Per Capita Income in Sand Rock is $32,841, while median incomes of families and households are $73,750 and $68,438 respectively.
| Characteristic | Number | Measure |
| Per Capita Income | 720 | $32,841 |
| Median Family Income | 184 | $73,750 |
| Mean Family Income | 184 | $85,830 |
| Median Household Income | 271 | $68,438 |
| Mean Household Income | 271 | $79,383 |
| Income Deficit | 184 | $0 |
| Wage / Income Gap (%) | 720 | 15.59% |
| Wage / Income Gap ($) | 720 | 84.41¢ per $1 |
| Gini / Inequality Index | 720 | 0.37 |
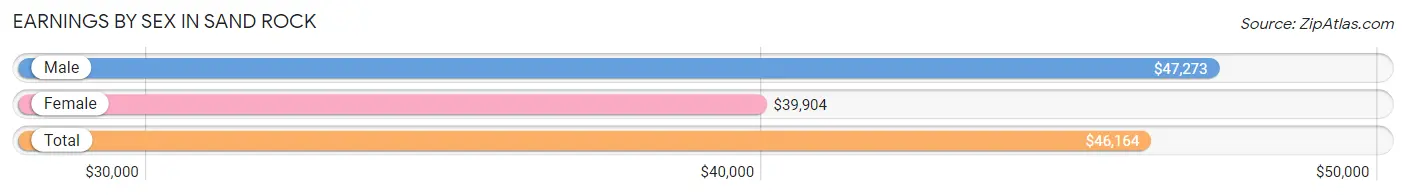
Earnings by Sex in Sand Rock
Average Earnings in Sand Rock are $46,164, $47,273 for men and $39,904 for women, a difference of 15.6%.
| Sex | Number | Average Earnings |
| Male | 154 (49.5%) | $47,273 |
| Female | 157 (50.5%) | $39,904 |
| Total | 311 (100.0%) | $46,164 |
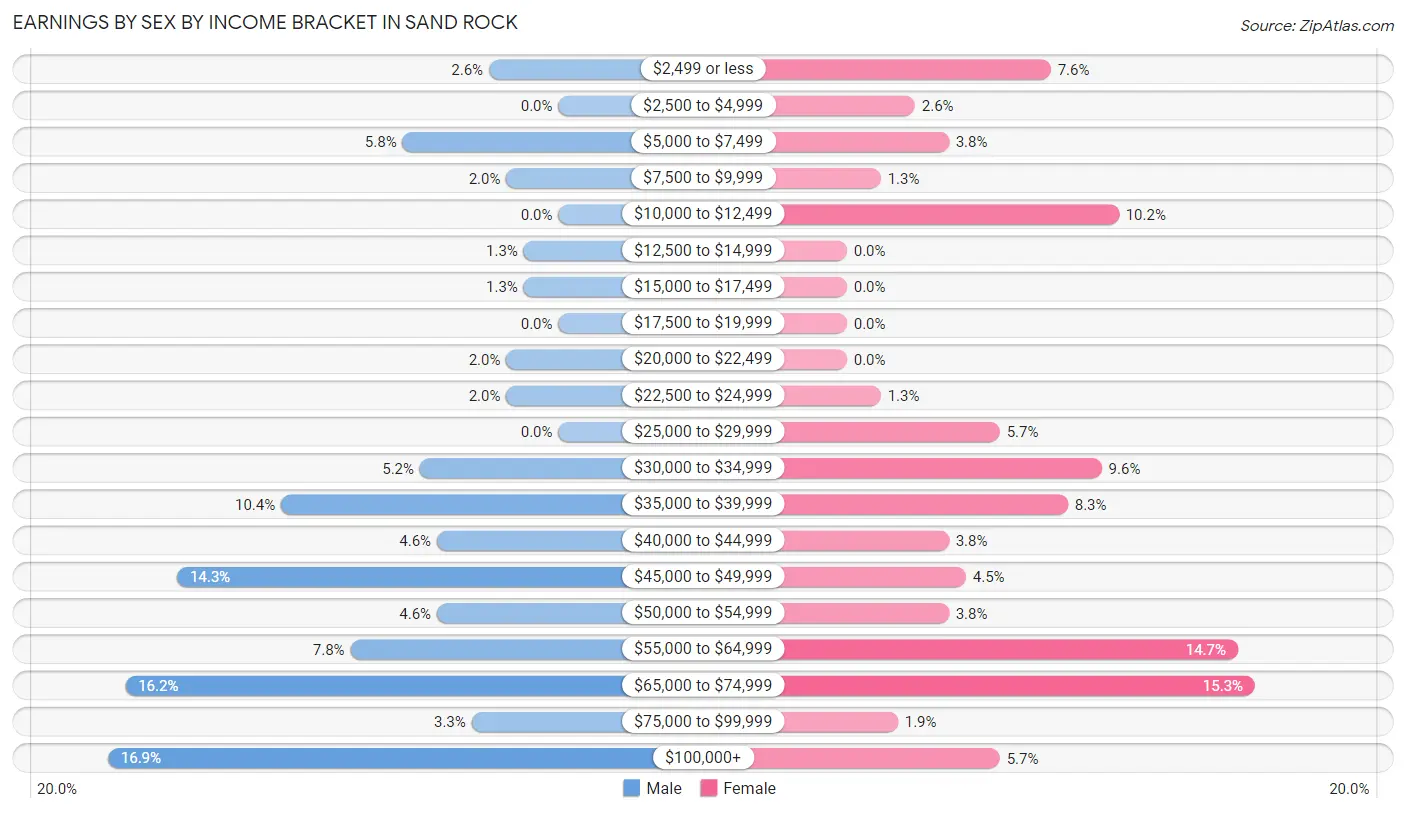
Earnings by Sex by Income Bracket in Sand Rock
The most common earnings brackets in Sand Rock are $100,000+ for men (26 | 16.9%) and $65,000 to $74,999 for women (24 | 15.3%).
| Income | Male | Female |
| $2,499 or less | 4 (2.6%) | 12 (7.6%) |
| $2,500 to $4,999 | 0 (0.0%) | 4 (2.5%) |
| $5,000 to $7,499 | 9 (5.8%) | 6 (3.8%) |
| $7,500 to $9,999 | 3 (1.9%) | 2 (1.3%) |
| $10,000 to $12,499 | 0 (0.0%) | 16 (10.2%) |
| $12,500 to $14,999 | 2 (1.3%) | 0 (0.0%) |
| $15,000 to $17,499 | 2 (1.3%) | 0 (0.0%) |
| $17,500 to $19,999 | 0 (0.0%) | 0 (0.0%) |
| $20,000 to $22,499 | 3 (1.9%) | 0 (0.0%) |
| $22,500 to $24,999 | 3 (1.9%) | 2 (1.3%) |
| $25,000 to $29,999 | 0 (0.0%) | 9 (5.7%) |
| $30,000 to $34,999 | 8 (5.2%) | 15 (9.6%) |
| $35,000 to $39,999 | 16 (10.4%) | 13 (8.3%) |
| $40,000 to $44,999 | 7 (4.5%) | 6 (3.8%) |
| $45,000 to $49,999 | 22 (14.3%) | 7 (4.5%) |
| $50,000 to $54,999 | 7 (4.5%) | 6 (3.8%) |
| $55,000 to $64,999 | 12 (7.8%) | 23 (14.6%) |
| $65,000 to $74,999 | 25 (16.2%) | 24 (15.3%) |
| $75,000 to $99,999 | 5 (3.3%) | 3 (1.9%) |
| $100,000+ | 26 (16.9%) | 9 (5.7%) |
| Total | 154 (100.0%) | 157 (100.0%) |
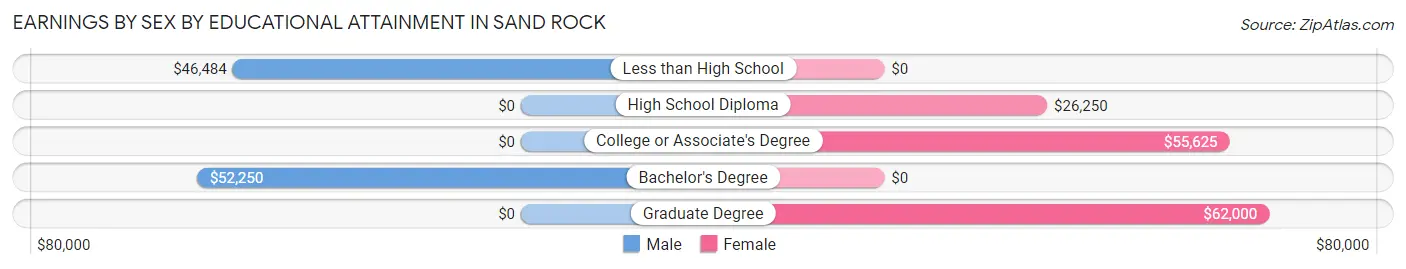
Earnings by Sex by Educational Attainment in Sand Rock
Average earnings in Sand Rock are $50,536 for men and $45,179 for women, a difference of 10.6%. Men with an educational attainment of bachelor's degree enjoy the highest average annual earnings of $52,250, while those with less than high school education earn the least with $46,484. Women with an educational attainment of graduate degree earn the most with the average annual earnings of $62,000, while those with high school diploma education have the smallest earnings of $26,250.
| Educational Attainment | Male Income | Female Income |
| Less than High School | $46,484 | $0 |
| High School Diploma | - | - |
| College or Associate's Degree | - | - |
| Bachelor's Degree | $52,250 | $0 |
| Graduate Degree | - | - |
| Total | $50,536 | $45,179 |
Family Income in Sand Rock
Family Income Brackets in Sand Rock
According to the Sand Rock family income data, there are 53 families falling into the $50,000 to $74,999 income range, which is the most common income bracket and makes up 28.8% of all families. Conversely, the $10,000 to $14,999 income bracket is the least frequent group with only 3 families (1.6%) belonging to this category.
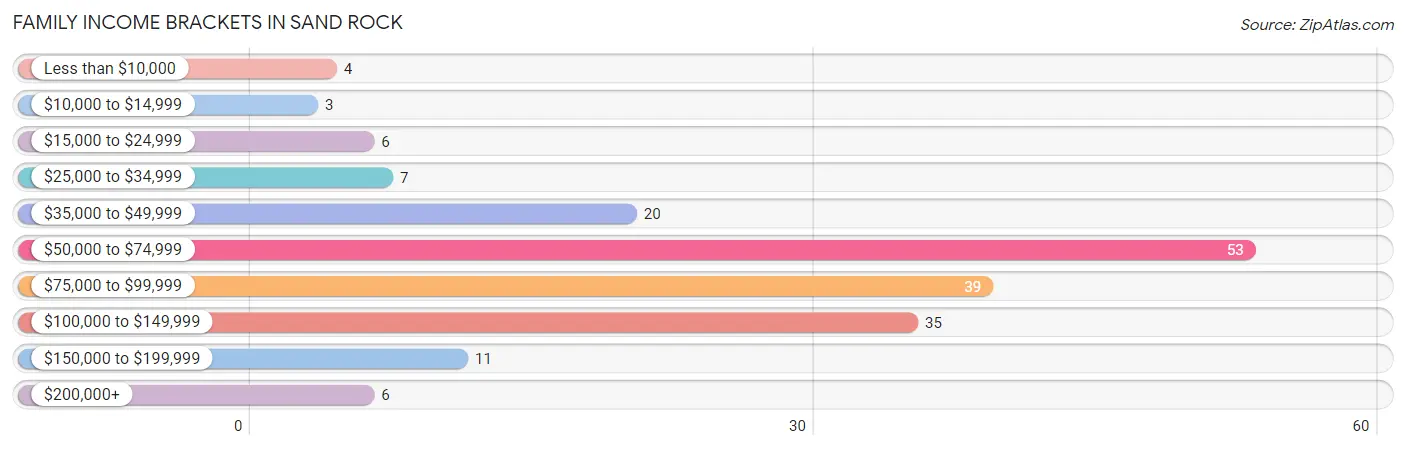
| Income Bracket | # Families | % Families |
| Less than $10,000 | 4 | 2.2% |
| $10,000 to $14,999 | 3 | 1.6% |
| $15,000 to $24,999 | 6 | 3.3% |
| $25,000 to $34,999 | 7 | 3.8% |
| $35,000 to $49,999 | 20 | 10.9% |
| $50,000 to $74,999 | 53 | 28.8% |
| $75,000 to $99,999 | 39 | 21.2% |
| $100,000 to $149,999 | 35 | 19.0% |
| $150,000 to $199,999 | 11 | 6.0% |
| $200,000+ | 6 | 3.3% |
Family Income by Famaliy Size in Sand Rock
3-person families (25 | 13.6%) account for the highest median family income in Sand Rock with $142,679 per family, while 3-person families (25 | 13.6%) have the highest median income of $47,560 per family member.
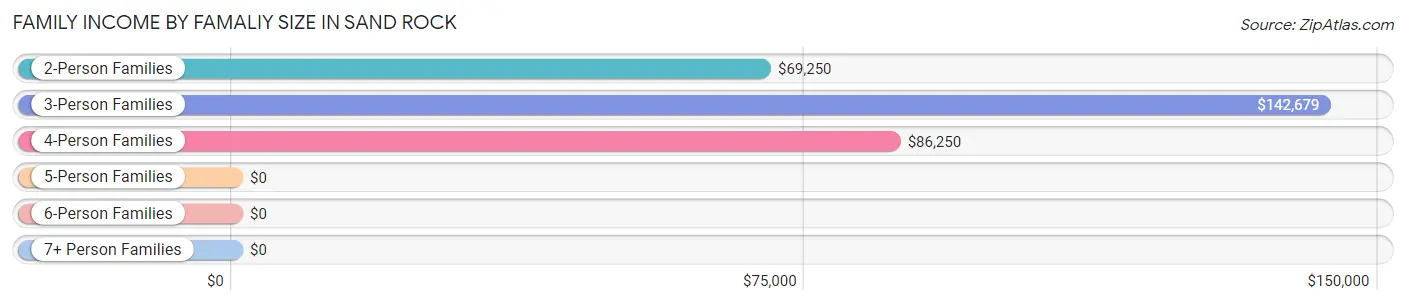
| Income Bracket | # Families | Median Income |
| 2-Person Families | 124 (67.4%) | $69,250 |
| 3-Person Families | 25 (13.6%) | $142,679 |
| 4-Person Families | 16 (8.7%) | $86,250 |
| 5-Person Families | 13 (7.1%) | $0 |
| 6-Person Families | 6 (3.3%) | $0 |
| 7+ Person Families | 0 (0.0%) | $0 |
| Total | 184 (100.0%) | $73,750 |
Family Income by Number of Earners in Sand Rock
The median family income in Sand Rock is $73,750, with families comprising 3+ earners (10) having the highest median family income of $193,333, while families with 1 earner (74) have the lowest median family income of $56,875, accounting for 5.4% and 40.2% of families, respectively.
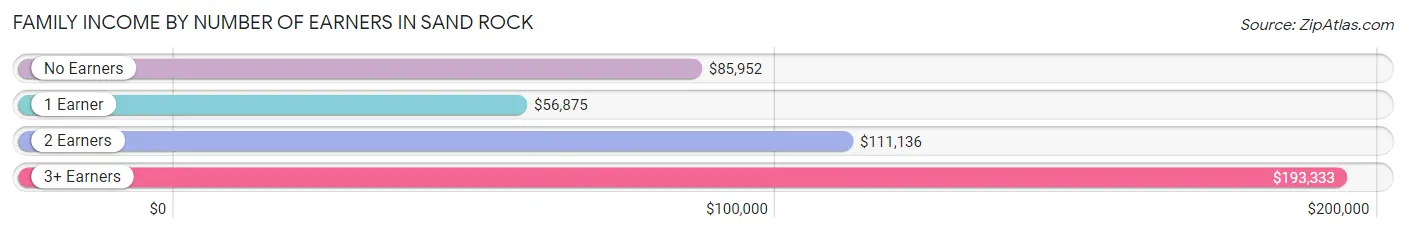
| Number of Earners | # Families | Median Income |
| No Earners | 38 (20.6%) | $85,952 |
| 1 Earner | 74 (40.2%) | $56,875 |
| 2 Earners | 62 (33.7%) | $111,136 |
| 3+ Earners | 10 (5.4%) | $193,333 |
| Total | 184 (100.0%) | $73,750 |
Household Income in Sand Rock
Household Income Brackets in Sand Rock
With 65 households falling in the category, the $50,000 to $74,999 income range is the most frequent in Sand Rock, accounting for 24.0% of all households. In contrast, only 6 households (2.2%) fall into the $10,000 to $14,999 income bracket, making it the least populous group.
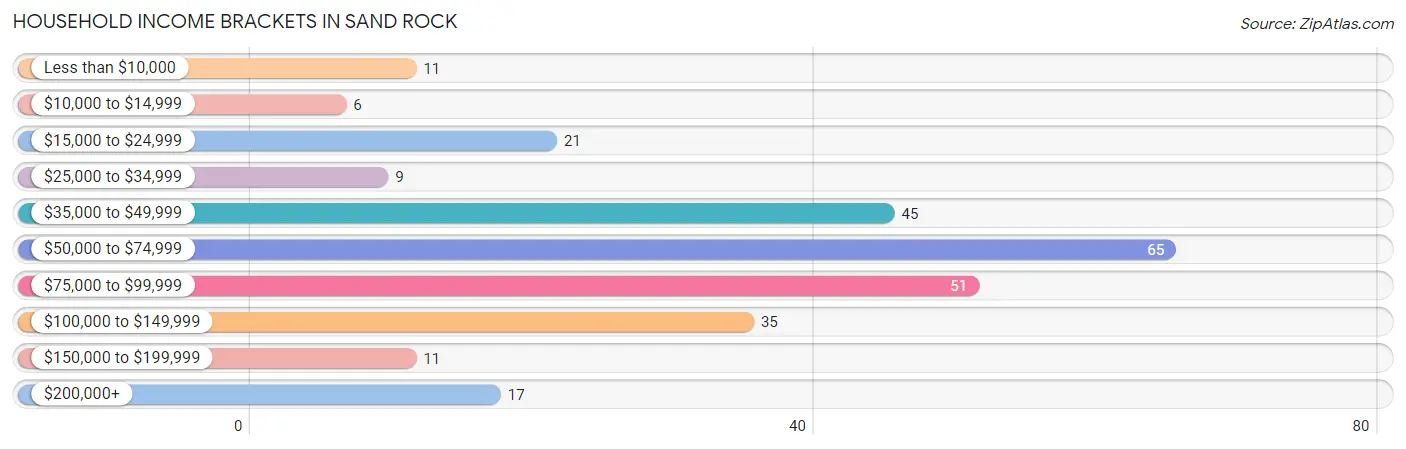
| Income Bracket | # Households | % Households |
| Less than $10,000 | 11 | 4.1% |
| $10,000 to $14,999 | 6 | 2.2% |
| $15,000 to $24,999 | 21 | 7.7% |
| $25,000 to $34,999 | 9 | 3.3% |
| $35,000 to $49,999 | 45 | 16.6% |
| $50,000 to $74,999 | 65 | 24.0% |
| $75,000 to $99,999 | 51 | 18.8% |
| $100,000 to $149,999 | 35 | 12.9% |
| $150,000 to $199,999 | 11 | 4.1% |
| $200,000+ | 17 | 6.3% |
Household Income by Householder Age in Sand Rock
The median household income in Sand Rock is $68,438, with the highest median household income of $70,893 found in the 45 to 64 years age bracket for the primary householder. A total of 133 households (49.1%) fall into this category. Meanwhile, the 15 to 24 years age bracket for the primary householder has the lowest median household income of $0, with 2 households (0.7%) in this group.
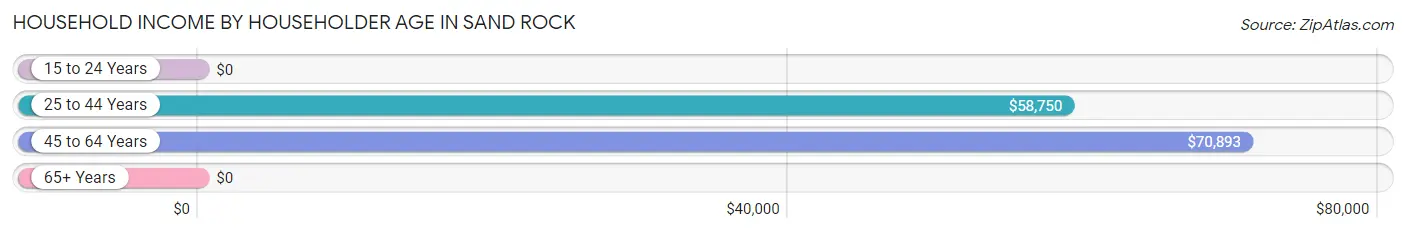
| Income Bracket | # Households | Median Income |
| 15 to 24 Years | 2 (0.7%) | $0 |
| 25 to 44 Years | 46 (17.0%) | $58,750 |
| 45 to 64 Years | 133 (49.1%) | $70,893 |
| 65+ Years | 90 (33.2%) | $0 |
| Total | 271 (100.0%) | $68,438 |
Poverty in Sand Rock
Income Below Poverty by Sex and Age in Sand Rock
With 13.6% poverty level for males and 6.3% for females among the residents of Sand Rock, 35 to 44 year old males and 18 to 24 year old females are the most vulnerable to poverty, with 29 males (41.4%) and 5 females (35.7%) in their respective age groups living below the poverty level.
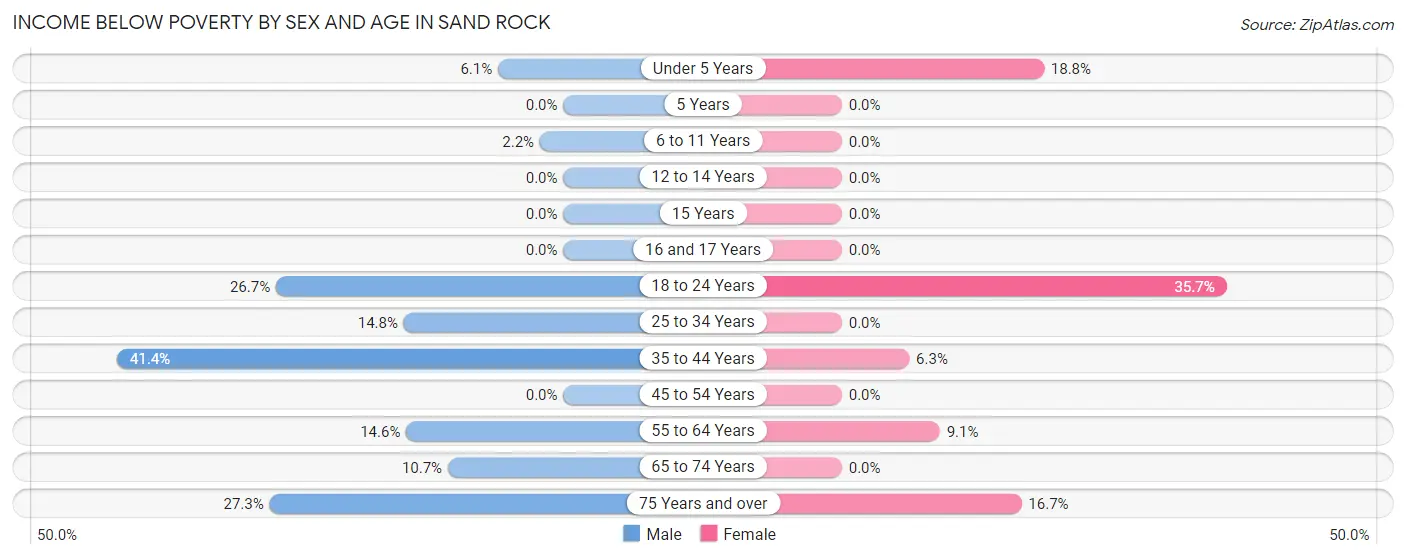
| Age Bracket | Male | Female |
| Under 5 Years | 2 (6.1%) | 3 (18.8%) |
| 5 Years | 0 (0.0%) | 0 (0.0%) |
| 6 to 11 Years | 1 (2.2%) | 0 (0.0%) |
| 12 to 14 Years | 0 (0.0%) | 0 (0.0%) |
| 15 Years | 0 (0.0%) | 0 (0.0%) |
| 16 and 17 Years | 0 (0.0%) | 0 (0.0%) |
| 18 to 24 Years | 4 (26.7%) | 5 (35.7%) |
| 25 to 34 Years | 4 (14.8%) | 0 (0.0%) |
| 35 to 44 Years | 29 (41.4%) | 2 (6.2%) |
| 45 to 54 Years | 0 (0.0%) | 0 (0.0%) |
| 55 to 64 Years | 7 (14.6%) | 5 (9.1%) |
| 65 to 74 Years | 9 (10.7%) | 0 (0.0%) |
| 75 Years and over | 3 (27.3%) | 3 (16.7%) |
| Total | 59 (13.6%) | 18 (6.3%) |
Income Above Poverty by Sex and Age in Sand Rock
According to the poverty statistics in Sand Rock, males aged 12 to 14 years and females aged 6 to 11 years are the age groups that are most secure financially, with 100.0% of males and 100.0% of females in these age groups living above the poverty line.
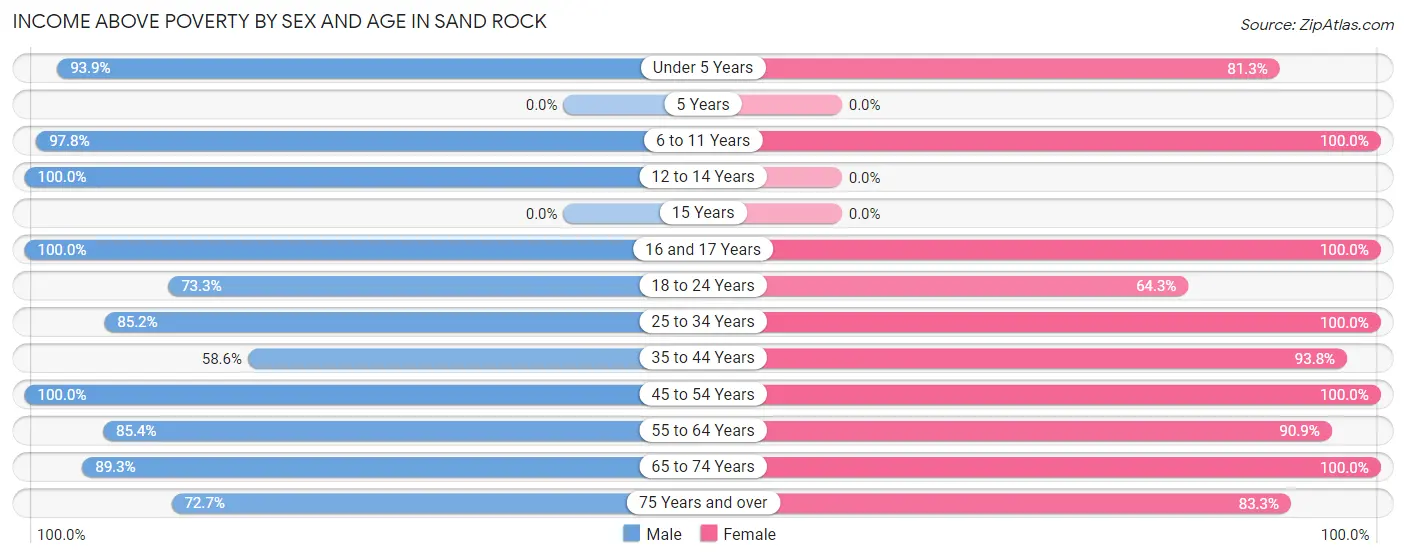
| Age Bracket | Male | Female |
| Under 5 Years | 31 (93.9%) | 13 (81.2%) |
| 5 Years | 0 (0.0%) | 0 (0.0%) |
| 6 to 11 Years | 45 (97.8%) | 9 (100.0%) |
| 12 to 14 Years | 10 (100.0%) | 0 (0.0%) |
| 15 Years | 0 (0.0%) | 0 (0.0%) |
| 16 and 17 Years | 30 (100.0%) | 2 (100.0%) |
| 18 to 24 Years | 11 (73.3%) | 9 (64.3%) |
| 25 to 34 Years | 23 (85.2%) | 37 (100.0%) |
| 35 to 44 Years | 41 (58.6%) | 30 (93.8%) |
| 45 to 54 Years | 60 (100.0%) | 42 (100.0%) |
| 55 to 64 Years | 41 (85.4%) | 50 (90.9%) |
| 65 to 74 Years | 75 (89.3%) | 61 (100.0%) |
| 75 Years and over | 8 (72.7%) | 15 (83.3%) |
| Total | 375 (86.4%) | 268 (93.7%) |
Income Below Poverty Among Married-Couple Families in Sand Rock
The poverty statistics for married-couple families in Sand Rock show that 3.8% or 5 of the total 130 families live below the poverty line. Families with 1 or 2 children have the highest poverty rate of 10.0%, comprising of 2 families. On the other hand, families with 3 or 4 children have the lowest poverty rate of 0.0%, which includes 0 families.
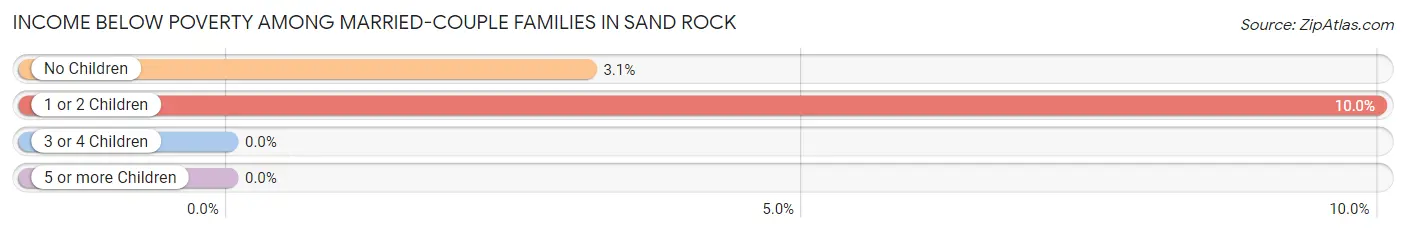
| Children | Above Poverty | Below Poverty |
| No Children | 93 (96.9%) | 3 (3.1%) |
| 1 or 2 Children | 18 (90.0%) | 2 (10.0%) |
| 3 or 4 Children | 14 (100.0%) | 0 (0.0%) |
| 5 or more Children | 0 (0.0%) | 0 (0.0%) |
| Total | 125 (96.2%) | 5 (3.8%) |
Income Below Poverty Among Single-Parent Households in Sand Rock
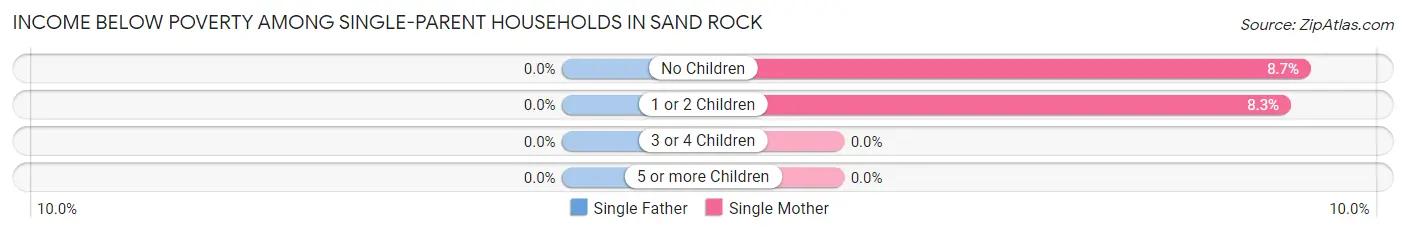
| Children | Single Father | Single Mother |
| No Children | 0 (0.0%) | 2 (8.7%) |
| 1 or 2 Children | 0 (0.0%) | 2 (8.3%) |
| 3 or 4 Children | 0 (0.0%) | 0 (0.0%) |
| 5 or more Children | 0 (0.0%) | 0 (0.0%) |
| Total | 0 (0.0%) | 4 (7.7%) |
Income Below Poverty Among Married-Couple vs Single-Parent Households in Sand Rock
The poverty data for Sand Rock shows that 5 of the married-couple family households (3.8%) and 4 of the single-parent households (7.4%) are living below the poverty level. Within the married-couple family households, those with 1 or 2 children have the highest poverty rate, with 2 households (10.0%) falling below the poverty line. Among the single-parent households, those with 1 or 2 children have the highest poverty rate, with 2 household (8.3%) living below poverty.
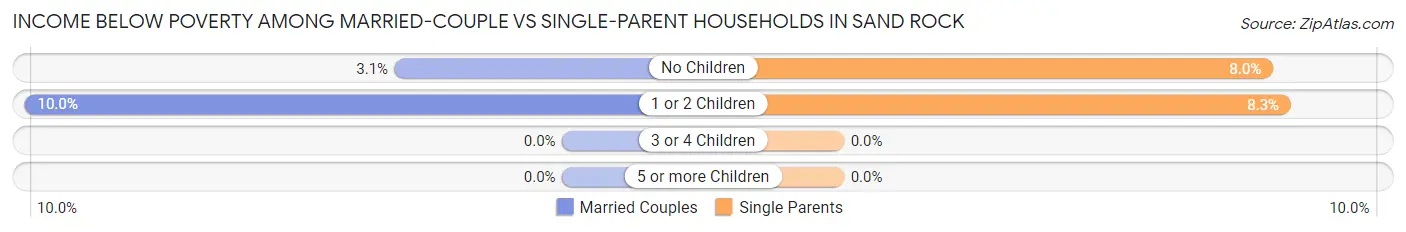
| Children | Married-Couple Families | Single-Parent Households |
| No Children | 3 (3.1%) | 2 (8.0%) |
| 1 or 2 Children | 2 (10.0%) | 2 (8.3%) |
| 3 or 4 Children | 0 (0.0%) | 0 (0.0%) |
| 5 or more Children | 0 (0.0%) | 0 (0.0%) |
| Total | 5 (3.8%) | 4 (7.4%) |
Race in Sand Rock
The most populous races in Sand Rock are White / Caucasian (696 | 96.7%), Hispanic or Latino (23 | 3.2%), and Two or more Races (15 | 2.1%).
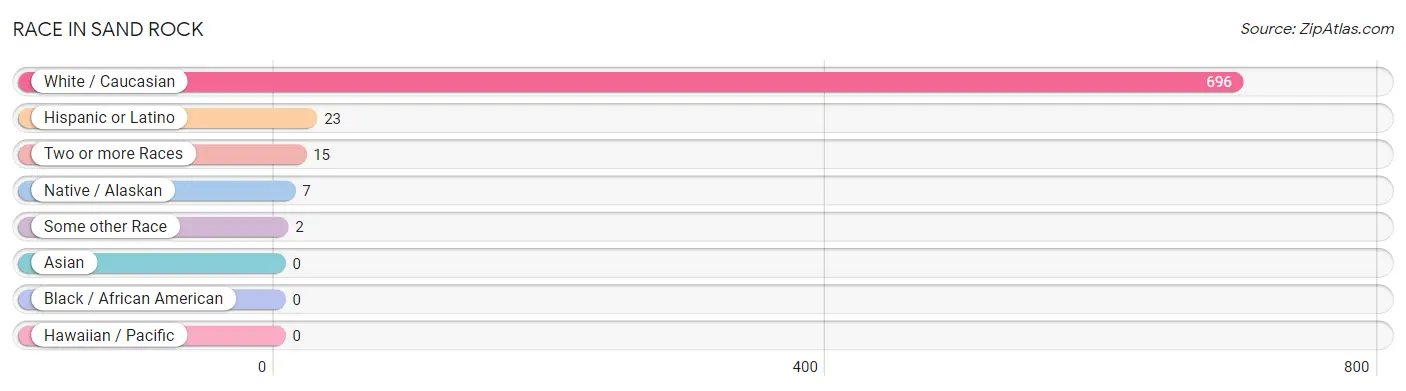
| Race | # Population | % Population |
| Asian | 0 | 0.0% |
| Black / African American | 0 | 0.0% |
| Hawaiian / Pacific | 0 | 0.0% |
| Hispanic or Latino | 23 | 3.2% |
| Native / Alaskan | 7 | 1.0% |
| White / Caucasian | 696 | 96.7% |
| Two or more Races | 15 | 2.1% |
| Some other Race | 2 | 0.3% |
| Total | 720 | 100.0% |
Ancestry in Sand Rock
The most populous ancestries reported in Sand Rock are American (165 | 22.9%), English (115 | 16.0%), Irish (94 | 13.1%), German (32 | 4.4%), and Canadian (26 | 3.6%), together accounting for 60.0% of all Sand Rock residents.
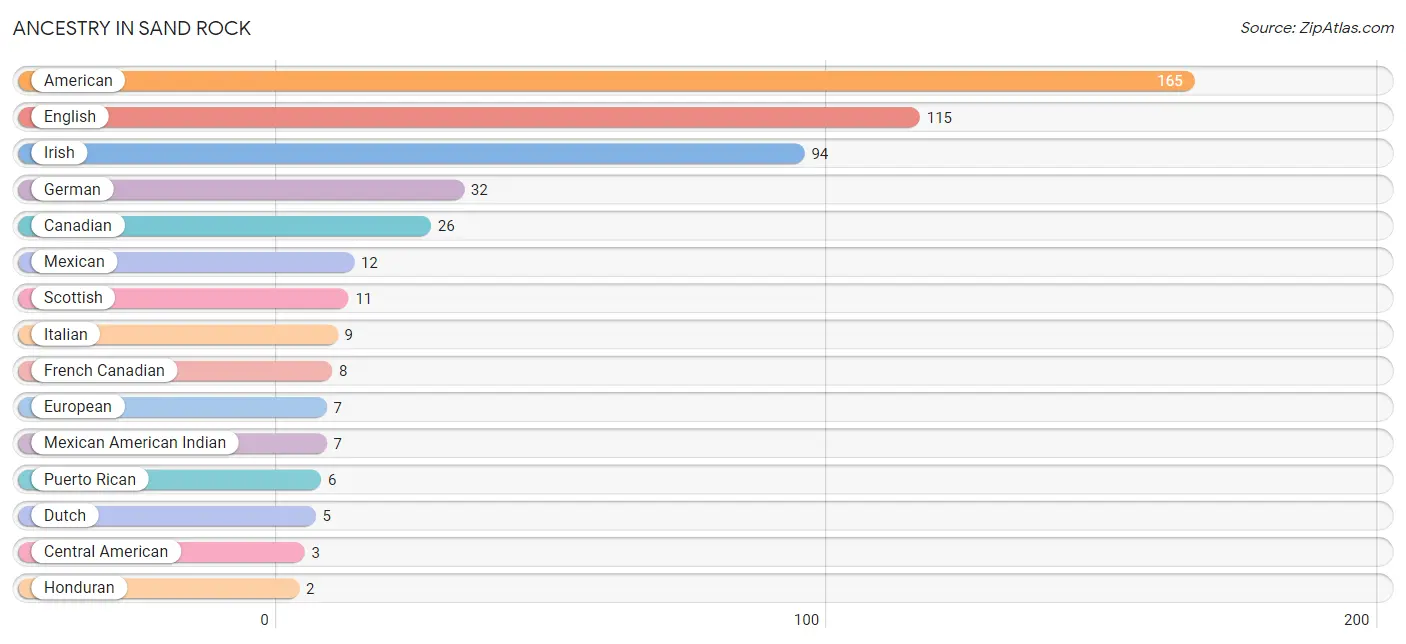
| Ancestry | # Population | % Population |
| American | 165 | 22.9% |
| Australian | 1 | 0.1% |
| Canadian | 26 | 3.6% |
| Central American | 3 | 0.4% |
| Dutch | 5 | 0.7% |
| English | 115 | 16.0% |
| European | 7 | 1.0% |
| French Canadian | 8 | 1.1% |
| German | 32 | 4.4% |
| Honduran | 2 | 0.3% |
| Irish | 94 | 13.1% |
| Italian | 9 | 1.3% |
| Mexican | 12 | 1.7% |
| Mexican American Indian | 7 | 1.0% |
| Puerto Rican | 6 | 0.8% |
| Salvadoran | 1 | 0.1% |
| Scotch-Irish | 2 | 0.3% |
| Scottish | 11 | 1.5% |
| Welsh | 2 | 0.3% | View All 19 Rows |
Immigrants in Sand Rock
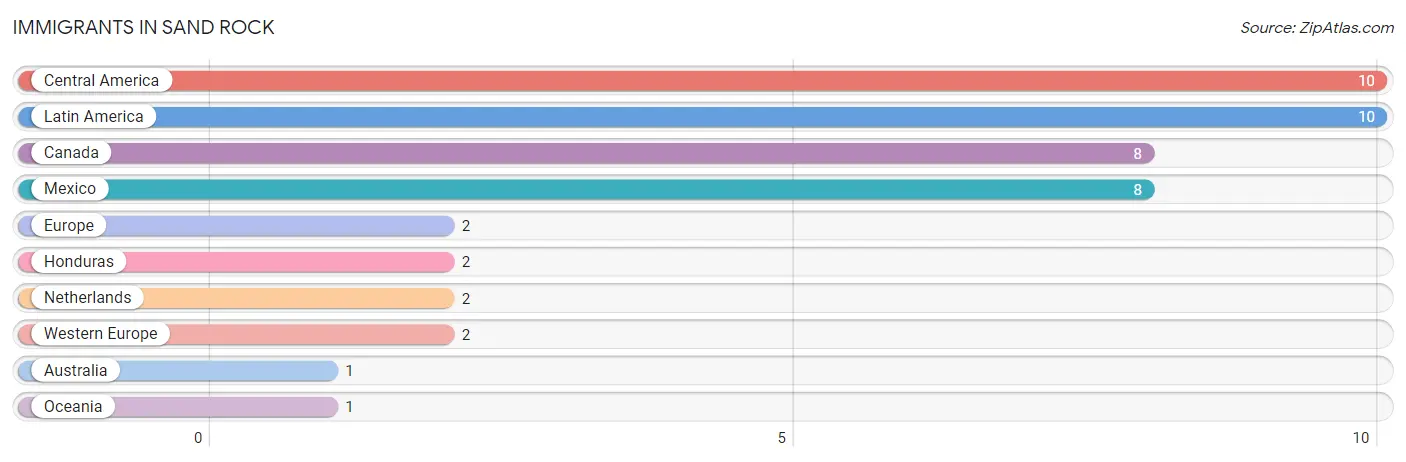
The most numerous immigrant groups reported in Sand Rock came from Central America (10 | 1.4%), Latin America (10 | 1.4%), Canada (8 | 1.1%), Mexico (8 | 1.1%), and Europe (2 | 0.3%), together accounting for 5.3% of all Sand Rock residents.
| Immigration Origin | # Population | % Population |
| Australia | 1 | 0.1% |
| Canada | 8 | 1.1% |
| Central America | 10 | 1.4% |
| Europe | 2 | 0.3% |
| Honduras | 2 | 0.3% |
| Latin America | 10 | 1.4% |
| Mexico | 8 | 1.1% |
| Netherlands | 2 | 0.3% |
| Oceania | 1 | 0.1% |
| Western Europe | 2 | 0.3% | View All 10 Rows |
Sex and Age in Sand Rock
Sex and Age in Sand Rock
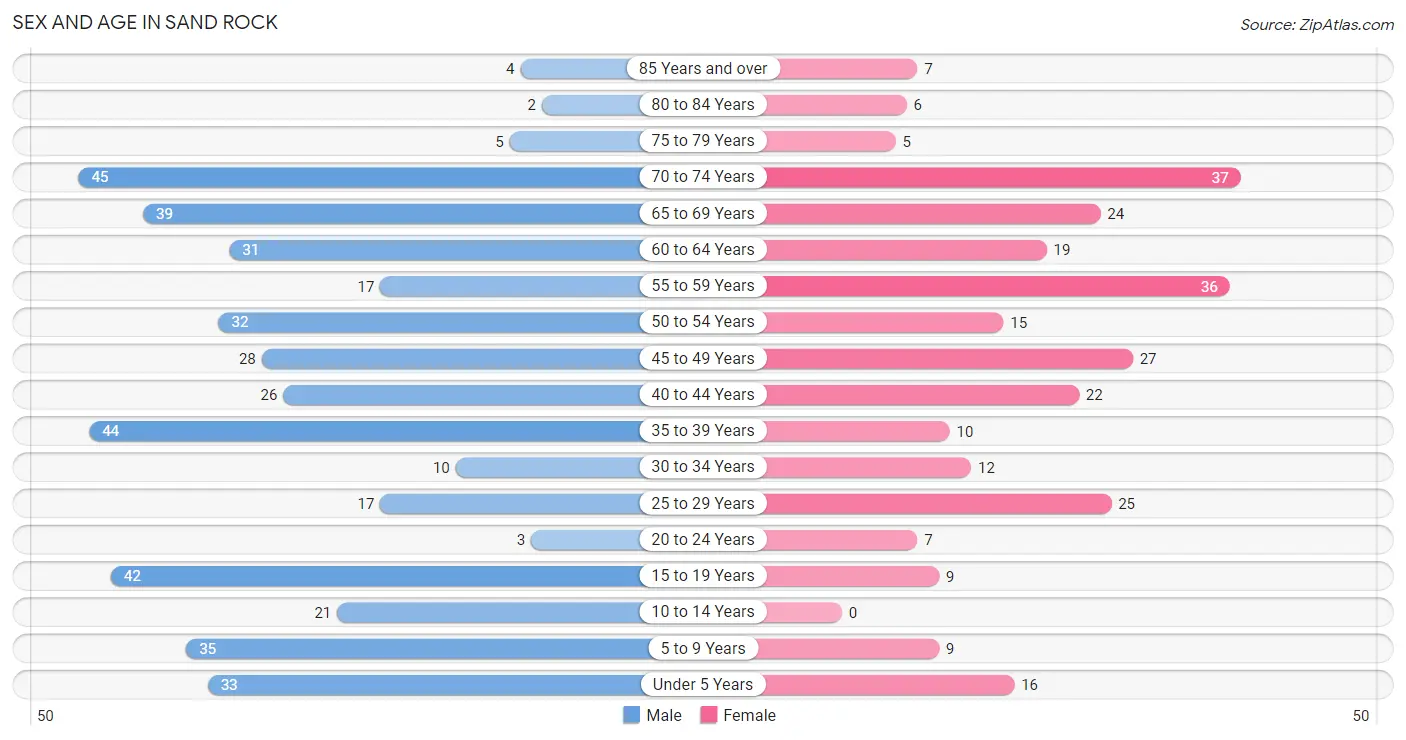
The most populous age groups in Sand Rock are 70 to 74 Years (45 | 10.4%) for men and 70 to 74 Years (37 | 12.9%) for women.
| Age Bracket | Male | Female |
| Under 5 Years | 33 (7.6%) | 16 (5.6%) |
| 5 to 9 Years | 35 (8.1%) | 9 (3.2%) |
| 10 to 14 Years | 21 (4.8%) | 0 (0.0%) |
| 15 to 19 Years | 42 (9.7%) | 9 (3.2%) |
| 20 to 24 Years | 3 (0.7%) | 7 (2.5%) |
| 25 to 29 Years | 17 (3.9%) | 25 (8.7%) |
| 30 to 34 Years | 10 (2.3%) | 12 (4.2%) |
| 35 to 39 Years | 44 (10.1%) | 10 (3.5%) |
| 40 to 44 Years | 26 (6.0%) | 22 (7.7%) |
| 45 to 49 Years | 28 (6.5%) | 27 (9.4%) |
| 50 to 54 Years | 32 (7.4%) | 15 (5.2%) |
| 55 to 59 Years | 17 (3.9%) | 36 (12.6%) |
| 60 to 64 Years | 31 (7.1%) | 19 (6.6%) |
| 65 to 69 Years | 39 (9.0%) | 24 (8.4%) |
| 70 to 74 Years | 45 (10.4%) | 37 (12.9%) |
| 75 to 79 Years | 5 (1.1%) | 5 (1.8%) |
| 80 to 84 Years | 2 (0.5%) | 6 (2.1%) |
| 85 Years and over | 4 (0.9%) | 7 (2.5%) |
| Total | 434 (100.0%) | 286 (100.0%) |
Families and Households in Sand Rock
Median Family Size in Sand Rock
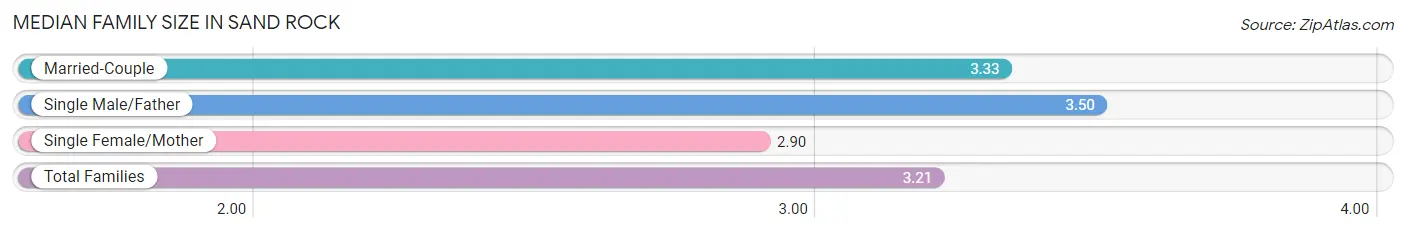
The median family size in Sand Rock is 3.21 persons per family, with single male/father families (2 | 1.1%) accounting for the largest median family size of 3.5 persons per family. On the other hand, single female/mother families (52 | 28.3%) represent the smallest median family size with 2.90 persons per family.
| Family Type | # Families | Family Size |
| Married-Couple | 130 (70.7%) | 3.33 |
| Single Male/Father | 2 (1.1%) | 3.50 |
| Single Female/Mother | 52 (28.3%) | 2.90 |
| Total Families | 184 (100.0%) | 3.21 |
Median Household Size in Sand Rock
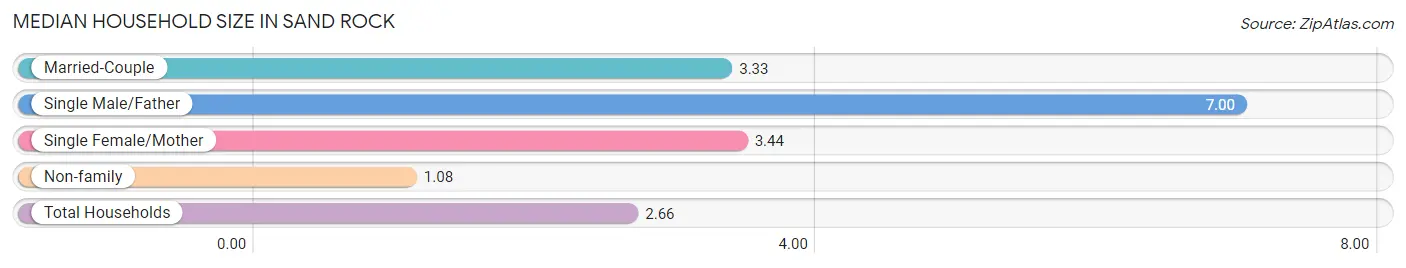
The median household size in Sand Rock is 2.66 persons per household, with single male/father households (2 | 0.7%) accounting for the largest median household size of 7 persons per household. non-family households (87 | 32.1%) represent the smallest median household size with 1.08 persons per household.
| Household Type | # Households | Household Size |
| Married-Couple | 130 (48.0%) | 3.33 |
| Single Male/Father | 2 (0.7%) | 7.00 |
| Single Female/Mother | 52 (19.2%) | 3.44 |
| Non-family | 87 (32.1%) | 1.08 |
| Total Households | 271 (100.0%) | 2.66 |
Household Size by Marriage Status in Sand Rock
Out of a total of 271 households in Sand Rock, 184 (67.9%) are family households, while 87 (32.1%) are nonfamily households. The most numerous type of family households are 2-person households, comprising 108, and the most common type of nonfamily households are 1-person households, comprising 84.
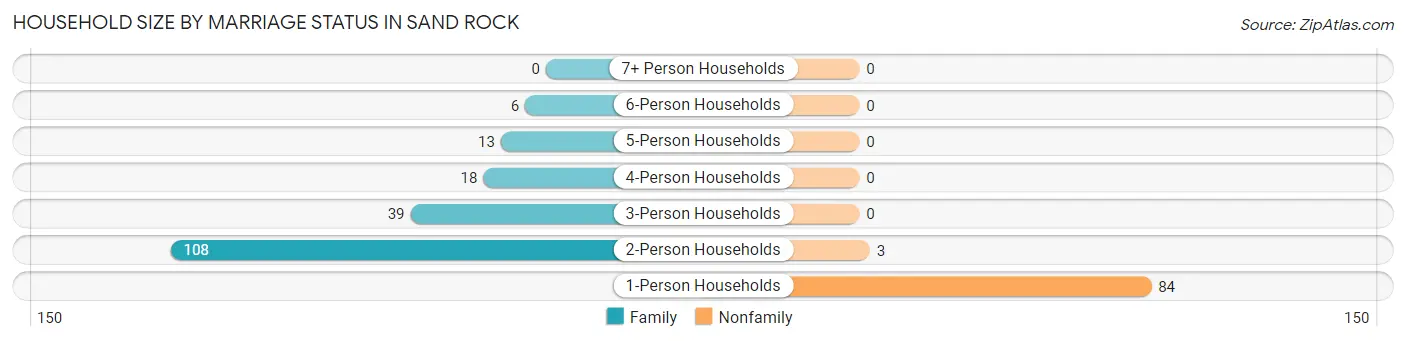
| Household Size | Family Households | Nonfamily Households |
| 1-Person Households | - | 84 (31.0%) |
| 2-Person Households | 108 (39.9%) | 3 (1.1%) |
| 3-Person Households | 39 (14.4%) | 0 (0.0%) |
| 4-Person Households | 18 (6.6%) | 0 (0.0%) |
| 5-Person Households | 13 (4.8%) | 0 (0.0%) |
| 6-Person Households | 6 (2.2%) | 0 (0.0%) |
| 7+ Person Households | 0 (0.0%) | 0 (0.0%) |
| Total | 184 (67.9%) | 87 (32.1%) |
Female Fertility in Sand Rock
Fertility by Age in Sand Rock
| Age Bracket | Women with Births | Births / 1,000 Women |
| 15 to 19 years | 0 (0.0%) | 0.0 |
| 20 to 34 years | 0 (0.0%) | 0.0 |
| 35 to 50 years | 0 (0.0%) | 0.0 |
| Total | 0 (0.0%) | 0.0 |
Fertility by Age by Marriage Status in Sand Rock
| Age Bracket | Married | Unmarried |
| 15 to 19 years | 0 (0.0%) | 0 (0.0%) |
| 20 to 34 years | 0 (0.0%) | 0 (0.0%) |
| 35 to 50 years | 0 (0.0%) | 0 (0.0%) |
| Total | 0 (0.0%) | 0 (0.0%) |
Fertility by Education in Sand Rock
| Educational Attainment | Women with Births | Births / 1,000 Women |
| Less than High School | 0 (0.0%) | 0.0 |
| High School Diploma | 0 (0.0%) | 0.0 |
| College or Associate's Degree | 0 (0.0%) | 0.0 |
| Bachelor's Degree | 0 (0.0%) | 0.0 |
| Graduate Degree | 0 (0.0%) | 0.0 |
| Total | 0 (0.0%) | 0.0 |
Fertility by Education by Marriage Status in Sand Rock
| Educational Attainment | Married | Unmarried |
| Less than High School | 0 (0.0%) | 0 (0.0%) |
| High School Diploma | 0 (0.0%) | 0 (0.0%) |
| College or Associate's Degree | 0 (0.0%) | 0 (0.0%) |
| Bachelor's Degree | 0 (0.0%) | 0 (0.0%) |
| Graduate Degree | 0 (0.0%) | 0 (0.0%) |
| Total | 0 (0.0%) | 0 (0.0%) |
Employment Characteristics in Sand Rock
Employment by Class of Employer in Sand Rock
Among the 278 employed individuals in Sand Rock, private company employees (192 | 69.1%), state government employees (28 | 10.1%), and local government employees (27 | 9.7%) make up the most common classes of employment.
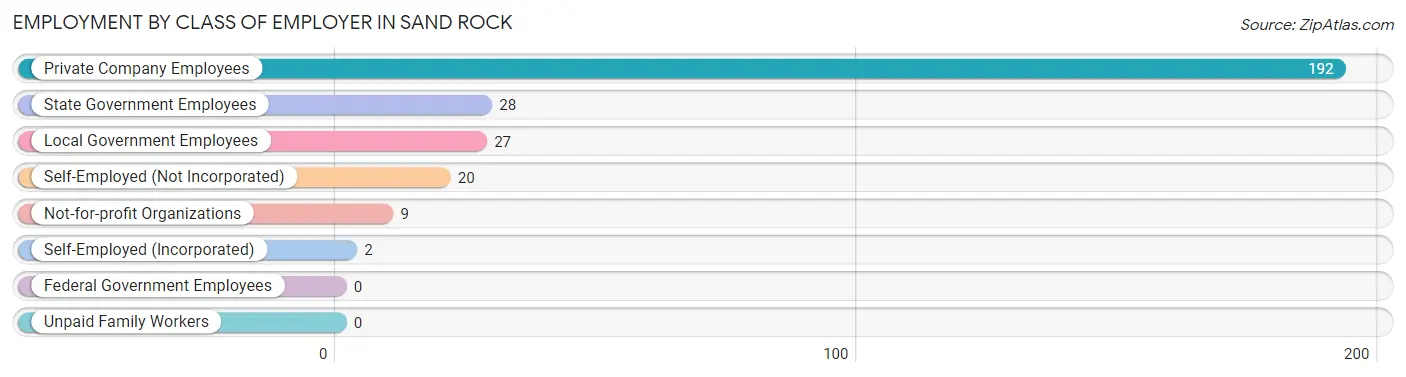
| Employer Class | # Employees | % Employees |
| Private Company Employees | 192 | 69.1% |
| Self-Employed (Incorporated) | 2 | 0.7% |
| Self-Employed (Not Incorporated) | 20 | 7.2% |
| Not-for-profit Organizations | 9 | 3.2% |
| Local Government Employees | 27 | 9.7% |
| State Government Employees | 28 | 10.1% |
| Federal Government Employees | 0 | 0.0% |
| Unpaid Family Workers | 0 | 0.0% |
| Total | 278 | 100.0% |
Employment Status by Age in Sand Rock
According to the labor force statistics for Sand Rock, out of the total population over 16 years of age (606), 48.8% or 296 individuals are in the labor force, with 4.7% or 14 of them unemployed. The age group with the highest labor force participation rate is 45 to 54 years, with 94.1% or 96 individuals in the labor force. Within the labor force, the 20 to 24 years age range has the highest percentage of unemployed individuals, with 37.5% or 3 of them being unemployed.
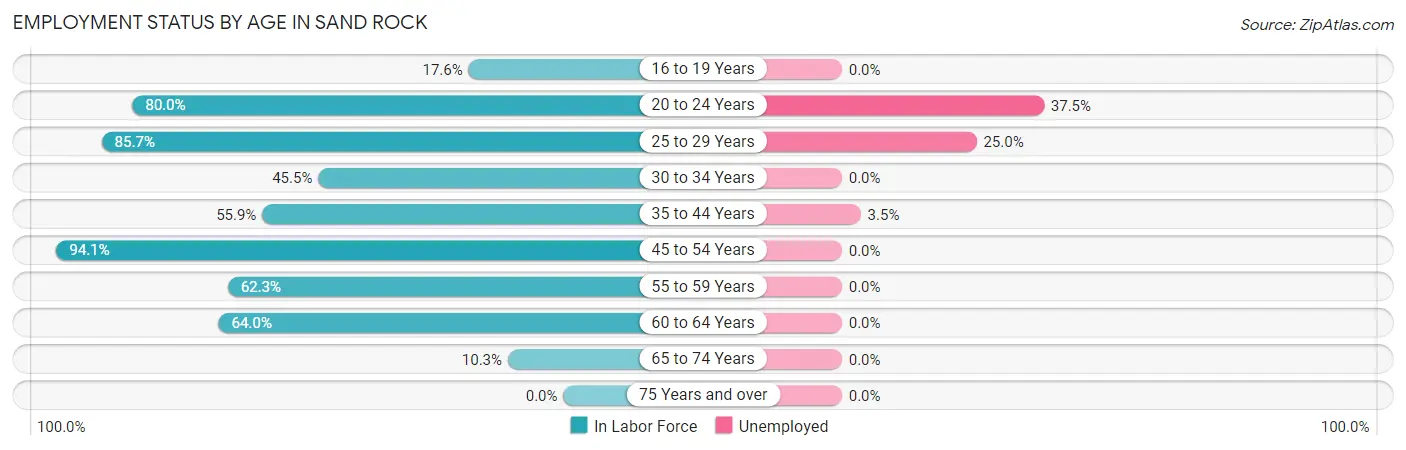
| Age Bracket | In Labor Force | Unemployed |
| 16 to 19 Years | 9 (17.6%) | 0 (0.0%) |
| 20 to 24 Years | 8 (80.0%) | 3 (37.5%) |
| 25 to 29 Years | 36 (85.7%) | 9 (25.0%) |
| 30 to 34 Years | 10 (45.5%) | 0 (0.0%) |
| 35 to 44 Years | 57 (55.9%) | 2 (3.5%) |
| 45 to 54 Years | 96 (94.1%) | 0 (0.0%) |
| 55 to 59 Years | 33 (62.3%) | 0 (0.0%) |
| 60 to 64 Years | 32 (64.0%) | 0 (0.0%) |
| 65 to 74 Years | 15 (10.3%) | 0 (0.0%) |
| 75 Years and over | 0 (0.0%) | 0 (0.0%) |
| Total | 296 (48.8%) | 14 (4.7%) |
Employment Status by Educational Attainment in Sand Rock
According to labor force statistics for Sand Rock, 71.2% of individuals (264) out of the total population between 25 and 64 years of age (371) are in the labor force, with 4.2% or 11 of them being unemployed. The group with the highest labor force participation rate are those with the educational attainment of bachelor's degree or higher, with 95.7% or 66 individuals in the labor force. Within the labor force, individuals with less than high school education have the highest percentage of unemployment, with 24.3% or 9 of them being unemployed.
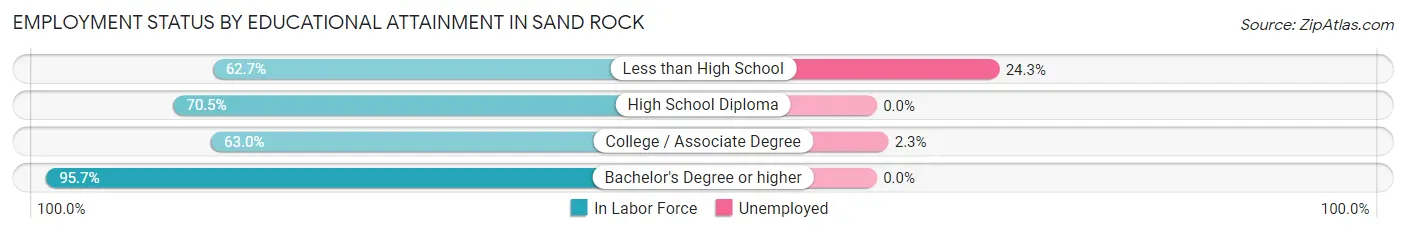
| Educational Attainment | In Labor Force | Unemployed |
| Less than High School | 37 (62.7%) | 14 (24.3%) |
| High School Diploma | 74 (70.5%) | 0 (0.0%) |
| College / Associate Degree | 87 (63.0%) | 3 (2.3%) |
| Bachelor's Degree or higher | 66 (95.7%) | 0 (0.0%) |
| Total | 264 (71.2%) | 16 (4.2%) |
Employment Occupations by Sex in Sand Rock
Management, Business, Science and Arts Occupations
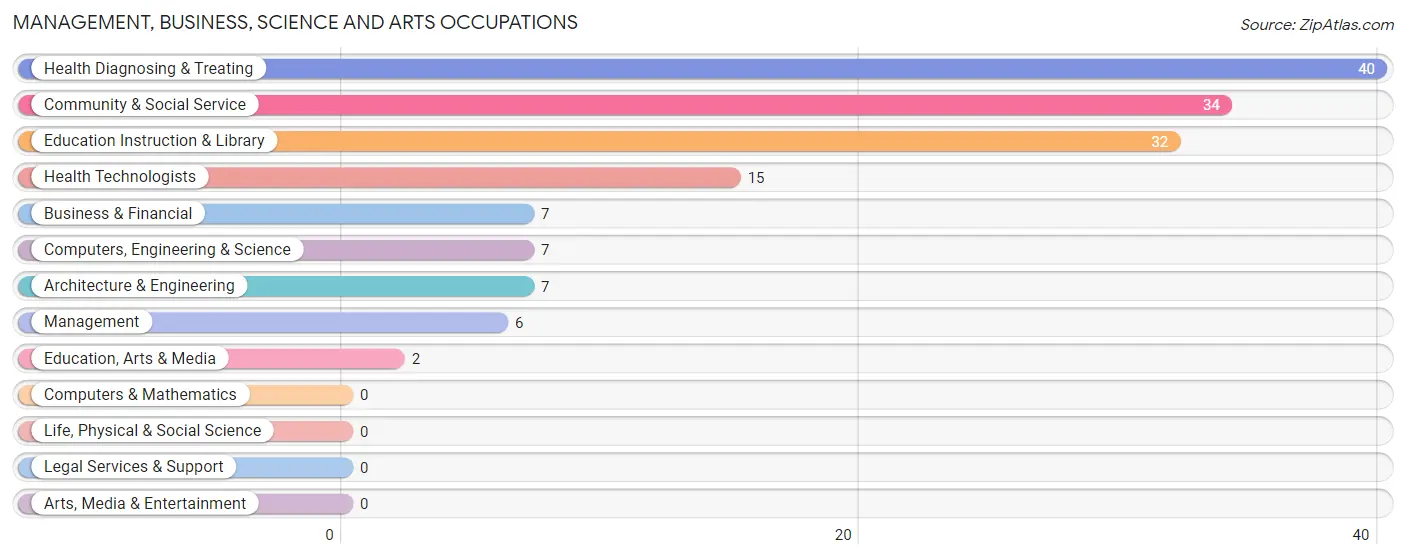
The most common Management, Business, Science and Arts occupations in Sand Rock are Health Diagnosing & Treating (40 | 14.2%), Community & Social Service (34 | 12.1%), Education Instruction & Library (32 | 11.4%), Health Technologists (15 | 5.3%), and Business & Financial (7 | 2.5%).
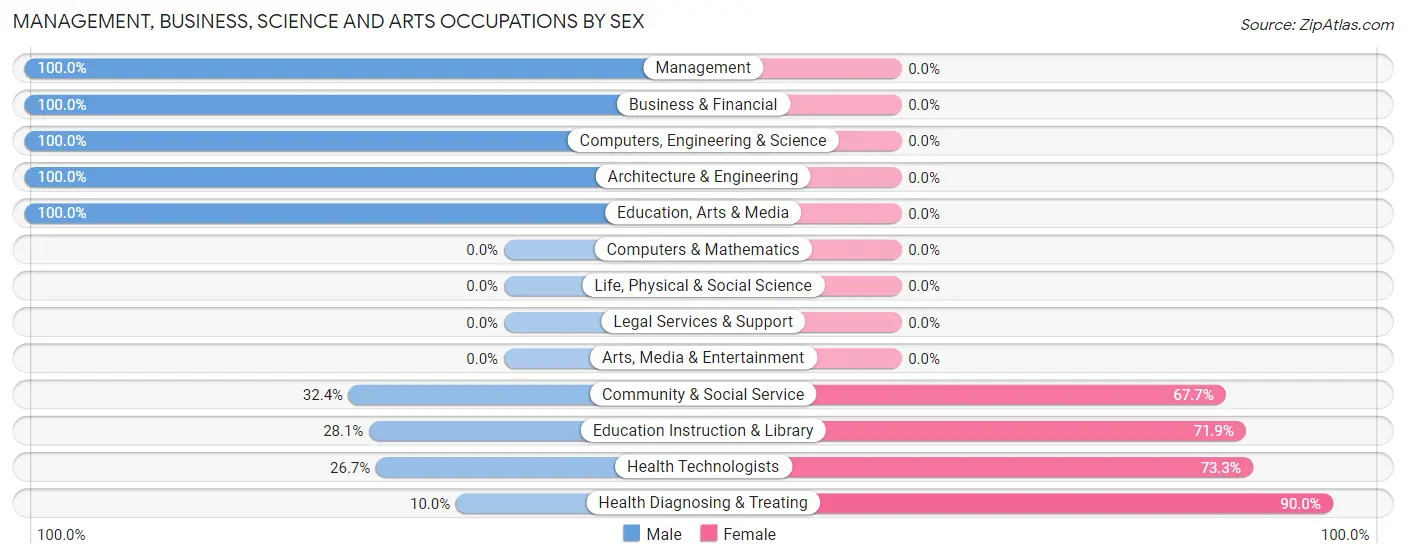
Management, Business, Science and Arts Occupations by Sex
Within the Management, Business, Science and Arts occupations in Sand Rock, the most male-oriented occupations are Management (100.0%), Business & Financial (100.0%), and Computers, Engineering & Science (100.0%), while the most female-oriented occupations are Health Diagnosing & Treating (90.0%), Health Technologists (73.3%), and Education Instruction & Library (71.9%).
| Occupation | Male | Female |
| Management | 6 (100.0%) | 0 (0.0%) |
| Business & Financial | 7 (100.0%) | 0 (0.0%) |
| Computers, Engineering & Science | 7 (100.0%) | 0 (0.0%) |
| Computers & Mathematics | 0 (0.0%) | 0 (0.0%) |
| Architecture & Engineering | 7 (100.0%) | 0 (0.0%) |
| Life, Physical & Social Science | 0 (0.0%) | 0 (0.0%) |
| Community & Social Service | 11 (32.4%) | 23 (67.6%) |
| Education, Arts & Media | 2 (100.0%) | 0 (0.0%) |
| Legal Services & Support | 0 (0.0%) | 0 (0.0%) |
| Education Instruction & Library | 9 (28.1%) | 23 (71.9%) |
| Arts, Media & Entertainment | 0 (0.0%) | 0 (0.0%) |
| Health Diagnosing & Treating | 4 (10.0%) | 36 (90.0%) |
| Health Technologists | 4 (26.7%) | 11 (73.3%) |
| Total (Category) | 35 (37.2%) | 59 (62.8%) |
| Total (Overall) | 145 (51.4%) | 137 (48.6%) |
Services Occupations
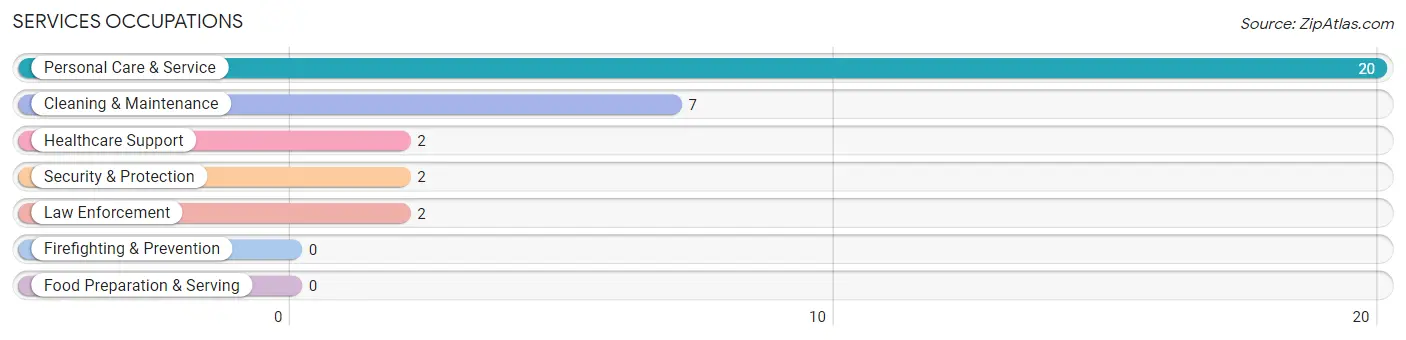
The most common Services occupations in Sand Rock are Personal Care & Service (20 | 7.1%), Cleaning & Maintenance (7 | 2.5%), Healthcare Support (2 | 0.7%), Security & Protection (2 | 0.7%), and Law Enforcement (2 | 0.7%).
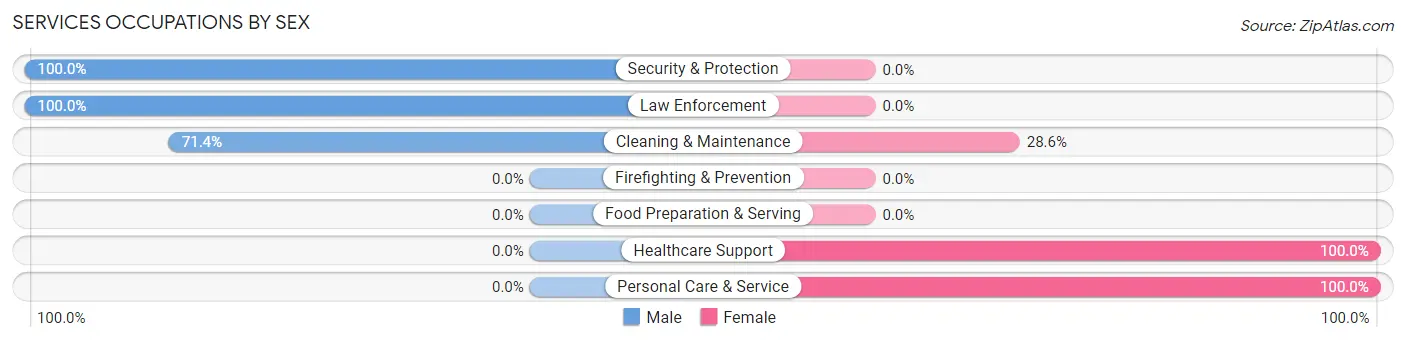
Services Occupations by Sex
Within the Services occupations in Sand Rock, the most male-oriented occupations are Security & Protection (100.0%), Law Enforcement (100.0%), and Cleaning & Maintenance (71.4%), while the most female-oriented occupations are Healthcare Support (100.0%), Personal Care & Service (100.0%), and Cleaning & Maintenance (28.6%).
| Occupation | Male | Female |
| Healthcare Support | 0 (0.0%) | 2 (100.0%) |
| Security & Protection | 2 (100.0%) | 0 (0.0%) |
| Firefighting & Prevention | 0 (0.0%) | 0 (0.0%) |
| Law Enforcement | 2 (100.0%) | 0 (0.0%) |
| Food Preparation & Serving | 0 (0.0%) | 0 (0.0%) |
| Cleaning & Maintenance | 5 (71.4%) | 2 (28.6%) |
| Personal Care & Service | 0 (0.0%) | 20 (100.0%) |
| Total (Category) | 7 (22.6%) | 24 (77.4%) |
| Total (Overall) | 145 (51.4%) | 137 (48.6%) |
Sales and Office Occupations
The most common Sales and Office occupations in Sand Rock are Office & Administration (45 | 16.0%), and Sales & Related (5 | 1.8%).
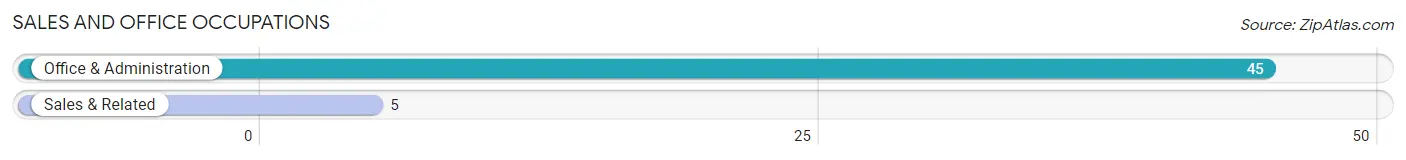
Sales and Office Occupations by Sex
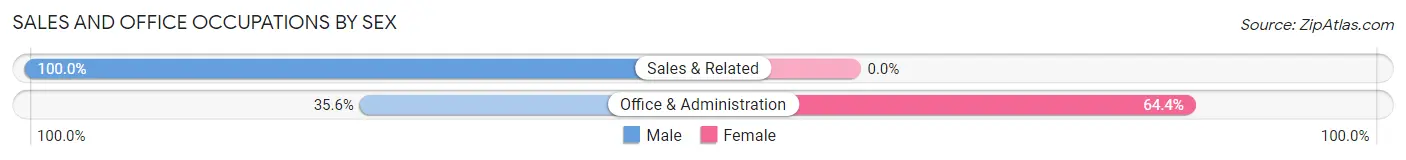
| Occupation | Male | Female |
| Sales & Related | 5 (100.0%) | 0 (0.0%) |
| Office & Administration | 16 (35.6%) | 29 (64.4%) |
| Total (Category) | 21 (42.0%) | 29 (58.0%) |
| Total (Overall) | 145 (51.4%) | 137 (48.6%) |
Natural Resources, Construction and Maintenance Occupations
The most common Natural Resources, Construction and Maintenance occupations in Sand Rock are , and Installation, Maintenance & Repair (26 | 9.2%).
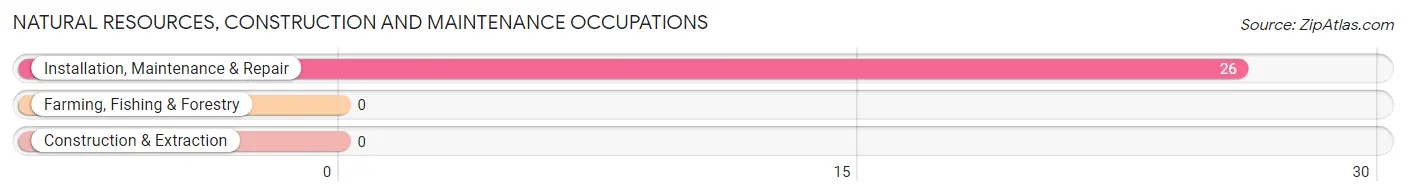
Natural Resources, Construction and Maintenance Occupations by Sex
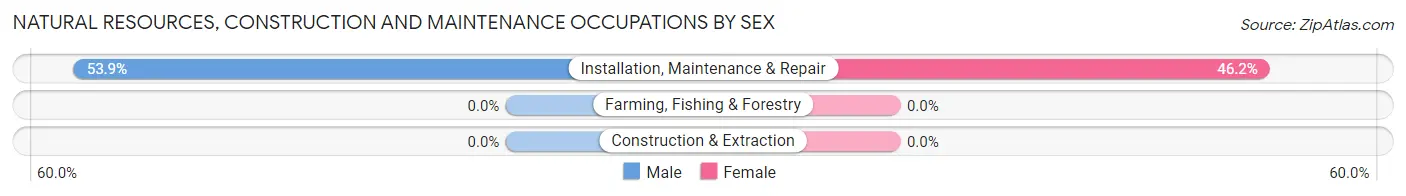
| Occupation | Male | Female |
| Farming, Fishing & Forestry | 0 (0.0%) | 0 (0.0%) |
| Construction & Extraction | 0 (0.0%) | 0 (0.0%) |
| Installation, Maintenance & Repair | 14 (53.8%) | 12 (46.2%) |
| Total (Category) | 14 (53.8%) | 12 (46.2%) |
| Total (Overall) | 145 (51.4%) | 137 (48.6%) |
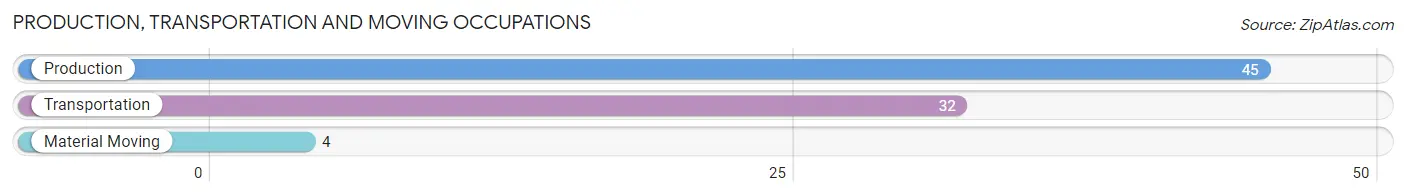
Production, Transportation and Moving Occupations
The most common Production, Transportation and Moving occupations in Sand Rock are Production (45 | 16.0%), Transportation (32 | 11.4%), and Material Moving (4 | 1.4%).
Production, Transportation and Moving Occupations by Sex
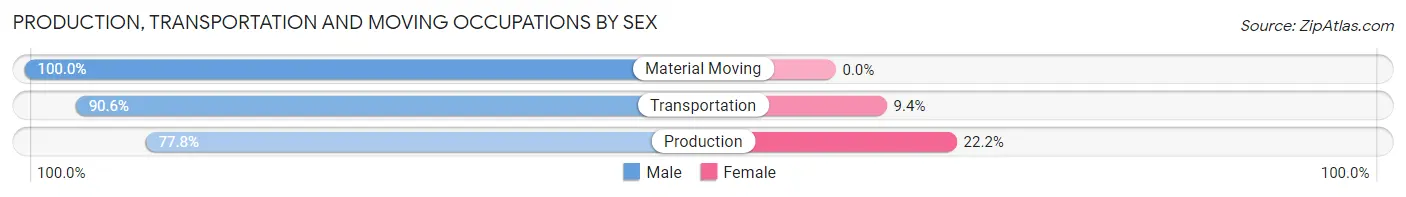
| Occupation | Male | Female |
| Production | 35 (77.8%) | 10 (22.2%) |
| Transportation | 29 (90.6%) | 3 (9.4%) |
| Material Moving | 4 (100.0%) | 0 (0.0%) |
| Total (Category) | 68 (84.0%) | 13 (16.1%) |
| Total (Overall) | 145 (51.4%) | 137 (48.6%) |
Employment Industries by Sex in Sand Rock
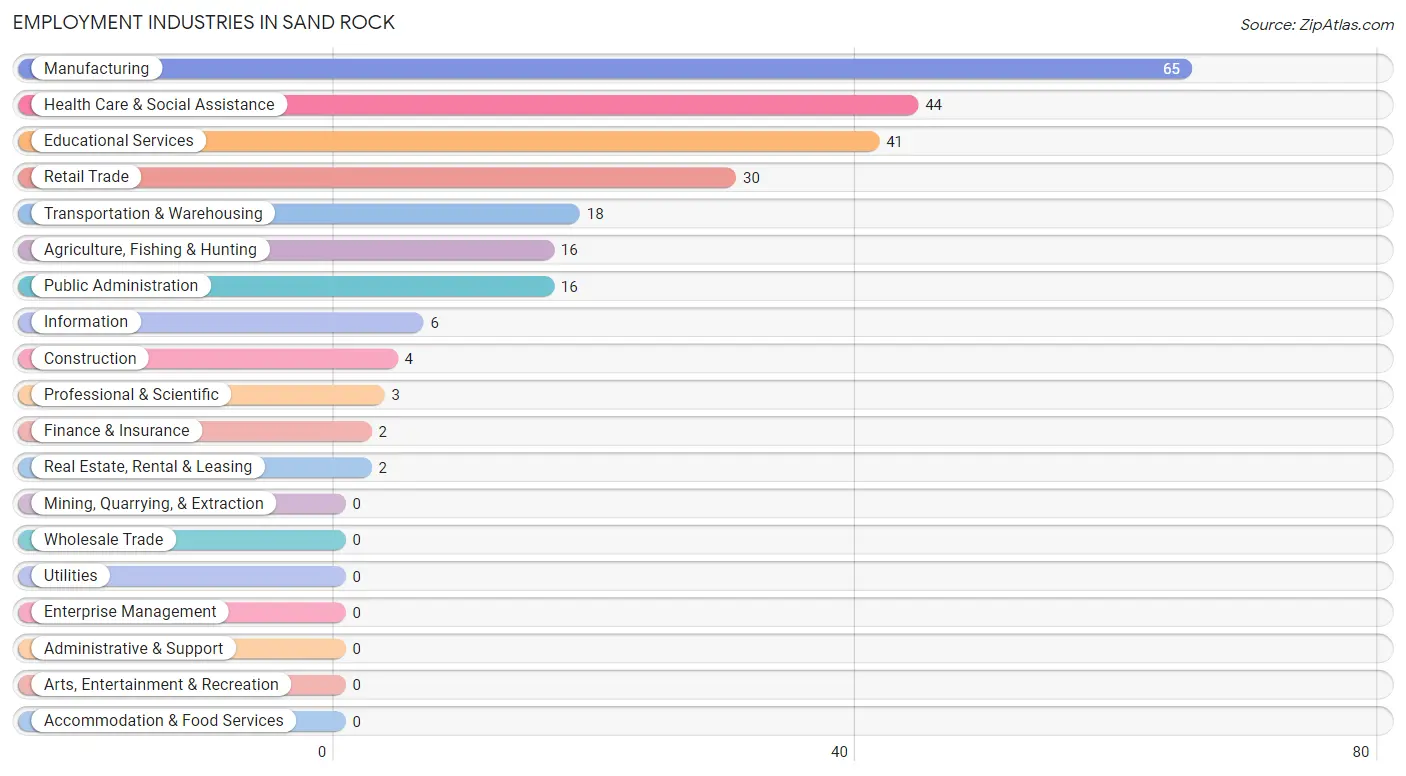
Employment Industries in Sand Rock
The major employment industries in Sand Rock include Manufacturing (65 | 23.1%), Health Care & Social Assistance (44 | 15.6%), Educational Services (41 | 14.5%), Retail Trade (30 | 10.6%), and Transportation & Warehousing (18 | 6.4%).
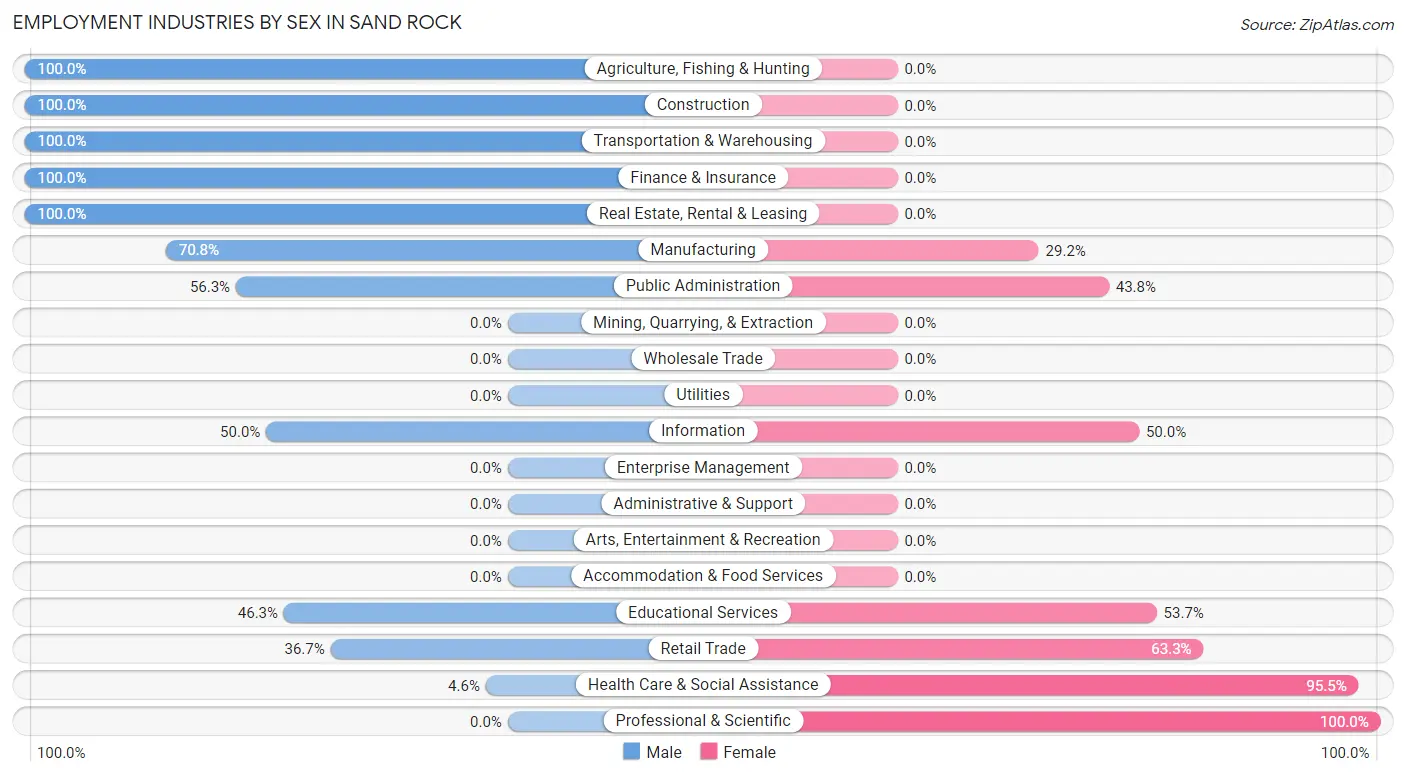
Employment Industries by Sex in Sand Rock
The Sand Rock industries that see more men than women are Agriculture, Fishing & Hunting (100.0%), Construction (100.0%), and Transportation & Warehousing (100.0%), whereas the industries that tend to have a higher number of women are Professional & Scientific (100.0%), Health Care & Social Assistance (95.5%), and Retail Trade (63.3%).
| Industry | Male | Female |
| Agriculture, Fishing & Hunting | 16 (100.0%) | 0 (0.0%) |
| Mining, Quarrying, & Extraction | 0 (0.0%) | 0 (0.0%) |
| Construction | 4 (100.0%) | 0 (0.0%) |
| Manufacturing | 46 (70.8%) | 19 (29.2%) |
| Wholesale Trade | 0 (0.0%) | 0 (0.0%) |
| Retail Trade | 11 (36.7%) | 19 (63.3%) |
| Transportation & Warehousing | 18 (100.0%) | 0 (0.0%) |
| Utilities | 0 (0.0%) | 0 (0.0%) |
| Information | 3 (50.0%) | 3 (50.0%) |
| Finance & Insurance | 2 (100.0%) | 0 (0.0%) |
| Real Estate, Rental & Leasing | 2 (100.0%) | 0 (0.0%) |
| Professional & Scientific | 0 (0.0%) | 3 (100.0%) |
| Enterprise Management | 0 (0.0%) | 0 (0.0%) |
| Administrative & Support | 0 (0.0%) | 0 (0.0%) |
| Educational Services | 19 (46.3%) | 22 (53.7%) |
| Health Care & Social Assistance | 2 (4.5%) | 42 (95.5%) |
| Arts, Entertainment & Recreation | 0 (0.0%) | 0 (0.0%) |
| Accommodation & Food Services | 0 (0.0%) | 0 (0.0%) |
| Public Administration | 9 (56.2%) | 7 (43.8%) |
| Total | 145 (51.4%) | 137 (48.6%) |
Education in Sand Rock
School Enrollment in Sand Rock
The most common levels of schooling among the 144 students in Sand Rock are elementary school (44 | 30.6%), high school (43 | 29.9%), and college / undergraduate (32 | 22.2%).
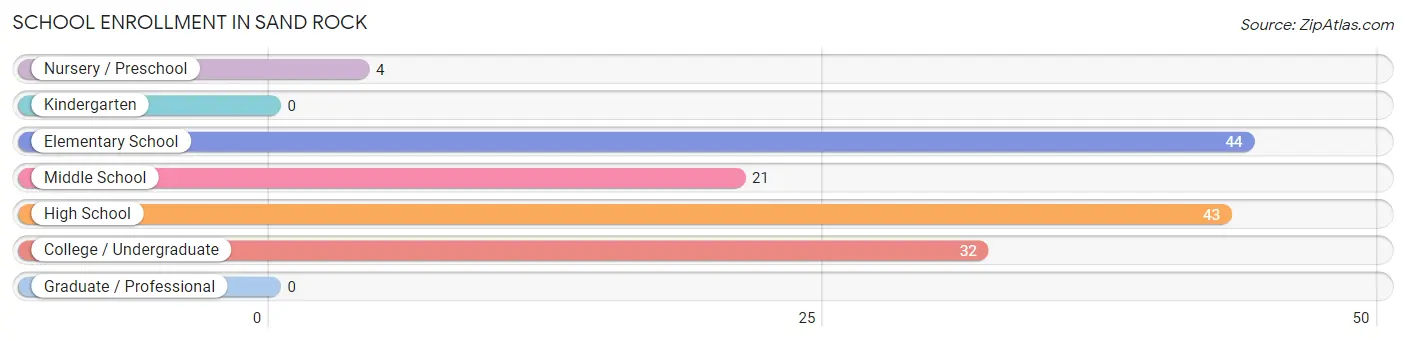
| School Level | # Students | % Students |
| Nursery / Preschool | 4 | 2.8% |
| Kindergarten | 0 | 0.0% |
| Elementary School | 44 | 30.6% |
| Middle School | 21 | 14.6% |
| High School | 43 | 29.9% |
| College / Undergraduate | 32 | 22.2% |
| Graduate / Professional | 0 | 0.0% |
| Total | 144 | 100.0% |
School Enrollment by Age by Funding Source in Sand Rock
Out of a total of 144 students who are enrolled in schools in Sand Rock, 14 (9.7%) attend a private institution, while the remaining 130 (90.3%) are enrolled in public schools. The age group of 35 years and over has the highest likelihood of being enrolled in private schools, with 9 (64.3% in the age bracket) enrolled. Conversely, the age group of 3 to 4 year olds has the lowest likelihood of being enrolled in a private school, with 4 (100.0% in the age bracket) attending a public institution.
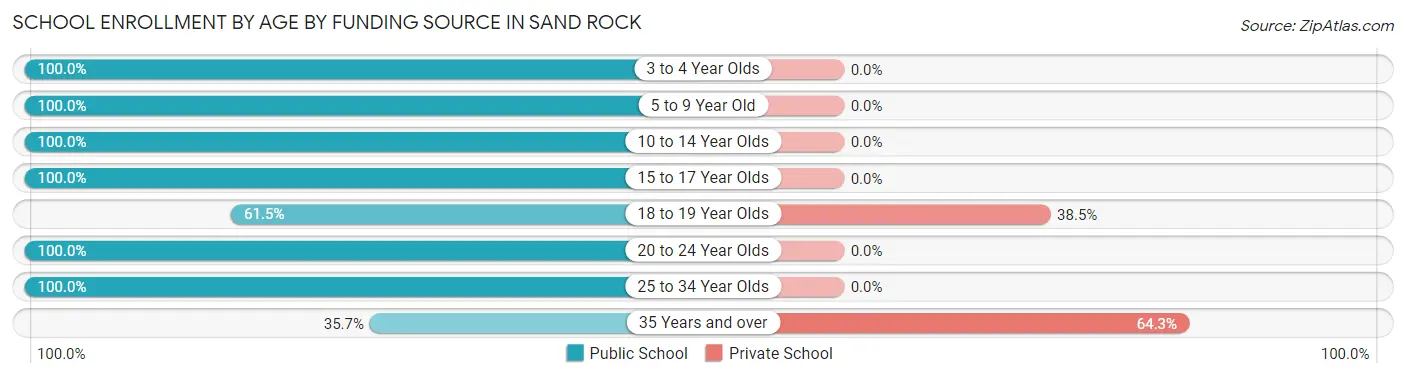
| Age Bracket | Public School | Private School |
| 3 to 4 Year Olds | 4 (100.0%) | 0 (0.0%) |
| 5 to 9 Year Old | 44 (100.0%) | 0 (0.0%) |
| 10 to 14 Year Olds | 21 (100.0%) | 0 (0.0%) |
| 15 to 17 Year Olds | 32 (100.0%) | 0 (0.0%) |
| 18 to 19 Year Olds | 8 (61.5%) | 5 (38.5%) |
| 20 to 24 Year Olds | 10 (100.0%) | 0 (0.0%) |
| 25 to 34 Year Olds | 6 (100.0%) | 0 (0.0%) |
| 35 Years and over | 5 (35.7%) | 9 (64.3%) |
| Total | 130 (90.3%) | 14 (9.7%) |
Educational Attainment by Field of Study in Sand Rock
Education (28 | 22.1%), social sciences (23 | 18.1%), literature & languages (21 | 16.5%), business (18 | 14.2%), and bio, nature & agricultural (12 | 9.5%) are the most common fields of study among 127 individuals in Sand Rock who have obtained a bachelor's degree or higher.
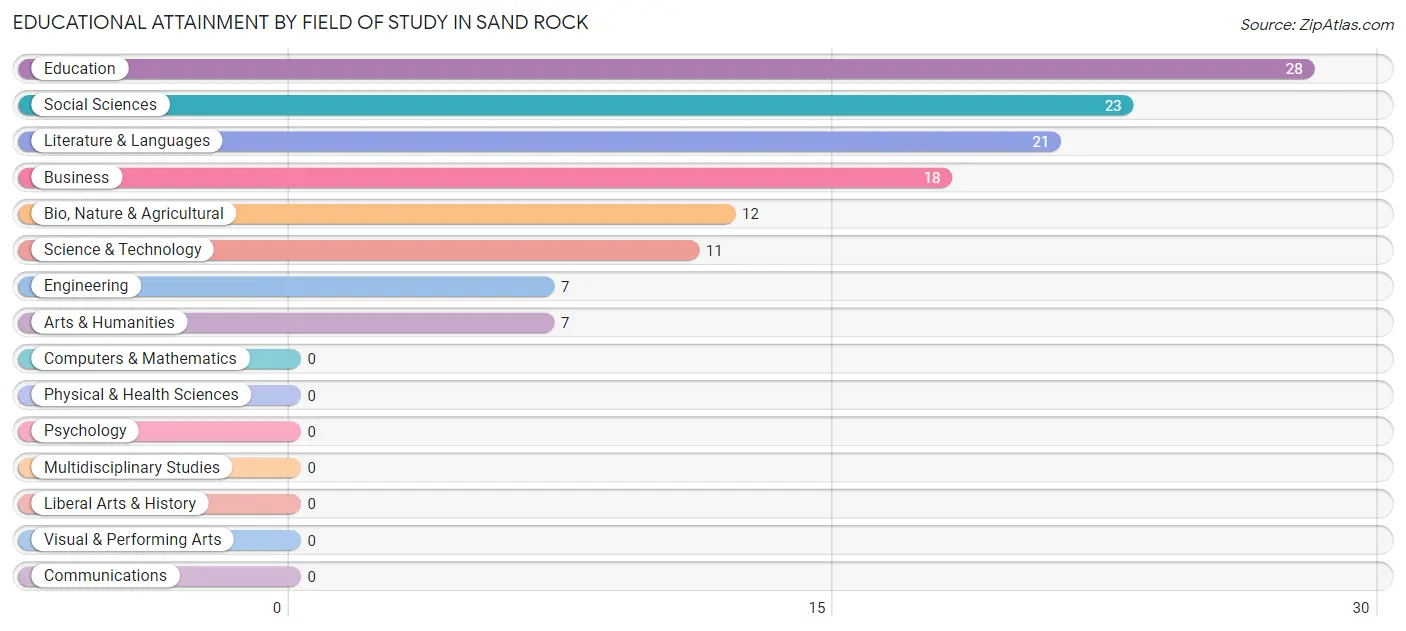
| Field of Study | # Graduates | % Graduates |
| Computers & Mathematics | 0 | 0.0% |
| Bio, Nature & Agricultural | 12 | 9.5% |
| Physical & Health Sciences | 0 | 0.0% |
| Psychology | 0 | 0.0% |
| Social Sciences | 23 | 18.1% |
| Engineering | 7 | 5.5% |
| Multidisciplinary Studies | 0 | 0.0% |
| Science & Technology | 11 | 8.7% |
| Business | 18 | 14.2% |
| Education | 28 | 22.1% |
| Literature & Languages | 21 | 16.5% |
| Liberal Arts & History | 0 | 0.0% |
| Visual & Performing Arts | 0 | 0.0% |
| Communications | 0 | 0.0% |
| Arts & Humanities | 7 | 5.5% |
| Total | 127 | 100.0% |
Transportation & Commute in Sand Rock
Vehicle Availability by Sex in Sand Rock
The most prevalent vehicle ownership categories in Sand Rock are males with 4 vehicles (39, accounting for 27.7%) and females with 4 vehicles (21, making up 28.5%).
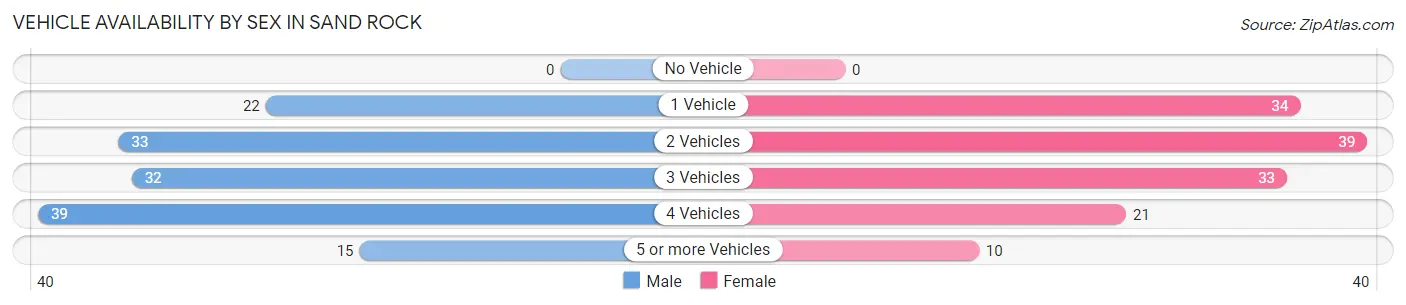
| Vehicles Available | Male | Female |
| No Vehicle | 0 (0.0%) | 0 (0.0%) |
| 1 Vehicle | 22 (15.6%) | 34 (24.8%) |
| 2 Vehicles | 33 (23.4%) | 39 (28.5%) |
| 3 Vehicles | 32 (22.7%) | 33 (24.1%) |
| 4 Vehicles | 39 (27.7%) | 21 (15.3%) |
| 5 or more Vehicles | 15 (10.6%) | 10 (7.3%) |
| Total | 141 (100.0%) | 137 (100.0%) |
Commute Time in Sand Rock
The most frequently occuring commute durations in Sand Rock are 30 to 34 minutes (50 commuters, 18.2%), 15 to 19 minutes (49 commuters, 17.9%), and 5 to 9 minutes (41 commuters, 15.0%).
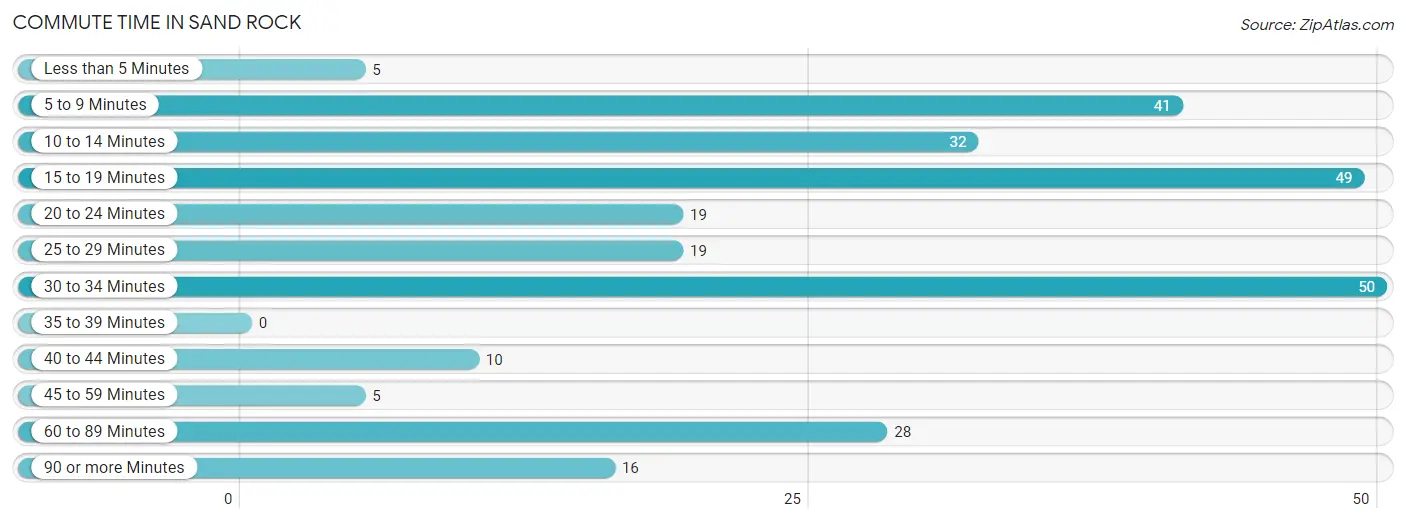
| Commute Time | # Commuters | % Commuters |
| Less than 5 Minutes | 5 | 1.8% |
| 5 to 9 Minutes | 41 | 15.0% |
| 10 to 14 Minutes | 32 | 11.7% |
| 15 to 19 Minutes | 49 | 17.9% |
| 20 to 24 Minutes | 19 | 6.9% |
| 25 to 29 Minutes | 19 | 6.9% |
| 30 to 34 Minutes | 50 | 18.2% |
| 35 to 39 Minutes | 0 | 0.0% |
| 40 to 44 Minutes | 10 | 3.6% |
| 45 to 59 Minutes | 5 | 1.8% |
| 60 to 89 Minutes | 28 | 10.2% |
| 90 or more Minutes | 16 | 5.8% |
Commute Time by Sex in Sand Rock
The most common commute times in Sand Rock are 30 to 34 minutes (34 commuters, 24.1%) for males and 5 to 9 minutes (29 commuters, 21.8%) for females.
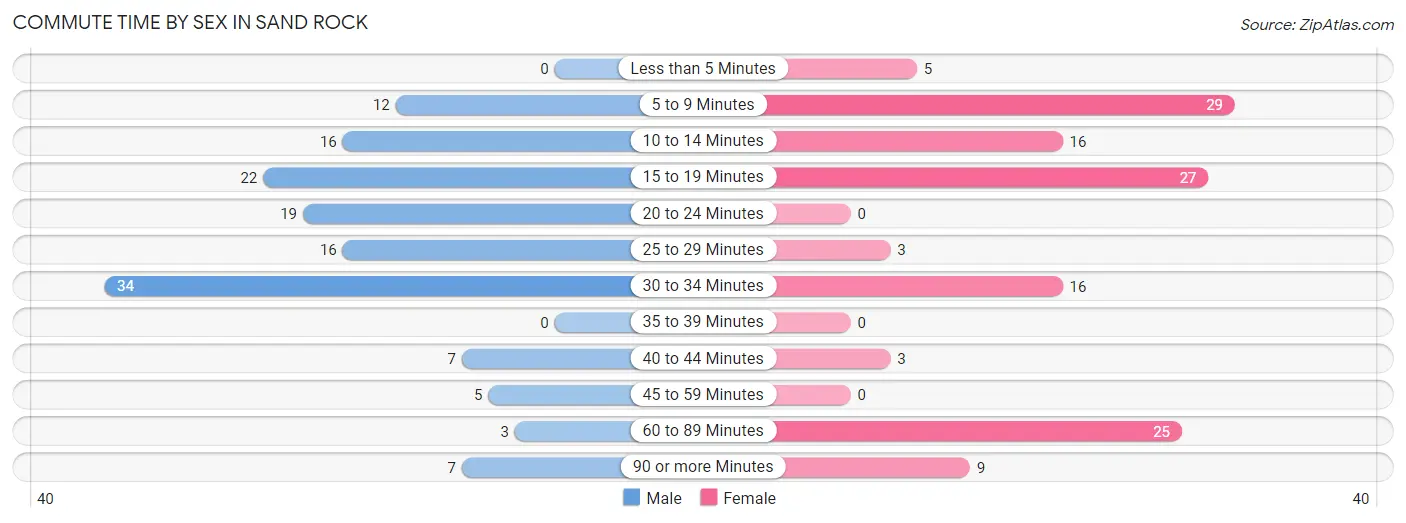
| Commute Time | Male | Female |
| Less than 5 Minutes | 0 (0.0%) | 5 (3.8%) |
| 5 to 9 Minutes | 12 (8.5%) | 29 (21.8%) |
| 10 to 14 Minutes | 16 (11.4%) | 16 (12.0%) |
| 15 to 19 Minutes | 22 (15.6%) | 27 (20.3%) |
| 20 to 24 Minutes | 19 (13.5%) | 0 (0.0%) |
| 25 to 29 Minutes | 16 (11.4%) | 3 (2.3%) |
| 30 to 34 Minutes | 34 (24.1%) | 16 (12.0%) |
| 35 to 39 Minutes | 0 (0.0%) | 0 (0.0%) |
| 40 to 44 Minutes | 7 (5.0%) | 3 (2.3%) |
| 45 to 59 Minutes | 5 (3.5%) | 0 (0.0%) |
| 60 to 89 Minutes | 3 (2.1%) | 25 (18.8%) |
| 90 or more Minutes | 7 (5.0%) | 9 (6.8%) |
Time of Departure to Work by Sex in Sand Rock
The most frequent times of departure to work in Sand Rock are 12:00 AM to 4:59 AM (32, 22.7%) for males and 6:30 AM to 6:59 AM (47, 35.3%) for females.
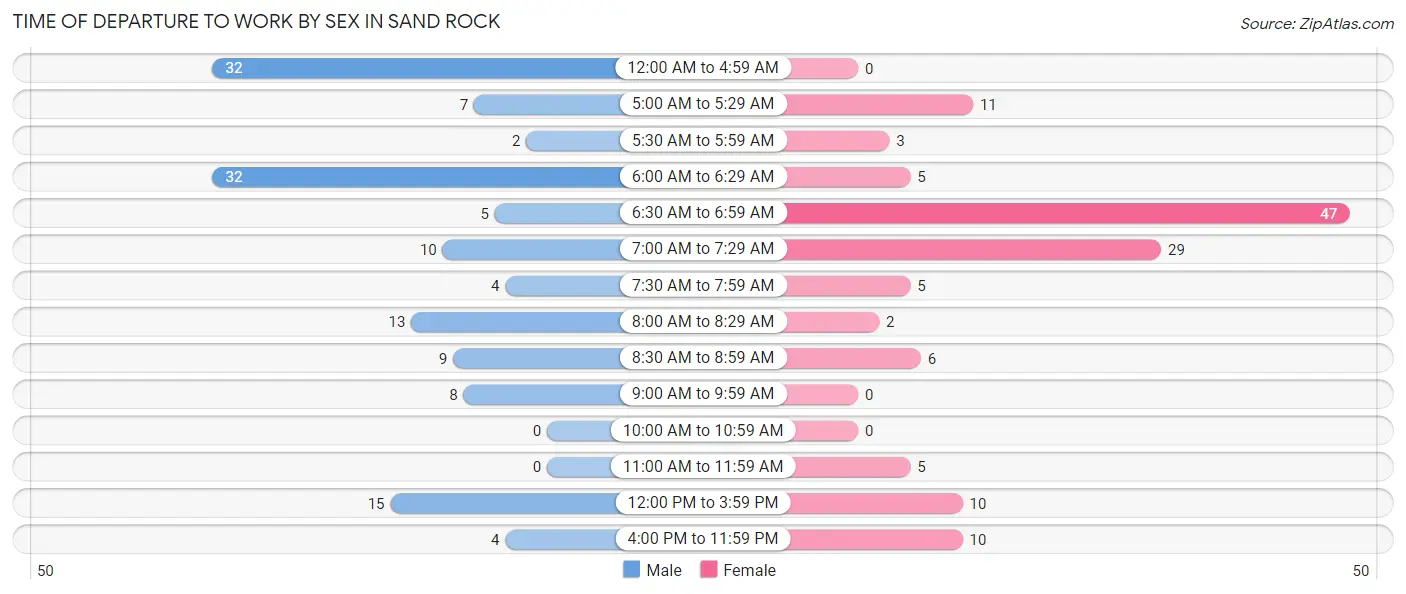
| Time of Departure | Male | Female |
| 12:00 AM to 4:59 AM | 32 (22.7%) | 0 (0.0%) |
| 5:00 AM to 5:29 AM | 7 (5.0%) | 11 (8.3%) |
| 5:30 AM to 5:59 AM | 2 (1.4%) | 3 (2.3%) |
| 6:00 AM to 6:29 AM | 32 (22.7%) | 5 (3.8%) |
| 6:30 AM to 6:59 AM | 5 (3.5%) | 47 (35.3%) |
| 7:00 AM to 7:29 AM | 10 (7.1%) | 29 (21.8%) |
| 7:30 AM to 7:59 AM | 4 (2.8%) | 5 (3.8%) |
| 8:00 AM to 8:29 AM | 13 (9.2%) | 2 (1.5%) |
| 8:30 AM to 8:59 AM | 9 (6.4%) | 6 (4.5%) |
| 9:00 AM to 9:59 AM | 8 (5.7%) | 0 (0.0%) |
| 10:00 AM to 10:59 AM | 0 (0.0%) | 0 (0.0%) |
| 11:00 AM to 11:59 AM | 0 (0.0%) | 5 (3.8%) |
| 12:00 PM to 3:59 PM | 15 (10.6%) | 10 (7.5%) |
| 4:00 PM to 11:59 PM | 4 (2.8%) | 10 (7.5%) |
| Total | 141 (100.0%) | 133 (100.0%) |
Housing Occupancy in Sand Rock
Occupancy by Ownership in Sand Rock
Of the total 271 dwellings in Sand Rock, owner-occupied units account for 236 (87.1%), while renter-occupied units make up 35 (12.9%).
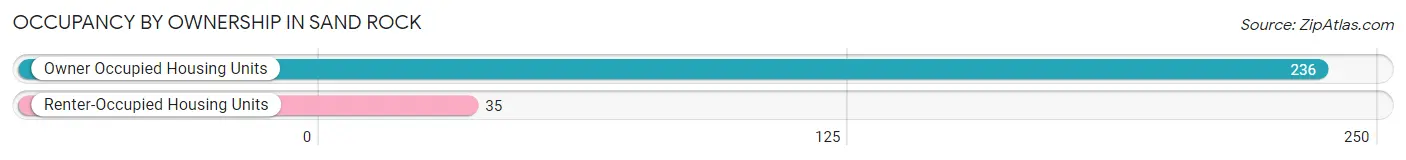
| Occupancy | # Housing Units | % Housing Units |
| Owner Occupied Housing Units | 236 | 87.1% |
| Renter-Occupied Housing Units | 35 | 12.9% |
| Total Occupied Housing Units | 271 | 100.0% |
Occupancy by Household Size in Sand Rock
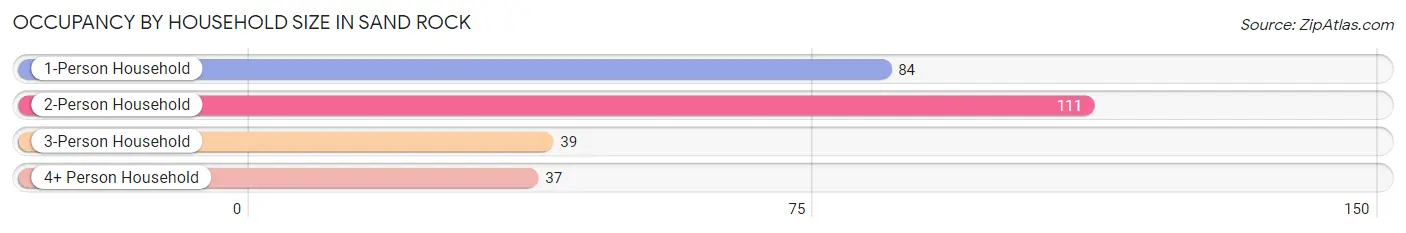
| Household Size | # Housing Units | % Housing Units |
| 1-Person Household | 84 | 31.0% |
| 2-Person Household | 111 | 41.0% |
| 3-Person Household | 39 | 14.4% |
| 4+ Person Household | 37 | 13.7% |
| Total Housing Units | 271 | 100.0% |
Occupancy by Ownership by Household Size in Sand Rock
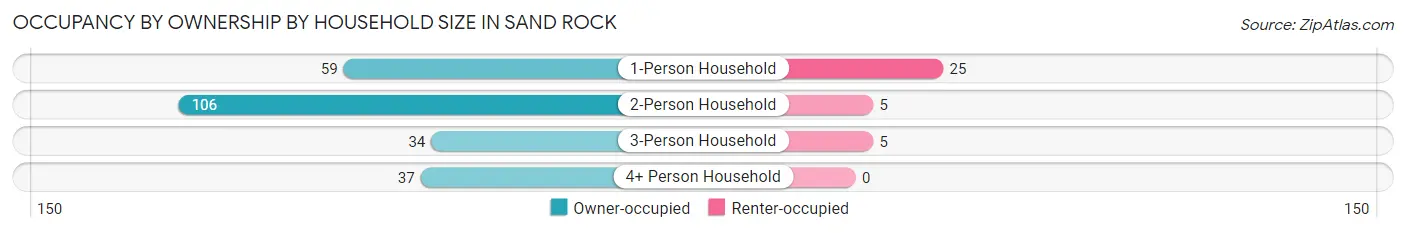
| Household Size | Owner-occupied | Renter-occupied |
| 1-Person Household | 59 (70.2%) | 25 (29.8%) |
| 2-Person Household | 106 (95.5%) | 5 (4.5%) |
| 3-Person Household | 34 (87.2%) | 5 (12.8%) |
| 4+ Person Household | 37 (100.0%) | 0 (0.0%) |
| Total Housing Units | 236 (87.1%) | 35 (12.9%) |
Occupancy by Educational Attainment in Sand Rock
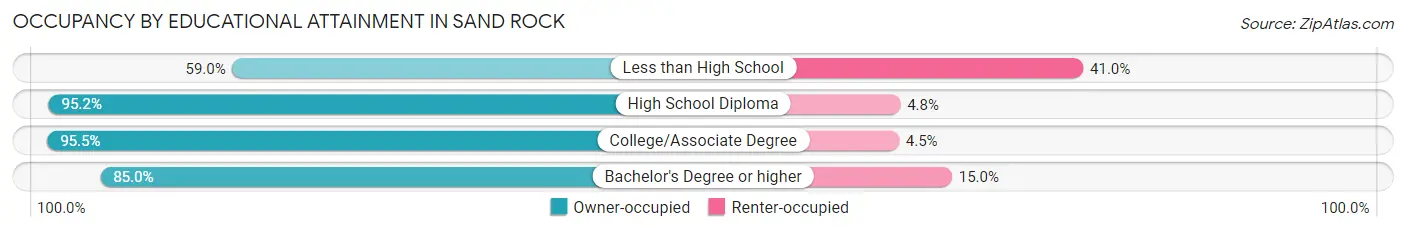
| Household Size | Owner-occupied | Renter-occupied |
| Less than High School | 23 (59.0%) | 16 (41.0%) |
| High School Diploma | 60 (95.2%) | 3 (4.8%) |
| College/Associate Degree | 85 (95.5%) | 4 (4.5%) |
| Bachelor's Degree or higher | 68 (85.0%) | 12 (15.0%) |
Occupancy by Age of Householder in Sand Rock
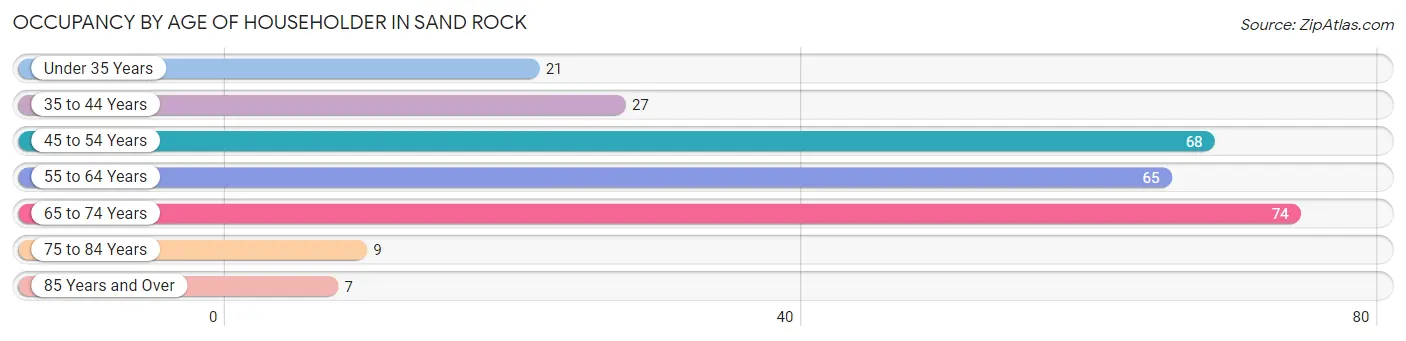
| Age Bracket | # Households | % Households |
| Under 35 Years | 21 | 7.7% |
| 35 to 44 Years | 27 | 10.0% |
| 45 to 54 Years | 68 | 25.1% |
| 55 to 64 Years | 65 | 24.0% |
| 65 to 74 Years | 74 | 27.3% |
| 75 to 84 Years | 9 | 3.3% |
| 85 Years and Over | 7 | 2.6% |
| Total | 271 | 100.0% |
Housing Finances in Sand Rock
Median Income by Occupancy in Sand Rock
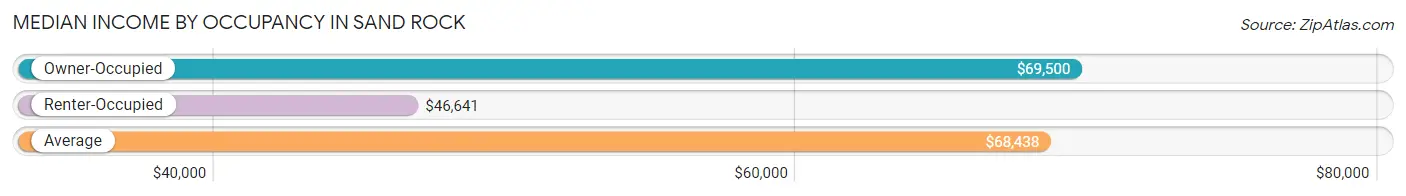
| Occupancy Type | # Households | Median Income |
| Owner-Occupied | 236 (87.1%) | $69,500 |
| Renter-Occupied | 35 (12.9%) | $46,641 |
| Average | 271 (100.0%) | $68,438 |
Occupancy by Householder Income Bracket in Sand Rock
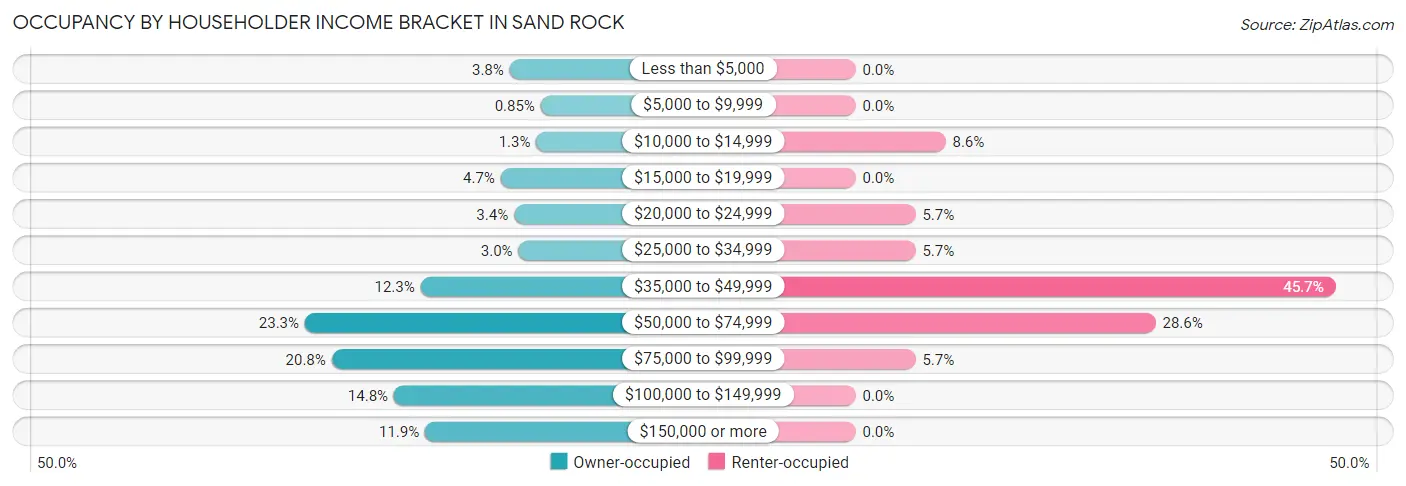
| Income Bracket | Owner-occupied | Renter-occupied |
| Less than $5,000 | 9 (3.8%) | 0 (0.0%) |
| $5,000 to $9,999 | 2 (0.9%) | 0 (0.0%) |
| $10,000 to $14,999 | 3 (1.3%) | 3 (8.6%) |
| $15,000 to $19,999 | 11 (4.7%) | 0 (0.0%) |
| $20,000 to $24,999 | 8 (3.4%) | 2 (5.7%) |
| $25,000 to $34,999 | 7 (3.0%) | 2 (5.7%) |
| $35,000 to $49,999 | 29 (12.3%) | 16 (45.7%) |
| $50,000 to $74,999 | 55 (23.3%) | 10 (28.6%) |
| $75,000 to $99,999 | 49 (20.8%) | 2 (5.7%) |
| $100,000 to $149,999 | 35 (14.8%) | 0 (0.0%) |
| $150,000 or more | 28 (11.9%) | 0 (0.0%) |
| Total | 236 (100.0%) | 35 (100.0%) |
Monthly Housing Cost Tiers in Sand Rock
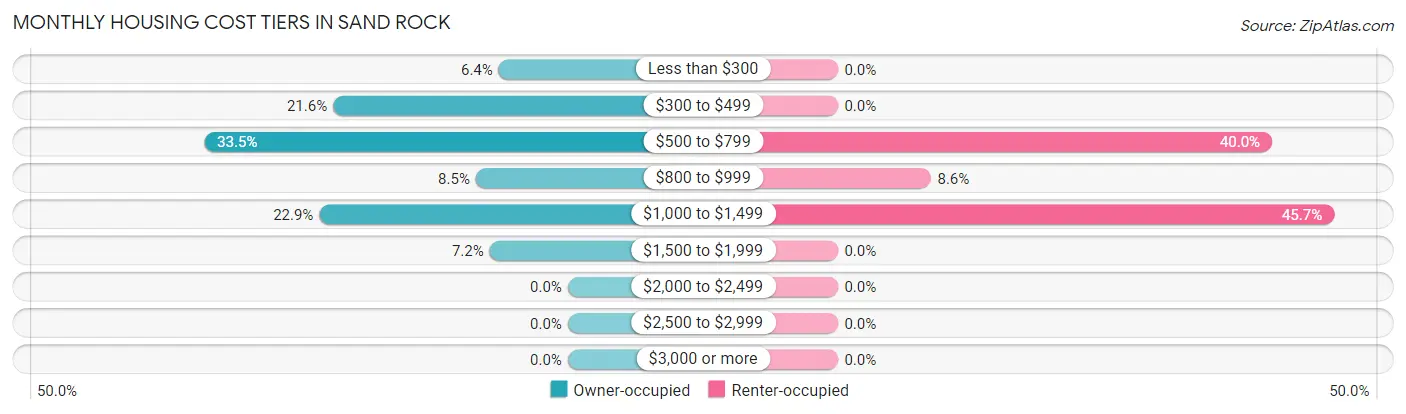
| Monthly Cost | Owner-occupied | Renter-occupied |
| Less than $300 | 15 (6.4%) | 0 (0.0%) |
| $300 to $499 | 51 (21.6%) | 0 (0.0%) |
| $500 to $799 | 79 (33.5%) | 14 (40.0%) |
| $800 to $999 | 20 (8.5%) | 3 (8.6%) |
| $1,000 to $1,499 | 54 (22.9%) | 16 (45.7%) |
| $1,500 to $1,999 | 17 (7.2%) | 0 (0.0%) |
| $2,000 to $2,499 | 0 (0.0%) | 0 (0.0%) |
| $2,500 to $2,999 | 0 (0.0%) | 0 (0.0%) |
| $3,000 or more | 0 (0.0%) | 0 (0.0%) |
| Total | 236 (100.0%) | 35 (100.0%) |
Physical Housing Characteristics in Sand Rock
Housing Structures in Sand Rock
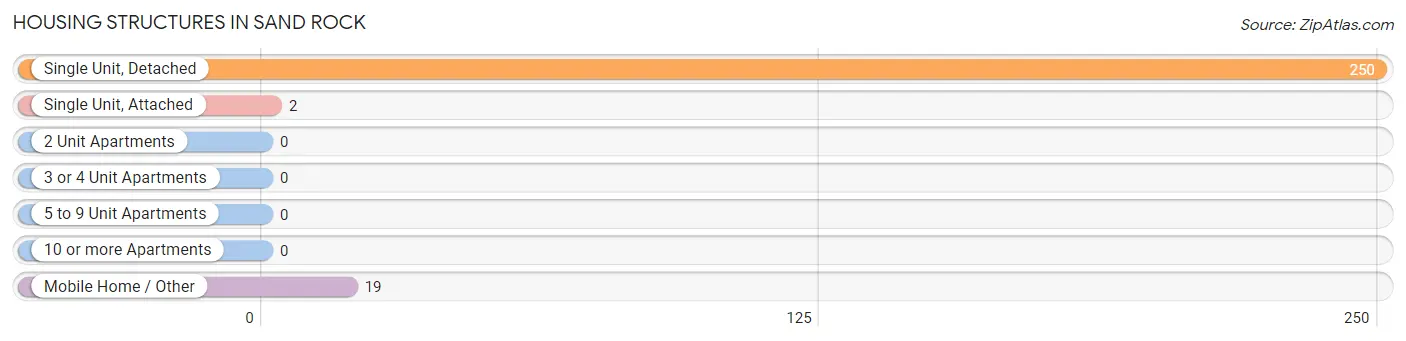
| Structure Type | # Housing Units | % Housing Units |
| Single Unit, Detached | 250 | 92.2% |
| Single Unit, Attached | 2 | 0.7% |
| 2 Unit Apartments | 0 | 0.0% |
| 3 or 4 Unit Apartments | 0 | 0.0% |
| 5 to 9 Unit Apartments | 0 | 0.0% |
| 10 or more Apartments | 0 | 0.0% |
| Mobile Home / Other | 19 | 7.0% |
| Total | 271 | 100.0% |
Housing Structures by Occupancy in Sand Rock
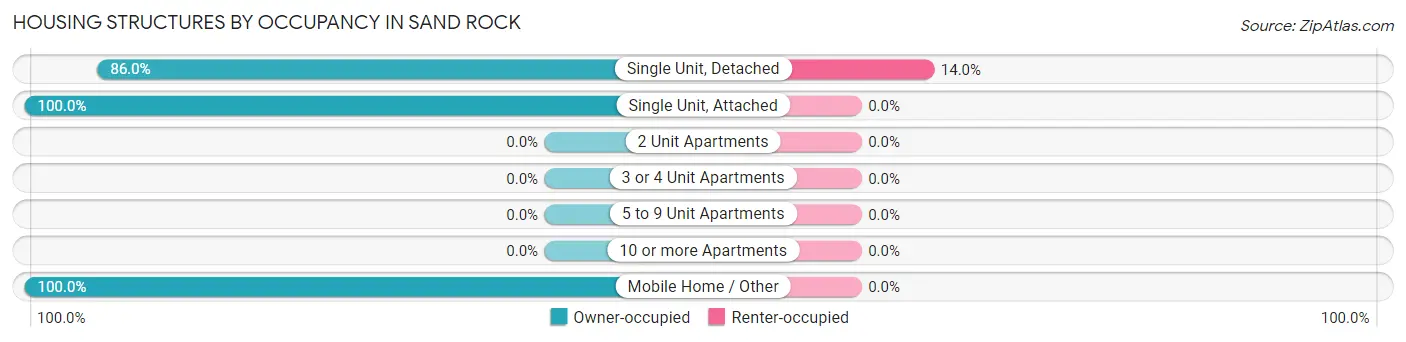
| Structure Type | Owner-occupied | Renter-occupied |
| Single Unit, Detached | 215 (86.0%) | 35 (14.0%) |
| Single Unit, Attached | 2 (100.0%) | 0 (0.0%) |
| 2 Unit Apartments | 0 (0.0%) | 0 (0.0%) |
| 3 or 4 Unit Apartments | 0 (0.0%) | 0 (0.0%) |
| 5 to 9 Unit Apartments | 0 (0.0%) | 0 (0.0%) |
| 10 or more Apartments | 0 (0.0%) | 0 (0.0%) |
| Mobile Home / Other | 19 (100.0%) | 0 (0.0%) |
| Total | 236 (87.1%) | 35 (12.9%) |
Housing Structures by Number of Rooms in Sand Rock
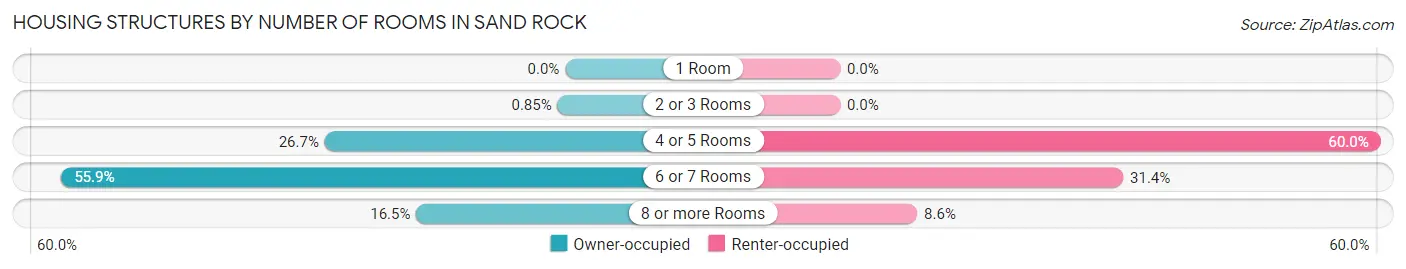
| Number of Rooms | Owner-occupied | Renter-occupied |
| 1 Room | 0 (0.0%) | 0 (0.0%) |
| 2 or 3 Rooms | 2 (0.9%) | 0 (0.0%) |
| 4 or 5 Rooms | 63 (26.7%) | 21 (60.0%) |
| 6 or 7 Rooms | 132 (55.9%) | 11 (31.4%) |
| 8 or more Rooms | 39 (16.5%) | 3 (8.6%) |
| Total | 236 (100.0%) | 35 (100.0%) |
Housing Structure by Heating Type in Sand Rock
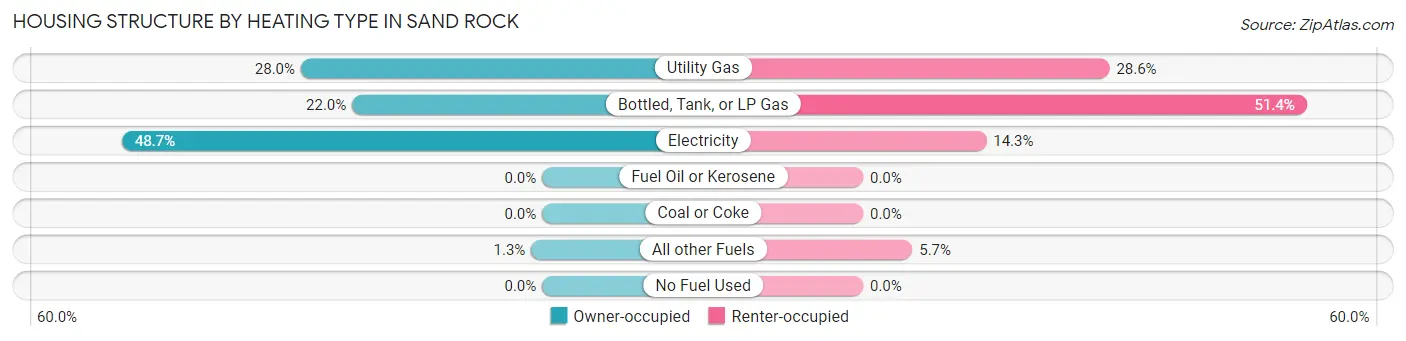
| Heating Type | Owner-occupied | Renter-occupied |
| Utility Gas | 66 (28.0%) | 10 (28.6%) |
| Bottled, Tank, or LP Gas | 52 (22.0%) | 18 (51.4%) |
| Electricity | 115 (48.7%) | 5 (14.3%) |
| Fuel Oil or Kerosene | 0 (0.0%) | 0 (0.0%) |
| Coal or Coke | 0 (0.0%) | 0 (0.0%) |
| All other Fuels | 3 (1.3%) | 2 (5.7%) |
| No Fuel Used | 0 (0.0%) | 0 (0.0%) |
| Total | 236 (100.0%) | 35 (100.0%) |
Household Vehicle Usage in Sand Rock
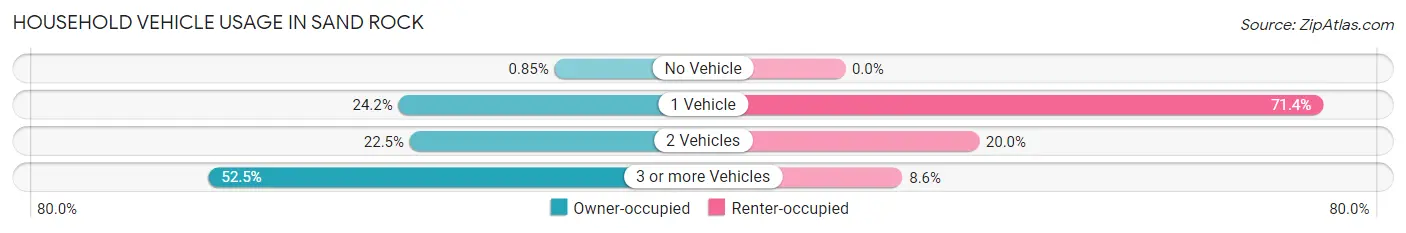
| Vehicles per Household | Owner-occupied | Renter-occupied |
| No Vehicle | 2 (0.9%) | 0 (0.0%) |
| 1 Vehicle | 57 (24.1%) | 25 (71.4%) |
| 2 Vehicles | 53 (22.5%) | 7 (20.0%) |
| 3 or more Vehicles | 124 (52.5%) | 3 (8.6%) |
| Total | 236 (100.0%) | 35 (100.0%) |
Real Estate & Mortgages in Sand Rock
Real Estate and Mortgage Overview in Sand Rock
| Characteristic | Without Mortgage | With Mortgage |
| Housing Units | 123 | 113 |
| Median Property Value | $167,700 | $153,300 |
| Median Household Income | $80,250 | $16 |
| Monthly Housing Costs | $486 | $0 |
| Real Estate Taxes | $564 | $14 |
Property Value by Mortgage Status in Sand Rock
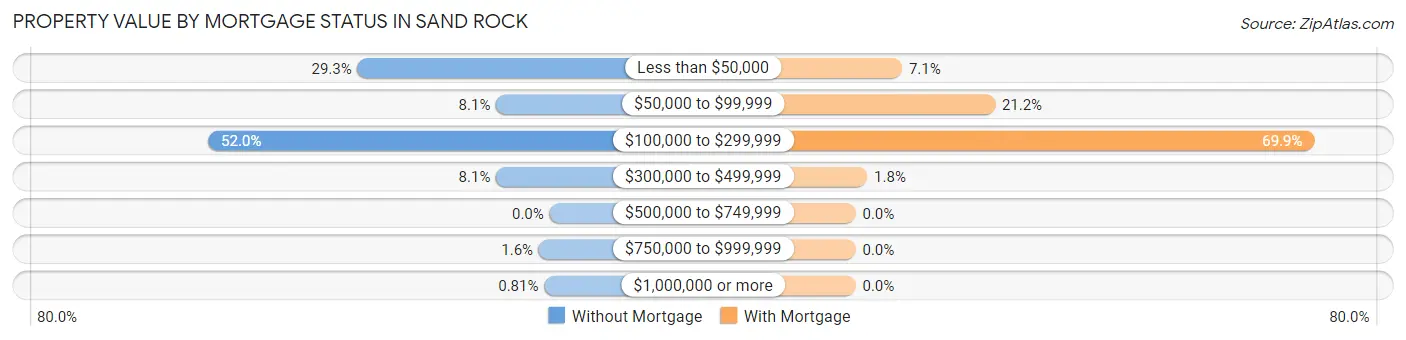
| Property Value | Without Mortgage | With Mortgage |
| Less than $50,000 | 36 (29.3%) | 8 (7.1%) |
| $50,000 to $99,999 | 10 (8.1%) | 24 (21.2%) |
| $100,000 to $299,999 | 64 (52.0%) | 79 (69.9%) |
| $300,000 to $499,999 | 10 (8.1%) | 2 (1.8%) |
| $500,000 to $749,999 | 0 (0.0%) | 0 (0.0%) |
| $750,000 to $999,999 | 2 (1.6%) | 0 (0.0%) |
| $1,000,000 or more | 1 (0.8%) | 0 (0.0%) |
| Total | 123 (100.0%) | 113 (100.0%) |
Household Income by Mortgage Status in Sand Rock
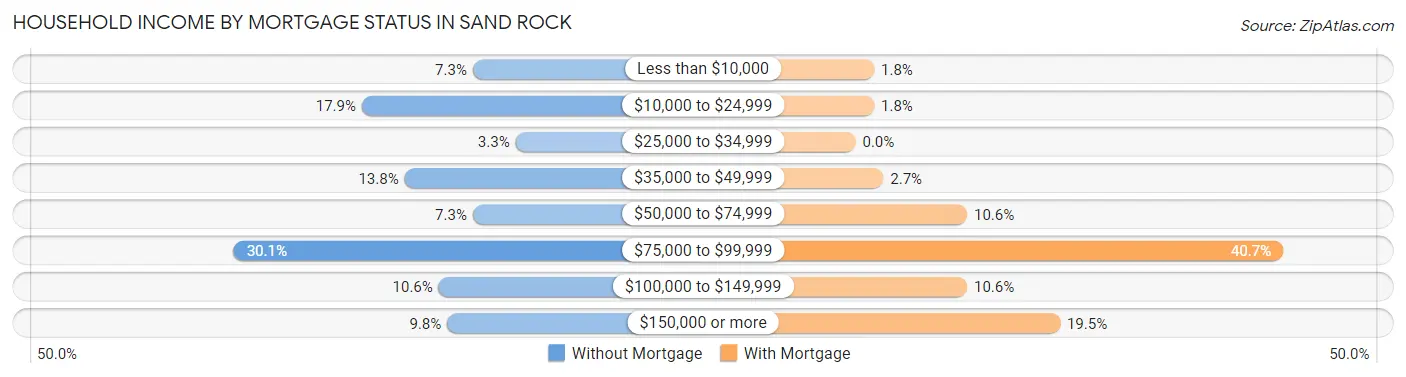
| Household Income | Without Mortgage | With Mortgage |
| Less than $10,000 | 9 (7.3%) | 2 (1.8%) |
| $10,000 to $24,999 | 22 (17.9%) | 2 (1.8%) |
| $25,000 to $34,999 | 4 (3.3%) | 0 (0.0%) |
| $35,000 to $49,999 | 17 (13.8%) | 3 (2.6%) |
| $50,000 to $74,999 | 9 (7.3%) | 12 (10.6%) |
| $75,000 to $99,999 | 37 (30.1%) | 46 (40.7%) |
| $100,000 to $149,999 | 13 (10.6%) | 12 (10.6%) |
| $150,000 or more | 12 (9.8%) | 22 (19.5%) |
| Total | 123 (100.0%) | 113 (100.0%) |
Property Value to Household Income Ratio in Sand Rock
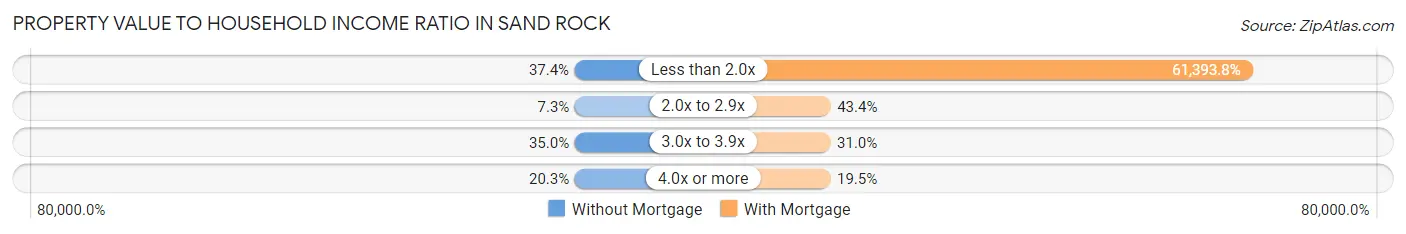
| Value-to-Income Ratio | Without Mortgage | With Mortgage |
| Less than 2.0x | 46 (37.4%) | 69,375 (61,393.8%) |
| 2.0x to 2.9x | 9 (7.3%) | 49 (43.4%) |
| 3.0x to 3.9x | 43 (35.0%) | 35 (31.0%) |
| 4.0x or more | 25 (20.3%) | 22 (19.5%) |
| Total | 123 (100.0%) | 113 (100.0%) |
Real Estate Taxes by Mortgage Status in Sand Rock
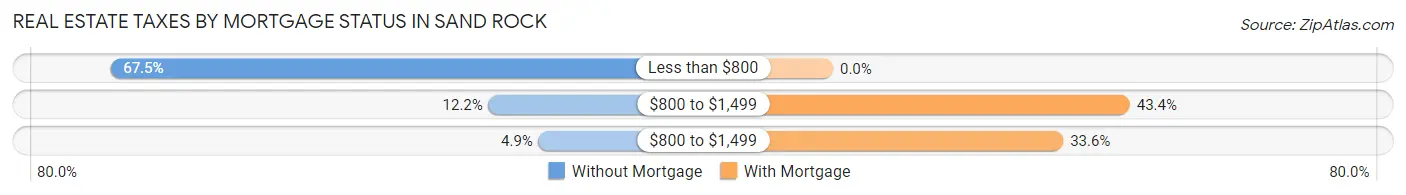
| Property Taxes | Without Mortgage | With Mortgage |
| Less than $800 | 83 (67.5%) | 0 (0.0%) |
| $800 to $1,499 | 15 (12.2%) | 49 (43.4%) |
| $800 to $1,499 | 6 (4.9%) | 38 (33.6%) |
| Total | 123 (100.0%) | 113 (100.0%) |
Health & Disability in Sand Rock
Health Insurance Coverage by Age in Sand Rock
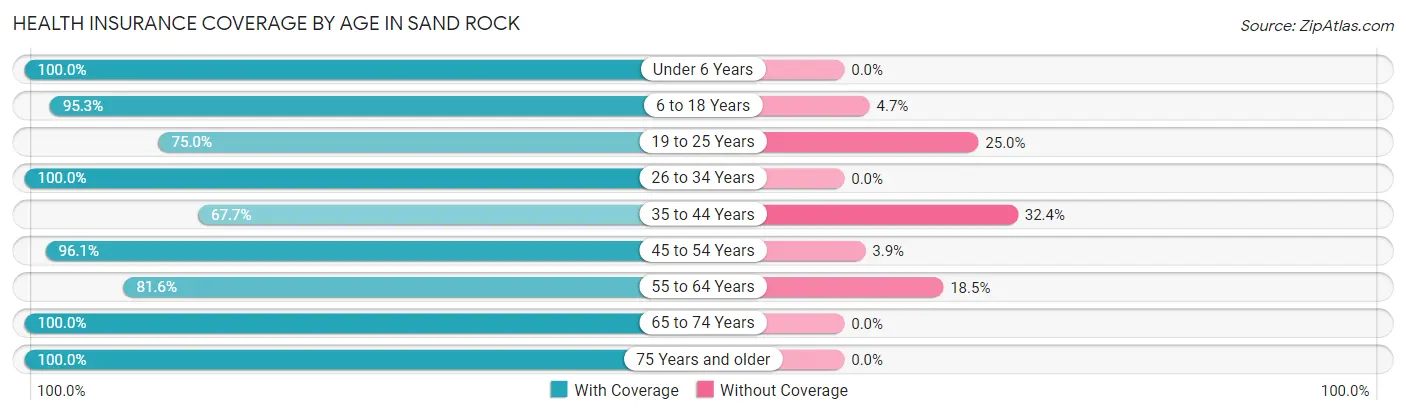
| Age Bracket | With Coverage | Without Coverage |
| Under 6 Years | 49 (100.0%) | 0 (0.0%) |
| 6 to 18 Years | 101 (95.3%) | 5 (4.7%) |
| 19 to 25 Years | 33 (75.0%) | 11 (25.0%) |
| 26 to 34 Years | 40 (100.0%) | 0 (0.0%) |
| 35 to 44 Years | 69 (67.6%) | 33 (32.4%) |
| 45 to 54 Years | 98 (96.1%) | 4 (3.9%) |
| 55 to 64 Years | 84 (81.6%) | 19 (18.4%) |
| 65 to 74 Years | 145 (100.0%) | 0 (0.0%) |
| 75 Years and older | 29 (100.0%) | 0 (0.0%) |
| Total | 648 (90.0%) | 72 (10.0%) |
Health Insurance Coverage by Citizenship Status in Sand Rock
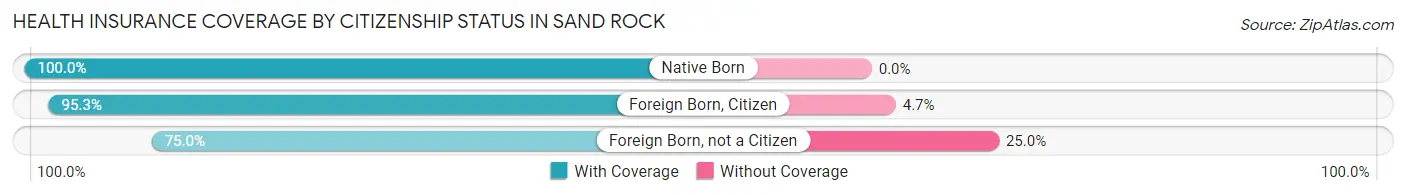
| Citizenship Status | With Coverage | Without Coverage |
| Native Born | 49 (100.0%) | 0 (0.0%) |
| Foreign Born, Citizen | 101 (95.3%) | 5 (4.7%) |
| Foreign Born, not a Citizen | 33 (75.0%) | 11 (25.0%) |
Health Insurance Coverage by Household Income in Sand Rock
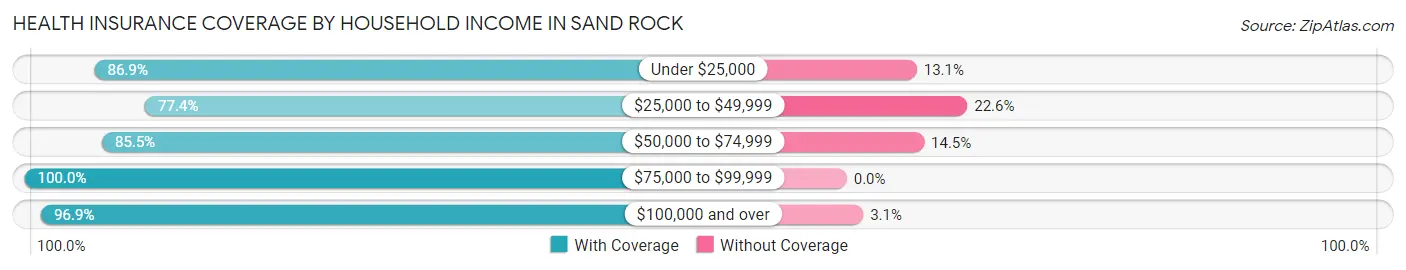
| Household Income | With Coverage | Without Coverage |
| Under $25,000 | 53 (86.9%) | 8 (13.1%) |
| $25,000 to $49,999 | 96 (77.4%) | 28 (22.6%) |
| $50,000 to $74,999 | 177 (85.5%) | 30 (14.5%) |
| $75,000 to $99,999 | 133 (100.0%) | 0 (0.0%) |
| $100,000 and over | 189 (96.9%) | 6 (3.1%) |
Public vs Private Health Insurance Coverage by Age in Sand Rock
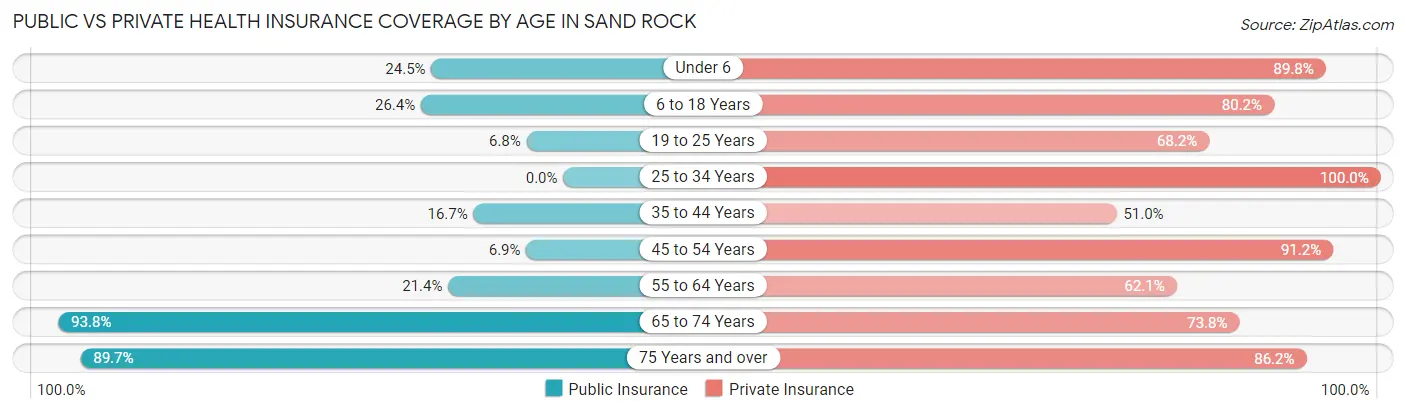
| Age Bracket | Public Insurance | Private Insurance |
| Under 6 | 12 (24.5%) | 44 (89.8%) |
| 6 to 18 Years | 28 (26.4%) | 85 (80.2%) |
| 19 to 25 Years | 3 (6.8%) | 30 (68.2%) |
| 25 to 34 Years | 0 (0.0%) | 40 (100.0%) |
| 35 to 44 Years | 17 (16.7%) | 52 (51.0%) |
| 45 to 54 Years | 7 (6.9%) | 93 (91.2%) |
| 55 to 64 Years | 22 (21.4%) | 64 (62.1%) |
| 65 to 74 Years | 136 (93.8%) | 107 (73.8%) |
| 75 Years and over | 26 (89.7%) | 25 (86.2%) |
| Total | 251 (34.9%) | 540 (75.0%) |
Disability Status by Sex by Age in Sand Rock
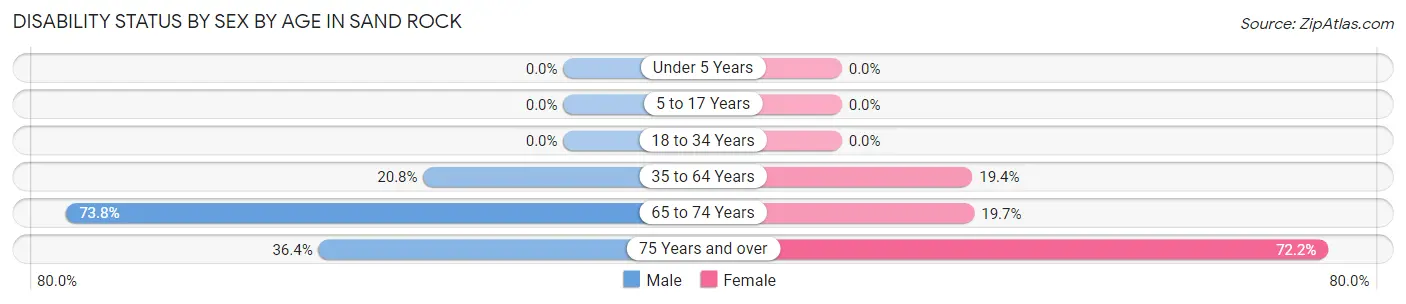
| Age Bracket | Male | Female |
| Under 5 Years | 0 (0.0%) | 0 (0.0%) |
| 5 to 17 Years | 0 (0.0%) | 0 (0.0%) |
| 18 to 34 Years | 0 (0.0%) | 0 (0.0%) |
| 35 to 64 Years | 37 (20.8%) | 25 (19.4%) |
| 65 to 74 Years | 62 (73.8%) | 12 (19.7%) |
| 75 Years and over | 4 (36.4%) | 13 (72.2%) |
Disability Class by Sex by Age in Sand Rock
Disability Class: Hearing Difficulty
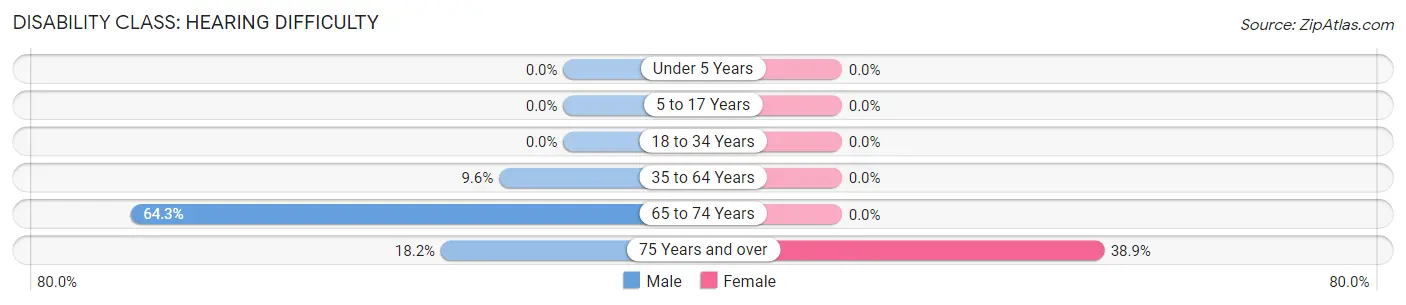
| Age Bracket | Male | Female |
| Under 5 Years | 0 (0.0%) | 0 (0.0%) |
| 5 to 17 Years | 0 (0.0%) | 0 (0.0%) |
| 18 to 34 Years | 0 (0.0%) | 0 (0.0%) |
| 35 to 64 Years | 17 (9.6%) | 0 (0.0%) |
| 65 to 74 Years | 54 (64.3%) | 0 (0.0%) |
| 75 Years and over | 2 (18.2%) | 7 (38.9%) |
Disability Class: Vision Difficulty
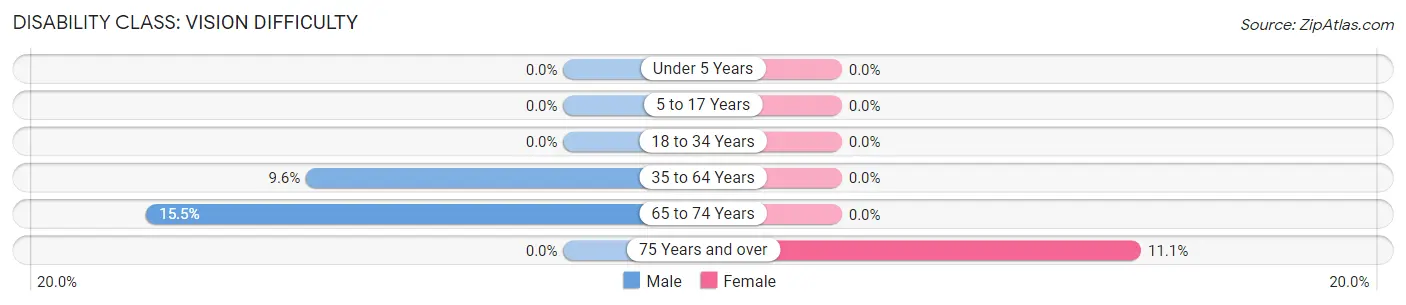
| Age Bracket | Male | Female |
| Under 5 Years | 0 (0.0%) | 0 (0.0%) |
| 5 to 17 Years | 0 (0.0%) | 0 (0.0%) |
| 18 to 34 Years | 0 (0.0%) | 0 (0.0%) |
| 35 to 64 Years | 17 (9.6%) | 0 (0.0%) |
| 65 to 74 Years | 13 (15.5%) | 0 (0.0%) |
| 75 Years and over | 0 (0.0%) | 2 (11.1%) |
Disability Class: Cognitive Difficulty
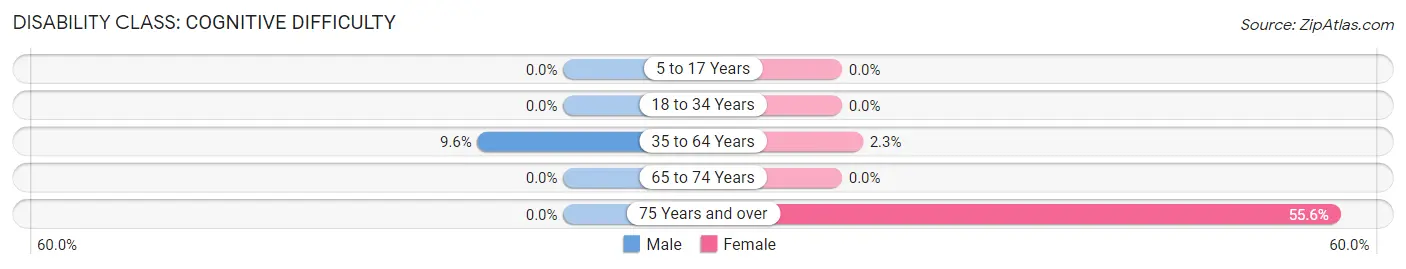
| Age Bracket | Male | Female |
| 5 to 17 Years | 0 (0.0%) | 0 (0.0%) |
| 18 to 34 Years | 0 (0.0%) | 0 (0.0%) |
| 35 to 64 Years | 17 (9.6%) | 3 (2.3%) |
| 65 to 74 Years | 0 (0.0%) | 0 (0.0%) |
| 75 Years and over | 0 (0.0%) | 10 (55.6%) |
Disability Class: Ambulatory Difficulty
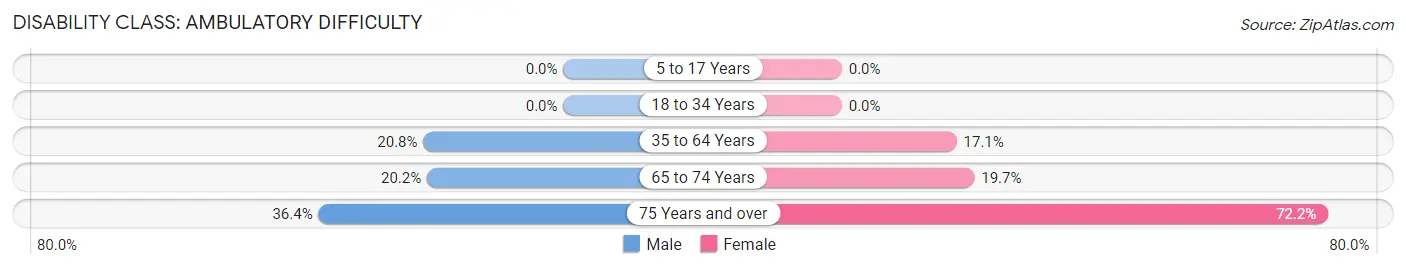
| Age Bracket | Male | Female |
| 5 to 17 Years | 0 (0.0%) | 0 (0.0%) |
| 18 to 34 Years | 0 (0.0%) | 0 (0.0%) |
| 35 to 64 Years | 37 (20.8%) | 22 (17.1%) |
| 65 to 74 Years | 17 (20.2%) | 12 (19.7%) |
| 75 Years and over | 4 (36.4%) | 13 (72.2%) |
Disability Class: Self-Care Difficulty
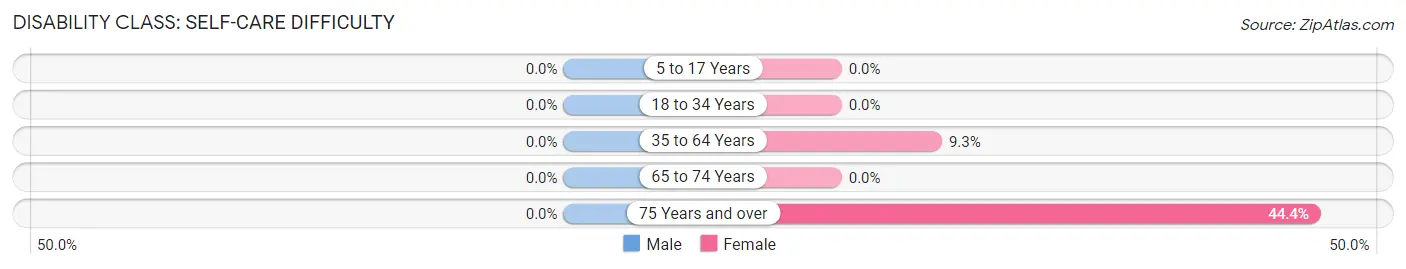
| Age Bracket | Male | Female |
| 5 to 17 Years | 0 (0.0%) | 0 (0.0%) |
| 18 to 34 Years | 0 (0.0%) | 0 (0.0%) |
| 35 to 64 Years | 0 (0.0%) | 12 (9.3%) |
| 65 to 74 Years | 0 (0.0%) | 0 (0.0%) |
| 75 Years and over | 0 (0.0%) | 8 (44.4%) |
Technology Access in Sand Rock
Computing Device Access in Sand Rock
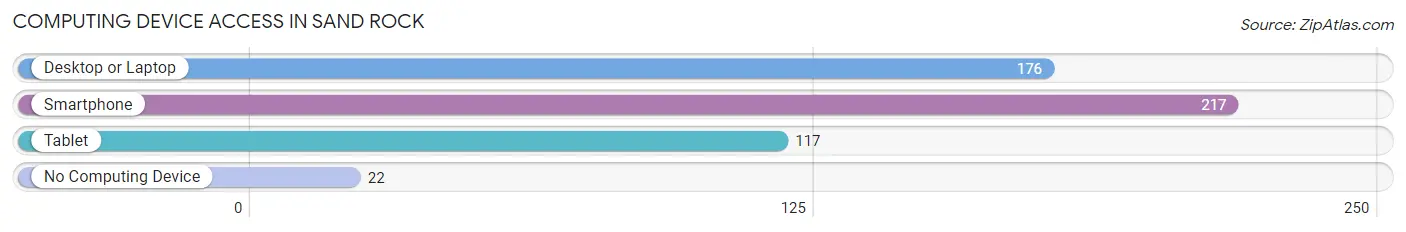
| Device Type | # Households | % Households |
| Desktop or Laptop | 176 | 64.9% |
| Smartphone | 217 | 80.1% |
| Tablet | 117 | 43.2% |
| No Computing Device | 22 | 8.1% |
| Total | 271 | 100.0% |
Internet Access in Sand Rock
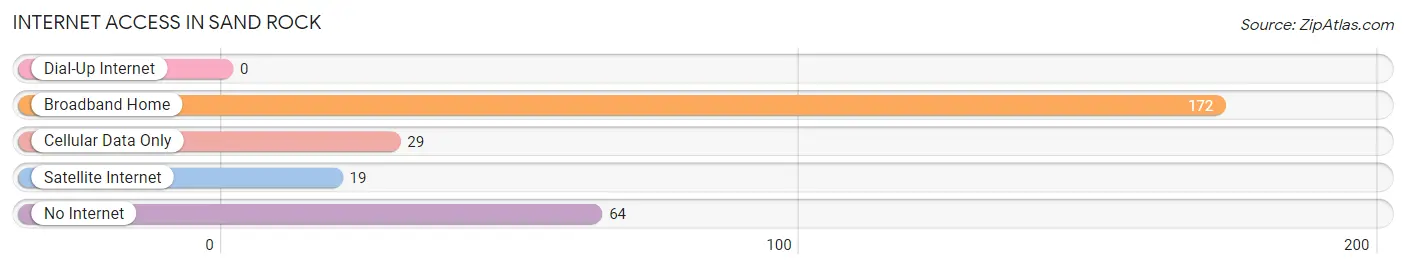
| Internet Type | # Households | % Households |
| Dial-Up Internet | 0 | 0.0% |
| Broadband Home | 172 | 63.5% |
| Cellular Data Only | 29 | 10.7% |
| Satellite Internet | 19 | 7.0% |
| No Internet | 64 | 23.6% |
| Total | 271 | 100.0% |
Sand Rock Summary
Sand Rock is a small town located in Cherokee County, Alabama. It is situated in the foothills of the Appalachian Mountains, and is part of the Gadsden-Anniston-Talladega metropolitan area. The town has a population of approximately 500 people, and is known for its rural charm and friendly atmosphere.
Geography
Sand Rock is located in the foothills of the Appalachian Mountains, and is part of the Gadsden-Anniston-Talladega metropolitan area. The town is situated on the banks of the Coosa River, and is surrounded by rolling hills and lush forests. The town is located approximately 30 miles from the city of Gadsden, and is accessible by US Highway 411.
Climate
Sand Rock has a humid subtropical climate, with hot summers and mild winters. The average annual temperature is around 68 degrees Fahrenheit, with temperatures ranging from the mid-50s in the winter to the mid-80s in the summer. The town receives an average of 48 inches of precipitation per year, with most of it falling in the spring and summer months.
Demographics
As of the 2010 census, Sand Rock had a population of 498 people. The racial makeup of the town was 97.2% White, 0.6% African American, 0.2% Native American, 0.2% Asian, 0.2% from other races, and 1.6% from two or more races. Hispanic or Latino of any race were 0.8% of the population.
Economy
Sand Rock’s economy is largely based on agriculture and tourism. The town is home to several farms, which produce a variety of crops, including corn, soybeans, and cotton. The town also has a number of small businesses, including restaurants, convenience stores, and antique shops. Tourism is also an important part of the local economy, with visitors coming to the area to enjoy the scenic beauty of the Appalachian Mountains.
History
Sand Rock was founded in 1836 by settlers from Georgia and Tennessee. The town was originally known as “Sandrock”, and was named after the sandstone formations in the area. The town was incorporated in 1887, and the first post office was established in 1891.
In the early 20th century, Sand Rock was a thriving community, with a population of over 1,000 people. The town was home to several businesses, including a cotton gin, a grist mill, and a sawmill. The town also had a number of churches, schools, and a bank.
In the late 20th century, Sand Rock began to decline, as many of its residents moved away in search of better economic opportunities. The population of the town has remained relatively stable since then, and the town has managed to retain its rural charm and friendly atmosphere.
Common Questions
What is Per Capita Income in Sand Rock?
Per Capita income in Sand Rock is $32,841.
What is the Median Family Income in Sand Rock?
Median Family Income in Sand Rock is $73,750.
What is the Median Household income in Sand Rock?
Median Household Income in Sand Rock is $68,438.
What is Income or Wage Gap in Sand Rock?
Income or Wage Gap in Sand Rock is 15.6%.
Women in Sand Rock earn 84.4 cents for every dollar earned by a man.
What is Inequality or Gini Index in Sand Rock?
Inequality or Gini Index in Sand Rock is 0.37.
What is the Total Population of Sand Rock?
Total Population of Sand Rock is 720.
What is the Total Male Population of Sand Rock?
Total Male Population of Sand Rock is 434.
What is the Total Female Population of Sand Rock?
Total Female Population of Sand Rock is 286.
What is the Ratio of Males per 100 Females in Sand Rock?
There are 151.75 Males per 100 Females in Sand Rock.
What is the Ratio of Females per 100 Males in Sand Rock?
There are 65.90 Females per 100 Males in Sand Rock.
What is the Median Population Age in Sand Rock?
Median Population Age in Sand Rock is 47.0 Years.
What is the Average Family Size in Sand Rock
Average Family Size in Sand Rock is 3.2 People.
What is the Average Household Size in Sand Rock
Average Household Size in Sand Rock is 2.7 People.
How Large is the Labor Force in Sand Rock?
There are 296 People in the Labor Forcein in Sand Rock.
What is the Percentage of People in the Labor Force in Sand Rock?
48.8% of People are in the Labor Force in Sand Rock.
What is the Unemployment Rate in Sand Rock?
Unemployment Rate in Sand Rock is 4.7%.