Ardmore, AL Map & Demographics
Ardmore Map
Ardmore Overview
$25,776
PER CAPITA INCOME
$52,200
AVG FAMILY INCOME
$39,973
AVG HOUSEHOLD INCOME
43.4%
WAGE / INCOME GAP [ % ]
56.6¢/ $1
WAGE / INCOME GAP [ $ ]
0.39
INEQUALITY / GINI INDEX
1,304
TOTAL POPULATION
645
MALE POPULATION
659
FEMALE POPULATION
97.88
MALES / 100 FEMALES
102.17
FEMALES / 100 MALES
33.9
MEDIAN AGE
3.3
AVG FAMILY SIZE
2.4
AVG HOUSEHOLD SIZE
584
LABOR FORCE [ PEOPLE ]
56.9%
PERCENT IN LABOR FORCE
1.7%
UNEMPLOYMENT RATE
Ardmore Zip Codes
Ardmore Area Codes
Income in Ardmore
Income Overview in Ardmore
Per Capita Income in Ardmore is $25,776, while median incomes of families and households are $52,200 and $39,973 respectively.
| Characteristic | Number | Measure |
| Per Capita Income | 1,304 | $25,776 |
| Median Family Income | 302 | $52,200 |
| Mean Family Income | 302 | $69,060 |
| Median Household Income | 552 | $39,973 |
| Mean Household Income | 552 | $55,650 |
| Income Deficit | 302 | $0 |
| Wage / Income Gap (%) | 1,304 | 43.38% |
| Wage / Income Gap ($) | 1,304 | 56.62¢ per $1 |
| Gini / Inequality Index | 1,304 | 0.39 |
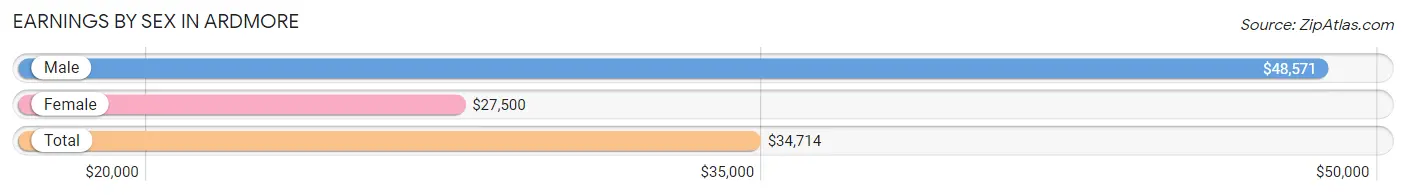
Earnings by Sex in Ardmore
Average Earnings in Ardmore are $34,714, $48,571 for men and $27,500 for women, a difference of 43.4%.
| Sex | Number | Average Earnings |
| Male | 348 (57.8%) | $48,571 |
| Female | 254 (42.2%) | $27,500 |
| Total | 602 (100.0%) | $34,714 |
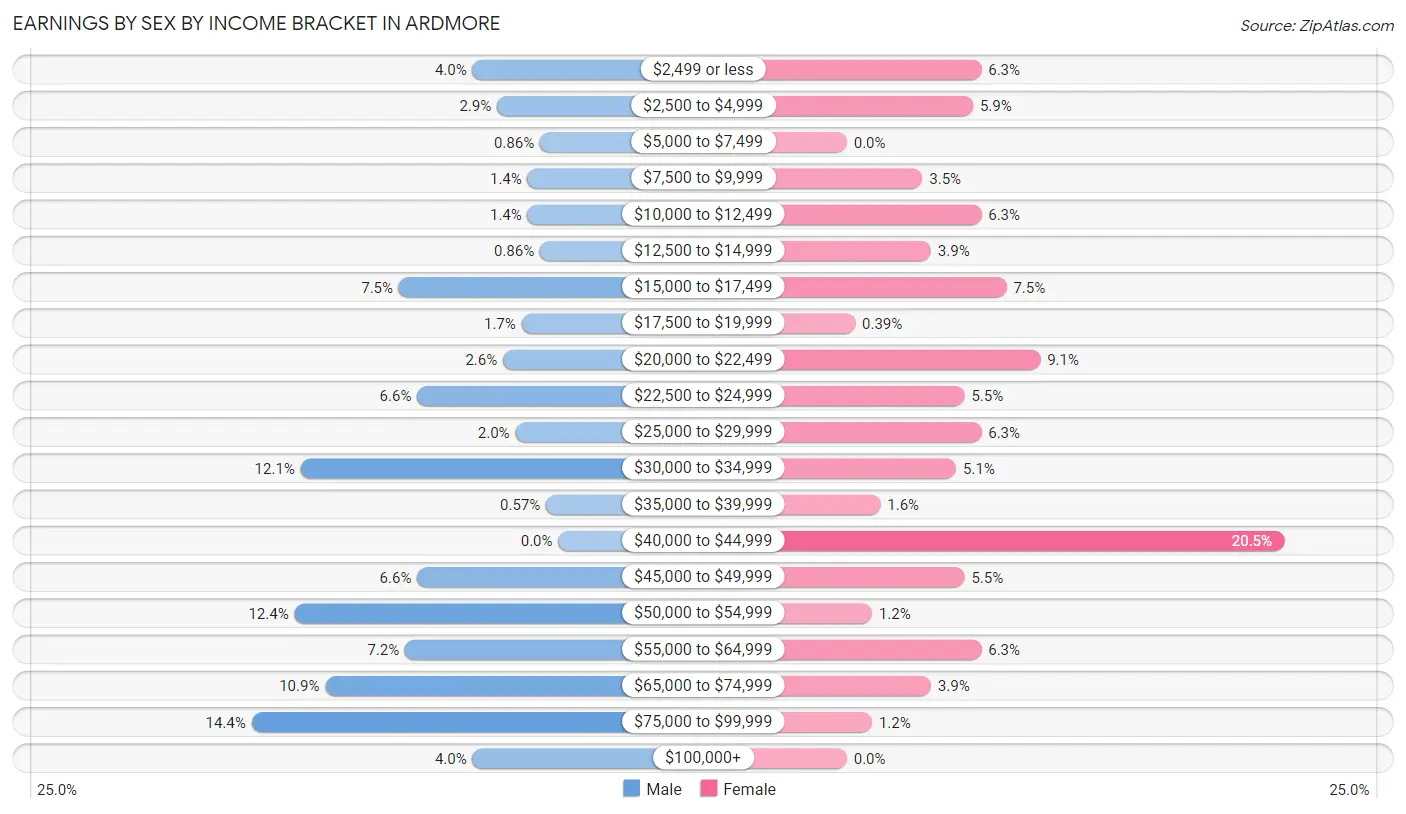
Earnings by Sex by Income Bracket in Ardmore
The most common earnings brackets in Ardmore are $75,000 to $99,999 for men (50 | 14.4%) and $40,000 to $44,999 for women (52 | 20.5%).
| Income | Male | Female |
| $2,499 or less | 14 (4.0%) | 16 (6.3%) |
| $2,500 to $4,999 | 10 (2.9%) | 15 (5.9%) |
| $5,000 to $7,499 | 3 (0.9%) | 0 (0.0%) |
| $7,500 to $9,999 | 5 (1.4%) | 9 (3.5%) |
| $10,000 to $12,499 | 5 (1.4%) | 16 (6.3%) |
| $12,500 to $14,999 | 3 (0.9%) | 10 (3.9%) |
| $15,000 to $17,499 | 26 (7.5%) | 19 (7.5%) |
| $17,500 to $19,999 | 6 (1.7%) | 1 (0.4%) |
| $20,000 to $22,499 | 9 (2.6%) | 23 (9.1%) |
| $22,500 to $24,999 | 23 (6.6%) | 14 (5.5%) |
| $25,000 to $29,999 | 7 (2.0%) | 16 (6.3%) |
| $30,000 to $34,999 | 42 (12.1%) | 13 (5.1%) |
| $35,000 to $39,999 | 2 (0.6%) | 4 (1.6%) |
| $40,000 to $44,999 | 0 (0.0%) | 52 (20.5%) |
| $45,000 to $49,999 | 23 (6.6%) | 14 (5.5%) |
| $50,000 to $54,999 | 43 (12.4%) | 3 (1.2%) |
| $55,000 to $64,999 | 25 (7.2%) | 16 (6.3%) |
| $65,000 to $74,999 | 38 (10.9%) | 10 (3.9%) |
| $75,000 to $99,999 | 50 (14.4%) | 3 (1.2%) |
| $100,000+ | 14 (4.0%) | 0 (0.0%) |
| Total | 348 (100.0%) | 254 (100.0%) |
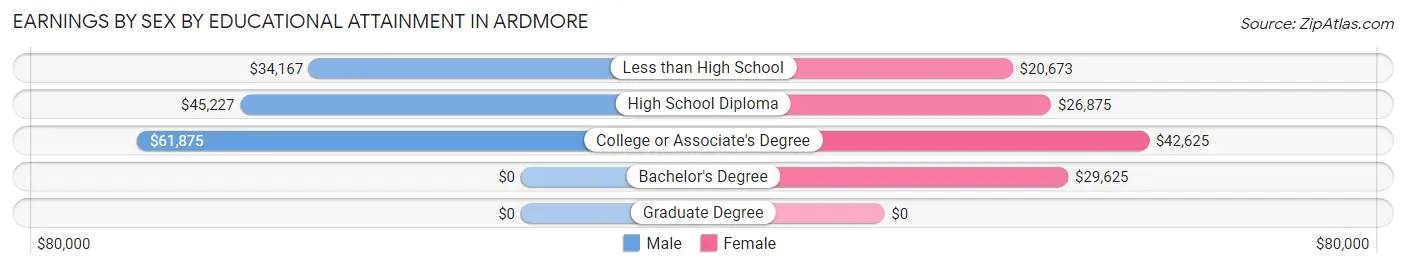
Earnings by Sex by Educational Attainment in Ardmore
Average earnings in Ardmore are $51,830 for men and $31,875 for women, a difference of 38.5%. Men with an educational attainment of college or associate's degree enjoy the highest average annual earnings of $61,875, while those with less than high school education earn the least with $34,167. Women with an educational attainment of college or associate's degree earn the most with the average annual earnings of $42,625, while those with less than high school education have the smallest earnings of $20,673.
| Educational Attainment | Male Income | Female Income |
| Less than High School | $34,167 | $20,673 |
| High School Diploma | $45,227 | $26,875 |
| College or Associate's Degree | $61,875 | $42,625 |
| Bachelor's Degree | - | - |
| Graduate Degree | - | - |
| Total | $51,830 | $31,875 |
Family Income in Ardmore
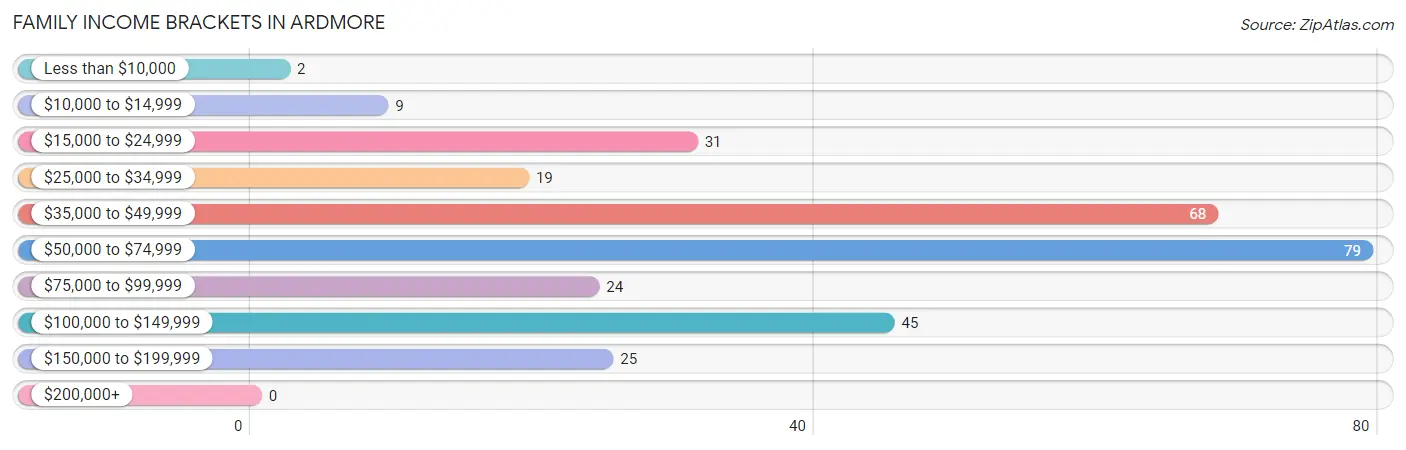
Family Income Brackets in Ardmore
According to the Ardmore family income data, there are 79 families falling into the $50,000 to $74,999 income range, which is the most common income bracket and makes up 26.2% of all families.
| Income Bracket | # Families | % Families |
| Less than $10,000 | 2 | 0.7% |
| $10,000 to $14,999 | 9 | 3.0% |
| $15,000 to $24,999 | 31 | 10.3% |
| $25,000 to $34,999 | 19 | 6.3% |
| $35,000 to $49,999 | 68 | 22.5% |
| $50,000 to $74,999 | 79 | 26.2% |
| $75,000 to $99,999 | 24 | 7.9% |
| $100,000 to $149,999 | 45 | 14.9% |
| $150,000 to $199,999 | 25 | 8.3% |
| $200,000+ | 0 | 0.0% |
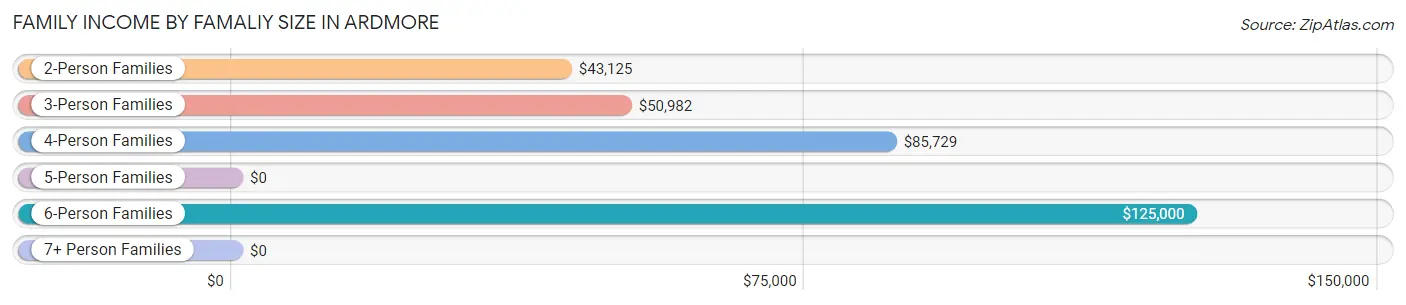
Family Income by Famaliy Size in Ardmore
6-person families (12 | 4.0%) account for the highest median family income in Ardmore with $125,000 per family, while 2-person families (112 | 37.1%) have the highest median income of $21,562 per family member.
| Income Bracket | # Families | Median Income |
| 2-Person Families | 112 (37.1%) | $43,125 |
| 3-Person Families | 69 (22.9%) | $50,982 |
| 4-Person Families | 109 (36.1%) | $85,729 |
| 5-Person Families | 0 (0.0%) | $0 |
| 6-Person Families | 12 (4.0%) | $125,000 |
| 7+ Person Families | 0 (0.0%) | $0 |
| Total | 302 (100.0%) | $52,200 |
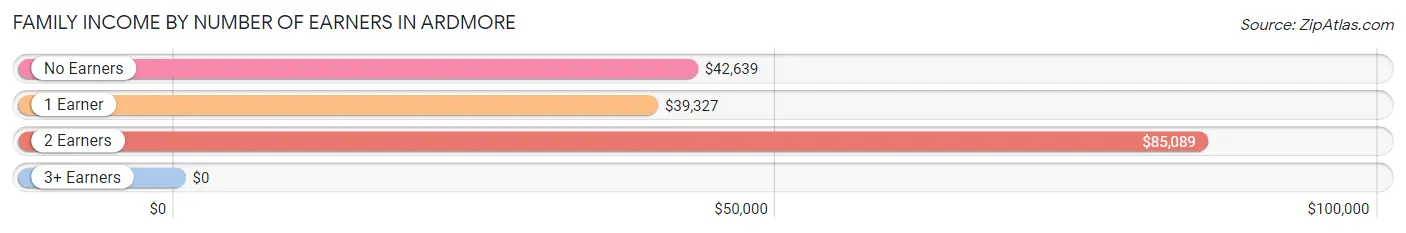
Family Income by Number of Earners in Ardmore
| Number of Earners | # Families | Median Income |
| No Earners | 47 (15.6%) | $42,639 |
| 1 Earner | 114 (37.8%) | $39,327 |
| 2 Earners | 121 (40.1%) | $85,089 |
| 3+ Earners | 20 (6.6%) | $0 |
| Total | 302 (100.0%) | $52,200 |
Household Income in Ardmore
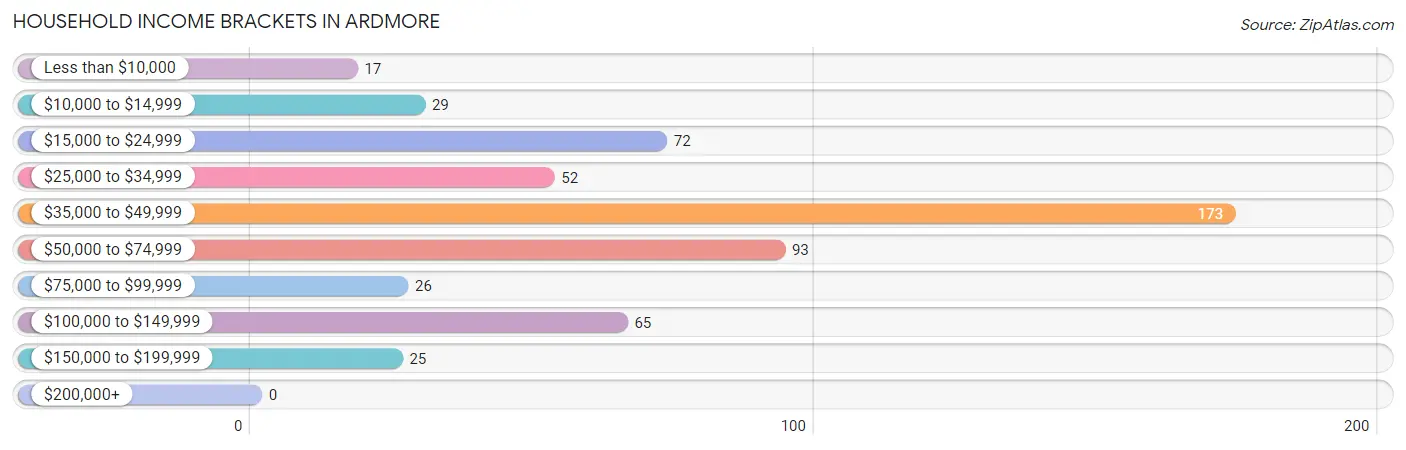
Household Income Brackets in Ardmore
With 173 households falling in the category, the $35,000 to $49,999 income range is the most frequent in Ardmore, accounting for 31.3% of all households.
| Income Bracket | # Households | % Households |
| Less than $10,000 | 17 | 3.1% |
| $10,000 to $14,999 | 29 | 5.3% |
| $15,000 to $24,999 | 72 | 13.0% |
| $25,000 to $34,999 | 52 | 9.4% |
| $35,000 to $49,999 | 173 | 31.3% |
| $50,000 to $74,999 | 93 | 16.8% |
| $75,000 to $99,999 | 26 | 4.7% |
| $100,000 to $149,999 | 65 | 11.8% |
| $150,000 to $199,999 | 25 | 4.5% |
| $200,000+ | 0 | 0.0% |
Household Income by Householder Age in Ardmore
The median household income in Ardmore is $39,973, with the highest median household income of $86,354 found in the 25 to 44 years age bracket for the primary householder. A total of 165 households (29.9%) fall into this category. Meanwhile, the 65+ years age bracket for the primary householder has the lowest median household income of $35,625, with 229 households (41.5%) in this group.
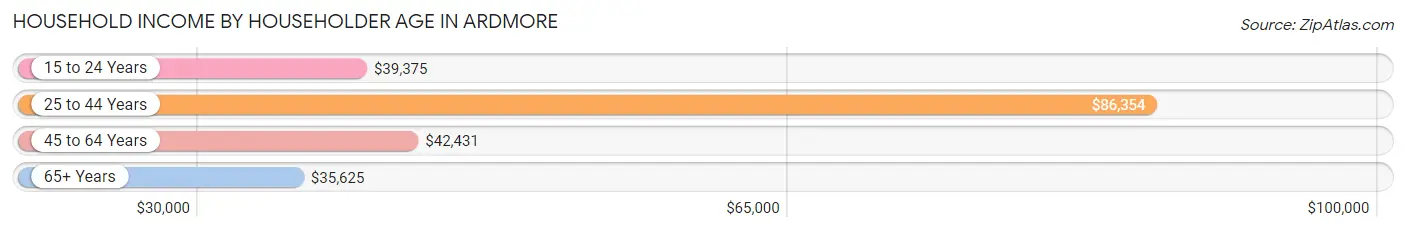
| Income Bracket | # Households | Median Income |
| 15 to 24 Years | 19 (3.4%) | $39,375 |
| 25 to 44 Years | 165 (29.9%) | $86,354 |
| 45 to 64 Years | 139 (25.2%) | $42,431 |
| 65+ Years | 229 (41.5%) | $35,625 |
| Total | 552 (100.0%) | $39,973 |
Poverty in Ardmore
Income Below Poverty by Sex and Age in Ardmore
With 10.7% poverty level for males and 19.1% for females among the residents of Ardmore, 5 year old males and 15 year old females are the most vulnerable to poverty, with 2 males (100.0%) and 2 females (100.0%) in their respective age groups living below the poverty level.
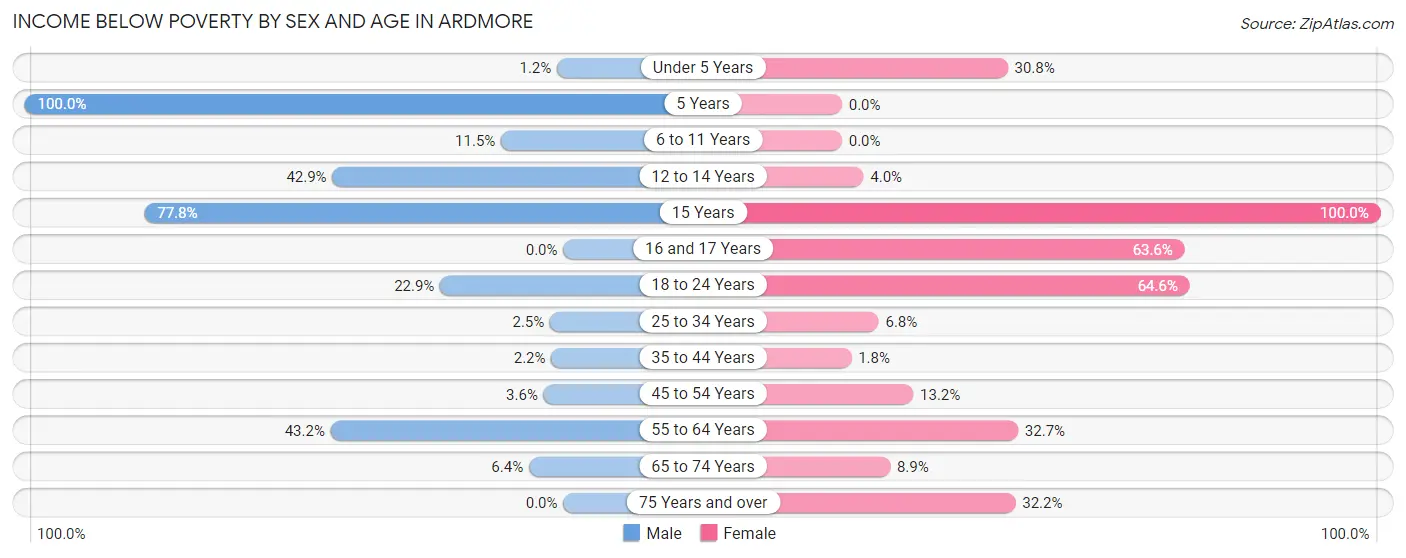
| Age Bracket | Male | Female |
| Under 5 Years | 1 (1.2%) | 12 (30.8%) |
| 5 Years | 2 (100.0%) | 0 (0.0%) |
| 6 to 11 Years | 6 (11.5%) | 0 (0.0%) |
| 12 to 14 Years | 9 (42.9%) | 1 (4.0%) |
| 15 Years | 14 (77.8%) | 2 (100.0%) |
| 16 and 17 Years | 0 (0.0%) | 14 (63.6%) |
| 18 to 24 Years | 8 (22.9%) | 31 (64.6%) |
| 25 to 34 Years | 3 (2.5%) | 9 (6.8%) |
| 35 to 44 Years | 2 (2.2%) | 1 (1.8%) |
| 45 to 54 Years | 2 (3.6%) | 9 (13.2%) |
| 55 to 64 Years | 19 (43.2%) | 17 (32.7%) |
| 65 to 74 Years | 3 (6.4%) | 11 (8.9%) |
| 75 Years and over | 0 (0.0%) | 19 (32.2%) |
| Total | 69 (10.7%) | 126 (19.1%) |
Income Above Poverty by Sex and Age in Ardmore
According to the poverty statistics in Ardmore, males aged 16 and 17 years and females aged 5 years are the age groups that are most secure financially, with 100.0% of males and 100.0% of females in these age groups living above the poverty line.
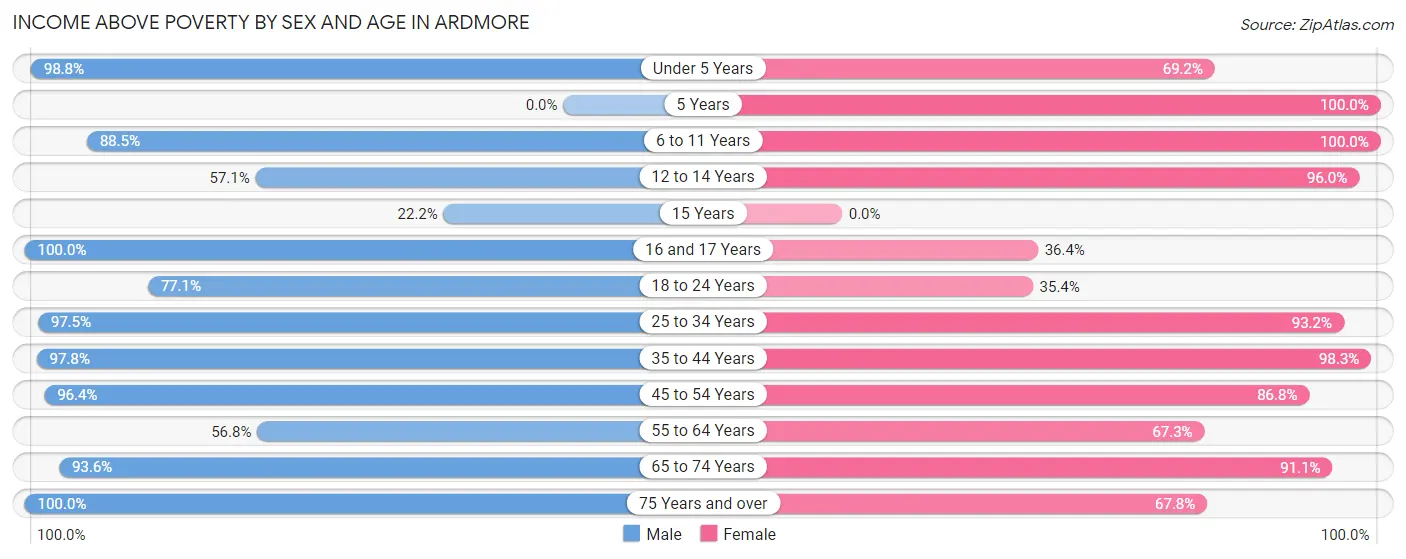
| Age Bracket | Male | Female |
| Under 5 Years | 85 (98.8%) | 27 (69.2%) |
| 5 Years | 0 (0.0%) | 3 (100.0%) |
| 6 to 11 Years | 46 (88.5%) | 29 (100.0%) |
| 12 to 14 Years | 12 (57.1%) | 24 (96.0%) |
| 15 Years | 4 (22.2%) | 0 (0.0%) |
| 16 and 17 Years | 28 (100.0%) | 8 (36.4%) |
| 18 to 24 Years | 27 (77.1%) | 17 (35.4%) |
| 25 to 34 Years | 119 (97.5%) | 123 (93.2%) |
| 35 to 44 Years | 88 (97.8%) | 56 (98.3%) |
| 45 to 54 Years | 53 (96.4%) | 59 (86.8%) |
| 55 to 64 Years | 25 (56.8%) | 35 (67.3%) |
| 65 to 74 Years | 44 (93.6%) | 112 (91.1%) |
| 75 Years and over | 45 (100.0%) | 40 (67.8%) |
| Total | 576 (89.3%) | 533 (80.9%) |
Income Below Poverty Among Married-Couple Families in Ardmore
The poverty statistics for married-couple families in Ardmore show that 1.7% or 4 of the total 230 families live below the poverty line. Families with 3 or 4 children have the highest poverty rate of 9.1%, comprising of 1 families. On the other hand, families with 1 or 2 children have the lowest poverty rate of 0.8%, which includes 1 families.
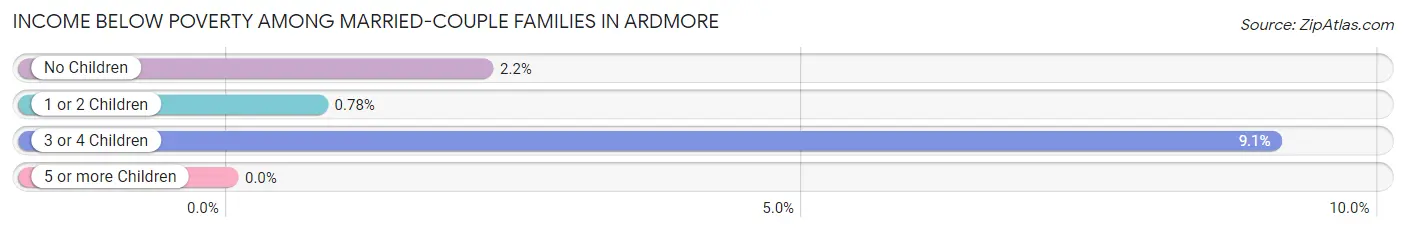
| Children | Above Poverty | Below Poverty |
| No Children | 88 (97.8%) | 2 (2.2%) |
| 1 or 2 Children | 128 (99.2%) | 1 (0.8%) |
| 3 or 4 Children | 10 (90.9%) | 1 (9.1%) |
| 5 or more Children | 0 (0.0%) | 0 (0.0%) |
| Total | 226 (98.3%) | 4 (1.7%) |
Income Below Poverty Among Single-Parent Households in Ardmore
According to the poverty data in Ardmore, 58.3% or 21 single-father households and 44.4% or 16 single-mother households are living below the poverty line. Among single-father households, those with 3 or 4 children have the highest poverty rate, with 19 households (100.0%) experiencing poverty. Likewise, among single-mother households, those with 1 or 2 children have the highest poverty rate, with 9 households (69.2%) falling below the poverty line.
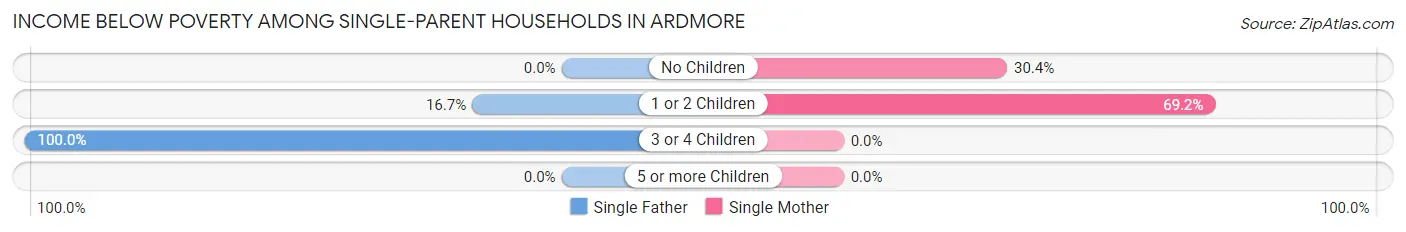
| Children | Single Father | Single Mother |
| No Children | 0 (0.0%) | 7 (30.4%) |
| 1 or 2 Children | 2 (16.7%) | 9 (69.2%) |
| 3 or 4 Children | 19 (100.0%) | 0 (0.0%) |
| 5 or more Children | 0 (0.0%) | 0 (0.0%) |
| Total | 21 (58.3%) | 16 (44.4%) |
Income Below Poverty Among Married-Couple vs Single-Parent Households in Ardmore
The poverty data for Ardmore shows that 4 of the married-couple family households (1.7%) and 37 of the single-parent households (51.4%) are living below the poverty level. Within the married-couple family households, those with 3 or 4 children have the highest poverty rate, with 1 households (9.1%) falling below the poverty line. Among the single-parent households, those with 3 or 4 children have the highest poverty rate, with 19 household (100.0%) living below poverty.
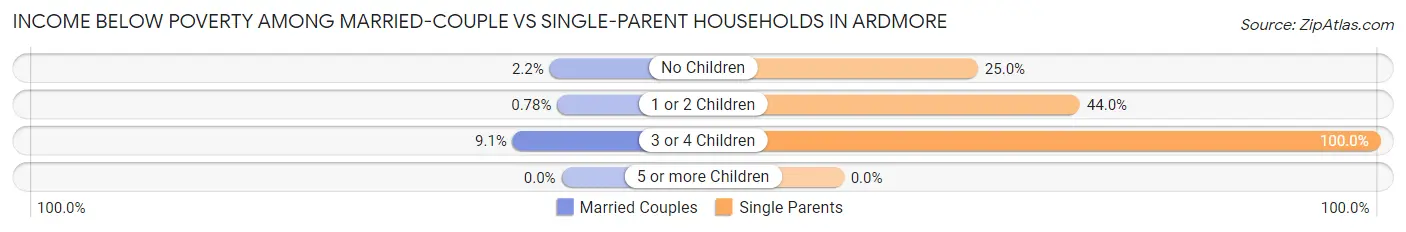
| Children | Married-Couple Families | Single-Parent Households |
| No Children | 2 (2.2%) | 7 (25.0%) |
| 1 or 2 Children | 1 (0.8%) | 11 (44.0%) |
| 3 or 4 Children | 1 (9.1%) | 19 (100.0%) |
| 5 or more Children | 0 (0.0%) | 0 (0.0%) |
| Total | 4 (1.7%) | 37 (51.4%) |
Race in Ardmore
The most populous races in Ardmore are White / Caucasian (1,137 | 87.2%), Black / African American (92 | 7.1%), and Two or more Races (51 | 3.9%).
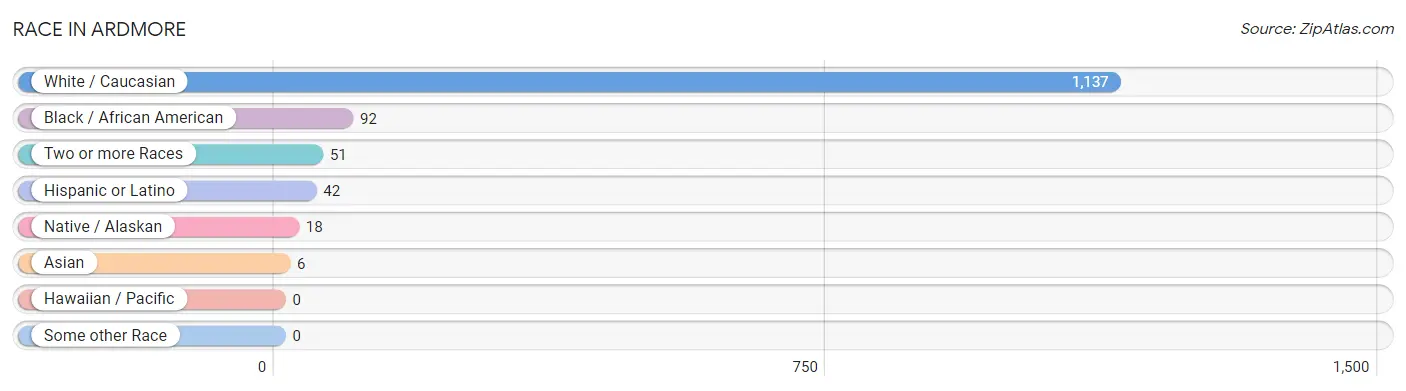
| Race | # Population | % Population |
| Asian | 6 | 0.5% |
| Black / African American | 92 | 7.1% |
| Hawaiian / Pacific | 0 | 0.0% |
| Hispanic or Latino | 42 | 3.2% |
| Native / Alaskan | 18 | 1.4% |
| White / Caucasian | 1,137 | 87.2% |
| Two or more Races | 51 | 3.9% |
| Some other Race | 0 | 0.0% |
| Total | 1,304 | 100.0% |
Ancestry in Ardmore
The most populous ancestries reported in Ardmore are American (167 | 12.8%), English (155 | 11.9%), Irish (141 | 10.8%), German (90 | 6.9%), and Italian (71 | 5.4%), together accounting for 47.8% of all Ardmore residents.
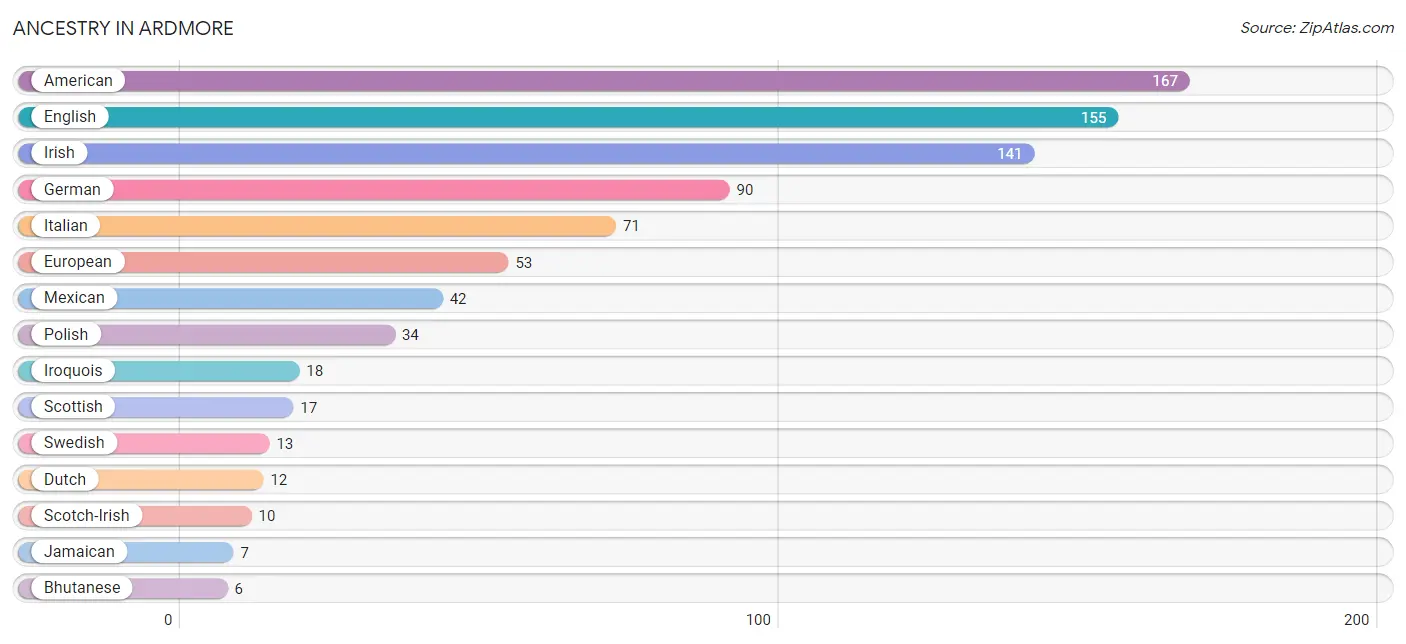
| Ancestry | # Population | % Population |
| American | 167 | 12.8% |
| Bhutanese | 6 | 0.5% |
| Dutch | 12 | 0.9% |
| English | 155 | 11.9% |
| European | 53 | 4.1% |
| French | 6 | 0.5% |
| French Canadian | 4 | 0.3% |
| German | 90 | 6.9% |
| Irish | 141 | 10.8% |
| Iroquois | 18 | 1.4% |
| Italian | 71 | 5.4% |
| Jamaican | 7 | 0.5% |
| Mexican | 42 | 3.2% |
| Native Hawaiian | 2 | 0.2% |
| Norwegian | 6 | 0.5% |
| Pennsylvania German | 4 | 0.3% |
| Polish | 34 | 2.6% |
| Scotch-Irish | 10 | 0.8% |
| Scottish | 17 | 1.3% |
| Swedish | 13 | 1.0% | View All 20 Rows |
Immigrants in Ardmore
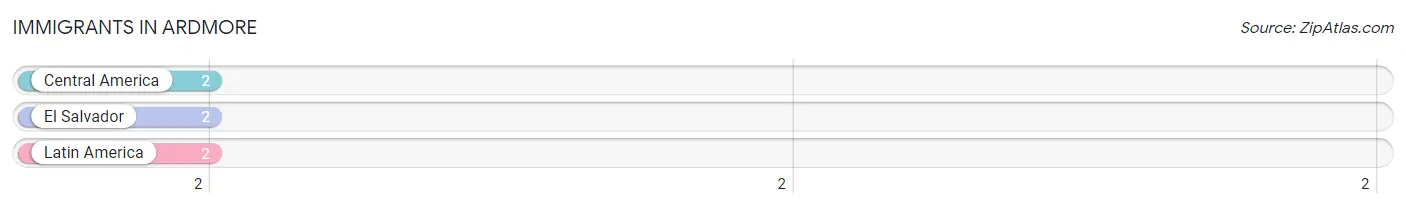
The most numerous immigrant groups reported in Ardmore came from Central America (2 | 0.2%), El Salvador (2 | 0.2%), and Latin America (2 | 0.2%), together accounting for 0.5% of all Ardmore residents.
| Immigration Origin | # Population | % Population |
| Central America | 2 | 0.2% |
| El Salvador | 2 | 0.2% |
| Latin America | 2 | 0.2% | View All 3 Rows |
Sex and Age in Ardmore
Sex and Age in Ardmore
The most populous age groups in Ardmore are 25 to 29 Years (97 | 15.0%) for men and 70 to 74 Years (87 | 13.2%) for women.
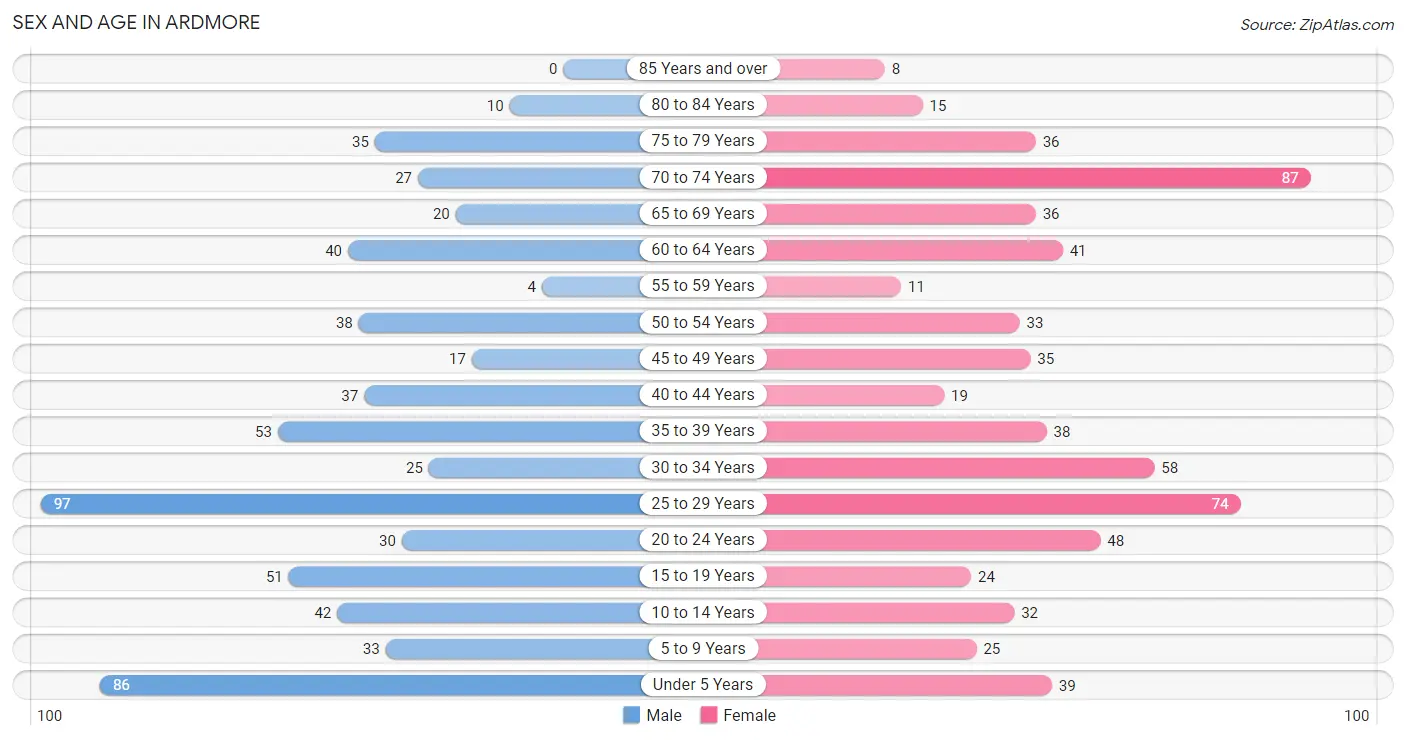
| Age Bracket | Male | Female |
| Under 5 Years | 86 (13.3%) | 39 (5.9%) |
| 5 to 9 Years | 33 (5.1%) | 25 (3.8%) |
| 10 to 14 Years | 42 (6.5%) | 32 (4.9%) |
| 15 to 19 Years | 51 (7.9%) | 24 (3.6%) |
| 20 to 24 Years | 30 (4.6%) | 48 (7.3%) |
| 25 to 29 Years | 97 (15.0%) | 74 (11.2%) |
| 30 to 34 Years | 25 (3.9%) | 58 (8.8%) |
| 35 to 39 Years | 53 (8.2%) | 38 (5.8%) |
| 40 to 44 Years | 37 (5.7%) | 19 (2.9%) |
| 45 to 49 Years | 17 (2.6%) | 35 (5.3%) |
| 50 to 54 Years | 38 (5.9%) | 33 (5.0%) |
| 55 to 59 Years | 4 (0.6%) | 11 (1.7%) |
| 60 to 64 Years | 40 (6.2%) | 41 (6.2%) |
| 65 to 69 Years | 20 (3.1%) | 36 (5.5%) |
| 70 to 74 Years | 27 (4.2%) | 87 (13.2%) |
| 75 to 79 Years | 35 (5.4%) | 36 (5.5%) |
| 80 to 84 Years | 10 (1.5%) | 15 (2.3%) |
| 85 Years and over | 0 (0.0%) | 8 (1.2%) |
| Total | 645 (100.0%) | 659 (100.0%) |
Families and Households in Ardmore
Median Family Size in Ardmore
The median family size in Ardmore is 3.30 persons per family, with married-couple families (230 | 76.2%) accounting for the largest median family size of 3.43 persons per family. On the other hand, single male/father families (36 | 11.9%) represent the smallest median family size with 2.81 persons per family.
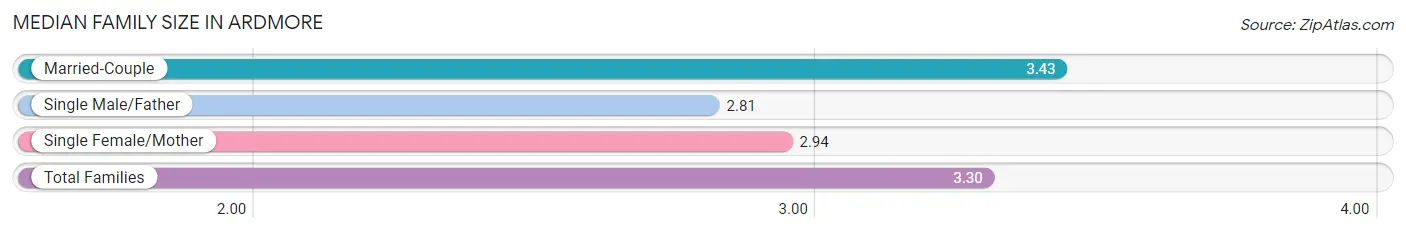
| Family Type | # Families | Family Size |
| Married-Couple | 230 (76.2%) | 3.43 |
| Single Male/Father | 36 (11.9%) | 2.81 |
| Single Female/Mother | 36 (11.9%) | 2.94 |
| Total Families | 302 (100.0%) | 3.30 |
Median Household Size in Ardmore
The median household size in Ardmore is 2.36 persons per household, with single female/mother households (36 | 6.5%) accounting for the largest median household size of 3.83 persons per household. non-family households (250 | 45.3%) represent the smallest median household size with 1.10 persons per household.
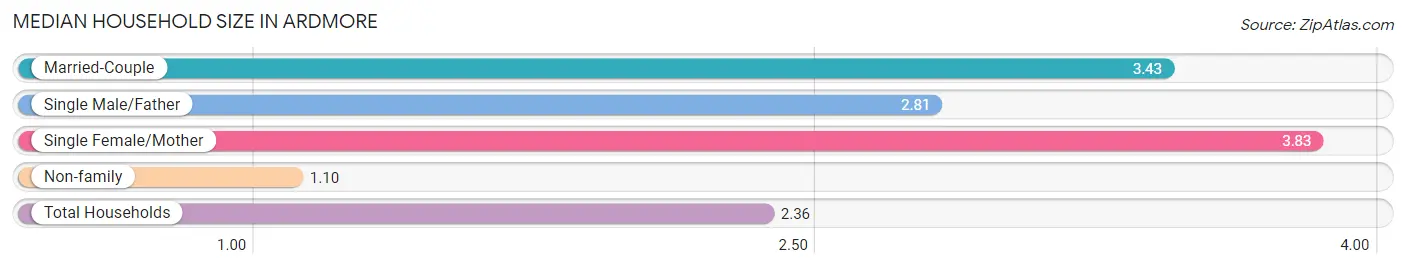
| Household Type | # Households | Household Size |
| Married-Couple | 230 (41.7%) | 3.43 |
| Single Male/Father | 36 (6.5%) | 2.81 |
| Single Female/Mother | 36 (6.5%) | 3.83 |
| Non-family | 250 (45.3%) | 1.10 |
| Total Households | 552 (100.0%) | 2.36 |
Household Size by Marriage Status in Ardmore
Out of a total of 552 households in Ardmore, 302 (54.7%) are family households, while 250 (45.3%) are nonfamily households. The most numerous type of family households are 4-person households, comprising 112, and the most common type of nonfamily households are 1-person households, comprising 222.
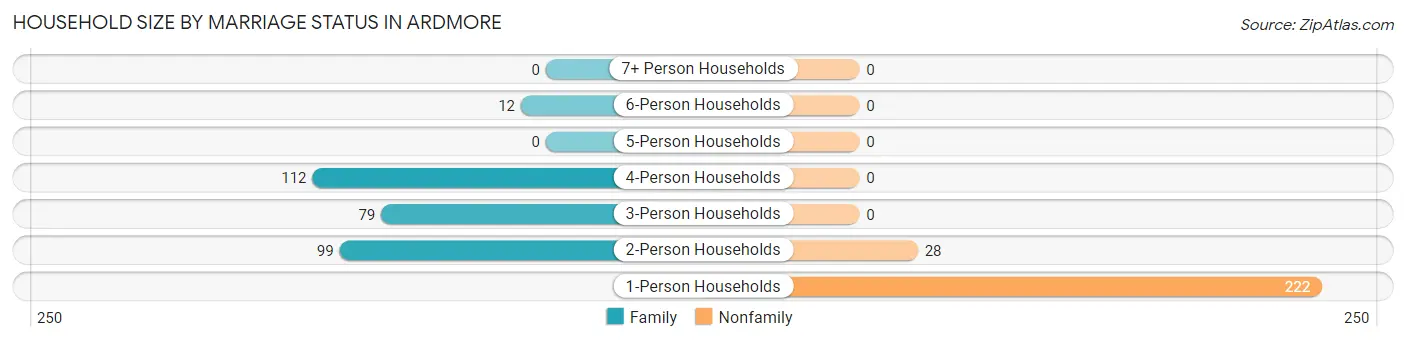
| Household Size | Family Households | Nonfamily Households |
| 1-Person Households | - | 222 (40.2%) |
| 2-Person Households | 99 (17.9%) | 28 (5.1%) |
| 3-Person Households | 79 (14.3%) | 0 (0.0%) |
| 4-Person Households | 112 (20.3%) | 0 (0.0%) |
| 5-Person Households | 0 (0.0%) | 0 (0.0%) |
| 6-Person Households | 12 (2.2%) | 0 (0.0%) |
| 7+ Person Households | 0 (0.0%) | 0 (0.0%) |
| Total | 302 (54.7%) | 250 (45.3%) |
Female Fertility in Ardmore
Fertility by Age in Ardmore
Average fertility rate in Ardmore is 120.0 births per 1,000 women. Women in the age bracket of 20 to 34 years have the highest fertility rate with 200.0 births per 1,000 women. Women in the age bracket of 20 to 34 years acount for 100.0% of all women with births.
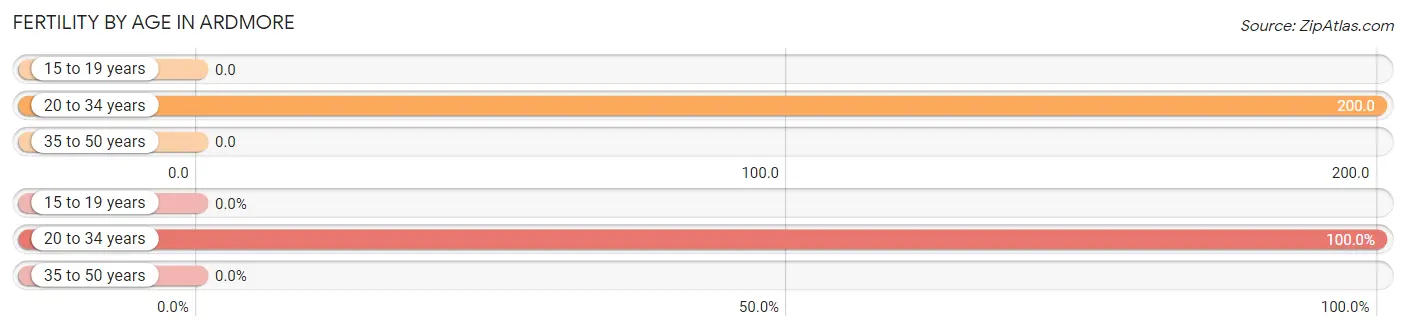
| Age Bracket | Women with Births | Births / 1,000 Women |
| 15 to 19 years | 0 (0.0%) | 0.0 |
| 20 to 34 years | 36 (100.0%) | 200.0 |
| 35 to 50 years | 0 (0.0%) | 0.0 |
| Total | 36 (100.0%) | 120.0 |
Fertility by Age by Marriage Status in Ardmore
91.7% of women with births (36) in Ardmore are married. The highest percentage of unmarried women with births falls into 20 to 34 years age bracket with 8.3% of them unmarried at the time of birth, while the lowest percentage of unmarried women with births belong to 20 to 34 years age bracket with 8.3% of them unmarried.
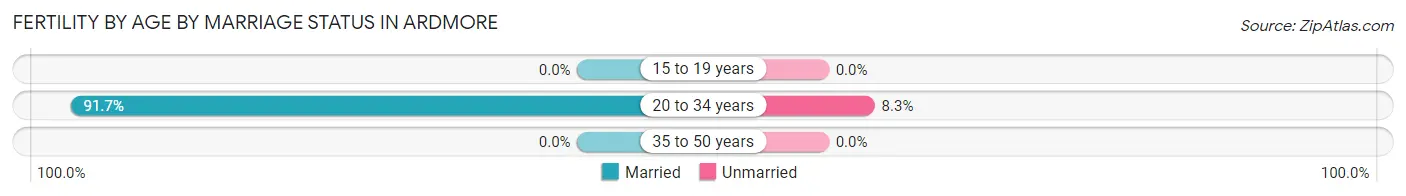
| Age Bracket | Married | Unmarried |
| 15 to 19 years | 0 (0.0%) | 0 (0.0%) |
| 20 to 34 years | 33 (91.7%) | 3 (8.3%) |
| 35 to 50 years | 0 (0.0%) | 0 (0.0%) |
| Total | 33 (91.7%) | 3 (8.3%) |
Fertility by Education in Ardmore
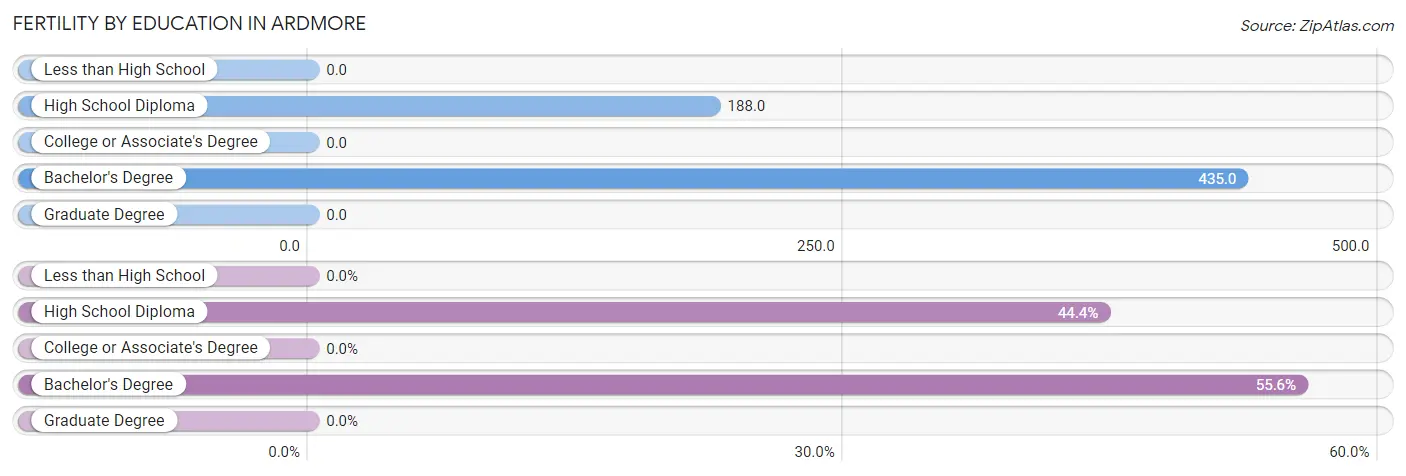
| Educational Attainment | Women with Births | Births / 1,000 Women |
| Less than High School | 0 (0.0%) | 0.0 |
| High School Diploma | 16 (44.4%) | 188.0 |
| College or Associate's Degree | 0 (0.0%) | 0.0 |
| Bachelor's Degree | 20 (55.6%) | 435.0 |
| Graduate Degree | 0 (0.0%) | 0.0 |
| Total | 36 (100.0%) | 120.0 |
Fertility by Education by Marriage Status in Ardmore
8.3% of women with births in Ardmore are unmarried. Women with the educational attainment of bachelor's degree are most likely to be married with 100.0% of them married at childbirth, while women with the educational attainment of high school diploma are least likely to be married with 18.8% of them unmarried at childbirth.
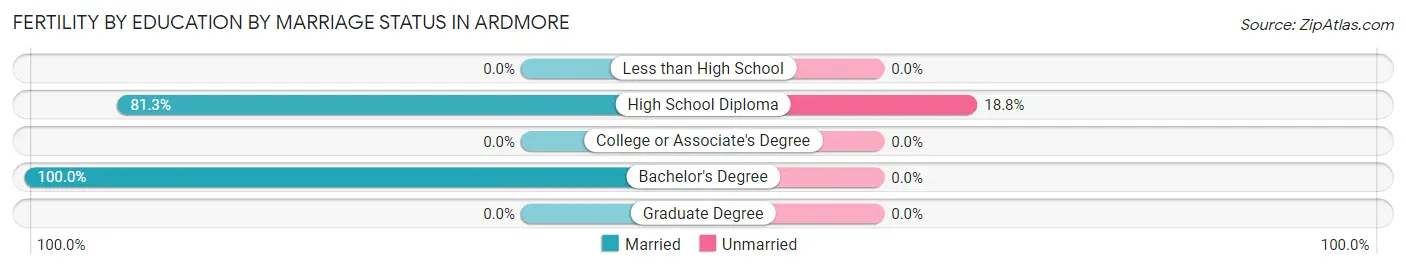
| Educational Attainment | Married | Unmarried |
| Less than High School | 0 (0.0%) | 0 (0.0%) |
| High School Diploma | 13 (81.2%) | 3 (18.8%) |
| College or Associate's Degree | 0 (0.0%) | 0 (0.0%) |
| Bachelor's Degree | 20 (100.0%) | 0 (0.0%) |
| Graduate Degree | 0 (0.0%) | 0 (0.0%) |
| Total | 33 (91.7%) | 3 (8.3%) |
Employment Characteristics in Ardmore
Employment by Class of Employer in Ardmore
Among the 568 employed individuals in Ardmore, private company employees (431 | 75.9%), local government employees (54 | 9.5%), and self-employed (not incorporated) (40 | 7.0%) make up the most common classes of employment.
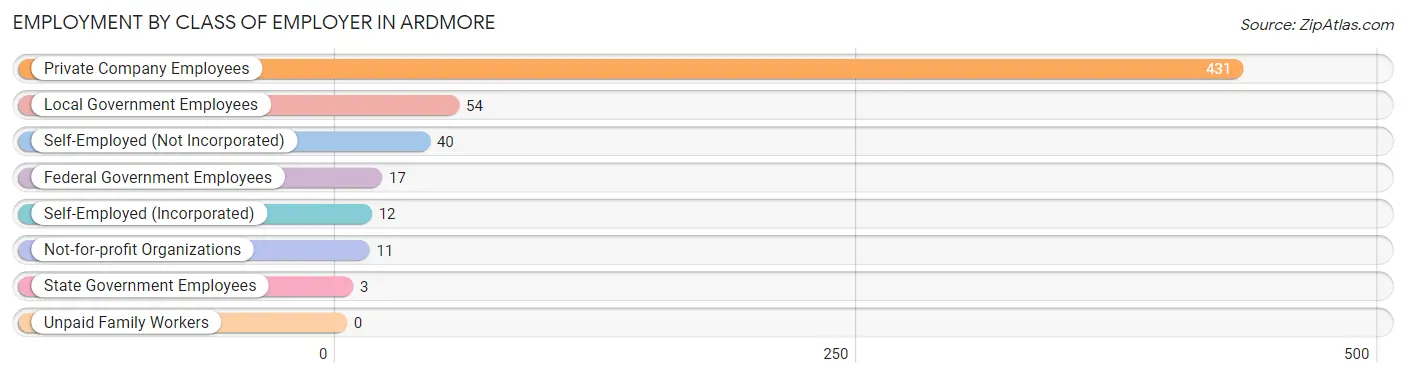
| Employer Class | # Employees | % Employees |
| Private Company Employees | 431 | 75.9% |
| Self-Employed (Incorporated) | 12 | 2.1% |
| Self-Employed (Not Incorporated) | 40 | 7.0% |
| Not-for-profit Organizations | 11 | 1.9% |
| Local Government Employees | 54 | 9.5% |
| State Government Employees | 3 | 0.5% |
| Federal Government Employees | 17 | 3.0% |
| Unpaid Family Workers | 0 | 0.0% |
| Total | 568 | 100.0% |
Employment Status by Age in Ardmore
According to the labor force statistics for Ardmore, out of the total population over 16 years of age (1,027), 56.9% or 584 individuals are in the labor force, with 1.7% or 10 of them unemployed. The age group with the highest labor force participation rate is 55 to 59 years, with 100.0% or 15 individuals in the labor force. Within the labor force, the 20 to 24 years age range has the highest percentage of unemployed individuals, with 25.6% or 10 of them being unemployed.
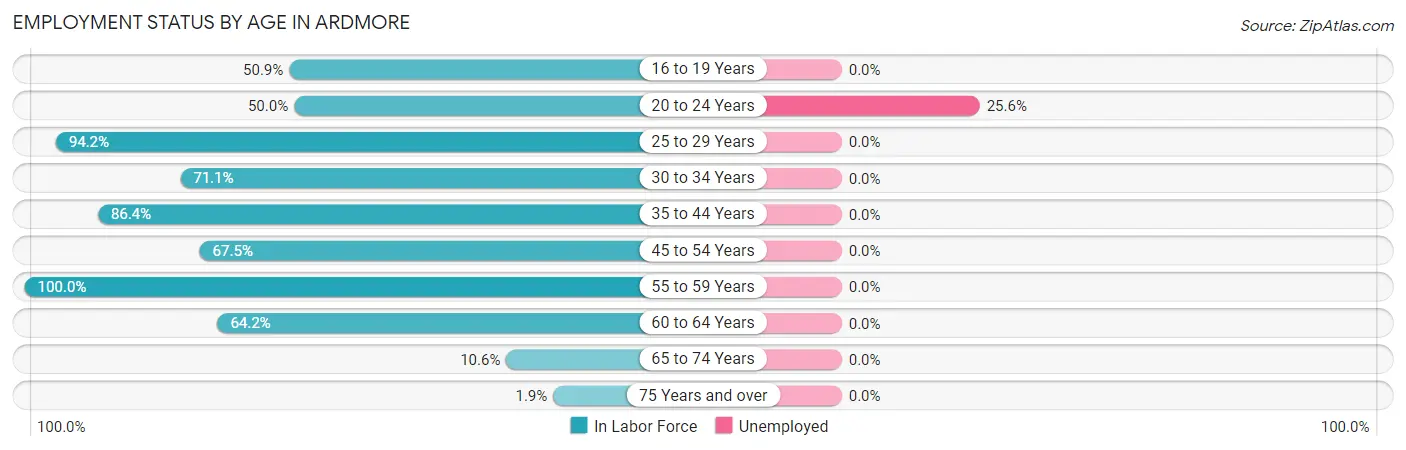
| Age Bracket | In Labor Force | Unemployed |
| 16 to 19 Years | 28 (50.9%) | 0 (0.0%) |
| 20 to 24 Years | 39 (50.0%) | 10 (25.6%) |
| 25 to 29 Years | 161 (94.2%) | 0 (0.0%) |
| 30 to 34 Years | 59 (71.1%) | 0 (0.0%) |
| 35 to 44 Years | 127 (86.4%) | 0 (0.0%) |
| 45 to 54 Years | 83 (67.5%) | 0 (0.0%) |
| 55 to 59 Years | 15 (100.0%) | 0 (0.0%) |
| 60 to 64 Years | 52 (64.2%) | 0 (0.0%) |
| 65 to 74 Years | 18 (10.6%) | 0 (0.0%) |
| 75 Years and over | 2 (1.9%) | 0 (0.0%) |
| Total | 584 (56.9%) | 10 (1.7%) |
Employment Status by Educational Attainment in Ardmore
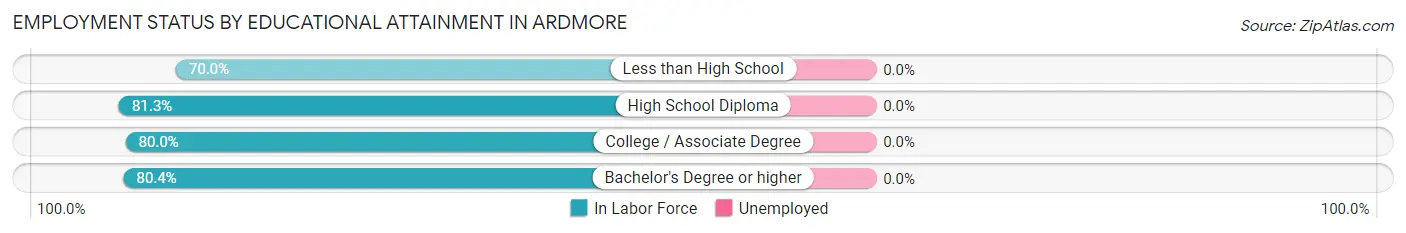
| Educational Attainment | In Labor Force | Unemployed |
| Less than High School | 21 (70.0%) | 0 (0.0%) |
| High School Diploma | 218 (81.3%) | 0 (0.0%) |
| College / Associate Degree | 176 (80.0%) | 0 (0.0%) |
| Bachelor's Degree or higher | 82 (80.4%) | 0 (0.0%) |
| Total | 497 (80.2%) | 0 (0.0%) |
Employment Occupations by Sex in Ardmore
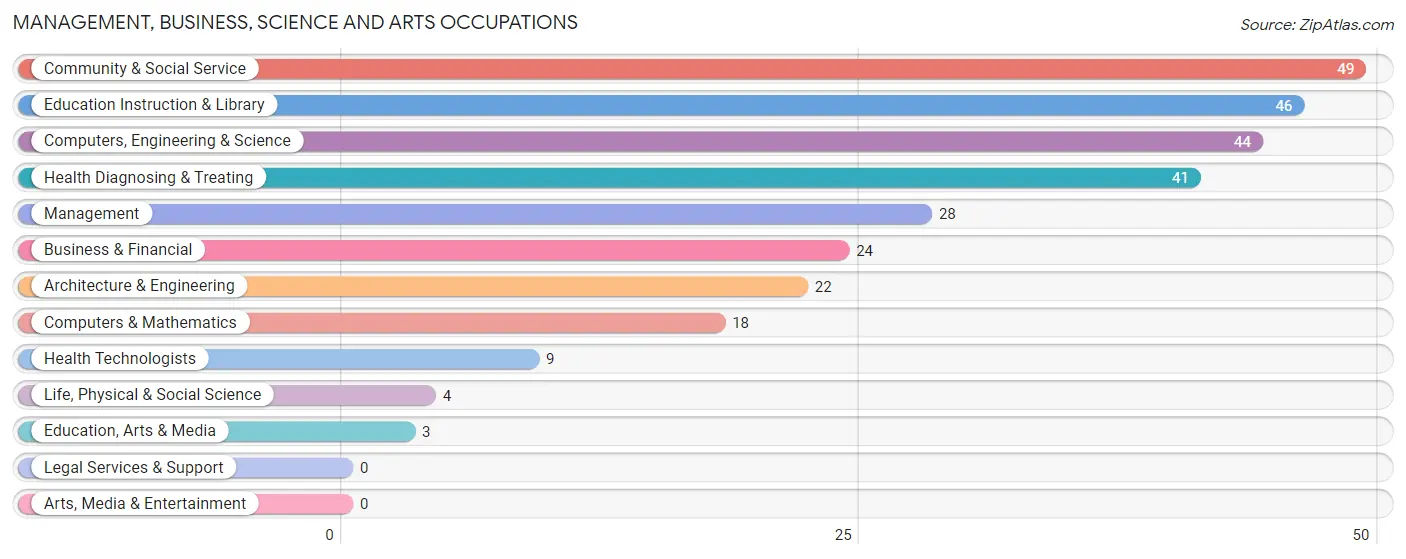
Management, Business, Science and Arts Occupations
The most common Management, Business, Science and Arts occupations in Ardmore are Community & Social Service (49 | 8.5%), Education Instruction & Library (46 | 8.0%), Computers, Engineering & Science (44 | 7.7%), Health Diagnosing & Treating (41 | 7.1%), and Management (28 | 4.9%).
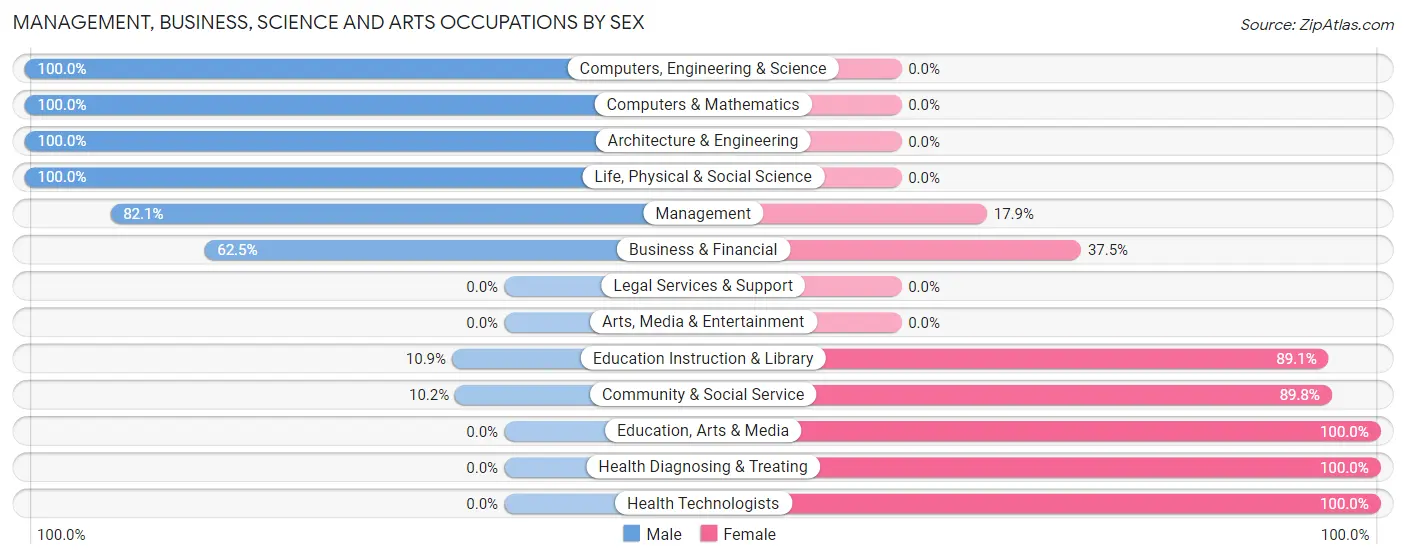
Management, Business, Science and Arts Occupations by Sex
Within the Management, Business, Science and Arts occupations in Ardmore, the most male-oriented occupations are Computers, Engineering & Science (100.0%), Computers & Mathematics (100.0%), and Architecture & Engineering (100.0%), while the most female-oriented occupations are Education, Arts & Media (100.0%), Health Diagnosing & Treating (100.0%), and Health Technologists (100.0%).
| Occupation | Male | Female |
| Management | 23 (82.1%) | 5 (17.9%) |
| Business & Financial | 15 (62.5%) | 9 (37.5%) |
| Computers, Engineering & Science | 44 (100.0%) | 0 (0.0%) |
| Computers & Mathematics | 18 (100.0%) | 0 (0.0%) |
| Architecture & Engineering | 22 (100.0%) | 0 (0.0%) |
| Life, Physical & Social Science | 4 (100.0%) | 0 (0.0%) |
| Community & Social Service | 5 (10.2%) | 44 (89.8%) |
| Education, Arts & Media | 0 (0.0%) | 3 (100.0%) |
| Legal Services & Support | 0 (0.0%) | 0 (0.0%) |
| Education Instruction & Library | 5 (10.9%) | 41 (89.1%) |
| Arts, Media & Entertainment | 0 (0.0%) | 0 (0.0%) |
| Health Diagnosing & Treating | 0 (0.0%) | 41 (100.0%) |
| Health Technologists | 0 (0.0%) | 9 (100.0%) |
| Total (Category) | 87 (46.8%) | 99 (53.2%) |
| Total (Overall) | 333 (58.0%) | 241 (42.0%) |
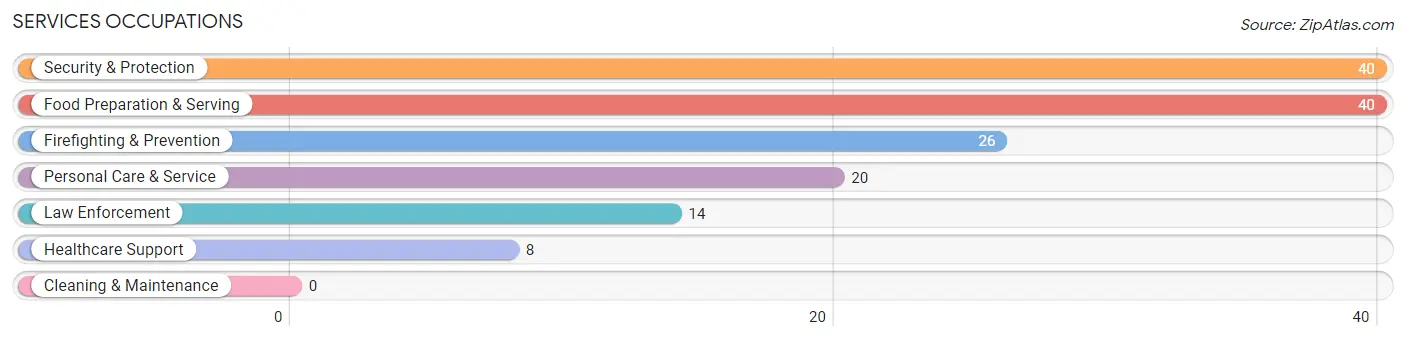
Services Occupations
The most common Services occupations in Ardmore are Security & Protection (40 | 7.0%), Food Preparation & Serving (40 | 7.0%), Firefighting & Prevention (26 | 4.5%), Personal Care & Service (20 | 3.5%), and Law Enforcement (14 | 2.4%).
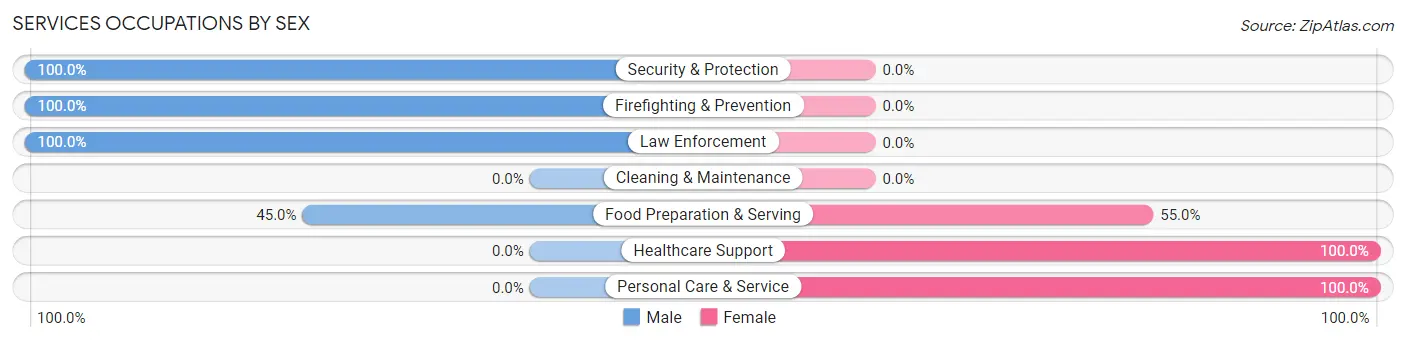
Services Occupations by Sex
Within the Services occupations in Ardmore, the most male-oriented occupations are Security & Protection (100.0%), Firefighting & Prevention (100.0%), and Law Enforcement (100.0%), while the most female-oriented occupations are Healthcare Support (100.0%), Personal Care & Service (100.0%), and Food Preparation & Serving (55.0%).
| Occupation | Male | Female |
| Healthcare Support | 0 (0.0%) | 8 (100.0%) |
| Security & Protection | 40 (100.0%) | 0 (0.0%) |
| Firefighting & Prevention | 26 (100.0%) | 0 (0.0%) |
| Law Enforcement | 14 (100.0%) | 0 (0.0%) |
| Food Preparation & Serving | 18 (45.0%) | 22 (55.0%) |
| Cleaning & Maintenance | 0 (0.0%) | 0 (0.0%) |
| Personal Care & Service | 0 (0.0%) | 20 (100.0%) |
| Total (Category) | 58 (53.7%) | 50 (46.3%) |
| Total (Overall) | 333 (58.0%) | 241 (42.0%) |
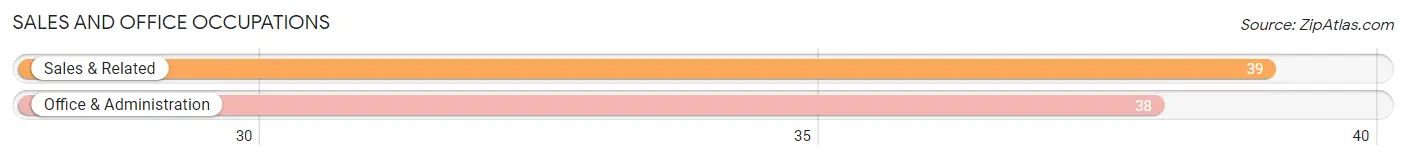
Sales and Office Occupations
The most common Sales and Office occupations in Ardmore are Sales & Related (39 | 6.8%), and Office & Administration (38 | 6.6%).
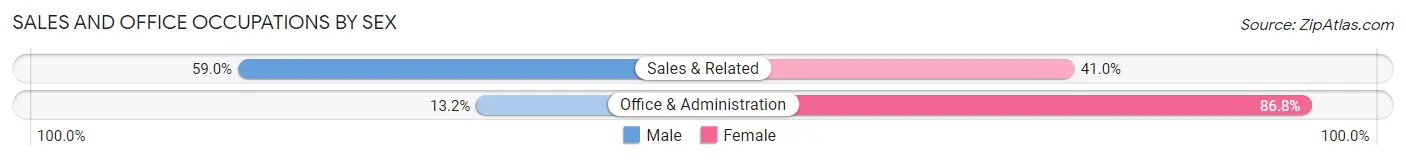
Sales and Office Occupations by Sex
| Occupation | Male | Female |
| Sales & Related | 23 (59.0%) | 16 (41.0%) |
| Office & Administration | 5 (13.2%) | 33 (86.8%) |
| Total (Category) | 28 (36.4%) | 49 (63.6%) |
| Total (Overall) | 333 (58.0%) | 241 (42.0%) |
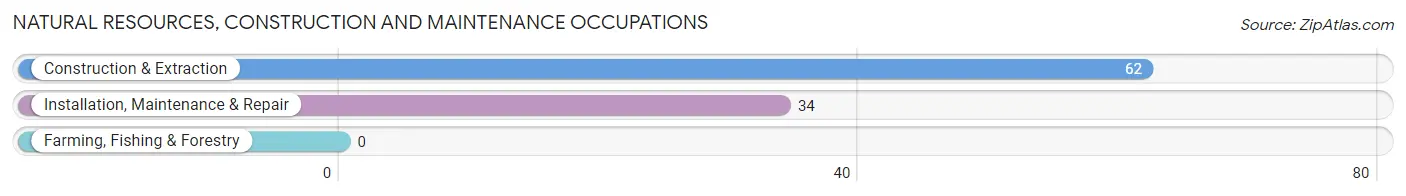
Natural Resources, Construction and Maintenance Occupations
The most common Natural Resources, Construction and Maintenance occupations in Ardmore are Construction & Extraction (62 | 10.8%), and Installation, Maintenance & Repair (34 | 5.9%).
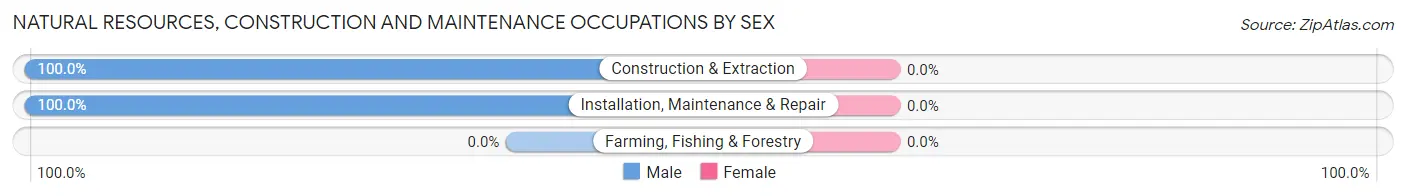
Natural Resources, Construction and Maintenance Occupations by Sex
| Occupation | Male | Female |
| Farming, Fishing & Forestry | 0 (0.0%) | 0 (0.0%) |
| Construction & Extraction | 62 (100.0%) | 0 (0.0%) |
| Installation, Maintenance & Repair | 34 (100.0%) | 0 (0.0%) |
| Total (Category) | 96 (100.0%) | 0 (0.0%) |
| Total (Overall) | 333 (58.0%) | 241 (42.0%) |
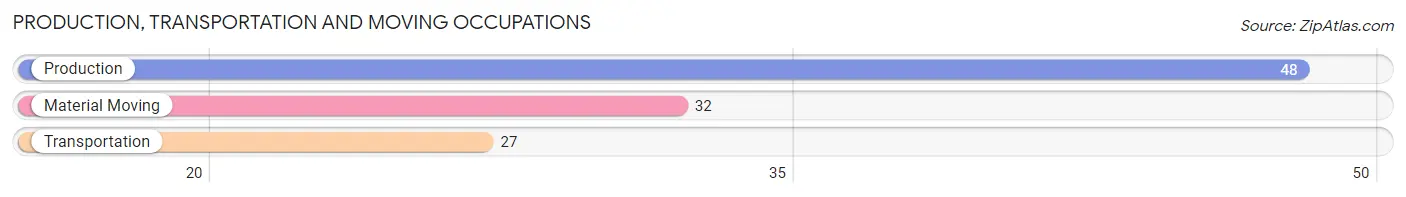
Production, Transportation and Moving Occupations
The most common Production, Transportation and Moving occupations in Ardmore are Production (48 | 8.4%), Material Moving (32 | 5.6%), and Transportation (27 | 4.7%).
Production, Transportation and Moving Occupations by Sex
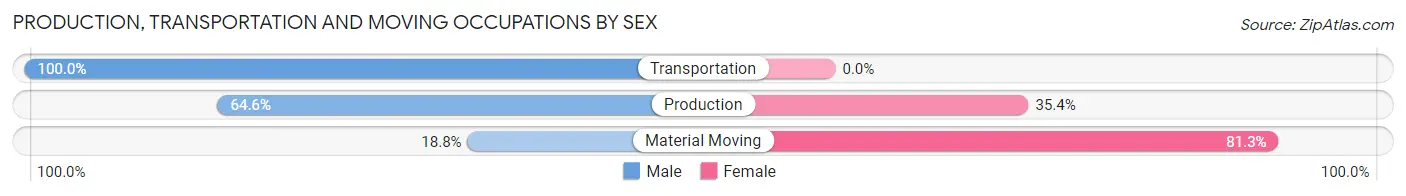
| Occupation | Male | Female |
| Production | 31 (64.6%) | 17 (35.4%) |
| Transportation | 27 (100.0%) | 0 (0.0%) |
| Material Moving | 6 (18.8%) | 26 (81.2%) |
| Total (Category) | 64 (59.8%) | 43 (40.2%) |
| Total (Overall) | 333 (58.0%) | 241 (42.0%) |
Employment Industries by Sex in Ardmore
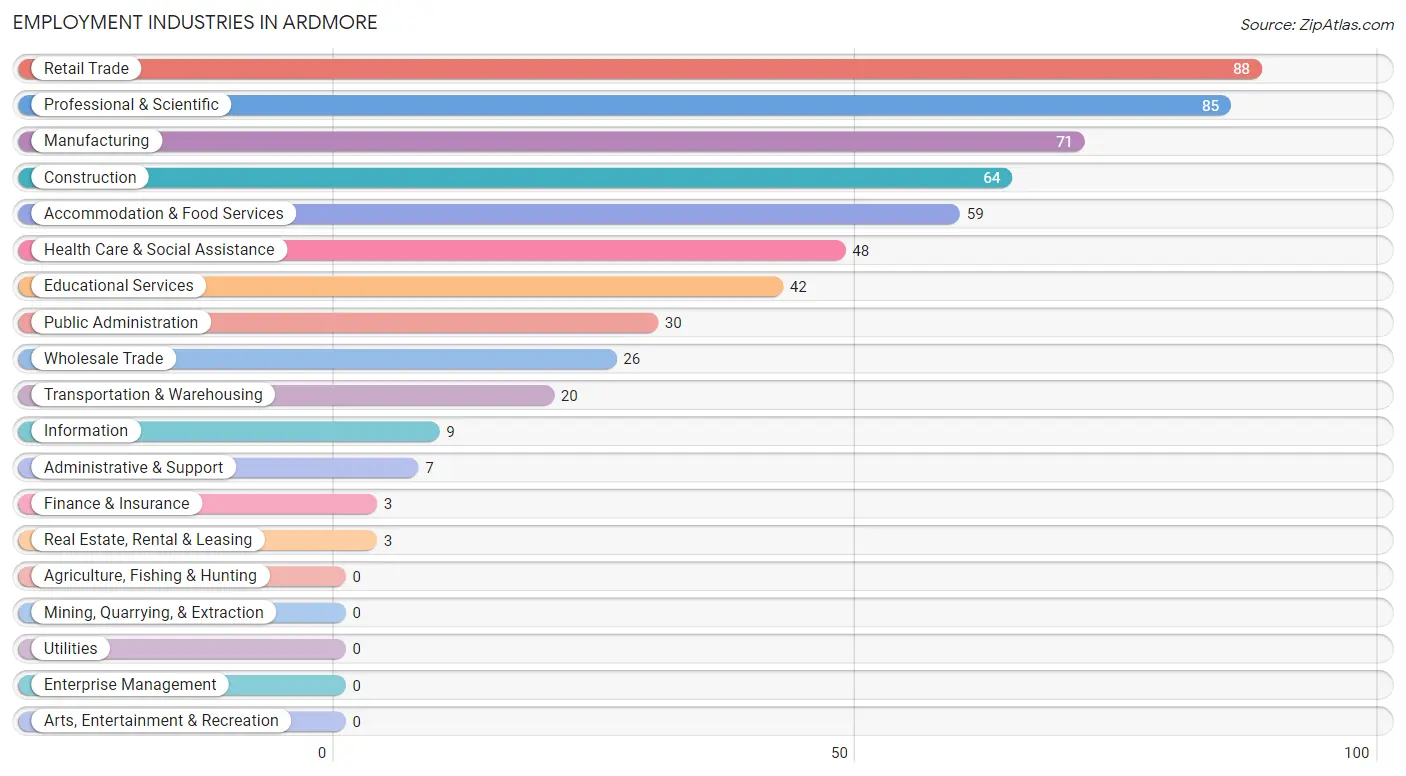
Employment Industries in Ardmore
The major employment industries in Ardmore include Retail Trade (88 | 15.3%), Professional & Scientific (85 | 14.8%), Manufacturing (71 | 12.4%), Construction (64 | 11.2%), and Accommodation & Food Services (59 | 10.3%).
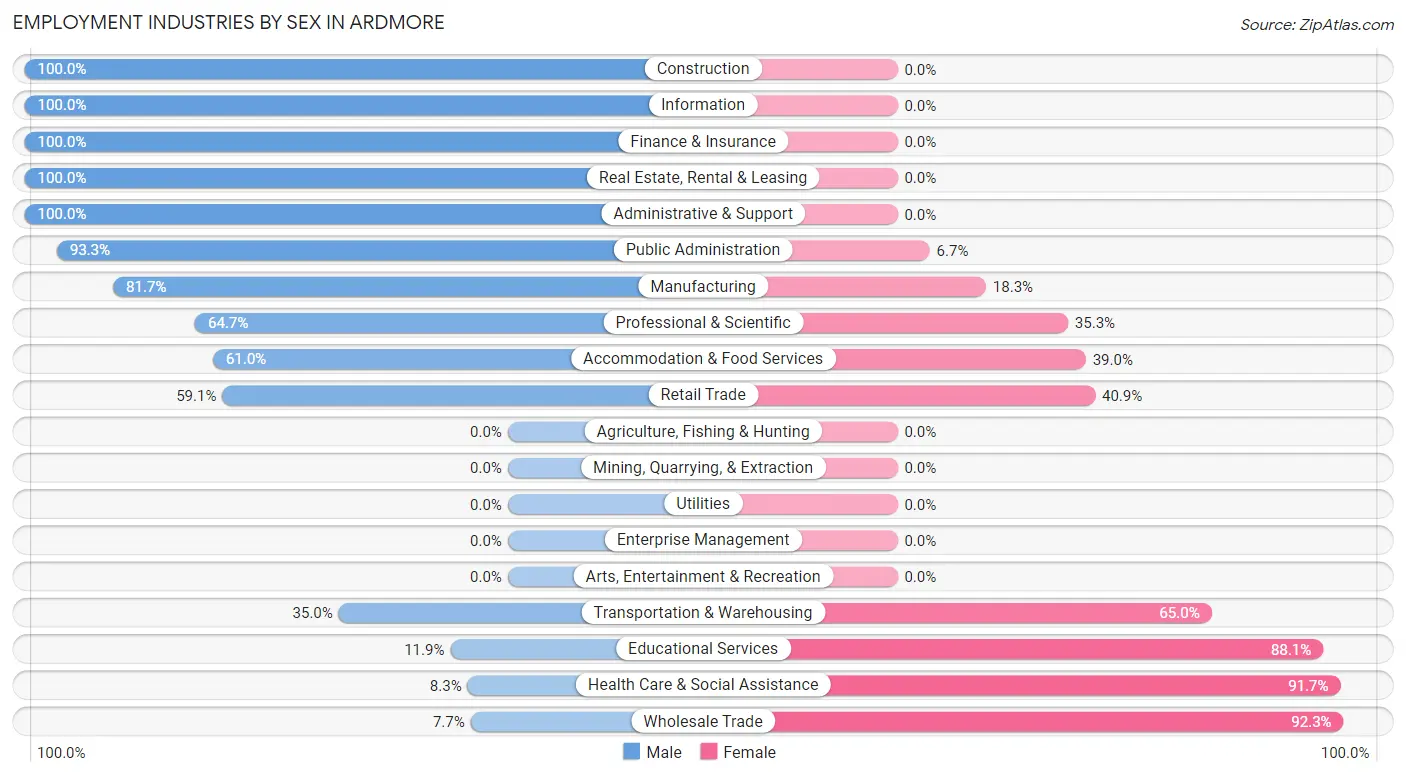
Employment Industries by Sex in Ardmore
The Ardmore industries that see more men than women are Construction (100.0%), Information (100.0%), and Finance & Insurance (100.0%), whereas the industries that tend to have a higher number of women are Wholesale Trade (92.3%), Health Care & Social Assistance (91.7%), and Educational Services (88.1%).
| Industry | Male | Female |
| Agriculture, Fishing & Hunting | 0 (0.0%) | 0 (0.0%) |
| Mining, Quarrying, & Extraction | 0 (0.0%) | 0 (0.0%) |
| Construction | 64 (100.0%) | 0 (0.0%) |
| Manufacturing | 58 (81.7%) | 13 (18.3%) |
| Wholesale Trade | 2 (7.7%) | 24 (92.3%) |
| Retail Trade | 52 (59.1%) | 36 (40.9%) |
| Transportation & Warehousing | 7 (35.0%) | 13 (65.0%) |
| Utilities | 0 (0.0%) | 0 (0.0%) |
| Information | 9 (100.0%) | 0 (0.0%) |
| Finance & Insurance | 3 (100.0%) | 0 (0.0%) |
| Real Estate, Rental & Leasing | 3 (100.0%) | 0 (0.0%) |
| Professional & Scientific | 55 (64.7%) | 30 (35.3%) |
| Enterprise Management | 0 (0.0%) | 0 (0.0%) |
| Administrative & Support | 7 (100.0%) | 0 (0.0%) |
| Educational Services | 5 (11.9%) | 37 (88.1%) |
| Health Care & Social Assistance | 4 (8.3%) | 44 (91.7%) |
| Arts, Entertainment & Recreation | 0 (0.0%) | 0 (0.0%) |
| Accommodation & Food Services | 36 (61.0%) | 23 (39.0%) |
| Public Administration | 28 (93.3%) | 2 (6.7%) |
| Total | 333 (58.0%) | 241 (42.0%) |
Education in Ardmore
School Enrollment in Ardmore
The most common levels of schooling among the 260 students in Ardmore are high school (74 | 28.5%), middle school (68 | 26.2%), and elementary school (51 | 19.6%).
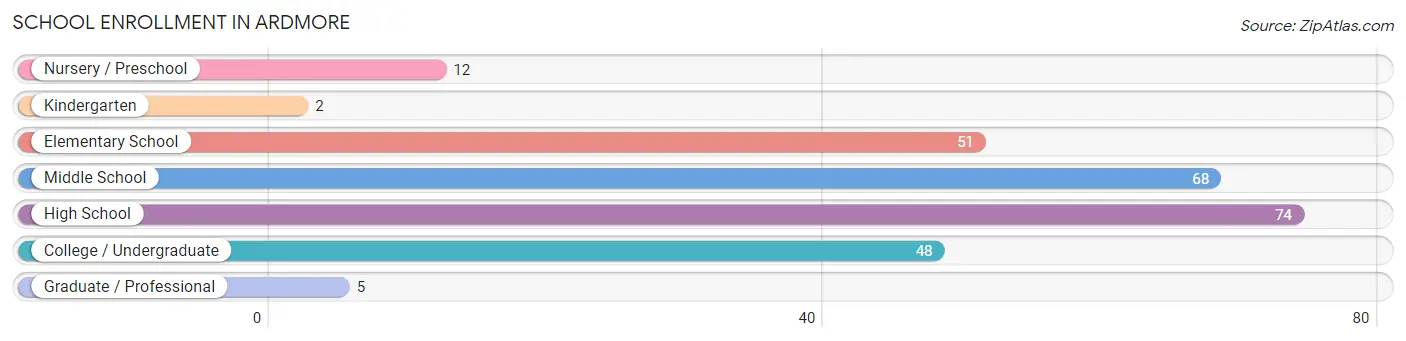
| School Level | # Students | % Students |
| Nursery / Preschool | 12 | 4.6% |
| Kindergarten | 2 | 0.8% |
| Elementary School | 51 | 19.6% |
| Middle School | 68 | 26.2% |
| High School | 74 | 28.5% |
| College / Undergraduate | 48 | 18.5% |
| Graduate / Professional | 5 | 1.9% |
| Total | 260 | 100.0% |
School Enrollment by Age by Funding Source in Ardmore
Out of a total of 260 students who are enrolled in schools in Ardmore, 8 (3.1%) attend a private institution, while the remaining 252 (96.9%) are enrolled in public schools. The age group of 35 years and over has the highest likelihood of being enrolled in private schools, with 2 (28.6% in the age bracket) enrolled. Conversely, the age group of 3 to 4 year olds has the lowest likelihood of being enrolled in a private school, with 7 (100.0% in the age bracket) attending a public institution.
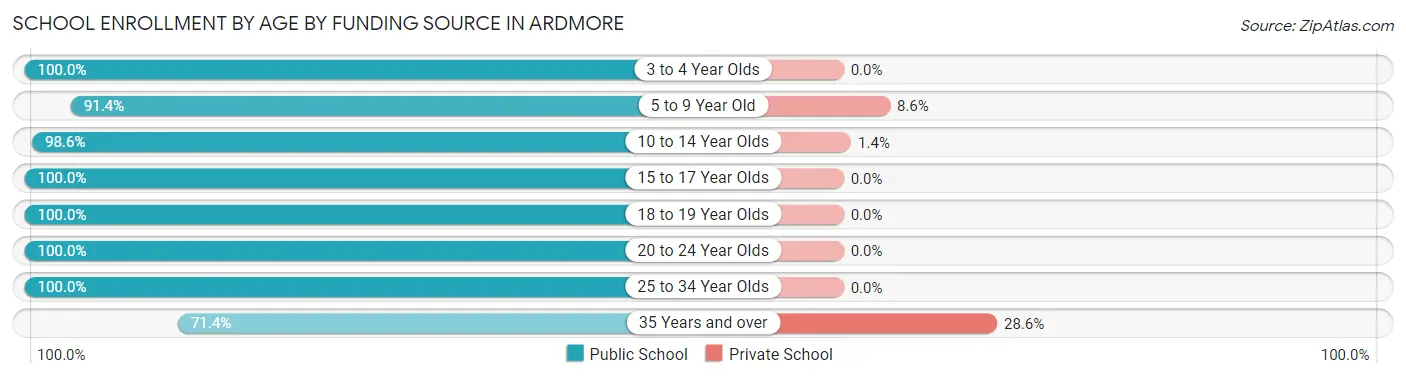
| Age Bracket | Public School | Private School |
| 3 to 4 Year Olds | 7 (100.0%) | 0 (0.0%) |
| 5 to 9 Year Old | 53 (91.4%) | 5 (8.6%) |
| 10 to 14 Year Olds | 71 (98.6%) | 1 (1.4%) |
| 15 to 17 Year Olds | 70 (100.0%) | 0 (0.0%) |
| 18 to 19 Year Olds | 3 (100.0%) | 0 (0.0%) |
| 20 to 24 Year Olds | 15 (100.0%) | 0 (0.0%) |
| 25 to 34 Year Olds | 28 (100.0%) | 0 (0.0%) |
| 35 Years and over | 5 (71.4%) | 2 (28.6%) |
| Total | 252 (96.9%) | 8 (3.1%) |
Educational Attainment by Field of Study in Ardmore
Business (47 | 37.0%), education (25 | 19.7%), computers & mathematics (17 | 13.4%), social sciences (14 | 11.0%), and engineering (14 | 11.0%) are the most common fields of study among 127 individuals in Ardmore who have obtained a bachelor's degree or higher.
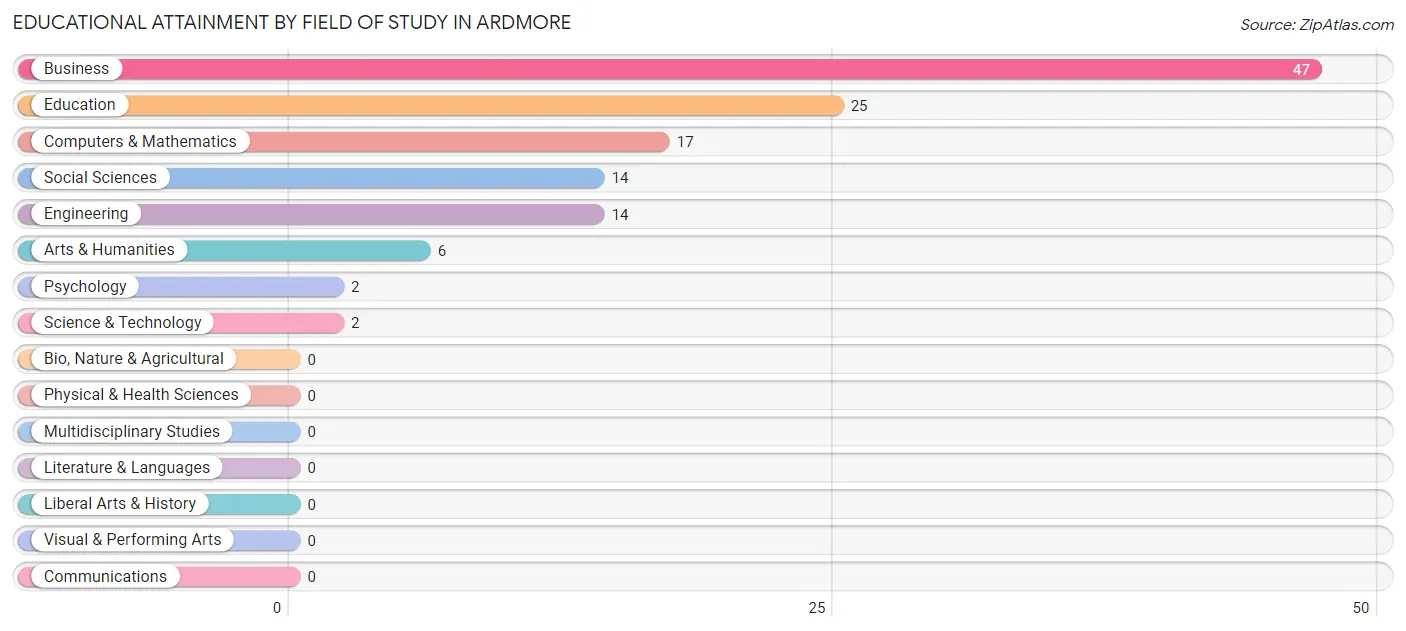
| Field of Study | # Graduates | % Graduates |
| Computers & Mathematics | 17 | 13.4% |
| Bio, Nature & Agricultural | 0 | 0.0% |
| Physical & Health Sciences | 0 | 0.0% |
| Psychology | 2 | 1.6% |
| Social Sciences | 14 | 11.0% |
| Engineering | 14 | 11.0% |
| Multidisciplinary Studies | 0 | 0.0% |
| Science & Technology | 2 | 1.6% |
| Business | 47 | 37.0% |
| Education | 25 | 19.7% |
| Literature & Languages | 0 | 0.0% |
| Liberal Arts & History | 0 | 0.0% |
| Visual & Performing Arts | 0 | 0.0% |
| Communications | 0 | 0.0% |
| Arts & Humanities | 6 | 4.7% |
| Total | 127 | 100.0% |
Transportation & Commute in Ardmore
Vehicle Availability by Sex in Ardmore
The most prevalent vehicle ownership categories in Ardmore are males with 2 vehicles (155, accounting for 47.0%) and females with 2 vehicles (53, making up 65.1%).
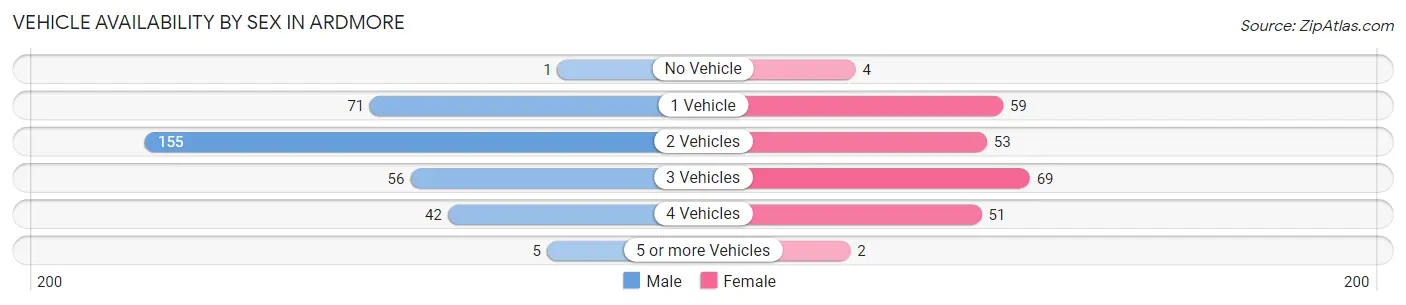
| Vehicles Available | Male | Female |
| No Vehicle | 1 (0.3%) | 4 (1.7%) |
| 1 Vehicle | 71 (21.5%) | 59 (24.8%) |
| 2 Vehicles | 155 (47.0%) | 53 (22.3%) |
| 3 Vehicles | 56 (17.0%) | 69 (29.0%) |
| 4 Vehicles | 42 (12.7%) | 51 (21.4%) |
| 5 or more Vehicles | 5 (1.5%) | 2 (0.8%) |
| Total | 330 (100.0%) | 238 (100.0%) |
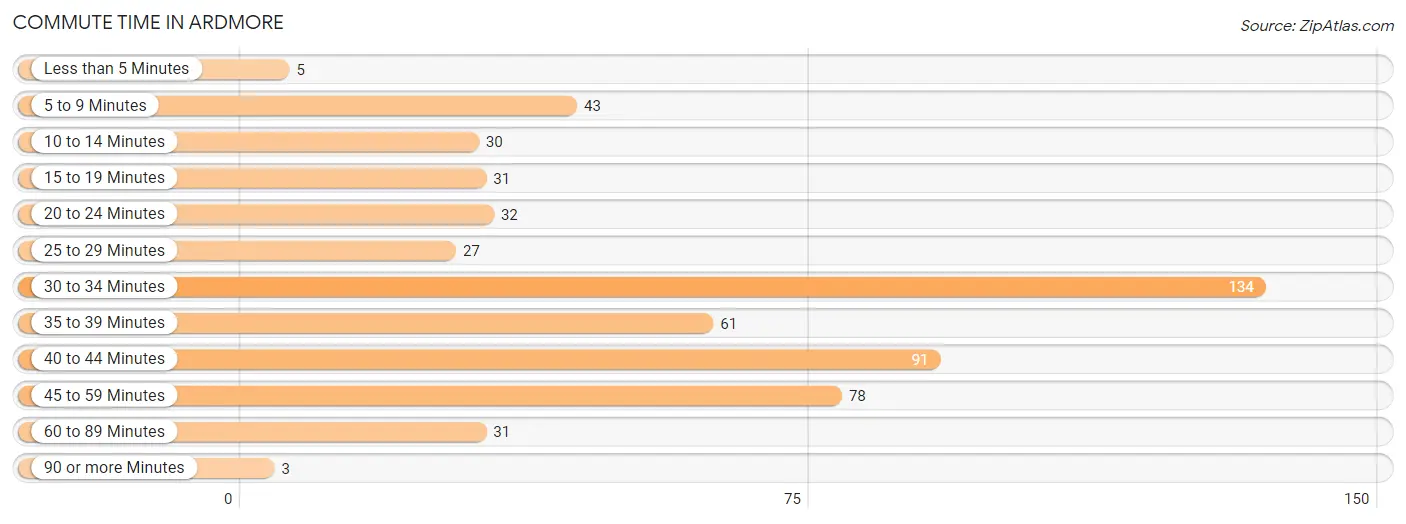
Commute Time in Ardmore
The most frequently occuring commute durations in Ardmore are 30 to 34 minutes (134 commuters, 23.7%), 40 to 44 minutes (91 commuters, 16.1%), and 45 to 59 minutes (78 commuters, 13.8%).
| Commute Time | # Commuters | % Commuters |
| Less than 5 Minutes | 5 | 0.9% |
| 5 to 9 Minutes | 43 | 7.6% |
| 10 to 14 Minutes | 30 | 5.3% |
| 15 to 19 Minutes | 31 | 5.5% |
| 20 to 24 Minutes | 32 | 5.7% |
| 25 to 29 Minutes | 27 | 4.8% |
| 30 to 34 Minutes | 134 | 23.7% |
| 35 to 39 Minutes | 61 | 10.8% |
| 40 to 44 Minutes | 91 | 16.1% |
| 45 to 59 Minutes | 78 | 13.8% |
| 60 to 89 Minutes | 31 | 5.5% |
| 90 or more Minutes | 3 | 0.5% |
Commute Time by Sex in Ardmore
The most common commute times in Ardmore are 40 to 44 minutes (64 commuters, 19.5%) for males and 30 to 34 minutes (75 commuters, 31.5%) for females.
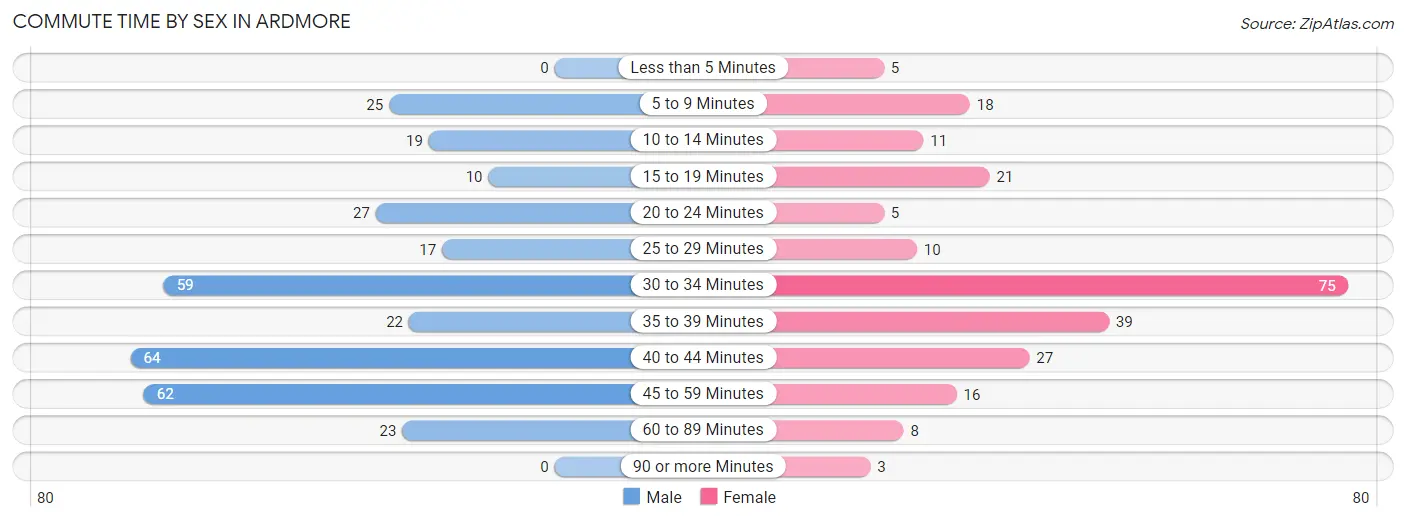
| Commute Time | Male | Female |
| Less than 5 Minutes | 0 (0.0%) | 5 (2.1%) |
| 5 to 9 Minutes | 25 (7.6%) | 18 (7.6%) |
| 10 to 14 Minutes | 19 (5.8%) | 11 (4.6%) |
| 15 to 19 Minutes | 10 (3.0%) | 21 (8.8%) |
| 20 to 24 Minutes | 27 (8.2%) | 5 (2.1%) |
| 25 to 29 Minutes | 17 (5.2%) | 10 (4.2%) |
| 30 to 34 Minutes | 59 (18.0%) | 75 (31.5%) |
| 35 to 39 Minutes | 22 (6.7%) | 39 (16.4%) |
| 40 to 44 Minutes | 64 (19.5%) | 27 (11.3%) |
| 45 to 59 Minutes | 62 (18.9%) | 16 (6.7%) |
| 60 to 89 Minutes | 23 (7.0%) | 8 (3.4%) |
| 90 or more Minutes | 0 (0.0%) | 3 (1.3%) |
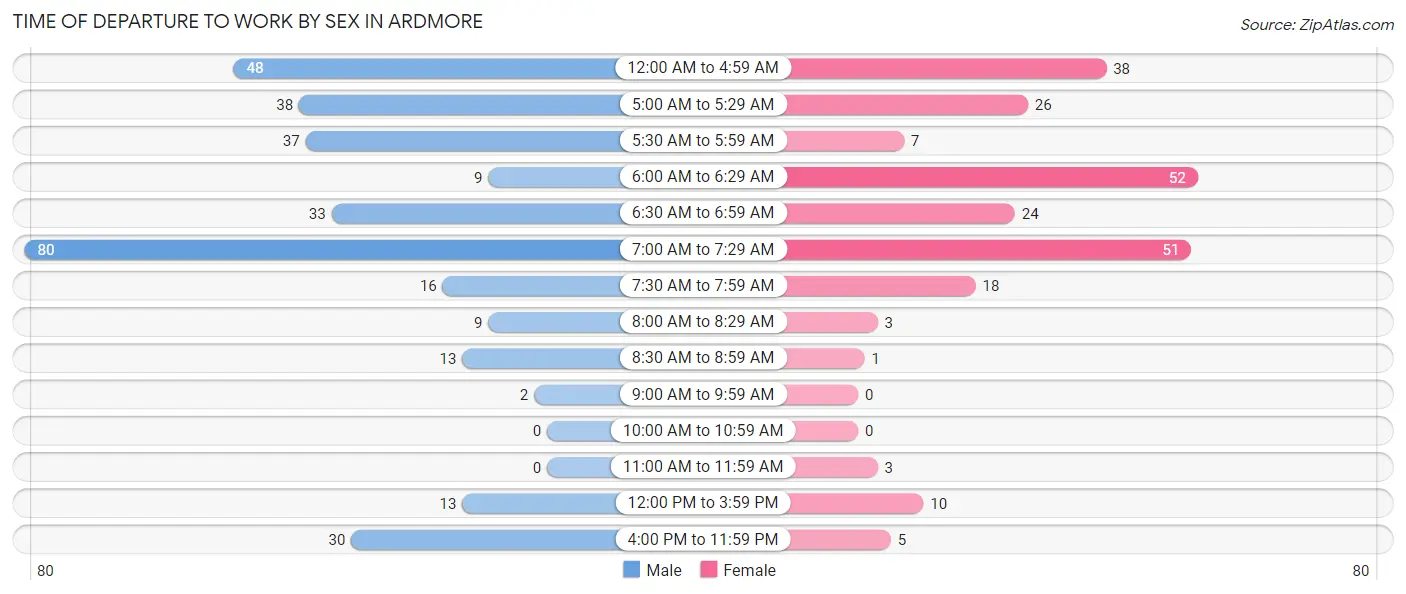
Time of Departure to Work by Sex in Ardmore
The most frequent times of departure to work in Ardmore are 7:00 AM to 7:29 AM (80, 24.4%) for males and 6:00 AM to 6:29 AM (52, 21.8%) for females.
| Time of Departure | Male | Female |
| 12:00 AM to 4:59 AM | 48 (14.6%) | 38 (16.0%) |
| 5:00 AM to 5:29 AM | 38 (11.6%) | 26 (10.9%) |
| 5:30 AM to 5:59 AM | 37 (11.3%) | 7 (2.9%) |
| 6:00 AM to 6:29 AM | 9 (2.7%) | 52 (21.8%) |
| 6:30 AM to 6:59 AM | 33 (10.1%) | 24 (10.1%) |
| 7:00 AM to 7:29 AM | 80 (24.4%) | 51 (21.4%) |
| 7:30 AM to 7:59 AM | 16 (4.9%) | 18 (7.6%) |
| 8:00 AM to 8:29 AM | 9 (2.7%) | 3 (1.3%) |
| 8:30 AM to 8:59 AM | 13 (4.0%) | 1 (0.4%) |
| 9:00 AM to 9:59 AM | 2 (0.6%) | 0 (0.0%) |
| 10:00 AM to 10:59 AM | 0 (0.0%) | 0 (0.0%) |
| 11:00 AM to 11:59 AM | 0 (0.0%) | 3 (1.3%) |
| 12:00 PM to 3:59 PM | 13 (4.0%) | 10 (4.2%) |
| 4:00 PM to 11:59 PM | 30 (9.1%) | 5 (2.1%) |
| Total | 328 (100.0%) | 238 (100.0%) |
Housing Occupancy in Ardmore
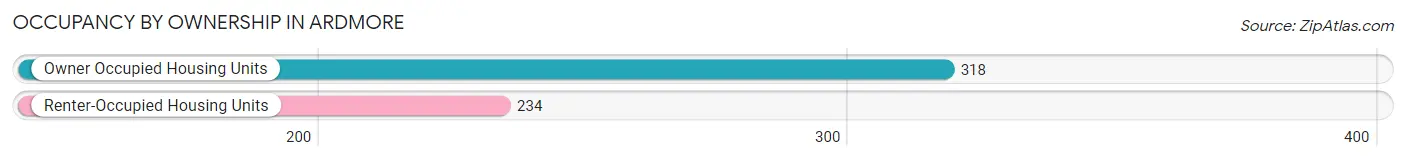
Occupancy by Ownership in Ardmore
Of the total 552 dwellings in Ardmore, owner-occupied units account for 318 (57.6%), while renter-occupied units make up 234 (42.4%).
| Occupancy | # Housing Units | % Housing Units |
| Owner Occupied Housing Units | 318 | 57.6% |
| Renter-Occupied Housing Units | 234 | 42.4% |
| Total Occupied Housing Units | 552 | 100.0% |
Occupancy by Household Size in Ardmore
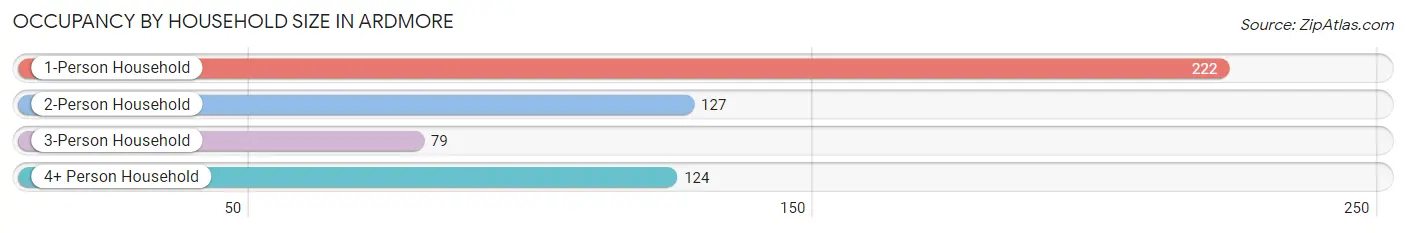
| Household Size | # Housing Units | % Housing Units |
| 1-Person Household | 222 | 40.2% |
| 2-Person Household | 127 | 23.0% |
| 3-Person Household | 79 | 14.3% |
| 4+ Person Household | 124 | 22.5% |
| Total Housing Units | 552 | 100.0% |
Occupancy by Ownership by Household Size in Ardmore
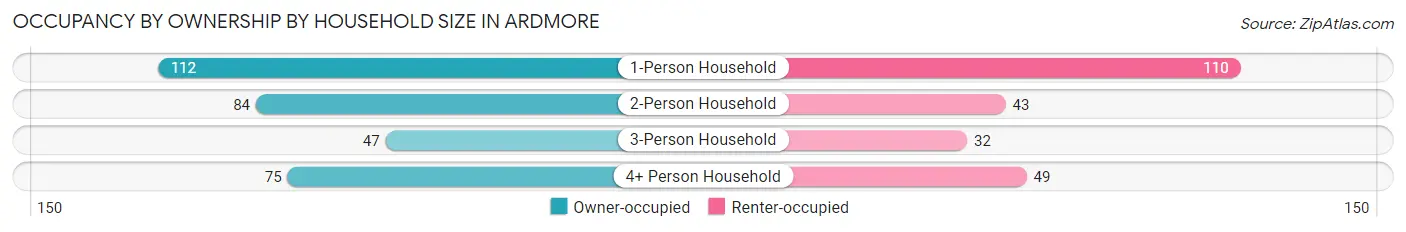
| Household Size | Owner-occupied | Renter-occupied |
| 1-Person Household | 112 (50.4%) | 110 (49.5%) |
| 2-Person Household | 84 (66.1%) | 43 (33.9%) |
| 3-Person Household | 47 (59.5%) | 32 (40.5%) |
| 4+ Person Household | 75 (60.5%) | 49 (39.5%) |
| Total Housing Units | 318 (57.6%) | 234 (42.4%) |
Occupancy by Educational Attainment in Ardmore
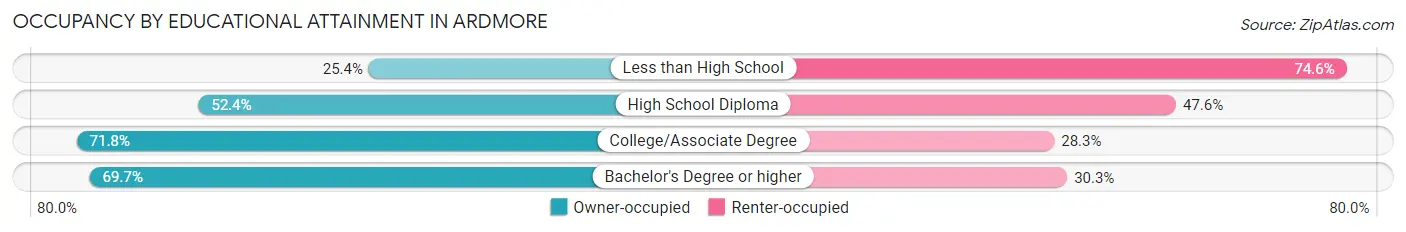
| Household Size | Owner-occupied | Renter-occupied |
| Less than High School | 16 (25.4%) | 47 (74.6%) |
| High School Diploma | 129 (52.4%) | 117 (47.6%) |
| College/Associate Degree | 127 (71.8%) | 50 (28.2%) |
| Bachelor's Degree or higher | 46 (69.7%) | 20 (30.3%) |
Occupancy by Age of Householder in Ardmore
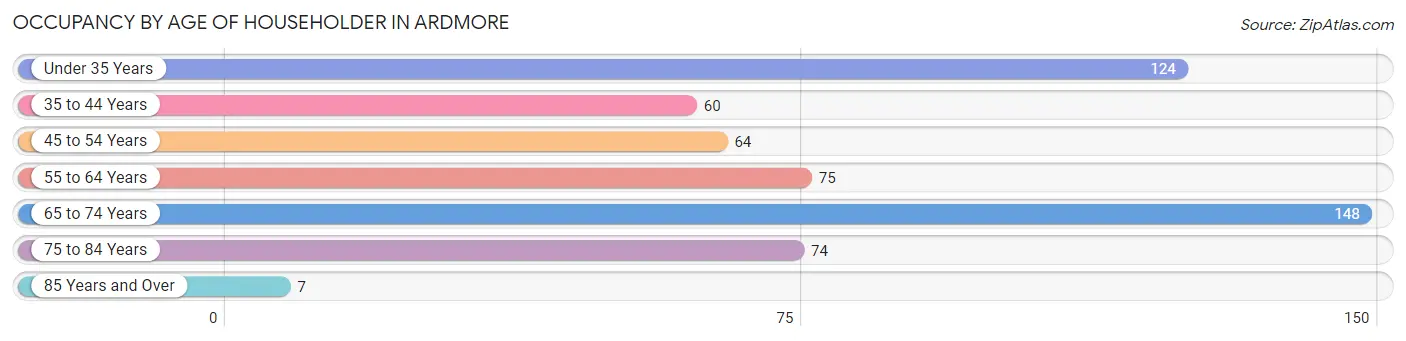
| Age Bracket | # Households | % Households |
| Under 35 Years | 124 | 22.5% |
| 35 to 44 Years | 60 | 10.9% |
| 45 to 54 Years | 64 | 11.6% |
| 55 to 64 Years | 75 | 13.6% |
| 65 to 74 Years | 148 | 26.8% |
| 75 to 84 Years | 74 | 13.4% |
| 85 Years and Over | 7 | 1.3% |
| Total | 552 | 100.0% |
Housing Finances in Ardmore
Median Income by Occupancy in Ardmore
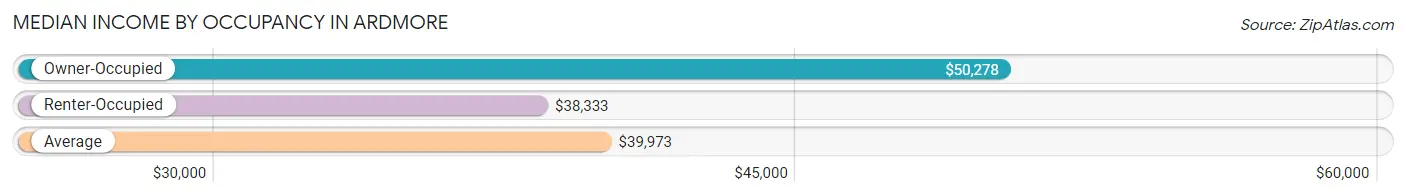
| Occupancy Type | # Households | Median Income |
| Owner-Occupied | 318 (57.6%) | $50,278 |
| Renter-Occupied | 234 (42.4%) | $38,333 |
| Average | 552 (100.0%) | $39,973 |
Occupancy by Householder Income Bracket in Ardmore
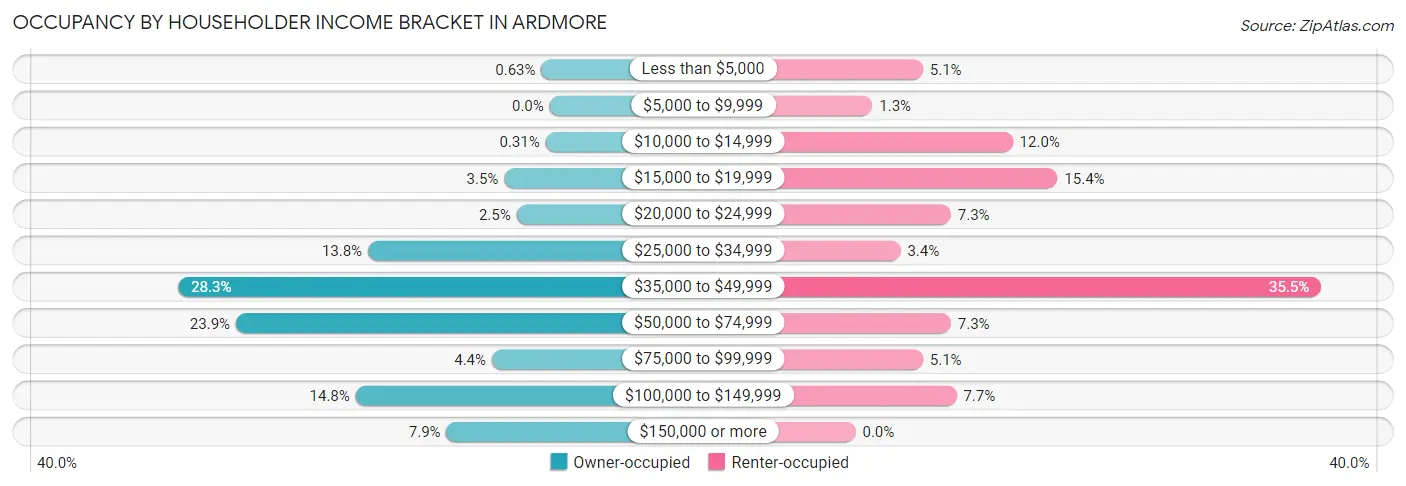
| Income Bracket | Owner-occupied | Renter-occupied |
| Less than $5,000 | 2 (0.6%) | 12 (5.1%) |
| $5,000 to $9,999 | 0 (0.0%) | 3 (1.3%) |
| $10,000 to $14,999 | 1 (0.3%) | 28 (12.0%) |
| $15,000 to $19,999 | 11 (3.5%) | 36 (15.4%) |
| $20,000 to $24,999 | 8 (2.5%) | 17 (7.3%) |
| $25,000 to $34,999 | 44 (13.8%) | 8 (3.4%) |
| $35,000 to $49,999 | 90 (28.3%) | 83 (35.5%) |
| $50,000 to $74,999 | 76 (23.9%) | 17 (7.3%) |
| $75,000 to $99,999 | 14 (4.4%) | 12 (5.1%) |
| $100,000 to $149,999 | 47 (14.8%) | 18 (7.7%) |
| $150,000 or more | 25 (7.9%) | 0 (0.0%) |
| Total | 318 (100.0%) | 234 (100.0%) |
Monthly Housing Cost Tiers in Ardmore
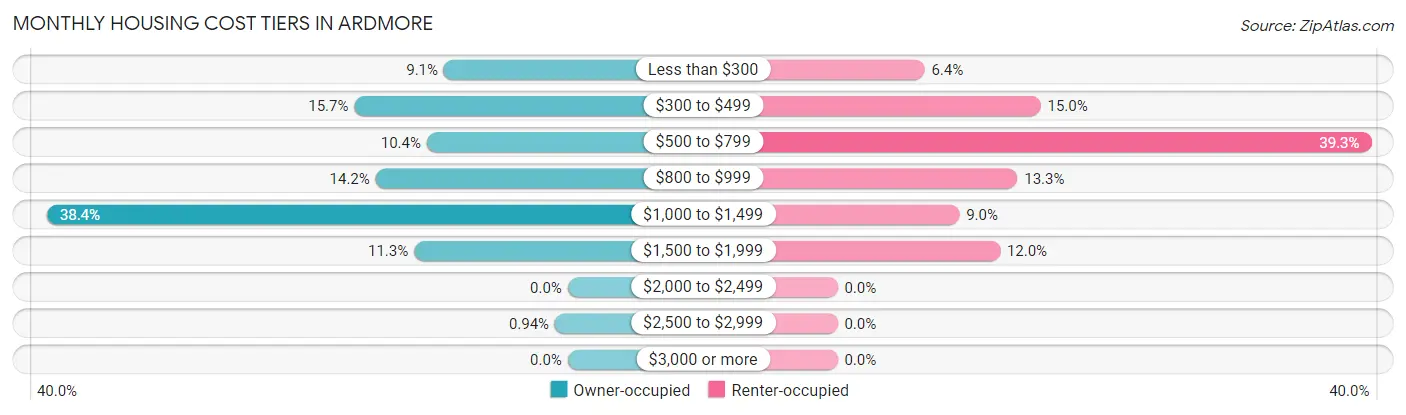
| Monthly Cost | Owner-occupied | Renter-occupied |
| Less than $300 | 29 (9.1%) | 15 (6.4%) |
| $300 to $499 | 50 (15.7%) | 35 (15.0%) |
| $500 to $799 | 33 (10.4%) | 92 (39.3%) |
| $800 to $999 | 45 (14.1%) | 31 (13.3%) |
| $1,000 to $1,499 | 122 (38.4%) | 21 (9.0%) |
| $1,500 to $1,999 | 36 (11.3%) | 28 (12.0%) |
| $2,000 to $2,499 | 0 (0.0%) | 0 (0.0%) |
| $2,500 to $2,999 | 3 (0.9%) | 0 (0.0%) |
| $3,000 or more | 0 (0.0%) | 0 (0.0%) |
| Total | 318 (100.0%) | 234 (100.0%) |
Physical Housing Characteristics in Ardmore
Housing Structures in Ardmore
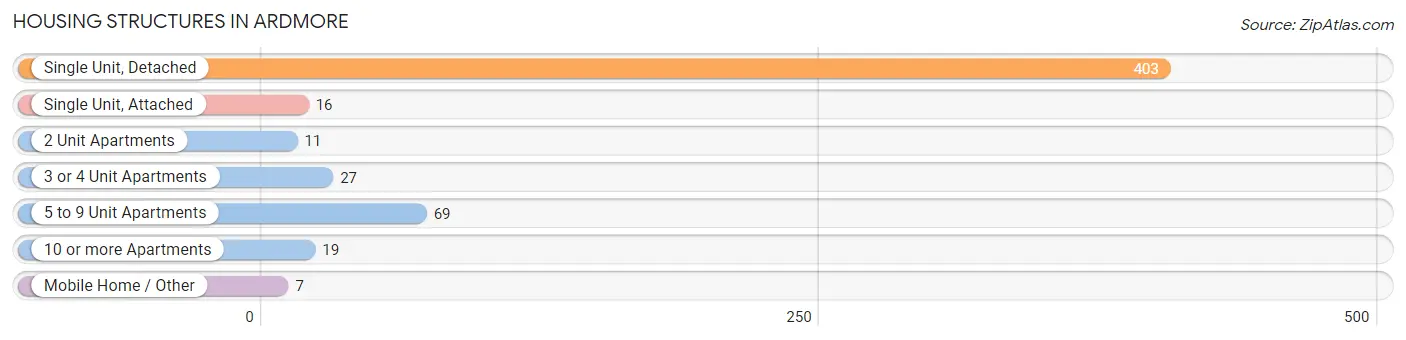
| Structure Type | # Housing Units | % Housing Units |
| Single Unit, Detached | 403 | 73.0% |
| Single Unit, Attached | 16 | 2.9% |
| 2 Unit Apartments | 11 | 2.0% |
| 3 or 4 Unit Apartments | 27 | 4.9% |
| 5 to 9 Unit Apartments | 69 | 12.5% |
| 10 or more Apartments | 19 | 3.4% |
| Mobile Home / Other | 7 | 1.3% |
| Total | 552 | 100.0% |
Housing Structures by Occupancy in Ardmore
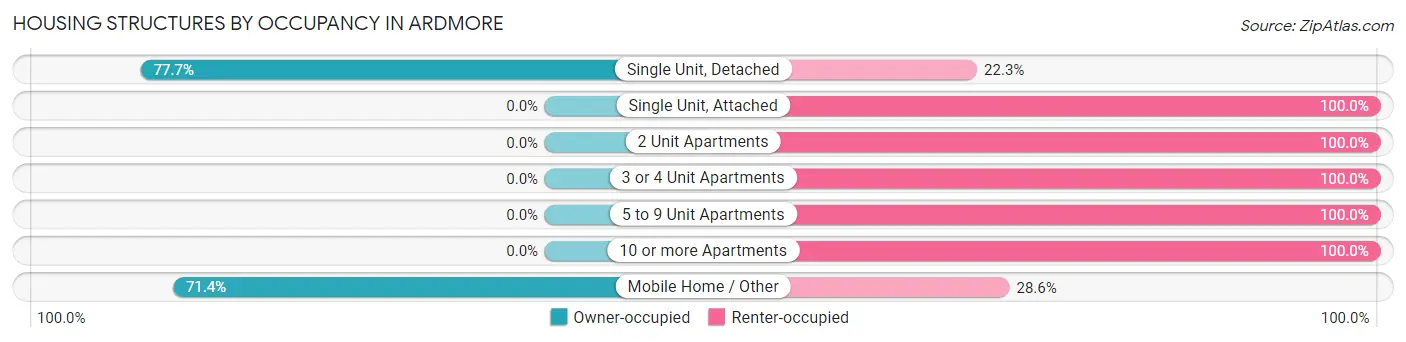
| Structure Type | Owner-occupied | Renter-occupied |
| Single Unit, Detached | 313 (77.7%) | 90 (22.3%) |
| Single Unit, Attached | 0 (0.0%) | 16 (100.0%) |
| 2 Unit Apartments | 0 (0.0%) | 11 (100.0%) |
| 3 or 4 Unit Apartments | 0 (0.0%) | 27 (100.0%) |
| 5 to 9 Unit Apartments | 0 (0.0%) | 69 (100.0%) |
| 10 or more Apartments | 0 (0.0%) | 19 (100.0%) |
| Mobile Home / Other | 5 (71.4%) | 2 (28.6%) |
| Total | 318 (57.6%) | 234 (42.4%) |
Housing Structures by Number of Rooms in Ardmore
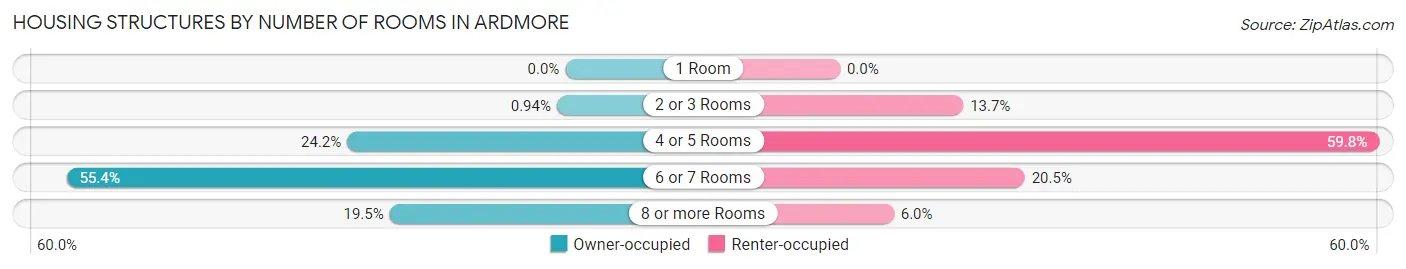
| Number of Rooms | Owner-occupied | Renter-occupied |
| 1 Room | 0 (0.0%) | 0 (0.0%) |
| 2 or 3 Rooms | 3 (0.9%) | 32 (13.7%) |
| 4 or 5 Rooms | 77 (24.2%) | 140 (59.8%) |
| 6 or 7 Rooms | 176 (55.3%) | 48 (20.5%) |
| 8 or more Rooms | 62 (19.5%) | 14 (6.0%) |
| Total | 318 (100.0%) | 234 (100.0%) |
Housing Structure by Heating Type in Ardmore
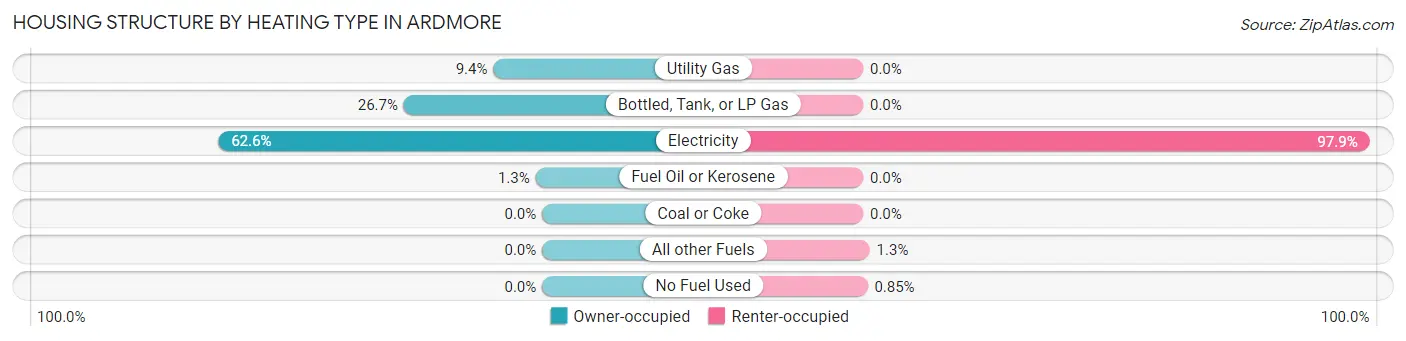
| Heating Type | Owner-occupied | Renter-occupied |
| Utility Gas | 30 (9.4%) | 0 (0.0%) |
| Bottled, Tank, or LP Gas | 85 (26.7%) | 0 (0.0%) |
| Electricity | 199 (62.6%) | 229 (97.9%) |
| Fuel Oil or Kerosene | 4 (1.3%) | 0 (0.0%) |
| Coal or Coke | 0 (0.0%) | 0 (0.0%) |
| All other Fuels | 0 (0.0%) | 3 (1.3%) |
| No Fuel Used | 0 (0.0%) | 2 (0.9%) |
| Total | 318 (100.0%) | 234 (100.0%) |
Household Vehicle Usage in Ardmore
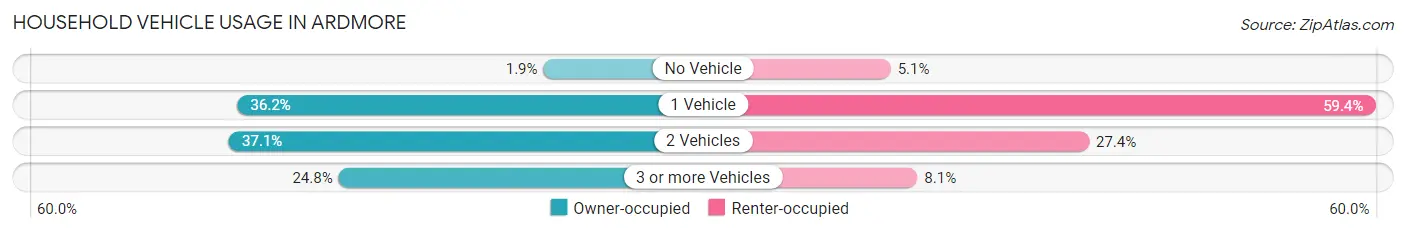
| Vehicles per Household | Owner-occupied | Renter-occupied |
| No Vehicle | 6 (1.9%) | 12 (5.1%) |
| 1 Vehicle | 115 (36.2%) | 139 (59.4%) |
| 2 Vehicles | 118 (37.1%) | 64 (27.4%) |
| 3 or more Vehicles | 79 (24.8%) | 19 (8.1%) |
| Total | 318 (100.0%) | 234 (100.0%) |
Real Estate & Mortgages in Ardmore
Real Estate and Mortgage Overview in Ardmore
| Characteristic | Without Mortgage | With Mortgage |
| Housing Units | 90 | 228 |
| Median Property Value | $127,500 | $155,900 |
| Median Household Income | $40,714 | $25 |
| Monthly Housing Costs | $361 | $0 |
| Real Estate Taxes | $853 | $21 |
Property Value by Mortgage Status in Ardmore
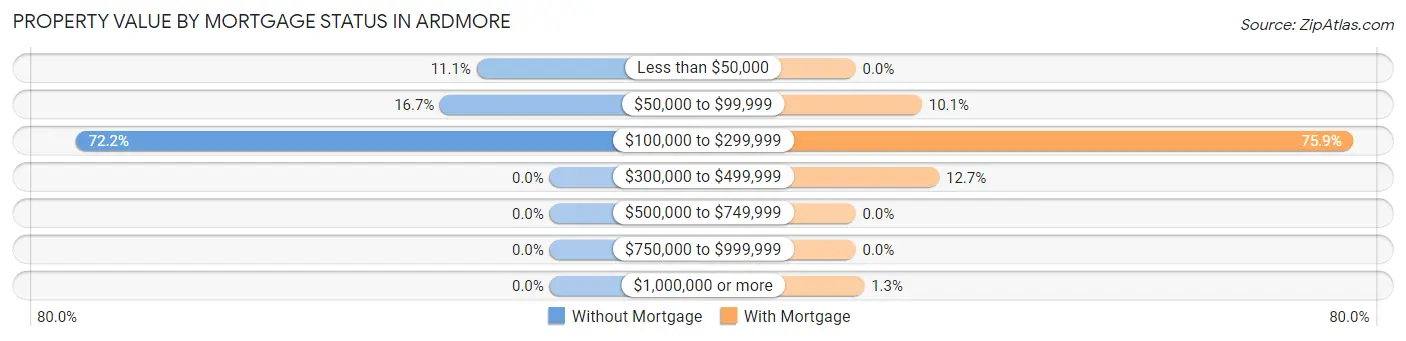
| Property Value | Without Mortgage | With Mortgage |
| Less than $50,000 | 10 (11.1%) | 0 (0.0%) |
| $50,000 to $99,999 | 15 (16.7%) | 23 (10.1%) |
| $100,000 to $299,999 | 65 (72.2%) | 173 (75.9%) |
| $300,000 to $499,999 | 0 (0.0%) | 29 (12.7%) |
| $500,000 to $749,999 | 0 (0.0%) | 0 (0.0%) |
| $750,000 to $999,999 | 0 (0.0%) | 0 (0.0%) |
| $1,000,000 or more | 0 (0.0%) | 3 (1.3%) |
| Total | 90 (100.0%) | 228 (100.0%) |
Household Income by Mortgage Status in Ardmore
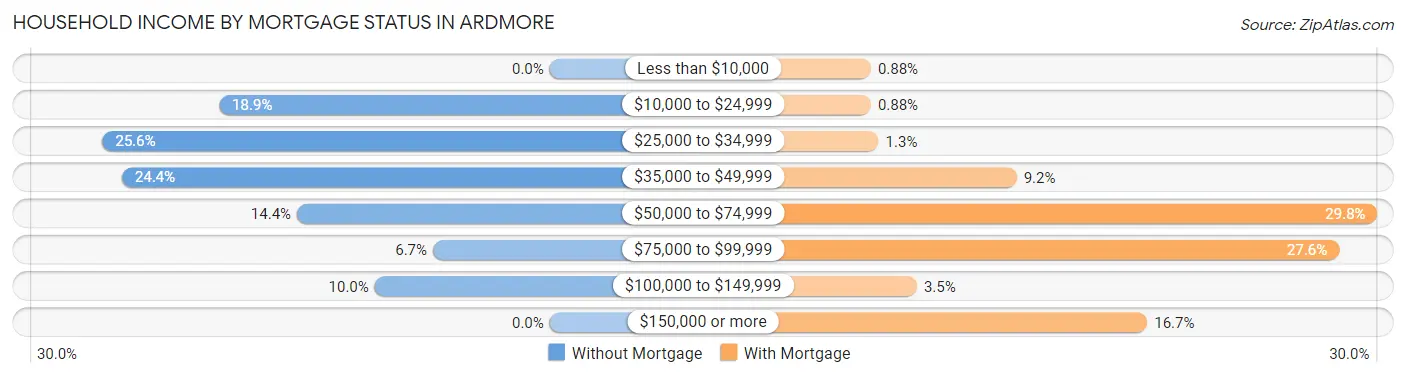
| Household Income | Without Mortgage | With Mortgage |
| Less than $10,000 | 0 (0.0%) | 2 (0.9%) |
| $10,000 to $24,999 | 17 (18.9%) | 2 (0.9%) |
| $25,000 to $34,999 | 23 (25.6%) | 3 (1.3%) |
| $35,000 to $49,999 | 22 (24.4%) | 21 (9.2%) |
| $50,000 to $74,999 | 13 (14.4%) | 68 (29.8%) |
| $75,000 to $99,999 | 6 (6.7%) | 63 (27.6%) |
| $100,000 to $149,999 | 9 (10.0%) | 8 (3.5%) |
| $150,000 or more | 0 (0.0%) | 38 (16.7%) |
| Total | 90 (100.0%) | 228 (100.0%) |
Property Value to Household Income Ratio in Ardmore
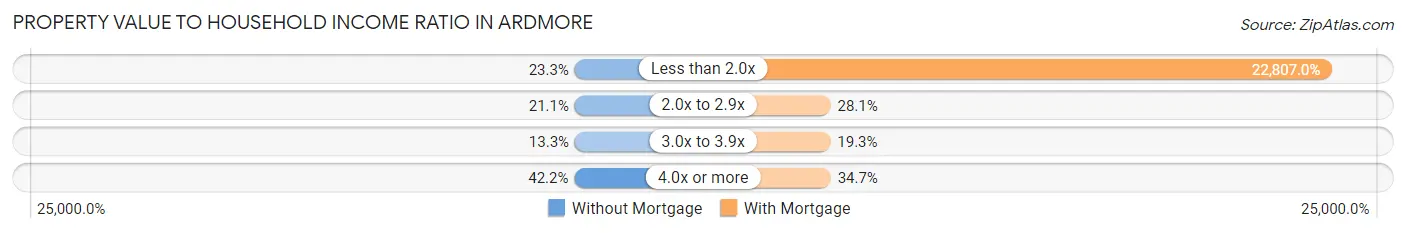
| Value-to-Income Ratio | Without Mortgage | With Mortgage |
| Less than 2.0x | 21 (23.3%) | 52,000 (22,807.0%) |
| 2.0x to 2.9x | 19 (21.1%) | 64 (28.1%) |
| 3.0x to 3.9x | 12 (13.3%) | 44 (19.3%) |
| 4.0x or more | 38 (42.2%) | 79 (34.6%) |
| Total | 90 (100.0%) | 228 (100.0%) |
Real Estate Taxes by Mortgage Status in Ardmore
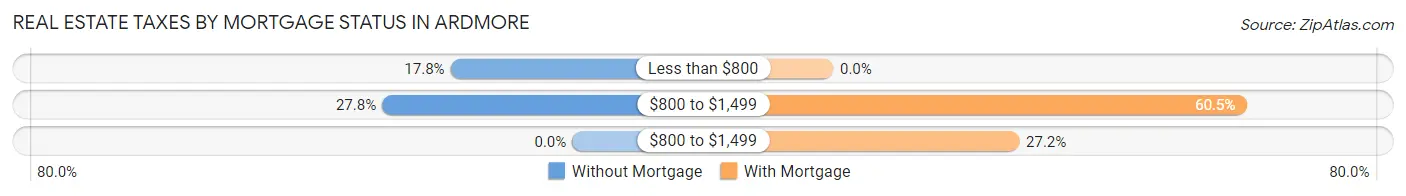
| Property Taxes | Without Mortgage | With Mortgage |
| Less than $800 | 16 (17.8%) | 0 (0.0%) |
| $800 to $1,499 | 25 (27.8%) | 138 (60.5%) |
| $800 to $1,499 | 0 (0.0%) | 62 (27.2%) |
| Total | 90 (100.0%) | 228 (100.0%) |
Health & Disability in Ardmore
Health Insurance Coverage by Age in Ardmore
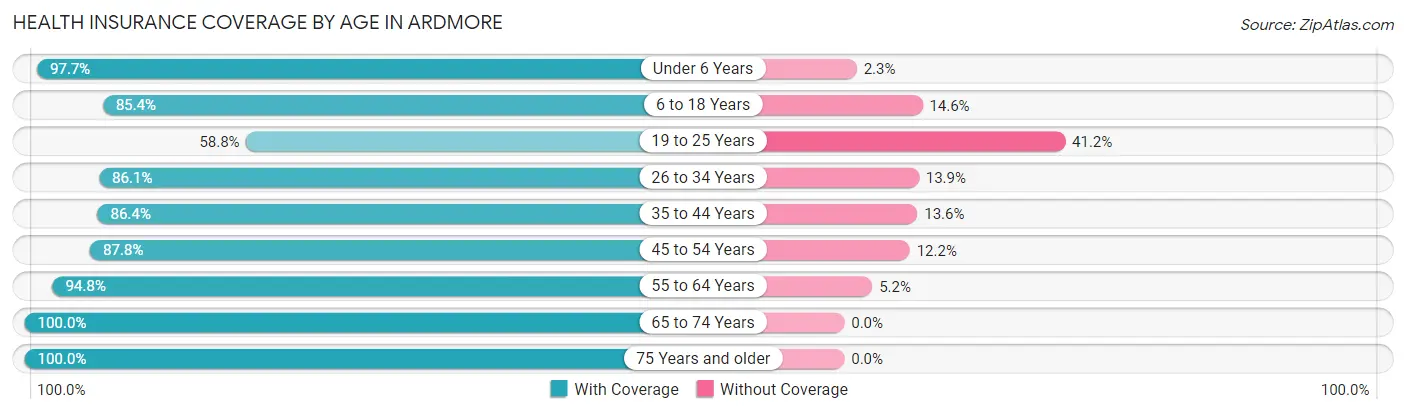
| Age Bracket | With Coverage | Without Coverage |
| Under 6 Years | 127 (97.7%) | 3 (2.3%) |
| 6 to 18 Years | 170 (85.4%) | 29 (14.6%) |
| 19 to 25 Years | 70 (58.8%) | 49 (41.2%) |
| 26 to 34 Years | 186 (86.1%) | 30 (13.9%) |
| 35 to 44 Years | 127 (86.4%) | 20 (13.6%) |
| 45 to 54 Years | 108 (87.8%) | 15 (12.2%) |
| 55 to 64 Years | 91 (94.8%) | 5 (5.2%) |
| 65 to 74 Years | 170 (100.0%) | 0 (0.0%) |
| 75 Years and older | 104 (100.0%) | 0 (0.0%) |
| Total | 1,153 (88.4%) | 151 (11.6%) |
Health Insurance Coverage by Citizenship Status in Ardmore
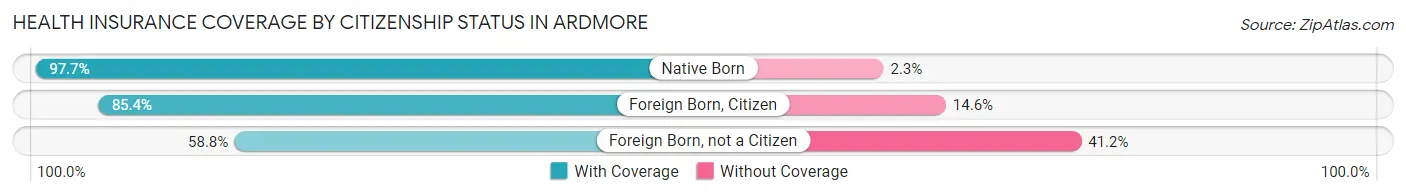
| Citizenship Status | With Coverage | Without Coverage |
| Native Born | 127 (97.7%) | 3 (2.3%) |
| Foreign Born, Citizen | 170 (85.4%) | 29 (14.6%) |
| Foreign Born, not a Citizen | 70 (58.8%) | 49 (41.2%) |
Health Insurance Coverage by Household Income in Ardmore
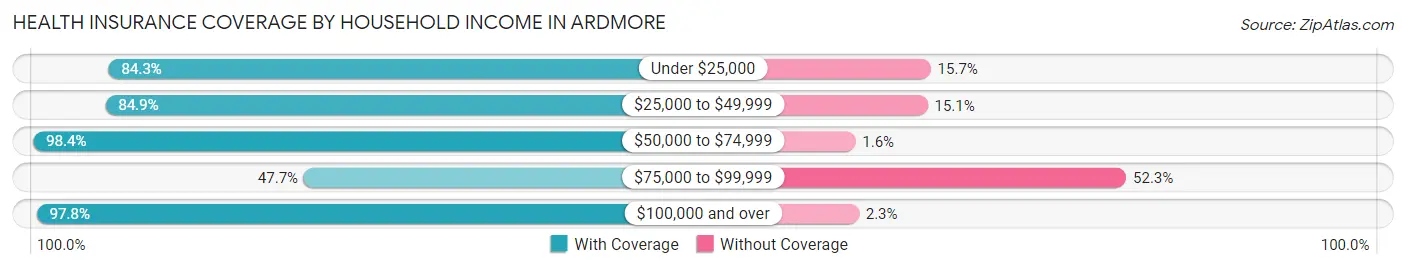
| Household Income | With Coverage | Without Coverage |
| Under $25,000 | 161 (84.3%) | 30 (15.7%) |
| $25,000 to $49,999 | 359 (84.9%) | 64 (15.1%) |
| $50,000 to $74,999 | 244 (98.4%) | 4 (1.6%) |
| $75,000 to $99,999 | 41 (47.7%) | 45 (52.3%) |
| $100,000 and over | 348 (97.8%) | 8 (2.2%) |
Public vs Private Health Insurance Coverage by Age in Ardmore
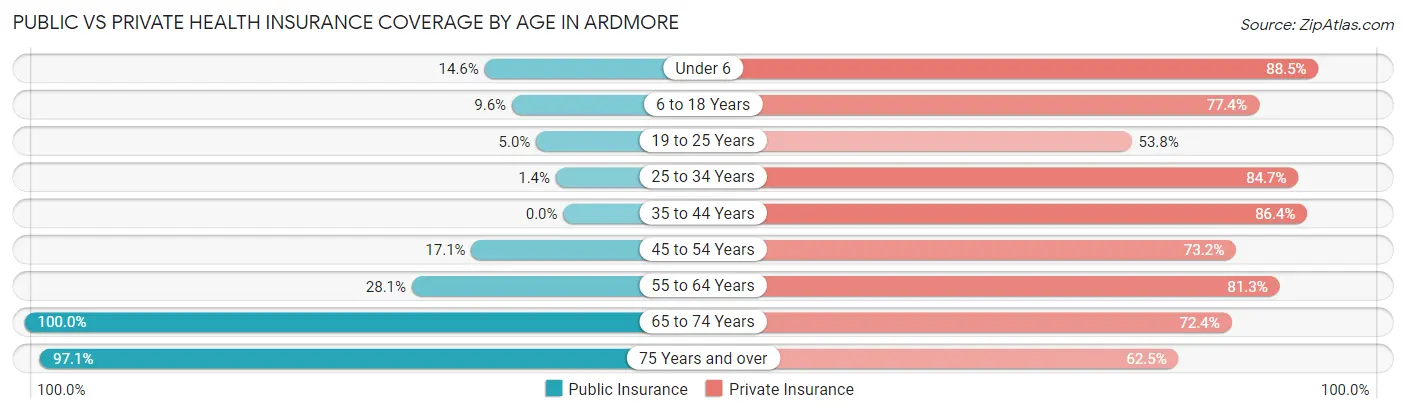
| Age Bracket | Public Insurance | Private Insurance |
| Under 6 | 19 (14.6%) | 115 (88.5%) |
| 6 to 18 Years | 19 (9.6%) | 154 (77.4%) |
| 19 to 25 Years | 6 (5.0%) | 64 (53.8%) |
| 25 to 34 Years | 3 (1.4%) | 183 (84.7%) |
| 35 to 44 Years | 0 (0.0%) | 127 (86.4%) |
| 45 to 54 Years | 21 (17.1%) | 90 (73.2%) |
| 55 to 64 Years | 27 (28.1%) | 78 (81.2%) |
| 65 to 74 Years | 170 (100.0%) | 123 (72.4%) |
| 75 Years and over | 101 (97.1%) | 65 (62.5%) |
| Total | 366 (28.1%) | 999 (76.6%) |
Disability Status by Sex by Age in Ardmore
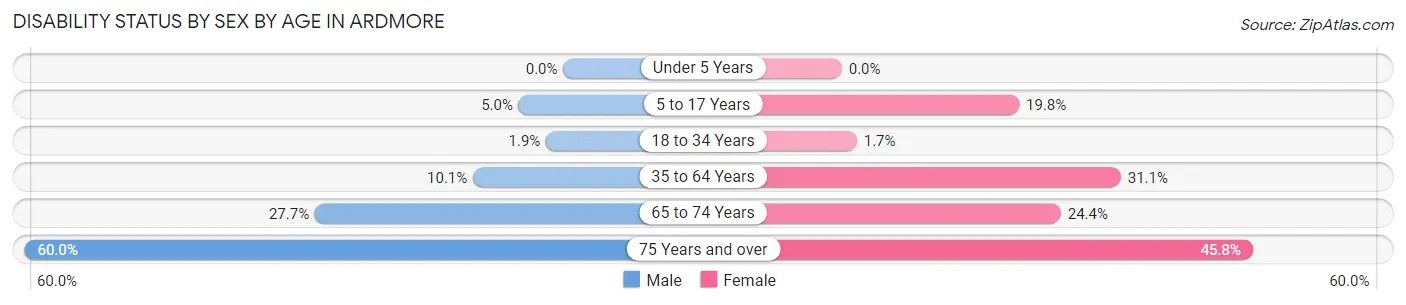
| Age Bracket | Male | Female |
| Under 5 Years | 0 (0.0%) | 0 (0.0%) |
| 5 to 17 Years | 6 (5.0%) | 16 (19.8%) |
| 18 to 34 Years | 3 (1.9%) | 3 (1.7%) |
| 35 to 64 Years | 19 (10.1%) | 55 (31.1%) |
| 65 to 74 Years | 13 (27.7%) | 30 (24.4%) |
| 75 Years and over | 27 (60.0%) | 27 (45.8%) |
Disability Class by Sex by Age in Ardmore
Disability Class: Hearing Difficulty
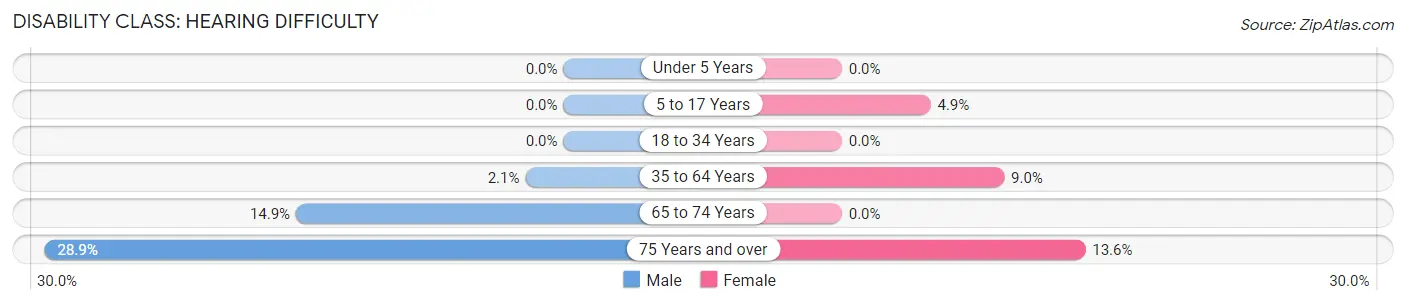
| Age Bracket | Male | Female |
| Under 5 Years | 0 (0.0%) | 0 (0.0%) |
| 5 to 17 Years | 0 (0.0%) | 4 (4.9%) |
| 18 to 34 Years | 0 (0.0%) | 0 (0.0%) |
| 35 to 64 Years | 4 (2.1%) | 16 (9.0%) |
| 65 to 74 Years | 7 (14.9%) | 0 (0.0%) |
| 75 Years and over | 13 (28.9%) | 8 (13.6%) |
Disability Class: Vision Difficulty
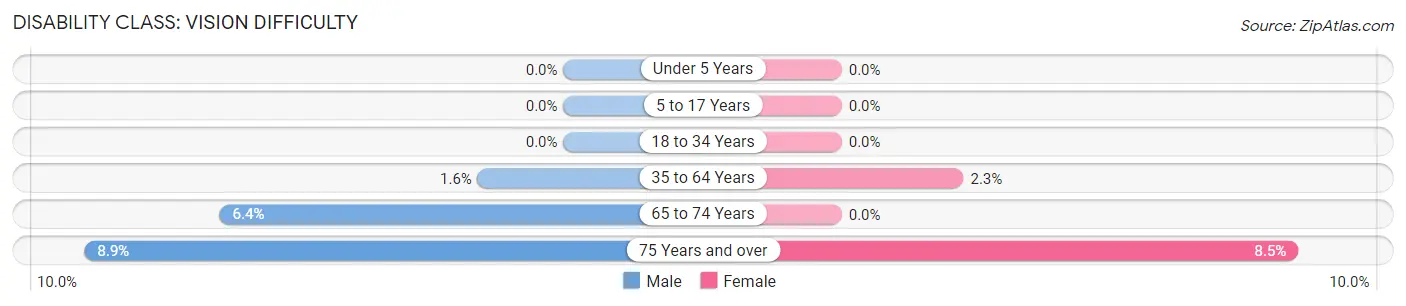
| Age Bracket | Male | Female |
| Under 5 Years | 0 (0.0%) | 0 (0.0%) |
| 5 to 17 Years | 0 (0.0%) | 0 (0.0%) |
| 18 to 34 Years | 0 (0.0%) | 0 (0.0%) |
| 35 to 64 Years | 3 (1.6%) | 4 (2.3%) |
| 65 to 74 Years | 3 (6.4%) | 0 (0.0%) |
| 75 Years and over | 4 (8.9%) | 5 (8.5%) |
Disability Class: Cognitive Difficulty
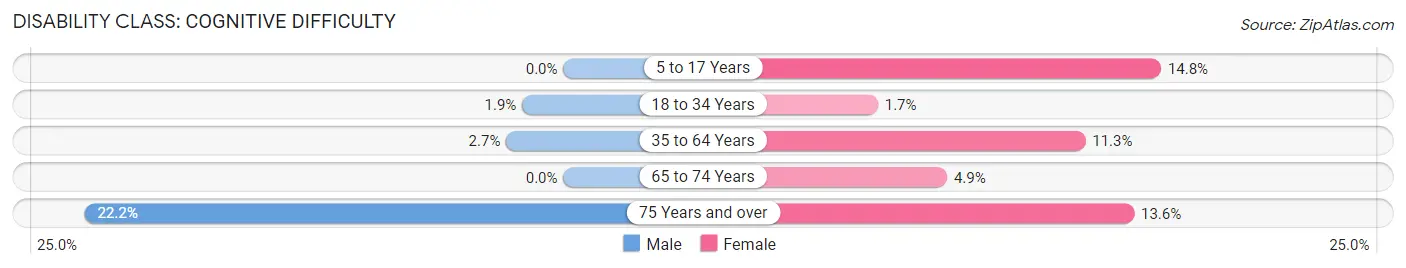
| Age Bracket | Male | Female |
| 5 to 17 Years | 0 (0.0%) | 12 (14.8%) |
| 18 to 34 Years | 3 (1.9%) | 3 (1.7%) |
| 35 to 64 Years | 5 (2.6%) | 20 (11.3%) |
| 65 to 74 Years | 0 (0.0%) | 6 (4.9%) |
| 75 Years and over | 10 (22.2%) | 8 (13.6%) |
Disability Class: Ambulatory Difficulty
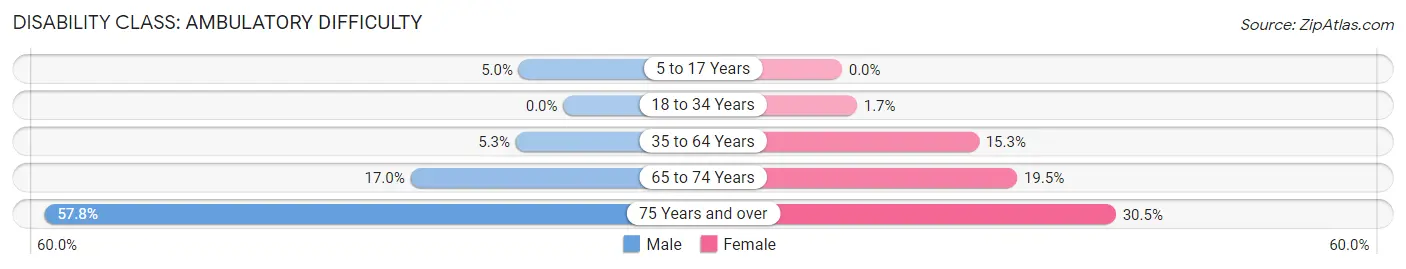
| Age Bracket | Male | Female |
| 5 to 17 Years | 6 (5.0%) | 0 (0.0%) |
| 18 to 34 Years | 0 (0.0%) | 3 (1.7%) |
| 35 to 64 Years | 10 (5.3%) | 27 (15.2%) |
| 65 to 74 Years | 8 (17.0%) | 24 (19.5%) |
| 75 Years and over | 26 (57.8%) | 18 (30.5%) |
Disability Class: Self-Care Difficulty
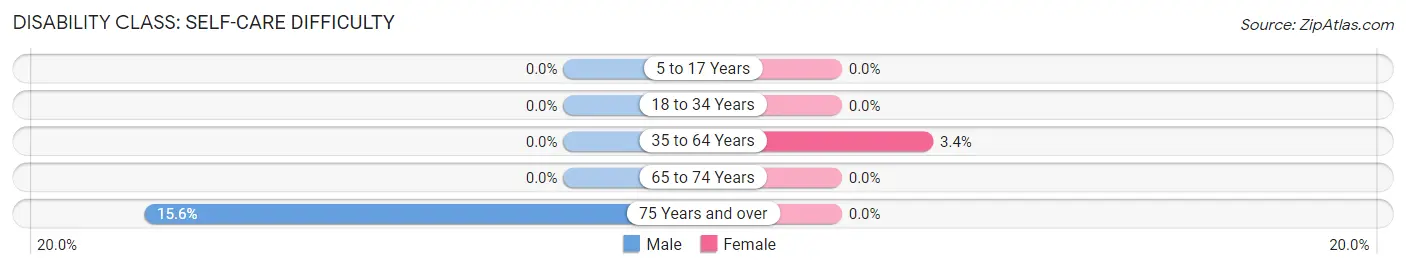
| Age Bracket | Male | Female |
| 5 to 17 Years | 0 (0.0%) | 0 (0.0%) |
| 18 to 34 Years | 0 (0.0%) | 0 (0.0%) |
| 35 to 64 Years | 0 (0.0%) | 6 (3.4%) |
| 65 to 74 Years | 0 (0.0%) | 0 (0.0%) |
| 75 Years and over | 7 (15.6%) | 0 (0.0%) |
Technology Access in Ardmore
Computing Device Access in Ardmore
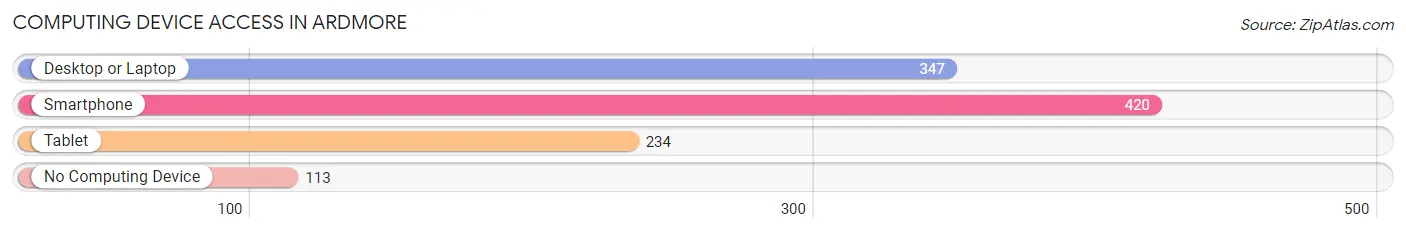
| Device Type | # Households | % Households |
| Desktop or Laptop | 347 | 62.9% |
| Smartphone | 420 | 76.1% |
| Tablet | 234 | 42.4% |
| No Computing Device | 113 | 20.5% |
| Total | 552 | 100.0% |
Internet Access in Ardmore
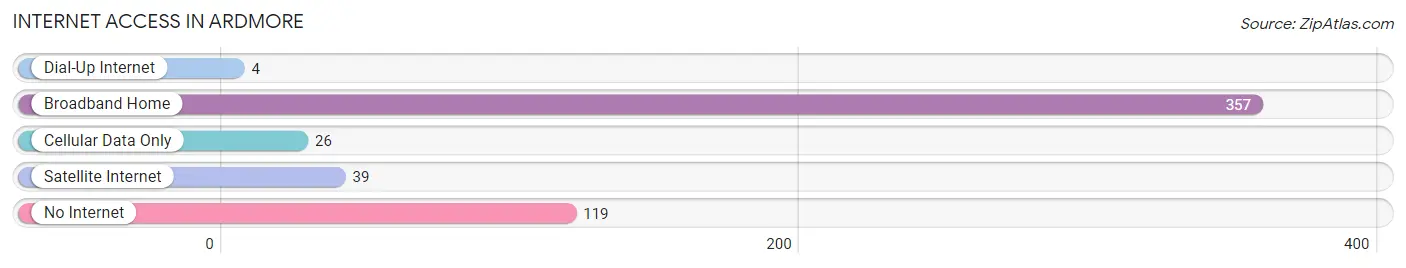
| Internet Type | # Households | % Households |
| Dial-Up Internet | 4 | 0.7% |
| Broadband Home | 357 | 64.7% |
| Cellular Data Only | 26 | 4.7% |
| Satellite Internet | 39 | 7.1% |
| No Internet | 119 | 21.6% |
| Total | 552 | 100.0% |
Ardmore Summary
Ardmore is a small town located in Limestone County, Alabama. It is situated in the foothills of the Appalachian Mountains, about 20 miles south of Huntsville. The town has a population of approximately 2,000 people and is part of the Huntsville-Decatur Combined Statistical Area.
History
Ardmore was founded in 1887 by a group of settlers from Tennessee. The town was named after a nearby creek, which was named after a nearby mountain. The town was originally a farming community, but it soon developed into a small industrial center. The town was incorporated in 1891 and the first mayor was elected in 1892.
In the early 1900s, the town experienced a period of growth and development. The first bank was established in 1904 and the first newspaper was published in 1906. The town also had a cotton gin, a sawmill, and a gristmill.
In the 1920s, the town experienced a period of decline due to the Great Depression. However, the town was able to recover and experienced a period of growth in the 1950s and 1960s. During this time, the town was home to several manufacturing plants, including a furniture factory and a textile mill.
Geography
Ardmore is located in the foothills of the Appalachian Mountains, about 20 miles south of Huntsville. The town is situated on the banks of the Flint River, which flows through the town. The town is surrounded by rolling hills and forests, and is home to several parks and recreational areas.
The climate in Ardmore is mild and humid, with temperatures ranging from the low 30s in the winter to the mid-90s in the summer. The town receives an average of 48 inches of rain per year.
Economy
The economy of Ardmore is largely based on agriculture and manufacturing. The town is home to several farms, which produce a variety of crops, including corn, soybeans, and cotton. The town is also home to several manufacturing plants, including a furniture factory and a textile mill.
The town is also home to several small businesses, including restaurants, shops, and service providers. The town is also home to several churches and schools.
Demographics
As of the 2010 census, the population of Ardmore was 2,000. The racial makeup of the town was 95.2% White, 2.2% African American, 0.7% Native American, 0.3% Asian, and 1.6% from other races. The median household income was $35,000 and the median family income was $41,000.
Conclusion
Ardmore is a small town located in Limestone County, Alabama. It is situated in the foothills of the Appalachian Mountains, about 20 miles south of Huntsville. The town has a population of approximately 2,000 people and is part of the Huntsville-Decatur Combined Statistical Area. The economy of Ardmore is largely based on agriculture and manufacturing, and the town is home to several small businesses, churches, and schools. The racial makeup of the town is 95.2% White, 2.2% African American, 0.7% Native American, 0.3% Asian, and 1.6% from other races. The median household income was $35,000 and the median family income was $41,000.
Common Questions
What is Per Capita Income in Ardmore?
Per Capita income in Ardmore is $25,776.
What is the Median Family Income in Ardmore?
Median Family Income in Ardmore is $52,200.
What is the Median Household income in Ardmore?
Median Household Income in Ardmore is $39,973.
What is Income or Wage Gap in Ardmore?
Income or Wage Gap in Ardmore is 43.4%.
Women in Ardmore earn 56.6 cents for every dollar earned by a man.
What is Inequality or Gini Index in Ardmore?
Inequality or Gini Index in Ardmore is 0.39.
What is the Total Population of Ardmore?
Total Population of Ardmore is 1,304.
What is the Total Male Population of Ardmore?
Total Male Population of Ardmore is 645.
What is the Total Female Population of Ardmore?
Total Female Population of Ardmore is 659.
What is the Ratio of Males per 100 Females in Ardmore?
There are 97.88 Males per 100 Females in Ardmore.
What is the Ratio of Females per 100 Males in Ardmore?
There are 102.17 Females per 100 Males in Ardmore.
What is the Median Population Age in Ardmore?
Median Population Age in Ardmore is 33.9 Years.
What is the Average Family Size in Ardmore
Average Family Size in Ardmore is 3.3 People.
What is the Average Household Size in Ardmore
Average Household Size in Ardmore is 2.4 People.
How Large is the Labor Force in Ardmore?
There are 584 People in the Labor Forcein in Ardmore.
What is the Percentage of People in the Labor Force in Ardmore?
56.9% of People are in the Labor Force in Ardmore.
What is the Unemployment Rate in Ardmore?
Unemployment Rate in Ardmore is 1.7%.