Ashford, AL Map & Demographics
Ashford Map
Ashford Overview
$27,273
PER CAPITA INCOME
$66,953
AVG FAMILY INCOME
$51,215
AVG HOUSEHOLD INCOME
44.7%
WAGE / INCOME GAP [ % ]
55.3¢/ $1
WAGE / INCOME GAP [ $ ]
$11,331
FAMILY INCOME DEFICIT
0.47
INEQUALITY / GINI INDEX
2,476
TOTAL POPULATION
1,140
MALE POPULATION
1,336
FEMALE POPULATION
85.33
MALES / 100 FEMALES
117.19
FEMALES / 100 MALES
37.8
MEDIAN AGE
3.5
AVG FAMILY SIZE
2.9
AVG HOUSEHOLD SIZE
1,008
LABOR FORCE [ PEOPLE ]
52.4%
PERCENT IN LABOR FORCE
3.8%
UNEMPLOYMENT RATE
Ashford Zip Codes
Ashford Area Codes
Income in Ashford
Income Overview in Ashford
Per Capita Income in Ashford is $27,273, while median incomes of families and households are $66,953 and $51,215 respectively.
| Characteristic | Number | Measure |
| Per Capita Income | 2,476 | $27,273 |
| Median Family Income | 615 | $66,953 |
| Mean Family Income | 615 | $86,810 |
| Median Household Income | 859 | $51,215 |
| Mean Household Income | 859 | $71,600 |
| Income Deficit | 615 | $11,331 |
| Wage / Income Gap (%) | 2,476 | 44.73% |
| Wage / Income Gap ($) | 2,476 | 55.27¢ per $1 |
| Gini / Inequality Index | 2,476 | 0.47 |
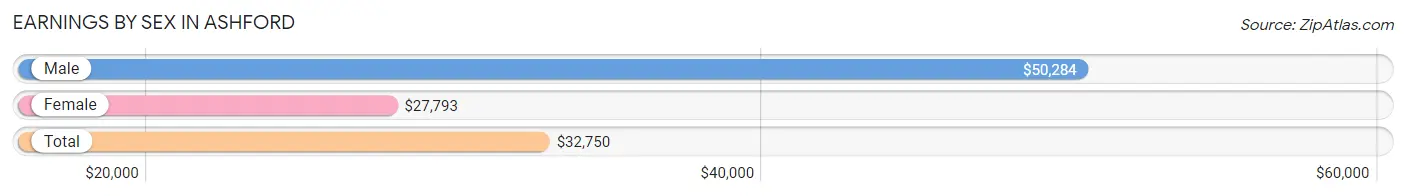
Earnings by Sex in Ashford
Average Earnings in Ashford are $32,750, $50,284 for men and $27,793 for women, a difference of 44.7%.
| Sex | Number | Average Earnings |
| Male | 501 (47.7%) | $50,284 |
| Female | 549 (52.3%) | $27,793 |
| Total | 1,050 (100.0%) | $32,750 |
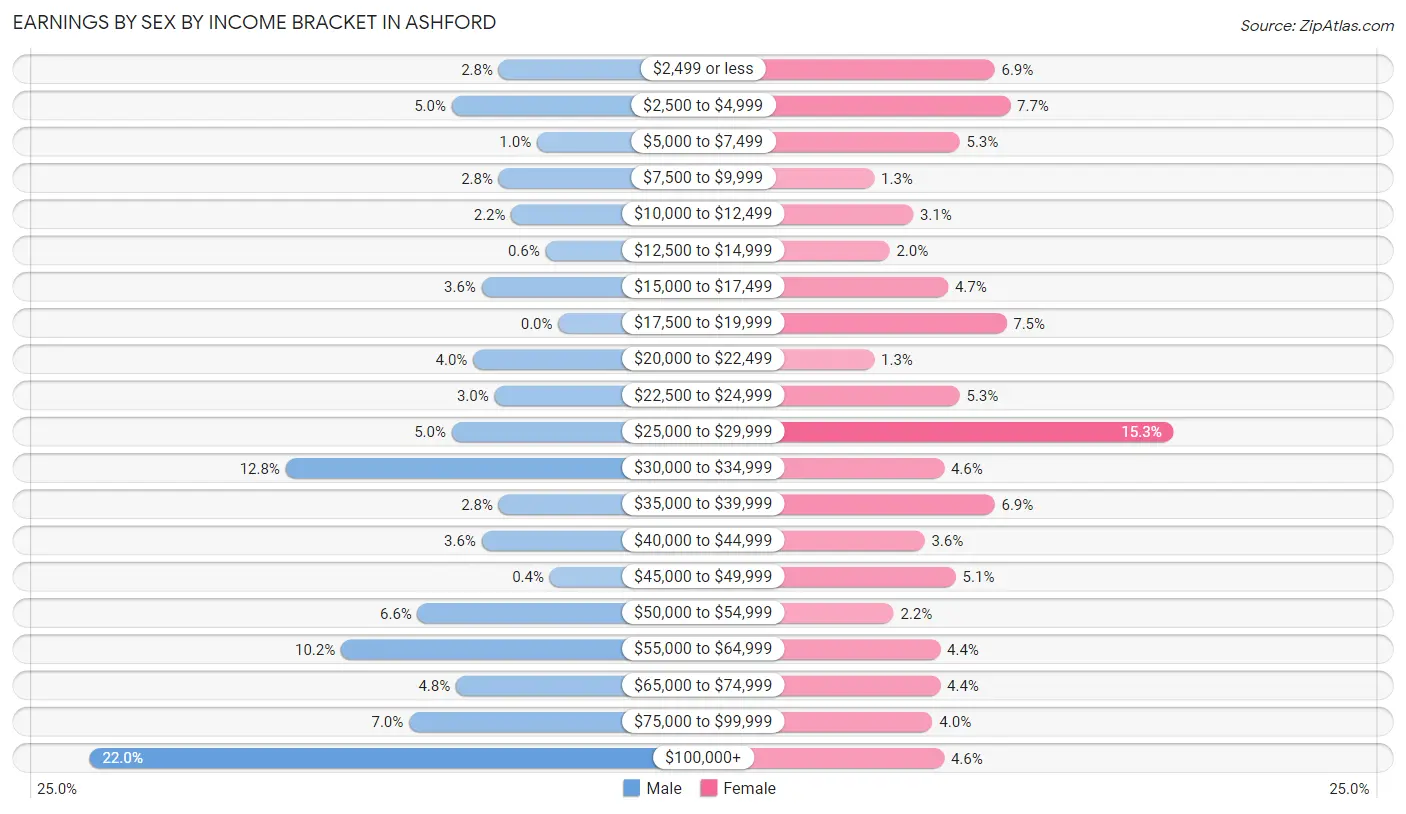
Earnings by Sex by Income Bracket in Ashford
The most common earnings brackets in Ashford are $100,000+ for men (110 | 22.0%) and $25,000 to $29,999 for women (84 | 15.3%).
| Income | Male | Female |
| $2,499 or less | 14 (2.8%) | 38 (6.9%) |
| $2,500 to $4,999 | 25 (5.0%) | 42 (7.6%) |
| $5,000 to $7,499 | 5 (1.0%) | 29 (5.3%) |
| $7,500 to $9,999 | 14 (2.8%) | 7 (1.3%) |
| $10,000 to $12,499 | 11 (2.2%) | 17 (3.1%) |
| $12,500 to $14,999 | 3 (0.6%) | 11 (2.0%) |
| $15,000 to $17,499 | 18 (3.6%) | 26 (4.7%) |
| $17,500 to $19,999 | 0 (0.0%) | 41 (7.5%) |
| $20,000 to $22,499 | 20 (4.0%) | 7 (1.3%) |
| $22,500 to $24,999 | 15 (3.0%) | 29 (5.3%) |
| $25,000 to $29,999 | 25 (5.0%) | 84 (15.3%) |
| $30,000 to $34,999 | 64 (12.8%) | 25 (4.5%) |
| $35,000 to $39,999 | 14 (2.8%) | 38 (6.9%) |
| $40,000 to $44,999 | 18 (3.6%) | 20 (3.6%) |
| $45,000 to $49,999 | 2 (0.4%) | 28 (5.1%) |
| $50,000 to $54,999 | 33 (6.6%) | 12 (2.2%) |
| $55,000 to $64,999 | 51 (10.2%) | 24 (4.4%) |
| $65,000 to $74,999 | 24 (4.8%) | 24 (4.4%) |
| $75,000 to $99,999 | 35 (7.0%) | 22 (4.0%) |
| $100,000+ | 110 (22.0%) | 25 (4.5%) |
| Total | 501 (100.0%) | 549 (100.0%) |
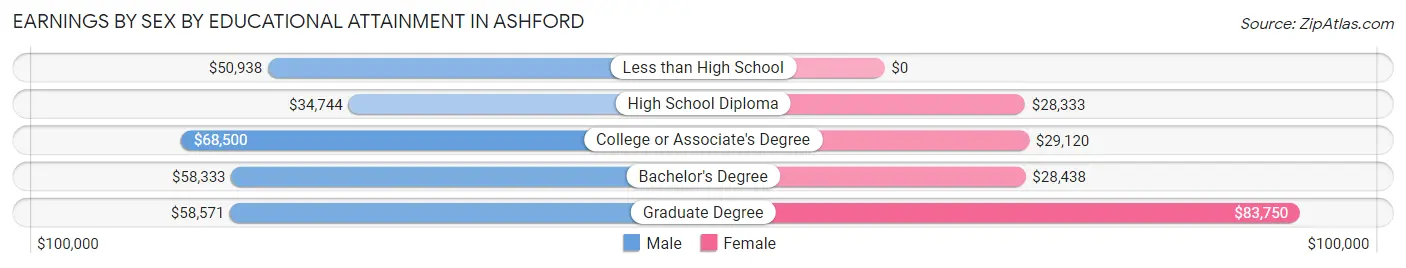
Earnings by Sex by Educational Attainment in Ashford
Average earnings in Ashford are $56,406 for men and $29,365 for women, a difference of 47.9%. Men with an educational attainment of college or associate's degree enjoy the highest average annual earnings of $68,500, while those with high school diploma education earn the least with $34,744. Women with an educational attainment of graduate degree earn the most with the average annual earnings of $83,750, while those with high school diploma education have the smallest earnings of $28,333.
| Educational Attainment | Male Income | Female Income |
| Less than High School | $50,938 | $0 |
| High School Diploma | $34,744 | $28,333 |
| College or Associate's Degree | $68,500 | $29,120 |
| Bachelor's Degree | $58,333 | $28,438 |
| Graduate Degree | $58,571 | $83,750 |
| Total | $56,406 | $29,365 |
Family Income in Ashford
Family Income Brackets in Ashford
According to the Ashford family income data, there are 151 families falling into the $50,000 to $74,999 income range, which is the most common income bracket and makes up 24.5% of all families. Conversely, the less than $10,000 income bracket is the least frequent group with only 15 families (2.4%) belonging to this category.
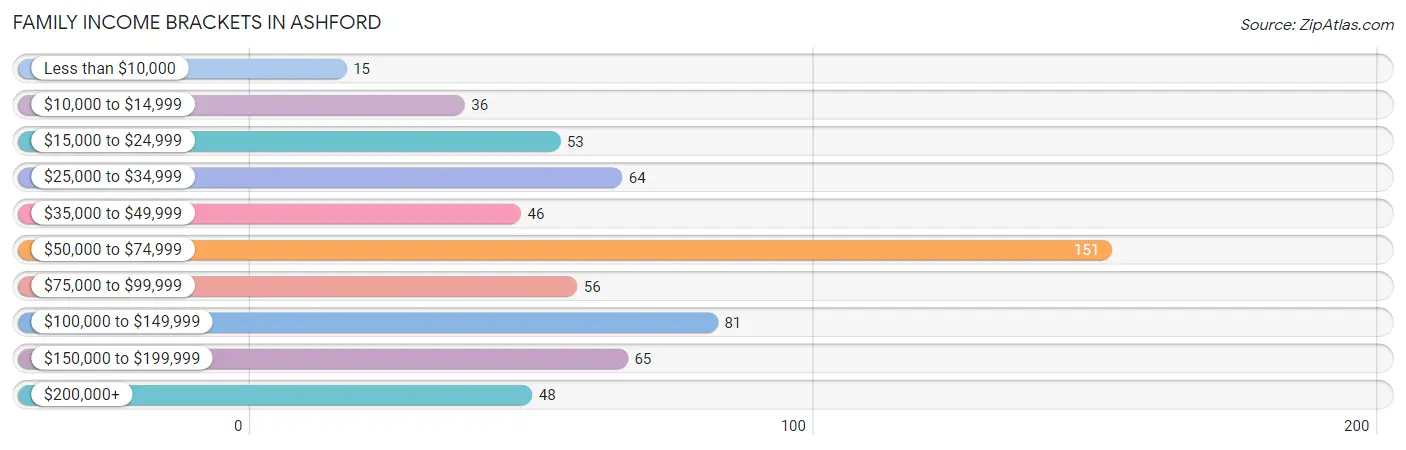
| Income Bracket | # Families | % Families |
| Less than $10,000 | 15 | 2.4% |
| $10,000 to $14,999 | 36 | 5.9% |
| $15,000 to $24,999 | 53 | 8.6% |
| $25,000 to $34,999 | 64 | 10.4% |
| $35,000 to $49,999 | 46 | 7.5% |
| $50,000 to $74,999 | 151 | 24.6% |
| $75,000 to $99,999 | 56 | 9.1% |
| $100,000 to $149,999 | 81 | 13.2% |
| $150,000 to $199,999 | 65 | 10.6% |
| $200,000+ | 48 | 7.8% |
Family Income by Famaliy Size in Ashford
4-person families (138 | 22.4%) account for the highest median family income in Ashford with $111,875 per family, while 4-person families (138 | 22.4%) have the highest median income of $27,969 per family member.
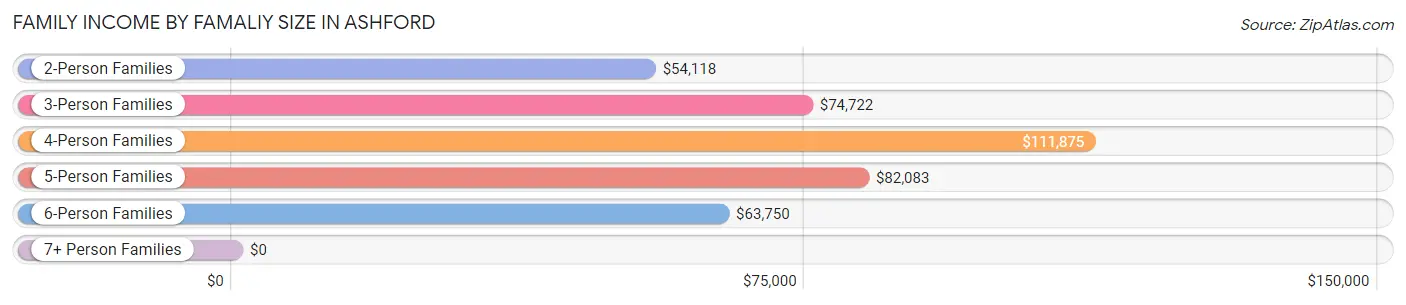
| Income Bracket | # Families | Median Income |
| 2-Person Families | 286 (46.5%) | $54,118 |
| 3-Person Families | 128 (20.8%) | $74,722 |
| 4-Person Families | 138 (22.4%) | $111,875 |
| 5-Person Families | 27 (4.4%) | $82,083 |
| 6-Person Families | 34 (5.5%) | $63,750 |
| 7+ Person Families | 2 (0.3%) | $0 |
| Total | 615 (100.0%) | $66,953 |
Family Income by Number of Earners in Ashford
The median family income in Ashford is $66,953, with families comprising 3+ earners (55) having the highest median family income of $144,375, while families with no earners (144) have the lowest median family income of $25,000, accounting for 8.9% and 23.4% of families, respectively.
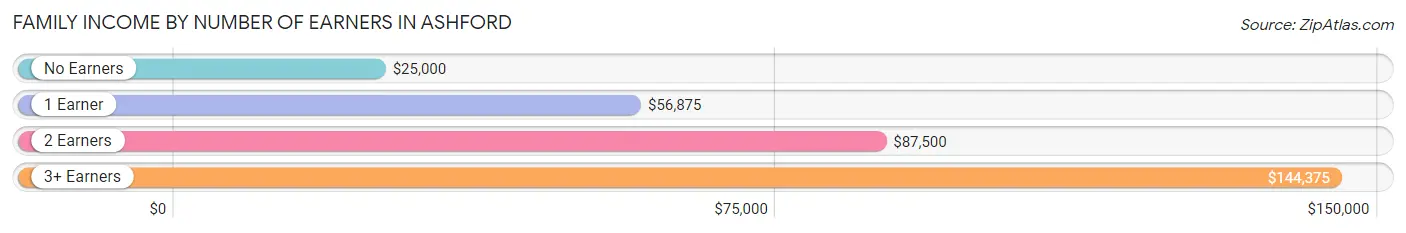
| Number of Earners | # Families | Median Income |
| No Earners | 144 (23.4%) | $25,000 |
| 1 Earner | 186 (30.2%) | $56,875 |
| 2 Earners | 230 (37.4%) | $87,500 |
| 3+ Earners | 55 (8.9%) | $144,375 |
| Total | 615 (100.0%) | $66,953 |
Household Income in Ashford
Household Income Brackets in Ashford
With 181 households falling in the category, the $50,000 to $74,999 income range is the most frequent in Ashford, accounting for 21.1% of all households. In contrast, only 48 households (5.6%) fall into the $200,000+ income bracket, making it the least populous group.
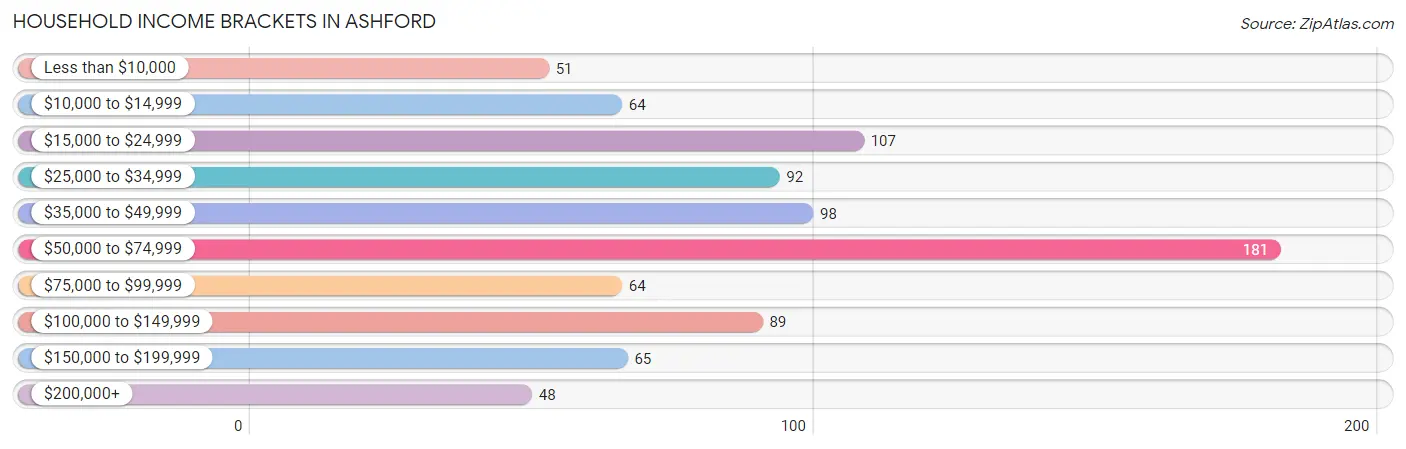
| Income Bracket | # Households | % Households |
| Less than $10,000 | 51 | 5.9% |
| $10,000 to $14,999 | 64 | 7.5% |
| $15,000 to $24,999 | 107 | 12.5% |
| $25,000 to $34,999 | 92 | 10.7% |
| $35,000 to $49,999 | 98 | 11.4% |
| $50,000 to $74,999 | 181 | 21.1% |
| $75,000 to $99,999 | 64 | 7.5% |
| $100,000 to $149,999 | 89 | 10.4% |
| $150,000 to $199,999 | 65 | 7.6% |
| $200,000+ | 48 | 5.6% |
Household Income by Householder Age in Ashford
The median household income in Ashford is $51,215, with the highest median household income of $66,136 found in the 45 to 64 years age bracket for the primary householder. A total of 326 households (38.0%) fall into this category. Meanwhile, the 65+ years age bracket for the primary householder has the lowest median household income of $35,066, with 279 households (32.5%) in this group.
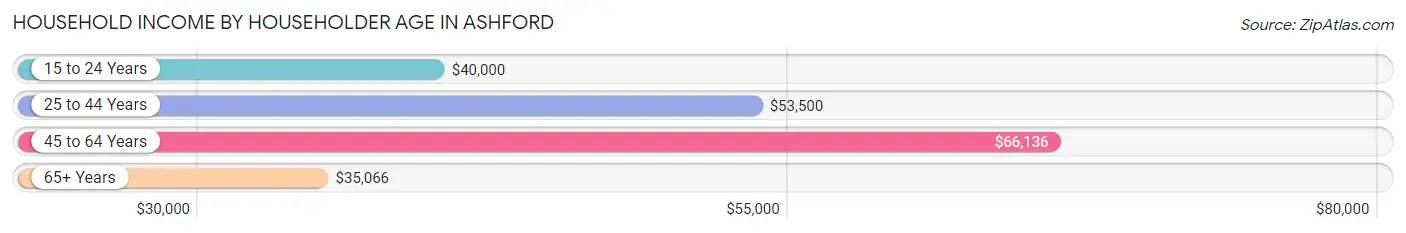
| Income Bracket | # Households | Median Income |
| 15 to 24 Years | 10 (1.2%) | $40,000 |
| 25 to 44 Years | 244 (28.4%) | $53,500 |
| 45 to 64 Years | 326 (38.0%) | $66,136 |
| 65+ Years | 279 (32.5%) | $35,066 |
| Total | 859 (100.0%) | $51,215 |
Poverty in Ashford
Income Below Poverty by Sex and Age in Ashford
With 15.6% poverty level for males and 20.5% for females among the residents of Ashford, 16 and 17 year old males and 5 year old females are the most vulnerable to poverty, with 30 males (55.6%) and 8 females (53.3%) in their respective age groups living below the poverty level.
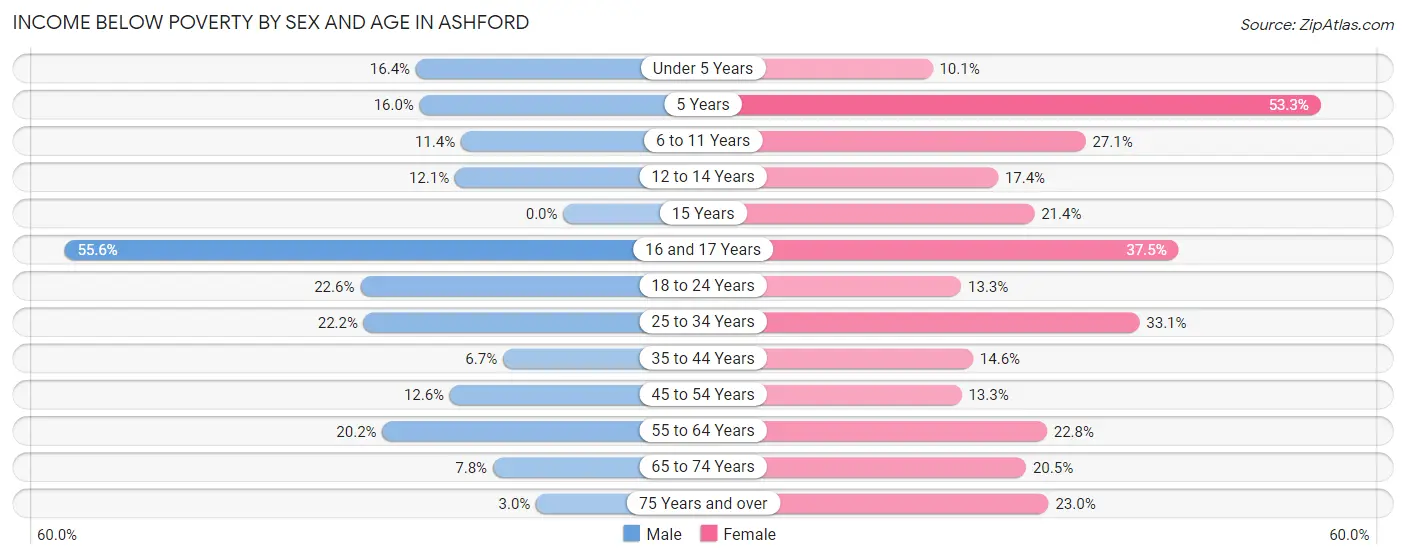
| Age Bracket | Male | Female |
| Under 5 Years | 11 (16.4%) | 10 (10.1%) |
| 5 Years | 4 (16.0%) | 8 (53.3%) |
| 6 to 11 Years | 13 (11.4%) | 19 (27.1%) |
| 12 to 14 Years | 7 (12.1%) | 12 (17.4%) |
| 15 Years | 0 (0.0%) | 3 (21.4%) |
| 16 and 17 Years | 30 (55.6%) | 9 (37.5%) |
| 18 to 24 Years | 19 (22.6%) | 21 (13.3%) |
| 25 to 34 Years | 24 (22.2%) | 58 (33.1%) |
| 35 to 44 Years | 8 (6.7%) | 20 (14.6%) |
| 45 to 54 Years | 24 (12.6%) | 20 (13.3%) |
| 55 to 64 Years | 27 (20.2%) | 29 (22.8%) |
| 65 to 74 Years | 8 (7.8%) | 32 (20.5%) |
| 75 Years and over | 2 (3.0%) | 32 (23.0%) |
| Total | 177 (15.6%) | 273 (20.5%) |
Income Above Poverty by Sex and Age in Ashford
According to the poverty statistics in Ashford, males aged 15 years and females aged under 5 years are the age groups that are most secure financially, with 100.0% of males and 89.9% of females in these age groups living above the poverty line.
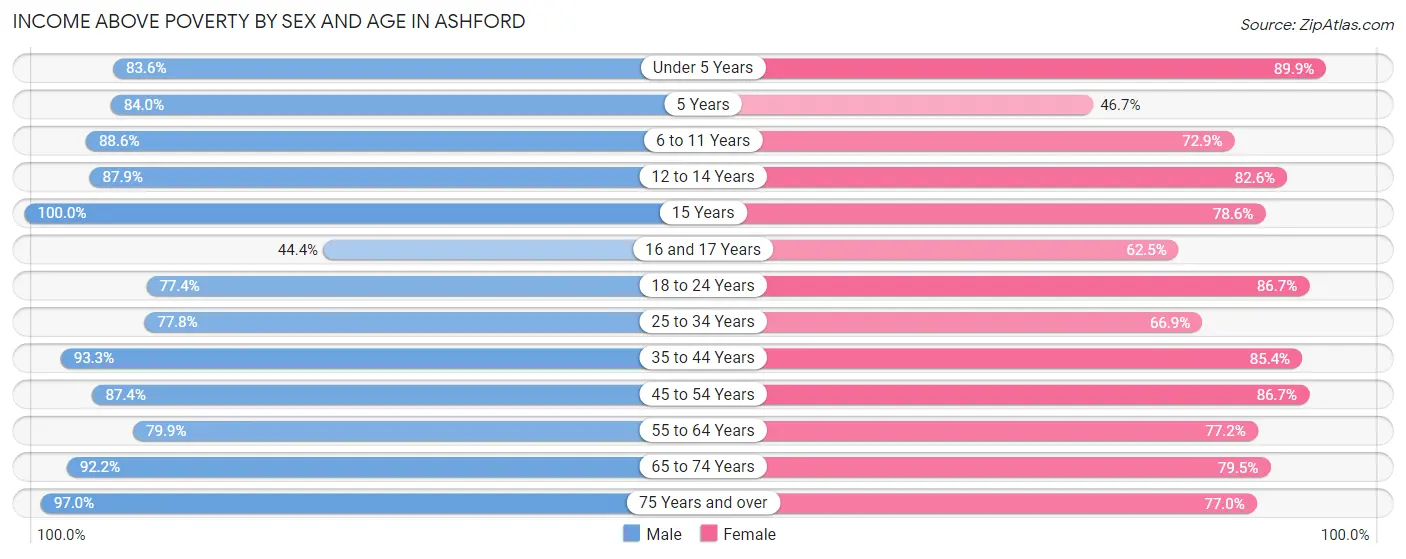
| Age Bracket | Male | Female |
| Under 5 Years | 56 (83.6%) | 89 (89.9%) |
| 5 Years | 21 (84.0%) | 7 (46.7%) |
| 6 to 11 Years | 101 (88.6%) | 51 (72.9%) |
| 12 to 14 Years | 51 (87.9%) | 57 (82.6%) |
| 15 Years | 15 (100.0%) | 11 (78.6%) |
| 16 and 17 Years | 24 (44.4%) | 15 (62.5%) |
| 18 to 24 Years | 65 (77.4%) | 137 (86.7%) |
| 25 to 34 Years | 84 (77.8%) | 117 (66.9%) |
| 35 to 44 Years | 111 (93.3%) | 117 (85.4%) |
| 45 to 54 Years | 166 (87.4%) | 130 (86.7%) |
| 55 to 64 Years | 107 (79.8%) | 98 (77.2%) |
| 65 to 74 Years | 94 (92.2%) | 124 (79.5%) |
| 75 Years and over | 64 (97.0%) | 107 (77.0%) |
| Total | 959 (84.4%) | 1,060 (79.5%) |
Income Below Poverty Among Married-Couple Families in Ashford
The poverty statistics for married-couple families in Ashford show that 6.7% or 26 of the total 386 families live below the poverty line. Families with 3 or 4 children have the highest poverty rate of 14.3%, comprising of 4 families. On the other hand, families with no children have the lowest poverty rate of 3.5%, which includes 7 families.
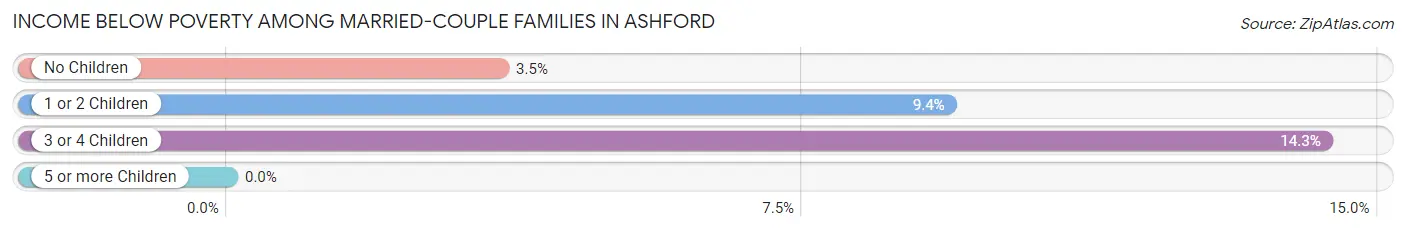
| Children | Above Poverty | Below Poverty |
| No Children | 191 (96.5%) | 7 (3.5%) |
| 1 or 2 Children | 145 (90.6%) | 15 (9.4%) |
| 3 or 4 Children | 24 (85.7%) | 4 (14.3%) |
| 5 or more Children | 0 (0.0%) | 0 (0.0%) |
| Total | 360 (93.3%) | 26 (6.7%) |
Income Below Poverty Among Single-Parent Households in Ashford
According to the poverty data in Ashford, 27.8% or 20 single-father households and 26.8% or 42 single-mother households are living below the poverty line. Among single-father households, those with no children have the highest poverty rate, with 11 households (44.0%) experiencing poverty. Likewise, among single-mother households, those with 3 or 4 children have the highest poverty rate, with 17 households (100.0%) falling below the poverty line.
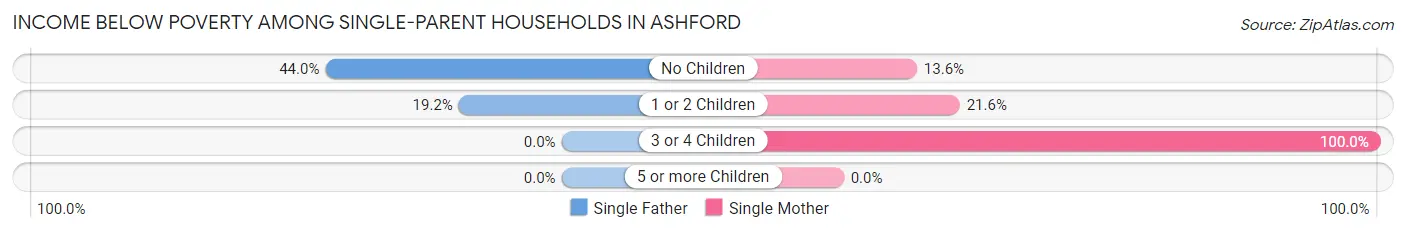
| Children | Single Father | Single Mother |
| No Children | 11 (44.0%) | 9 (13.6%) |
| 1 or 2 Children | 9 (19.2%) | 16 (21.6%) |
| 3 or 4 Children | 0 (0.0%) | 17 (100.0%) |
| 5 or more Children | 0 (0.0%) | 0 (0.0%) |
| Total | 20 (27.8%) | 42 (26.8%) |
Income Below Poverty Among Married-Couple vs Single-Parent Households in Ashford
The poverty data for Ashford shows that 26 of the married-couple family households (6.7%) and 62 of the single-parent households (27.1%) are living below the poverty level. Within the married-couple family households, those with 3 or 4 children have the highest poverty rate, with 4 households (14.3%) falling below the poverty line. Among the single-parent households, those with 3 or 4 children have the highest poverty rate, with 17 household (100.0%) living below poverty.
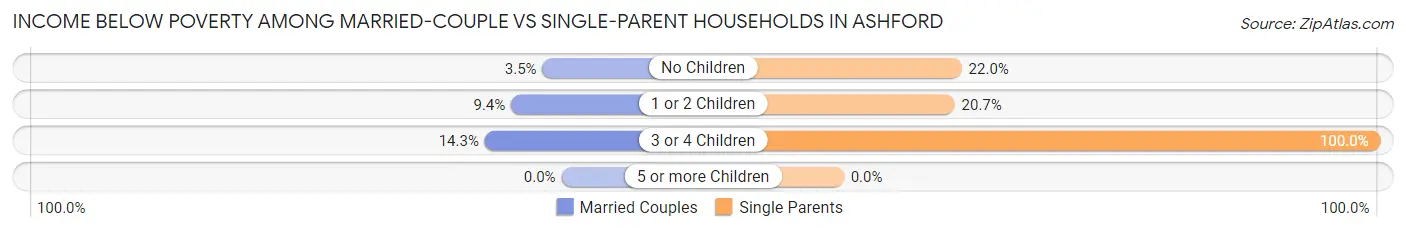
| Children | Married-Couple Families | Single-Parent Households |
| No Children | 7 (3.5%) | 20 (22.0%) |
| 1 or 2 Children | 15 (9.4%) | 25 (20.7%) |
| 3 or 4 Children | 4 (14.3%) | 17 (100.0%) |
| 5 or more Children | 0 (0.0%) | 0 (0.0%) |
| Total | 26 (6.7%) | 62 (27.1%) |
Race in Ashford
The most populous races in Ashford are White / Caucasian (1,709 | 69.0%), Black / African American (680 | 27.5%), and Hispanic or Latino (73 | 2.9%).
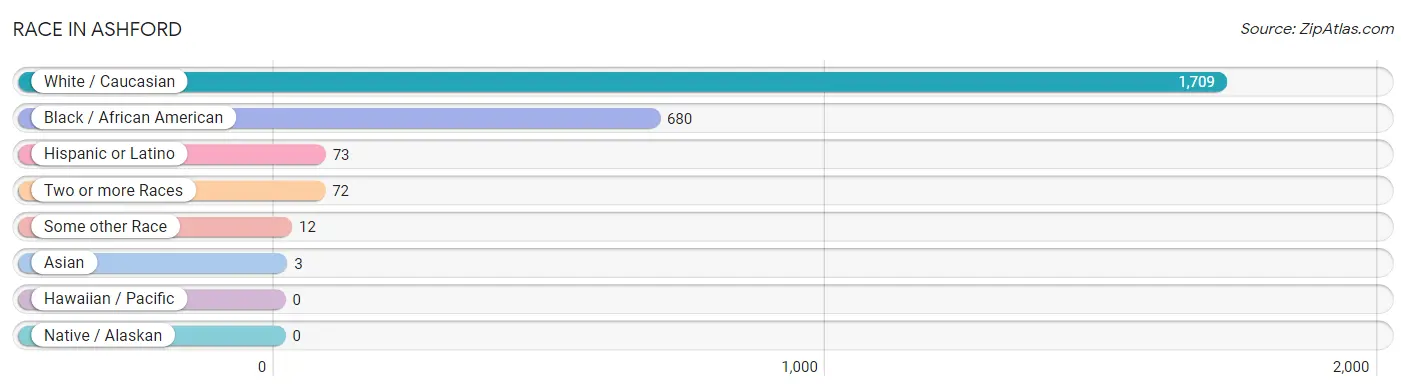
| Race | # Population | % Population |
| Asian | 3 | 0.1% |
| Black / African American | 680 | 27.5% |
| Hawaiian / Pacific | 0 | 0.0% |
| Hispanic or Latino | 73 | 2.9% |
| Native / Alaskan | 0 | 0.0% |
| White / Caucasian | 1,709 | 69.0% |
| Two or more Races | 72 | 2.9% |
| Some other Race | 12 | 0.5% |
| Total | 2,476 | 100.0% |
Ancestry in Ashford
The most populous ancestries reported in Ashford are American (447 | 18.0%), English (278 | 11.2%), German (134 | 5.4%), Irish (131 | 5.3%), and French (42 | 1.7%), together accounting for 41.7% of all Ashford residents.
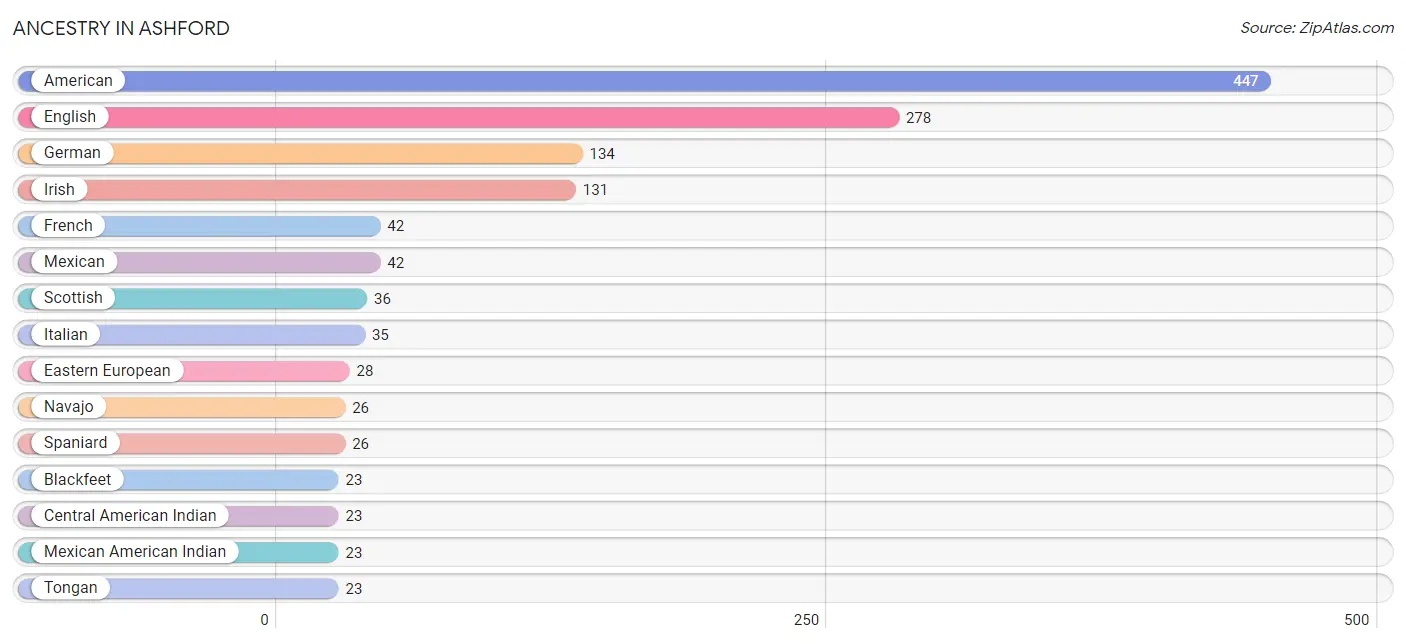
| Ancestry | # Population | % Population |
| African | 6 | 0.2% |
| American | 447 | 18.0% |
| Arab | 2 | 0.1% |
| Blackfeet | 23 | 0.9% |
| British | 3 | 0.1% |
| Central American | 2 | 0.1% |
| Central American Indian | 23 | 0.9% |
| Cherokee | 6 | 0.2% |
| Colombian | 3 | 0.1% |
| Creek | 3 | 0.1% |
| Dutch | 2 | 0.1% |
| Eastern European | 28 | 1.1% |
| English | 278 | 11.2% |
| European | 16 | 0.6% |
| French | 42 | 1.7% |
| French Canadian | 2 | 0.1% |
| German | 134 | 5.4% |
| Greek | 2 | 0.1% |
| Honduran | 2 | 0.1% |
| Indian (Asian) | 3 | 0.1% |
| Irish | 131 | 5.3% |
| Italian | 35 | 1.4% |
| Jamaican | 3 | 0.1% |
| Lebanese | 2 | 0.1% |
| Lithuanian | 4 | 0.2% |
| Mexican | 42 | 1.7% |
| Mexican American Indian | 23 | 0.9% |
| Navajo | 26 | 1.1% |
| Norwegian | 2 | 0.1% |
| Polish | 18 | 0.7% |
| Russian | 7 | 0.3% |
| Scandinavian | 4 | 0.2% |
| Scotch-Irish | 15 | 0.6% |
| Scottish | 36 | 1.5% |
| Slovak | 2 | 0.1% |
| South American | 3 | 0.1% |
| Spaniard | 26 | 1.1% |
| Subsaharan African | 6 | 0.2% |
| Swiss | 2 | 0.1% |
| Tongan | 23 | 0.9% |
| Welsh | 7 | 0.3% | View All 41 Rows |
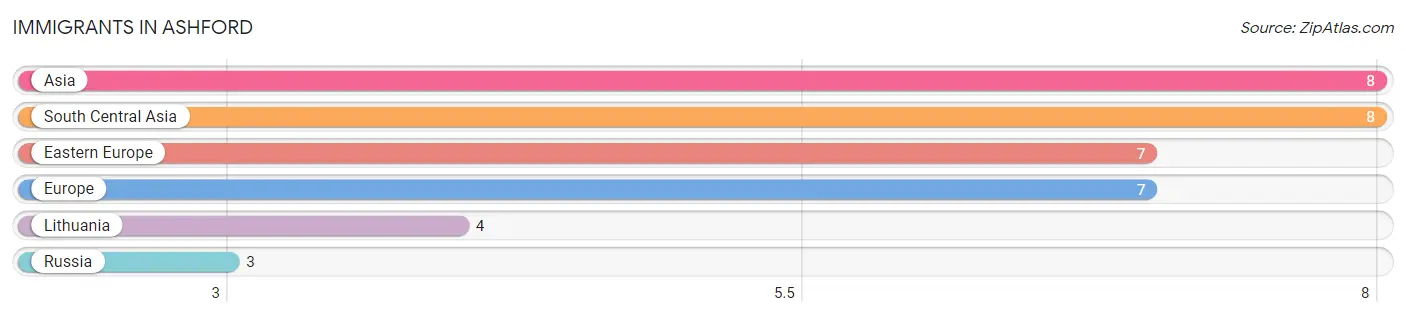
Immigrants in Ashford
The most numerous immigrant groups reported in Ashford came from Asia (8 | 0.3%), South Central Asia (8 | 0.3%), Eastern Europe (7 | 0.3%), Europe (7 | 0.3%), and Lithuania (4 | 0.2%), together accounting for 1.4% of all Ashford residents.
| Immigration Origin | # Population | % Population |
| Asia | 8 | 0.3% |
| Eastern Europe | 7 | 0.3% |
| Europe | 7 | 0.3% |
| Lithuania | 4 | 0.2% |
| Russia | 3 | 0.1% |
| South Central Asia | 8 | 0.3% | View All 6 Rows |
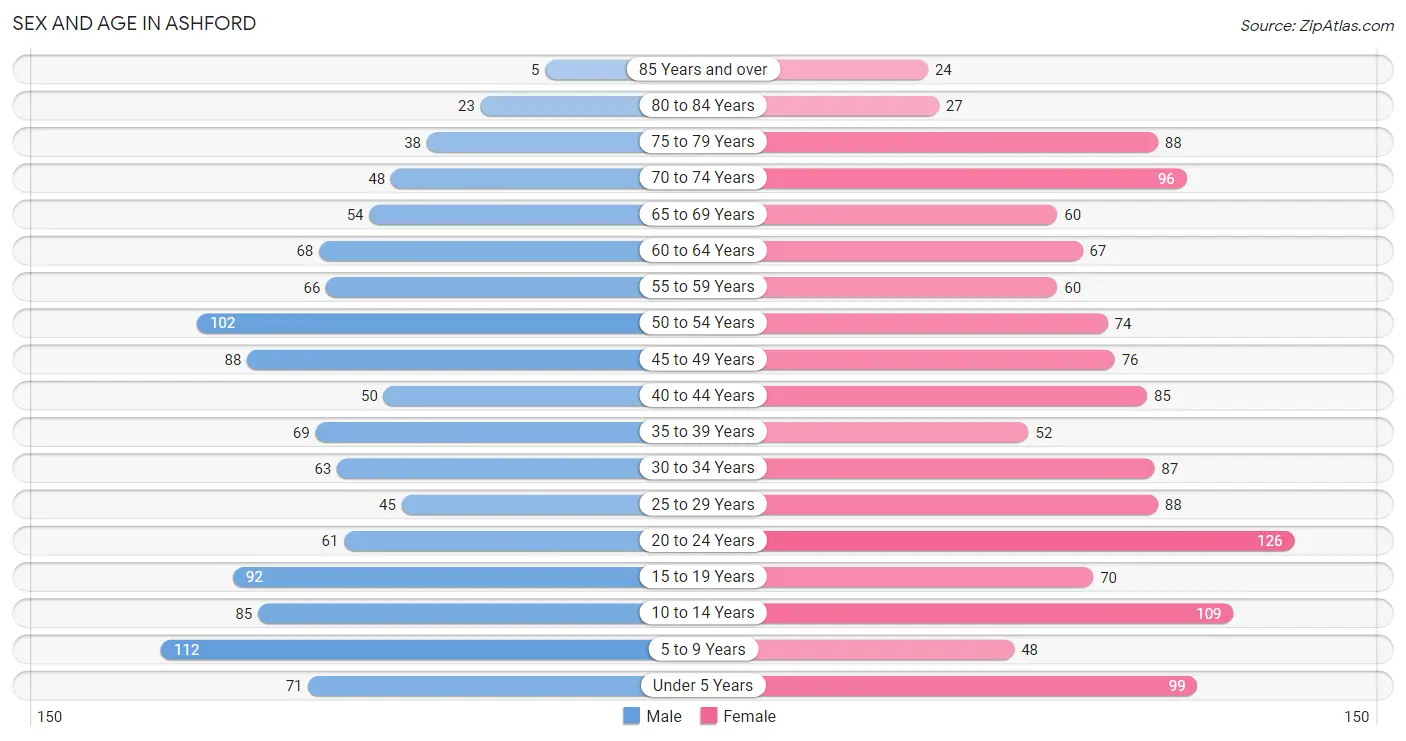
Sex and Age in Ashford
Sex and Age in Ashford
The most populous age groups in Ashford are 5 to 9 Years (112 | 9.8%) for men and 20 to 24 Years (126 | 9.4%) for women.
| Age Bracket | Male | Female |
| Under 5 Years | 71 (6.2%) | 99 (7.4%) |
| 5 to 9 Years | 112 (9.8%) | 48 (3.6%) |
| 10 to 14 Years | 85 (7.5%) | 109 (8.2%) |
| 15 to 19 Years | 92 (8.1%) | 70 (5.2%) |
| 20 to 24 Years | 61 (5.3%) | 126 (9.4%) |
| 25 to 29 Years | 45 (4.0%) | 88 (6.6%) |
| 30 to 34 Years | 63 (5.5%) | 87 (6.5%) |
| 35 to 39 Years | 69 (6.0%) | 52 (3.9%) |
| 40 to 44 Years | 50 (4.4%) | 85 (6.4%) |
| 45 to 49 Years | 88 (7.7%) | 76 (5.7%) |
| 50 to 54 Years | 102 (8.9%) | 74 (5.5%) |
| 55 to 59 Years | 66 (5.8%) | 60 (4.5%) |
| 60 to 64 Years | 68 (6.0%) | 67 (5.0%) |
| 65 to 69 Years | 54 (4.7%) | 60 (4.5%) |
| 70 to 74 Years | 48 (4.2%) | 96 (7.2%) |
| 75 to 79 Years | 38 (3.3%) | 88 (6.6%) |
| 80 to 84 Years | 23 (2.0%) | 27 (2.0%) |
| 85 Years and over | 5 (0.4%) | 24 (1.8%) |
| Total | 1,140 (100.0%) | 1,336 (100.0%) |
Families and Households in Ashford
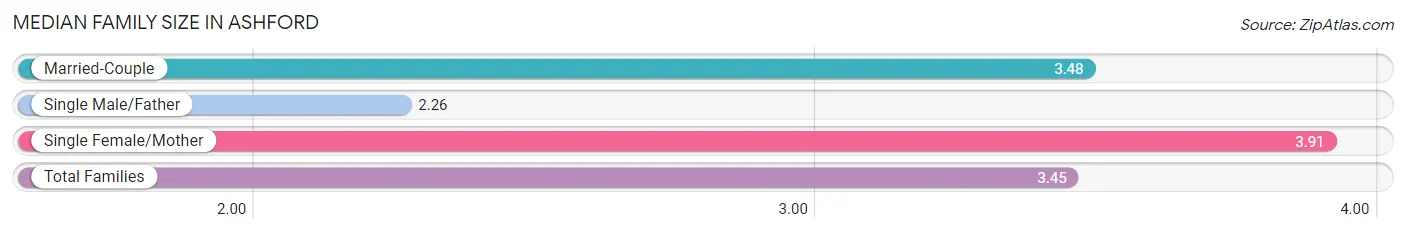
Median Family Size in Ashford
The median family size in Ashford is 3.45 persons per family, with single female/mother families (157 | 25.5%) accounting for the largest median family size of 3.91 persons per family. On the other hand, single male/father families (72 | 11.7%) represent the smallest median family size with 2.26 persons per family.
| Family Type | # Families | Family Size |
| Married-Couple | 386 (62.8%) | 3.48 |
| Single Male/Father | 72 (11.7%) | 2.26 |
| Single Female/Mother | 157 (25.5%) | 3.91 |
| Total Families | 615 (100.0%) | 3.45 |
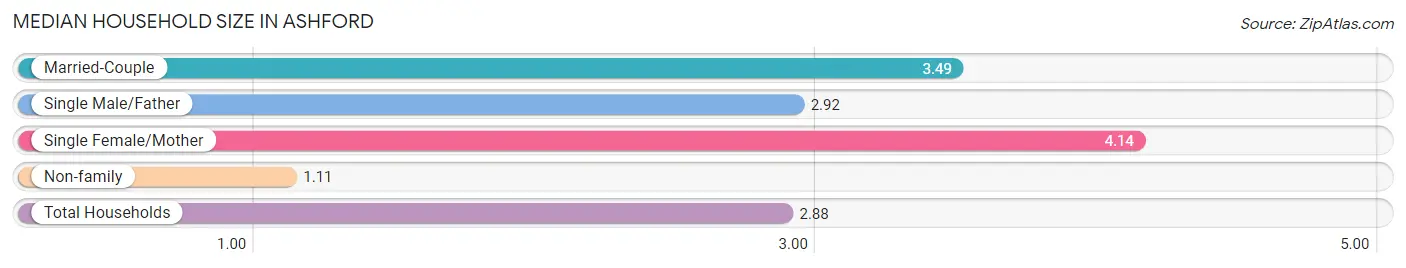
Median Household Size in Ashford
The median household size in Ashford is 2.88 persons per household, with single female/mother households (157 | 18.3%) accounting for the largest median household size of 4.14 persons per household. non-family households (244 | 28.4%) represent the smallest median household size with 1.11 persons per household.
| Household Type | # Households | Household Size |
| Married-Couple | 386 (44.9%) | 3.49 |
| Single Male/Father | 72 (8.4%) | 2.92 |
| Single Female/Mother | 157 (18.3%) | 4.14 |
| Non-family | 244 (28.4%) | 1.11 |
| Total Households | 859 (100.0%) | 2.88 |
Household Size by Marriage Status in Ashford
Out of a total of 859 households in Ashford, 615 (71.6%) are family households, while 244 (28.4%) are nonfamily households. The most numerous type of family households are 2-person households, comprising 260, and the most common type of nonfamily households are 1-person households, comprising 222.
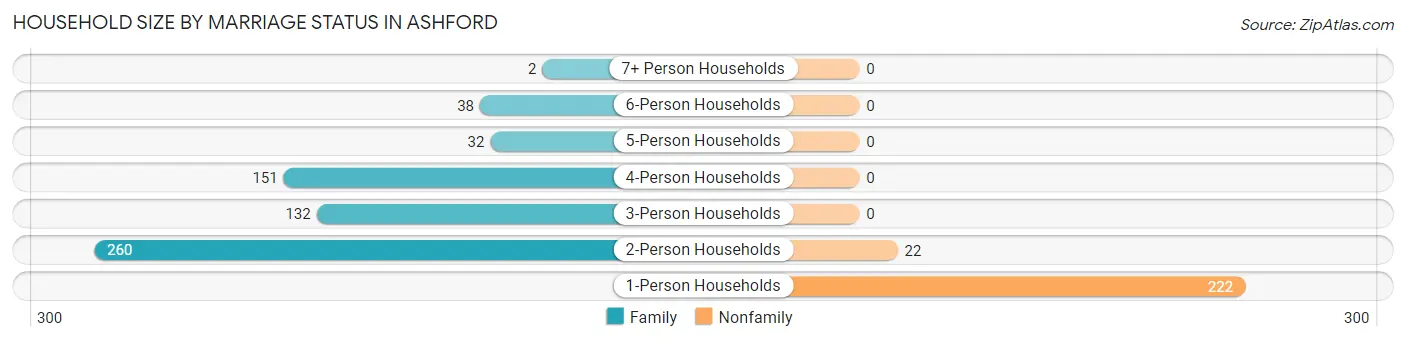
| Household Size | Family Households | Nonfamily Households |
| 1-Person Households | - | 222 (25.8%) |
| 2-Person Households | 260 (30.3%) | 22 (2.6%) |
| 3-Person Households | 132 (15.4%) | 0 (0.0%) |
| 4-Person Households | 151 (17.6%) | 0 (0.0%) |
| 5-Person Households | 32 (3.7%) | 0 (0.0%) |
| 6-Person Households | 38 (4.4%) | 0 (0.0%) |
| 7+ Person Households | 2 (0.2%) | 0 (0.0%) |
| Total | 615 (71.6%) | 244 (28.4%) |
Female Fertility in Ashford
Fertility by Age in Ashford
Average fertility rate in Ashford is 60.0 births per 1,000 women. Women in the age bracket of 20 to 34 years have the highest fertility rate with 106.0 births per 1,000 women. Women in the age bracket of 20 to 34 years acount for 88.9% of all women with births.
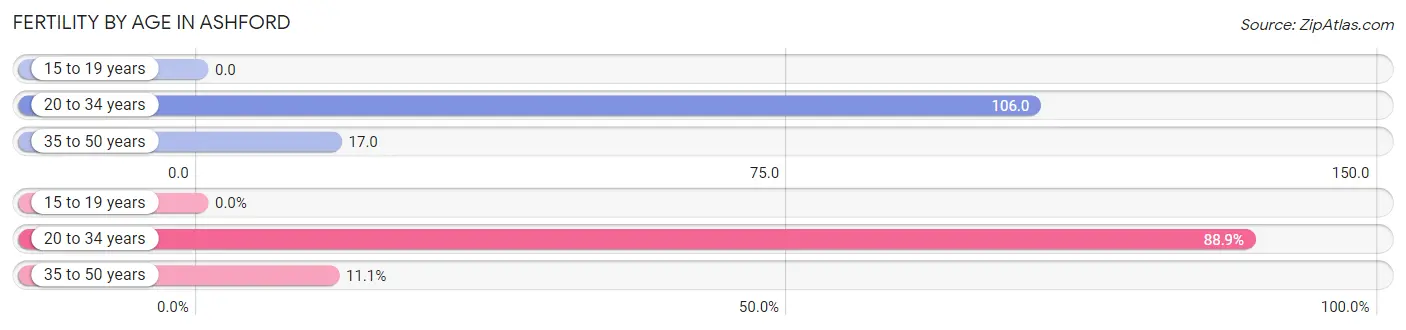
| Age Bracket | Women with Births | Births / 1,000 Women |
| 15 to 19 years | 0 (0.0%) | 0.0 |
| 20 to 34 years | 32 (88.9%) | 106.0 |
| 35 to 50 years | 4 (11.1%) | 17.0 |
| Total | 36 (100.0%) | 60.0 |
Fertility by Age by Marriage Status in Ashford
38.9% of women with births (36) in Ashford are married. The highest percentage of unmarried women with births falls into 20 to 34 years age bracket with 68.8% of them unmarried at the time of birth, while the lowest percentage of unmarried women with births belong to 35 to 50 years age bracket with 0.0% of them unmarried.
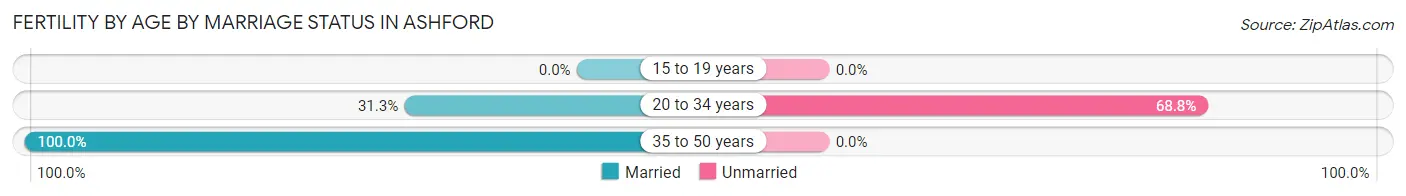
| Age Bracket | Married | Unmarried |
| 15 to 19 years | 0 (0.0%) | 0 (0.0%) |
| 20 to 34 years | 10 (31.2%) | 22 (68.8%) |
| 35 to 50 years | 4 (100.0%) | 0 (0.0%) |
| Total | 14 (38.9%) | 22 (61.1%) |
Fertility by Education in Ashford
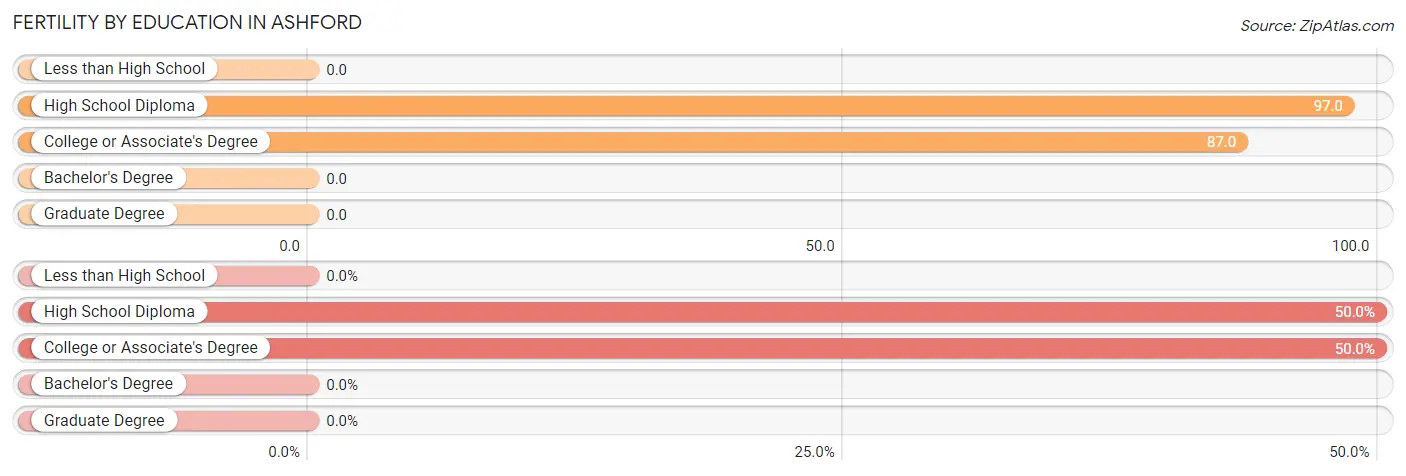
| Educational Attainment | Women with Births | Births / 1,000 Women |
| Less than High School | 0 (0.0%) | 0.0 |
| High School Diploma | 18 (50.0%) | 97.0 |
| College or Associate's Degree | 18 (50.0%) | 87.0 |
| Bachelor's Degree | 0 (0.0%) | 0.0 |
| Graduate Degree | 0 (0.0%) | 0.0 |
| Total | 36 (100.0%) | 60.0 |
Fertility by Education by Marriage Status in Ashford
61.1% of women with births in Ashford are unmarried. Women with the educational attainment of college or associate's degree are most likely to be married with 61.1% of them married at childbirth, while women with the educational attainment of high school diploma are least likely to be married with 83.3% of them unmarried at childbirth.
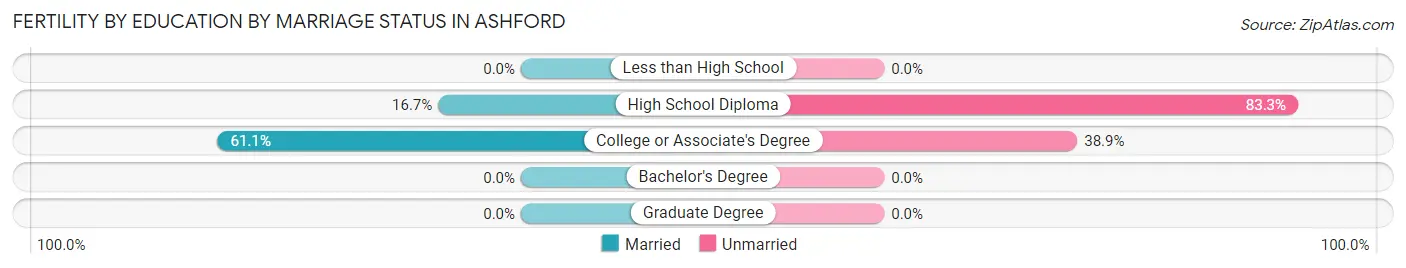
| Educational Attainment | Married | Unmarried |
| Less than High School | 0 (0.0%) | 0 (0.0%) |
| High School Diploma | 3 (16.7%) | 15 (83.3%) |
| College or Associate's Degree | 11 (61.1%) | 7 (38.9%) |
| Bachelor's Degree | 0 (0.0%) | 0 (0.0%) |
| Graduate Degree | 0 (0.0%) | 0 (0.0%) |
| Total | 14 (38.9%) | 22 (61.1%) |
Employment Characteristics in Ashford
Employment by Class of Employer in Ashford
Among the 946 employed individuals in Ashford, private company employees (688 | 72.7%), local government employees (80 | 8.5%), and not-for-profit organizations (49 | 5.2%) make up the most common classes of employment.
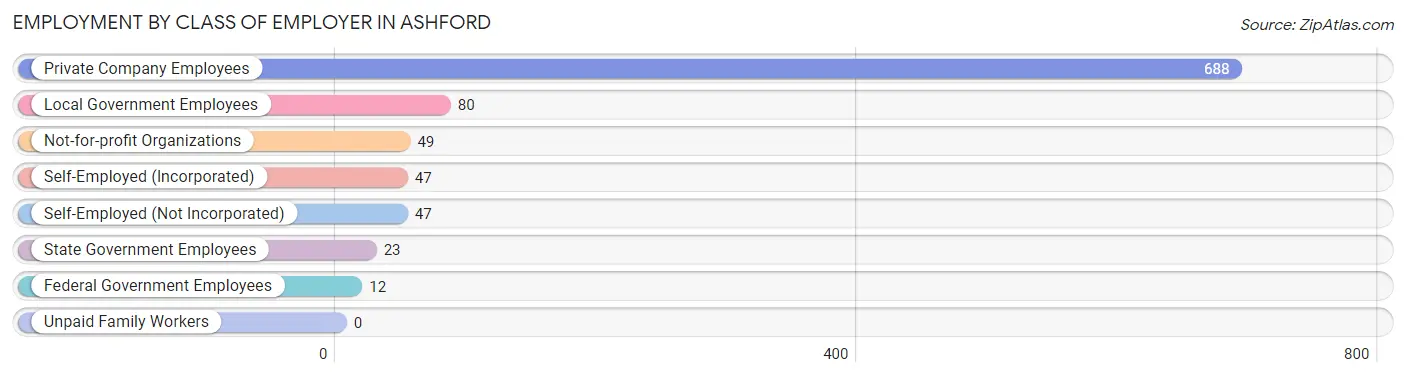
| Employer Class | # Employees | % Employees |
| Private Company Employees | 688 | 72.7% |
| Self-Employed (Incorporated) | 47 | 5.0% |
| Self-Employed (Not Incorporated) | 47 | 5.0% |
| Not-for-profit Organizations | 49 | 5.2% |
| Local Government Employees | 80 | 8.5% |
| State Government Employees | 23 | 2.4% |
| Federal Government Employees | 12 | 1.3% |
| Unpaid Family Workers | 0 | 0.0% |
| Total | 946 | 100.0% |
Employment Status by Age in Ashford
According to the labor force statistics for Ashford, out of the total population over 16 years of age (1,923), 52.4% or 1,008 individuals are in the labor force, with 3.8% or 38 of them unemployed. The age group with the highest labor force participation rate is 30 to 34 years, with 86.7% or 130 individuals in the labor force. Within the labor force, the 16 to 19 years age range has the highest percentage of unemployed individuals, with 17.1% or 7 of them being unemployed.
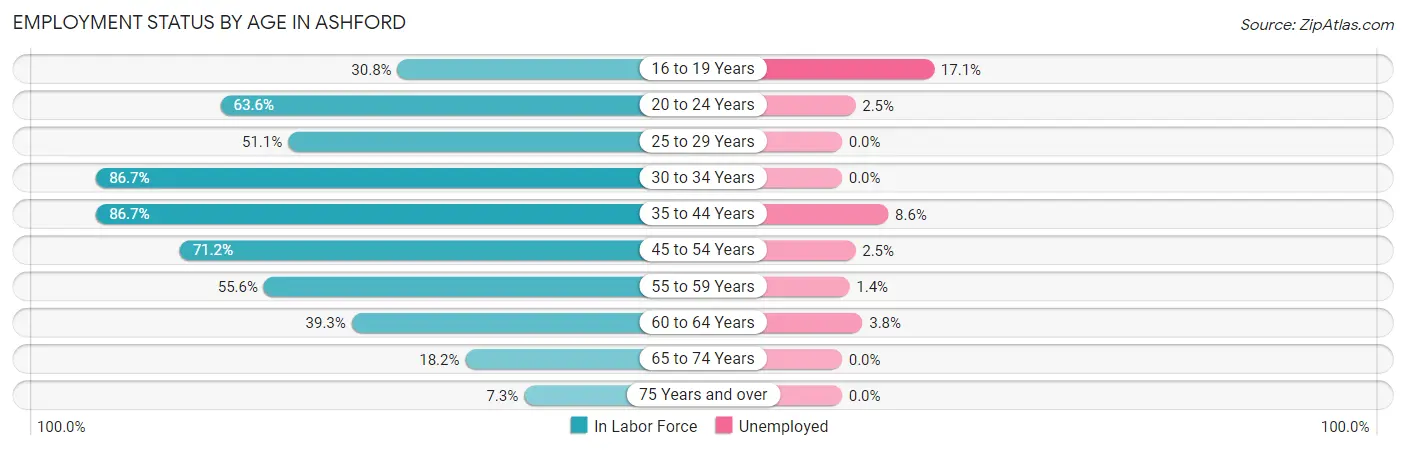
| Age Bracket | In Labor Force | Unemployed |
| 16 to 19 Years | 41 (30.8%) | 7 (17.1%) |
| 20 to 24 Years | 119 (63.6%) | 3 (2.5%) |
| 25 to 29 Years | 68 (51.1%) | 0 (0.0%) |
| 30 to 34 Years | 130 (86.7%) | 0 (0.0%) |
| 35 to 44 Years | 222 (86.7%) | 19 (8.6%) |
| 45 to 54 Years | 242 (71.2%) | 6 (2.5%) |
| 55 to 59 Years | 70 (55.6%) | 1 (1.4%) |
| 60 to 64 Years | 53 (39.3%) | 2 (3.8%) |
| 65 to 74 Years | 47 (18.2%) | 0 (0.0%) |
| 75 Years and over | 15 (7.3%) | 0 (0.0%) |
| Total | 1,008 (52.4%) | 38 (3.8%) |
Employment Status by Educational Attainment in Ashford
According to labor force statistics for Ashford, 68.9% of individuals (785) out of the total population between 25 and 64 years of age (1,140) are in the labor force, with 3.6% or 28 of them being unemployed. The group with the highest labor force participation rate are those with the educational attainment of college / associate degree, with 83.3% or 334 individuals in the labor force. Within the labor force, individuals with less than high school education have the highest percentage of unemployment, with 7.9% or 3 of them being unemployed.
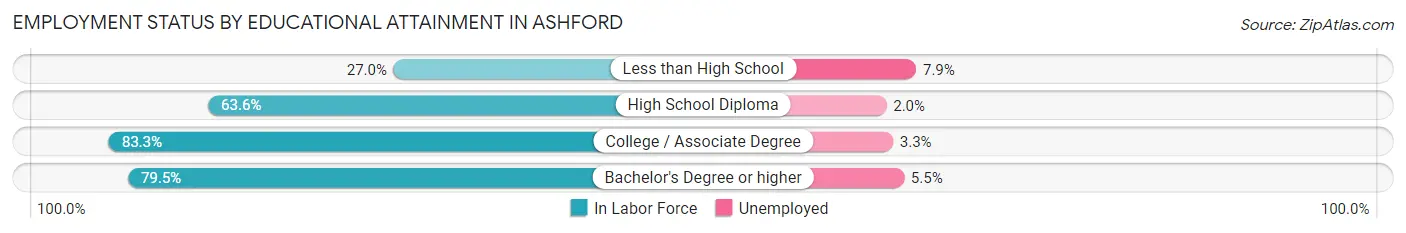
| Educational Attainment | In Labor Force | Unemployed |
| Less than High School | 38 (27.0%) | 11 (7.9%) |
| High School Diploma | 250 (63.6%) | 8 (2.0%) |
| College / Associate Degree | 334 (83.3%) | 13 (3.3%) |
| Bachelor's Degree or higher | 163 (79.5%) | 11 (5.5%) |
| Total | 785 (68.9%) | 41 (3.6%) |
Employment Occupations by Sex in Ashford
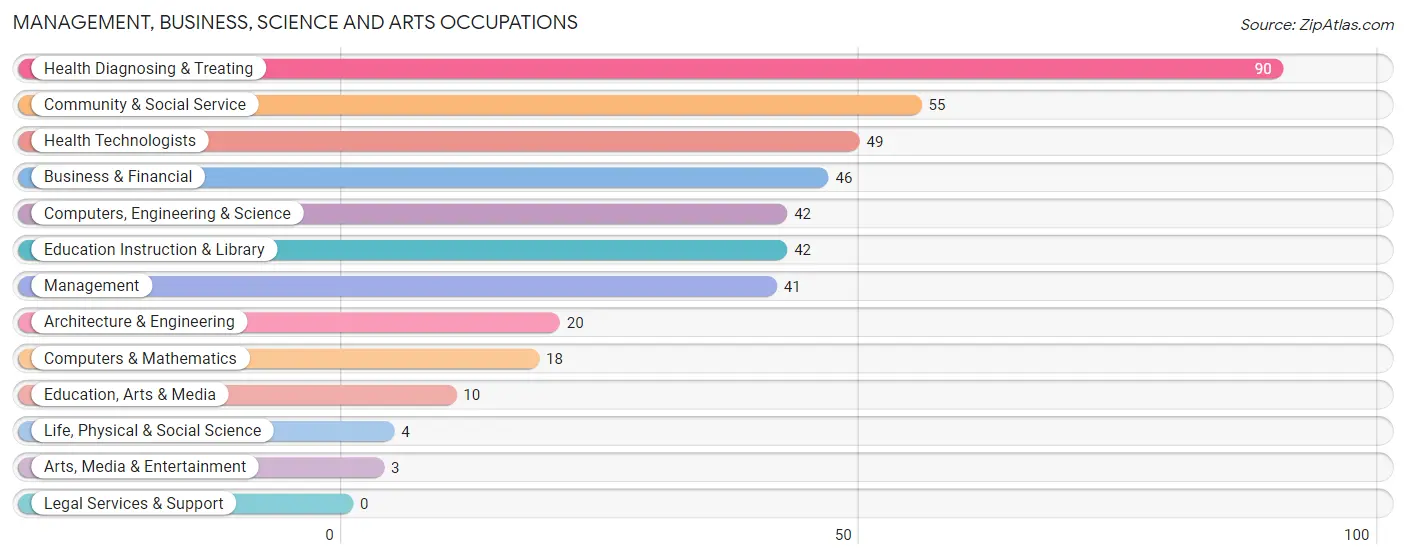
Management, Business, Science and Arts Occupations
The most common Management, Business, Science and Arts occupations in Ashford are Health Diagnosing & Treating (90 | 9.3%), Community & Social Service (55 | 5.7%), Health Technologists (49 | 5.1%), Business & Financial (46 | 4.8%), and Computers, Engineering & Science (42 | 4.3%).
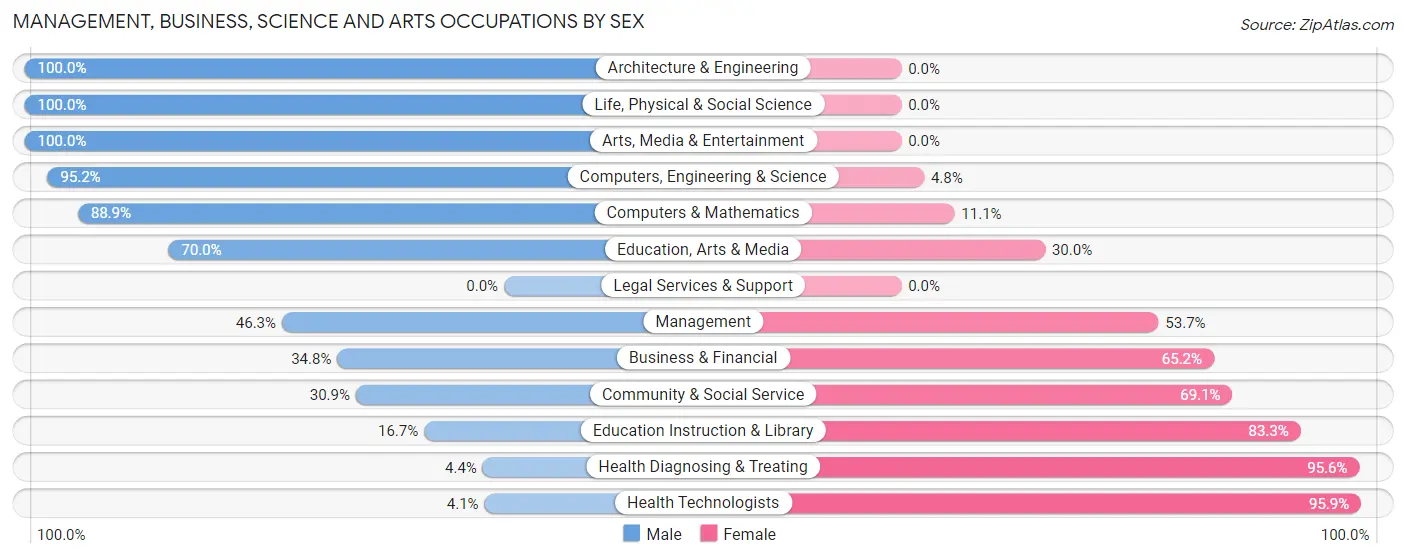
Management, Business, Science and Arts Occupations by Sex
Within the Management, Business, Science and Arts occupations in Ashford, the most male-oriented occupations are Architecture & Engineering (100.0%), Life, Physical & Social Science (100.0%), and Arts, Media & Entertainment (100.0%), while the most female-oriented occupations are Health Technologists (95.9%), Health Diagnosing & Treating (95.6%), and Education Instruction & Library (83.3%).
| Occupation | Male | Female |
| Management | 19 (46.3%) | 22 (53.7%) |
| Business & Financial | 16 (34.8%) | 30 (65.2%) |
| Computers, Engineering & Science | 40 (95.2%) | 2 (4.8%) |
| Computers & Mathematics | 16 (88.9%) | 2 (11.1%) |
| Architecture & Engineering | 20 (100.0%) | 0 (0.0%) |
| Life, Physical & Social Science | 4 (100.0%) | 0 (0.0%) |
| Community & Social Service | 17 (30.9%) | 38 (69.1%) |
| Education, Arts & Media | 7 (70.0%) | 3 (30.0%) |
| Legal Services & Support | 0 (0.0%) | 0 (0.0%) |
| Education Instruction & Library | 7 (16.7%) | 35 (83.3%) |
| Arts, Media & Entertainment | 3 (100.0%) | 0 (0.0%) |
| Health Diagnosing & Treating | 4 (4.4%) | 86 (95.6%) |
| Health Technologists | 2 (4.1%) | 47 (95.9%) |
| Total (Category) | 96 (35.0%) | 178 (65.0%) |
| Total (Overall) | 452 (46.7%) | 517 (53.3%) |
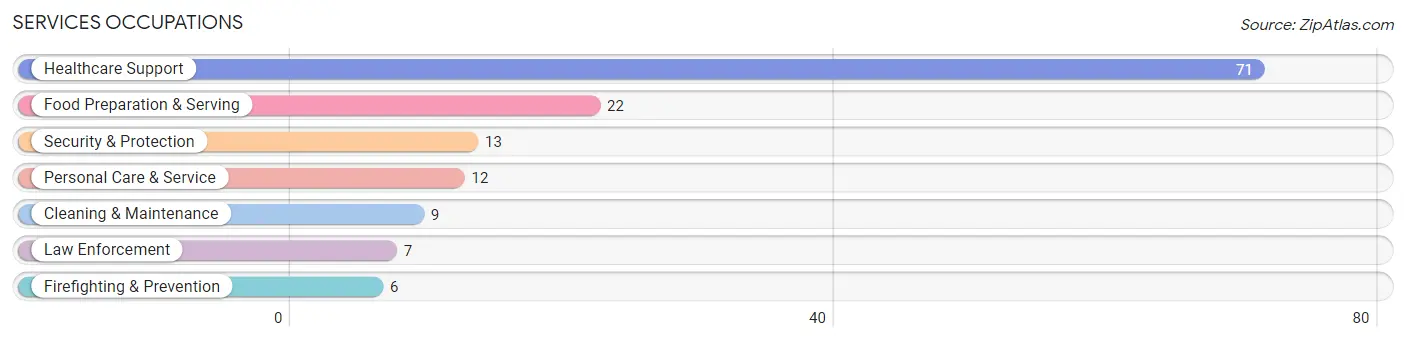
Services Occupations
The most common Services occupations in Ashford are Healthcare Support (71 | 7.3%), Food Preparation & Serving (22 | 2.3%), Security & Protection (13 | 1.3%), Personal Care & Service (12 | 1.2%), and Cleaning & Maintenance (9 | 0.9%).
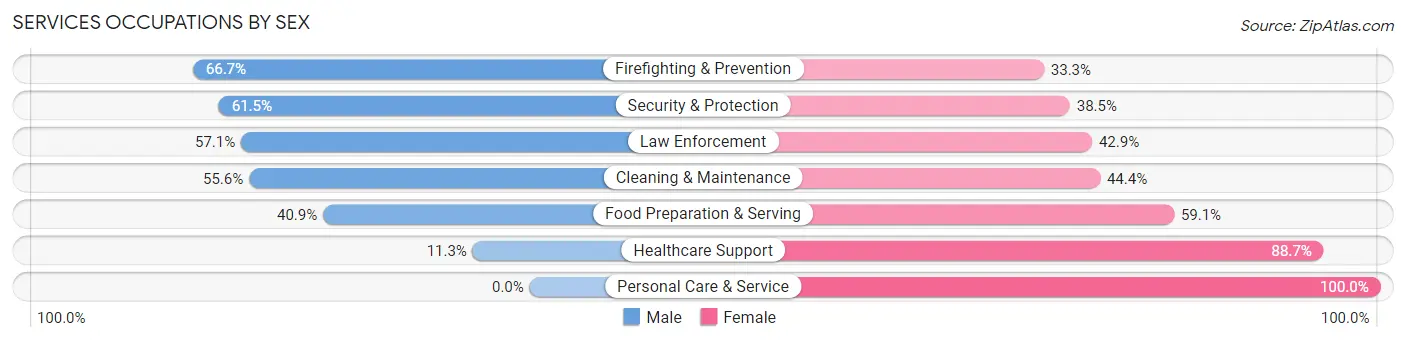
Services Occupations by Sex
Within the Services occupations in Ashford, the most male-oriented occupations are Firefighting & Prevention (66.7%), Security & Protection (61.5%), and Law Enforcement (57.1%), while the most female-oriented occupations are Personal Care & Service (100.0%), Healthcare Support (88.7%), and Food Preparation & Serving (59.1%).
| Occupation | Male | Female |
| Healthcare Support | 8 (11.3%) | 63 (88.7%) |
| Security & Protection | 8 (61.5%) | 5 (38.5%) |
| Firefighting & Prevention | 4 (66.7%) | 2 (33.3%) |
| Law Enforcement | 4 (57.1%) | 3 (42.9%) |
| Food Preparation & Serving | 9 (40.9%) | 13 (59.1%) |
| Cleaning & Maintenance | 5 (55.6%) | 4 (44.4%) |
| Personal Care & Service | 0 (0.0%) | 12 (100.0%) |
| Total (Category) | 30 (23.6%) | 97 (76.4%) |
| Total (Overall) | 452 (46.7%) | 517 (53.3%) |
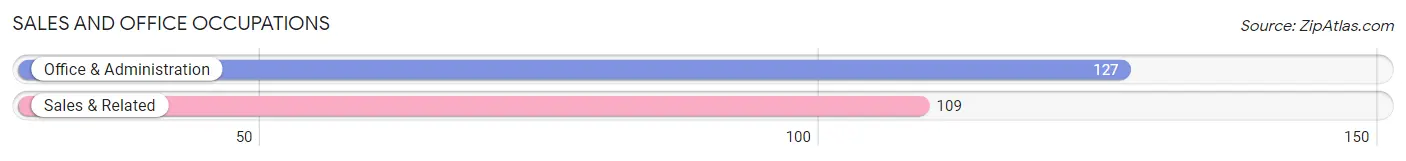
Sales and Office Occupations
The most common Sales and Office occupations in Ashford are Office & Administration (127 | 13.1%), and Sales & Related (109 | 11.3%).
Sales and Office Occupations by Sex
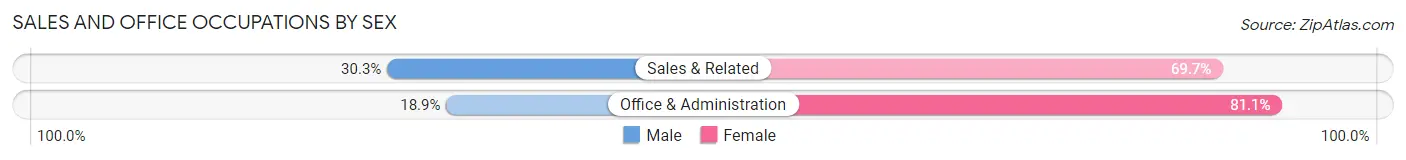
| Occupation | Male | Female |
| Sales & Related | 33 (30.3%) | 76 (69.7%) |
| Office & Administration | 24 (18.9%) | 103 (81.1%) |
| Total (Category) | 57 (24.1%) | 179 (75.8%) |
| Total (Overall) | 452 (46.7%) | 517 (53.3%) |
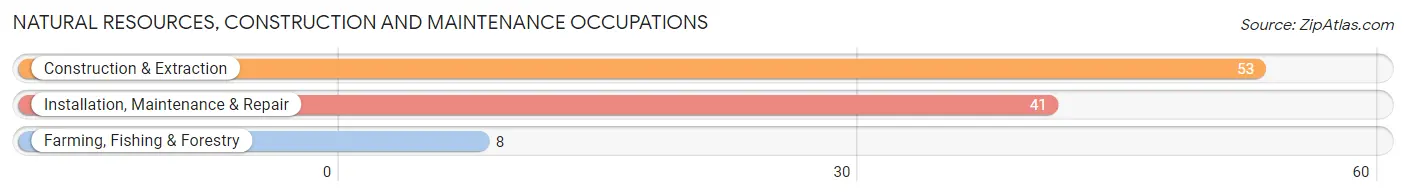
Natural Resources, Construction and Maintenance Occupations
The most common Natural Resources, Construction and Maintenance occupations in Ashford are Construction & Extraction (53 | 5.5%), Installation, Maintenance & Repair (41 | 4.2%), and Farming, Fishing & Forestry (8 | 0.8%).
Natural Resources, Construction and Maintenance Occupations by Sex
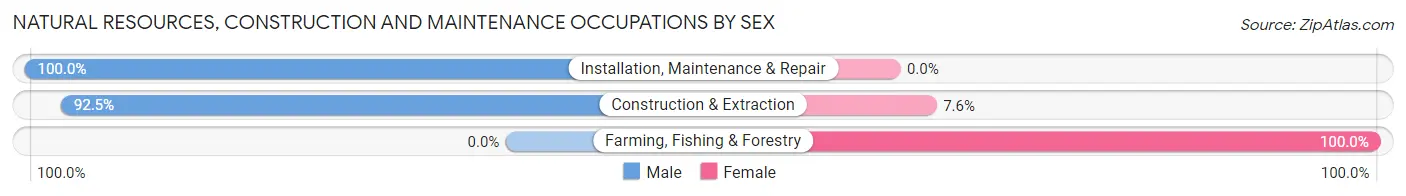
| Occupation | Male | Female |
| Farming, Fishing & Forestry | 0 (0.0%) | 8 (100.0%) |
| Construction & Extraction | 49 (92.4%) | 4 (7.5%) |
| Installation, Maintenance & Repair | 41 (100.0%) | 0 (0.0%) |
| Total (Category) | 90 (88.2%) | 12 (11.8%) |
| Total (Overall) | 452 (46.7%) | 517 (53.3%) |
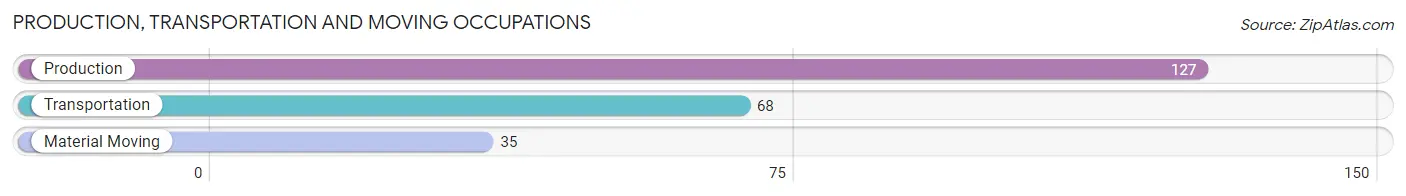
Production, Transportation and Moving Occupations
The most common Production, Transportation and Moving occupations in Ashford are Production (127 | 13.1%), Transportation (68 | 7.0%), and Material Moving (35 | 3.6%).
Production, Transportation and Moving Occupations by Sex
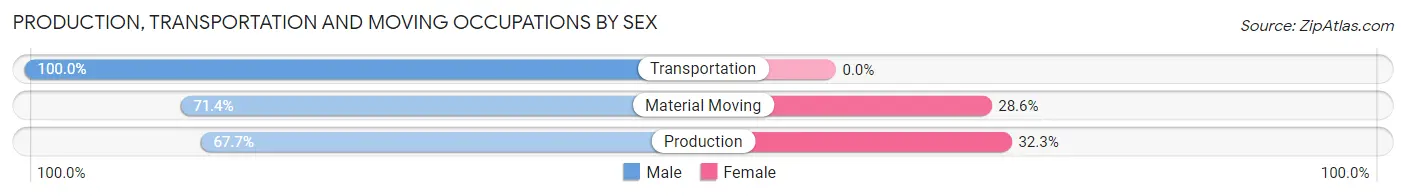
| Occupation | Male | Female |
| Production | 86 (67.7%) | 41 (32.3%) |
| Transportation | 68 (100.0%) | 0 (0.0%) |
| Material Moving | 25 (71.4%) | 10 (28.6%) |
| Total (Category) | 179 (77.8%) | 51 (22.2%) |
| Total (Overall) | 452 (46.7%) | 517 (53.3%) |
Employment Industries by Sex in Ashford
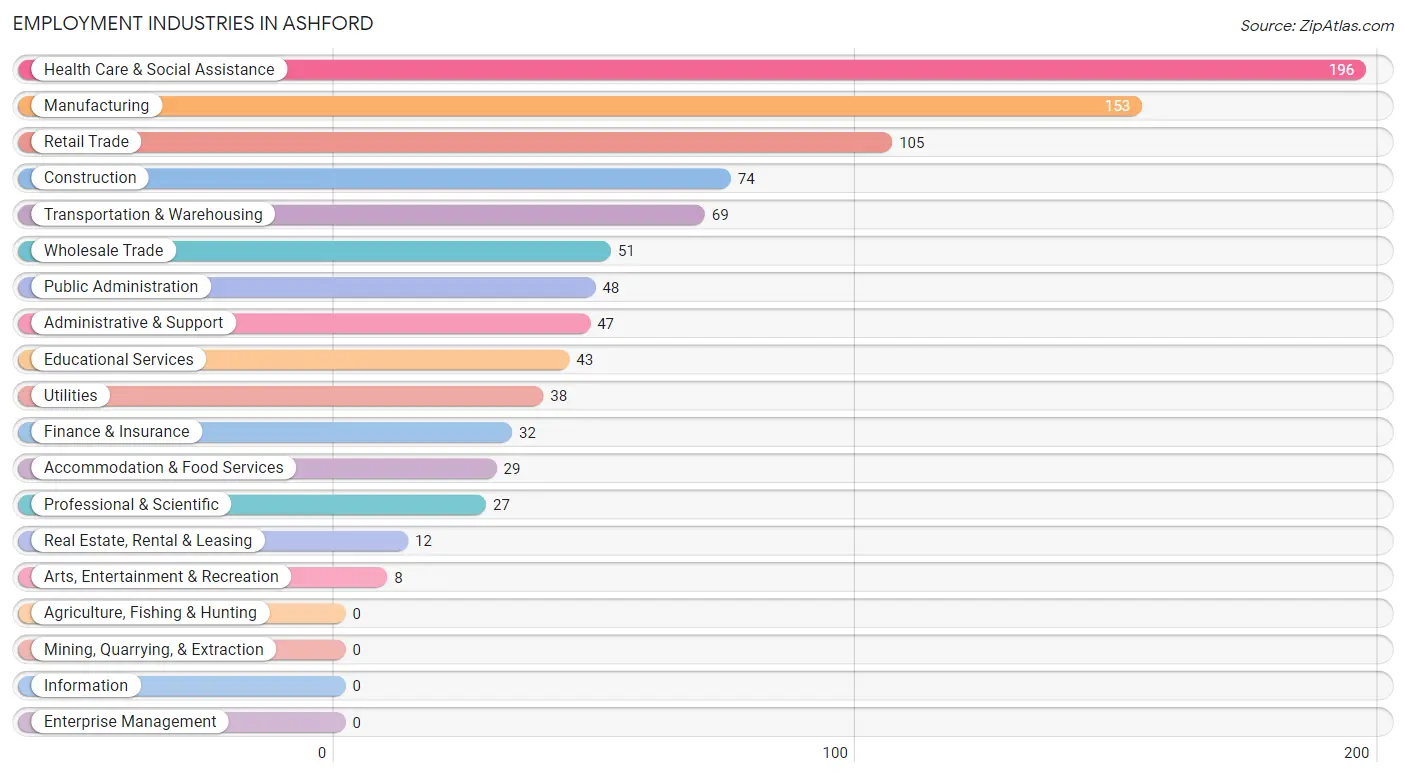
Employment Industries in Ashford
The major employment industries in Ashford include Health Care & Social Assistance (196 | 20.2%), Manufacturing (153 | 15.8%), Retail Trade (105 | 10.8%), Construction (74 | 7.6%), and Transportation & Warehousing (69 | 7.1%).
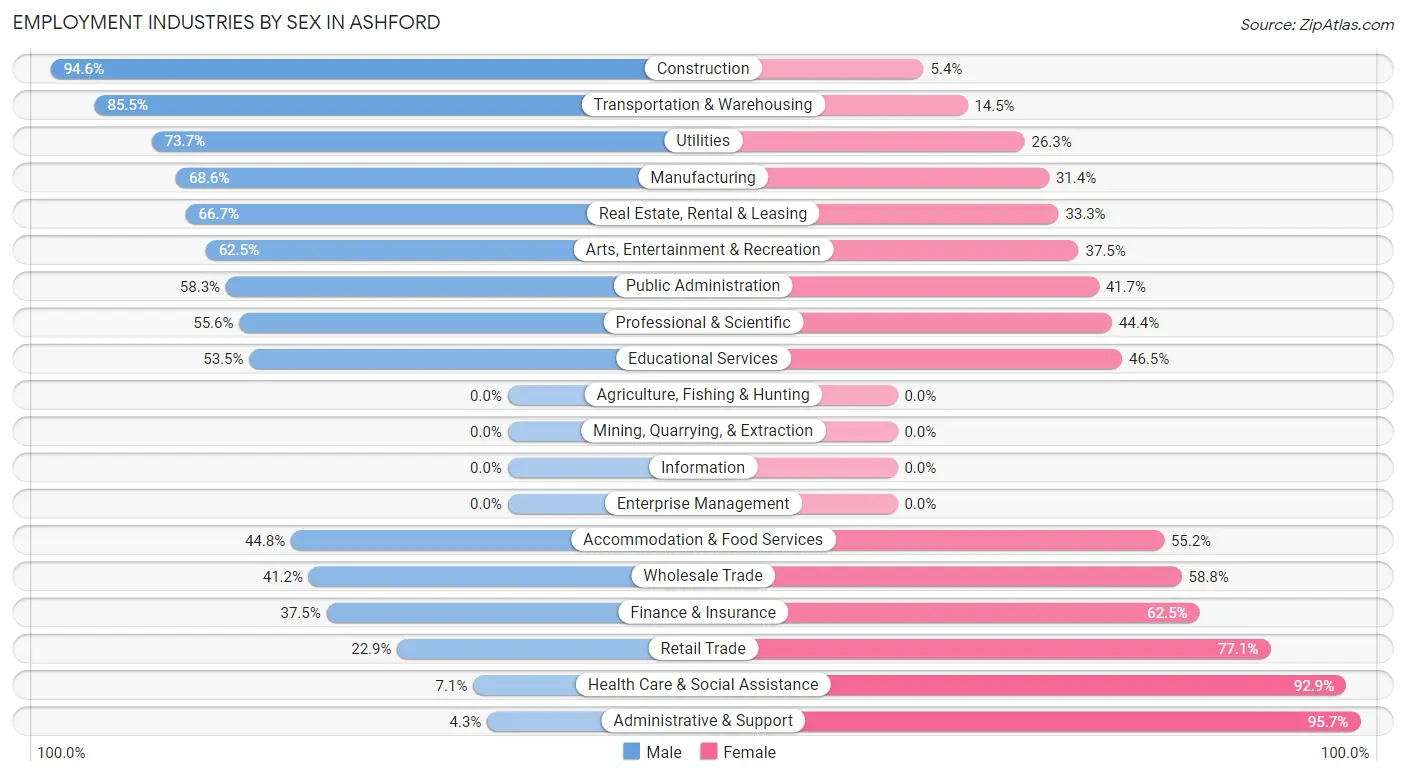
Employment Industries by Sex in Ashford
The Ashford industries that see more men than women are Construction (94.6%), Transportation & Warehousing (85.5%), and Utilities (73.7%), whereas the industries that tend to have a higher number of women are Administrative & Support (95.7%), Health Care & Social Assistance (92.9%), and Retail Trade (77.1%).
| Industry | Male | Female |
| Agriculture, Fishing & Hunting | 0 (0.0%) | 0 (0.0%) |
| Mining, Quarrying, & Extraction | 0 (0.0%) | 0 (0.0%) |
| Construction | 70 (94.6%) | 4 (5.4%) |
| Manufacturing | 105 (68.6%) | 48 (31.4%) |
| Wholesale Trade | 21 (41.2%) | 30 (58.8%) |
| Retail Trade | 24 (22.9%) | 81 (77.1%) |
| Transportation & Warehousing | 59 (85.5%) | 10 (14.5%) |
| Utilities | 28 (73.7%) | 10 (26.3%) |
| Information | 0 (0.0%) | 0 (0.0%) |
| Finance & Insurance | 12 (37.5%) | 20 (62.5%) |
| Real Estate, Rental & Leasing | 8 (66.7%) | 4 (33.3%) |
| Professional & Scientific | 15 (55.6%) | 12 (44.4%) |
| Enterprise Management | 0 (0.0%) | 0 (0.0%) |
| Administrative & Support | 2 (4.3%) | 45 (95.7%) |
| Educational Services | 23 (53.5%) | 20 (46.5%) |
| Health Care & Social Assistance | 14 (7.1%) | 182 (92.9%) |
| Arts, Entertainment & Recreation | 5 (62.5%) | 3 (37.5%) |
| Accommodation & Food Services | 13 (44.8%) | 16 (55.2%) |
| Public Administration | 28 (58.3%) | 20 (41.7%) |
| Total | 452 (46.7%) | 517 (53.3%) |
Education in Ashford
School Enrollment in Ashford
The most common levels of schooling among the 647 students in Ashford are middle school (195 | 30.1%), high school (115 | 17.8%), and elementary school (103 | 15.9%).
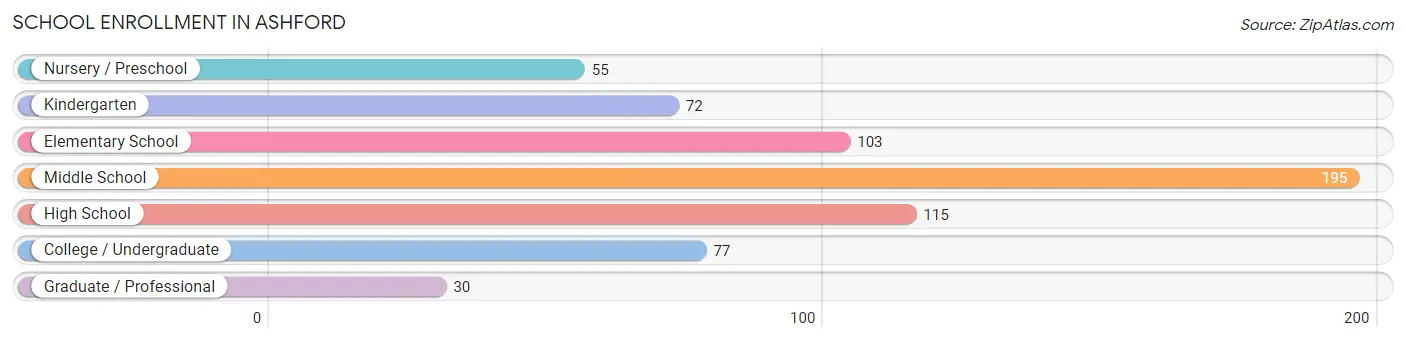
| School Level | # Students | % Students |
| Nursery / Preschool | 55 | 8.5% |
| Kindergarten | 72 | 11.1% |
| Elementary School | 103 | 15.9% |
| Middle School | 195 | 30.1% |
| High School | 115 | 17.8% |
| College / Undergraduate | 77 | 11.9% |
| Graduate / Professional | 30 | 4.6% |
| Total | 647 | 100.0% |
School Enrollment by Age by Funding Source in Ashford
Out of a total of 647 students who are enrolled in schools in Ashford, 170 (26.3%) attend a private institution, while the remaining 477 (73.7%) are enrolled in public schools. The age group of 35 years and over has the highest likelihood of being enrolled in private schools, with 16 (61.5% in the age bracket) enrolled. Conversely, the age group of 10 to 14 year olds has the lowest likelihood of being enrolled in a private school, with 161 (84.3% in the age bracket) attending a public institution.
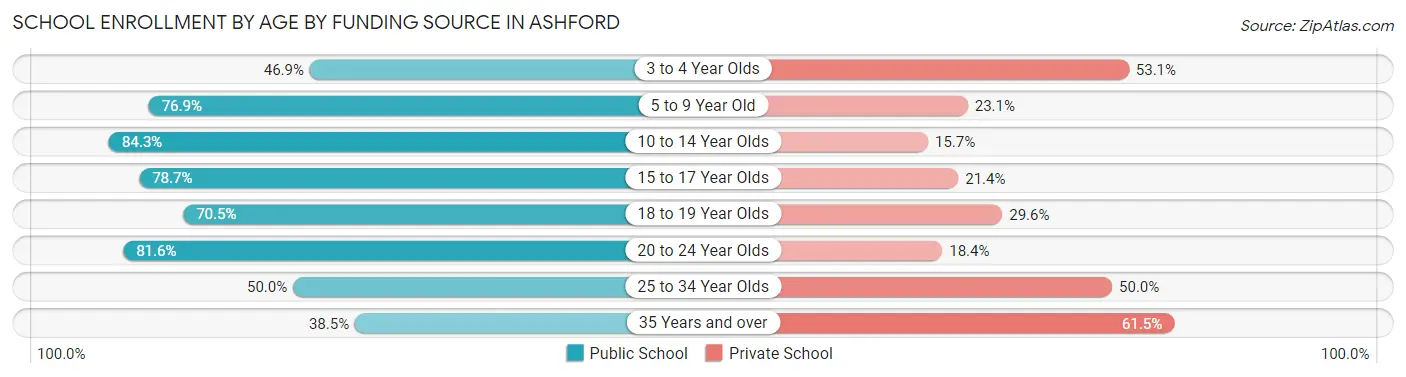
| Age Bracket | Public School | Private School |
| 3 to 4 Year Olds | 30 (46.9%) | 34 (53.1%) |
| 5 to 9 Year Old | 123 (76.9%) | 37 (23.1%) |
| 10 to 14 Year Olds | 161 (84.3%) | 30 (15.7%) |
| 15 to 17 Year Olds | 70 (78.6%) | 19 (21.3%) |
| 18 to 19 Year Olds | 31 (70.5%) | 13 (29.5%) |
| 20 to 24 Year Olds | 40 (81.6%) | 9 (18.4%) |
| 25 to 34 Year Olds | 12 (50.0%) | 12 (50.0%) |
| 35 Years and over | 10 (38.5%) | 16 (61.5%) |
| Total | 477 (73.7%) | 170 (26.3%) |
Educational Attainment by Field of Study in Ashford
Education (44 | 15.3%), liberal arts & history (39 | 13.5%), bio, nature & agricultural (31 | 10.8%), social sciences (31 | 10.8%), and science & technology (31 | 10.8%) are the most common fields of study among 288 individuals in Ashford who have obtained a bachelor's degree or higher.
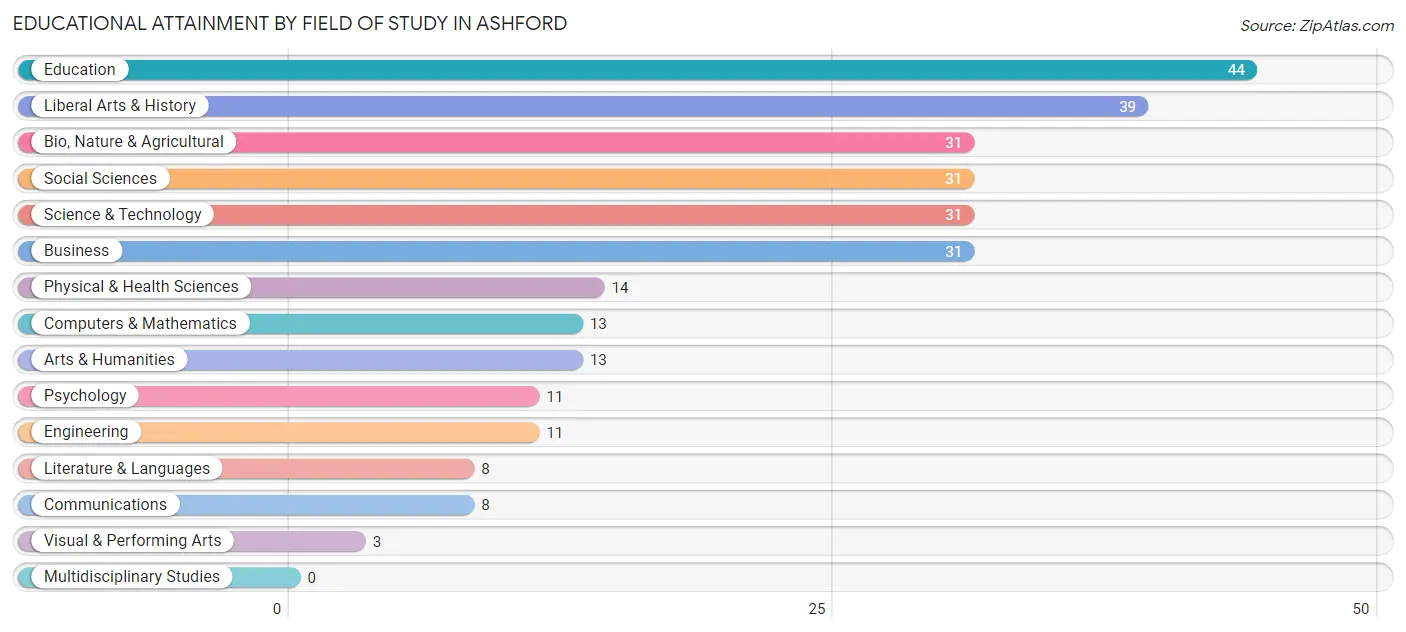
| Field of Study | # Graduates | % Graduates |
| Computers & Mathematics | 13 | 4.5% |
| Bio, Nature & Agricultural | 31 | 10.8% |
| Physical & Health Sciences | 14 | 4.9% |
| Psychology | 11 | 3.8% |
| Social Sciences | 31 | 10.8% |
| Engineering | 11 | 3.8% |
| Multidisciplinary Studies | 0 | 0.0% |
| Science & Technology | 31 | 10.8% |
| Business | 31 | 10.8% |
| Education | 44 | 15.3% |
| Literature & Languages | 8 | 2.8% |
| Liberal Arts & History | 39 | 13.5% |
| Visual & Performing Arts | 3 | 1.0% |
| Communications | 8 | 2.8% |
| Arts & Humanities | 13 | 4.5% |
| Total | 288 | 100.0% |
Transportation & Commute in Ashford
Vehicle Availability by Sex in Ashford
The most prevalent vehicle ownership categories in Ashford are males with 2 vehicles (136, accounting for 30.1%) and females with 2 vehicles (191, making up 27.5%).
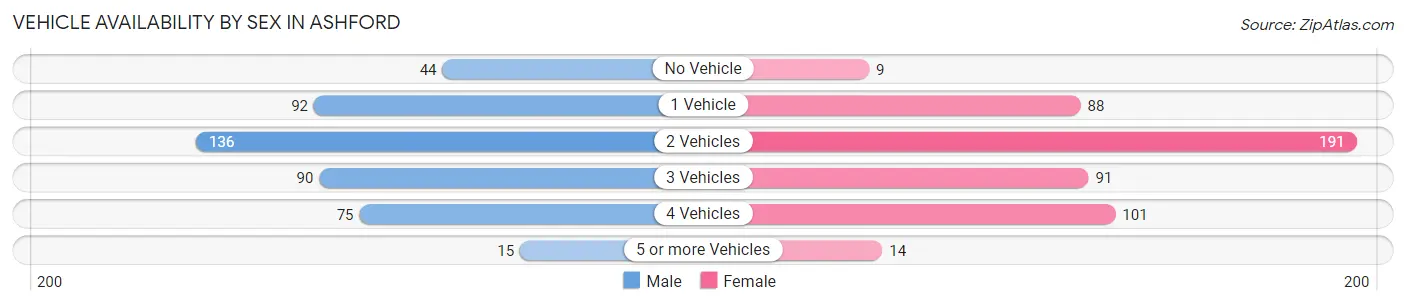
| Vehicles Available | Male | Female |
| No Vehicle | 44 (9.7%) | 9 (1.8%) |
| 1 Vehicle | 92 (20.3%) | 88 (17.8%) |
| 2 Vehicles | 136 (30.1%) | 191 (38.7%) |
| 3 Vehicles | 90 (19.9%) | 91 (18.4%) |
| 4 Vehicles | 75 (16.6%) | 101 (20.4%) |
| 5 or more Vehicles | 15 (3.3%) | 14 (2.8%) |
| Total | 452 (100.0%) | 494 (100.0%) |
Commute Time in Ashford
The most frequently occuring commute durations in Ashford are 15 to 19 minutes (195 commuters, 21.3%), 30 to 34 minutes (171 commuters, 18.7%), and 20 to 24 minutes (163 commuters, 17.8%).
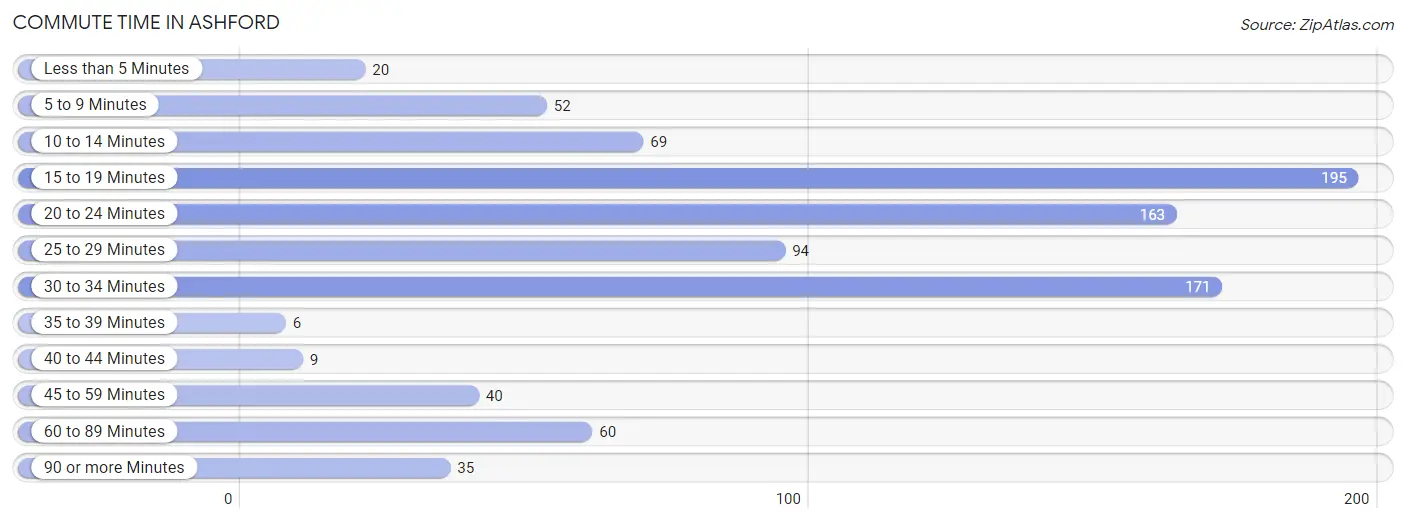
| Commute Time | # Commuters | % Commuters |
| Less than 5 Minutes | 20 | 2.2% |
| 5 to 9 Minutes | 52 | 5.7% |
| 10 to 14 Minutes | 69 | 7.5% |
| 15 to 19 Minutes | 195 | 21.3% |
| 20 to 24 Minutes | 163 | 17.8% |
| 25 to 29 Minutes | 94 | 10.3% |
| 30 to 34 Minutes | 171 | 18.7% |
| 35 to 39 Minutes | 6 | 0.7% |
| 40 to 44 Minutes | 9 | 1.0% |
| 45 to 59 Minutes | 40 | 4.4% |
| 60 to 89 Minutes | 60 | 6.6% |
| 90 or more Minutes | 35 | 3.8% |
Commute Time by Sex in Ashford
The most common commute times in Ashford are 15 to 19 minutes (103 commuters, 23.2%) for males and 20 to 24 minutes (106 commuters, 22.6%) for females.
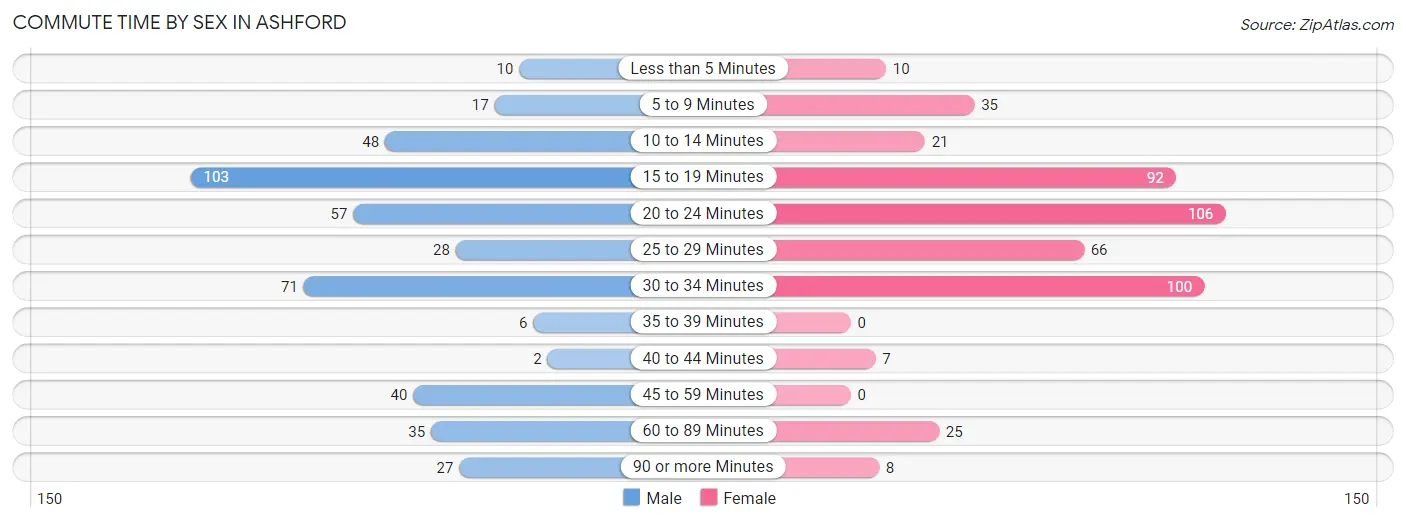
| Commute Time | Male | Female |
| Less than 5 Minutes | 10 (2.2%) | 10 (2.1%) |
| 5 to 9 Minutes | 17 (3.8%) | 35 (7.4%) |
| 10 to 14 Minutes | 48 (10.8%) | 21 (4.5%) |
| 15 to 19 Minutes | 103 (23.2%) | 92 (19.6%) |
| 20 to 24 Minutes | 57 (12.8%) | 106 (22.6%) |
| 25 to 29 Minutes | 28 (6.3%) | 66 (14.0%) |
| 30 to 34 Minutes | 71 (16.0%) | 100 (21.3%) |
| 35 to 39 Minutes | 6 (1.3%) | 0 (0.0%) |
| 40 to 44 Minutes | 2 (0.4%) | 7 (1.5%) |
| 45 to 59 Minutes | 40 (9.0%) | 0 (0.0%) |
| 60 to 89 Minutes | 35 (7.9%) | 25 (5.3%) |
| 90 or more Minutes | 27 (6.1%) | 8 (1.7%) |
Time of Departure to Work by Sex in Ashford
The most frequent times of departure to work in Ashford are 7:30 AM to 7:59 AM (106, 23.9%) for males and 6:30 AM to 6:59 AM (93, 19.8%) for females.
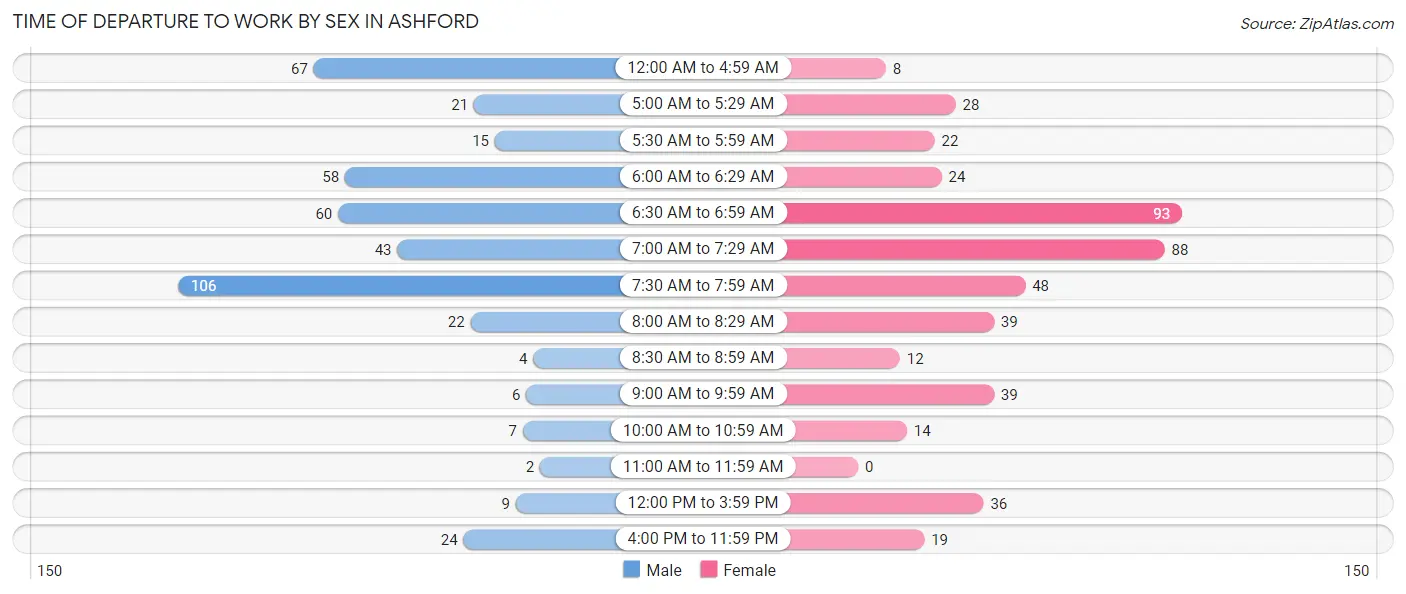
| Time of Departure | Male | Female |
| 12:00 AM to 4:59 AM | 67 (15.1%) | 8 (1.7%) |
| 5:00 AM to 5:29 AM | 21 (4.7%) | 28 (6.0%) |
| 5:30 AM to 5:59 AM | 15 (3.4%) | 22 (4.7%) |
| 6:00 AM to 6:29 AM | 58 (13.1%) | 24 (5.1%) |
| 6:30 AM to 6:59 AM | 60 (13.5%) | 93 (19.8%) |
| 7:00 AM to 7:29 AM | 43 (9.7%) | 88 (18.7%) |
| 7:30 AM to 7:59 AM | 106 (23.9%) | 48 (10.2%) |
| 8:00 AM to 8:29 AM | 22 (5.0%) | 39 (8.3%) |
| 8:30 AM to 8:59 AM | 4 (0.9%) | 12 (2.5%) |
| 9:00 AM to 9:59 AM | 6 (1.3%) | 39 (8.3%) |
| 10:00 AM to 10:59 AM | 7 (1.6%) | 14 (3.0%) |
| 11:00 AM to 11:59 AM | 2 (0.4%) | 0 (0.0%) |
| 12:00 PM to 3:59 PM | 9 (2.0%) | 36 (7.7%) |
| 4:00 PM to 11:59 PM | 24 (5.4%) | 19 (4.0%) |
| Total | 444 (100.0%) | 470 (100.0%) |
Housing Occupancy in Ashford
Occupancy by Ownership in Ashford
Of the total 859 dwellings in Ashford, owner-occupied units account for 627 (73.0%), while renter-occupied units make up 232 (27.0%).
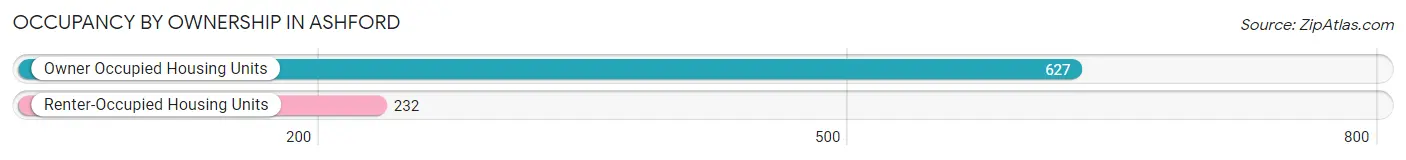
| Occupancy | # Housing Units | % Housing Units |
| Owner Occupied Housing Units | 627 | 73.0% |
| Renter-Occupied Housing Units | 232 | 27.0% |
| Total Occupied Housing Units | 859 | 100.0% |
Occupancy by Household Size in Ashford
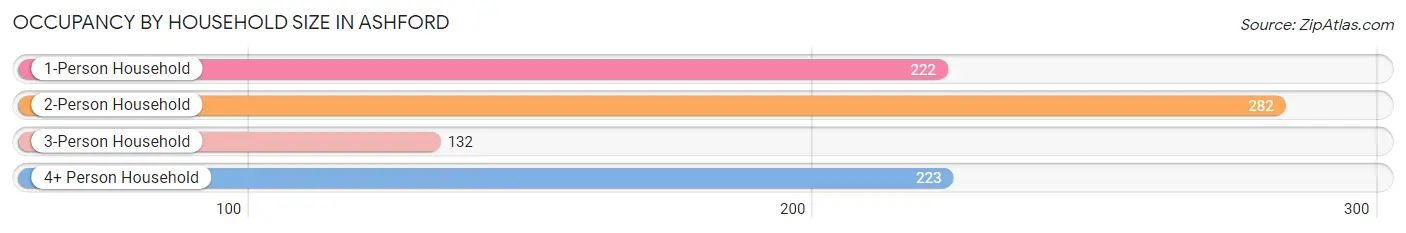
| Household Size | # Housing Units | % Housing Units |
| 1-Person Household | 222 | 25.8% |
| 2-Person Household | 282 | 32.8% |
| 3-Person Household | 132 | 15.4% |
| 4+ Person Household | 223 | 26.0% |
| Total Housing Units | 859 | 100.0% |
Occupancy by Ownership by Household Size in Ashford
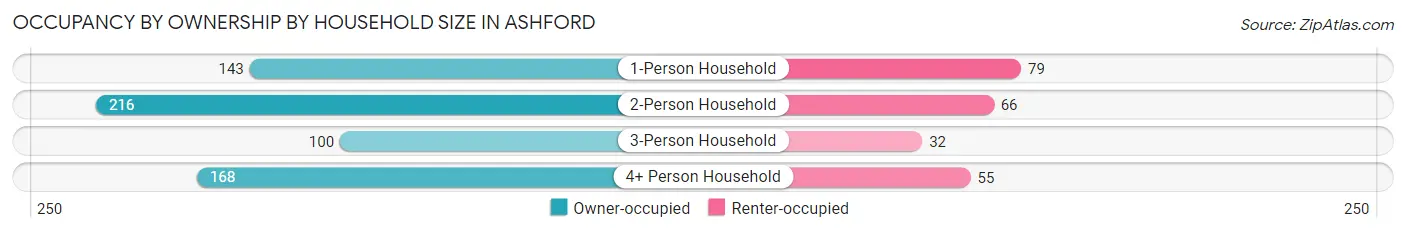
| Household Size | Owner-occupied | Renter-occupied |
| 1-Person Household | 143 (64.4%) | 79 (35.6%) |
| 2-Person Household | 216 (76.6%) | 66 (23.4%) |
| 3-Person Household | 100 (75.8%) | 32 (24.2%) |
| 4+ Person Household | 168 (75.3%) | 55 (24.7%) |
| Total Housing Units | 627 (73.0%) | 232 (27.0%) |
Occupancy by Educational Attainment in Ashford
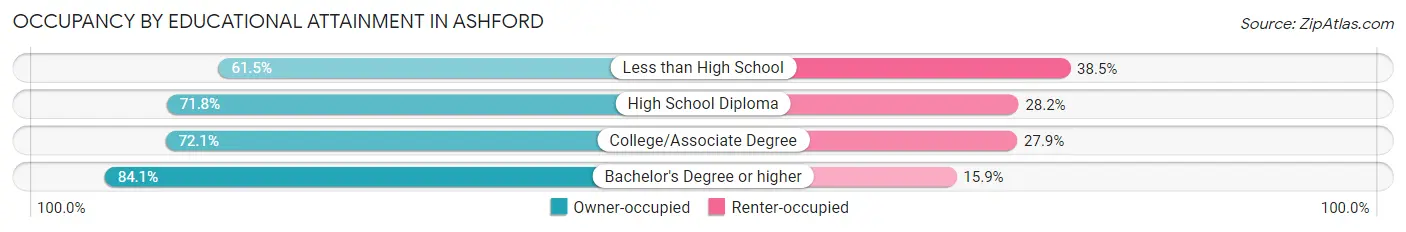
| Household Size | Owner-occupied | Renter-occupied |
| Less than High School | 72 (61.5%) | 45 (38.5%) |
| High School Diploma | 229 (71.8%) | 90 (28.2%) |
| College/Associate Degree | 178 (72.1%) | 69 (27.9%) |
| Bachelor's Degree or higher | 148 (84.1%) | 28 (15.9%) |
Occupancy by Age of Householder in Ashford
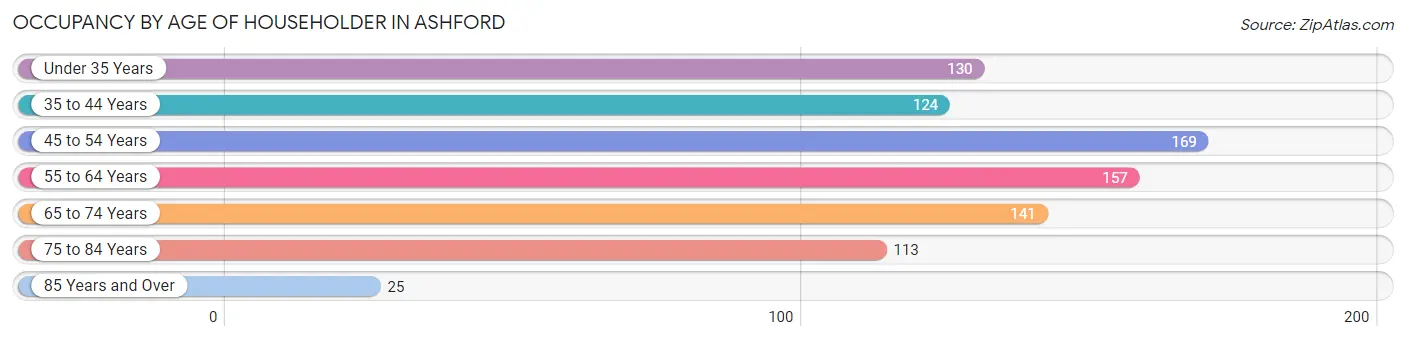
| Age Bracket | # Households | % Households |
| Under 35 Years | 130 | 15.1% |
| 35 to 44 Years | 124 | 14.4% |
| 45 to 54 Years | 169 | 19.7% |
| 55 to 64 Years | 157 | 18.3% |
| 65 to 74 Years | 141 | 16.4% |
| 75 to 84 Years | 113 | 13.2% |
| 85 Years and Over | 25 | 2.9% |
| Total | 859 | 100.0% |
Housing Finances in Ashford
Median Income by Occupancy in Ashford
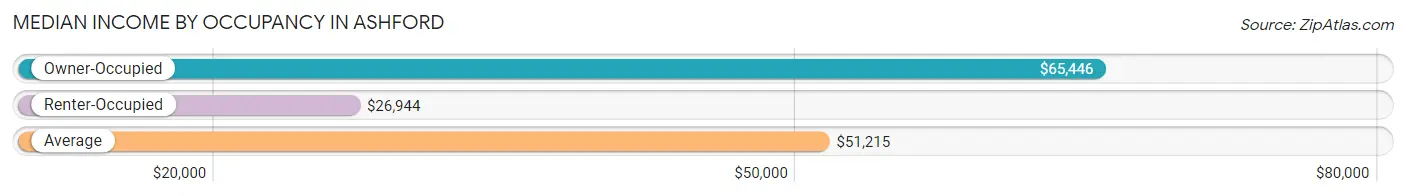
| Occupancy Type | # Households | Median Income |
| Owner-Occupied | 627 (73.0%) | $65,446 |
| Renter-Occupied | 232 (27.0%) | $26,944 |
| Average | 859 (100.0%) | $51,215 |
Occupancy by Householder Income Bracket in Ashford
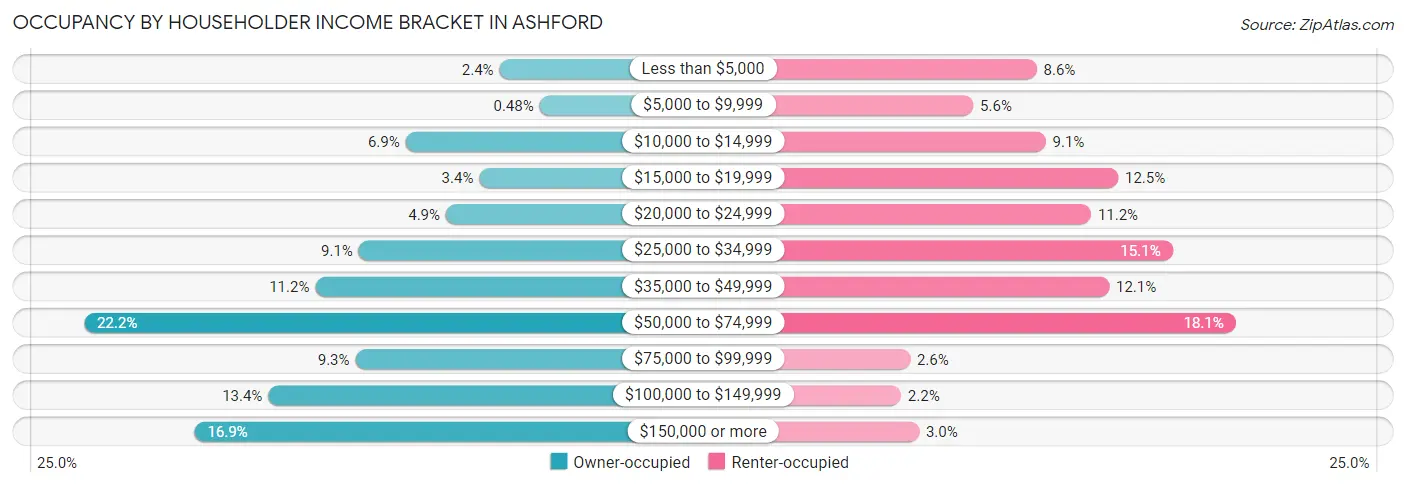
| Income Bracket | Owner-occupied | Renter-occupied |
| Less than $5,000 | 15 (2.4%) | 20 (8.6%) |
| $5,000 to $9,999 | 3 (0.5%) | 13 (5.6%) |
| $10,000 to $14,999 | 43 (6.9%) | 21 (9.0%) |
| $15,000 to $19,999 | 21 (3.4%) | 29 (12.5%) |
| $20,000 to $24,999 | 31 (4.9%) | 26 (11.2%) |
| $25,000 to $34,999 | 57 (9.1%) | 35 (15.1%) |
| $35,000 to $49,999 | 70 (11.2%) | 28 (12.1%) |
| $50,000 to $74,999 | 139 (22.2%) | 42 (18.1%) |
| $75,000 to $99,999 | 58 (9.2%) | 6 (2.6%) |
| $100,000 to $149,999 | 84 (13.4%) | 5 (2.2%) |
| $150,000 or more | 106 (16.9%) | 7 (3.0%) |
| Total | 627 (100.0%) | 232 (100.0%) |
Monthly Housing Cost Tiers in Ashford
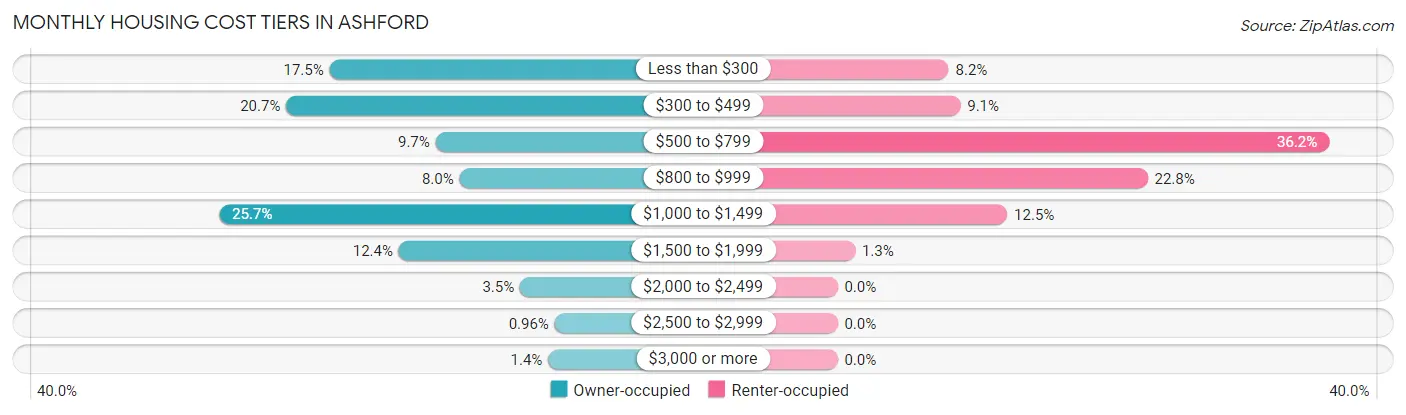
| Monthly Cost | Owner-occupied | Renter-occupied |
| Less than $300 | 110 (17.5%) | 19 (8.2%) |
| $300 to $499 | 130 (20.7%) | 21 (9.0%) |
| $500 to $799 | 61 (9.7%) | 84 (36.2%) |
| $800 to $999 | 50 (8.0%) | 53 (22.8%) |
| $1,000 to $1,499 | 161 (25.7%) | 29 (12.5%) |
| $1,500 to $1,999 | 78 (12.4%) | 3 (1.3%) |
| $2,000 to $2,499 | 22 (3.5%) | 0 (0.0%) |
| $2,500 to $2,999 | 6 (1.0%) | 0 (0.0%) |
| $3,000 or more | 9 (1.4%) | 0 (0.0%) |
| Total | 627 (100.0%) | 232 (100.0%) |
Physical Housing Characteristics in Ashford
Housing Structures in Ashford
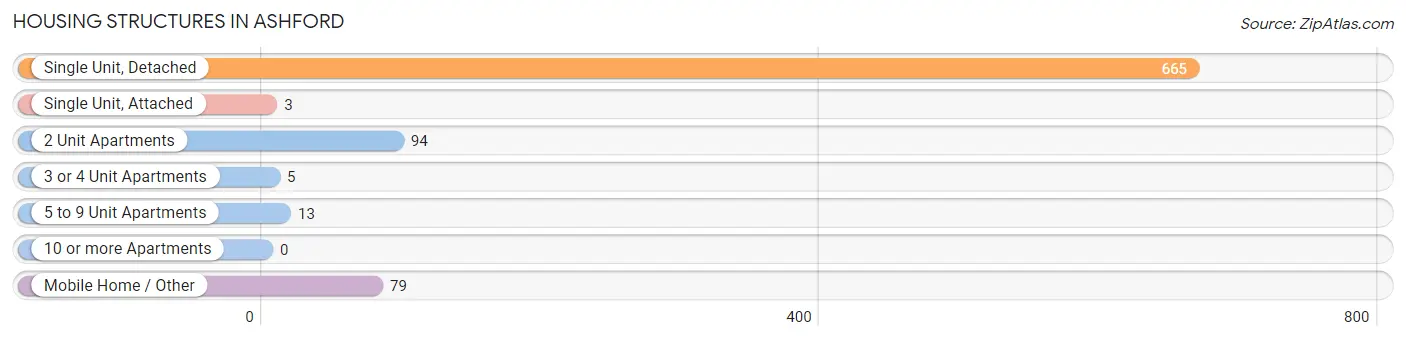
| Structure Type | # Housing Units | % Housing Units |
| Single Unit, Detached | 665 | 77.4% |
| Single Unit, Attached | 3 | 0.4% |
| 2 Unit Apartments | 94 | 10.9% |
| 3 or 4 Unit Apartments | 5 | 0.6% |
| 5 to 9 Unit Apartments | 13 | 1.5% |
| 10 or more Apartments | 0 | 0.0% |
| Mobile Home / Other | 79 | 9.2% |
| Total | 859 | 100.0% |
Housing Structures by Occupancy in Ashford
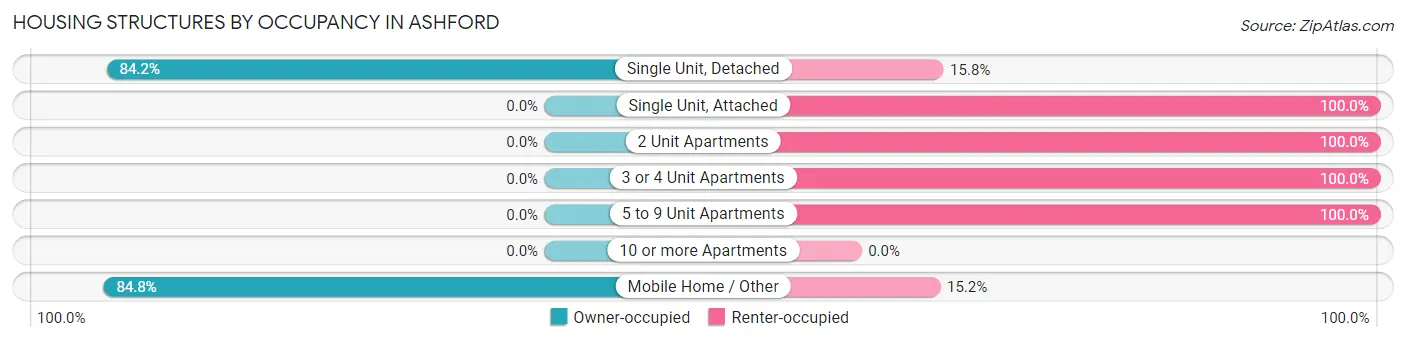
| Structure Type | Owner-occupied | Renter-occupied |
| Single Unit, Detached | 560 (84.2%) | 105 (15.8%) |
| Single Unit, Attached | 0 (0.0%) | 3 (100.0%) |
| 2 Unit Apartments | 0 (0.0%) | 94 (100.0%) |
| 3 or 4 Unit Apartments | 0 (0.0%) | 5 (100.0%) |
| 5 to 9 Unit Apartments | 0 (0.0%) | 13 (100.0%) |
| 10 or more Apartments | 0 (0.0%) | 0 (0.0%) |
| Mobile Home / Other | 67 (84.8%) | 12 (15.2%) |
| Total | 627 (73.0%) | 232 (27.0%) |
Housing Structures by Number of Rooms in Ashford
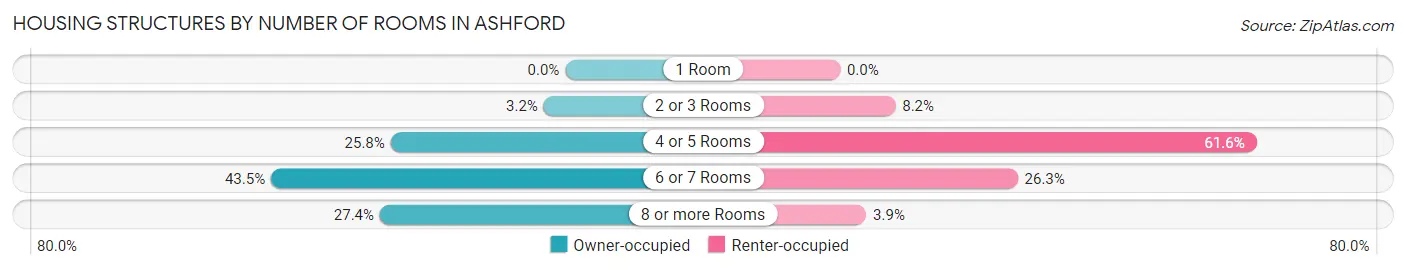
| Number of Rooms | Owner-occupied | Renter-occupied |
| 1 Room | 0 (0.0%) | 0 (0.0%) |
| 2 or 3 Rooms | 20 (3.2%) | 19 (8.2%) |
| 4 or 5 Rooms | 162 (25.8%) | 143 (61.6%) |
| 6 or 7 Rooms | 273 (43.5%) | 61 (26.3%) |
| 8 or more Rooms | 172 (27.4%) | 9 (3.9%) |
| Total | 627 (100.0%) | 232 (100.0%) |
Housing Structure by Heating Type in Ashford
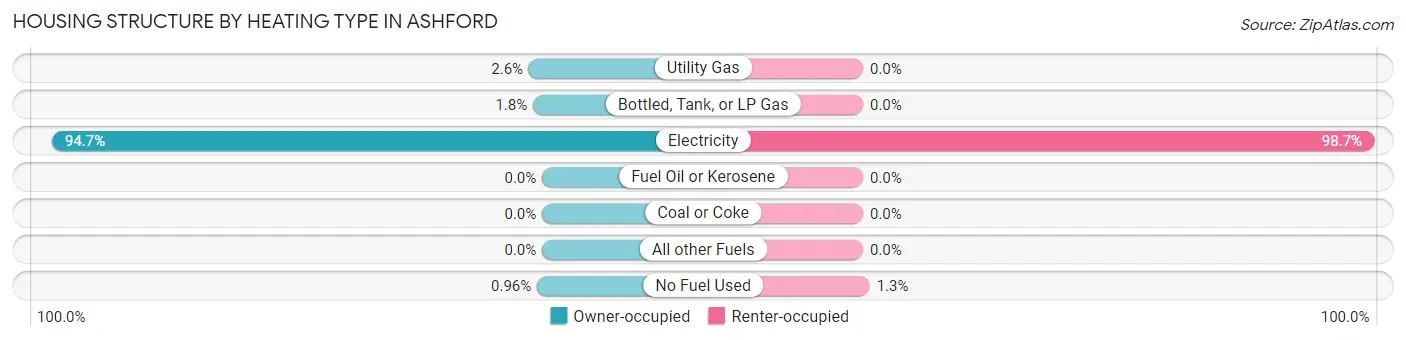
| Heating Type | Owner-occupied | Renter-occupied |
| Utility Gas | 16 (2.5%) | 0 (0.0%) |
| Bottled, Tank, or LP Gas | 11 (1.8%) | 0 (0.0%) |
| Electricity | 594 (94.7%) | 229 (98.7%) |
| Fuel Oil or Kerosene | 0 (0.0%) | 0 (0.0%) |
| Coal or Coke | 0 (0.0%) | 0 (0.0%) |
| All other Fuels | 0 (0.0%) | 0 (0.0%) |
| No Fuel Used | 6 (1.0%) | 3 (1.3%) |
| Total | 627 (100.0%) | 232 (100.0%) |
Household Vehicle Usage in Ashford
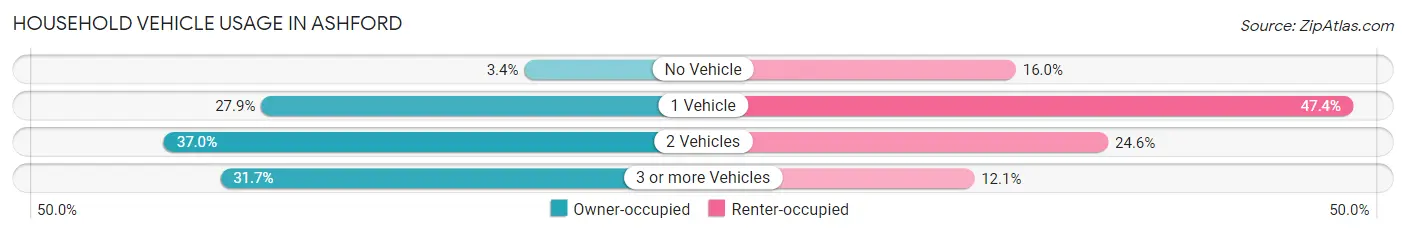
| Vehicles per Household | Owner-occupied | Renter-occupied |
| No Vehicle | 21 (3.4%) | 37 (16.0%) |
| 1 Vehicle | 175 (27.9%) | 110 (47.4%) |
| 2 Vehicles | 232 (37.0%) | 57 (24.6%) |
| 3 or more Vehicles | 199 (31.7%) | 28 (12.1%) |
| Total | 627 (100.0%) | 232 (100.0%) |
Real Estate & Mortgages in Ashford
Real Estate and Mortgage Overview in Ashford
| Characteristic | Without Mortgage | With Mortgage |
| Housing Units | 277 | 350 |
| Median Property Value | $98,600 | $173,200 |
| Median Household Income | $42,411 | $76 |
| Monthly Housing Costs | $329 | $9 |
| Real Estate Taxes | $260 | $21 |
Property Value by Mortgage Status in Ashford
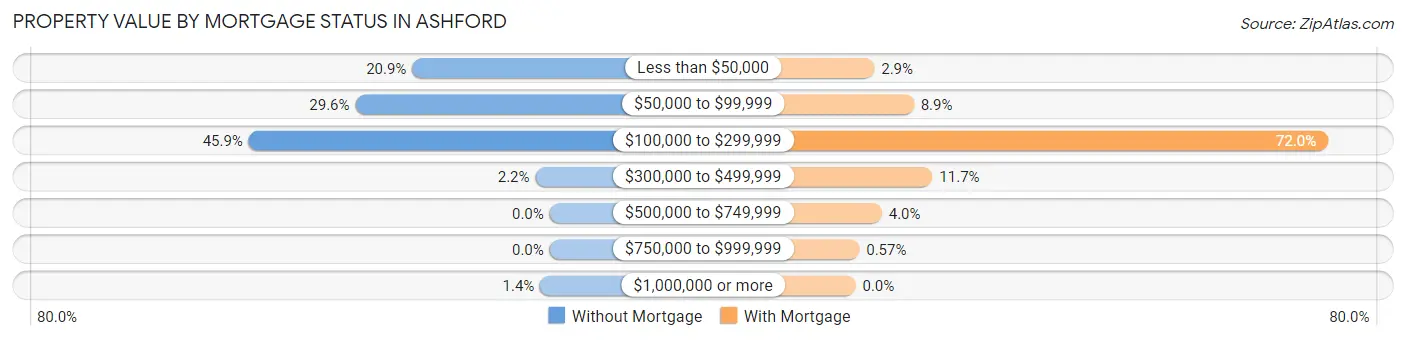
| Property Value | Without Mortgage | With Mortgage |
| Less than $50,000 | 58 (20.9%) | 10 (2.9%) |
| $50,000 to $99,999 | 82 (29.6%) | 31 (8.9%) |
| $100,000 to $299,999 | 127 (45.9%) | 252 (72.0%) |
| $300,000 to $499,999 | 6 (2.2%) | 41 (11.7%) |
| $500,000 to $749,999 | 0 (0.0%) | 14 (4.0%) |
| $750,000 to $999,999 | 0 (0.0%) | 2 (0.6%) |
| $1,000,000 or more | 4 (1.4%) | 0 (0.0%) |
| Total | 277 (100.0%) | 350 (100.0%) |
Household Income by Mortgage Status in Ashford
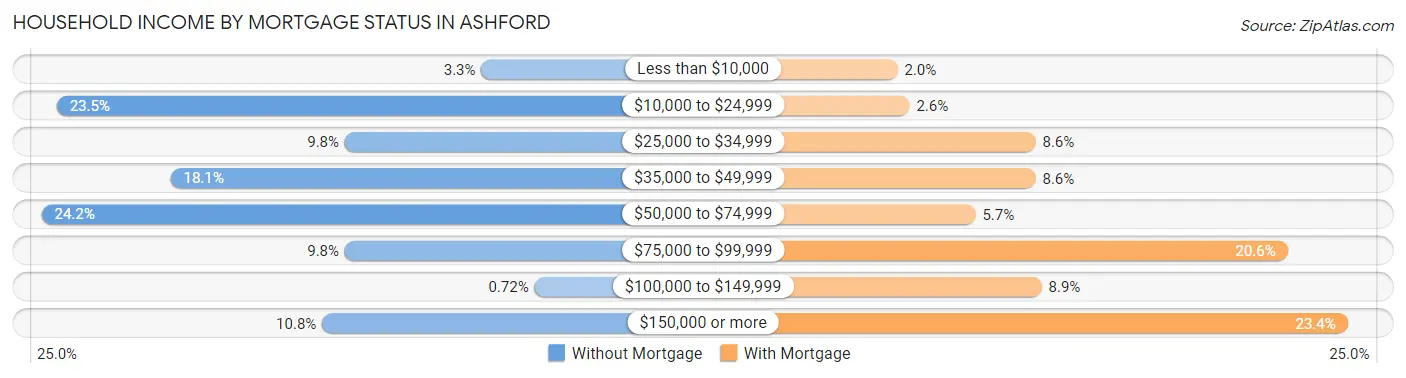
| Household Income | Without Mortgage | With Mortgage |
| Less than $10,000 | 9 (3.3%) | 7 (2.0%) |
| $10,000 to $24,999 | 65 (23.5%) | 9 (2.6%) |
| $25,000 to $34,999 | 27 (9.8%) | 30 (8.6%) |
| $35,000 to $49,999 | 50 (18.0%) | 30 (8.6%) |
| $50,000 to $74,999 | 67 (24.2%) | 20 (5.7%) |
| $75,000 to $99,999 | 27 (9.8%) | 72 (20.6%) |
| $100,000 to $149,999 | 2 (0.7%) | 31 (8.9%) |
| $150,000 or more | 30 (10.8%) | 82 (23.4%) |
| Total | 277 (100.0%) | 350 (100.0%) |
Property Value to Household Income Ratio in Ashford
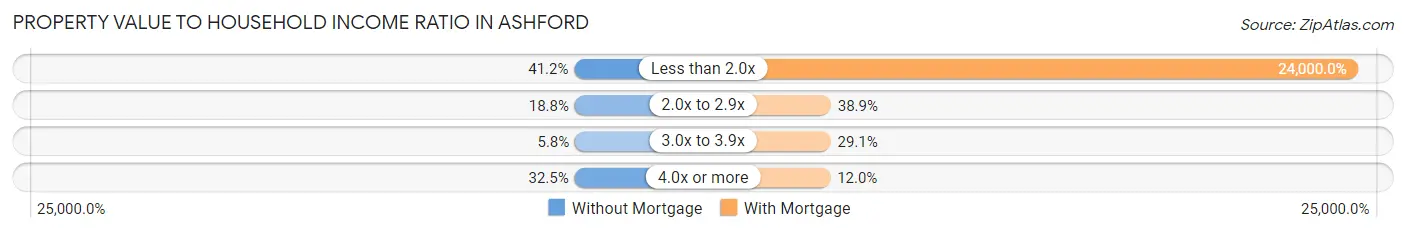
| Value-to-Income Ratio | Without Mortgage | With Mortgage |
| Less than 2.0x | 114 (41.2%) | 84,000 (24,000.0%) |
| 2.0x to 2.9x | 52 (18.8%) | 136 (38.9%) |
| 3.0x to 3.9x | 16 (5.8%) | 102 (29.1%) |
| 4.0x or more | 90 (32.5%) | 42 (12.0%) |
| Total | 277 (100.0%) | 350 (100.0%) |
Real Estate Taxes by Mortgage Status in Ashford
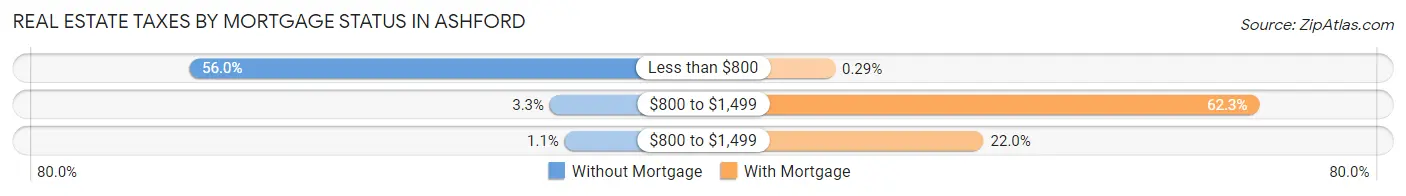
| Property Taxes | Without Mortgage | With Mortgage |
| Less than $800 | 155 (56.0%) | 1 (0.3%) |
| $800 to $1,499 | 9 (3.3%) | 218 (62.3%) |
| $800 to $1,499 | 3 (1.1%) | 77 (22.0%) |
| Total | 277 (100.0%) | 350 (100.0%) |
Health & Disability in Ashford
Health Insurance Coverage by Age in Ashford
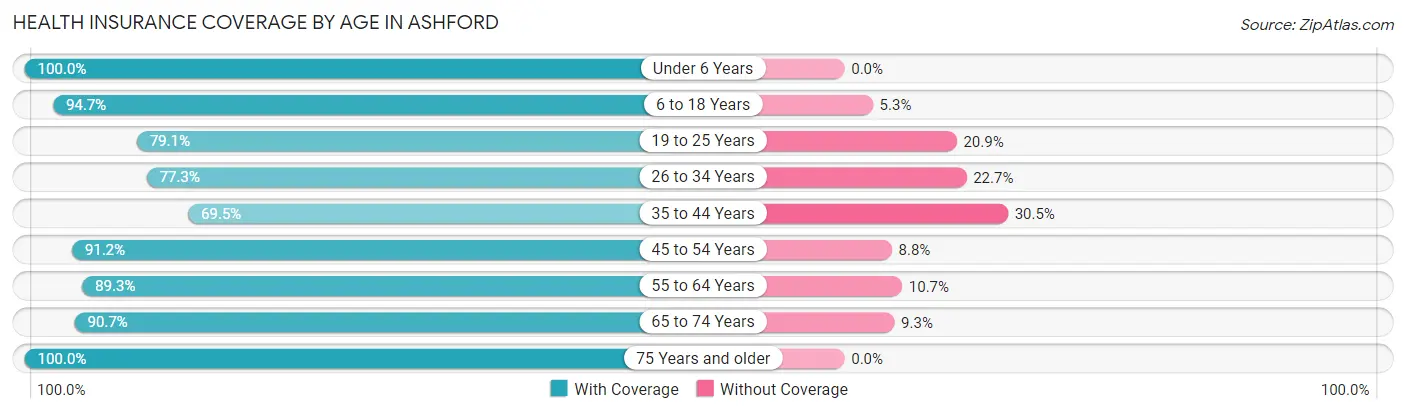
| Age Bracket | With Coverage | Without Coverage |
| Under 6 Years | 210 (100.0%) | 0 (0.0%) |
| 6 to 18 Years | 448 (94.7%) | 25 (5.3%) |
| 19 to 25 Years | 155 (79.1%) | 41 (20.9%) |
| 26 to 34 Years | 214 (77.3%) | 63 (22.7%) |
| 35 to 44 Years | 178 (69.5%) | 78 (30.5%) |
| 45 to 54 Years | 310 (91.2%) | 30 (8.8%) |
| 55 to 64 Years | 233 (89.3%) | 28 (10.7%) |
| 65 to 74 Years | 234 (90.7%) | 24 (9.3%) |
| 75 Years and older | 205 (100.0%) | 0 (0.0%) |
| Total | 2,187 (88.3%) | 289 (11.7%) |
Health Insurance Coverage by Citizenship Status in Ashford
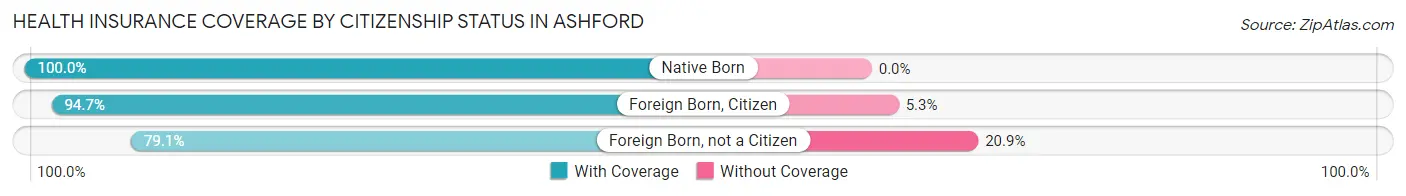
| Citizenship Status | With Coverage | Without Coverage |
| Native Born | 210 (100.0%) | 0 (0.0%) |
| Foreign Born, Citizen | 448 (94.7%) | 25 (5.3%) |
| Foreign Born, not a Citizen | 155 (79.1%) | 41 (20.9%) |
Health Insurance Coverage by Household Income in Ashford
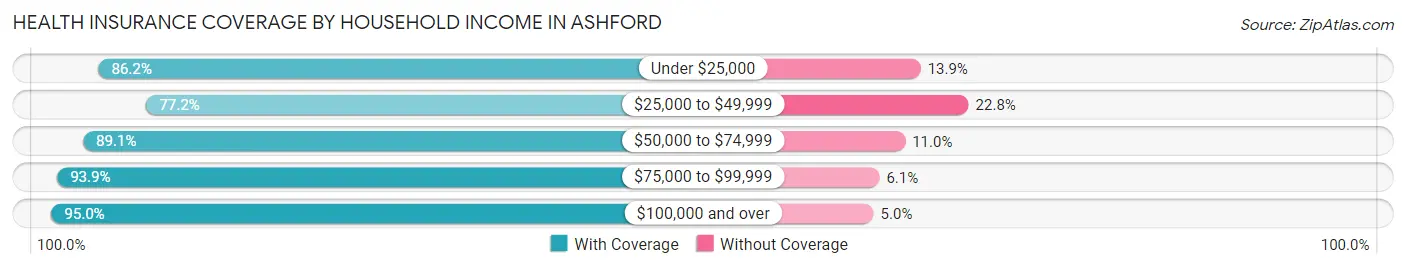
| Household Income | With Coverage | Without Coverage |
| Under $25,000 | 398 (86.2%) | 64 (13.9%) |
| $25,000 to $49,999 | 365 (77.2%) | 108 (22.8%) |
| $50,000 to $74,999 | 561 (89.0%) | 69 (11.0%) |
| $75,000 to $99,999 | 184 (93.9%) | 12 (6.1%) |
| $100,000 and over | 679 (95.0%) | 36 (5.0%) |
Public vs Private Health Insurance Coverage by Age in Ashford
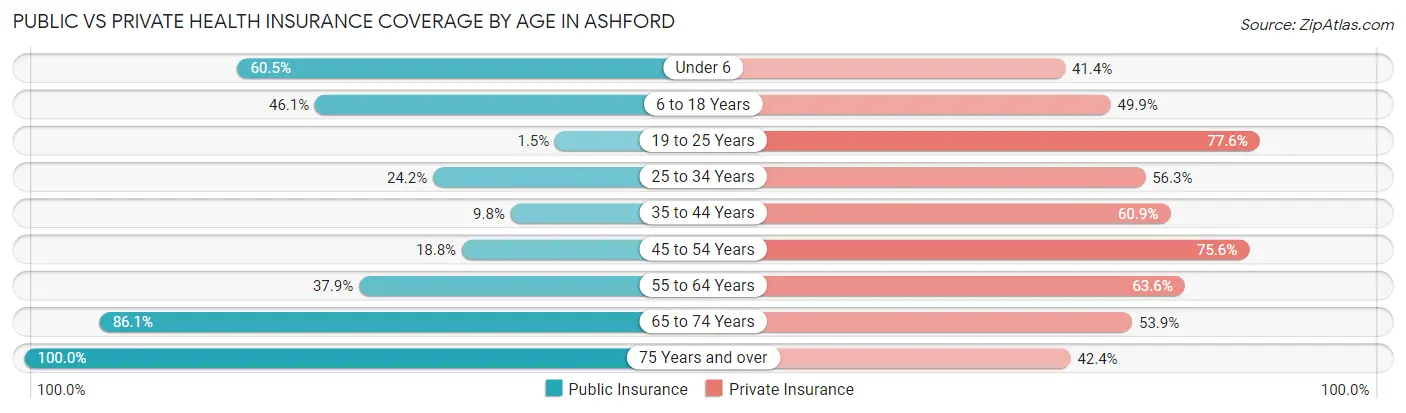
| Age Bracket | Public Insurance | Private Insurance |
| Under 6 | 127 (60.5%) | 87 (41.4%) |
| 6 to 18 Years | 218 (46.1%) | 236 (49.9%) |
| 19 to 25 Years | 3 (1.5%) | 152 (77.5%) |
| 25 to 34 Years | 67 (24.2%) | 156 (56.3%) |
| 35 to 44 Years | 25 (9.8%) | 156 (60.9%) |
| 45 to 54 Years | 64 (18.8%) | 257 (75.6%) |
| 55 to 64 Years | 99 (37.9%) | 166 (63.6%) |
| 65 to 74 Years | 222 (86.1%) | 139 (53.9%) |
| 75 Years and over | 205 (100.0%) | 87 (42.4%) |
| Total | 1,030 (41.6%) | 1,436 (58.0%) |
Disability Status by Sex by Age in Ashford
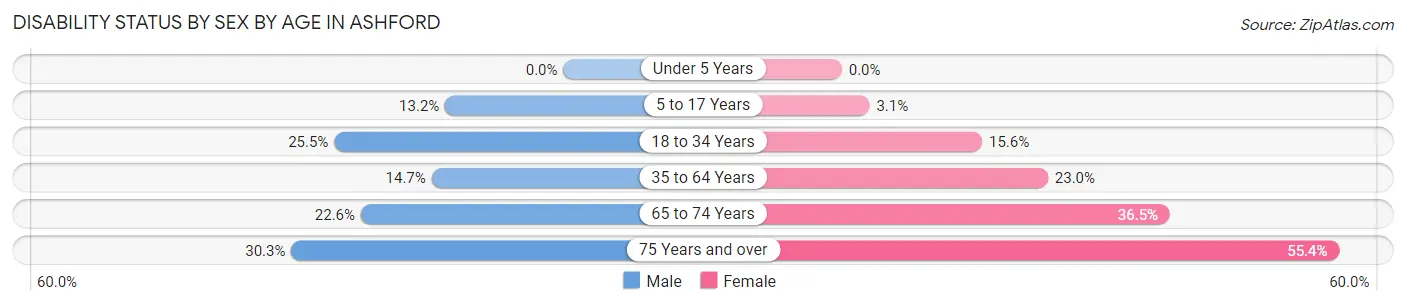
| Age Bracket | Male | Female |
| Under 5 Years | 0 (0.0%) | 0 (0.0%) |
| 5 to 17 Years | 35 (13.2%) | 6 (3.1%) |
| 18 to 34 Years | 49 (25.5%) | 52 (15.6%) |
| 35 to 64 Years | 65 (14.7%) | 95 (23.0%) |
| 65 to 74 Years | 23 (22.6%) | 57 (36.5%) |
| 75 Years and over | 20 (30.3%) | 77 (55.4%) |
Disability Class by Sex by Age in Ashford
Disability Class: Hearing Difficulty
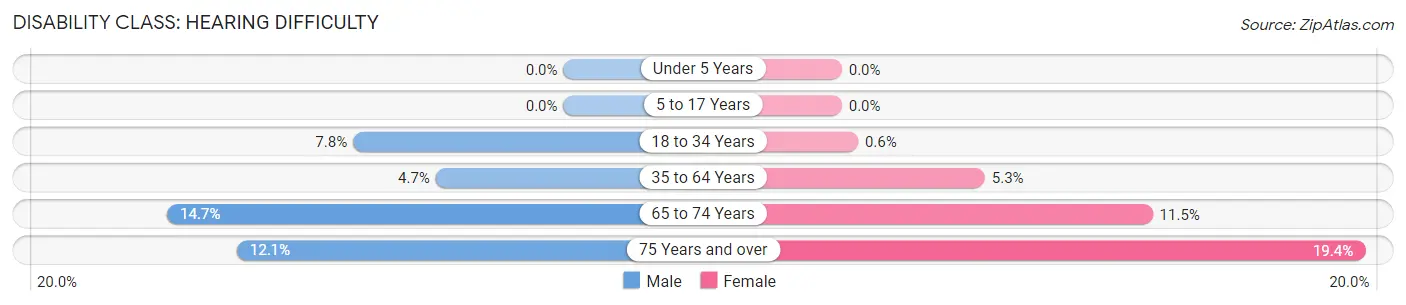
| Age Bracket | Male | Female |
| Under 5 Years | 0 (0.0%) | 0 (0.0%) |
| 5 to 17 Years | 0 (0.0%) | 0 (0.0%) |
| 18 to 34 Years | 15 (7.8%) | 2 (0.6%) |
| 35 to 64 Years | 21 (4.7%) | 22 (5.3%) |
| 65 to 74 Years | 15 (14.7%) | 18 (11.5%) |
| 75 Years and over | 8 (12.1%) | 27 (19.4%) |
Disability Class: Vision Difficulty
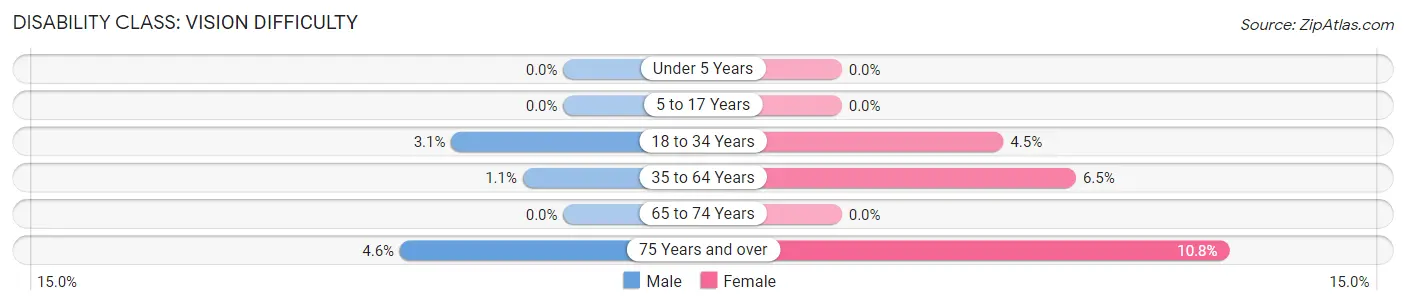
| Age Bracket | Male | Female |
| Under 5 Years | 0 (0.0%) | 0 (0.0%) |
| 5 to 17 Years | 0 (0.0%) | 0 (0.0%) |
| 18 to 34 Years | 6 (3.1%) | 15 (4.5%) |
| 35 to 64 Years | 5 (1.1%) | 27 (6.5%) |
| 65 to 74 Years | 0 (0.0%) | 0 (0.0%) |
| 75 Years and over | 3 (4.5%) | 15 (10.8%) |
Disability Class: Cognitive Difficulty
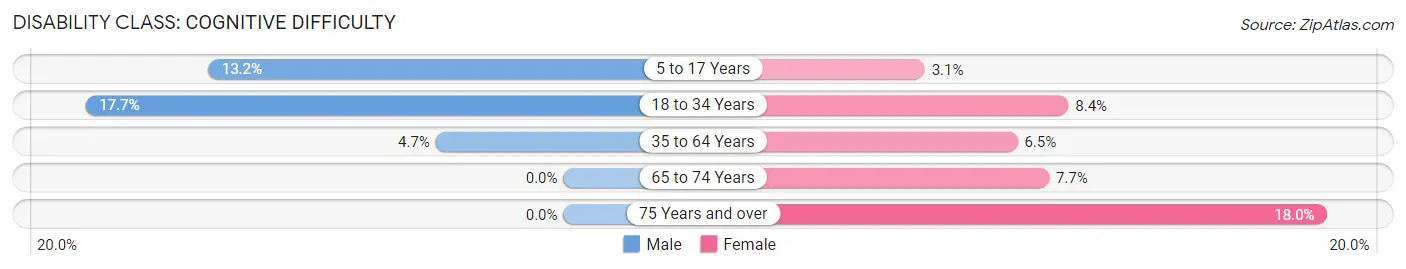
| Age Bracket | Male | Female |
| 5 to 17 Years | 35 (13.2%) | 6 (3.1%) |
| 18 to 34 Years | 34 (17.7%) | 28 (8.4%) |
| 35 to 64 Years | 21 (4.7%) | 27 (6.5%) |
| 65 to 74 Years | 0 (0.0%) | 12 (7.7%) |
| 75 Years and over | 0 (0.0%) | 25 (18.0%) |
Disability Class: Ambulatory Difficulty
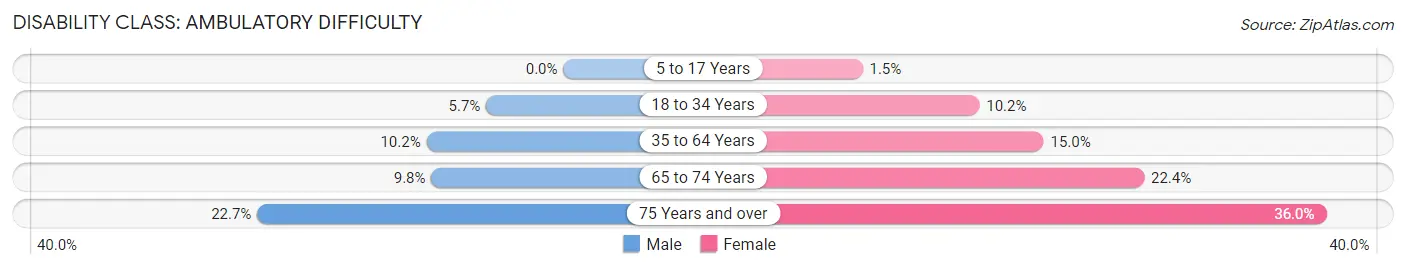
| Age Bracket | Male | Female |
| 5 to 17 Years | 0 (0.0%) | 3 (1.5%) |
| 18 to 34 Years | 11 (5.7%) | 34 (10.2%) |
| 35 to 64 Years | 45 (10.2%) | 62 (15.0%) |
| 65 to 74 Years | 10 (9.8%) | 35 (22.4%) |
| 75 Years and over | 15 (22.7%) | 50 (36.0%) |
Disability Class: Self-Care Difficulty
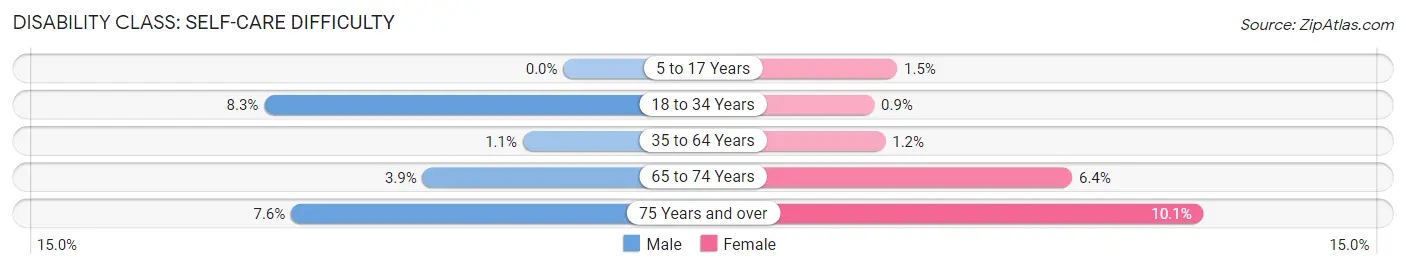
| Age Bracket | Male | Female |
| 5 to 17 Years | 0 (0.0%) | 3 (1.5%) |
| 18 to 34 Years | 16 (8.3%) | 3 (0.9%) |
| 35 to 64 Years | 5 (1.1%) | 5 (1.2%) |
| 65 to 74 Years | 4 (3.9%) | 10 (6.4%) |
| 75 Years and over | 5 (7.6%) | 14 (10.1%) |
Technology Access in Ashford
Computing Device Access in Ashford
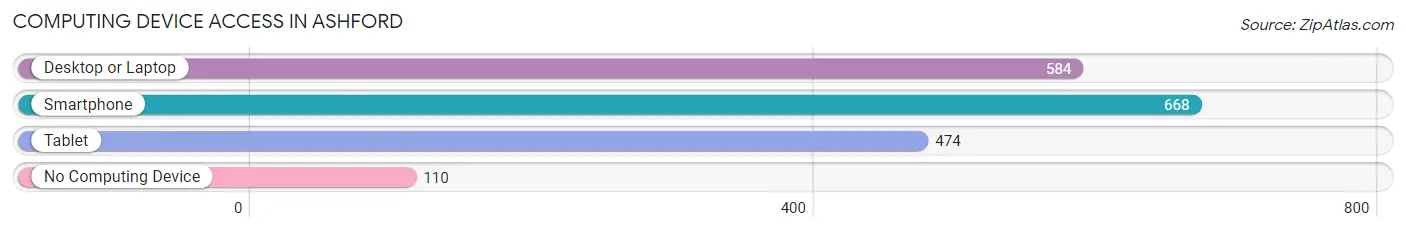
| Device Type | # Households | % Households |
| Desktop or Laptop | 584 | 68.0% |
| Smartphone | 668 | 77.8% |
| Tablet | 474 | 55.2% |
| No Computing Device | 110 | 12.8% |
| Total | 859 | 100.0% |
Internet Access in Ashford
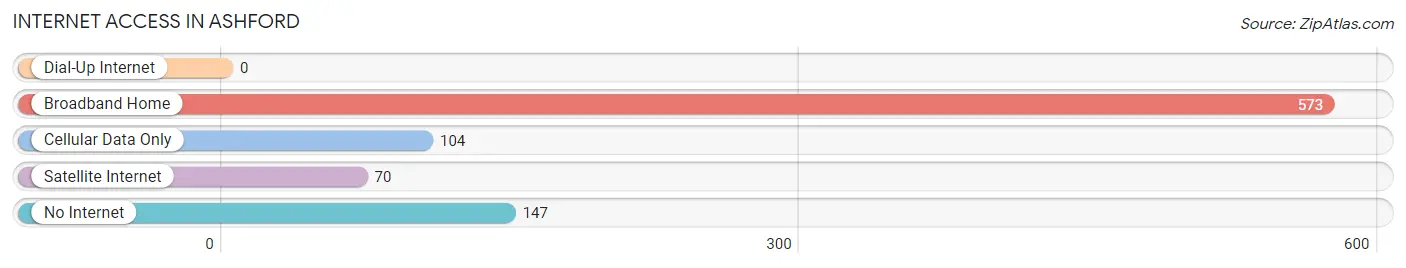
| Internet Type | # Households | % Households |
| Dial-Up Internet | 0 | 0.0% |
| Broadband Home | 573 | 66.7% |
| Cellular Data Only | 104 | 12.1% |
| Satellite Internet | 70 | 8.2% |
| No Internet | 147 | 17.1% |
| Total | 859 | 100.0% |
Ashford Summary
Ashford, Alabama is a small town located in the southeastern corner of the state, in Houston County. It is situated on the banks of the Chattahoochee River, and is part of the Dothan metropolitan area. The town has a population of approximately 5,000 people, and is known for its rural charm and friendly atmosphere.
History
The area that is now Ashford was first settled in the early 1800s by settlers from Georgia. The town was originally known as “Ashford’s Crossroads”, and was named after the Ashford family who owned the land. The town was officially incorporated in 1891, and was named after the Ashford family.
The town grew slowly over the years, and by the early 1900s, it had become a thriving agricultural center. Cotton was the main crop grown in the area, and the town was home to several cotton gins and warehouses. The town also had a number of stores, churches, and other businesses.
In the 1950s, the town began to experience a decline in population as many of its residents moved away in search of better economic opportunities. However, the town has experienced a resurgence in recent years, and is now home to a number of businesses and industries.
Geography
Ashford is located in the southeastern corner of Alabama, in Houston County. It is situated on the banks of the Chattahoochee River, and is part of the Dothan metropolitan area. The town is located approximately 30 miles south of Dothan, and is about an hour’s drive from Montgomery and Mobile.
The town is situated in a rural area, and is surrounded by rolling hills and farmland. The town is also home to several small lakes and ponds, as well as the Chattahoochee River.
Economy
The economy of Ashford is largely based on agriculture and manufacturing. The town is home to several cotton gins and warehouses, as well as a number of other businesses. The town is also home to a number of small businesses, including restaurants, retail stores, and service providers.
The town is also home to a number of industries, including a paper mill, a lumber mill, and a furniture factory. The town is also home to a number of small manufacturing companies, including a plastics factory and a metal fabrication plant.
Demographics
As of the 2010 census, the population of Ashford was 5,000. The town is predominantly white, with approximately 75% of the population being white. The remaining 25% of the population is made up of African Americans, Hispanics, and other ethnicities.
The median household income in Ashford is $35,000, and the median home value is $90,000. The town has a low unemployment rate, and the majority of the population is employed in either agriculture or manufacturing.
Conclusion
Ashford, Alabama is a small town located in the southeastern corner of the state, in Houston County. It is situated on the banks of the Chattahoochee River, and is part of the Dothan metropolitan area. The town has a population of approximately 5,000 people, and is known for its rural charm and friendly atmosphere. The economy of Ashford is largely based on agriculture and manufacturing, and the town is home to a number of small businesses, industries, and service providers. The town is predominantly white, with approximately 75% of the population being white. The median household income in Ashford is $35,000, and the median home value is $90,000.
Common Questions
What is Per Capita Income in Ashford?
Per Capita income in Ashford is $27,273.
What is the Median Family Income in Ashford?
Median Family Income in Ashford is $66,953.
What is the Median Household income in Ashford?
Median Household Income in Ashford is $51,215.
What is Income or Wage Gap in Ashford?
Income or Wage Gap in Ashford is 44.7%.
Women in Ashford earn 55.3 cents for every dollar earned by a man.
What is Family Income Deficit in Ashford?
Family Income Deficit in Ashford is $11,331.
Families that are below poverty line in Ashford earn $11,331 less on average than the poverty threshold level.
What is Inequality or Gini Index in Ashford?
Inequality or Gini Index in Ashford is 0.47.
What is the Total Population of Ashford?
Total Population of Ashford is 2,476.
What is the Total Male Population of Ashford?
Total Male Population of Ashford is 1,140.
What is the Total Female Population of Ashford?
Total Female Population of Ashford is 1,336.
What is the Ratio of Males per 100 Females in Ashford?
There are 85.33 Males per 100 Females in Ashford.
What is the Ratio of Females per 100 Males in Ashford?
There are 117.19 Females per 100 Males in Ashford.
What is the Median Population Age in Ashford?
Median Population Age in Ashford is 37.8 Years.
What is the Average Family Size in Ashford
Average Family Size in Ashford is 3.5 People.
What is the Average Household Size in Ashford
Average Household Size in Ashford is 2.9 People.
How Large is the Labor Force in Ashford?
There are 1,008 People in the Labor Forcein in Ashford.
What is the Percentage of People in the Labor Force in Ashford?
52.4% of People are in the Labor Force in Ashford.
What is the Unemployment Rate in Ashford?
Unemployment Rate in Ashford is 3.8%.