Owens Cross Roads, AL Map & Demographics
Owens Cross Roads Map
Owens Cross Roads Overview
$31,766
PER CAPITA INCOME
$79,091
AVG FAMILY INCOME
$70,750
AVG HOUSEHOLD INCOME
50.1%
WAGE / INCOME GAP [ % ]
49.9¢/ $1
WAGE / INCOME GAP [ $ ]
0.36
INEQUALITY / GINI INDEX
2,567
TOTAL POPULATION
1,218
MALE POPULATION
1,349
FEMALE POPULATION
90.29
MALES / 100 FEMALES
110.76
FEMALES / 100 MALES
33.8
MEDIAN AGE
3.0
AVG FAMILY SIZE
2.7
AVG HOUSEHOLD SIZE
1,309
LABOR FORCE [ PEOPLE ]
67.0%
PERCENT IN LABOR FORCE
7.9%
UNEMPLOYMENT RATE
Owens Cross Roads Zip Codes
Owens Cross Roads Area Codes
Income in Owens Cross Roads
Income Overview in Owens Cross Roads
Per Capita Income in Owens Cross Roads is $31,766, while median incomes of families and households are $79,091 and $70,750 respectively.
| Characteristic | Number | Measure |
| Per Capita Income | 2,567 | $31,766 |
| Median Family Income | 712 | $79,091 |
| Mean Family Income | 712 | $90,304 |
| Median Household Income | 927 | $70,750 |
| Mean Household Income | 927 | $83,405 |
| Income Deficit | 712 | $0 |
| Wage / Income Gap (%) | 2,567 | 50.12% |
| Wage / Income Gap ($) | 2,567 | 49.88¢ per $1 |
| Gini / Inequality Index | 2,567 | 0.36 |
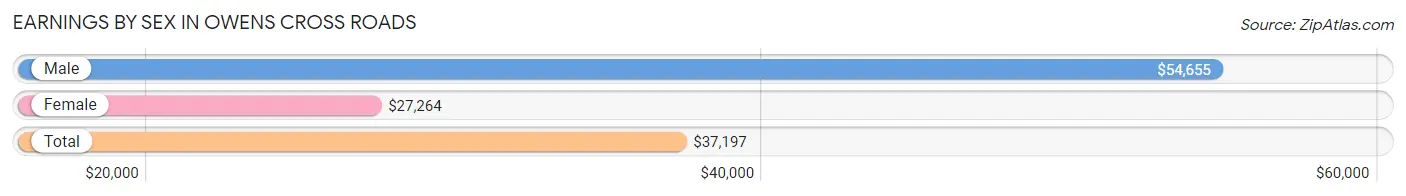
Earnings by Sex in Owens Cross Roads
Average Earnings in Owens Cross Roads are $37,197, $54,655 for men and $27,264 for women, a difference of 50.1%.
| Sex | Number | Average Earnings |
| Male | 710 (53.5%) | $54,655 |
| Female | 616 (46.5%) | $27,264 |
| Total | 1,326 (100.0%) | $37,197 |
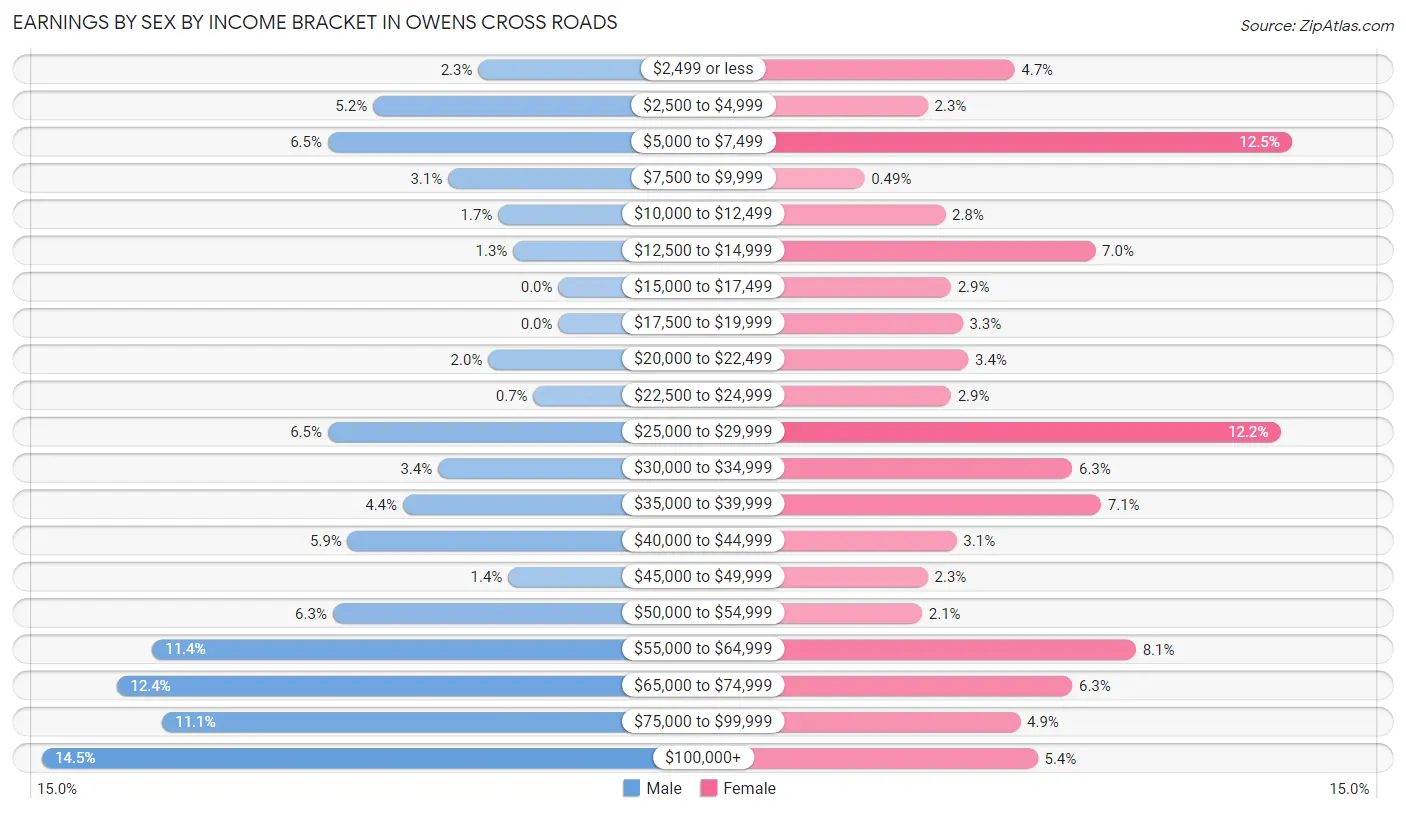
Earnings by Sex by Income Bracket in Owens Cross Roads
The most common earnings brackets in Owens Cross Roads are $100,000+ for men (103 | 14.5%) and $5,000 to $7,499 for women (77 | 12.5%).
| Income | Male | Female |
| $2,499 or less | 16 (2.2%) | 29 (4.7%) |
| $2,500 to $4,999 | 37 (5.2%) | 14 (2.3%) |
| $5,000 to $7,499 | 46 (6.5%) | 77 (12.5%) |
| $7,500 to $9,999 | 22 (3.1%) | 3 (0.5%) |
| $10,000 to $12,499 | 12 (1.7%) | 17 (2.8%) |
| $12,500 to $14,999 | 9 (1.3%) | 43 (7.0%) |
| $15,000 to $17,499 | 0 (0.0%) | 18 (2.9%) |
| $17,500 to $19,999 | 0 (0.0%) | 20 (3.3%) |
| $20,000 to $22,499 | 14 (2.0%) | 21 (3.4%) |
| $22,500 to $24,999 | 5 (0.7%) | 18 (2.9%) |
| $25,000 to $29,999 | 46 (6.5%) | 75 (12.2%) |
| $30,000 to $34,999 | 24 (3.4%) | 39 (6.3%) |
| $35,000 to $39,999 | 31 (4.4%) | 44 (7.1%) |
| $40,000 to $44,999 | 42 (5.9%) | 19 (3.1%) |
| $45,000 to $49,999 | 10 (1.4%) | 14 (2.3%) |
| $50,000 to $54,999 | 45 (6.3%) | 13 (2.1%) |
| $55,000 to $64,999 | 81 (11.4%) | 50 (8.1%) |
| $65,000 to $74,999 | 88 (12.4%) | 39 (6.3%) |
| $75,000 to $99,999 | 79 (11.1%) | 30 (4.9%) |
| $100,000+ | 103 (14.5%) | 33 (5.4%) |
| Total | 710 (100.0%) | 616 (100.0%) |
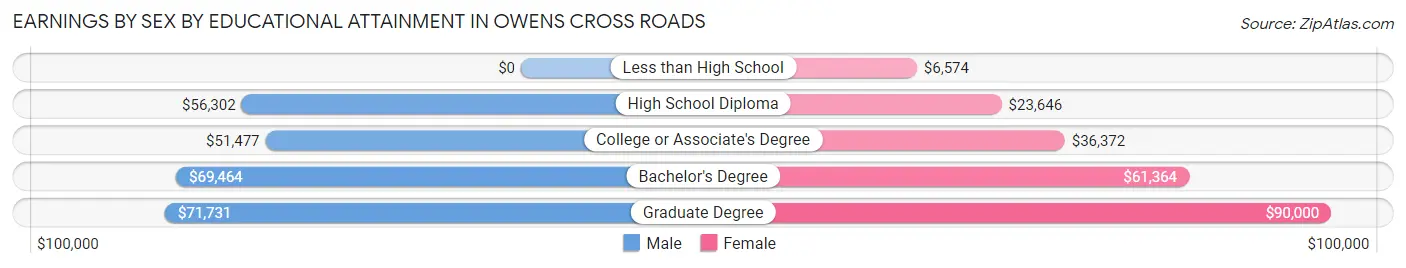
Earnings by Sex by Educational Attainment in Owens Cross Roads
Average earnings in Owens Cross Roads are $57,500 for men and $34,643 for women, a difference of 39.8%. Men with an educational attainment of graduate degree enjoy the highest average annual earnings of $71,731, while those with college or associate's degree education earn the least with $51,477. Women with an educational attainment of graduate degree earn the most with the average annual earnings of $90,000, while those with less than high school education have the smallest earnings of $6,574.
| Educational Attainment | Male Income | Female Income |
| Less than High School | - | - |
| High School Diploma | $56,302 | $23,646 |
| College or Associate's Degree | $51,477 | $36,372 |
| Bachelor's Degree | $69,464 | $61,364 |
| Graduate Degree | $71,731 | $90,000 |
| Total | $57,500 | $34,643 |
Family Income in Owens Cross Roads
Family Income Brackets in Owens Cross Roads
According to the Owens Cross Roads family income data, there are 154 families falling into the $75,000 to $99,999 income range, which is the most common income bracket and makes up 21.6% of all families. Conversely, the $10,000 to $14,999 income bracket is the least frequent group with only 4 families (0.6%) belonging to this category.
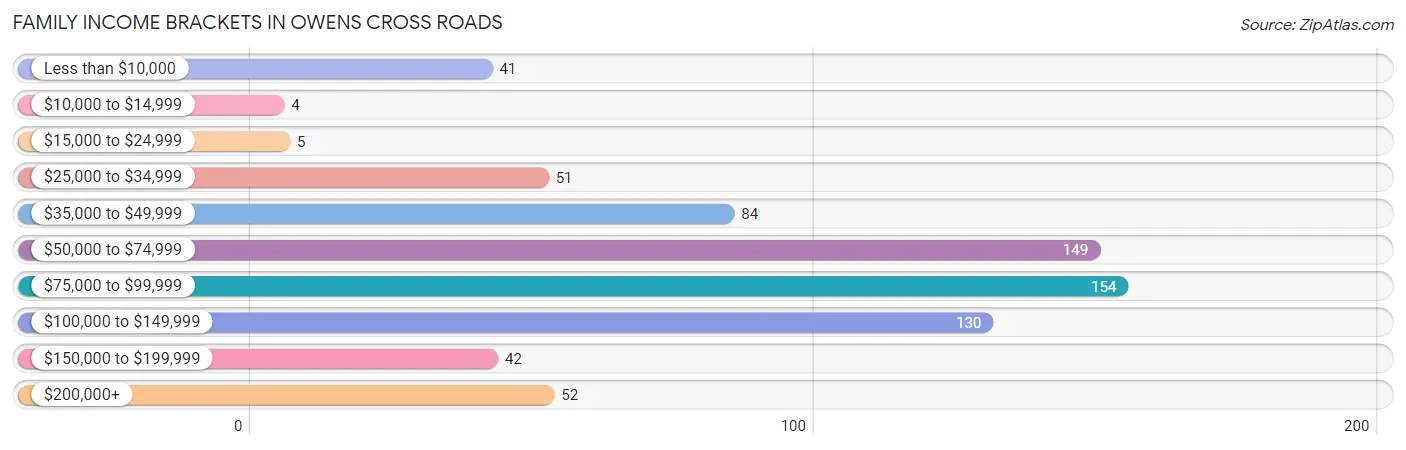
| Income Bracket | # Families | % Families |
| Less than $10,000 | 41 | 5.8% |
| $10,000 to $14,999 | 4 | 0.6% |
| $15,000 to $24,999 | 5 | 0.7% |
| $25,000 to $34,999 | 51 | 7.2% |
| $35,000 to $49,999 | 84 | 11.8% |
| $50,000 to $74,999 | 149 | 20.9% |
| $75,000 to $99,999 | 154 | 21.6% |
| $100,000 to $149,999 | 130 | 18.3% |
| $150,000 to $199,999 | 42 | 5.9% |
| $200,000+ | 52 | 7.3% |
Family Income by Famaliy Size in Owens Cross Roads
4-person families (120 | 16.9%) account for the highest median family income in Owens Cross Roads with $96,250 per family, while 2-person families (334 | 46.9%) have the highest median income of $35,347 per family member.
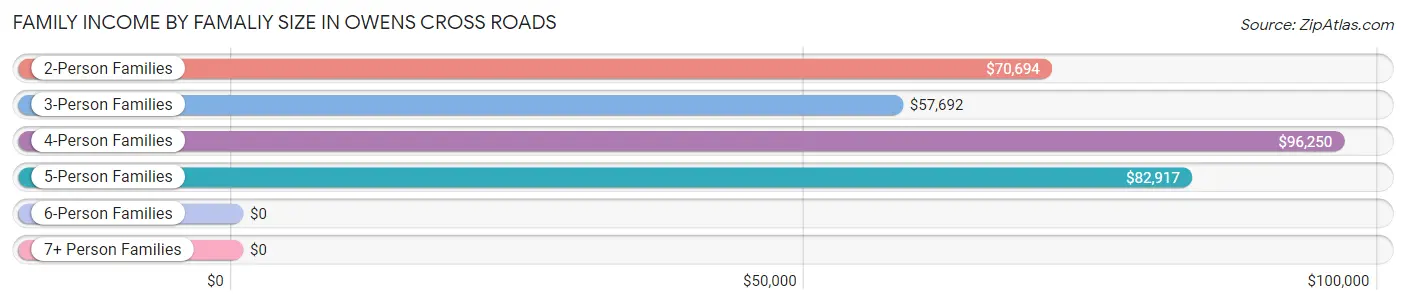
| Income Bracket | # Families | Median Income |
| 2-Person Families | 334 (46.9%) | $70,694 |
| 3-Person Families | 192 (27.0%) | $57,692 |
| 4-Person Families | 120 (16.9%) | $96,250 |
| 5-Person Families | 49 (6.9%) | $82,917 |
| 6-Person Families | 6 (0.8%) | $0 |
| 7+ Person Families | 11 (1.5%) | $0 |
| Total | 712 (100.0%) | $79,091 |
Family Income by Number of Earners in Owens Cross Roads
The median family income in Owens Cross Roads is $79,091, with families comprising 3+ earners (51) having the highest median family income of $116,771, while families with no earners (88) have the lowest median family income of $62,500, accounting for 7.2% and 12.4% of families, respectively.
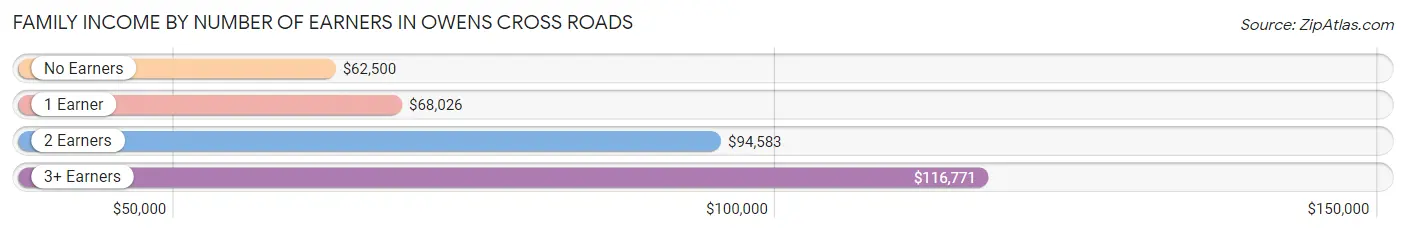
| Number of Earners | # Families | Median Income |
| No Earners | 88 (12.4%) | $62,500 |
| 1 Earner | 294 (41.3%) | $68,026 |
| 2 Earners | 279 (39.2%) | $94,583 |
| 3+ Earners | 51 (7.2%) | $116,771 |
| Total | 712 (100.0%) | $79,091 |
Household Income in Owens Cross Roads
Household Income Brackets in Owens Cross Roads
With 188 households falling in the category, the $50,000 to $74,999 income range is the most frequent in Owens Cross Roads, accounting for 20.3% of all households. In contrast, only 4 households (0.4%) fall into the $10,000 to $14,999 income bracket, making it the least populous group.
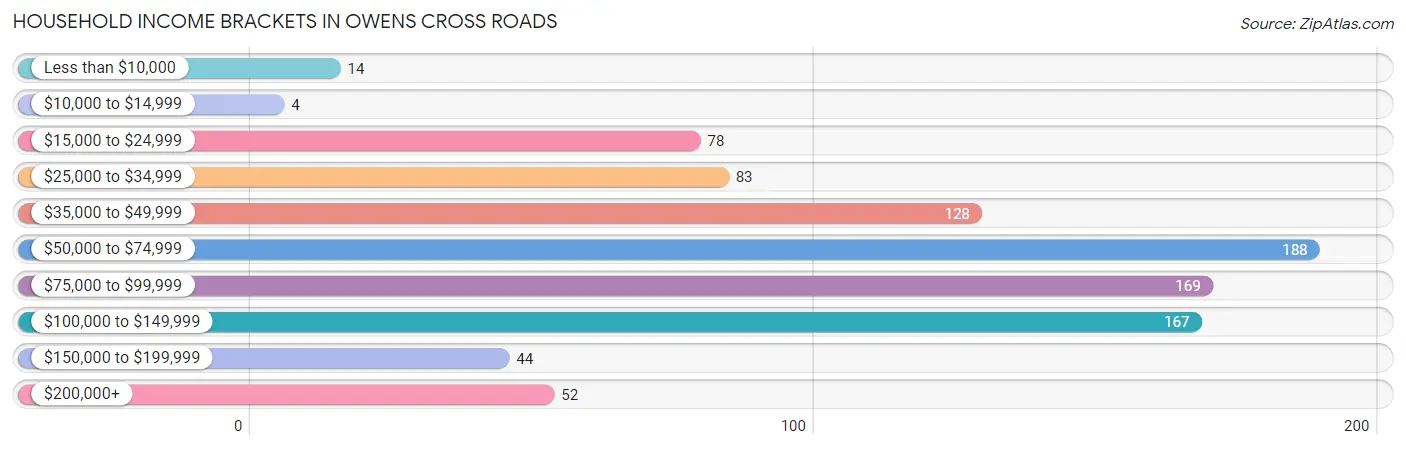
| Income Bracket | # Households | % Households |
| Less than $10,000 | 14 | 1.5% |
| $10,000 to $14,999 | 4 | 0.4% |
| $15,000 to $24,999 | 78 | 8.4% |
| $25,000 to $34,999 | 83 | 9.0% |
| $35,000 to $49,999 | 128 | 13.8% |
| $50,000 to $74,999 | 188 | 20.3% |
| $75,000 to $99,999 | 169 | 18.2% |
| $100,000 to $149,999 | 167 | 18.0% |
| $150,000 to $199,999 | 44 | 4.7% |
| $200,000+ | 52 | 5.6% |
Household Income by Householder Age in Owens Cross Roads
The median household income in Owens Cross Roads is $70,750, with the highest median household income of $77,273 found in the 25 to 44 years age bracket for the primary householder. A total of 352 households (38.0%) fall into this category. Meanwhile, the 15 to 24 years age bracket for the primary householder has the lowest median household income of $59,375, with 53 households (5.7%) in this group.
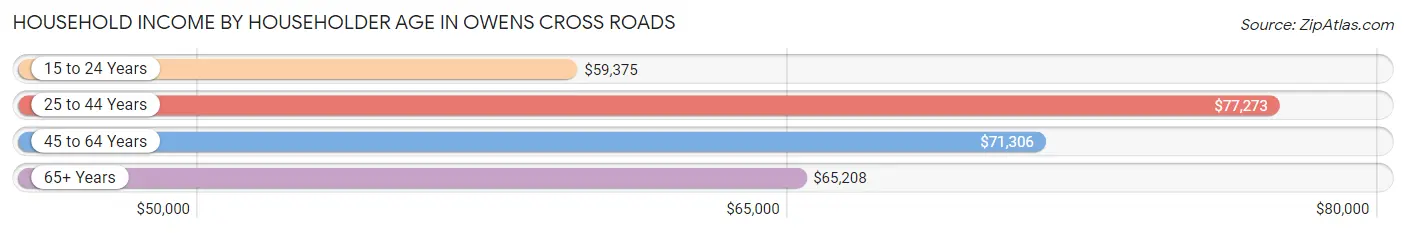
| Income Bracket | # Households | Median Income |
| 15 to 24 Years | 53 (5.7%) | $59,375 |
| 25 to 44 Years | 352 (38.0%) | $77,273 |
| 45 to 64 Years | 341 (36.8%) | $71,306 |
| 65+ Years | 181 (19.5%) | $65,208 |
| Total | 927 (100.0%) | $70,750 |
Poverty in Owens Cross Roads
Income Below Poverty by Sex and Age in Owens Cross Roads
With 8.7% poverty level for males and 12.2% for females among the residents of Owens Cross Roads, 6 to 11 year old males and 6 to 11 year old females are the most vulnerable to poverty, with 23 males (26.4%) and 46 females (32.6%) in their respective age groups living below the poverty level.
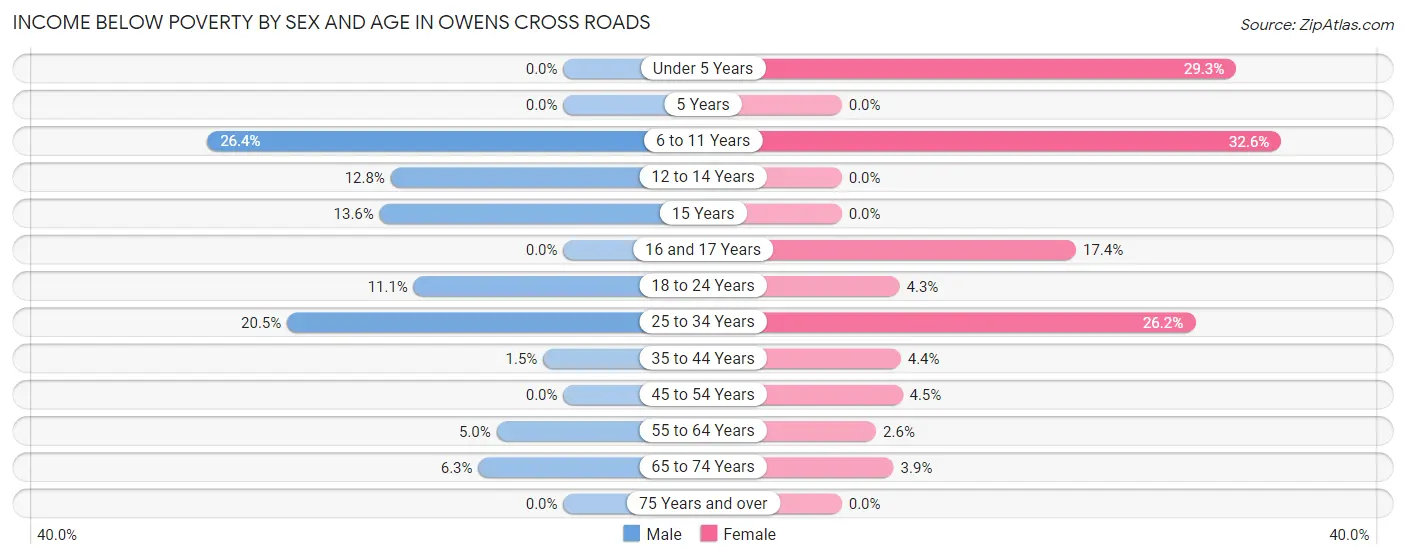
| Age Bracket | Male | Female |
| Under 5 Years | 0 (0.0%) | 24 (29.3%) |
| 5 Years | 0 (0.0%) | 0 (0.0%) |
| 6 to 11 Years | 23 (26.4%) | 46 (32.6%) |
| 12 to 14 Years | 5 (12.8%) | 0 (0.0%) |
| 15 Years | 3 (13.6%) | 0 (0.0%) |
| 16 and 17 Years | 0 (0.0%) | 4 (17.4%) |
| 18 to 24 Years | 8 (11.1%) | 6 (4.3%) |
| 25 to 34 Years | 48 (20.5%) | 59 (26.2%) |
| 35 to 44 Years | 2 (1.5%) | 6 (4.4%) |
| 45 to 54 Years | 0 (0.0%) | 6 (4.5%) |
| 55 to 64 Years | 7 (5.0%) | 4 (2.5%) |
| 65 to 74 Years | 7 (6.3%) | 3 (3.8%) |
| 75 Years and over | 0 (0.0%) | 0 (0.0%) |
| Total | 103 (8.7%) | 158 (12.2%) |
Income Above Poverty by Sex and Age in Owens Cross Roads
According to the poverty statistics in Owens Cross Roads, males aged under 5 years and females aged 5 years are the age groups that are most secure financially, with 100.0% of males and 100.0% of females in these age groups living above the poverty line.
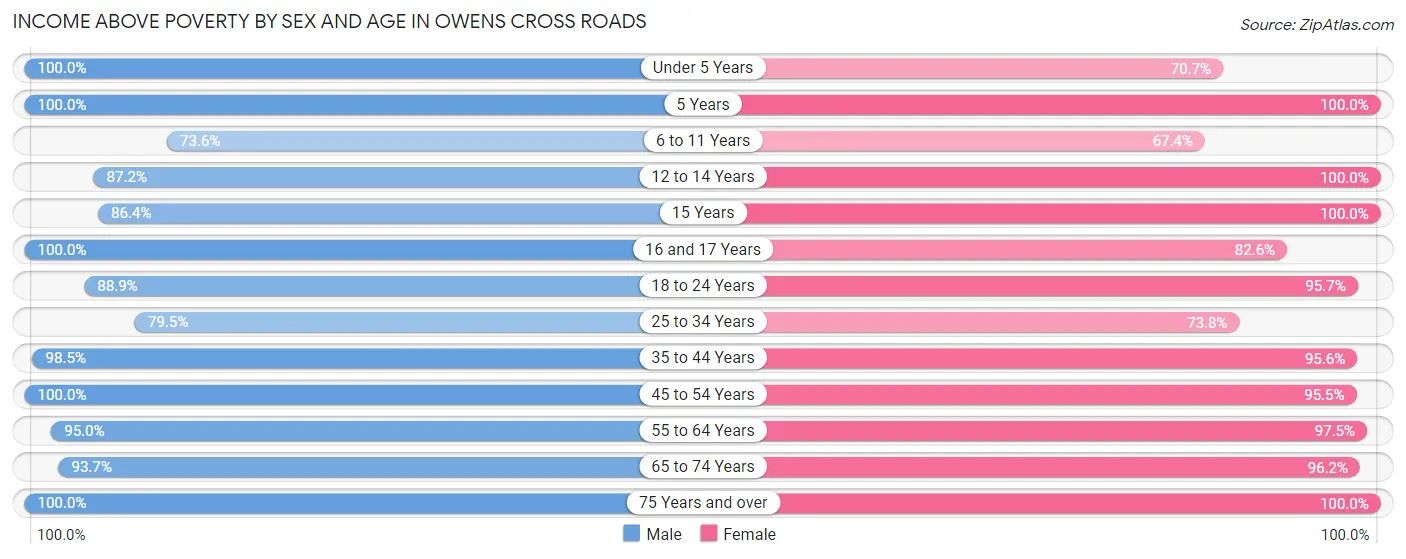
| Age Bracket | Male | Female |
| Under 5 Years | 99 (100.0%) | 58 (70.7%) |
| 5 Years | 16 (100.0%) | 20 (100.0%) |
| 6 to 11 Years | 64 (73.6%) | 95 (67.4%) |
| 12 to 14 Years | 34 (87.2%) | 47 (100.0%) |
| 15 Years | 19 (86.4%) | 52 (100.0%) |
| 16 and 17 Years | 66 (100.0%) | 19 (82.6%) |
| 18 to 24 Years | 64 (88.9%) | 134 (95.7%) |
| 25 to 34 Years | 186 (79.5%) | 166 (73.8%) |
| 35 to 44 Years | 131 (98.5%) | 131 (95.6%) |
| 45 to 54 Years | 130 (100.0%) | 127 (95.5%) |
| 55 to 64 Years | 134 (95.0%) | 153 (97.5%) |
| 65 to 74 Years | 104 (93.7%) | 75 (96.2%) |
| 75 Years and over | 39 (100.0%) | 56 (100.0%) |
| Total | 1,086 (91.3%) | 1,133 (87.8%) |
Income Below Poverty Among Married-Couple Families in Owens Cross Roads
The poverty statistics for married-couple families in Owens Cross Roads show that 1.0% or 5 of the total 516 families live below the poverty line. Families with 3 or 4 children have the highest poverty rate of 6.7%, comprising of 3 families. On the other hand, families with no children have the lowest poverty rate of 0.0%, which includes 0 families.
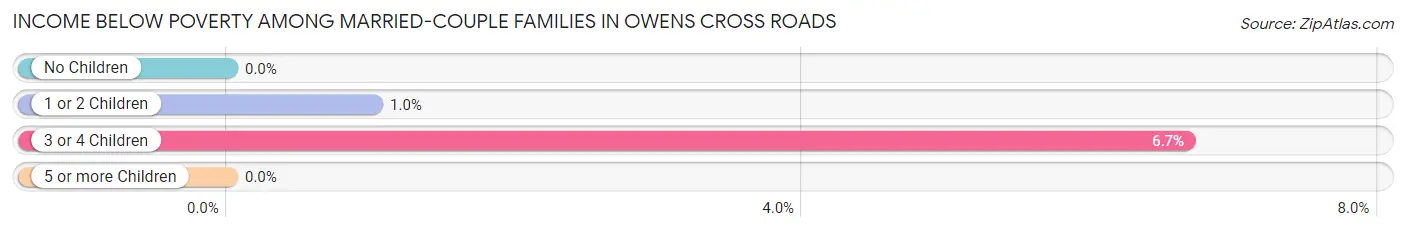
| Children | Above Poverty | Below Poverty |
| No Children | 272 (100.0%) | 0 (0.0%) |
| 1 or 2 Children | 197 (99.0%) | 2 (1.0%) |
| 3 or 4 Children | 42 (93.3%) | 3 (6.7%) |
| 5 or more Children | 0 (0.0%) | 0 (0.0%) |
| Total | 511 (99.0%) | 5 (1.0%) |
Income Below Poverty Among Single-Parent Households in Owens Cross Roads
According to the poverty data in Owens Cross Roads, 57.8% or 41 single-father households and 7.2% or 9 single-mother households are living below the poverty line. Among single-father households, those with 1 or 2 children have the highest poverty rate, with 41 households (69.5%) experiencing poverty. Likewise, among single-mother households, those with no children have the highest poverty rate, with 4 households (18.2%) falling below the poverty line.
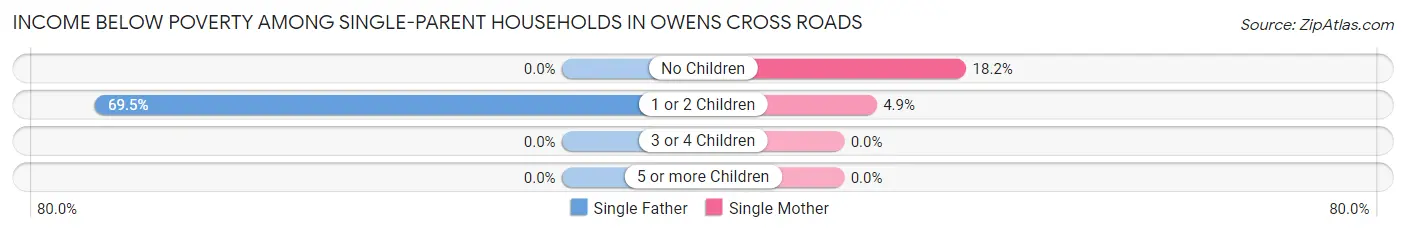
| Children | Single Father | Single Mother |
| No Children | 0 (0.0%) | 4 (18.2%) |
| 1 or 2 Children | 41 (69.5%) | 5 (4.9%) |
| 3 or 4 Children | 0 (0.0%) | 0 (0.0%) |
| 5 or more Children | 0 (0.0%) | 0 (0.0%) |
| Total | 41 (57.8%) | 9 (7.2%) |
Income Below Poverty Among Married-Couple vs Single-Parent Households in Owens Cross Roads
The poverty data for Owens Cross Roads shows that 5 of the married-couple family households (1.0%) and 50 of the single-parent households (25.5%) are living below the poverty level. Within the married-couple family households, those with 3 or 4 children have the highest poverty rate, with 3 households (6.7%) falling below the poverty line. Among the single-parent households, those with 1 or 2 children have the highest poverty rate, with 46 household (28.4%) living below poverty.
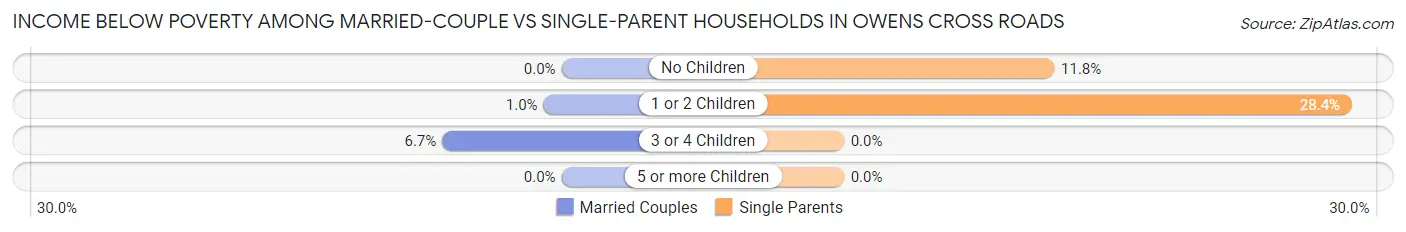
| Children | Married-Couple Families | Single-Parent Households |
| No Children | 0 (0.0%) | 4 (11.8%) |
| 1 or 2 Children | 2 (1.0%) | 46 (28.4%) |
| 3 or 4 Children | 3 (6.7%) | 0 (0.0%) |
| 5 or more Children | 0 (0.0%) | 0 (0.0%) |
| Total | 5 (1.0%) | 50 (25.5%) |
Race in Owens Cross Roads
The most populous races in Owens Cross Roads are White / Caucasian (2,113 | 82.3%), Black / African American (202 | 7.9%), and Two or more Races (179 | 7.0%).
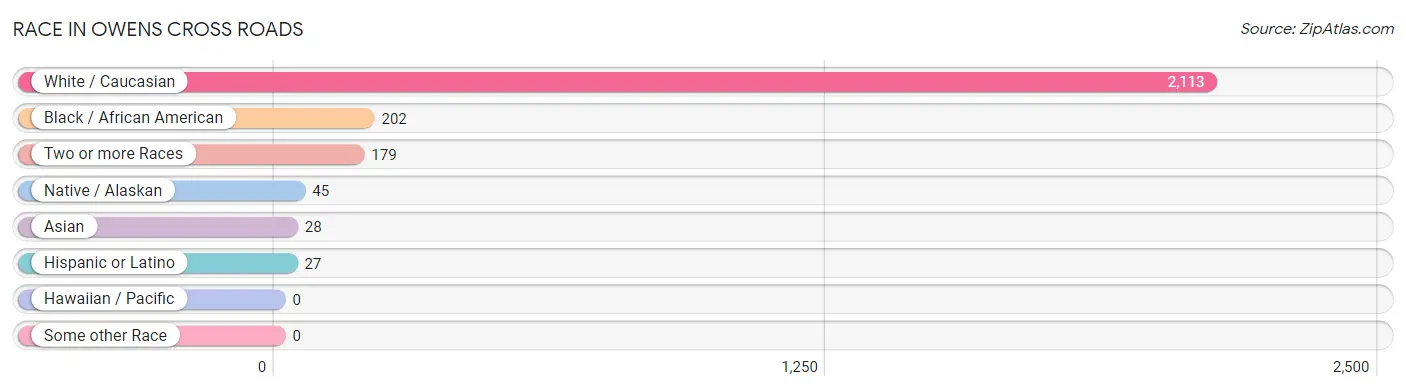
| Race | # Population | % Population |
| Asian | 28 | 1.1% |
| Black / African American | 202 | 7.9% |
| Hawaiian / Pacific | 0 | 0.0% |
| Hispanic or Latino | 27 | 1.1% |
| Native / Alaskan | 45 | 1.8% |
| White / Caucasian | 2,113 | 82.3% |
| Two or more Races | 179 | 7.0% |
| Some other Race | 0 | 0.0% |
| Total | 2,567 | 100.0% |
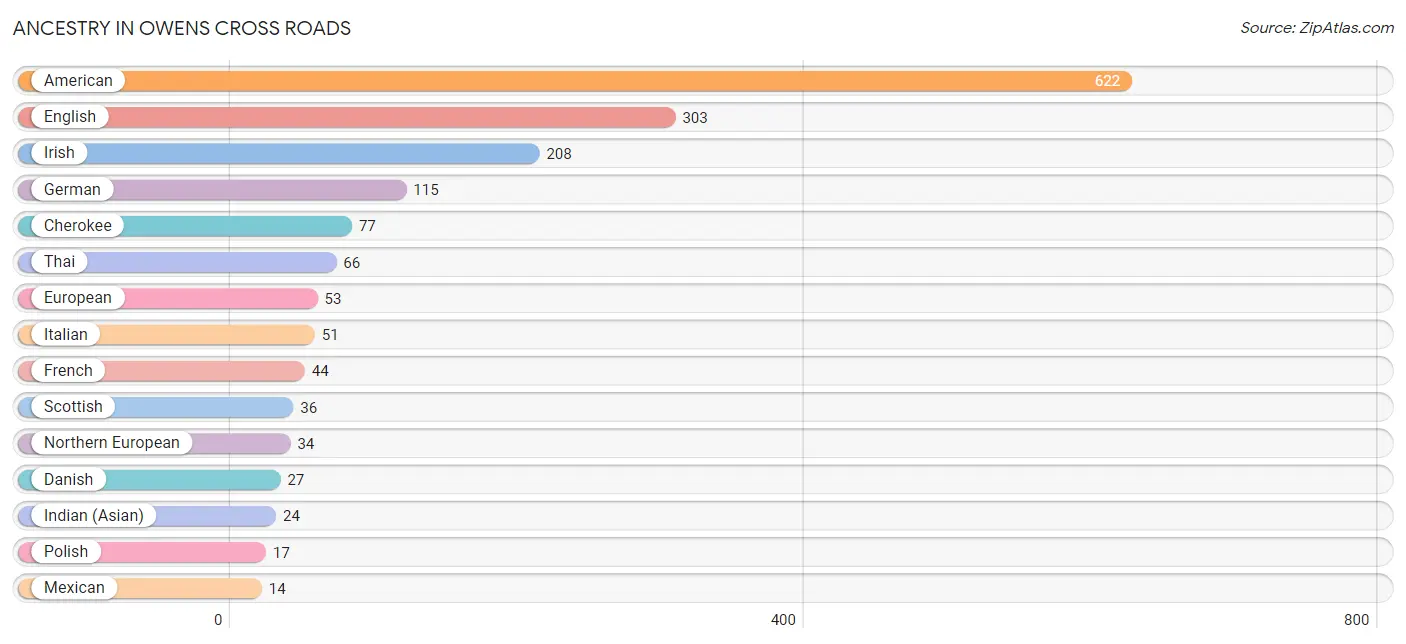
Ancestry in Owens Cross Roads
The most populous ancestries reported in Owens Cross Roads are American (622 | 24.2%), English (303 | 11.8%), Irish (208 | 8.1%), German (115 | 4.5%), and Cherokee (77 | 3.0%), together accounting for 51.6% of all Owens Cross Roads residents.
| Ancestry | # Population | % Population |
| American | 622 | 24.2% |
| British | 13 | 0.5% |
| Cherokee | 77 | 3.0% |
| Danish | 27 | 1.1% |
| English | 303 | 11.8% |
| European | 53 | 2.1% |
| French | 44 | 1.7% |
| French Canadian | 3 | 0.1% |
| German | 115 | 4.5% |
| Indian (Asian) | 24 | 0.9% |
| Irish | 208 | 8.1% |
| Italian | 51 | 2.0% |
| Lithuanian | 5 | 0.2% |
| Mexican | 14 | 0.5% |
| Northern European | 34 | 1.3% |
| Norwegian | 7 | 0.3% |
| Osage | 4 | 0.2% |
| Polish | 17 | 0.7% |
| Puerto Rican | 13 | 0.5% |
| Russian | 9 | 0.4% |
| Scotch-Irish | 11 | 0.4% |
| Scottish | 36 | 1.4% |
| Sri Lankan | 13 | 0.5% |
| Swedish | 14 | 0.5% |
| Thai | 66 | 2.6% |
| Trinidadian and Tobagonian | 13 | 0.5% |
| Welsh | 2 | 0.1% | View All 27 Rows |
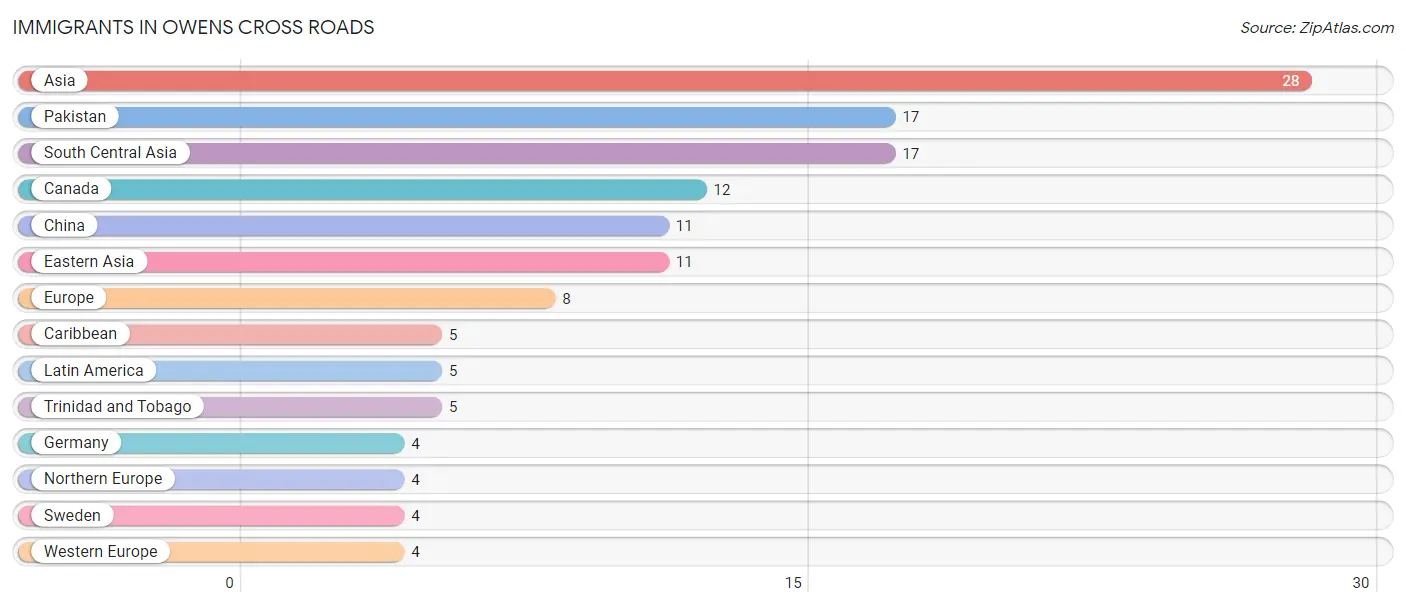
Immigrants in Owens Cross Roads
The most numerous immigrant groups reported in Owens Cross Roads came from Asia (28 | 1.1%), Pakistan (17 | 0.7%), South Central Asia (17 | 0.7%), Canada (12 | 0.5%), and China (11 | 0.4%), together accounting for 3.3% of all Owens Cross Roads residents.
| Immigration Origin | # Population | % Population |
| Asia | 28 | 1.1% |
| Canada | 12 | 0.5% |
| Caribbean | 5 | 0.2% |
| China | 11 | 0.4% |
| Eastern Asia | 11 | 0.4% |
| Europe | 8 | 0.3% |
| Germany | 4 | 0.2% |
| Latin America | 5 | 0.2% |
| Northern Europe | 4 | 0.2% |
| Pakistan | 17 | 0.7% |
| South Central Asia | 17 | 0.7% |
| Sweden | 4 | 0.2% |
| Trinidad and Tobago | 5 | 0.2% |
| Western Europe | 4 | 0.2% | View All 14 Rows |
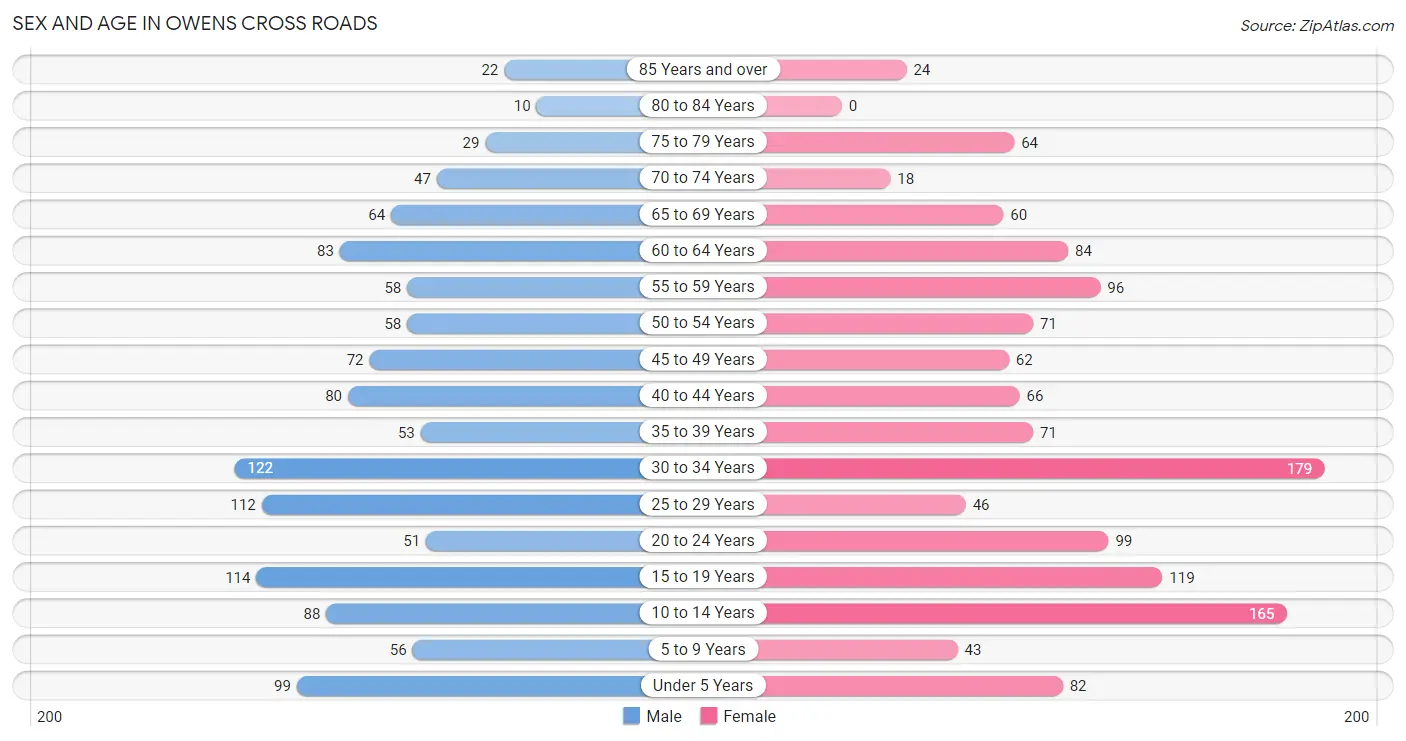
Sex and Age in Owens Cross Roads
Sex and Age in Owens Cross Roads
The most populous age groups in Owens Cross Roads are 30 to 34 Years (122 | 10.0%) for men and 30 to 34 Years (179 | 13.3%) for women.
| Age Bracket | Male | Female |
| Under 5 Years | 99 (8.1%) | 82 (6.1%) |
| 5 to 9 Years | 56 (4.6%) | 43 (3.2%) |
| 10 to 14 Years | 88 (7.2%) | 165 (12.2%) |
| 15 to 19 Years | 114 (9.4%) | 119 (8.8%) |
| 20 to 24 Years | 51 (4.2%) | 99 (7.3%) |
| 25 to 29 Years | 112 (9.2%) | 46 (3.4%) |
| 30 to 34 Years | 122 (10.0%) | 179 (13.3%) |
| 35 to 39 Years | 53 (4.3%) | 71 (5.3%) |
| 40 to 44 Years | 80 (6.6%) | 66 (4.9%) |
| 45 to 49 Years | 72 (5.9%) | 62 (4.6%) |
| 50 to 54 Years | 58 (4.8%) | 71 (5.3%) |
| 55 to 59 Years | 58 (4.8%) | 96 (7.1%) |
| 60 to 64 Years | 83 (6.8%) | 84 (6.2%) |
| 65 to 69 Years | 64 (5.2%) | 60 (4.4%) |
| 70 to 74 Years | 47 (3.9%) | 18 (1.3%) |
| 75 to 79 Years | 29 (2.4%) | 64 (4.7%) |
| 80 to 84 Years | 10 (0.8%) | 0 (0.0%) |
| 85 Years and over | 22 (1.8%) | 24 (1.8%) |
| Total | 1,218 (100.0%) | 1,349 (100.0%) |
Families and Households in Owens Cross Roads
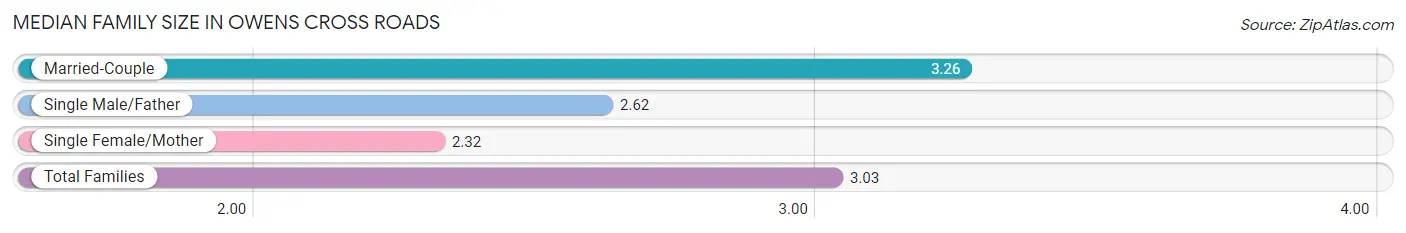
Median Family Size in Owens Cross Roads
The median family size in Owens Cross Roads is 3.03 persons per family, with married-couple families (516 | 72.5%) accounting for the largest median family size of 3.26 persons per family. On the other hand, single female/mother families (125 | 17.6%) represent the smallest median family size with 2.32 persons per family.
| Family Type | # Families | Family Size |
| Married-Couple | 516 (72.5%) | 3.26 |
| Single Male/Father | 71 (10.0%) | 2.62 |
| Single Female/Mother | 125 (17.6%) | 2.32 |
| Total Families | 712 (100.0%) | 3.03 |
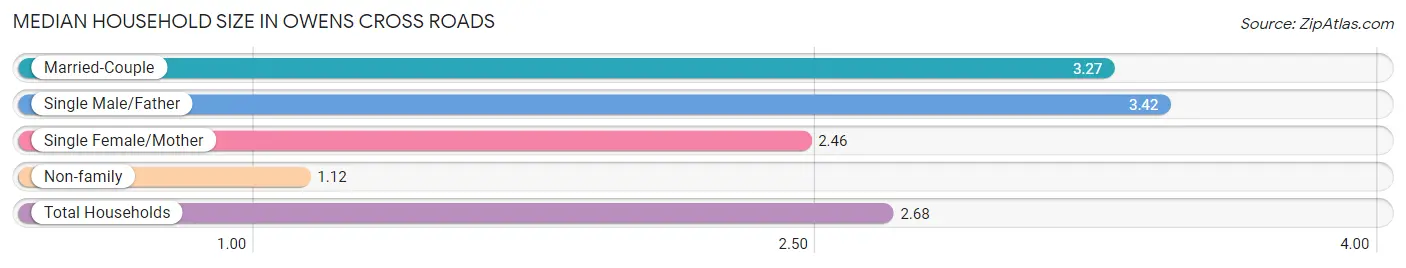
Median Household Size in Owens Cross Roads
The median household size in Owens Cross Roads is 2.68 persons per household, with single male/father households (71 | 7.7%) accounting for the largest median household size of 3.42 persons per household. non-family households (215 | 23.2%) represent the smallest median household size with 1.12 persons per household.
| Household Type | # Households | Household Size |
| Married-Couple | 516 (55.7%) | 3.27 |
| Single Male/Father | 71 (7.7%) | 3.42 |
| Single Female/Mother | 125 (13.5%) | 2.46 |
| Non-family | 215 (23.2%) | 1.12 |
| Total Households | 927 (100.0%) | 2.68 |
Household Size by Marriage Status in Owens Cross Roads
Out of a total of 927 households in Owens Cross Roads, 712 (76.8%) are family households, while 215 (23.2%) are nonfamily households. The most numerous type of family households are 2-person households, comprising 328, and the most common type of nonfamily households are 1-person households, comprising 196.
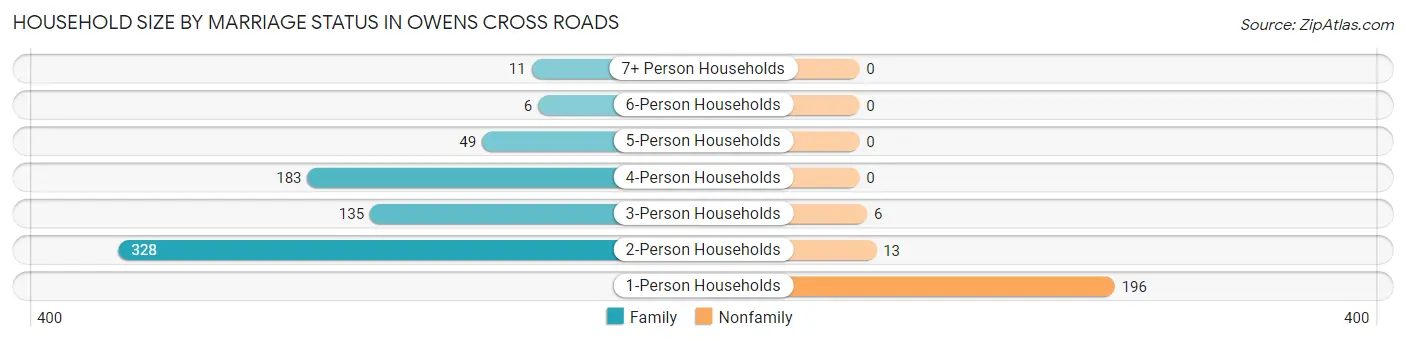
| Household Size | Family Households | Nonfamily Households |
| 1-Person Households | - | 196 (21.1%) |
| 2-Person Households | 328 (35.4%) | 13 (1.4%) |
| 3-Person Households | 135 (14.6%) | 6 (0.6%) |
| 4-Person Households | 183 (19.7%) | 0 (0.0%) |
| 5-Person Households | 49 (5.3%) | 0 (0.0%) |
| 6-Person Households | 6 (0.6%) | 0 (0.0%) |
| 7+ Person Households | 11 (1.2%) | 0 (0.0%) |
| Total | 712 (76.8%) | 215 (23.2%) |
Female Fertility in Owens Cross Roads
Fertility by Age in Owens Cross Roads
Average fertility rate in Owens Cross Roads is 43.0 births per 1,000 women. Women in the age bracket of 20 to 34 years have the highest fertility rate with 71.0 births per 1,000 women. Women in the age bracket of 20 to 34 years acount for 82.1% of all women with births.
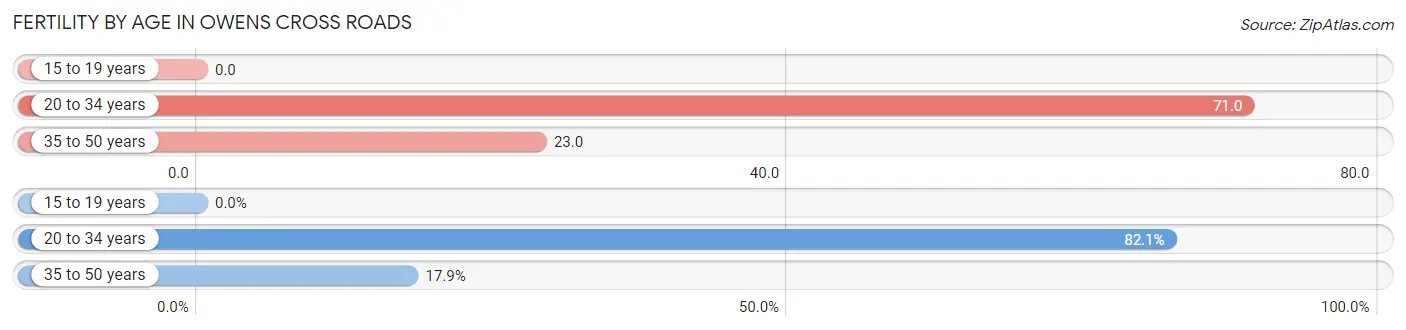
| Age Bracket | Women with Births | Births / 1,000 Women |
| 15 to 19 years | 0 (0.0%) | 0.0 |
| 20 to 34 years | 23 (82.1%) | 71.0 |
| 35 to 50 years | 5 (17.9%) | 23.0 |
| Total | 28 (100.0%) | 43.0 |
Fertility by Age by Marriage Status in Owens Cross Roads
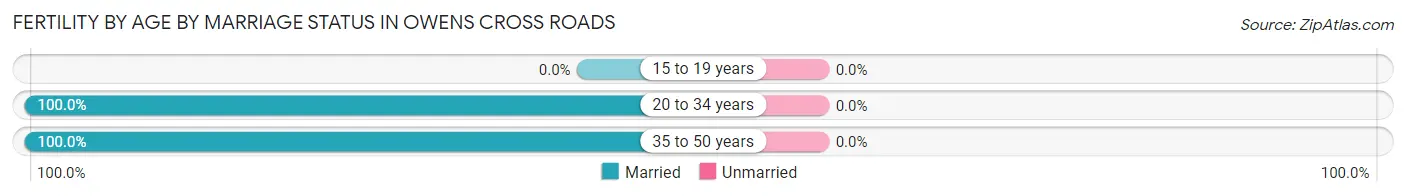
| Age Bracket | Married | Unmarried |
| 15 to 19 years | 0 (0.0%) | 0 (0.0%) |
| 20 to 34 years | 23 (100.0%) | 0 (0.0%) |
| 35 to 50 years | 5 (100.0%) | 0 (0.0%) |
| Total | 28 (100.0%) | 0 (0.0%) |
Fertility by Education in Owens Cross Roads
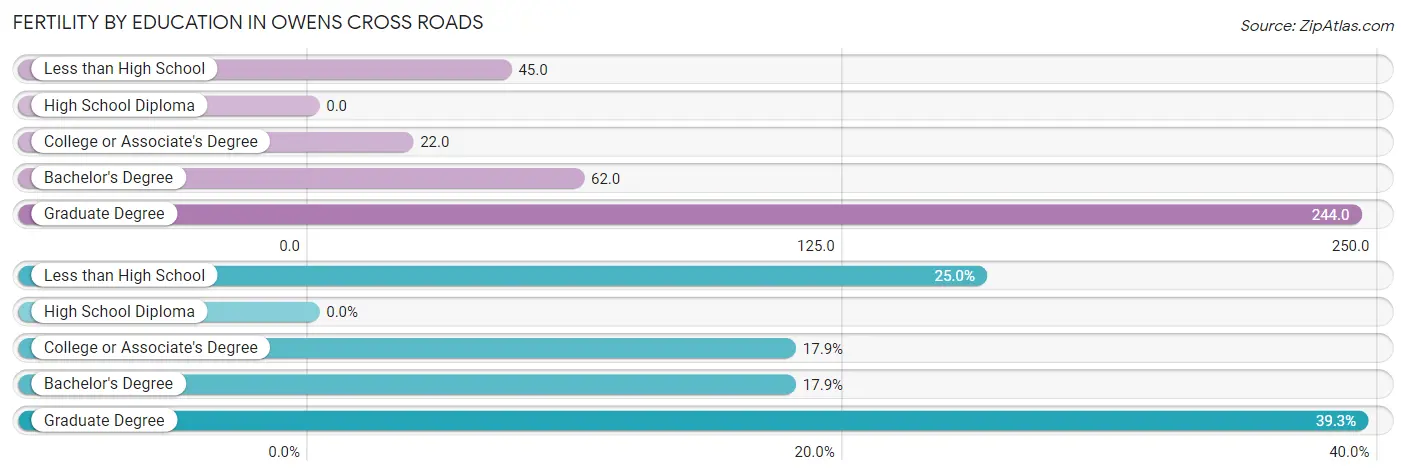
| Educational Attainment | Women with Births | Births / 1,000 Women |
| Less than High School | 7 (25.0%) | 45.0 |
| High School Diploma | 0 (0.0%) | 0.0 |
| College or Associate's Degree | 5 (17.9%) | 22.0 |
| Bachelor's Degree | 5 (17.9%) | 62.0 |
| Graduate Degree | 11 (39.3%) | 244.0 |
| Total | 28 (100.0%) | 43.0 |
Fertility by Education by Marriage Status in Owens Cross Roads
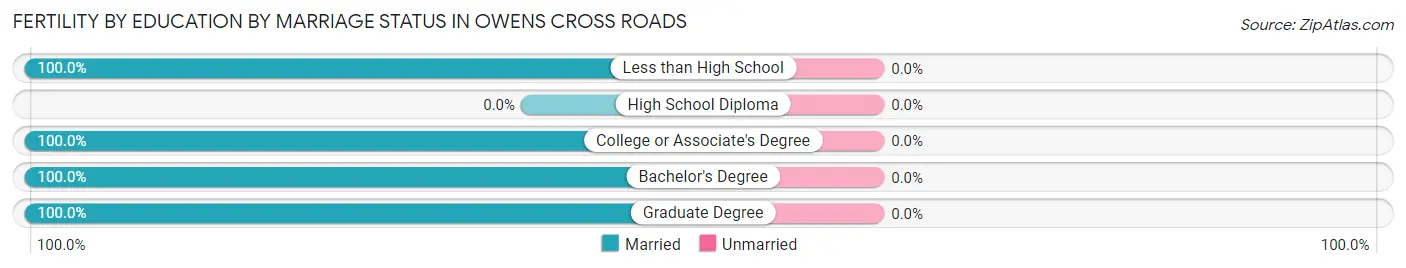
| Educational Attainment | Married | Unmarried |
| Less than High School | 7 (100.0%) | 0 (0.0%) |
| High School Diploma | 0 (0.0%) | 0 (0.0%) |
| College or Associate's Degree | 5 (100.0%) | 0 (0.0%) |
| Bachelor's Degree | 5 (100.0%) | 0 (0.0%) |
| Graduate Degree | 11 (100.0%) | 0 (0.0%) |
| Total | 28 (100.0%) | 0 (0.0%) |
Employment Characteristics in Owens Cross Roads
Employment by Class of Employer in Owens Cross Roads
Among the 1,190 employed individuals in Owens Cross Roads, private company employees (744 | 62.5%), not-for-profit organizations (104 | 8.7%), and local government employees (99 | 8.3%) make up the most common classes of employment.
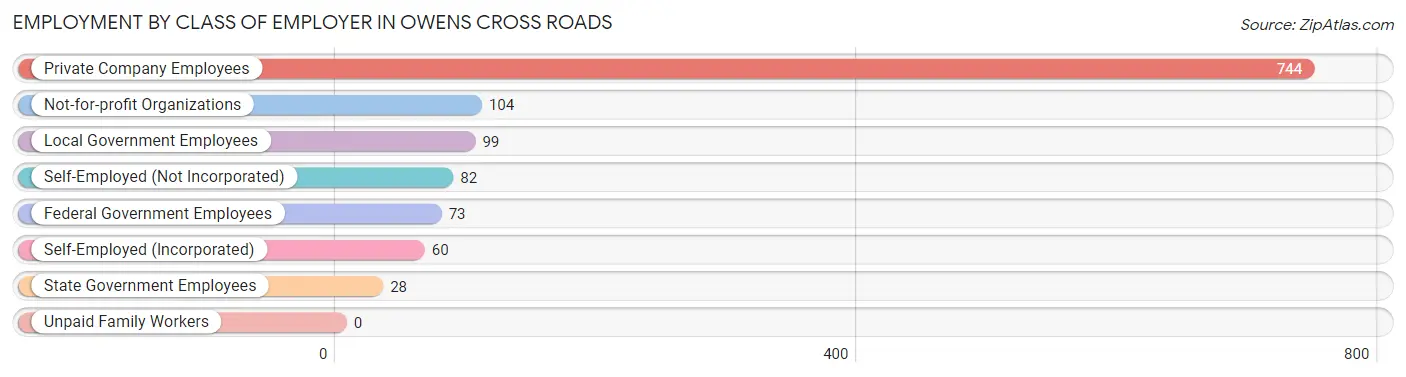
| Employer Class | # Employees | % Employees |
| Private Company Employees | 744 | 62.5% |
| Self-Employed (Incorporated) | 60 | 5.0% |
| Self-Employed (Not Incorporated) | 82 | 6.9% |
| Not-for-profit Organizations | 104 | 8.7% |
| Local Government Employees | 99 | 8.3% |
| State Government Employees | 28 | 2.4% |
| Federal Government Employees | 73 | 6.1% |
| Unpaid Family Workers | 0 | 0.0% |
| Total | 1,190 | 100.0% |
Employment Status by Age in Owens Cross Roads
According to the labor force statistics for Owens Cross Roads, out of the total population over 16 years of age (1,953), 67.0% or 1,309 individuals are in the labor force, with 7.9% or 103 of them unemployed. The age group with the highest labor force participation rate is 30 to 34 years, with 94.0% or 283 individuals in the labor force. Within the labor force, the 30 to 34 years age range has the highest percentage of unemployed individuals, with 18.0% or 51 of them being unemployed.
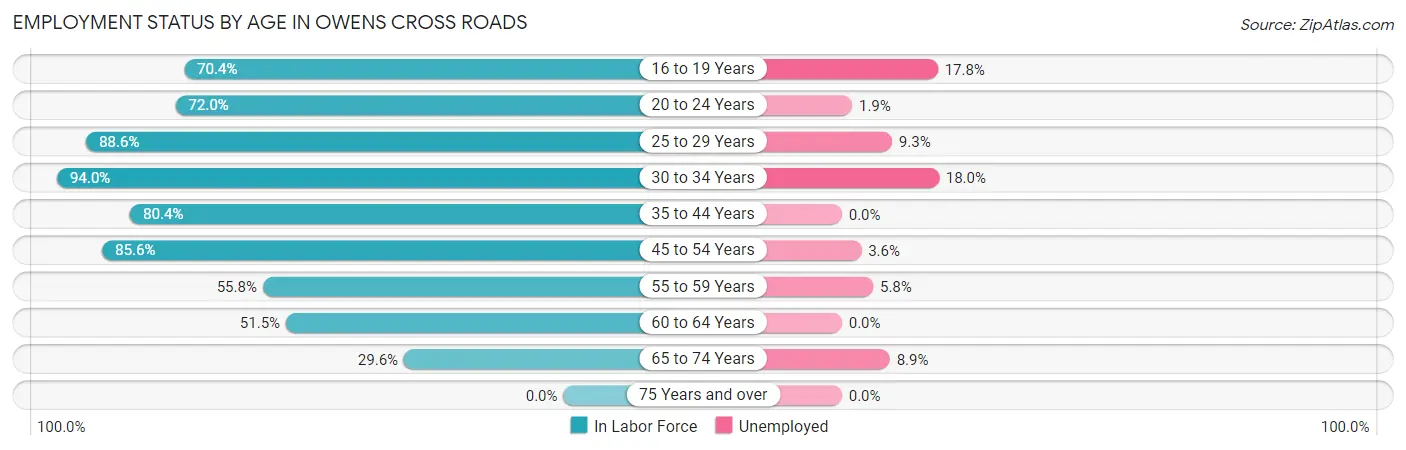
| Age Bracket | In Labor Force | Unemployed |
| 16 to 19 Years | 107 (70.4%) | 19 (17.8%) |
| 20 to 24 Years | 108 (72.0%) | 2 (1.9%) |
| 25 to 29 Years | 140 (88.6%) | 13 (9.3%) |
| 30 to 34 Years | 283 (94.0%) | 51 (18.0%) |
| 35 to 44 Years | 217 (80.4%) | 0 (0.0%) |
| 45 to 54 Years | 225 (85.6%) | 8 (3.6%) |
| 55 to 59 Years | 86 (55.8%) | 5 (5.8%) |
| 60 to 64 Years | 86 (51.5%) | 0 (0.0%) |
| 65 to 74 Years | 56 (29.6%) | 5 (8.9%) |
| 75 Years and over | 0 (0.0%) | 0 (0.0%) |
| Total | 1,309 (67.0%) | 103 (7.9%) |
Employment Status by Educational Attainment in Owens Cross Roads
According to labor force statistics for Owens Cross Roads, 79.0% of individuals (1,037) out of the total population between 25 and 64 years of age (1,313) are in the labor force, with 7.4% or 77 of them being unemployed. The group with the highest labor force participation rate are those with the educational attainment of bachelor's degree or higher, with 81.3% or 304 individuals in the labor force. Within the labor force, individuals with less than high school education have the highest percentage of unemployment, with 34.5% or 58 of them being unemployed.
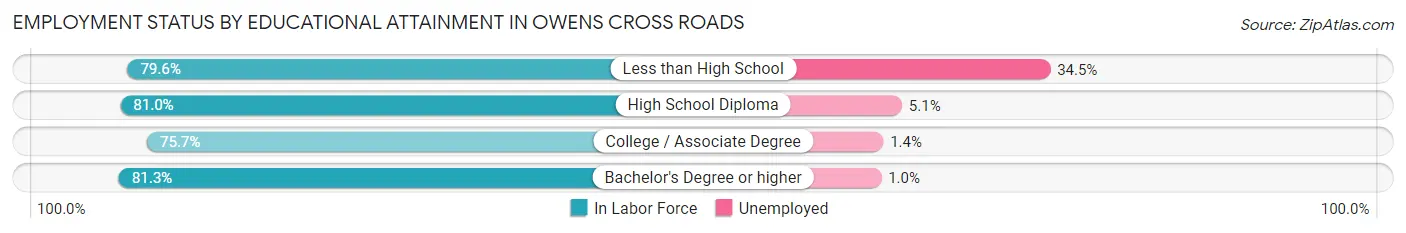
| Educational Attainment | In Labor Force | Unemployed |
| Less than High School | 168 (79.6%) | 73 (34.5%) |
| High School Diploma | 217 (81.0%) | 14 (5.1%) |
| College / Associate Degree | 348 (75.7%) | 6 (1.4%) |
| Bachelor's Degree or higher | 304 (81.3%) | 4 (1.0%) |
| Total | 1,037 (79.0%) | 97 (7.4%) |
Employment Occupations by Sex in Owens Cross Roads
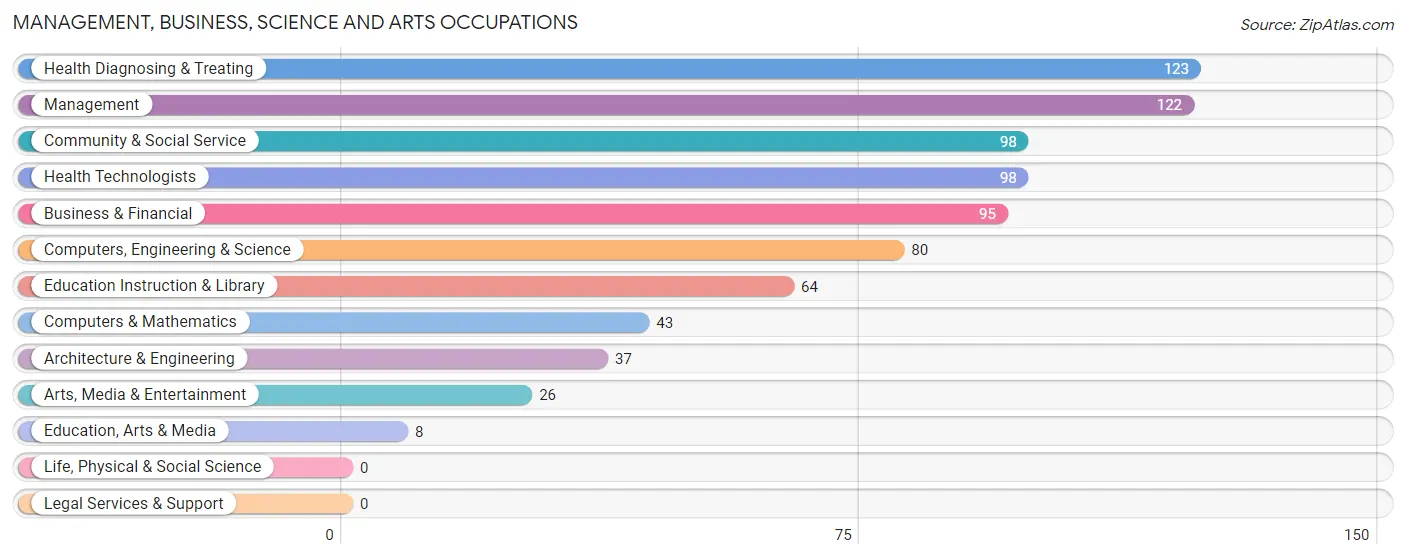
Management, Business, Science and Arts Occupations
The most common Management, Business, Science and Arts occupations in Owens Cross Roads are Health Diagnosing & Treating (123 | 10.2%), Management (122 | 10.1%), Community & Social Service (98 | 8.1%), Health Technologists (98 | 8.1%), and Business & Financial (95 | 7.9%).
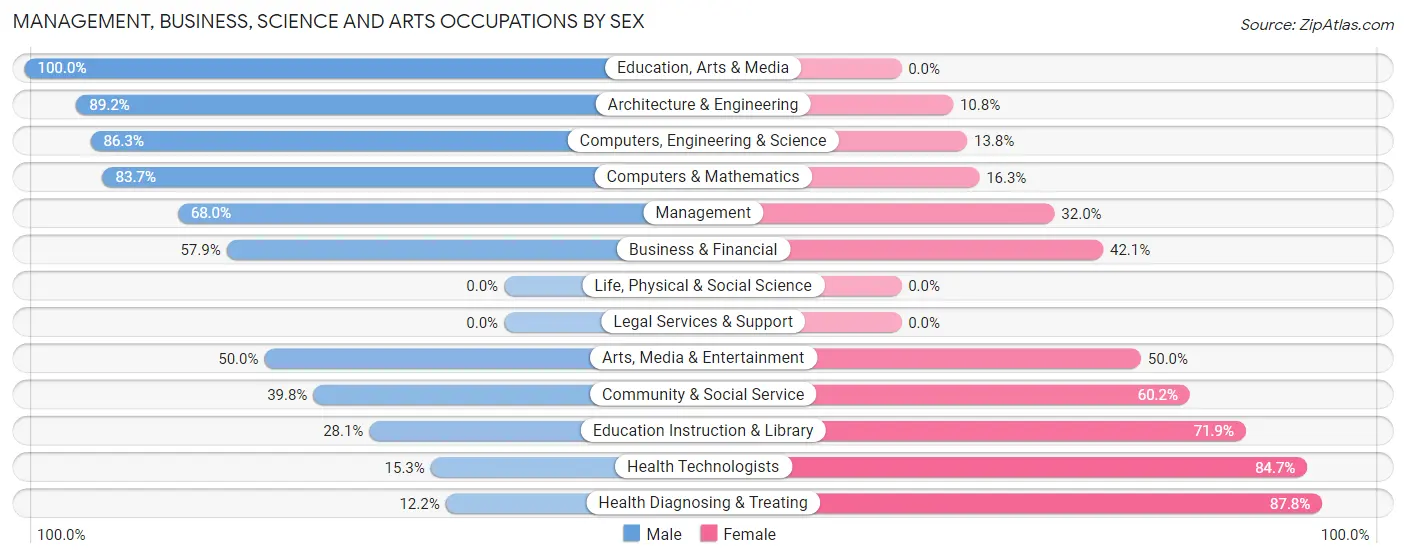
Management, Business, Science and Arts Occupations by Sex
Within the Management, Business, Science and Arts occupations in Owens Cross Roads, the most male-oriented occupations are Education, Arts & Media (100.0%), Architecture & Engineering (89.2%), and Computers, Engineering & Science (86.3%), while the most female-oriented occupations are Health Diagnosing & Treating (87.8%), Health Technologists (84.7%), and Education Instruction & Library (71.9%).
| Occupation | Male | Female |
| Management | 83 (68.0%) | 39 (32.0%) |
| Business & Financial | 55 (57.9%) | 40 (42.1%) |
| Computers, Engineering & Science | 69 (86.3%) | 11 (13.8%) |
| Computers & Mathematics | 36 (83.7%) | 7 (16.3%) |
| Architecture & Engineering | 33 (89.2%) | 4 (10.8%) |
| Life, Physical & Social Science | 0 (0.0%) | 0 (0.0%) |
| Community & Social Service | 39 (39.8%) | 59 (60.2%) |
| Education, Arts & Media | 8 (100.0%) | 0 (0.0%) |
| Legal Services & Support | 0 (0.0%) | 0 (0.0%) |
| Education Instruction & Library | 18 (28.1%) | 46 (71.9%) |
| Arts, Media & Entertainment | 13 (50.0%) | 13 (50.0%) |
| Health Diagnosing & Treating | 15 (12.2%) | 108 (87.8%) |
| Health Technologists | 15 (15.3%) | 83 (84.7%) |
| Total (Category) | 261 (50.4%) | 257 (49.6%) |
| Total (Overall) | 684 (56.8%) | 521 (43.2%) |
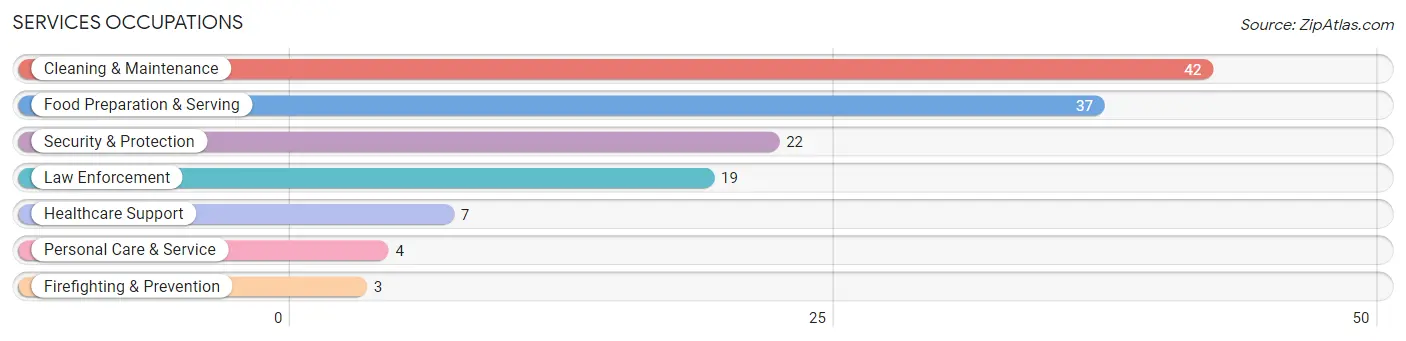
Services Occupations
The most common Services occupations in Owens Cross Roads are Cleaning & Maintenance (42 | 3.5%), Food Preparation & Serving (37 | 3.1%), Security & Protection (22 | 1.8%), Law Enforcement (19 | 1.6%), and Healthcare Support (7 | 0.6%).
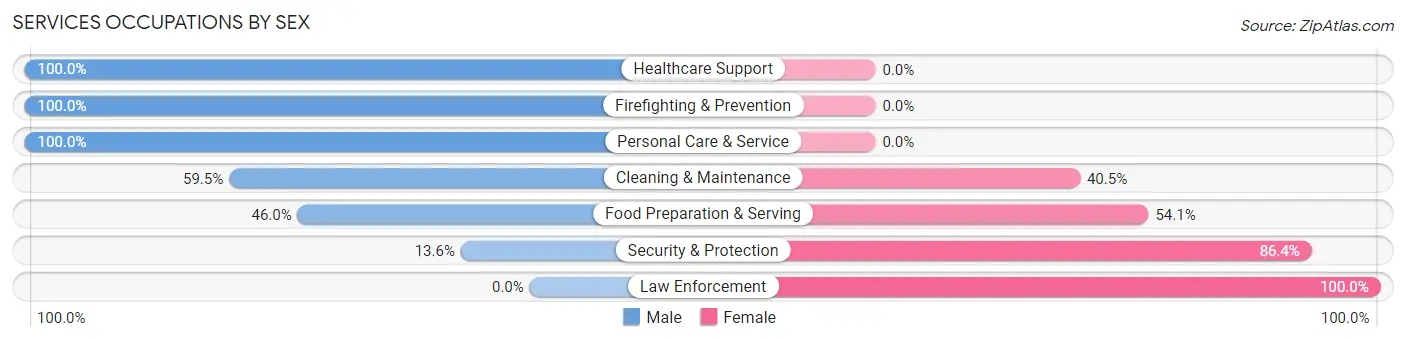
Services Occupations by Sex
Within the Services occupations in Owens Cross Roads, the most male-oriented occupations are Healthcare Support (100.0%), Firefighting & Prevention (100.0%), and Personal Care & Service (100.0%), while the most female-oriented occupations are Law Enforcement (100.0%), Security & Protection (86.4%), and Food Preparation & Serving (54.0%).
| Occupation | Male | Female |
| Healthcare Support | 7 (100.0%) | 0 (0.0%) |
| Security & Protection | 3 (13.6%) | 19 (86.4%) |
| Firefighting & Prevention | 3 (100.0%) | 0 (0.0%) |
| Law Enforcement | 0 (0.0%) | 19 (100.0%) |
| Food Preparation & Serving | 17 (46.0%) | 20 (54.0%) |
| Cleaning & Maintenance | 25 (59.5%) | 17 (40.5%) |
| Personal Care & Service | 4 (100.0%) | 0 (0.0%) |
| Total (Category) | 56 (50.0%) | 56 (50.0%) |
| Total (Overall) | 684 (56.8%) | 521 (43.2%) |
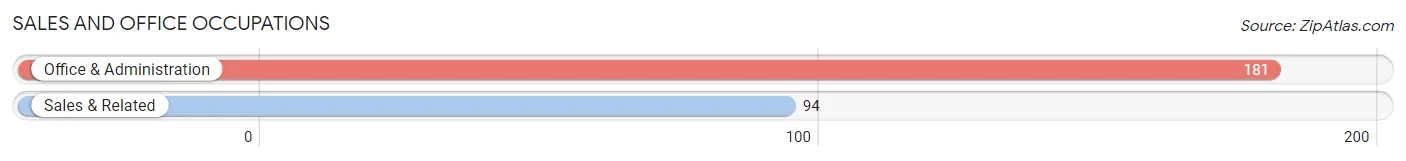
Sales and Office Occupations
The most common Sales and Office occupations in Owens Cross Roads are Office & Administration (181 | 15.0%), and Sales & Related (94 | 7.8%).
Sales and Office Occupations by Sex
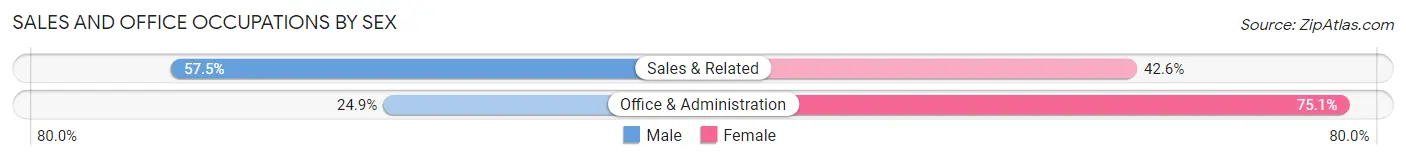
| Occupation | Male | Female |
| Sales & Related | 54 (57.5%) | 40 (42.5%) |
| Office & Administration | 45 (24.9%) | 136 (75.1%) |
| Total (Category) | 99 (36.0%) | 176 (64.0%) |
| Total (Overall) | 684 (56.8%) | 521 (43.2%) |
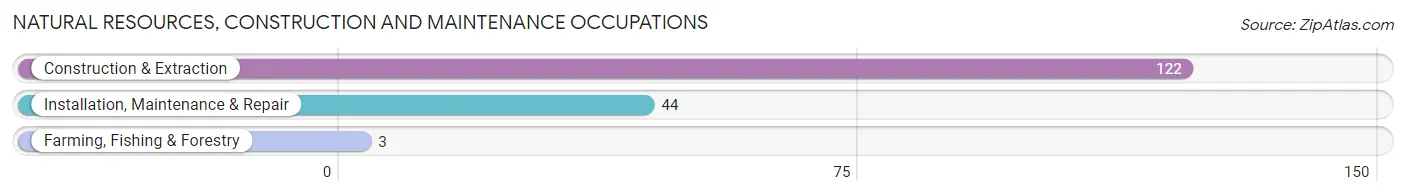
Natural Resources, Construction and Maintenance Occupations
The most common Natural Resources, Construction and Maintenance occupations in Owens Cross Roads are Construction & Extraction (122 | 10.1%), Installation, Maintenance & Repair (44 | 3.6%), and Farming, Fishing & Forestry (3 | 0.3%).
Natural Resources, Construction and Maintenance Occupations by Sex
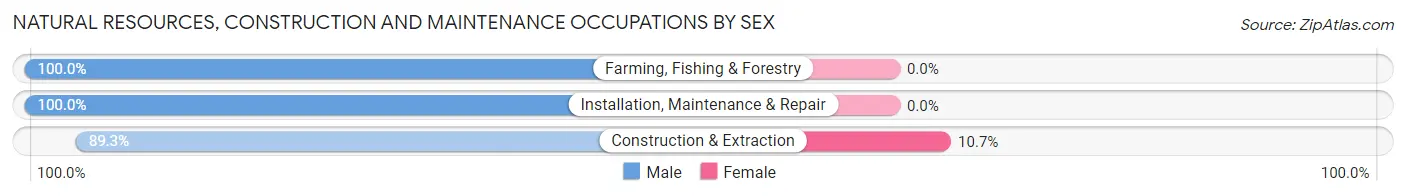
| Occupation | Male | Female |
| Farming, Fishing & Forestry | 3 (100.0%) | 0 (0.0%) |
| Construction & Extraction | 109 (89.3%) | 13 (10.7%) |
| Installation, Maintenance & Repair | 44 (100.0%) | 0 (0.0%) |
| Total (Category) | 156 (92.3%) | 13 (7.7%) |
| Total (Overall) | 684 (56.8%) | 521 (43.2%) |
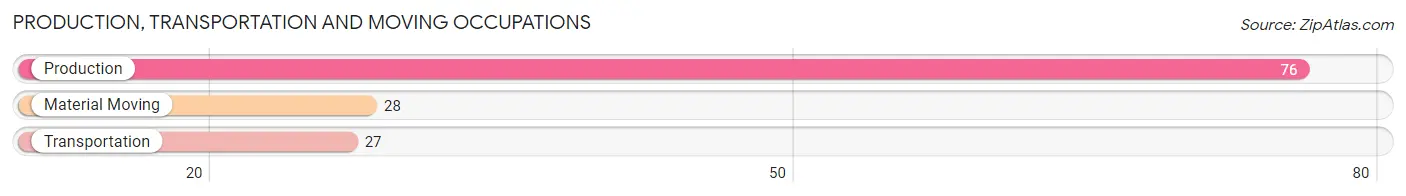
Production, Transportation and Moving Occupations
The most common Production, Transportation and Moving occupations in Owens Cross Roads are Production (76 | 6.3%), Material Moving (28 | 2.3%), and Transportation (27 | 2.2%).
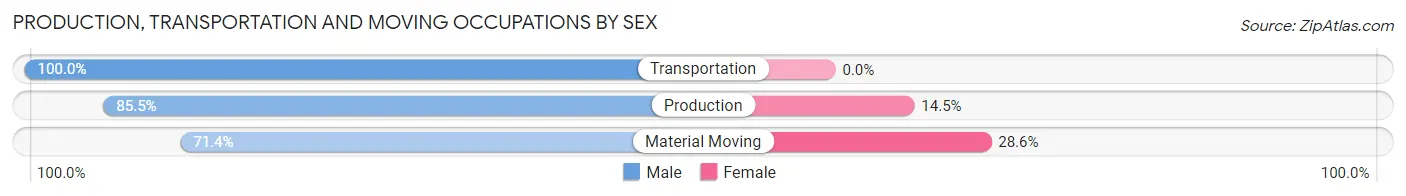
Production, Transportation and Moving Occupations by Sex
| Occupation | Male | Female |
| Production | 65 (85.5%) | 11 (14.5%) |
| Transportation | 27 (100.0%) | 0 (0.0%) |
| Material Moving | 20 (71.4%) | 8 (28.6%) |
| Total (Category) | 112 (85.5%) | 19 (14.5%) |
| Total (Overall) | 684 (56.8%) | 521 (43.2%) |
Employment Industries by Sex in Owens Cross Roads
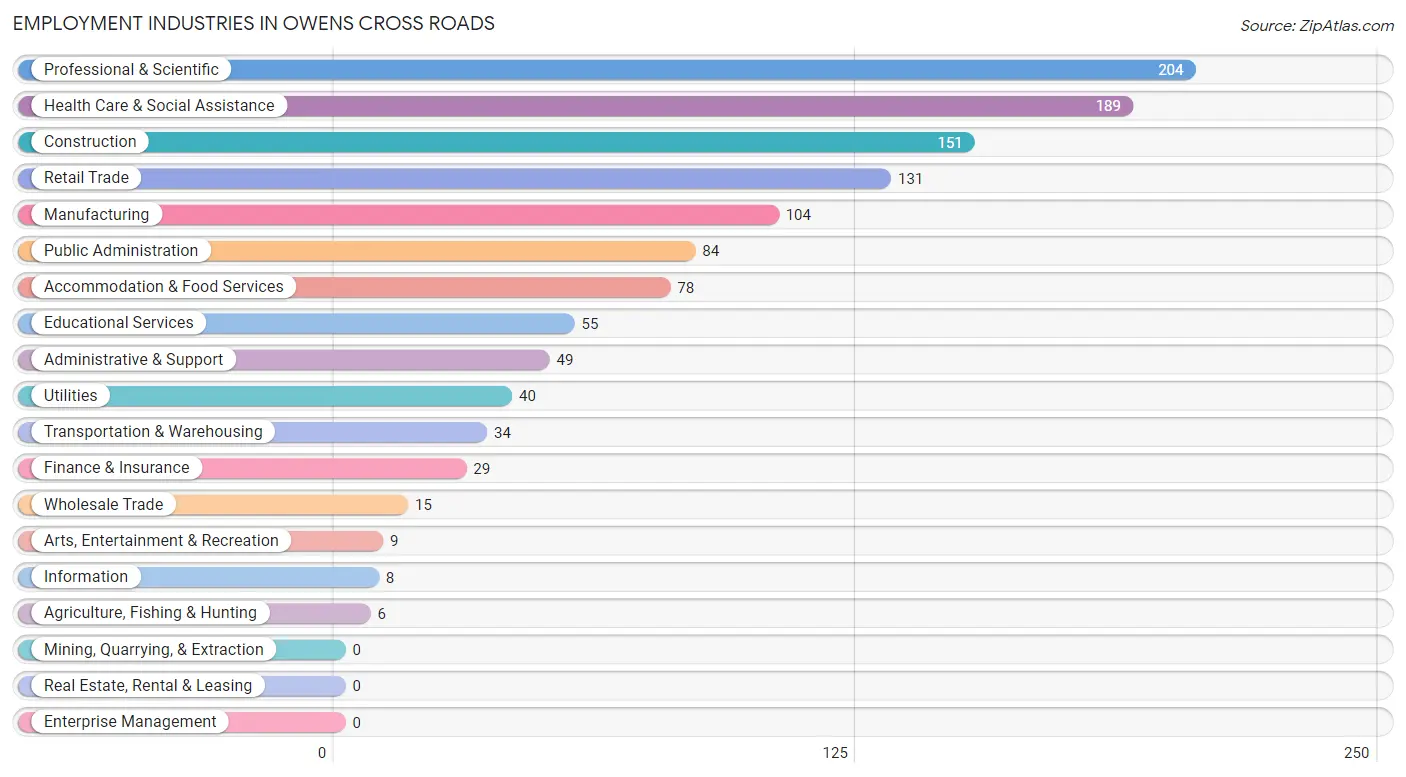
Employment Industries in Owens Cross Roads
The major employment industries in Owens Cross Roads include Professional & Scientific (204 | 16.9%), Health Care & Social Assistance (189 | 15.7%), Construction (151 | 12.5%), Retail Trade (131 | 10.9%), and Manufacturing (104 | 8.6%).
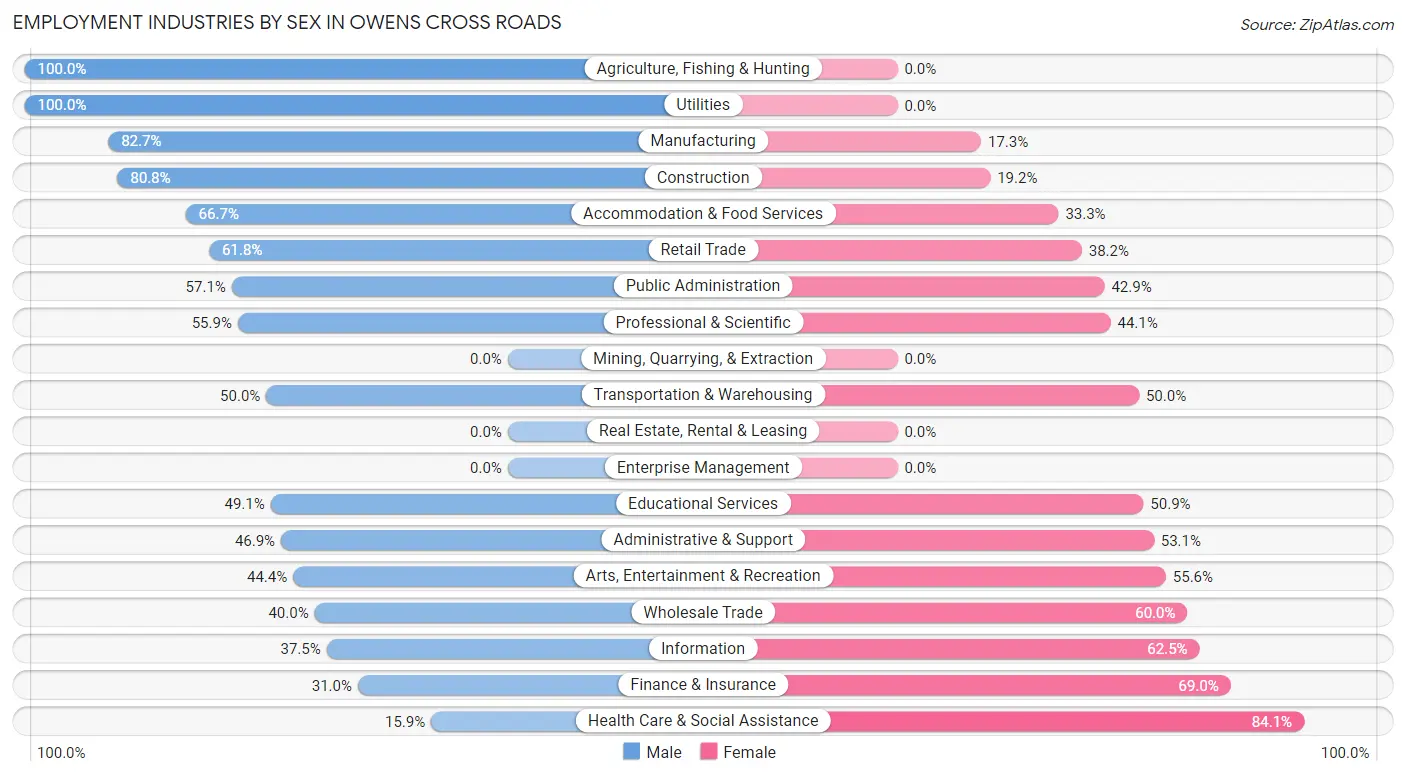
Employment Industries by Sex in Owens Cross Roads
The Owens Cross Roads industries that see more men than women are Agriculture, Fishing & Hunting (100.0%), Utilities (100.0%), and Manufacturing (82.7%), whereas the industries that tend to have a higher number of women are Health Care & Social Assistance (84.1%), Finance & Insurance (69.0%), and Information (62.5%).
| Industry | Male | Female |
| Agriculture, Fishing & Hunting | 6 (100.0%) | 0 (0.0%) |
| Mining, Quarrying, & Extraction | 0 (0.0%) | 0 (0.0%) |
| Construction | 122 (80.8%) | 29 (19.2%) |
| Manufacturing | 86 (82.7%) | 18 (17.3%) |
| Wholesale Trade | 6 (40.0%) | 9 (60.0%) |
| Retail Trade | 81 (61.8%) | 50 (38.2%) |
| Transportation & Warehousing | 17 (50.0%) | 17 (50.0%) |
| Utilities | 40 (100.0%) | 0 (0.0%) |
| Information | 3 (37.5%) | 5 (62.5%) |
| Finance & Insurance | 9 (31.0%) | 20 (69.0%) |
| Real Estate, Rental & Leasing | 0 (0.0%) | 0 (0.0%) |
| Professional & Scientific | 114 (55.9%) | 90 (44.1%) |
| Enterprise Management | 0 (0.0%) | 0 (0.0%) |
| Administrative & Support | 23 (46.9%) | 26 (53.1%) |
| Educational Services | 27 (49.1%) | 28 (50.9%) |
| Health Care & Social Assistance | 30 (15.9%) | 159 (84.1%) |
| Arts, Entertainment & Recreation | 4 (44.4%) | 5 (55.6%) |
| Accommodation & Food Services | 52 (66.7%) | 26 (33.3%) |
| Public Administration | 48 (57.1%) | 36 (42.9%) |
| Total | 684 (56.8%) | 521 (43.2%) |
Education in Owens Cross Roads
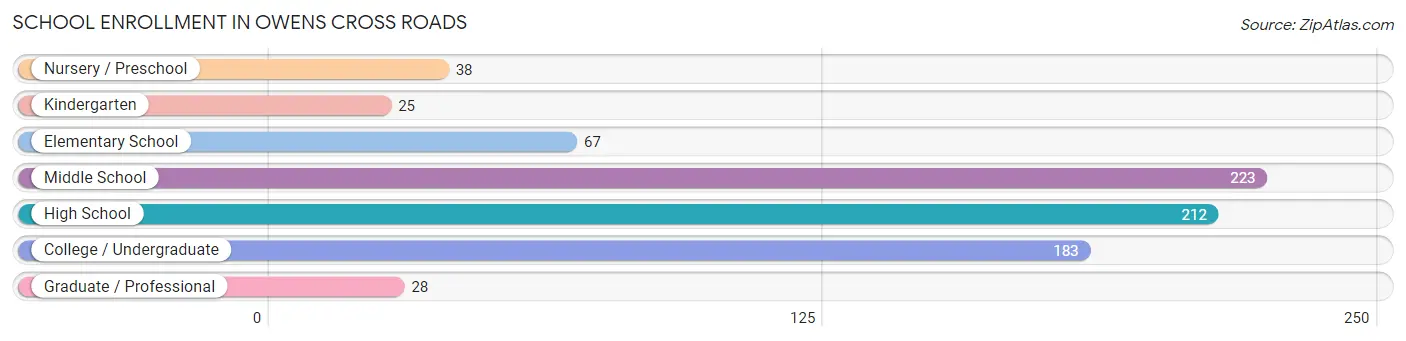
School Enrollment in Owens Cross Roads
The most common levels of schooling among the 776 students in Owens Cross Roads are middle school (223 | 28.7%), high school (212 | 27.3%), and college / undergraduate (183 | 23.6%).
| School Level | # Students | % Students |
| Nursery / Preschool | 38 | 4.9% |
| Kindergarten | 25 | 3.2% |
| Elementary School | 67 | 8.6% |
| Middle School | 223 | 28.7% |
| High School | 212 | 27.3% |
| College / Undergraduate | 183 | 23.6% |
| Graduate / Professional | 28 | 3.6% |
| Total | 776 | 100.0% |
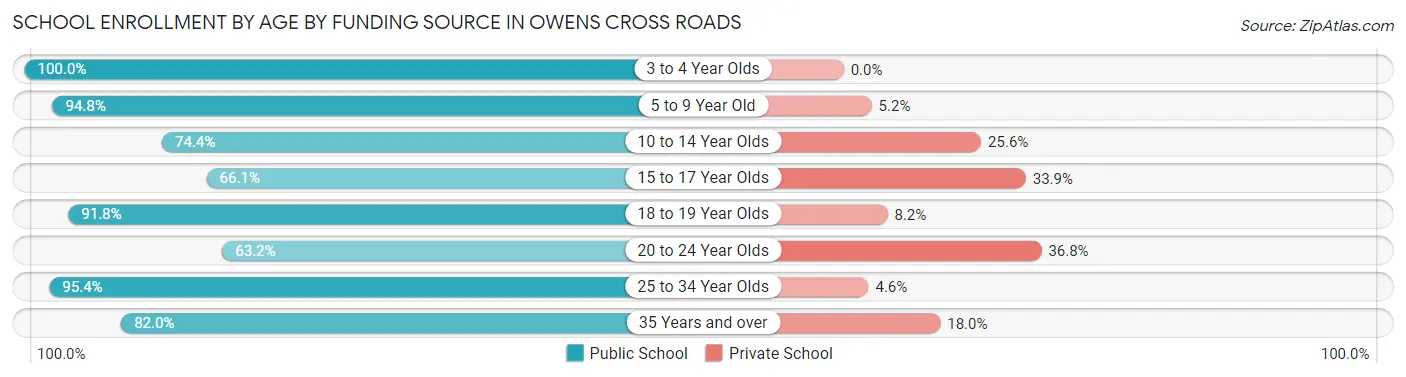
School Enrollment by Age by Funding Source in Owens Cross Roads
Out of a total of 776 students who are enrolled in schools in Owens Cross Roads, 158 (20.4%) attend a private institution, while the remaining 618 (79.6%) are enrolled in public schools. The age group of 20 to 24 year olds has the highest likelihood of being enrolled in private schools, with 14 (36.8% in the age bracket) enrolled. Conversely, the age group of 3 to 4 year olds has the lowest likelihood of being enrolled in a private school, with 18 (100.0% in the age bracket) attending a public institution.
| Age Bracket | Public School | Private School |
| 3 to 4 Year Olds | 18 (100.0%) | 0 (0.0%) |
| 5 to 9 Year Old | 91 (94.8%) | 5 (5.2%) |
| 10 to 14 Year Olds | 183 (74.4%) | 63 (25.6%) |
| 15 to 17 Year Olds | 113 (66.1%) | 58 (33.9%) |
| 18 to 19 Year Olds | 45 (91.8%) | 4 (8.2%) |
| 20 to 24 Year Olds | 24 (63.2%) | 14 (36.8%) |
| 25 to 34 Year Olds | 103 (95.4%) | 5 (4.6%) |
| 35 Years and over | 41 (82.0%) | 9 (18.0%) |
| Total | 618 (79.6%) | 158 (20.4%) |
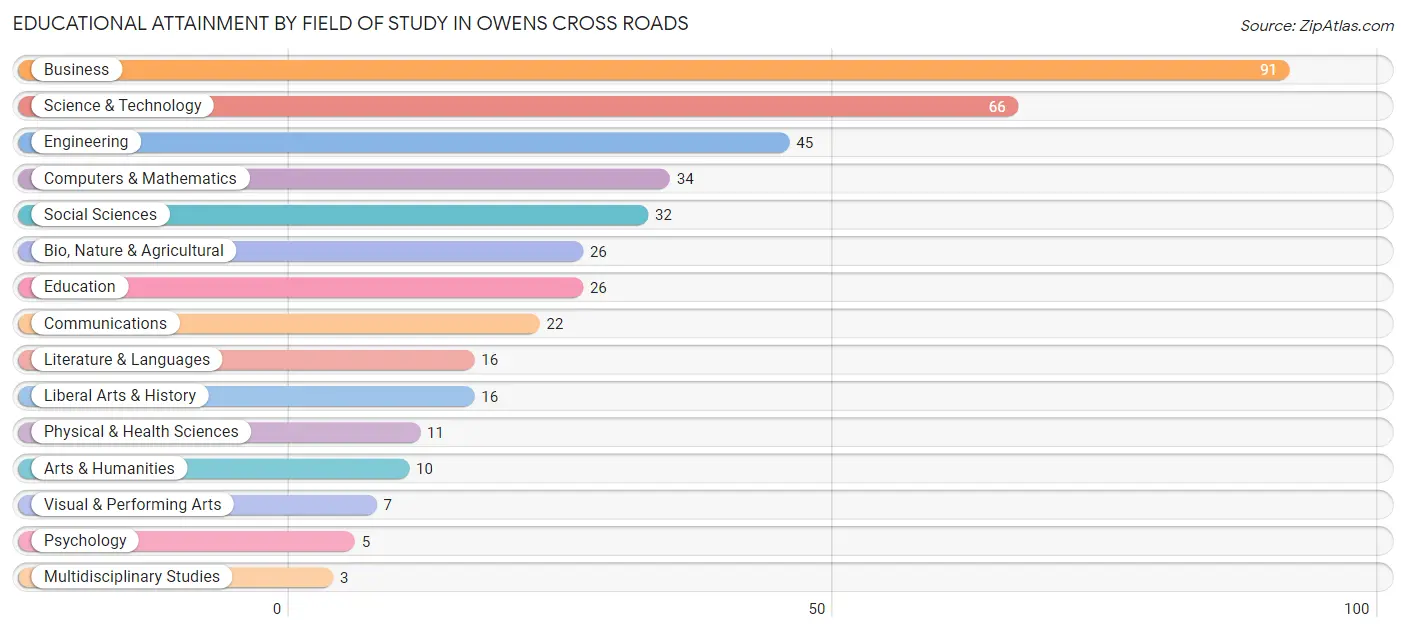
Educational Attainment by Field of Study in Owens Cross Roads
Business (91 | 22.2%), science & technology (66 | 16.1%), engineering (45 | 11.0%), computers & mathematics (34 | 8.3%), and social sciences (32 | 7.8%) are the most common fields of study among 410 individuals in Owens Cross Roads who have obtained a bachelor's degree or higher.
| Field of Study | # Graduates | % Graduates |
| Computers & Mathematics | 34 | 8.3% |
| Bio, Nature & Agricultural | 26 | 6.3% |
| Physical & Health Sciences | 11 | 2.7% |
| Psychology | 5 | 1.2% |
| Social Sciences | 32 | 7.8% |
| Engineering | 45 | 11.0% |
| Multidisciplinary Studies | 3 | 0.7% |
| Science & Technology | 66 | 16.1% |
| Business | 91 | 22.2% |
| Education | 26 | 6.3% |
| Literature & Languages | 16 | 3.9% |
| Liberal Arts & History | 16 | 3.9% |
| Visual & Performing Arts | 7 | 1.7% |
| Communications | 22 | 5.4% |
| Arts & Humanities | 10 | 2.4% |
| Total | 410 | 100.0% |
Transportation & Commute in Owens Cross Roads
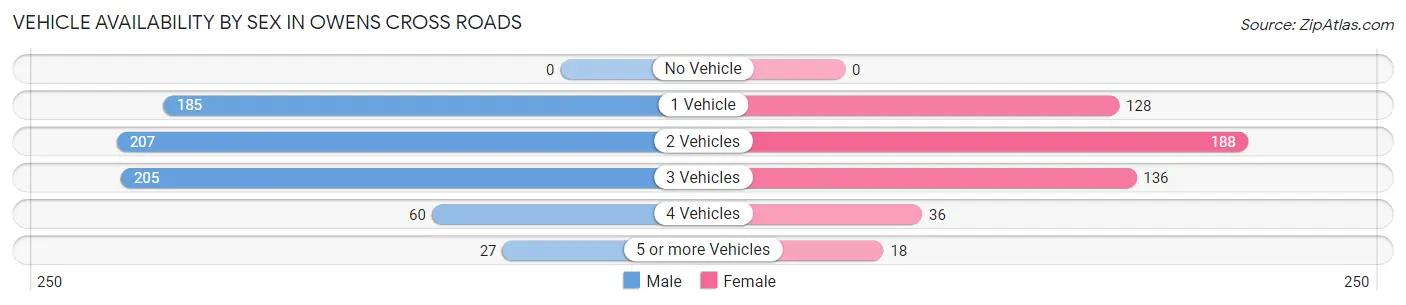
Vehicle Availability by Sex in Owens Cross Roads
The most prevalent vehicle ownership categories in Owens Cross Roads are males with 2 vehicles (207, accounting for 30.3%) and females with 2 vehicles (188, making up 40.9%).
| Vehicles Available | Male | Female |
| No Vehicle | 0 (0.0%) | 0 (0.0%) |
| 1 Vehicle | 185 (27.1%) | 128 (25.3%) |
| 2 Vehicles | 207 (30.3%) | 188 (37.1%) |
| 3 Vehicles | 205 (30.0%) | 136 (26.9%) |
| 4 Vehicles | 60 (8.8%) | 36 (7.1%) |
| 5 or more Vehicles | 27 (4.0%) | 18 (3.6%) |
| Total | 684 (100.0%) | 506 (100.0%) |
Commute Time in Owens Cross Roads
The most frequently occuring commute durations in Owens Cross Roads are 20 to 24 minutes (196 commuters, 18.5%), 30 to 34 minutes (165 commuters, 15.6%), and 45 to 59 minutes (124 commuters, 11.7%).
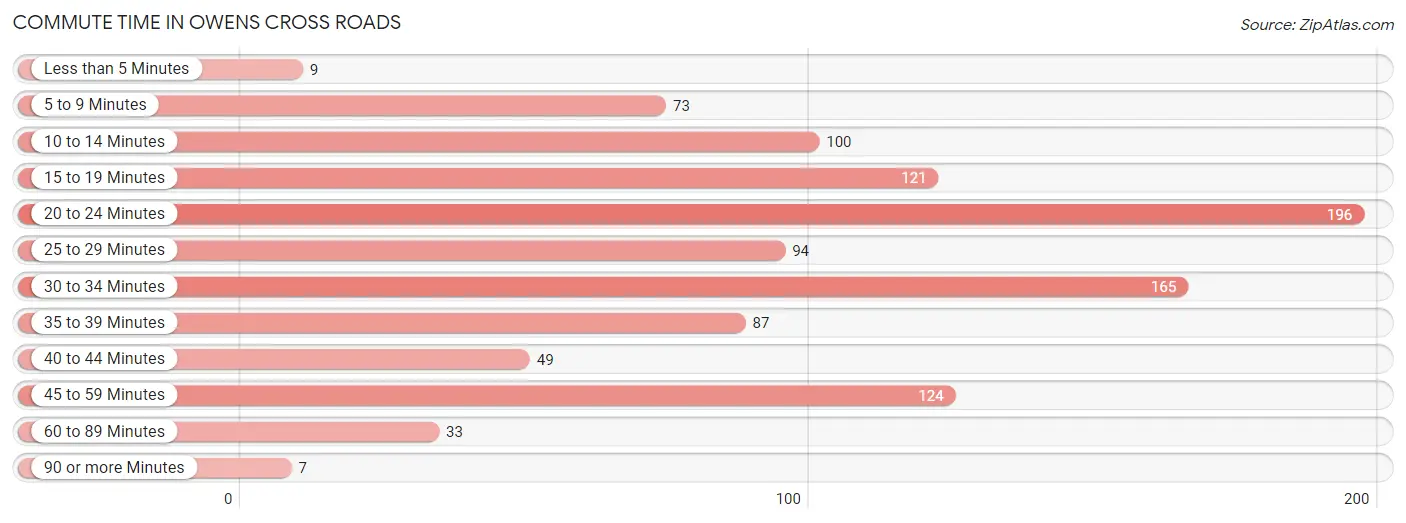
| Commute Time | # Commuters | % Commuters |
| Less than 5 Minutes | 9 | 0.9% |
| 5 to 9 Minutes | 73 | 6.9% |
| 10 to 14 Minutes | 100 | 9.5% |
| 15 to 19 Minutes | 121 | 11.4% |
| 20 to 24 Minutes | 196 | 18.5% |
| 25 to 29 Minutes | 94 | 8.9% |
| 30 to 34 Minutes | 165 | 15.6% |
| 35 to 39 Minutes | 87 | 8.2% |
| 40 to 44 Minutes | 49 | 4.6% |
| 45 to 59 Minutes | 124 | 11.7% |
| 60 to 89 Minutes | 33 | 3.1% |
| 90 or more Minutes | 7 | 0.7% |
Commute Time by Sex in Owens Cross Roads
The most common commute times in Owens Cross Roads are 30 to 34 minutes (127 commuters, 21.7%) for males and 20 to 24 minutes (120 commuters, 25.3%) for females.
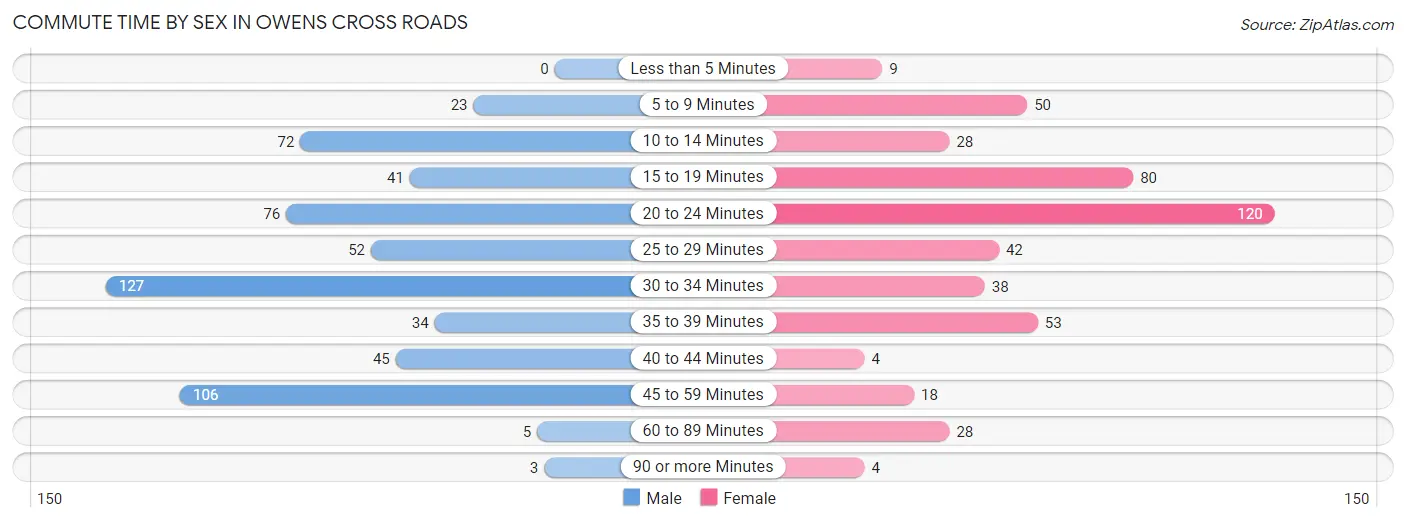
| Commute Time | Male | Female |
| Less than 5 Minutes | 0 (0.0%) | 9 (1.9%) |
| 5 to 9 Minutes | 23 (3.9%) | 50 (10.5%) |
| 10 to 14 Minutes | 72 (12.3%) | 28 (5.9%) |
| 15 to 19 Minutes | 41 (7.0%) | 80 (16.9%) |
| 20 to 24 Minutes | 76 (13.0%) | 120 (25.3%) |
| 25 to 29 Minutes | 52 (8.9%) | 42 (8.9%) |
| 30 to 34 Minutes | 127 (21.7%) | 38 (8.0%) |
| 35 to 39 Minutes | 34 (5.8%) | 53 (11.2%) |
| 40 to 44 Minutes | 45 (7.7%) | 4 (0.8%) |
| 45 to 59 Minutes | 106 (18.1%) | 18 (3.8%) |
| 60 to 89 Minutes | 5 (0.9%) | 28 (5.9%) |
| 90 or more Minutes | 3 (0.5%) | 4 (0.8%) |
Time of Departure to Work by Sex in Owens Cross Roads
The most frequent times of departure to work in Owens Cross Roads are 6:30 AM to 6:59 AM (189, 32.4%) for males and 6:30 AM to 6:59 AM (103, 21.7%) for females.
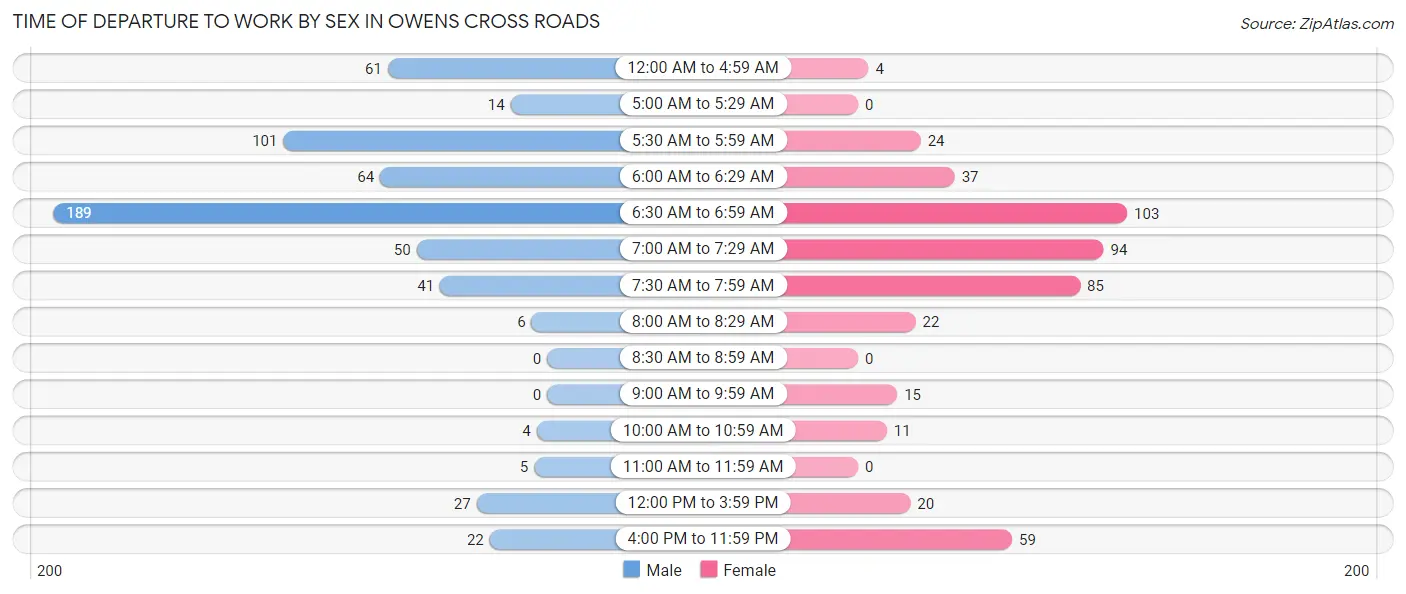
| Time of Departure | Male | Female |
| 12:00 AM to 4:59 AM | 61 (10.4%) | 4 (0.8%) |
| 5:00 AM to 5:29 AM | 14 (2.4%) | 0 (0.0%) |
| 5:30 AM to 5:59 AM | 101 (17.3%) | 24 (5.1%) |
| 6:00 AM to 6:29 AM | 64 (11.0%) | 37 (7.8%) |
| 6:30 AM to 6:59 AM | 189 (32.4%) | 103 (21.7%) |
| 7:00 AM to 7:29 AM | 50 (8.6%) | 94 (19.8%) |
| 7:30 AM to 7:59 AM | 41 (7.0%) | 85 (17.9%) |
| 8:00 AM to 8:29 AM | 6 (1.0%) | 22 (4.6%) |
| 8:30 AM to 8:59 AM | 0 (0.0%) | 0 (0.0%) |
| 9:00 AM to 9:59 AM | 0 (0.0%) | 15 (3.2%) |
| 10:00 AM to 10:59 AM | 4 (0.7%) | 11 (2.3%) |
| 11:00 AM to 11:59 AM | 5 (0.9%) | 0 (0.0%) |
| 12:00 PM to 3:59 PM | 27 (4.6%) | 20 (4.2%) |
| 4:00 PM to 11:59 PM | 22 (3.8%) | 59 (12.4%) |
| Total | 584 (100.0%) | 474 (100.0%) |
Housing Occupancy in Owens Cross Roads
Occupancy by Ownership in Owens Cross Roads
Of the total 927 dwellings in Owens Cross Roads, owner-occupied units account for 769 (83.0%), while renter-occupied units make up 158 (17.0%).
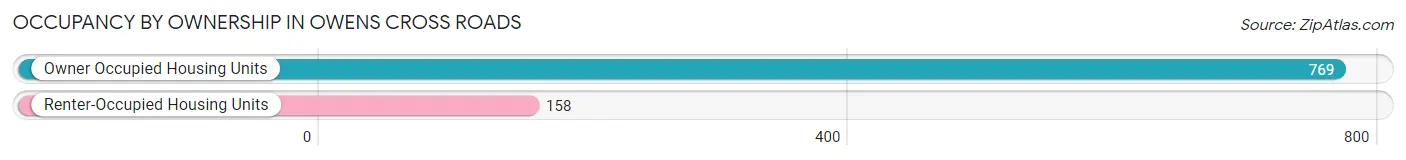
| Occupancy | # Housing Units | % Housing Units |
| Owner Occupied Housing Units | 769 | 83.0% |
| Renter-Occupied Housing Units | 158 | 17.0% |
| Total Occupied Housing Units | 927 | 100.0% |
Occupancy by Household Size in Owens Cross Roads
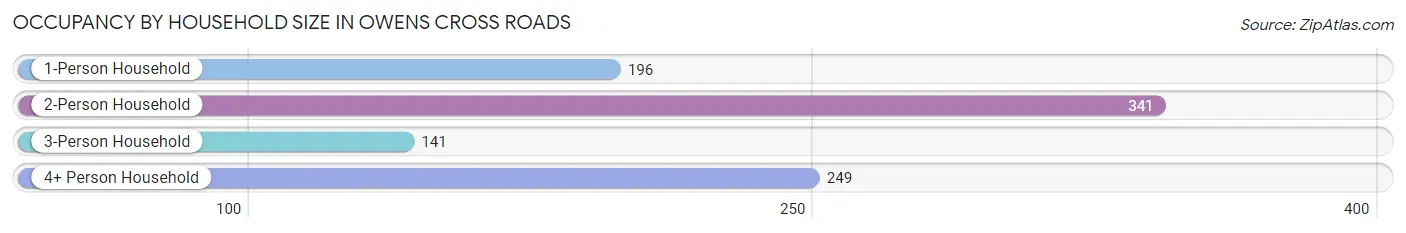
| Household Size | # Housing Units | % Housing Units |
| 1-Person Household | 196 | 21.1% |
| 2-Person Household | 341 | 36.8% |
| 3-Person Household | 141 | 15.2% |
| 4+ Person Household | 249 | 26.9% |
| Total Housing Units | 927 | 100.0% |
Occupancy by Ownership by Household Size in Owens Cross Roads
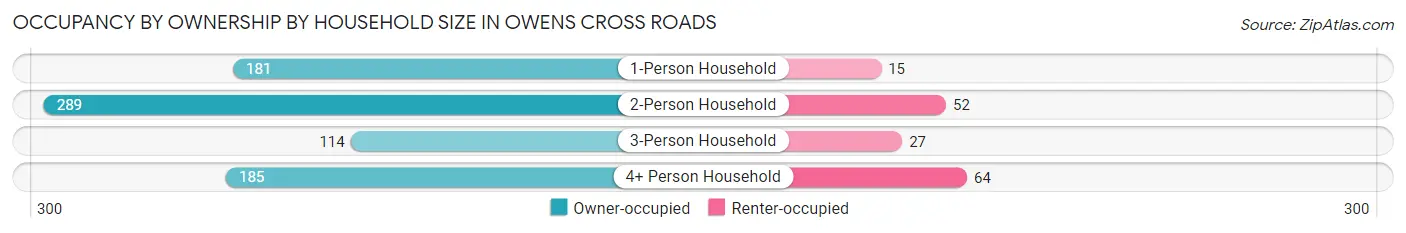
| Household Size | Owner-occupied | Renter-occupied |
| 1-Person Household | 181 (92.3%) | 15 (7.6%) |
| 2-Person Household | 289 (84.8%) | 52 (15.2%) |
| 3-Person Household | 114 (80.8%) | 27 (19.2%) |
| 4+ Person Household | 185 (74.3%) | 64 (25.7%) |
| Total Housing Units | 769 (83.0%) | 158 (17.0%) |
Occupancy by Educational Attainment in Owens Cross Roads
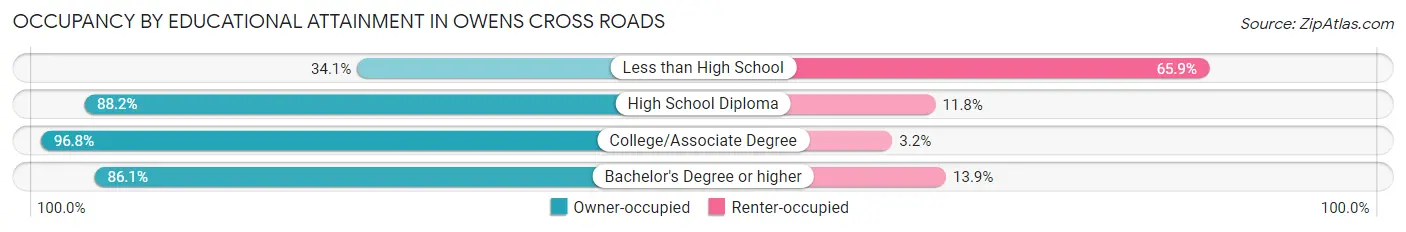
| Household Size | Owner-occupied | Renter-occupied |
| Less than High School | 46 (34.1%) | 89 (65.9%) |
| High School Diploma | 187 (88.2%) | 25 (11.8%) |
| College/Associate Degree | 331 (96.8%) | 11 (3.2%) |
| Bachelor's Degree or higher | 205 (86.1%) | 33 (13.9%) |
Occupancy by Age of Householder in Owens Cross Roads
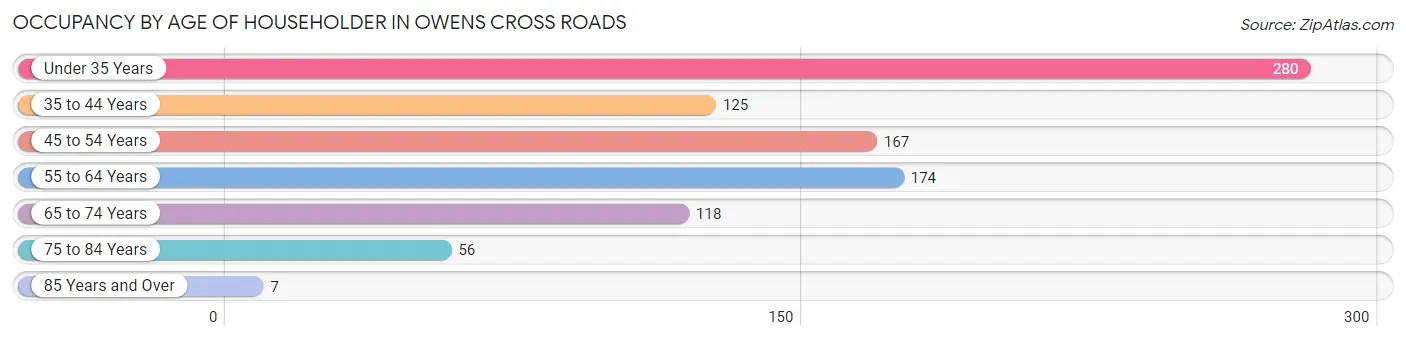
| Age Bracket | # Households | % Households |
| Under 35 Years | 280 | 30.2% |
| 35 to 44 Years | 125 | 13.5% |
| 45 to 54 Years | 167 | 18.0% |
| 55 to 64 Years | 174 | 18.8% |
| 65 to 74 Years | 118 | 12.7% |
| 75 to 84 Years | 56 | 6.0% |
| 85 Years and Over | 7 | 0.8% |
| Total | 927 | 100.0% |
Housing Finances in Owens Cross Roads
Median Income by Occupancy in Owens Cross Roads
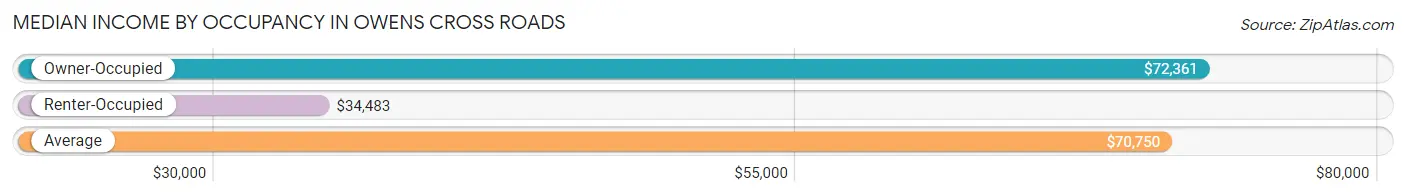
| Occupancy Type | # Households | Median Income |
| Owner-Occupied | 769 (83.0%) | $72,361 |
| Renter-Occupied | 158 (17.0%) | $34,483 |
| Average | 927 (100.0%) | $70,750 |
Occupancy by Householder Income Bracket in Owens Cross Roads
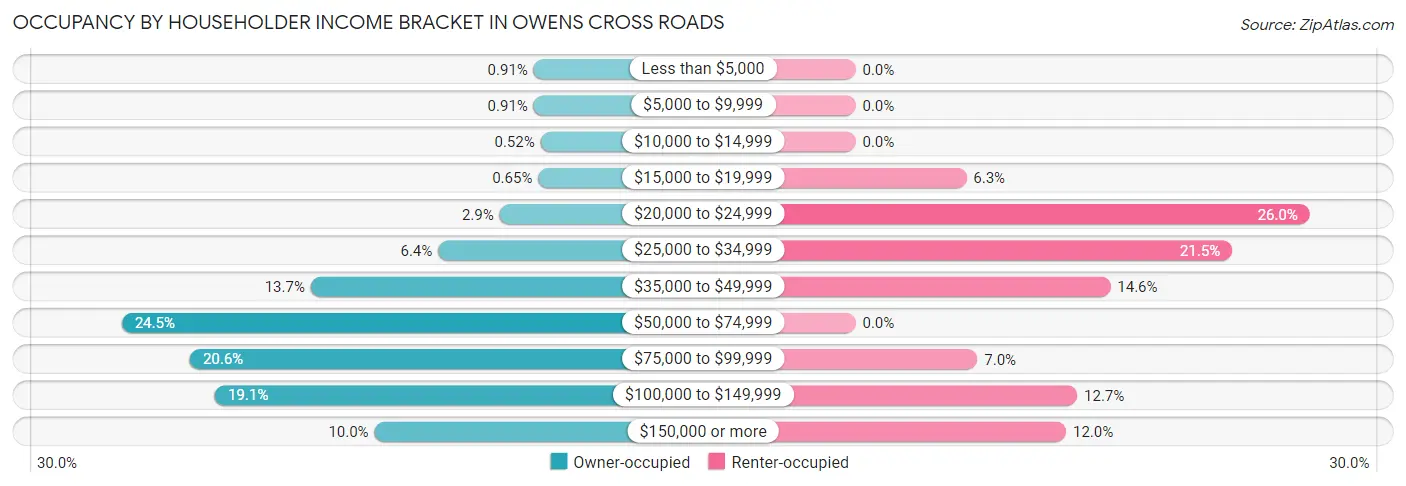
| Income Bracket | Owner-occupied | Renter-occupied |
| Less than $5,000 | 7 (0.9%) | 0 (0.0%) |
| $5,000 to $9,999 | 7 (0.9%) | 0 (0.0%) |
| $10,000 to $14,999 | 4 (0.5%) | 0 (0.0%) |
| $15,000 to $19,999 | 5 (0.6%) | 10 (6.3%) |
| $20,000 to $24,999 | 22 (2.9%) | 41 (26.0%) |
| $25,000 to $34,999 | 49 (6.4%) | 34 (21.5%) |
| $35,000 to $49,999 | 105 (13.7%) | 23 (14.6%) |
| $50,000 to $74,999 | 188 (24.4%) | 0 (0.0%) |
| $75,000 to $99,999 | 158 (20.5%) | 11 (7.0%) |
| $100,000 to $149,999 | 147 (19.1%) | 20 (12.7%) |
| $150,000 or more | 77 (10.0%) | 19 (12.0%) |
| Total | 769 (100.0%) | 158 (100.0%) |
Monthly Housing Cost Tiers in Owens Cross Roads
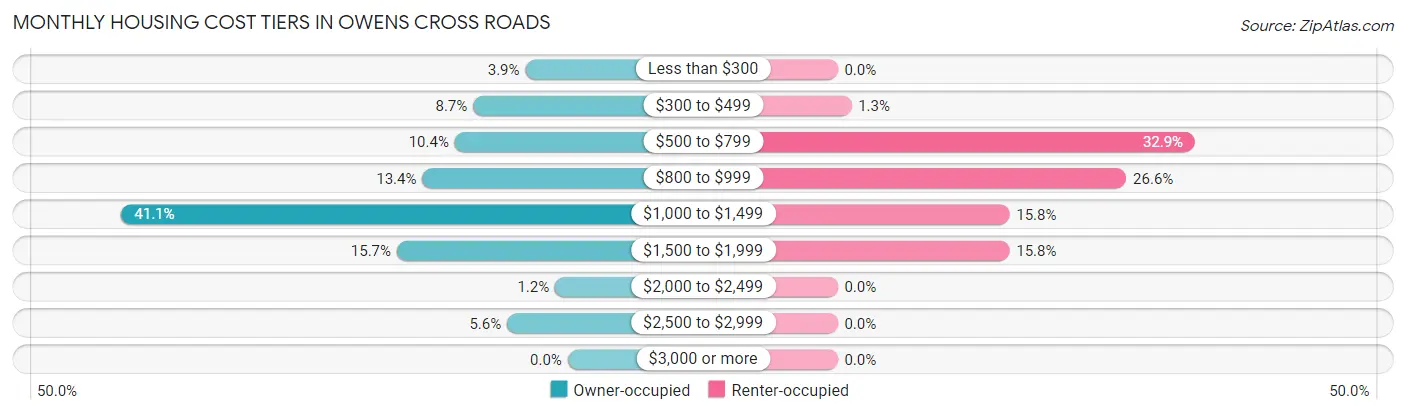
| Monthly Cost | Owner-occupied | Renter-occupied |
| Less than $300 | 30 (3.9%) | 0 (0.0%) |
| $300 to $499 | 67 (8.7%) | 2 (1.3%) |
| $500 to $799 | 80 (10.4%) | 52 (32.9%) |
| $800 to $999 | 103 (13.4%) | 42 (26.6%) |
| $1,000 to $1,499 | 316 (41.1%) | 25 (15.8%) |
| $1,500 to $1,999 | 121 (15.7%) | 25 (15.8%) |
| $2,000 to $2,499 | 9 (1.2%) | 0 (0.0%) |
| $2,500 to $2,999 | 43 (5.6%) | 0 (0.0%) |
| $3,000 or more | 0 (0.0%) | 0 (0.0%) |
| Total | 769 (100.0%) | 158 (100.0%) |
Physical Housing Characteristics in Owens Cross Roads
Housing Structures in Owens Cross Roads
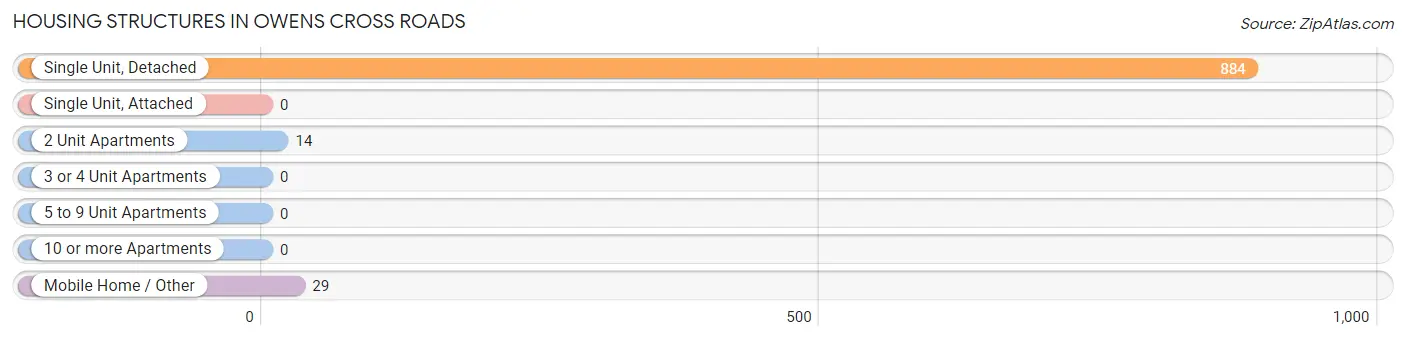
| Structure Type | # Housing Units | % Housing Units |
| Single Unit, Detached | 884 | 95.4% |
| Single Unit, Attached | 0 | 0.0% |
| 2 Unit Apartments | 14 | 1.5% |
| 3 or 4 Unit Apartments | 0 | 0.0% |
| 5 to 9 Unit Apartments | 0 | 0.0% |
| 10 or more Apartments | 0 | 0.0% |
| Mobile Home / Other | 29 | 3.1% |
| Total | 927 | 100.0% |
Housing Structures by Occupancy in Owens Cross Roads
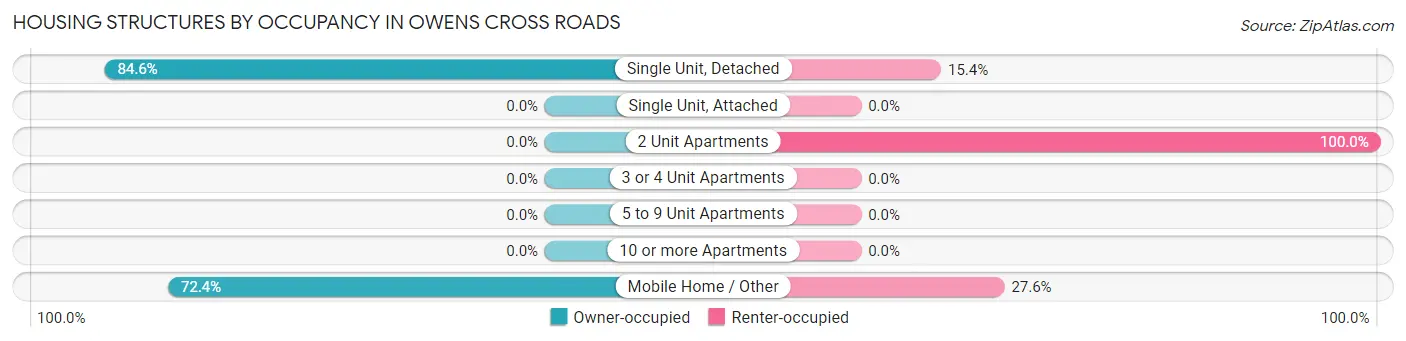
| Structure Type | Owner-occupied | Renter-occupied |
| Single Unit, Detached | 748 (84.6%) | 136 (15.4%) |
| Single Unit, Attached | 0 (0.0%) | 0 (0.0%) |
| 2 Unit Apartments | 0 (0.0%) | 14 (100.0%) |
| 3 or 4 Unit Apartments | 0 (0.0%) | 0 (0.0%) |
| 5 to 9 Unit Apartments | 0 (0.0%) | 0 (0.0%) |
| 10 or more Apartments | 0 (0.0%) | 0 (0.0%) |
| Mobile Home / Other | 21 (72.4%) | 8 (27.6%) |
| Total | 769 (83.0%) | 158 (17.0%) |
Housing Structures by Number of Rooms in Owens Cross Roads
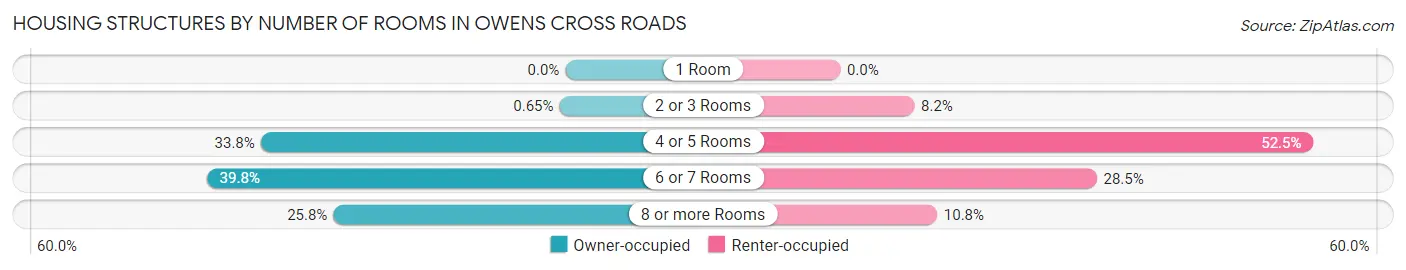
| Number of Rooms | Owner-occupied | Renter-occupied |
| 1 Room | 0 (0.0%) | 0 (0.0%) |
| 2 or 3 Rooms | 5 (0.6%) | 13 (8.2%) |
| 4 or 5 Rooms | 260 (33.8%) | 83 (52.5%) |
| 6 or 7 Rooms | 306 (39.8%) | 45 (28.5%) |
| 8 or more Rooms | 198 (25.8%) | 17 (10.8%) |
| Total | 769 (100.0%) | 158 (100.0%) |
Housing Structure by Heating Type in Owens Cross Roads
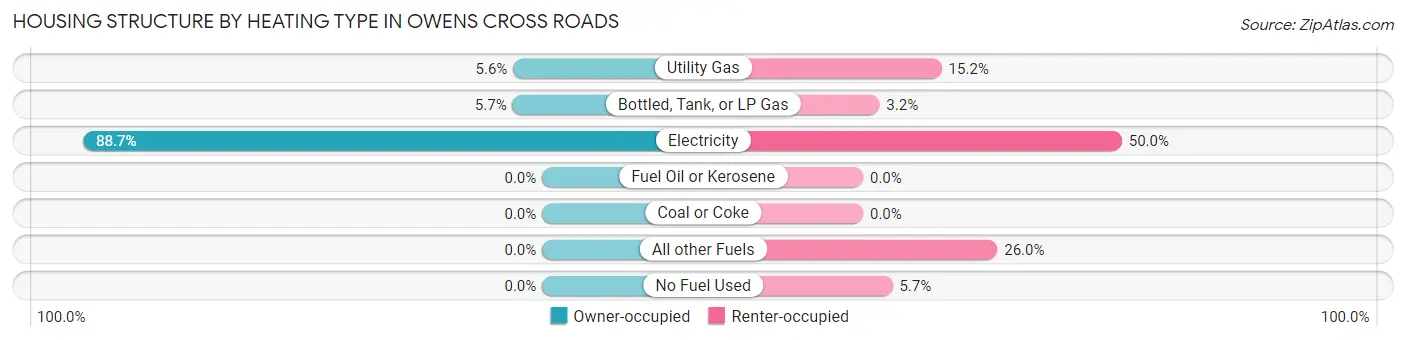
| Heating Type | Owner-occupied | Renter-occupied |
| Utility Gas | 43 (5.6%) | 24 (15.2%) |
| Bottled, Tank, or LP Gas | 44 (5.7%) | 5 (3.2%) |
| Electricity | 682 (88.7%) | 79 (50.0%) |
| Fuel Oil or Kerosene | 0 (0.0%) | 0 (0.0%) |
| Coal or Coke | 0 (0.0%) | 0 (0.0%) |
| All other Fuels | 0 (0.0%) | 41 (26.0%) |
| No Fuel Used | 0 (0.0%) | 9 (5.7%) |
| Total | 769 (100.0%) | 158 (100.0%) |
Household Vehicle Usage in Owens Cross Roads
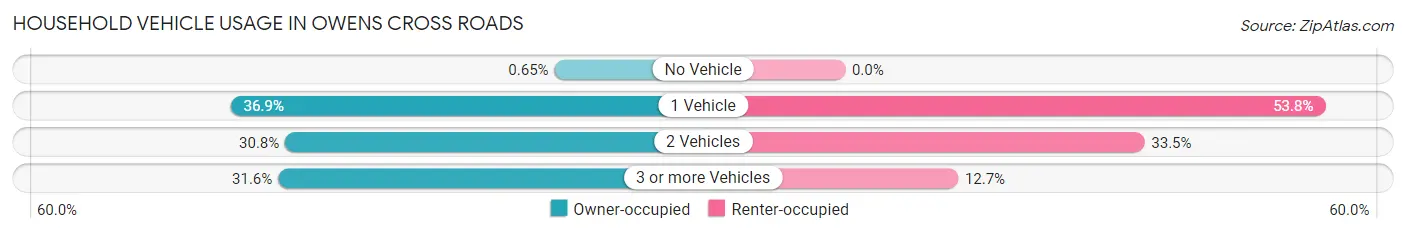
| Vehicles per Household | Owner-occupied | Renter-occupied |
| No Vehicle | 5 (0.6%) | 0 (0.0%) |
| 1 Vehicle | 284 (36.9%) | 85 (53.8%) |
| 2 Vehicles | 237 (30.8%) | 53 (33.5%) |
| 3 or more Vehicles | 243 (31.6%) | 20 (12.7%) |
| Total | 769 (100.0%) | 158 (100.0%) |
Real Estate & Mortgages in Owens Cross Roads
Real Estate and Mortgage Overview in Owens Cross Roads
| Characteristic | Without Mortgage | With Mortgage |
| Housing Units | 146 | 623 |
| Median Property Value | $166,400 | $194,700 |
| Median Household Income | $66,111 | $74 |
| Monthly Housing Costs | $425 | $0 |
| Real Estate Taxes | $550 | $73 |
Property Value by Mortgage Status in Owens Cross Roads
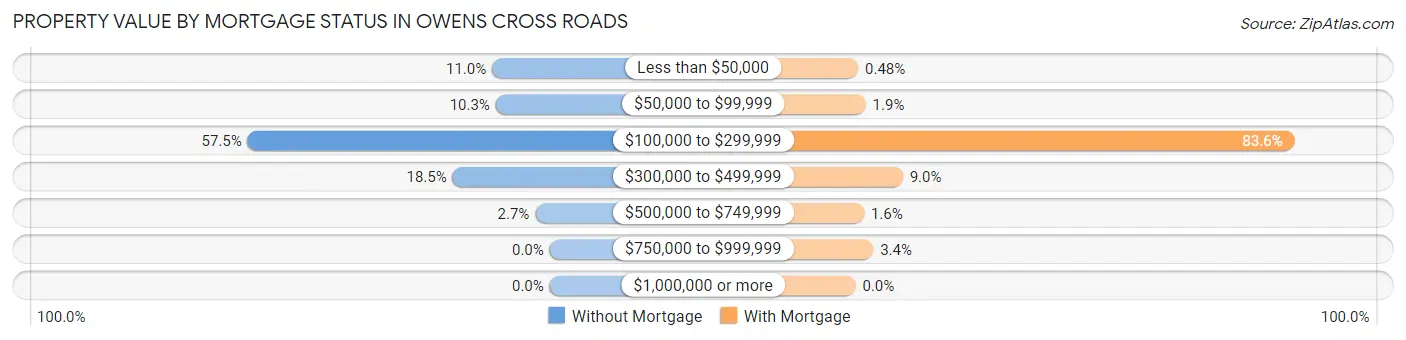
| Property Value | Without Mortgage | With Mortgage |
| Less than $50,000 | 16 (11.0%) | 3 (0.5%) |
| $50,000 to $99,999 | 15 (10.3%) | 12 (1.9%) |
| $100,000 to $299,999 | 84 (57.5%) | 521 (83.6%) |
| $300,000 to $499,999 | 27 (18.5%) | 56 (9.0%) |
| $500,000 to $749,999 | 4 (2.7%) | 10 (1.6%) |
| $750,000 to $999,999 | 0 (0.0%) | 21 (3.4%) |
| $1,000,000 or more | 0 (0.0%) | 0 (0.0%) |
| Total | 146 (100.0%) | 623 (100.0%) |
Household Income by Mortgage Status in Owens Cross Roads
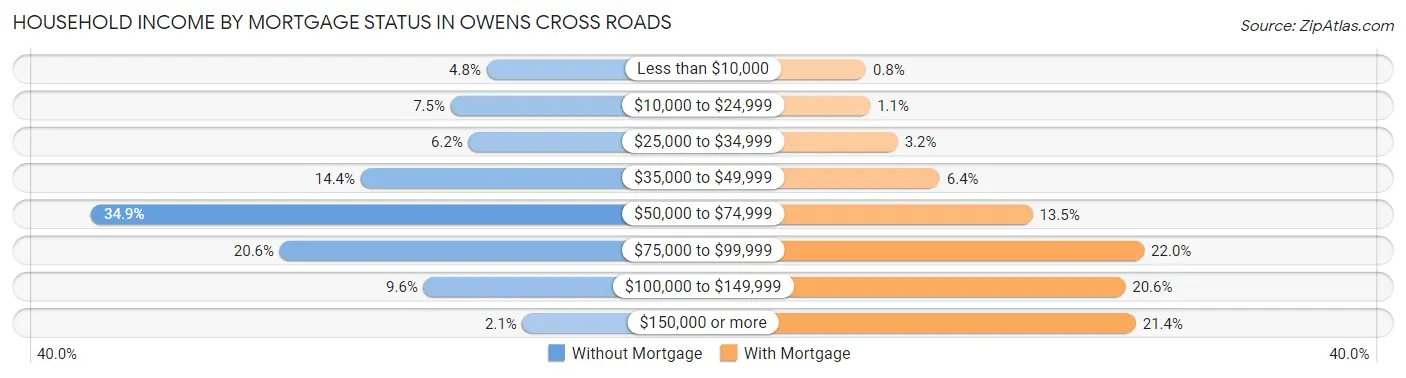
| Household Income | Without Mortgage | With Mortgage |
| Less than $10,000 | 7 (4.8%) | 5 (0.8%) |
| $10,000 to $24,999 | 11 (7.5%) | 7 (1.1%) |
| $25,000 to $34,999 | 9 (6.2%) | 20 (3.2%) |
| $35,000 to $49,999 | 21 (14.4%) | 40 (6.4%) |
| $50,000 to $74,999 | 51 (34.9%) | 84 (13.5%) |
| $75,000 to $99,999 | 30 (20.5%) | 137 (22.0%) |
| $100,000 to $149,999 | 14 (9.6%) | 128 (20.5%) |
| $150,000 or more | 3 (2.1%) | 133 (21.3%) |
| Total | 146 (100.0%) | 623 (100.0%) |
Property Value to Household Income Ratio in Owens Cross Roads
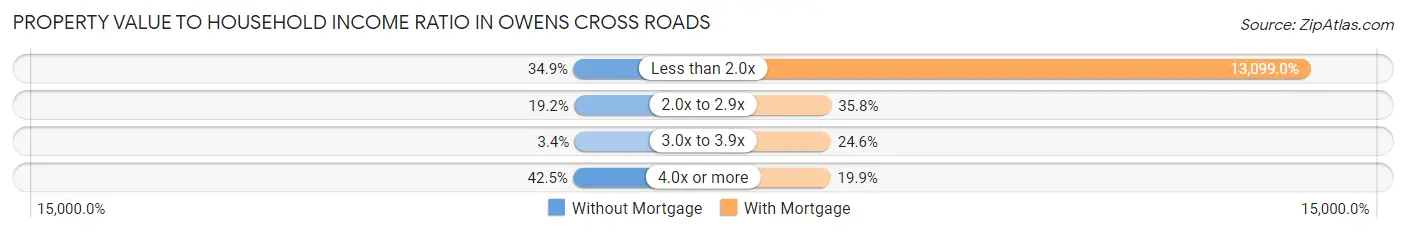
| Value-to-Income Ratio | Without Mortgage | With Mortgage |
| Less than 2.0x | 51 (34.9%) | 81,607 (13,099.0%) |
| 2.0x to 2.9x | 28 (19.2%) | 223 (35.8%) |
| 3.0x to 3.9x | 5 (3.4%) | 153 (24.6%) |
| 4.0x or more | 62 (42.5%) | 124 (19.9%) |
| Total | 146 (100.0%) | 623 (100.0%) |
Real Estate Taxes by Mortgage Status in Owens Cross Roads
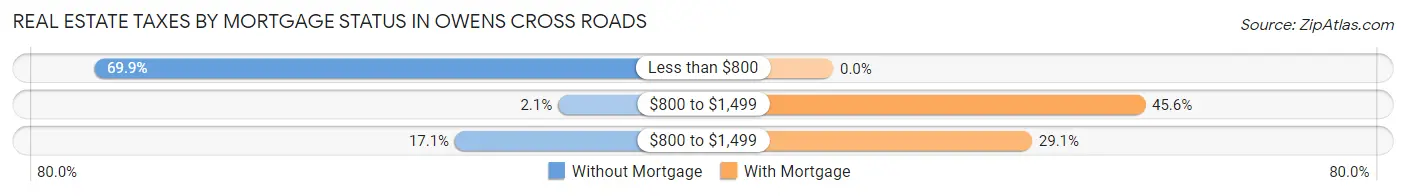
| Property Taxes | Without Mortgage | With Mortgage |
| Less than $800 | 102 (69.9%) | 0 (0.0%) |
| $800 to $1,499 | 3 (2.1%) | 284 (45.6%) |
| $800 to $1,499 | 25 (17.1%) | 181 (29.0%) |
| Total | 146 (100.0%) | 623 (100.0%) |
Health & Disability in Owens Cross Roads
Health Insurance Coverage by Age in Owens Cross Roads
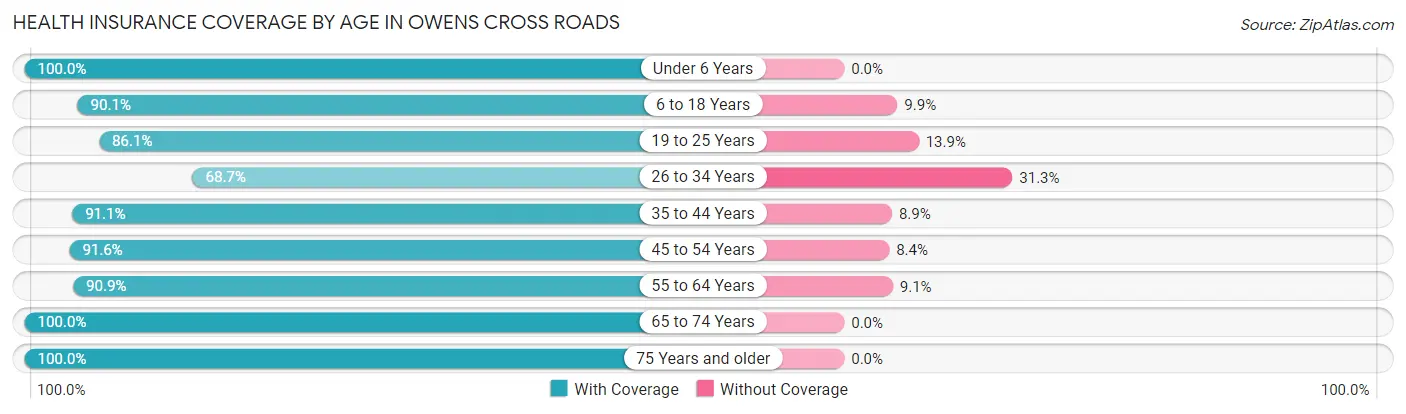
| Age Bracket | With Coverage | Without Coverage |
| Under 6 Years | 217 (100.0%) | 0 (0.0%) |
| 6 to 18 Years | 437 (90.1%) | 48 (9.9%) |
| 19 to 25 Years | 211 (86.1%) | 34 (13.9%) |
| 26 to 34 Years | 287 (68.7%) | 131 (31.3%) |
| 35 to 44 Years | 246 (91.1%) | 24 (8.9%) |
| 45 to 54 Years | 241 (91.6%) | 22 (8.4%) |
| 55 to 64 Years | 271 (90.9%) | 27 (9.1%) |
| 65 to 74 Years | 189 (100.0%) | 0 (0.0%) |
| 75 Years and older | 95 (100.0%) | 0 (0.0%) |
| Total | 2,194 (88.5%) | 286 (11.5%) |
Health Insurance Coverage by Citizenship Status in Owens Cross Roads
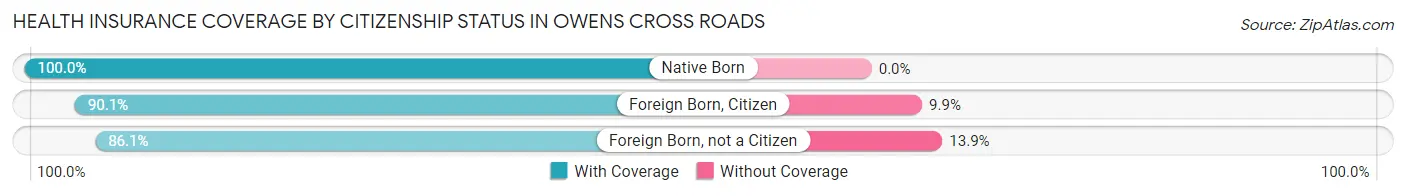
| Citizenship Status | With Coverage | Without Coverage |
| Native Born | 217 (100.0%) | 0 (0.0%) |
| Foreign Born, Citizen | 437 (90.1%) | 48 (9.9%) |
| Foreign Born, not a Citizen | 211 (86.1%) | 34 (13.9%) |
Health Insurance Coverage by Household Income in Owens Cross Roads
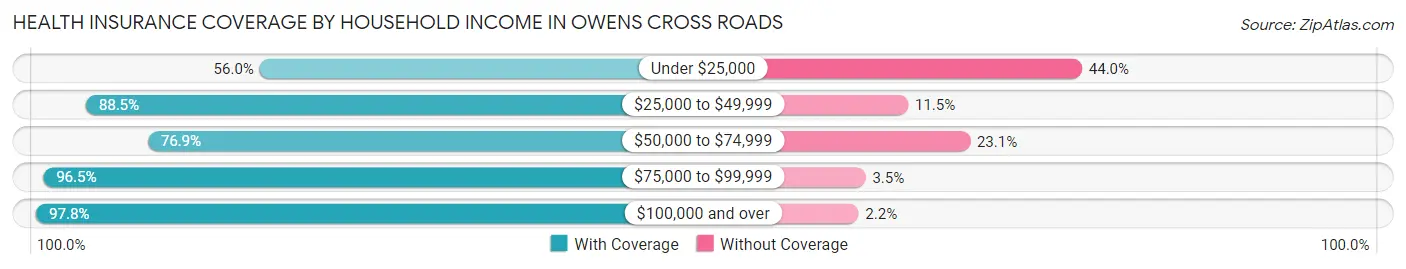
| Household Income | With Coverage | Without Coverage |
| Under $25,000 | 122 (56.0%) | 96 (44.0%) |
| $25,000 to $49,999 | 370 (88.5%) | 48 (11.5%) |
| $50,000 to $74,999 | 350 (76.9%) | 105 (23.1%) |
| $75,000 to $99,999 | 496 (96.5%) | 18 (3.5%) |
| $100,000 and over | 856 (97.8%) | 19 (2.2%) |
Public vs Private Health Insurance Coverage by Age in Owens Cross Roads
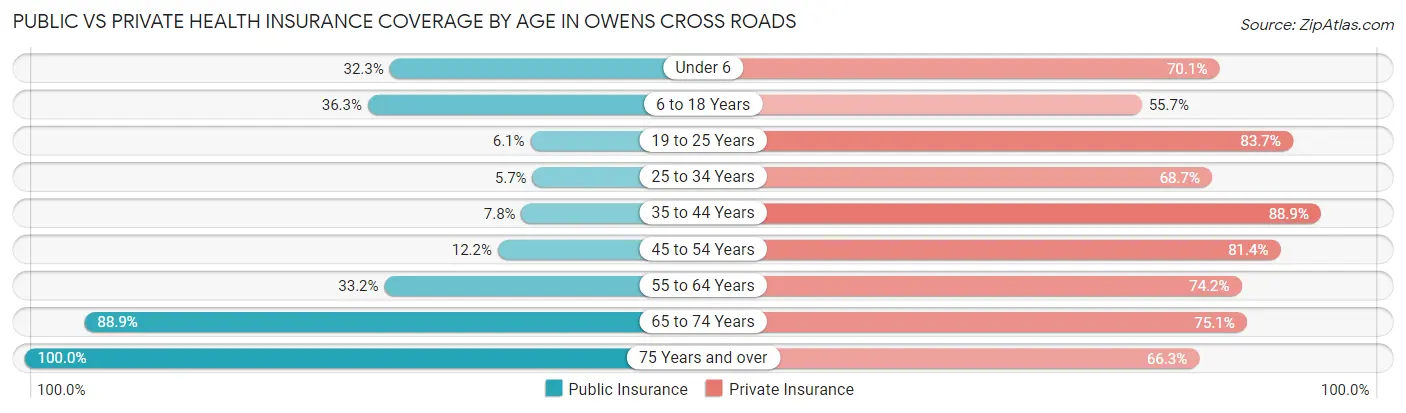
| Age Bracket | Public Insurance | Private Insurance |
| Under 6 | 70 (32.3%) | 152 (70.1%) |
| 6 to 18 Years | 176 (36.3%) | 270 (55.7%) |
| 19 to 25 Years | 15 (6.1%) | 205 (83.7%) |
| 25 to 34 Years | 24 (5.7%) | 287 (68.7%) |
| 35 to 44 Years | 21 (7.8%) | 240 (88.9%) |
| 45 to 54 Years | 32 (12.2%) | 214 (81.4%) |
| 55 to 64 Years | 99 (33.2%) | 221 (74.2%) |
| 65 to 74 Years | 168 (88.9%) | 142 (75.1%) |
| 75 Years and over | 95 (100.0%) | 63 (66.3%) |
| Total | 700 (28.2%) | 1,794 (72.3%) |
Disability Status by Sex by Age in Owens Cross Roads
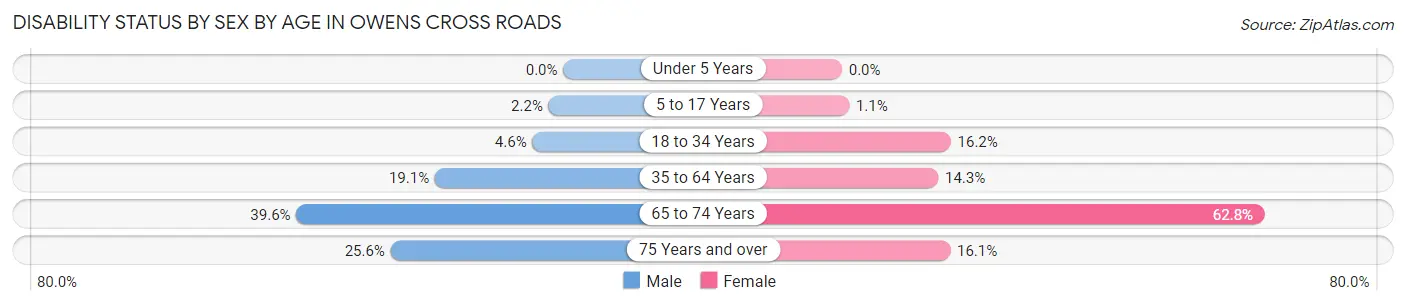
| Age Bracket | Male | Female |
| Under 5 Years | 0 (0.0%) | 0 (0.0%) |
| 5 to 17 Years | 5 (2.2%) | 3 (1.1%) |
| 18 to 34 Years | 14 (4.6%) | 59 (16.2%) |
| 35 to 64 Years | 77 (19.1%) | 61 (14.3%) |
| 65 to 74 Years | 44 (39.6%) | 49 (62.8%) |
| 75 Years and over | 10 (25.6%) | 9 (16.1%) |
Disability Class by Sex by Age in Owens Cross Roads
Disability Class: Hearing Difficulty
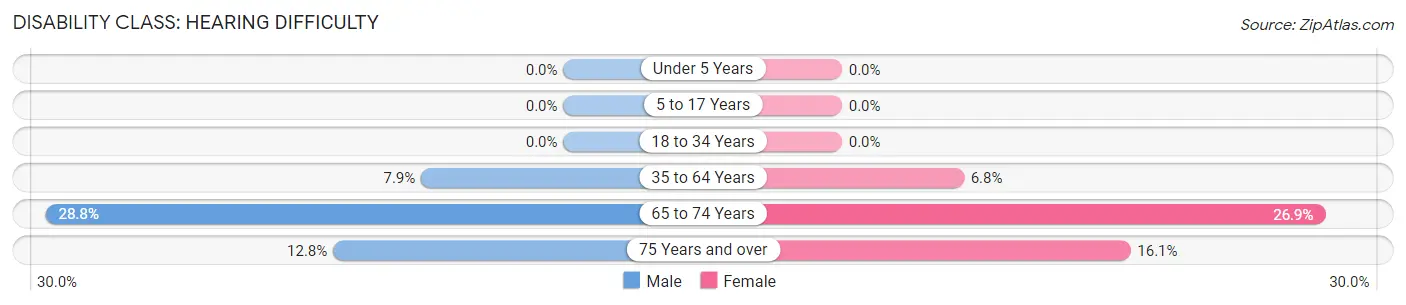
| Age Bracket | Male | Female |
| Under 5 Years | 0 (0.0%) | 0 (0.0%) |
| 5 to 17 Years | 0 (0.0%) | 0 (0.0%) |
| 18 to 34 Years | 0 (0.0%) | 0 (0.0%) |
| 35 to 64 Years | 32 (7.9%) | 29 (6.8%) |
| 65 to 74 Years | 32 (28.8%) | 21 (26.9%) |
| 75 Years and over | 5 (12.8%) | 9 (16.1%) |
Disability Class: Vision Difficulty
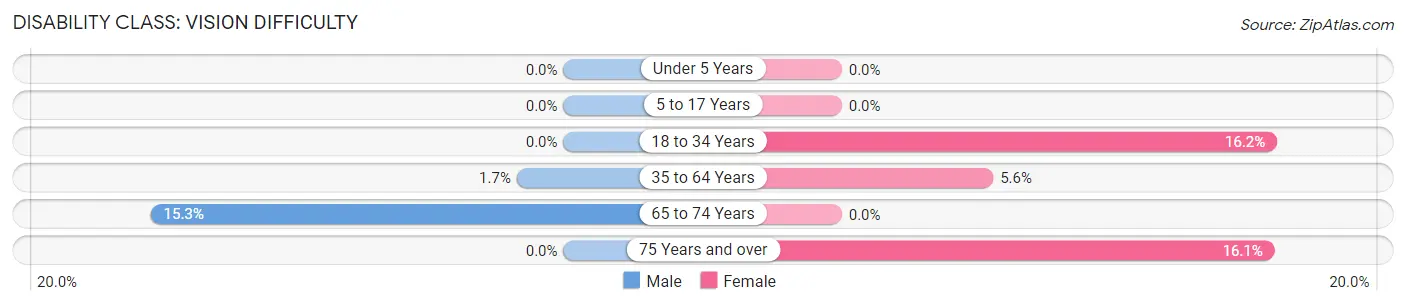
| Age Bracket | Male | Female |
| Under 5 Years | 0 (0.0%) | 0 (0.0%) |
| 5 to 17 Years | 0 (0.0%) | 0 (0.0%) |
| 18 to 34 Years | 0 (0.0%) | 59 (16.2%) |
| 35 to 64 Years | 7 (1.7%) | 24 (5.6%) |
| 65 to 74 Years | 17 (15.3%) | 0 (0.0%) |
| 75 Years and over | 0 (0.0%) | 9 (16.1%) |
Disability Class: Cognitive Difficulty
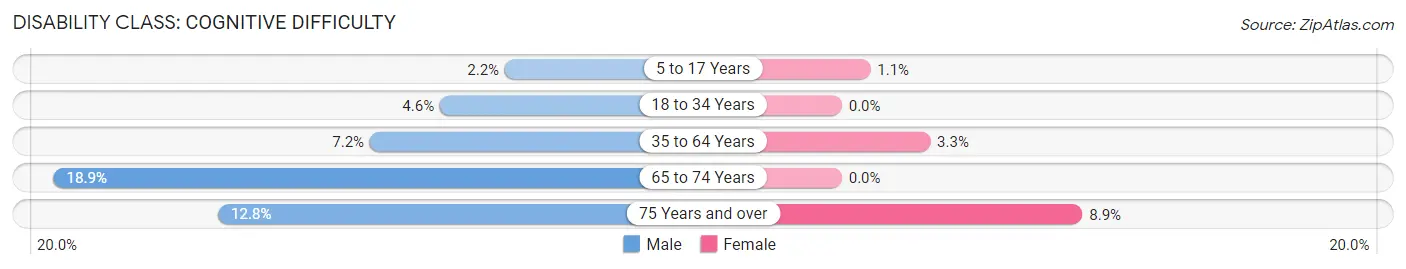
| Age Bracket | Male | Female |
| 5 to 17 Years | 5 (2.2%) | 3 (1.1%) |
| 18 to 34 Years | 14 (4.6%) | 0 (0.0%) |
| 35 to 64 Years | 29 (7.2%) | 14 (3.3%) |
| 65 to 74 Years | 21 (18.9%) | 0 (0.0%) |
| 75 Years and over | 5 (12.8%) | 5 (8.9%) |
Disability Class: Ambulatory Difficulty
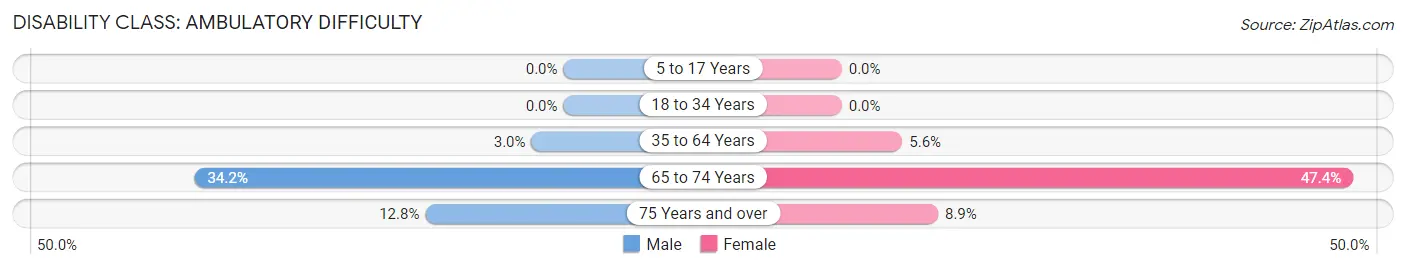
| Age Bracket | Male | Female |
| 5 to 17 Years | 0 (0.0%) | 0 (0.0%) |
| 18 to 34 Years | 0 (0.0%) | 0 (0.0%) |
| 35 to 64 Years | 12 (3.0%) | 24 (5.6%) |
| 65 to 74 Years | 38 (34.2%) | 37 (47.4%) |
| 75 Years and over | 5 (12.8%) | 5 (8.9%) |
Disability Class: Self-Care Difficulty
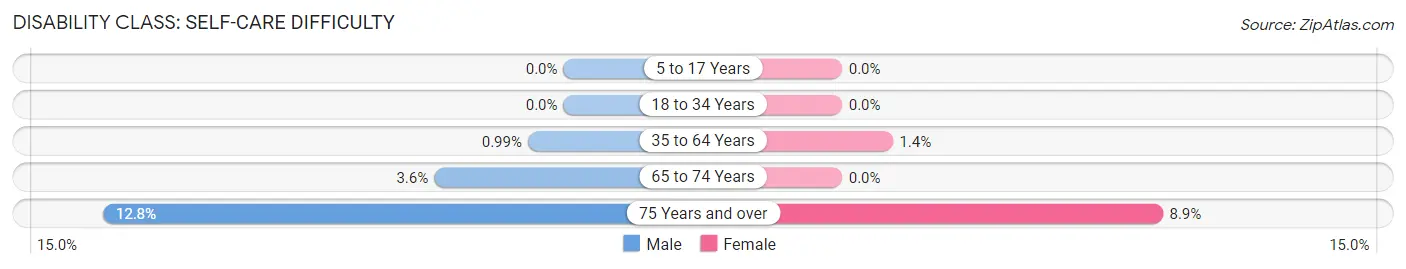
| Age Bracket | Male | Female |
| 5 to 17 Years | 0 (0.0%) | 0 (0.0%) |
| 18 to 34 Years | 0 (0.0%) | 0 (0.0%) |
| 35 to 64 Years | 4 (1.0%) | 6 (1.4%) |
| 65 to 74 Years | 4 (3.6%) | 0 (0.0%) |
| 75 Years and over | 5 (12.8%) | 5 (8.9%) |
Technology Access in Owens Cross Roads
Computing Device Access in Owens Cross Roads
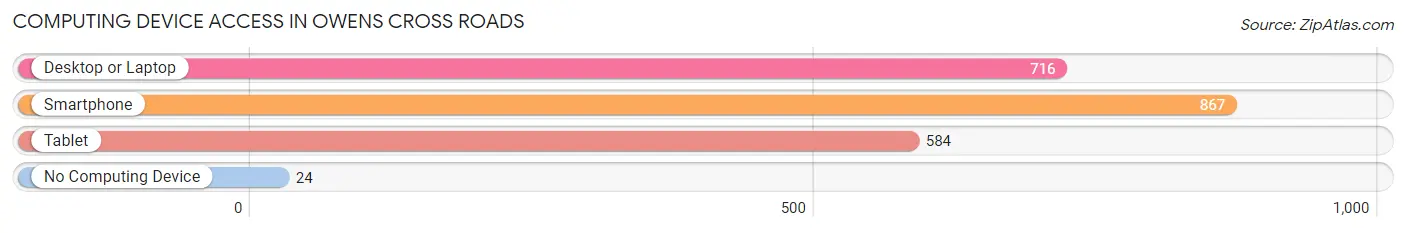
| Device Type | # Households | % Households |
| Desktop or Laptop | 716 | 77.2% |
| Smartphone | 867 | 93.5% |
| Tablet | 584 | 63.0% |
| No Computing Device | 24 | 2.6% |
| Total | 927 | 100.0% |
Internet Access in Owens Cross Roads
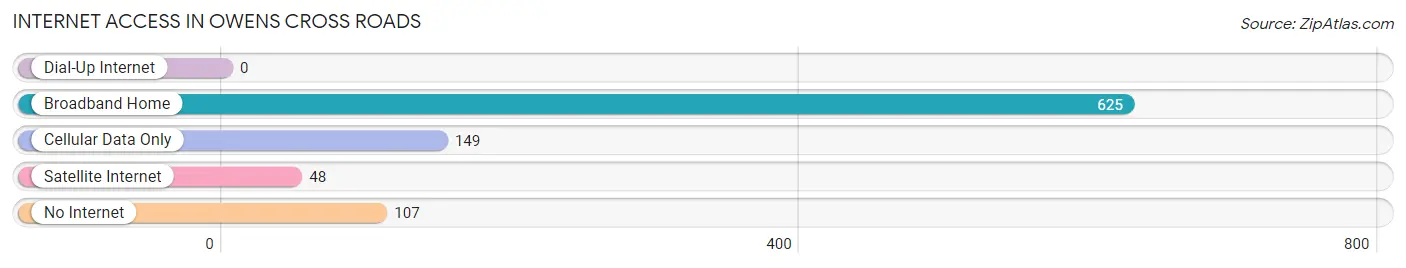
| Internet Type | # Households | % Households |
| Dial-Up Internet | 0 | 0.0% |
| Broadband Home | 625 | 67.4% |
| Cellular Data Only | 149 | 16.1% |
| Satellite Internet | 48 | 5.2% |
| No Internet | 107 | 11.5% |
| Total | 927 | 100.0% |
Owens Cross Roads Summary
Owens Cross Roads is a small unincorporated community located in Madison County, Alabama. It is situated in the foothills of the Appalachian Mountains, approximately 10 miles east of Huntsville. The population of Owens Cross Roads was estimated to be 2,845 in 2019.
History
Owens Cross Roads was first settled in the early 1800s by the Owens family, who were among the first settlers in the area. The community was named after the family, and the crossroads were the intersection of two major roads, the Old Decatur Road and the Old Huntsville Road. The community grew slowly over the years, and by the mid-1800s, it had become a thriving agricultural center.
In the late 1800s, the railroad came to Owens Cross Roads, and the community began to grow rapidly. The railroad brought new businesses and industries to the area, and the population increased significantly. By the early 1900s, Owens Cross Roads had become a bustling small town.
In the 1950s, the population of Owens Cross Roads began to decline as people moved away to larger cities. However, the community has seen a resurgence in recent years, and the population has grown steadily since the 2000s.
Geography
Owens Cross Roads is located in the foothills of the Appalachian Mountains, approximately 10 miles east of Huntsville. The community is situated at an elevation of 890 feet above sea level. The terrain is mostly hilly, with some flat areas. The climate is humid subtropical, with hot summers and mild winters.
Economy
Owens Cross Roads is primarily a residential community, but it does have some businesses and industries. The largest employers in the area are the Huntsville Hospital, the Huntsville City Schools, and the Huntsville-Madison County Public Library. Other businesses in the area include restaurants, retail stores, and automotive repair shops.
Demographics
As of 2019, the population of Owens Cross Roads was estimated to be 2,845. The racial makeup of the community is 87.3% White, 8.2% African American, 1.2% Hispanic or Latino, 0.7% Asian, and 2.6% other. The median household income is $50,945, and the median home value is $179,400.
Conclusion
Owens Cross Roads is a small unincorporated community located in Madison County, Alabama. It is situated in the foothills of the Appalachian Mountains, approximately 10 miles east of Huntsville. The population of Owens Cross Roads was estimated to be 2,845 in 2019. The economy of the community is primarily residential, but it does have some businesses and industries. The racial makeup of the community is 87.3% White, 8.2% African American, 1.2% Hispanic or Latino, 0.7% Asian, and 2.6% other. The median household income is $50,945, and the median home value is $179,400.
Common Questions
What is Per Capita Income in Owens Cross Roads?
Per Capita income in Owens Cross Roads is $31,766.
What is the Median Family Income in Owens Cross Roads?
Median Family Income in Owens Cross Roads is $79,091.
What is the Median Household income in Owens Cross Roads?
Median Household Income in Owens Cross Roads is $70,750.
What is Income or Wage Gap in Owens Cross Roads?
Income or Wage Gap in Owens Cross Roads is 50.1%.
Women in Owens Cross Roads earn 49.9 cents for every dollar earned by a man.
What is Inequality or Gini Index in Owens Cross Roads?
Inequality or Gini Index in Owens Cross Roads is 0.36.
What is the Total Population of Owens Cross Roads?
Total Population of Owens Cross Roads is 2,567.
What is the Total Male Population of Owens Cross Roads?
Total Male Population of Owens Cross Roads is 1,218.
What is the Total Female Population of Owens Cross Roads?
Total Female Population of Owens Cross Roads is 1,349.
What is the Ratio of Males per 100 Females in Owens Cross Roads?
There are 90.29 Males per 100 Females in Owens Cross Roads.
What is the Ratio of Females per 100 Males in Owens Cross Roads?
There are 110.76 Females per 100 Males in Owens Cross Roads.
What is the Median Population Age in Owens Cross Roads?
Median Population Age in Owens Cross Roads is 33.8 Years.
What is the Average Family Size in Owens Cross Roads
Average Family Size in Owens Cross Roads is 3.0 People.
What is the Average Household Size in Owens Cross Roads
Average Household Size in Owens Cross Roads is 2.7 People.
How Large is the Labor Force in Owens Cross Roads?
There are 1,309 People in the Labor Forcein in Owens Cross Roads.
What is the Percentage of People in the Labor Force in Owens Cross Roads?
67.0% of People are in the Labor Force in Owens Cross Roads.
What is the Unemployment Rate in Owens Cross Roads?
Unemployment Rate in Owens Cross Roads is 7.9%.