Falkville, AL Map & Demographics
Falkville Map
Falkville Overview
$22,462
PER CAPITA INCOME
$64,375
AVG FAMILY INCOME
$42,863
AVG HOUSEHOLD INCOME
38.4%
WAGE / INCOME GAP [ % ]
61.6¢/ $1
WAGE / INCOME GAP [ $ ]
0.36
INEQUALITY / GINI INDEX
1,422
TOTAL POPULATION
685
MALE POPULATION
737
FEMALE POPULATION
92.94
MALES / 100 FEMALES
107.59
FEMALES / 100 MALES
56.5
MEDIAN AGE
3.2
AVG FAMILY SIZE
2.5
AVG HOUSEHOLD SIZE
561
LABOR FORCE [ PEOPLE ]
43.8%
PERCENT IN LABOR FORCE
4.3%
UNEMPLOYMENT RATE
Falkville Zip Codes
Falkville Area Codes
Income in Falkville
Income Overview in Falkville
Per Capita Income in Falkville is $22,462, while median incomes of families and households are $64,375 and $42,863 respectively.
| Characteristic | Number | Measure |
| Per Capita Income | 1,422 | $22,462 |
| Median Family Income | 238 | $64,375 |
| Mean Family Income | 238 | $67,603 |
| Median Household Income | 423 | $42,863 |
| Mean Household Income | 423 | $57,755 |
| Income Deficit | 238 | $0 |
| Wage / Income Gap (%) | 1,422 | 38.36% |
| Wage / Income Gap ($) | 1,422 | 61.64¢ per $1 |
| Gini / Inequality Index | 1,422 | 0.36 |
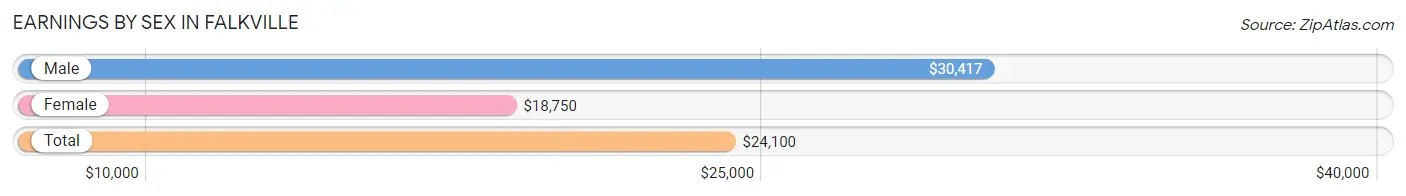
Earnings by Sex in Falkville
Average Earnings in Falkville are $24,100, $30,417 for men and $18,750 for women, a difference of 38.4%.
| Sex | Number | Average Earnings |
| Male | 266 (47.5%) | $30,417 |
| Female | 294 (52.5%) | $18,750 |
| Total | 560 (100.0%) | $24,100 |
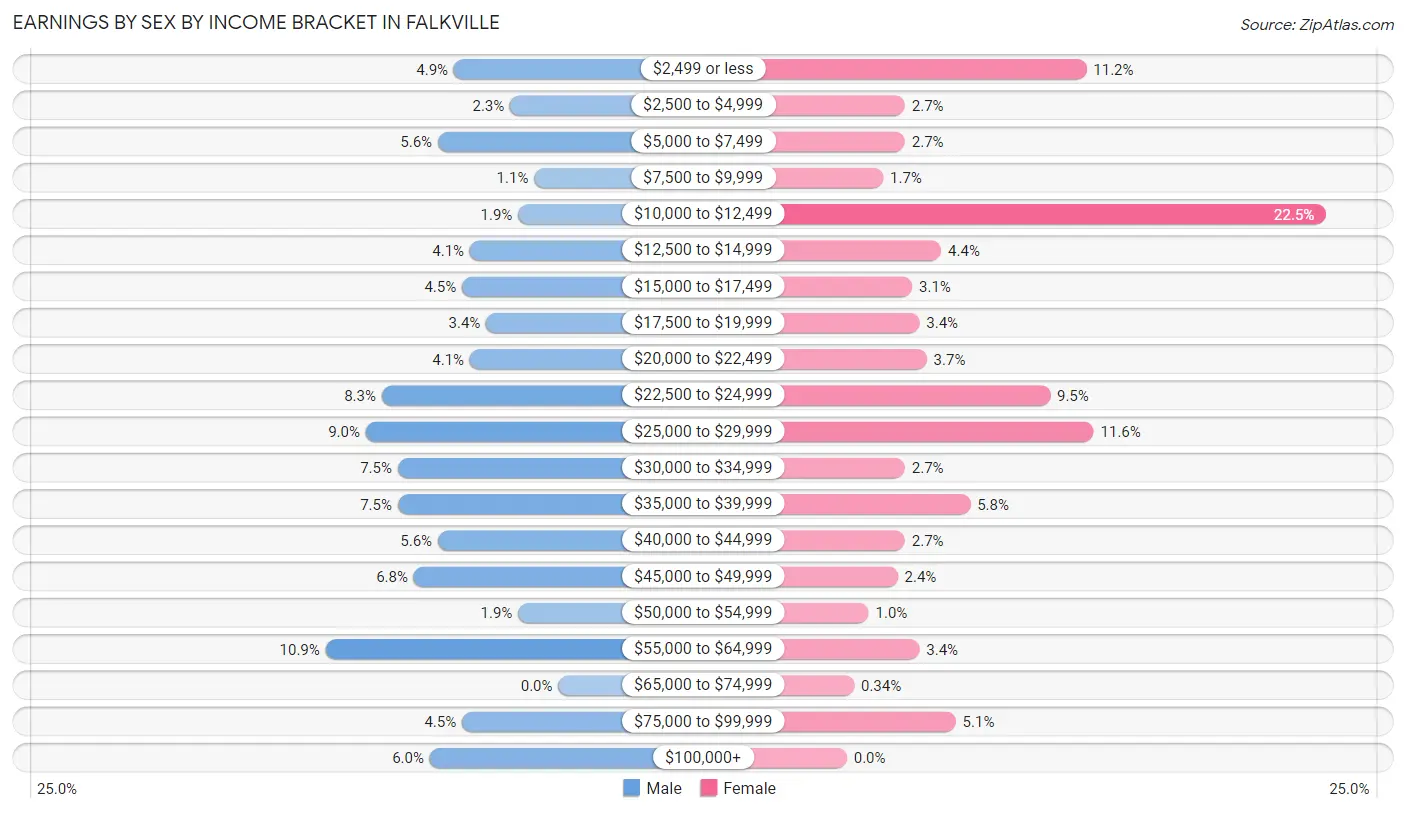
Earnings by Sex by Income Bracket in Falkville
The most common earnings brackets in Falkville are $55,000 to $64,999 for men (29 | 10.9%) and $10,000 to $12,499 for women (66 | 22.5%).
| Income | Male | Female |
| $2,499 or less | 13 (4.9%) | 33 (11.2%) |
| $2,500 to $4,999 | 6 (2.3%) | 8 (2.7%) |
| $5,000 to $7,499 | 15 (5.6%) | 8 (2.7%) |
| $7,500 to $9,999 | 3 (1.1%) | 5 (1.7%) |
| $10,000 to $12,499 | 5 (1.9%) | 66 (22.5%) |
| $12,500 to $14,999 | 11 (4.1%) | 13 (4.4%) |
| $15,000 to $17,499 | 12 (4.5%) | 9 (3.1%) |
| $17,500 to $19,999 | 9 (3.4%) | 10 (3.4%) |
| $20,000 to $22,499 | 11 (4.1%) | 11 (3.7%) |
| $22,500 to $24,999 | 22 (8.3%) | 28 (9.5%) |
| $25,000 to $29,999 | 24 (9.0%) | 34 (11.6%) |
| $30,000 to $34,999 | 20 (7.5%) | 8 (2.7%) |
| $35,000 to $39,999 | 20 (7.5%) | 17 (5.8%) |
| $40,000 to $44,999 | 15 (5.6%) | 8 (2.7%) |
| $45,000 to $49,999 | 18 (6.8%) | 7 (2.4%) |
| $50,000 to $54,999 | 5 (1.9%) | 3 (1.0%) |
| $55,000 to $64,999 | 29 (10.9%) | 10 (3.4%) |
| $65,000 to $74,999 | 0 (0.0%) | 1 (0.3%) |
| $75,000 to $99,999 | 12 (4.5%) | 15 (5.1%) |
| $100,000+ | 16 (6.0%) | 0 (0.0%) |
| Total | 266 (100.0%) | 294 (100.0%) |
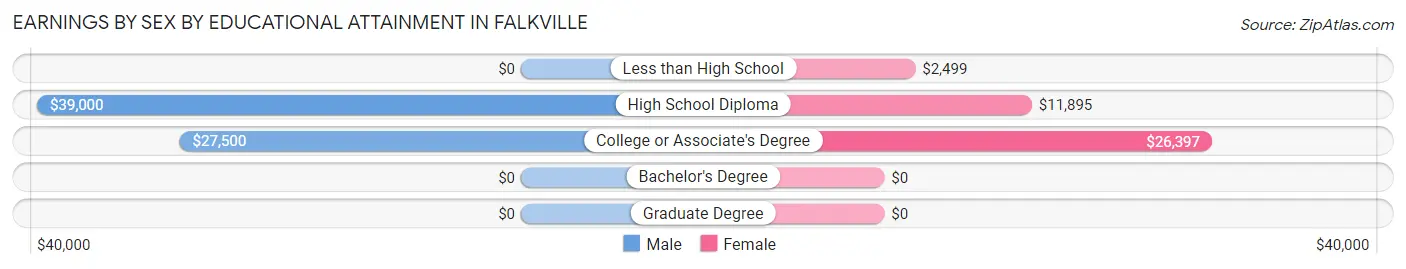
Earnings by Sex by Educational Attainment in Falkville
Average earnings in Falkville are $33,125 for men and $19,625 for women, a difference of 40.7%. Men with an educational attainment of high school diploma enjoy the highest average annual earnings of $39,000, while those with college or associate's degree education earn the least with $27,500. Women with an educational attainment of college or associate's degree earn the most with the average annual earnings of $26,397, while those with less than high school education have the smallest earnings of $2,499.
| Educational Attainment | Male Income | Female Income |
| Less than High School | - | - |
| High School Diploma | $39,000 | $11,895 |
| College or Associate's Degree | $27,500 | $26,397 |
| Bachelor's Degree | - | - |
| Graduate Degree | - | - |
| Total | $33,125 | $19,625 |
Family Income in Falkville
Family Income Brackets in Falkville
According to the Falkville family income data, there are 58 families falling into the $75,000 to $99,999 income range, which is the most common income bracket and makes up 24.4% of all families.
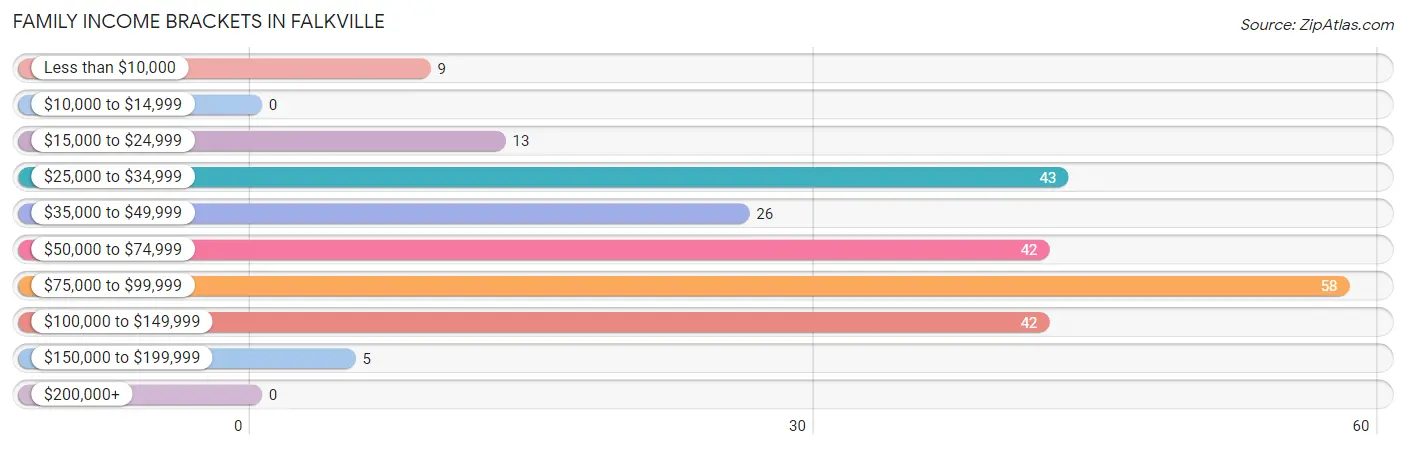
| Income Bracket | # Families | % Families |
| Less than $10,000 | 9 | 3.8% |
| $10,000 to $14,999 | 0 | 0.0% |
| $15,000 to $24,999 | 13 | 5.5% |
| $25,000 to $34,999 | 43 | 18.1% |
| $35,000 to $49,999 | 26 | 10.9% |
| $50,000 to $74,999 | 42 | 17.6% |
| $75,000 to $99,999 | 58 | 24.4% |
| $100,000 to $149,999 | 42 | 17.6% |
| $150,000 to $199,999 | 5 | 2.1% |
| $200,000+ | 0 | 0.0% |
Family Income by Famaliy Size in Falkville
4-person families (32 | 13.5%) account for the highest median family income in Falkville with $82,500 per family, while 3-person families (84 | 35.3%) have the highest median income of $25,036 per family member.
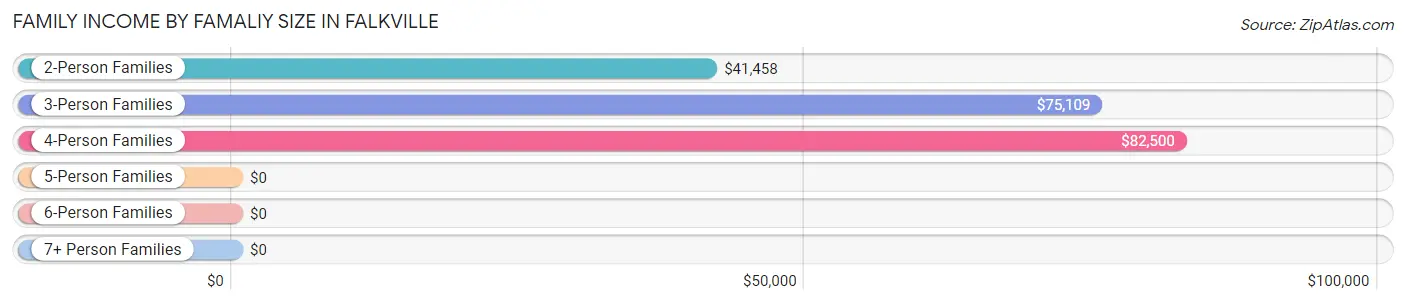
| Income Bracket | # Families | Median Income |
| 2-Person Families | 111 (46.6%) | $41,458 |
| 3-Person Families | 84 (35.3%) | $75,109 |
| 4-Person Families | 32 (13.5%) | $82,500 |
| 5-Person Families | 9 (3.8%) | $0 |
| 6-Person Families | 0 (0.0%) | $0 |
| 7+ Person Families | 2 (0.8%) | $0 |
| Total | 238 (100.0%) | $64,375 |
Family Income by Number of Earners in Falkville
The median family income in Falkville is $64,375, with families comprising 3+ earners (41) having the highest median family income of $82,917, while families with no earners (35) have the lowest median family income of $31,625, accounting for 17.2% and 14.7% of families, respectively.
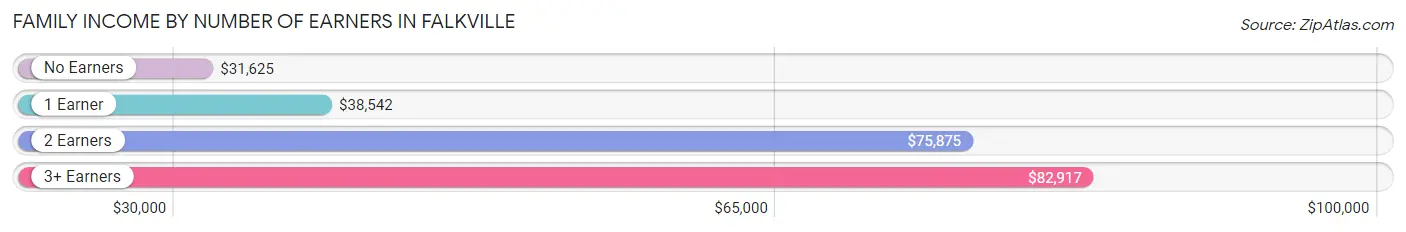
| Number of Earners | # Families | Median Income |
| No Earners | 35 (14.7%) | $31,625 |
| 1 Earner | 75 (31.5%) | $38,542 |
| 2 Earners | 87 (36.5%) | $75,875 |
| 3+ Earners | 41 (17.2%) | $82,917 |
| Total | 238 (100.0%) | $64,375 |
Household Income in Falkville
Household Income Brackets in Falkville
With 112 households falling in the category, the $25,000 to $34,999 income range is the most frequent in Falkville, accounting for 26.5% of all households. In contrast, only 2 households (0.5%) fall into the $200,000+ income bracket, making it the least populous group.
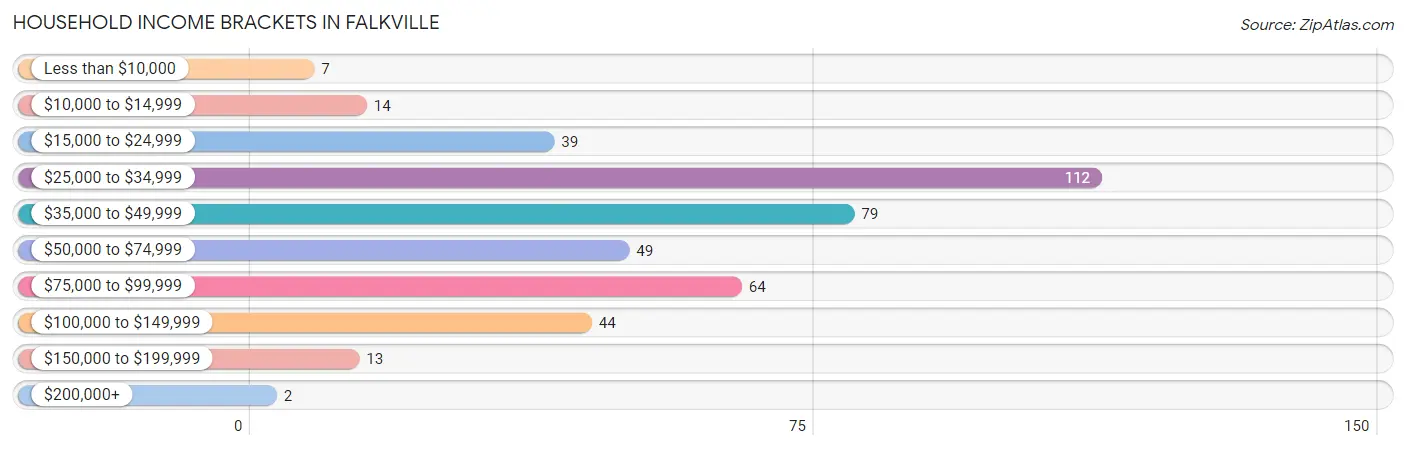
| Income Bracket | # Households | % Households |
| Less than $10,000 | 7 | 1.7% |
| $10,000 to $14,999 | 14 | 3.3% |
| $15,000 to $24,999 | 39 | 9.2% |
| $25,000 to $34,999 | 112 | 26.5% |
| $35,000 to $49,999 | 79 | 18.7% |
| $50,000 to $74,999 | 49 | 11.6% |
| $75,000 to $99,999 | 64 | 15.1% |
| $100,000 to $149,999 | 44 | 10.4% |
| $150,000 to $199,999 | 13 | 3.1% |
| $200,000+ | 2 | 0.5% |
Household Income by Householder Age in Falkville
The median household income in Falkville is $42,863, with the highest median household income of $61,964 found in the 25 to 44 years age bracket for the primary householder. A total of 91 households (21.5%) fall into this category. Meanwhile, the 65+ years age bracket for the primary householder has the lowest median household income of $39,375, with 174 households (41.1%) in this group.
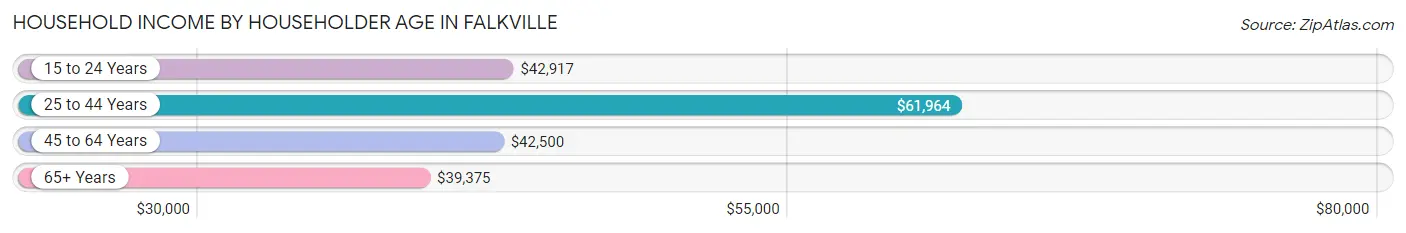
| Income Bracket | # Households | Median Income |
| 15 to 24 Years | 32 (7.6%) | $42,917 |
| 25 to 44 Years | 91 (21.5%) | $61,964 |
| 45 to 64 Years | 126 (29.8%) | $42,500 |
| 65+ Years | 174 (41.1%) | $39,375 |
| Total | 423 (100.0%) | $42,863 |
Poverty in Falkville
Income Below Poverty by Sex and Age in Falkville
With 9.0% poverty level for males and 14.4% for females among the residents of Falkville, 16 and 17 year old males and 55 to 64 year old females are the most vulnerable to poverty, with 7 males (41.2%) and 34 females (39.1%) in their respective age groups living below the poverty level.
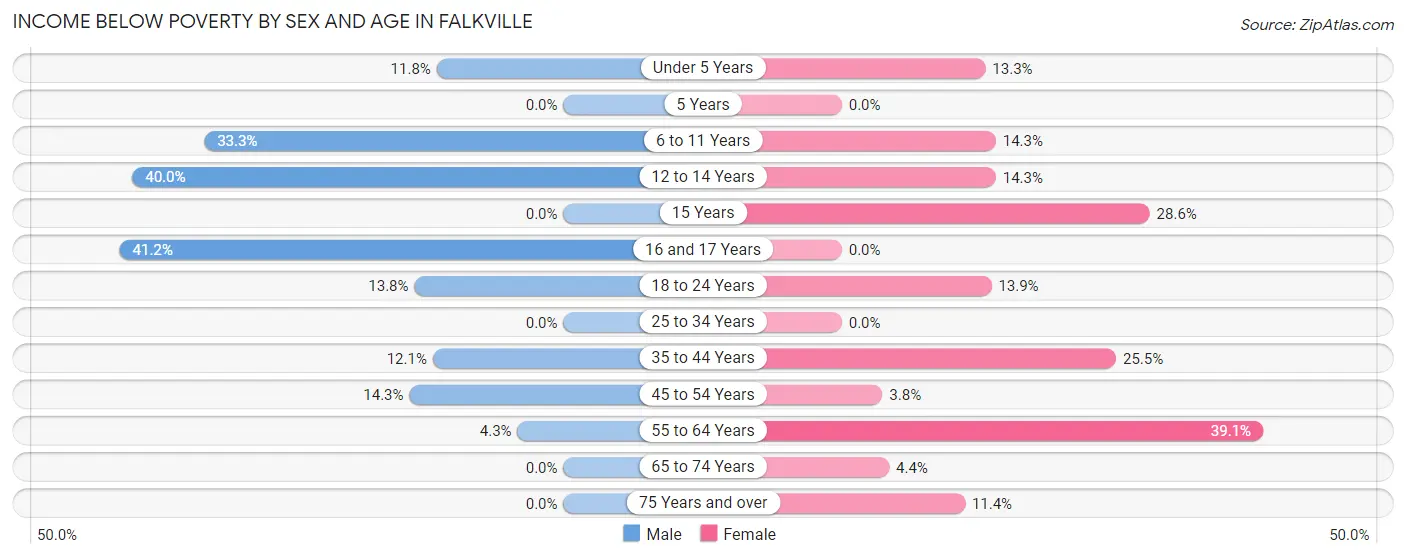
| Age Bracket | Male | Female |
| Under 5 Years | 4 (11.8%) | 4 (13.3%) |
| 5 Years | 0 (0.0%) | 0 (0.0%) |
| 6 to 11 Years | 5 (33.3%) | 2 (14.3%) |
| 12 to 14 Years | 2 (40.0%) | 2 (14.3%) |
| 15 Years | 0 (0.0%) | 2 (28.6%) |
| 16 and 17 Years | 7 (41.2%) | 0 (0.0%) |
| 18 to 24 Years | 13 (13.8%) | 5 (13.9%) |
| 25 to 34 Years | 0 (0.0%) | 0 (0.0%) |
| 35 to 44 Years | 8 (12.1%) | 14 (25.5%) |
| 45 to 54 Years | 7 (14.3%) | 2 (3.8%) |
| 55 to 64 Years | 2 (4.3%) | 34 (39.1%) |
| 65 to 74 Years | 0 (0.0%) | 5 (4.4%) |
| 75 Years and over | 0 (0.0%) | 4 (11.4%) |
| Total | 48 (9.0%) | 74 (14.4%) |
Income Above Poverty by Sex and Age in Falkville
According to the poverty statistics in Falkville, males aged 15 years and females aged 5 years are the age groups that are most secure financially, with 100.0% of males and 100.0% of females in these age groups living above the poverty line.
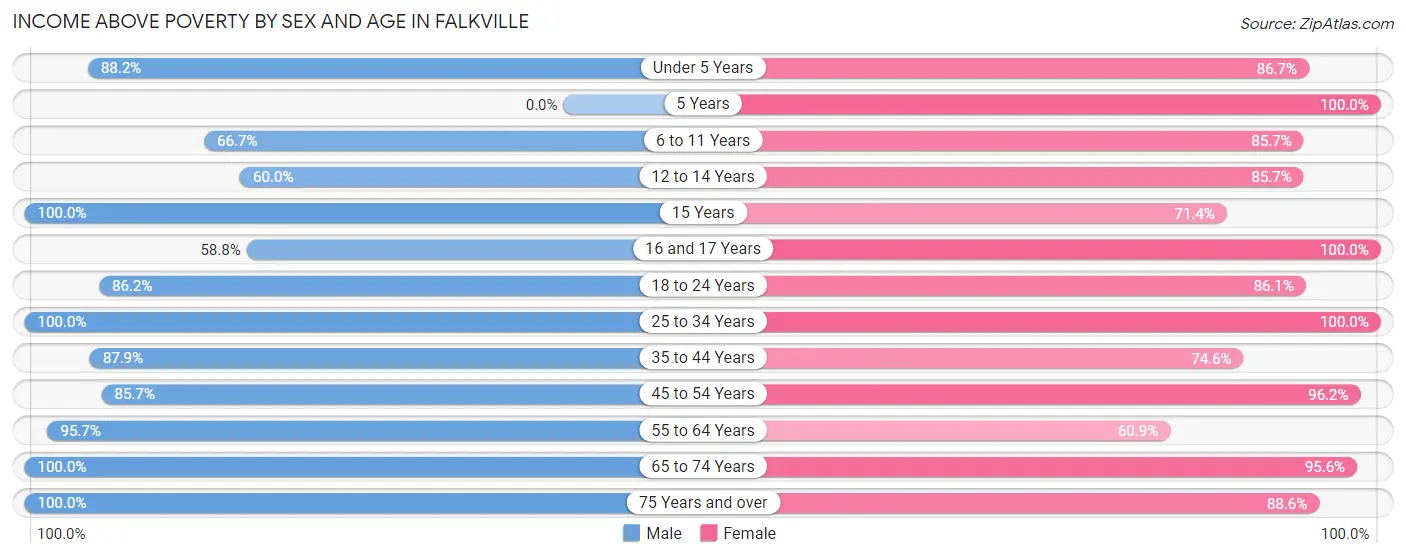
| Age Bracket | Male | Female |
| Under 5 Years | 30 (88.2%) | 26 (86.7%) |
| 5 Years | 0 (0.0%) | 3 (100.0%) |
| 6 to 11 Years | 10 (66.7%) | 12 (85.7%) |
| 12 to 14 Years | 3 (60.0%) | 12 (85.7%) |
| 15 Years | 6 (100.0%) | 5 (71.4%) |
| 16 and 17 Years | 10 (58.8%) | 6 (100.0%) |
| 18 to 24 Years | 81 (86.2%) | 31 (86.1%) |
| 25 to 34 Years | 59 (100.0%) | 58 (100.0%) |
| 35 to 44 Years | 58 (87.9%) | 41 (74.6%) |
| 45 to 54 Years | 42 (85.7%) | 51 (96.2%) |
| 55 to 64 Years | 45 (95.7%) | 53 (60.9%) |
| 65 to 74 Years | 122 (100.0%) | 109 (95.6%) |
| 75 Years and over | 17 (100.0%) | 31 (88.6%) |
| Total | 483 (91.0%) | 438 (85.6%) |
Income Below Poverty Among Married-Couple Families in Falkville
The poverty statistics for married-couple families in Falkville show that 4.6% or 8 of the total 175 families live below the poverty line. Families with 1 or 2 children have the highest poverty rate of 7.0%, comprising of 3 families. On the other hand, families with 3 or 4 children have the lowest poverty rate of 0.0%, which includes 0 families.
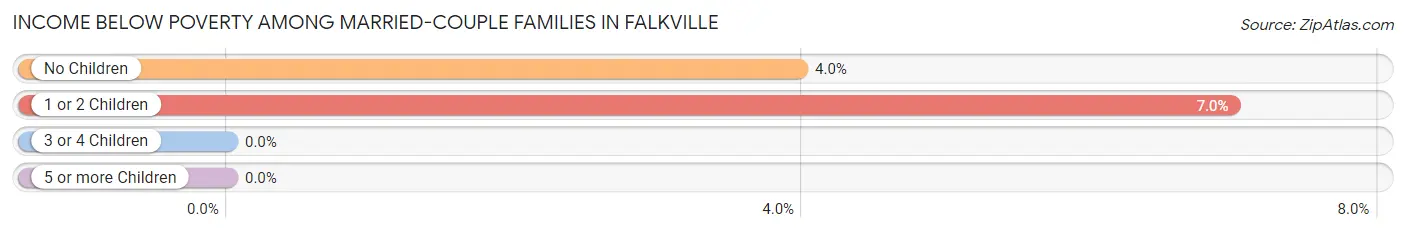
| Children | Above Poverty | Below Poverty |
| No Children | 121 (96.0%) | 5 (4.0%) |
| 1 or 2 Children | 40 (93.0%) | 3 (7.0%) |
| 3 or 4 Children | 6 (100.0%) | 0 (0.0%) |
| 5 or more Children | 0 (0.0%) | 0 (0.0%) |
| Total | 167 (95.4%) | 8 (4.6%) |
Income Below Poverty Among Single-Parent Households in Falkville
According to the poverty data in Falkville, 23.3% or 7 single-father households and 24.2% or 8 single-mother households are living below the poverty line. Among single-father households, those with 1 or 2 children have the highest poverty rate, with 7 households (58.3%) experiencing poverty. Likewise, among single-mother households, those with 3 or 4 children have the highest poverty rate, with 3 households (100.0%) falling below the poverty line.
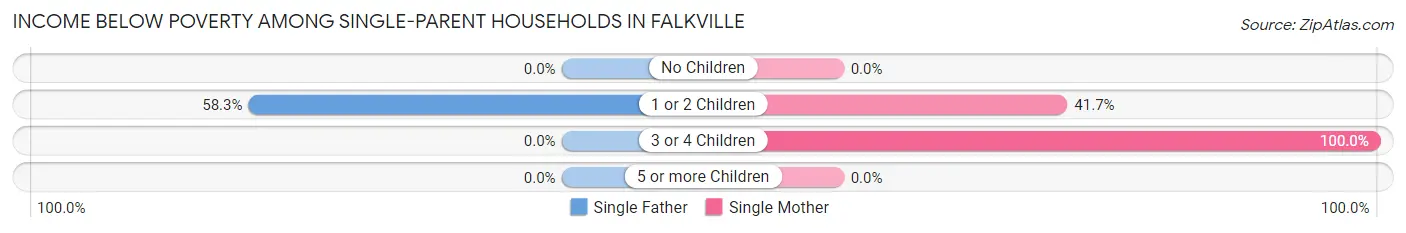
| Children | Single Father | Single Mother |
| No Children | 0 (0.0%) | 0 (0.0%) |
| 1 or 2 Children | 7 (58.3%) | 5 (41.7%) |
| 3 or 4 Children | 0 (0.0%) | 3 (100.0%) |
| 5 or more Children | 0 (0.0%) | 0 (0.0%) |
| Total | 7 (23.3%) | 8 (24.2%) |
Income Below Poverty Among Married-Couple vs Single-Parent Households in Falkville
The poverty data for Falkville shows that 8 of the married-couple family households (4.6%) and 15 of the single-parent households (23.8%) are living below the poverty level. Within the married-couple family households, those with 1 or 2 children have the highest poverty rate, with 3 households (7.0%) falling below the poverty line. Among the single-parent households, those with 3 or 4 children have the highest poverty rate, with 3 household (100.0%) living below poverty.
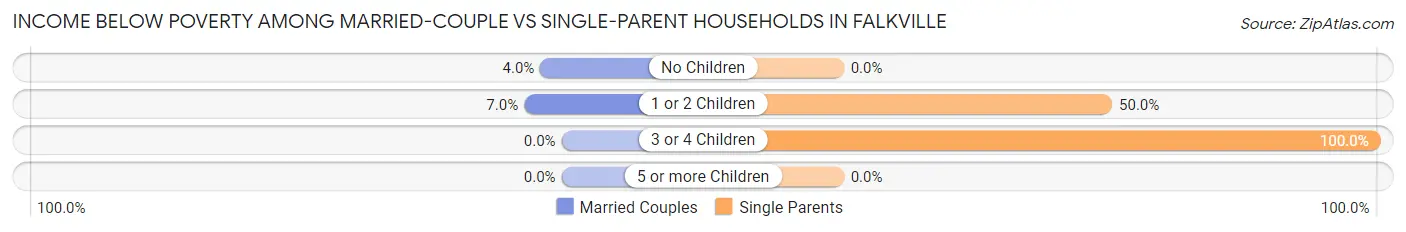
| Children | Married-Couple Families | Single-Parent Households |
| No Children | 5 (4.0%) | 0 (0.0%) |
| 1 or 2 Children | 3 (7.0%) | 12 (50.0%) |
| 3 or 4 Children | 0 (0.0%) | 3 (100.0%) |
| 5 or more Children | 0 (0.0%) | 0 (0.0%) |
| Total | 8 (4.6%) | 15 (23.8%) |
Race in Falkville
The most populous races in Falkville are White / Caucasian (1,233 | 86.7%), Two or more Races (81 | 5.7%), and Asian (61 | 4.3%).
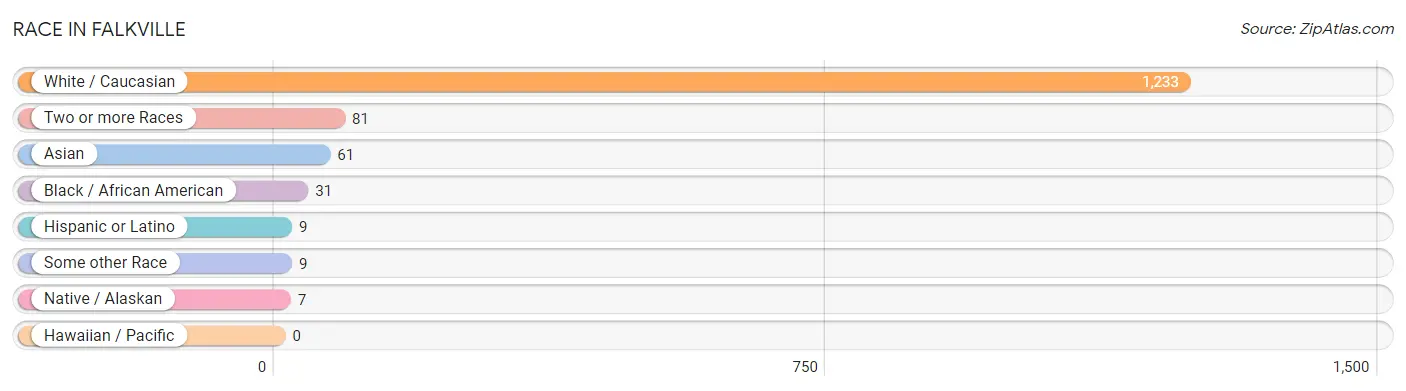
| Race | # Population | % Population |
| Asian | 61 | 4.3% |
| Black / African American | 31 | 2.2% |
| Hawaiian / Pacific | 0 | 0.0% |
| Hispanic or Latino | 9 | 0.6% |
| Native / Alaskan | 7 | 0.5% |
| White / Caucasian | 1,233 | 86.7% |
| Two or more Races | 81 | 5.7% |
| Some other Race | 9 | 0.6% |
| Total | 1,422 | 100.0% |
Ancestry in Falkville
The most populous ancestries reported in Falkville are American (128 | 9.0%), English (110 | 7.7%), Irish (81 | 5.7%), German (79 | 5.6%), and Burmese (61 | 4.3%), together accounting for 32.3% of all Falkville residents.
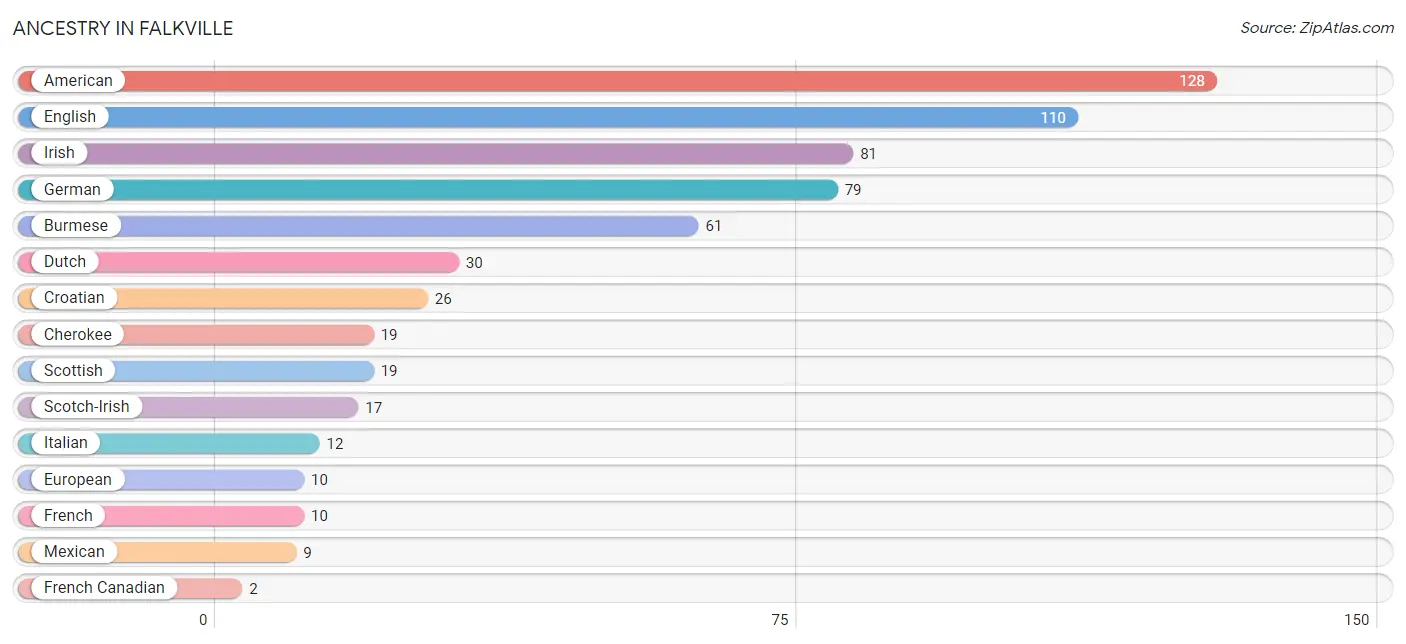
| Ancestry | # Population | % Population |
| American | 128 | 9.0% |
| Burmese | 61 | 4.3% |
| Cherokee | 19 | 1.3% |
| Croatian | 26 | 1.8% |
| Dutch | 30 | 2.1% |
| English | 110 | 7.7% |
| European | 10 | 0.7% |
| French | 10 | 0.7% |
| French Canadian | 2 | 0.1% |
| German | 79 | 5.6% |
| Irish | 81 | 5.7% |
| Italian | 12 | 0.8% |
| Mexican | 9 | 0.6% |
| Norwegian | 2 | 0.1% |
| Scotch-Irish | 17 | 1.2% |
| Scottish | 19 | 1.3% |
| Slovak | 2 | 0.1% |
| Yugoslavian | 2 | 0.1% | View All 18 Rows |
Immigrants in Falkville
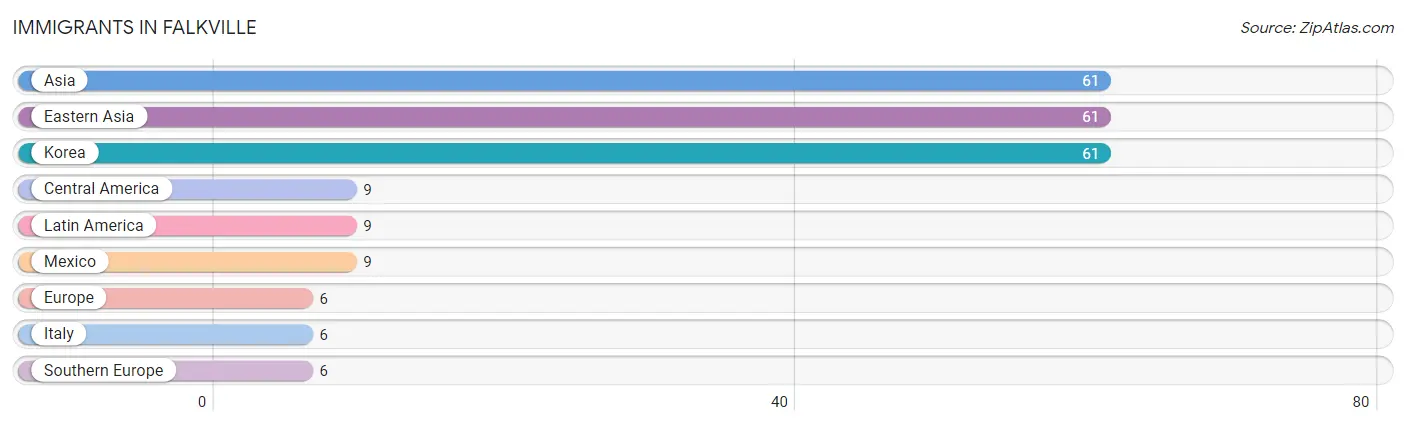
The most numerous immigrant groups reported in Falkville came from Asia (61 | 4.3%), Eastern Asia (61 | 4.3%), Korea (61 | 4.3%), Central America (9 | 0.6%), and Latin America (9 | 0.6%), together accounting for 14.1% of all Falkville residents.
| Immigration Origin | # Population | % Population |
| Asia | 61 | 4.3% |
| Central America | 9 | 0.6% |
| Eastern Asia | 61 | 4.3% |
| Europe | 6 | 0.4% |
| Italy | 6 | 0.4% |
| Korea | 61 | 4.3% |
| Latin America | 9 | 0.6% |
| Mexico | 9 | 0.6% |
| Southern Europe | 6 | 0.4% | View All 9 Rows |
Sex and Age in Falkville
Sex and Age in Falkville
The most populous age groups in Falkville are 65 to 69 Years (94 | 13.7%) for men and 70 to 74 Years (103 | 14.0%) for women.
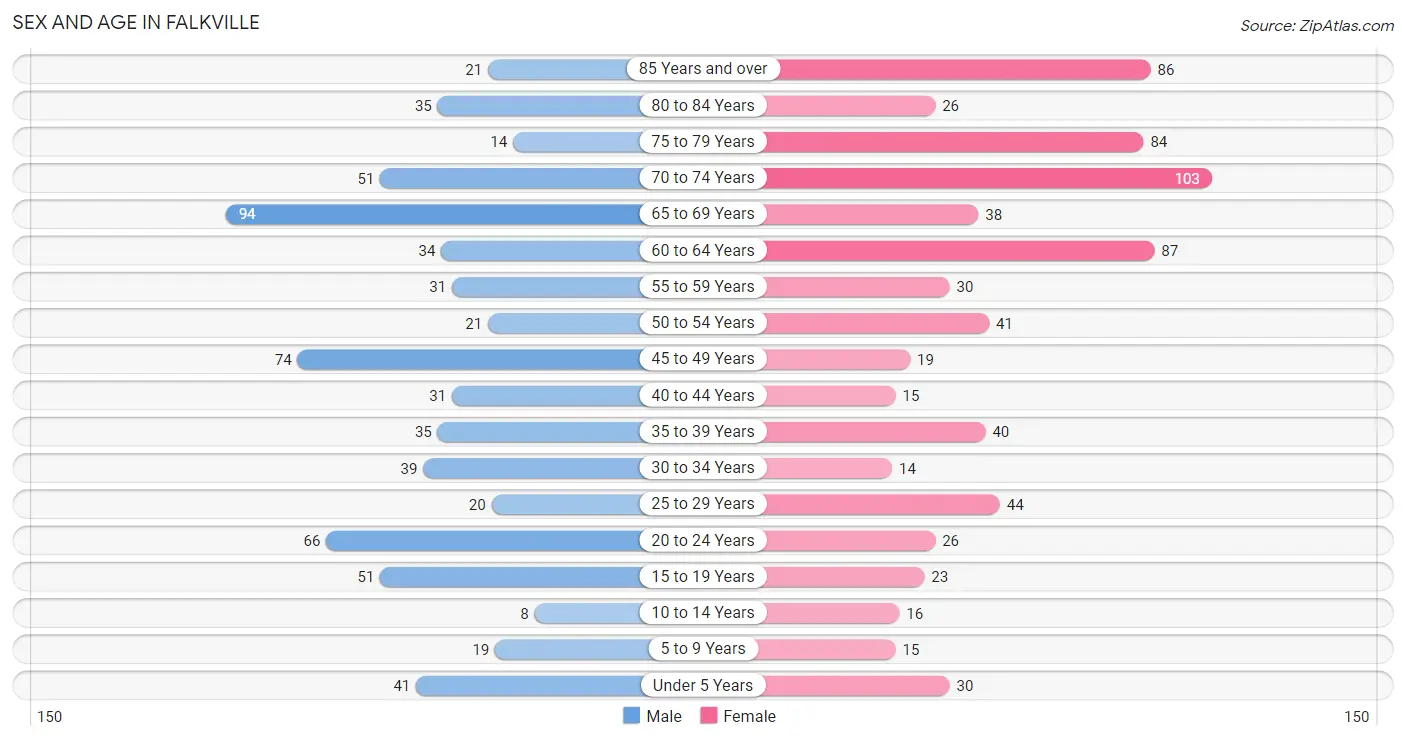
| Age Bracket | Male | Female |
| Under 5 Years | 41 (6.0%) | 30 (4.1%) |
| 5 to 9 Years | 19 (2.8%) | 15 (2.0%) |
| 10 to 14 Years | 8 (1.2%) | 16 (2.2%) |
| 15 to 19 Years | 51 (7.4%) | 23 (3.1%) |
| 20 to 24 Years | 66 (9.6%) | 26 (3.5%) |
| 25 to 29 Years | 20 (2.9%) | 44 (6.0%) |
| 30 to 34 Years | 39 (5.7%) | 14 (1.9%) |
| 35 to 39 Years | 35 (5.1%) | 40 (5.4%) |
| 40 to 44 Years | 31 (4.5%) | 15 (2.0%) |
| 45 to 49 Years | 74 (10.8%) | 19 (2.6%) |
| 50 to 54 Years | 21 (3.1%) | 41 (5.6%) |
| 55 to 59 Years | 31 (4.5%) | 30 (4.1%) |
| 60 to 64 Years | 34 (5.0%) | 87 (11.8%) |
| 65 to 69 Years | 94 (13.7%) | 38 (5.2%) |
| 70 to 74 Years | 51 (7.4%) | 103 (14.0%) |
| 75 to 79 Years | 14 (2.0%) | 84 (11.4%) |
| 80 to 84 Years | 35 (5.1%) | 26 (3.5%) |
| 85 Years and over | 21 (3.1%) | 86 (11.7%) |
| Total | 685 (100.0%) | 737 (100.0%) |
Families and Households in Falkville
Median Family Size in Falkville
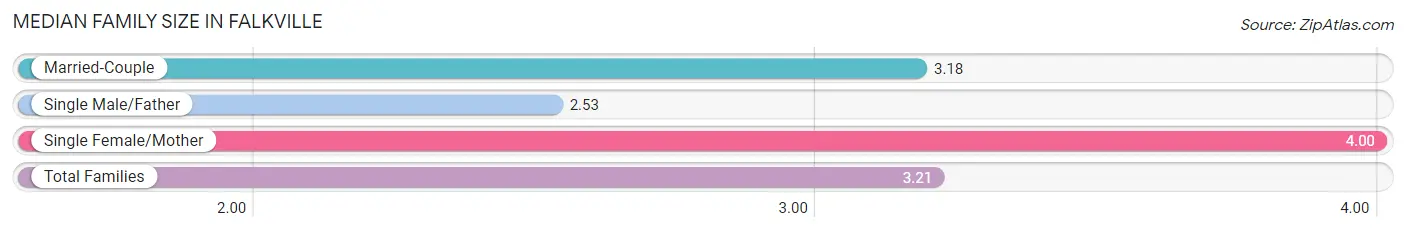
The median family size in Falkville is 3.21 persons per family, with single female/mother families (33 | 13.9%) accounting for the largest median family size of 4 persons per family. On the other hand, single male/father families (30 | 12.6%) represent the smallest median family size with 2.53 persons per family.
| Family Type | # Families | Family Size |
| Married-Couple | 175 (73.5%) | 3.18 |
| Single Male/Father | 30 (12.6%) | 2.53 |
| Single Female/Mother | 33 (13.9%) | 4.00 |
| Total Families | 238 (100.0%) | 3.21 |
Median Household Size in Falkville
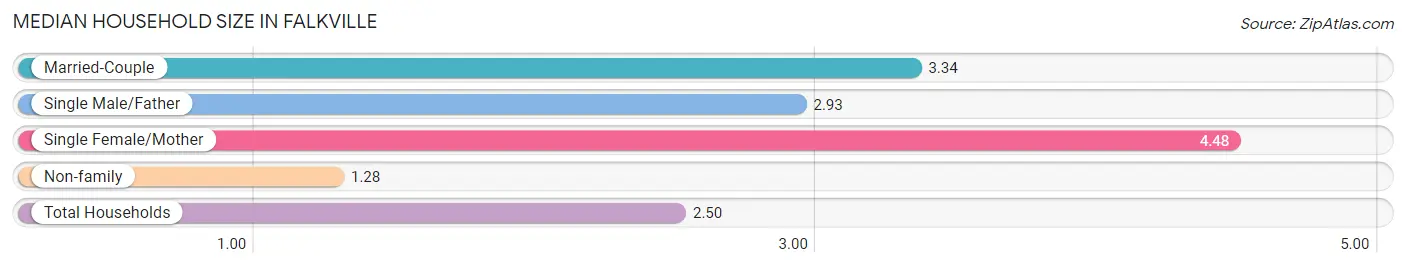
The median household size in Falkville is 2.50 persons per household, with single female/mother households (33 | 7.8%) accounting for the largest median household size of 4.48 persons per household. non-family households (185 | 43.7%) represent the smallest median household size with 1.28 persons per household.
| Household Type | # Households | Household Size |
| Married-Couple | 175 (41.4%) | 3.34 |
| Single Male/Father | 30 (7.1%) | 2.93 |
| Single Female/Mother | 33 (7.8%) | 4.48 |
| Non-family | 185 (43.7%) | 1.28 |
| Total Households | 423 (100.0%) | 2.50 |
Household Size by Marriage Status in Falkville
Out of a total of 423 households in Falkville, 238 (56.3%) are family households, while 185 (43.7%) are nonfamily households. The most numerous type of family households are 2-person households, comprising 101, and the most common type of nonfamily households are 1-person households, comprising 149.
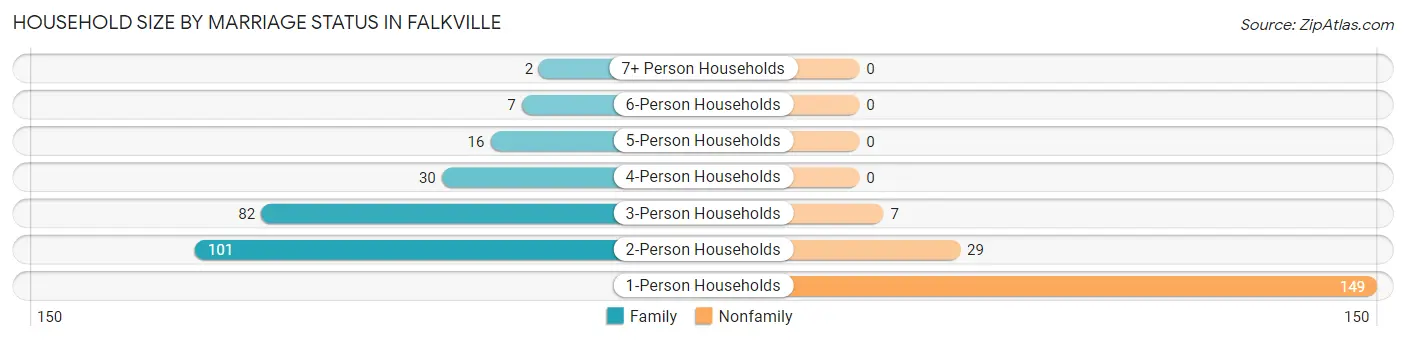
| Household Size | Family Households | Nonfamily Households |
| 1-Person Households | - | 149 (35.2%) |
| 2-Person Households | 101 (23.9%) | 29 (6.9%) |
| 3-Person Households | 82 (19.4%) | 7 (1.7%) |
| 4-Person Households | 30 (7.1%) | 0 (0.0%) |
| 5-Person Households | 16 (3.8%) | 0 (0.0%) |
| 6-Person Households | 7 (1.7%) | 0 (0.0%) |
| 7+ Person Households | 2 (0.5%) | 0 (0.0%) |
| Total | 238 (56.3%) | 185 (43.7%) |
Female Fertility in Falkville
Fertility by Age in Falkville
Average fertility rate in Falkville is 155.0 births per 1,000 women. Women in the age bracket of 20 to 34 years have the highest fertility rate with 262.0 births per 1,000 women. Women in the age bracket of 20 to 34 years acount for 78.6% of all women with births.
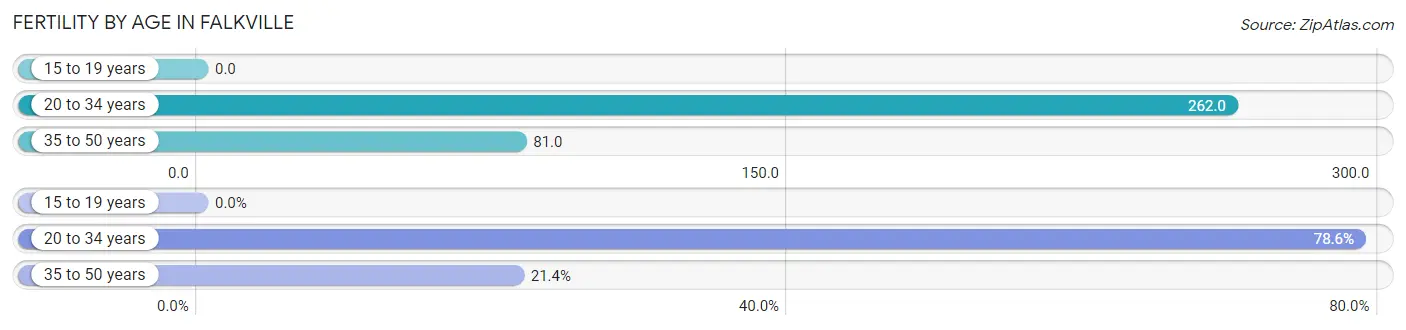
| Age Bracket | Women with Births | Births / 1,000 Women |
| 15 to 19 years | 0 (0.0%) | 0.0 |
| 20 to 34 years | 22 (78.6%) | 262.0 |
| 35 to 50 years | 6 (21.4%) | 81.0 |
| Total | 28 (100.0%) | 155.0 |
Fertility by Age by Marriage Status in Falkville
85.7% of women with births (28) in Falkville are married. The highest percentage of unmarried women with births falls into 20 to 34 years age bracket with 18.2% of them unmarried at the time of birth, while the lowest percentage of unmarried women with births belong to 35 to 50 years age bracket with 0.0% of them unmarried.
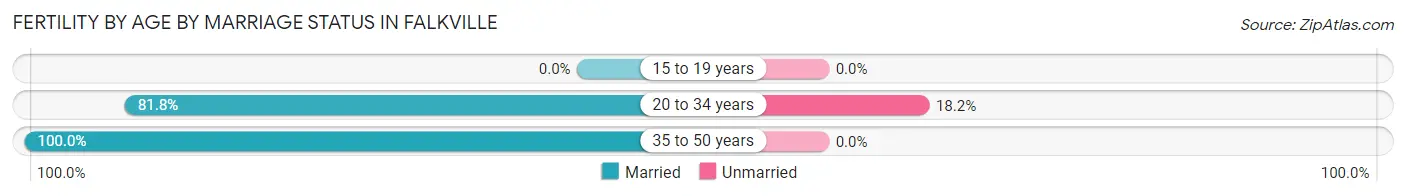
| Age Bracket | Married | Unmarried |
| 15 to 19 years | 0 (0.0%) | 0 (0.0%) |
| 20 to 34 years | 18 (81.8%) | 4 (18.2%) |
| 35 to 50 years | 6 (100.0%) | 0 (0.0%) |
| Total | 24 (85.7%) | 4 (14.3%) |
Fertility by Education in Falkville
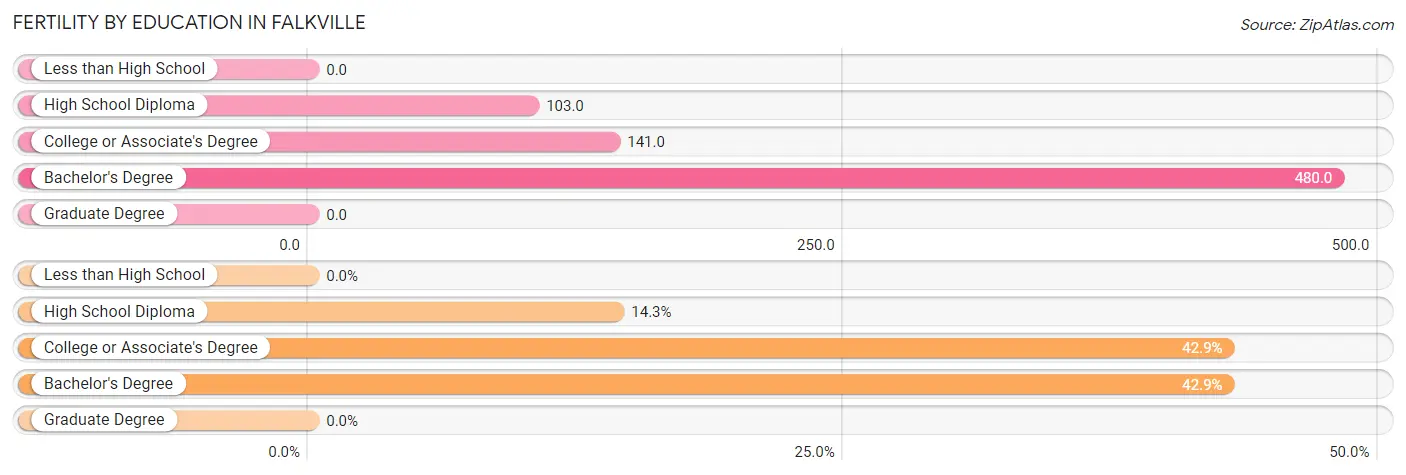
| Educational Attainment | Women with Births | Births / 1,000 Women |
| Less than High School | 0 (0.0%) | 0.0 |
| High School Diploma | 4 (14.3%) | 103.0 |
| College or Associate's Degree | 12 (42.9%) | 141.0 |
| Bachelor's Degree | 12 (42.9%) | 480.0 |
| Graduate Degree | 0 (0.0%) | 0.0 |
| Total | 28 (100.0%) | 155.0 |
Fertility by Education by Marriage Status in Falkville
14.3% of women with births in Falkville are unmarried. Women with the educational attainment of college or associate's degree are most likely to be married with 100.0% of them married at childbirth, while women with the educational attainment of high school diploma are least likely to be married with 100.0% of them unmarried at childbirth.
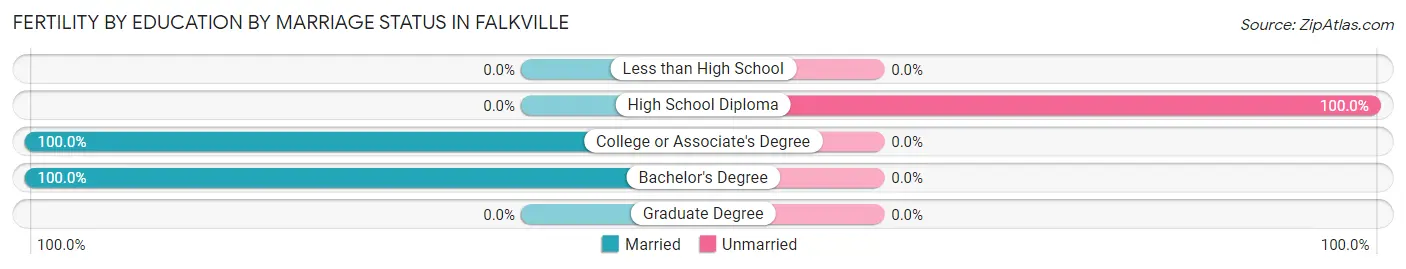
| Educational Attainment | Married | Unmarried |
| Less than High School | 0 (0.0%) | 0 (0.0%) |
| High School Diploma | 0 (0.0%) | 4 (100.0%) |
| College or Associate's Degree | 12 (100.0%) | 0 (0.0%) |
| Bachelor's Degree | 12 (100.0%) | 0 (0.0%) |
| Graduate Degree | 0 (0.0%) | 0 (0.0%) |
| Total | 24 (85.7%) | 4 (14.3%) |
Employment Characteristics in Falkville
Employment by Class of Employer in Falkville
Among the 534 employed individuals in Falkville, private company employees (427 | 80.0%), local government employees (49 | 9.2%), and self-employed (not incorporated) (21 | 3.9%) make up the most common classes of employment.
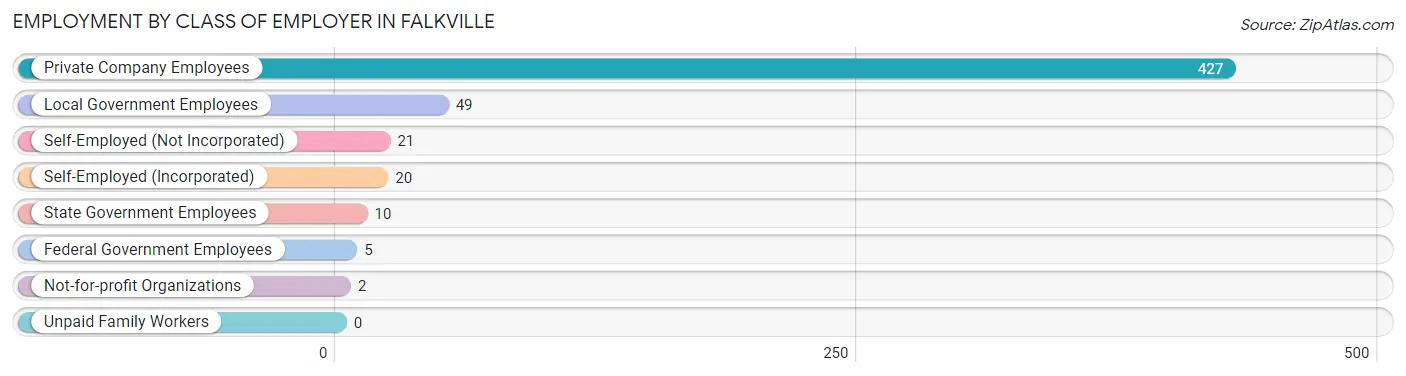
| Employer Class | # Employees | % Employees |
| Private Company Employees | 427 | 80.0% |
| Self-Employed (Incorporated) | 20 | 3.7% |
| Self-Employed (Not Incorporated) | 21 | 3.9% |
| Not-for-profit Organizations | 2 | 0.4% |
| Local Government Employees | 49 | 9.2% |
| State Government Employees | 10 | 1.9% |
| Federal Government Employees | 5 | 0.9% |
| Unpaid Family Workers | 0 | 0.0% |
| Total | 534 | 100.0% |
Employment Status by Age in Falkville
According to the labor force statistics for Falkville, out of the total population over 16 years of age (1,280), 43.8% or 561 individuals are in the labor force, with 4.3% or 24 of them unemployed. The age group with the highest labor force participation rate is 30 to 34 years, with 100.0% or 53 individuals in the labor force. Within the labor force, the 25 to 29 years age range has the highest percentage of unemployed individuals, with 14.8% or 9 of them being unemployed.
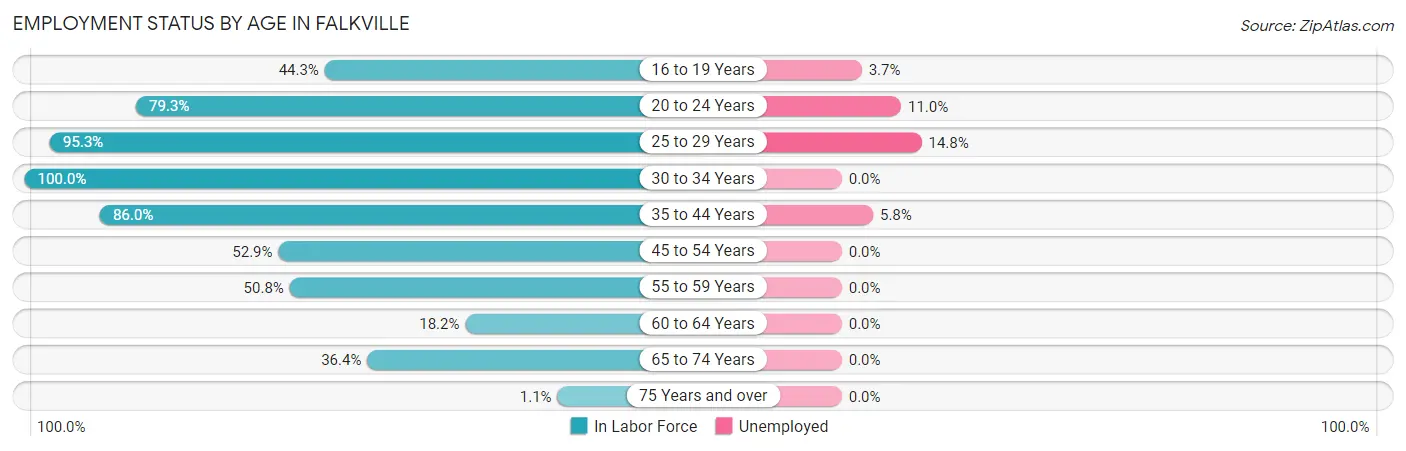
| Age Bracket | In Labor Force | Unemployed |
| 16 to 19 Years | 27 (44.3%) | 1 (3.7%) |
| 20 to 24 Years | 73 (79.3%) | 8 (11.0%) |
| 25 to 29 Years | 61 (95.3%) | 9 (14.8%) |
| 30 to 34 Years | 53 (100.0%) | 0 (0.0%) |
| 35 to 44 Years | 104 (86.0%) | 6 (5.8%) |
| 45 to 54 Years | 82 (52.9%) | 0 (0.0%) |
| 55 to 59 Years | 31 (50.8%) | 0 (0.0%) |
| 60 to 64 Years | 22 (18.2%) | 0 (0.0%) |
| 65 to 74 Years | 104 (36.4%) | 0 (0.0%) |
| 75 Years and over | 3 (1.1%) | 0 (0.0%) |
| Total | 561 (43.8%) | 24 (4.3%) |
Employment Status by Educational Attainment in Falkville
According to labor force statistics for Falkville, 61.4% of individuals (353) out of the total population between 25 and 64 years of age (575) are in the labor force, with 4.2% or 15 of them being unemployed. The group with the highest labor force participation rate are those with the educational attainment of bachelor's degree or higher, with 96.9% or 63 individuals in the labor force. Within the labor force, individuals with high school diploma education have the highest percentage of unemployment, with 6.0% or 9 of them being unemployed.
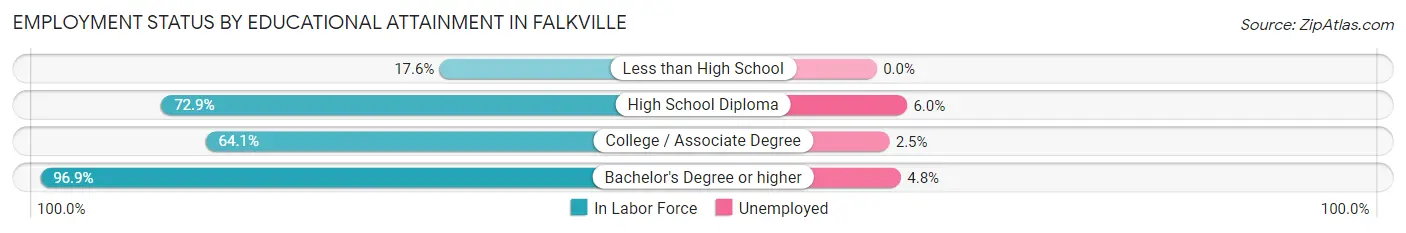
| Educational Attainment | In Labor Force | Unemployed |
| Less than High School | 21 (17.6%) | 0 (0.0%) |
| High School Diploma | 151 (72.9%) | 12 (6.0%) |
| College / Associate Degree | 118 (64.1%) | 5 (2.5%) |
| Bachelor's Degree or higher | 63 (96.9%) | 3 (4.8%) |
| Total | 353 (61.4%) | 24 (4.2%) |
Employment Occupations by Sex in Falkville
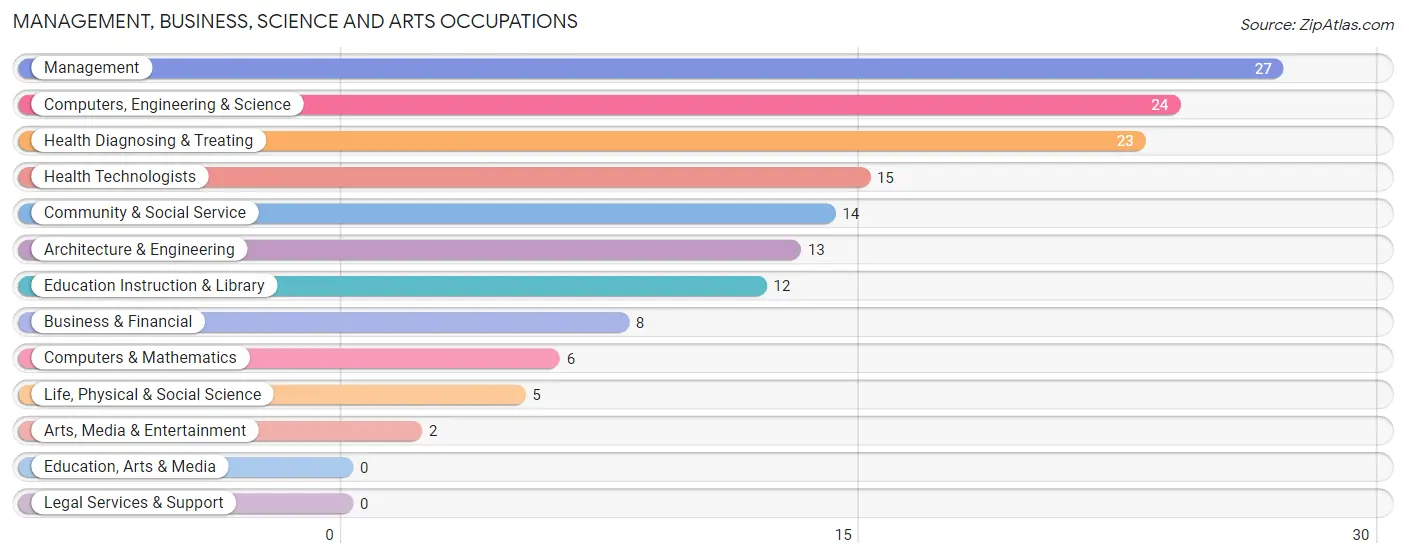
Management, Business, Science and Arts Occupations
The most common Management, Business, Science and Arts occupations in Falkville are Management (27 | 5.0%), Computers, Engineering & Science (24 | 4.5%), Health Diagnosing & Treating (23 | 4.3%), Health Technologists (15 | 2.8%), and Community & Social Service (14 | 2.6%).
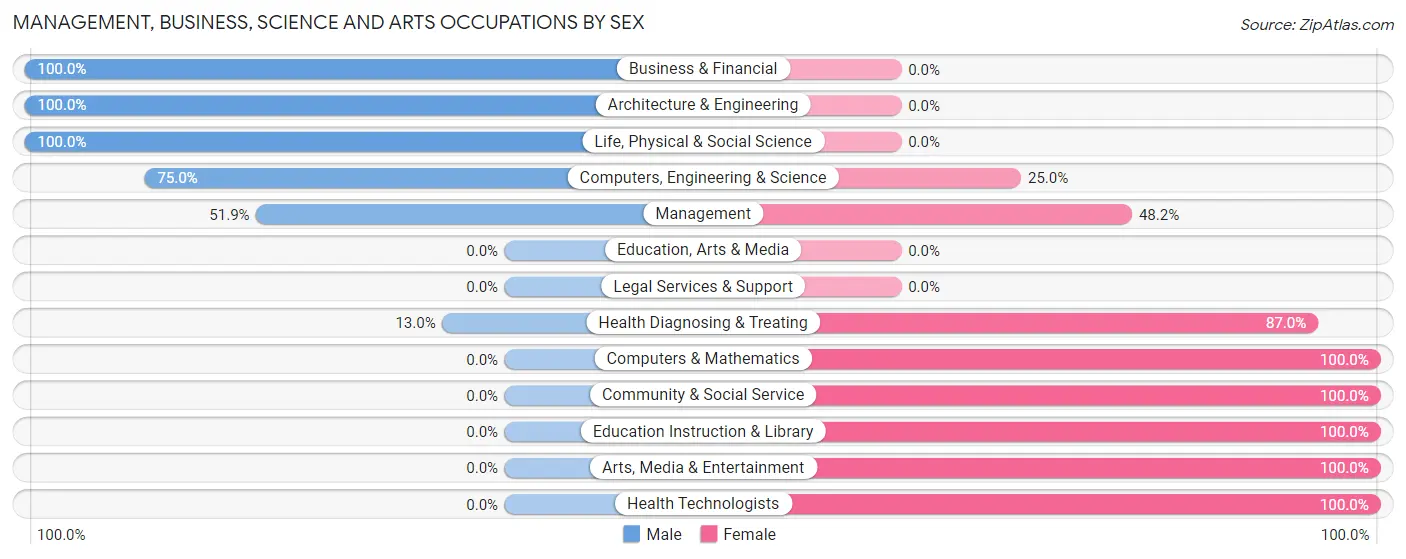
Management, Business, Science and Arts Occupations by Sex
Within the Management, Business, Science and Arts occupations in Falkville, the most male-oriented occupations are Business & Financial (100.0%), Architecture & Engineering (100.0%), and Life, Physical & Social Science (100.0%), while the most female-oriented occupations are Computers & Mathematics (100.0%), Community & Social Service (100.0%), and Education Instruction & Library (100.0%).
| Occupation | Male | Female |
| Management | 14 (51.8%) | 13 (48.1%) |
| Business & Financial | 8 (100.0%) | 0 (0.0%) |
| Computers, Engineering & Science | 18 (75.0%) | 6 (25.0%) |
| Computers & Mathematics | 0 (0.0%) | 6 (100.0%) |
| Architecture & Engineering | 13 (100.0%) | 0 (0.0%) |
| Life, Physical & Social Science | 5 (100.0%) | 0 (0.0%) |
| Community & Social Service | 0 (0.0%) | 14 (100.0%) |
| Education, Arts & Media | 0 (0.0%) | 0 (0.0%) |
| Legal Services & Support | 0 (0.0%) | 0 (0.0%) |
| Education Instruction & Library | 0 (0.0%) | 12 (100.0%) |
| Arts, Media & Entertainment | 0 (0.0%) | 2 (100.0%) |
| Health Diagnosing & Treating | 3 (13.0%) | 20 (87.0%) |
| Health Technologists | 0 (0.0%) | 15 (100.0%) |
| Total (Category) | 43 (44.8%) | 53 (55.2%) |
| Total (Overall) | 262 (48.9%) | 274 (51.1%) |
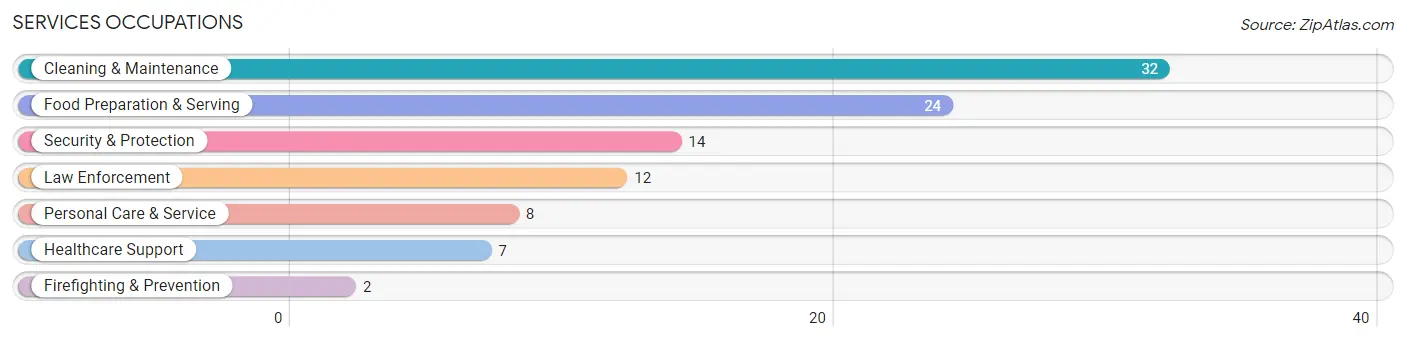
Services Occupations
The most common Services occupations in Falkville are Cleaning & Maintenance (32 | 6.0%), Food Preparation & Serving (24 | 4.5%), Security & Protection (14 | 2.6%), Law Enforcement (12 | 2.2%), and Personal Care & Service (8 | 1.5%).
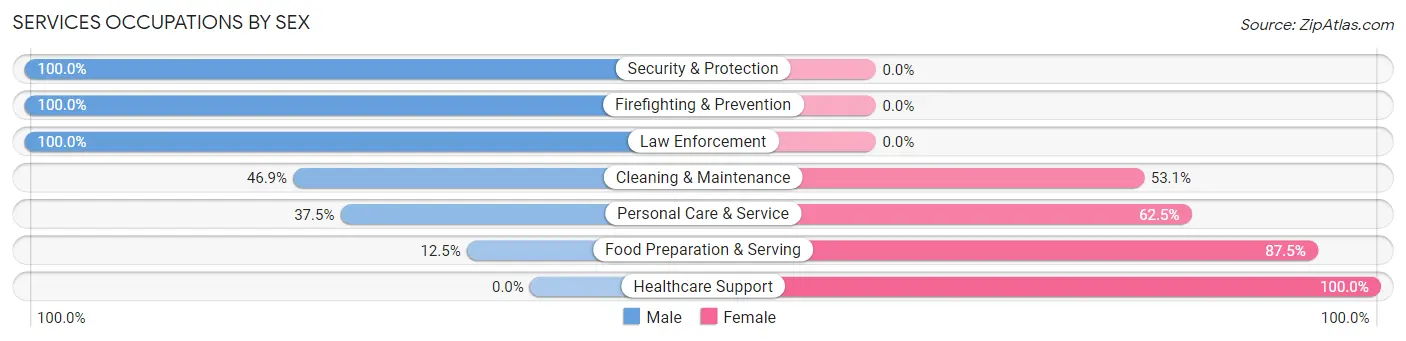
Services Occupations by Sex
Within the Services occupations in Falkville, the most male-oriented occupations are Security & Protection (100.0%), Firefighting & Prevention (100.0%), and Law Enforcement (100.0%), while the most female-oriented occupations are Healthcare Support (100.0%), Food Preparation & Serving (87.5%), and Personal Care & Service (62.5%).
| Occupation | Male | Female |
| Healthcare Support | 0 (0.0%) | 7 (100.0%) |
| Security & Protection | 14 (100.0%) | 0 (0.0%) |
| Firefighting & Prevention | 2 (100.0%) | 0 (0.0%) |
| Law Enforcement | 12 (100.0%) | 0 (0.0%) |
| Food Preparation & Serving | 3 (12.5%) | 21 (87.5%) |
| Cleaning & Maintenance | 15 (46.9%) | 17 (53.1%) |
| Personal Care & Service | 3 (37.5%) | 5 (62.5%) |
| Total (Category) | 35 (41.2%) | 50 (58.8%) |
| Total (Overall) | 262 (48.9%) | 274 (51.1%) |
Sales and Office Occupations
The most common Sales and Office occupations in Falkville are Office & Administration (65 | 12.1%), and Sales & Related (52 | 9.7%).

Sales and Office Occupations by Sex

| Occupation | Male | Female |
| Sales & Related | 18 (34.6%) | 34 (65.4%) |
| Office & Administration | 7 (10.8%) | 58 (89.2%) |
| Total (Category) | 25 (21.4%) | 92 (78.6%) |
| Total (Overall) | 262 (48.9%) | 274 (51.1%) |
Natural Resources, Construction and Maintenance Occupations
The most common Natural Resources, Construction and Maintenance occupations in Falkville are Construction & Extraction (29 | 5.4%), and Installation, Maintenance & Repair (25 | 4.7%).
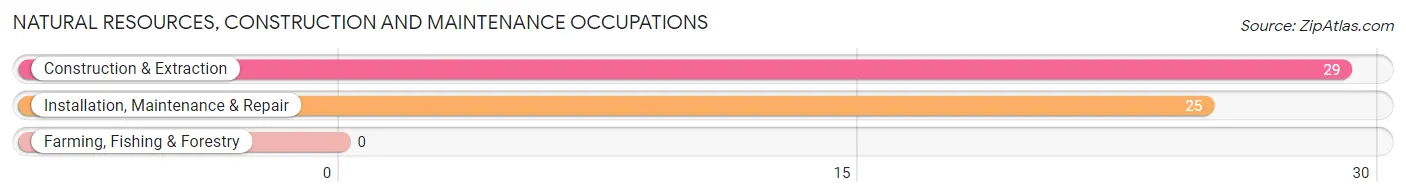
Natural Resources, Construction and Maintenance Occupations by Sex

| Occupation | Male | Female |
| Farming, Fishing & Forestry | 0 (0.0%) | 0 (0.0%) |
| Construction & Extraction | 29 (100.0%) | 0 (0.0%) |
| Installation, Maintenance & Repair | 25 (100.0%) | 0 (0.0%) |
| Total (Category) | 54 (100.0%) | 0 (0.0%) |
| Total (Overall) | 262 (48.9%) | 274 (51.1%) |
Production, Transportation and Moving Occupations
The most common Production, Transportation and Moving occupations in Falkville are Production (133 | 24.8%), Transportation (38 | 7.1%), and Material Moving (13 | 2.4%).
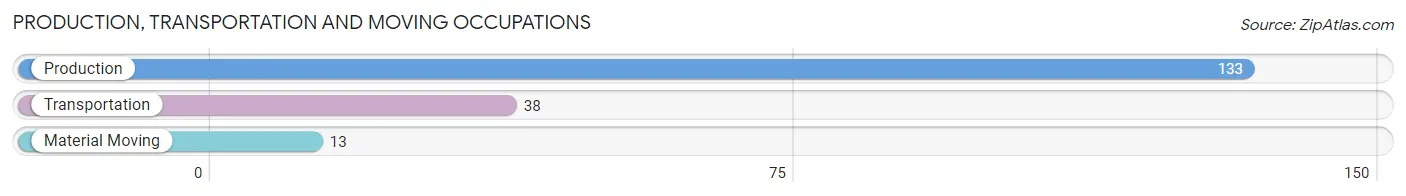
Production, Transportation and Moving Occupations by Sex
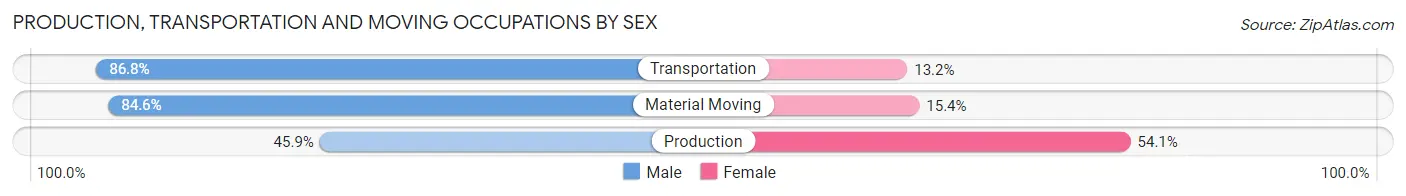
| Occupation | Male | Female |
| Production | 61 (45.9%) | 72 (54.1%) |
| Transportation | 33 (86.8%) | 5 (13.2%) |
| Material Moving | 11 (84.6%) | 2 (15.4%) |
| Total (Category) | 105 (57.1%) | 79 (42.9%) |
| Total (Overall) | 262 (48.9%) | 274 (51.1%) |
Employment Industries by Sex in Falkville
Employment Industries in Falkville
The major employment industries in Falkville include Retail Trade (101 | 18.8%), Accommodation & Food Services (76 | 14.2%), Manufacturing (62 | 11.6%), Health Care & Social Assistance (56 | 10.4%), and Construction (49 | 9.1%).
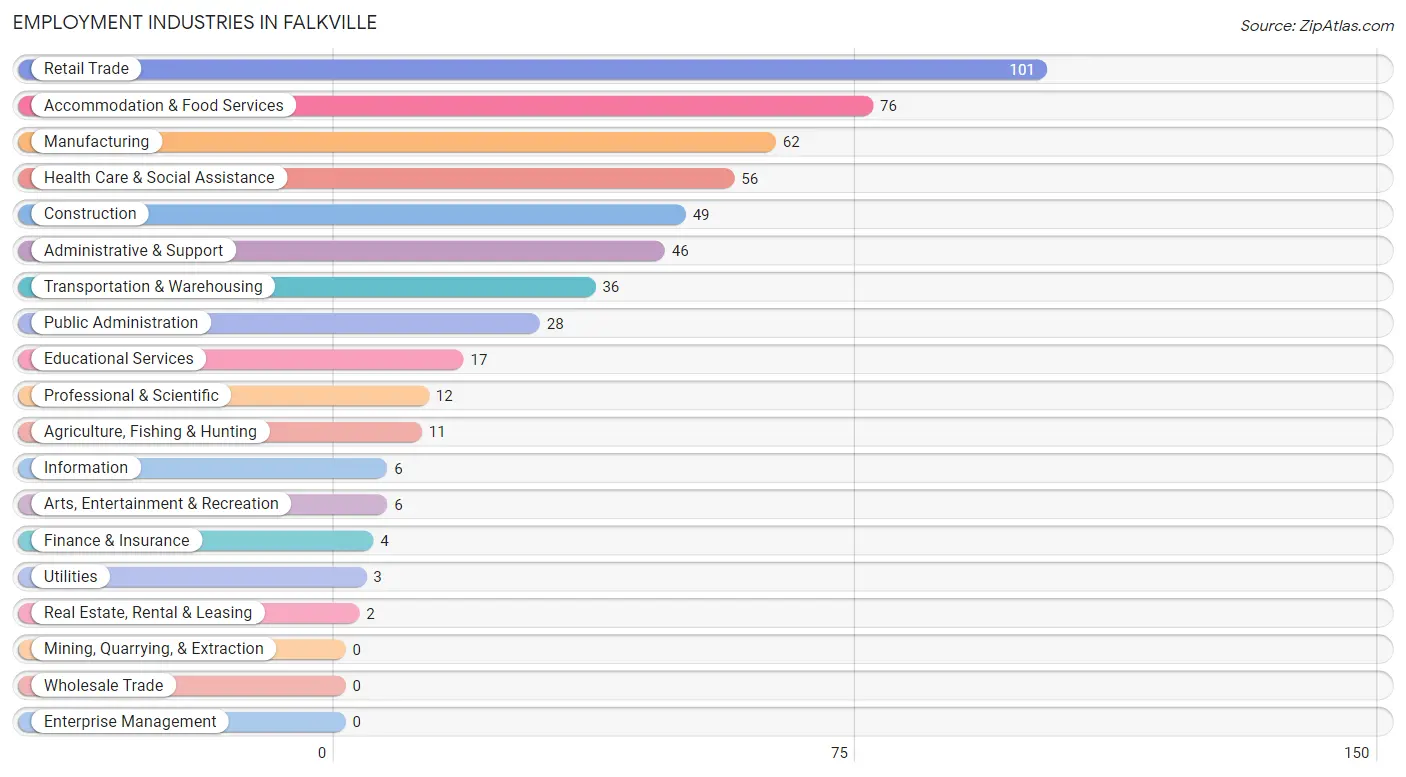
Employment Industries by Sex in Falkville
The Falkville industries that see more men than women are Agriculture, Fishing & Hunting (100.0%), Construction (100.0%), and Manufacturing (88.7%), whereas the industries that tend to have a higher number of women are Utilities (100.0%), Information (100.0%), and Finance & Insurance (100.0%).
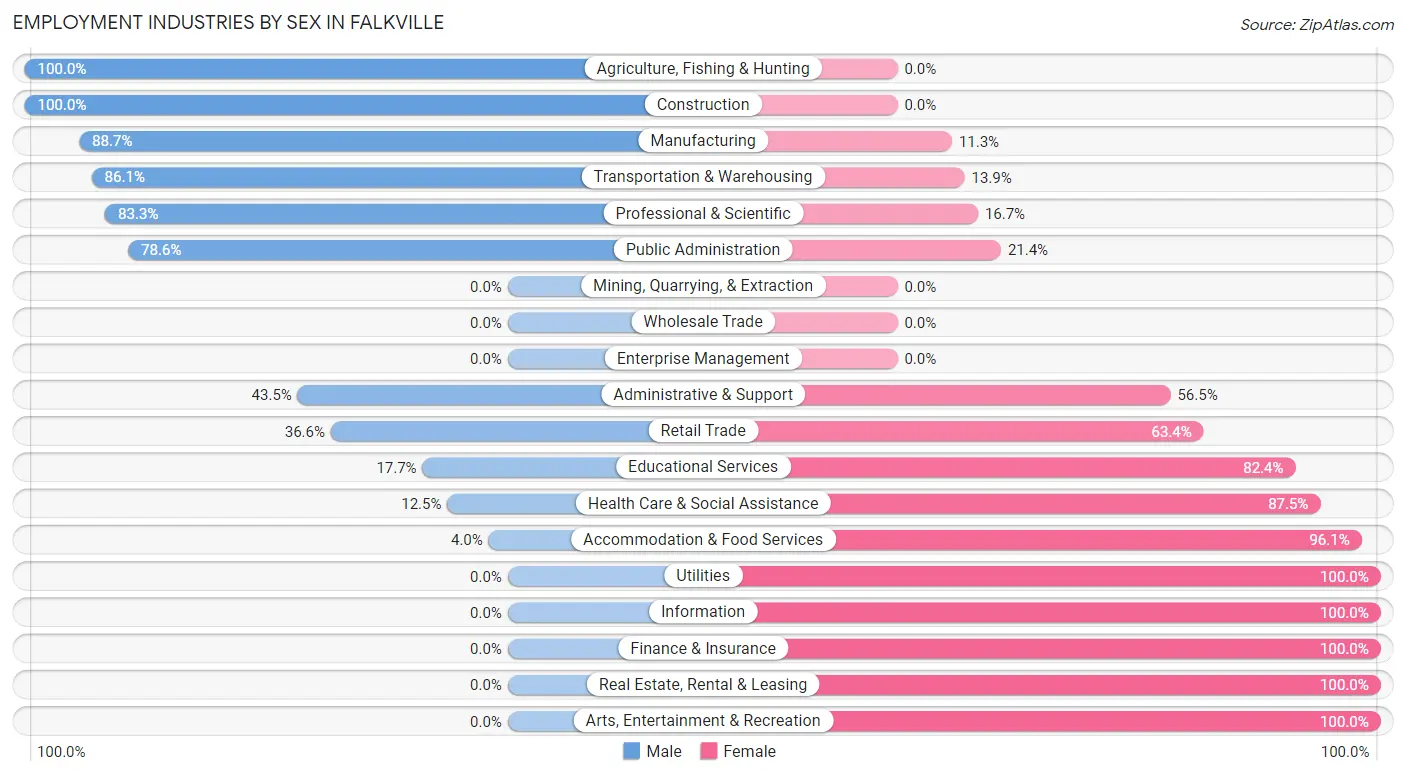
| Industry | Male | Female |
| Agriculture, Fishing & Hunting | 11 (100.0%) | 0 (0.0%) |
| Mining, Quarrying, & Extraction | 0 (0.0%) | 0 (0.0%) |
| Construction | 49 (100.0%) | 0 (0.0%) |
| Manufacturing | 55 (88.7%) | 7 (11.3%) |
| Wholesale Trade | 0 (0.0%) | 0 (0.0%) |
| Retail Trade | 37 (36.6%) | 64 (63.4%) |
| Transportation & Warehousing | 31 (86.1%) | 5 (13.9%) |
| Utilities | 0 (0.0%) | 3 (100.0%) |
| Information | 0 (0.0%) | 6 (100.0%) |
| Finance & Insurance | 0 (0.0%) | 4 (100.0%) |
| Real Estate, Rental & Leasing | 0 (0.0%) | 2 (100.0%) |
| Professional & Scientific | 10 (83.3%) | 2 (16.7%) |
| Enterprise Management | 0 (0.0%) | 0 (0.0%) |
| Administrative & Support | 20 (43.5%) | 26 (56.5%) |
| Educational Services | 3 (17.6%) | 14 (82.4%) |
| Health Care & Social Assistance | 7 (12.5%) | 49 (87.5%) |
| Arts, Entertainment & Recreation | 0 (0.0%) | 6 (100.0%) |
| Accommodation & Food Services | 3 (4.0%) | 73 (96.1%) |
| Public Administration | 22 (78.6%) | 6 (21.4%) |
| Total | 262 (48.9%) | 274 (51.1%) |
Education in Falkville
School Enrollment in Falkville
The most common levels of schooling among the 182 students in Falkville are college / undergraduate (55 | 30.2%), high school (43 | 23.6%), and elementary school (28 | 15.4%).
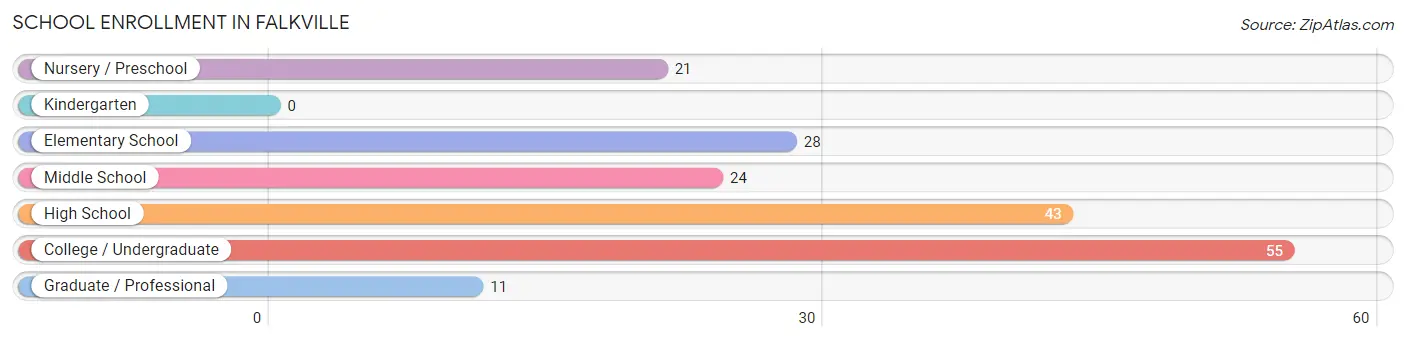
| School Level | # Students | % Students |
| Nursery / Preschool | 21 | 11.5% |
| Kindergarten | 0 | 0.0% |
| Elementary School | 28 | 15.4% |
| Middle School | 24 | 13.2% |
| High School | 43 | 23.6% |
| College / Undergraduate | 55 | 30.2% |
| Graduate / Professional | 11 | 6.0% |
| Total | 182 | 100.0% |
School Enrollment by Age by Funding Source in Falkville
Out of a total of 182 students who are enrolled in schools in Falkville, 17 (9.3%) attend a private institution, while the remaining 165 (90.7%) are enrolled in public schools. The age group of 3 to 4 year olds has the highest likelihood of being enrolled in private schools, with 6 (33.3% in the age bracket) enrolled. Conversely, the age group of 15 to 17 year olds has the lowest likelihood of being enrolled in a private school, with 36 (100.0% in the age bracket) attending a public institution.
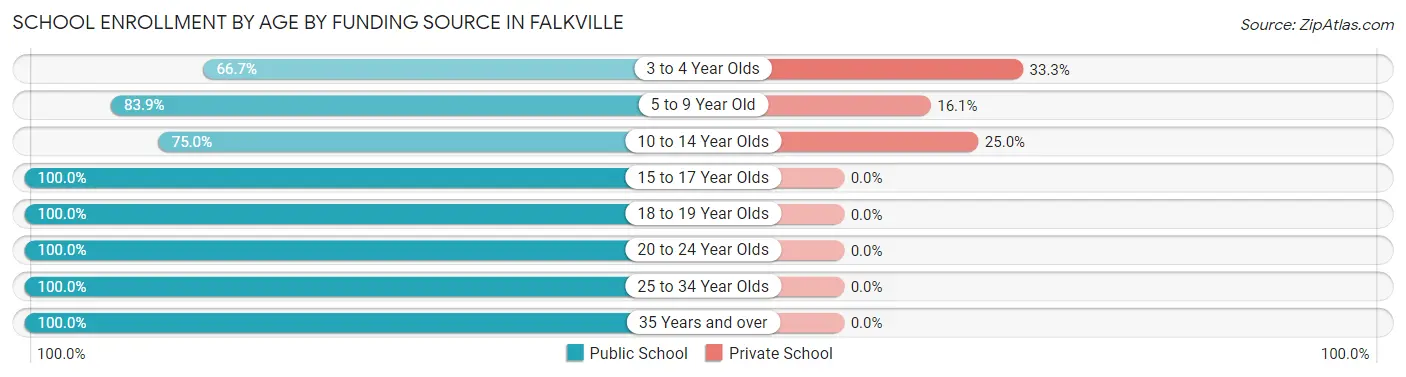
| Age Bracket | Public School | Private School |
| 3 to 4 Year Olds | 12 (66.7%) | 6 (33.3%) |
| 5 to 9 Year Old | 26 (83.9%) | 5 (16.1%) |
| 10 to 14 Year Olds | 18 (75.0%) | 6 (25.0%) |
| 15 to 17 Year Olds | 36 (100.0%) | 0 (0.0%) |
| 18 to 19 Year Olds | 29 (100.0%) | 0 (0.0%) |
| 20 to 24 Year Olds | 24 (100.0%) | 0 (0.0%) |
| 25 to 34 Year Olds | 2 (100.0%) | 0 (0.0%) |
| 35 Years and over | 18 (100.0%) | 0 (0.0%) |
| Total | 165 (90.7%) | 17 (9.3%) |
Educational Attainment by Field of Study in Falkville
Business (28 | 25.2%), education (26 | 23.4%), computers & mathematics (11 | 9.9%), bio, nature & agricultural (8 | 7.2%), and science & technology (8 | 7.2%) are the most common fields of study among 111 individuals in Falkville who have obtained a bachelor's degree or higher.
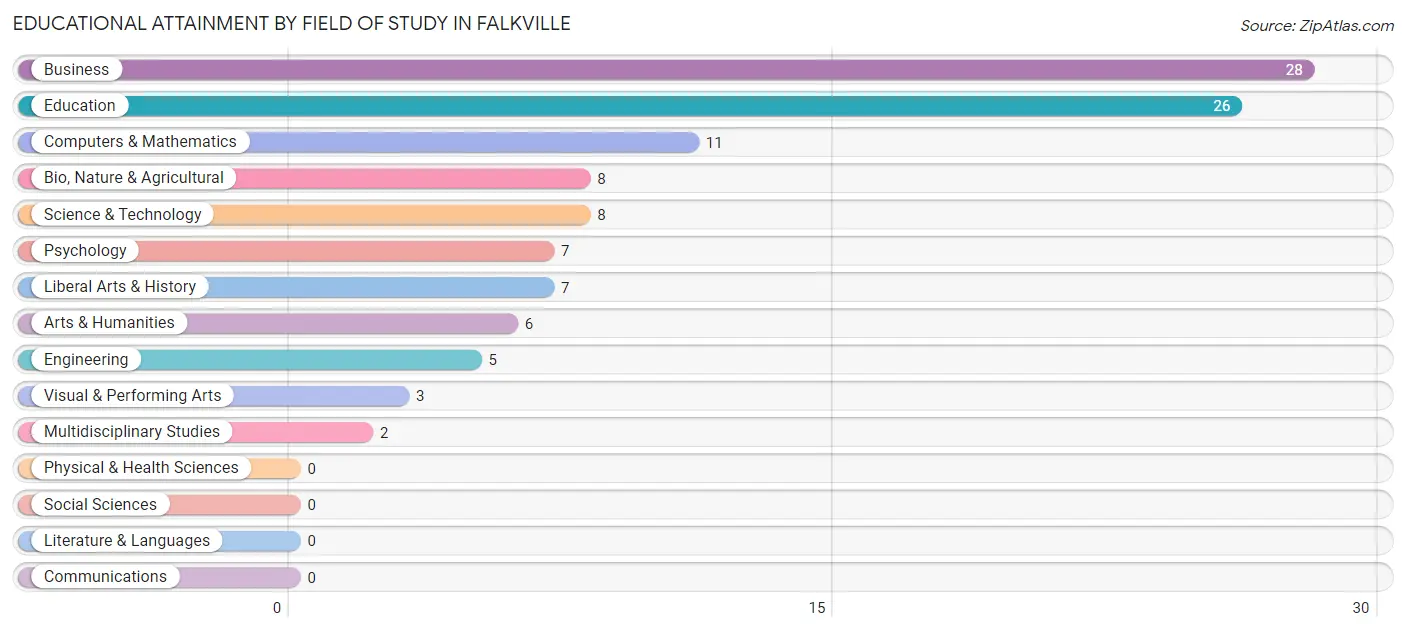
| Field of Study | # Graduates | % Graduates |
| Computers & Mathematics | 11 | 9.9% |
| Bio, Nature & Agricultural | 8 | 7.2% |
| Physical & Health Sciences | 0 | 0.0% |
| Psychology | 7 | 6.3% |
| Social Sciences | 0 | 0.0% |
| Engineering | 5 | 4.5% |
| Multidisciplinary Studies | 2 | 1.8% |
| Science & Technology | 8 | 7.2% |
| Business | 28 | 25.2% |
| Education | 26 | 23.4% |
| Literature & Languages | 0 | 0.0% |
| Liberal Arts & History | 7 | 6.3% |
| Visual & Performing Arts | 3 | 2.7% |
| Communications | 0 | 0.0% |
| Arts & Humanities | 6 | 5.4% |
| Total | 111 | 100.0% |
Transportation & Commute in Falkville
Vehicle Availability by Sex in Falkville
The most prevalent vehicle ownership categories in Falkville are males with 2 vehicles (99, accounting for 37.8%) and females with 2 vehicles (159, making up 36.4%).
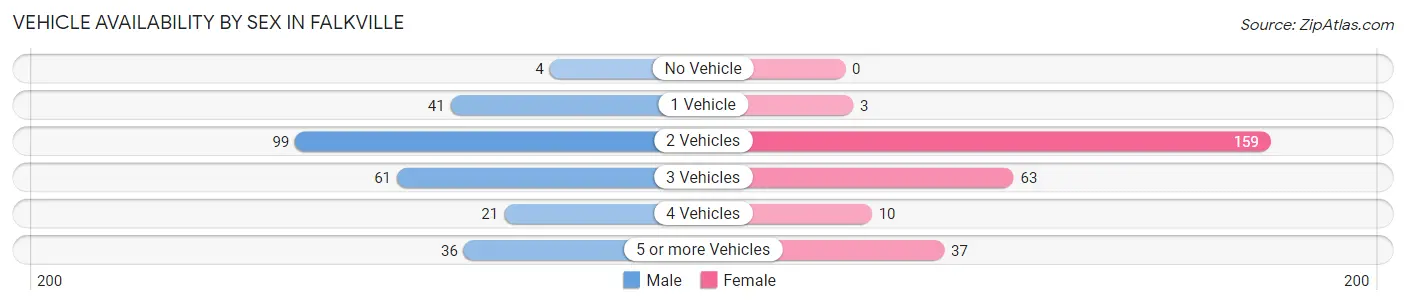
| Vehicles Available | Male | Female |
| No Vehicle | 4 (1.5%) | 0 (0.0%) |
| 1 Vehicle | 41 (15.7%) | 3 (1.1%) |
| 2 Vehicles | 99 (37.8%) | 159 (58.5%) |
| 3 Vehicles | 61 (23.3%) | 63 (23.2%) |
| 4 Vehicles | 21 (8.0%) | 10 (3.7%) |
| 5 or more Vehicles | 36 (13.7%) | 37 (13.6%) |
| Total | 262 (100.0%) | 272 (100.0%) |
Commute Time in Falkville
The most frequently occuring commute durations in Falkville are 20 to 24 minutes (125 commuters, 23.7%), 30 to 34 minutes (73 commuters, 13.8%), and 15 to 19 minutes (67 commuters, 12.7%).
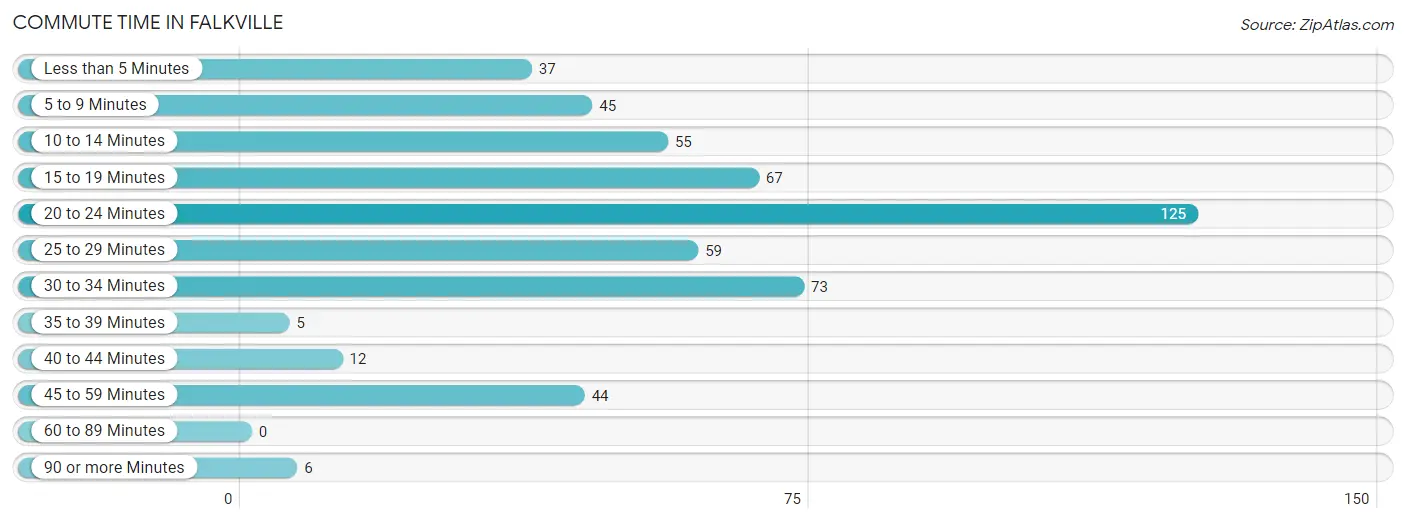
| Commute Time | # Commuters | % Commuters |
| Less than 5 Minutes | 37 | 7.0% |
| 5 to 9 Minutes | 45 | 8.5% |
| 10 to 14 Minutes | 55 | 10.4% |
| 15 to 19 Minutes | 67 | 12.7% |
| 20 to 24 Minutes | 125 | 23.7% |
| 25 to 29 Minutes | 59 | 11.2% |
| 30 to 34 Minutes | 73 | 13.8% |
| 35 to 39 Minutes | 5 | 0.9% |
| 40 to 44 Minutes | 12 | 2.3% |
| 45 to 59 Minutes | 44 | 8.3% |
| 60 to 89 Minutes | 0 | 0.0% |
| 90 or more Minutes | 6 | 1.1% |
Commute Time by Sex in Falkville
The most common commute times in Falkville are 30 to 34 minutes (47 commuters, 17.9%) for males and 20 to 24 minutes (90 commuters, 33.8%) for females.
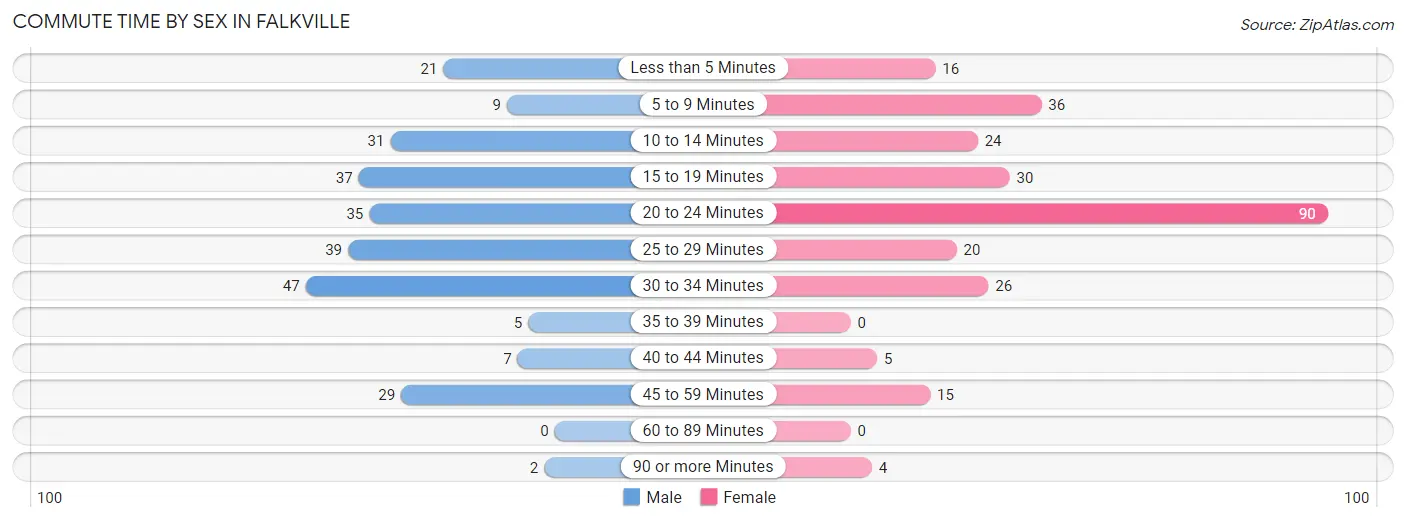
| Commute Time | Male | Female |
| Less than 5 Minutes | 21 (8.0%) | 16 (6.0%) |
| 5 to 9 Minutes | 9 (3.4%) | 36 (13.5%) |
| 10 to 14 Minutes | 31 (11.8%) | 24 (9.0%) |
| 15 to 19 Minutes | 37 (14.1%) | 30 (11.3%) |
| 20 to 24 Minutes | 35 (13.4%) | 90 (33.8%) |
| 25 to 29 Minutes | 39 (14.9%) | 20 (7.5%) |
| 30 to 34 Minutes | 47 (17.9%) | 26 (9.8%) |
| 35 to 39 Minutes | 5 (1.9%) | 0 (0.0%) |
| 40 to 44 Minutes | 7 (2.7%) | 5 (1.9%) |
| 45 to 59 Minutes | 29 (11.1%) | 15 (5.6%) |
| 60 to 89 Minutes | 0 (0.0%) | 0 (0.0%) |
| 90 or more Minutes | 2 (0.8%) | 4 (1.5%) |
Time of Departure to Work by Sex in Falkville
The most frequent times of departure to work in Falkville are 12:00 AM to 4:59 AM (38, 14.5%) for males and 12:00 AM to 4:59 AM (76, 28.6%) for females.
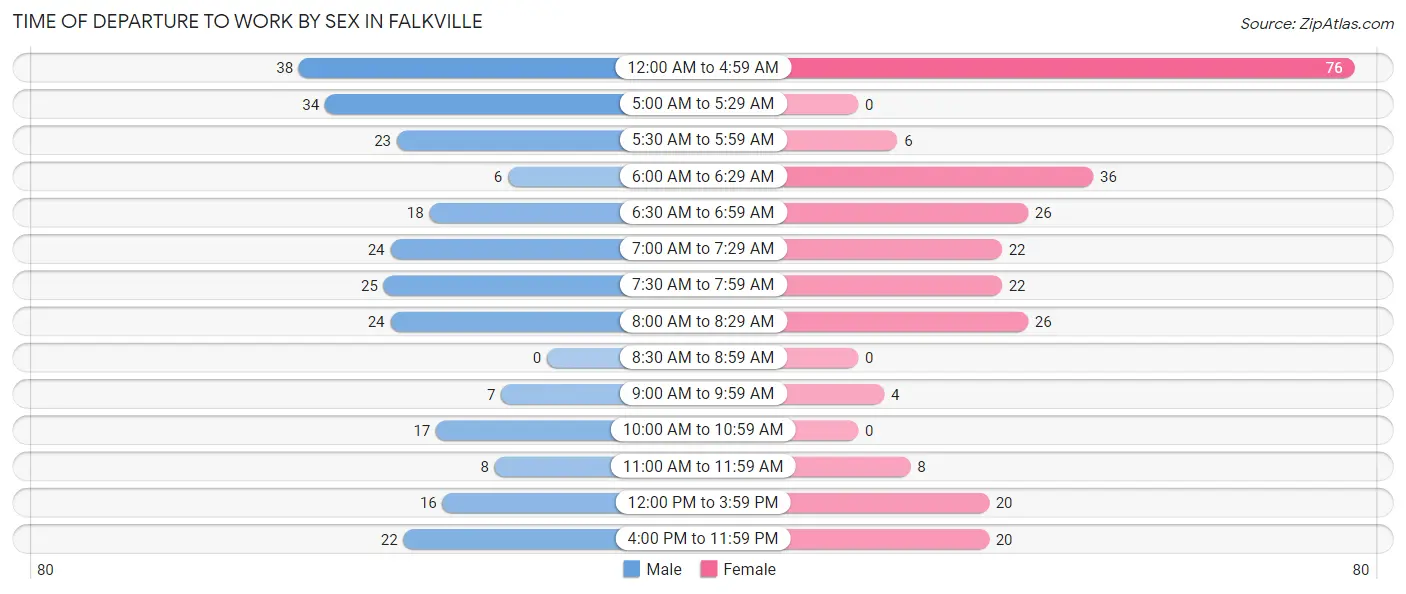
| Time of Departure | Male | Female |
| 12:00 AM to 4:59 AM | 38 (14.5%) | 76 (28.6%) |
| 5:00 AM to 5:29 AM | 34 (13.0%) | 0 (0.0%) |
| 5:30 AM to 5:59 AM | 23 (8.8%) | 6 (2.3%) |
| 6:00 AM to 6:29 AM | 6 (2.3%) | 36 (13.5%) |
| 6:30 AM to 6:59 AM | 18 (6.9%) | 26 (9.8%) |
| 7:00 AM to 7:29 AM | 24 (9.2%) | 22 (8.3%) |
| 7:30 AM to 7:59 AM | 25 (9.5%) | 22 (8.3%) |
| 8:00 AM to 8:29 AM | 24 (9.2%) | 26 (9.8%) |
| 8:30 AM to 8:59 AM | 0 (0.0%) | 0 (0.0%) |
| 9:00 AM to 9:59 AM | 7 (2.7%) | 4 (1.5%) |
| 10:00 AM to 10:59 AM | 17 (6.5%) | 0 (0.0%) |
| 11:00 AM to 11:59 AM | 8 (3.0%) | 8 (3.0%) |
| 12:00 PM to 3:59 PM | 16 (6.1%) | 20 (7.5%) |
| 4:00 PM to 11:59 PM | 22 (8.4%) | 20 (7.5%) |
| Total | 262 (100.0%) | 266 (100.0%) |
Housing Occupancy in Falkville
Occupancy by Ownership in Falkville
Of the total 423 dwellings in Falkville, owner-occupied units account for 352 (83.2%), while renter-occupied units make up 71 (16.8%).
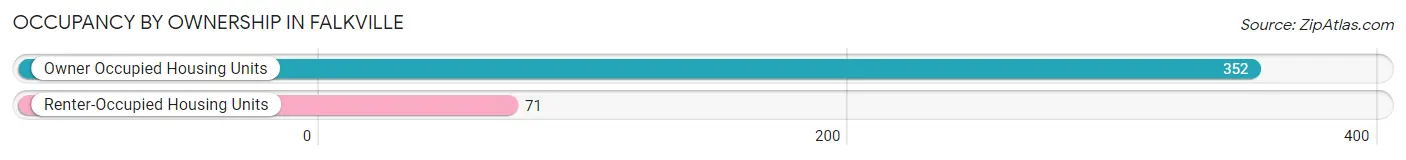
| Occupancy | # Housing Units | % Housing Units |
| Owner Occupied Housing Units | 352 | 83.2% |
| Renter-Occupied Housing Units | 71 | 16.8% |
| Total Occupied Housing Units | 423 | 100.0% |
Occupancy by Household Size in Falkville
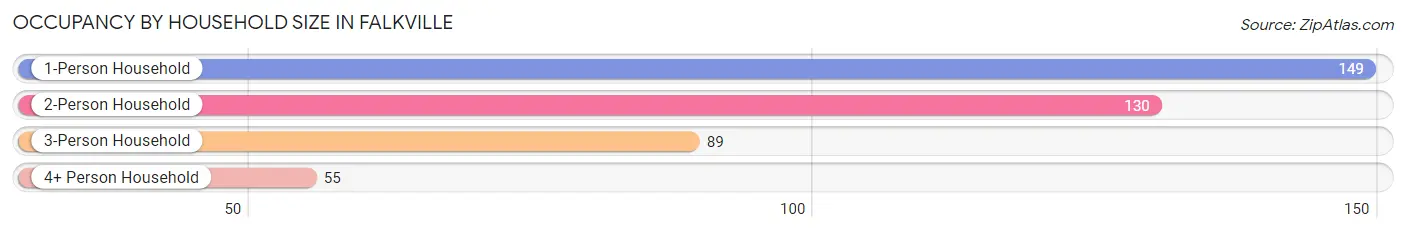
| Household Size | # Housing Units | % Housing Units |
| 1-Person Household | 149 | 35.2% |
| 2-Person Household | 130 | 30.7% |
| 3-Person Household | 89 | 21.0% |
| 4+ Person Household | 55 | 13.0% |
| Total Housing Units | 423 | 100.0% |
Occupancy by Ownership by Household Size in Falkville
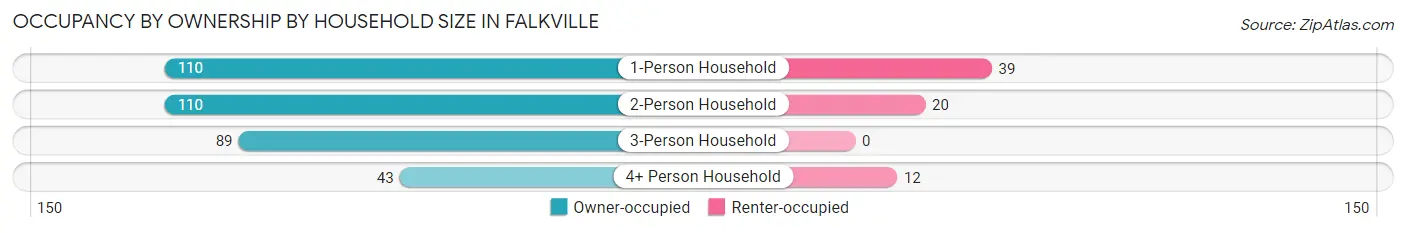
| Household Size | Owner-occupied | Renter-occupied |
| 1-Person Household | 110 (73.8%) | 39 (26.2%) |
| 2-Person Household | 110 (84.6%) | 20 (15.4%) |
| 3-Person Household | 89 (100.0%) | 0 (0.0%) |
| 4+ Person Household | 43 (78.2%) | 12 (21.8%) |
| Total Housing Units | 352 (83.2%) | 71 (16.8%) |
Occupancy by Educational Attainment in Falkville
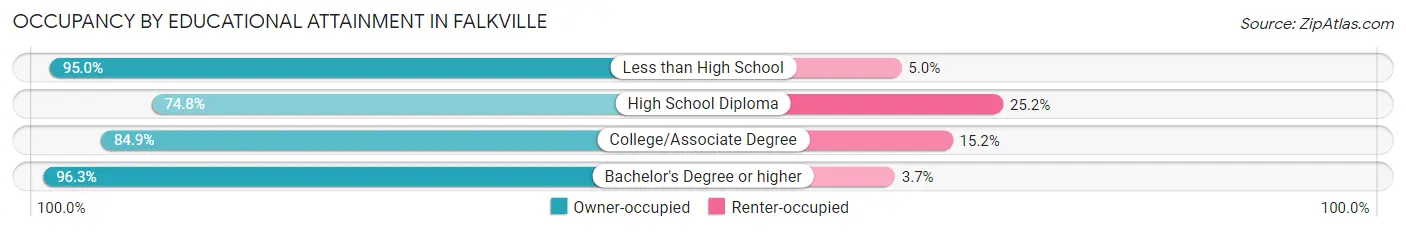
| Household Size | Owner-occupied | Renter-occupied |
| Less than High School | 19 (95.0%) | 1 (5.0%) |
| High School Diploma | 113 (74.8%) | 38 (25.2%) |
| College/Associate Degree | 168 (84.9%) | 30 (15.1%) |
| Bachelor's Degree or higher | 52 (96.3%) | 2 (3.7%) |
Occupancy by Age of Householder in Falkville
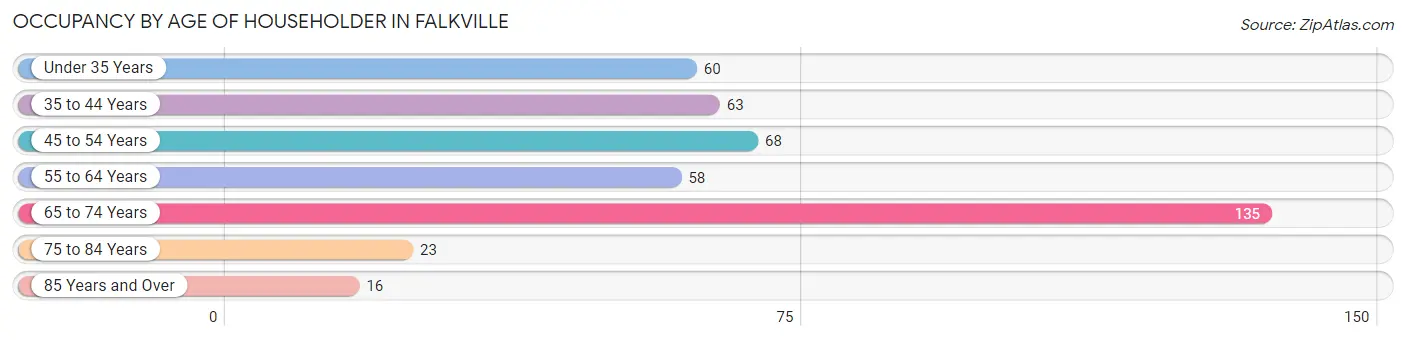
| Age Bracket | # Households | % Households |
| Under 35 Years | 60 | 14.2% |
| 35 to 44 Years | 63 | 14.9% |
| 45 to 54 Years | 68 | 16.1% |
| 55 to 64 Years | 58 | 13.7% |
| 65 to 74 Years | 135 | 31.9% |
| 75 to 84 Years | 23 | 5.4% |
| 85 Years and Over | 16 | 3.8% |
| Total | 423 | 100.0% |
Housing Finances in Falkville
Median Income by Occupancy in Falkville
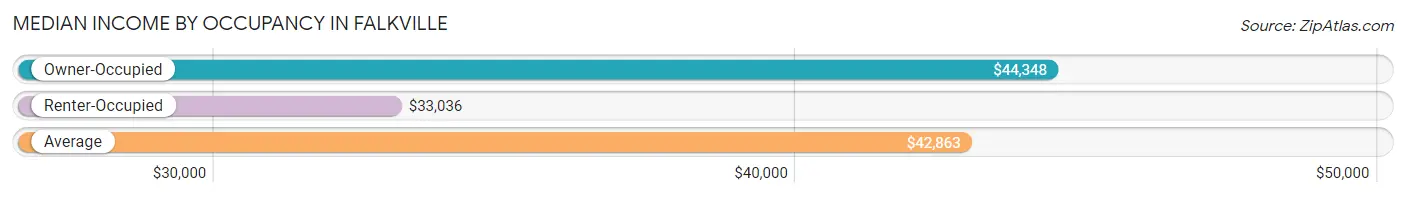
| Occupancy Type | # Households | Median Income |
| Owner-Occupied | 352 (83.2%) | $44,348 |
| Renter-Occupied | 71 (16.8%) | $33,036 |
| Average | 423 (100.0%) | $42,863 |
Occupancy by Householder Income Bracket in Falkville
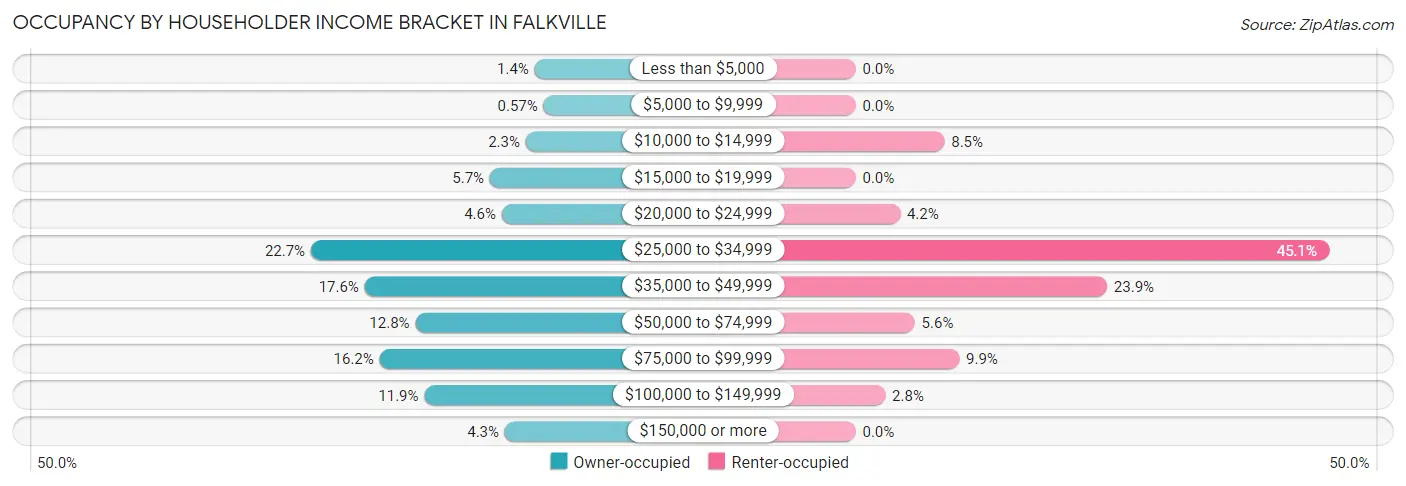
| Income Bracket | Owner-occupied | Renter-occupied |
| Less than $5,000 | 5 (1.4%) | 0 (0.0%) |
| $5,000 to $9,999 | 2 (0.6%) | 0 (0.0%) |
| $10,000 to $14,999 | 8 (2.3%) | 6 (8.5%) |
| $15,000 to $19,999 | 20 (5.7%) | 0 (0.0%) |
| $20,000 to $24,999 | 16 (4.5%) | 3 (4.2%) |
| $25,000 to $34,999 | 80 (22.7%) | 32 (45.1%) |
| $35,000 to $49,999 | 62 (17.6%) | 17 (23.9%) |
| $50,000 to $74,999 | 45 (12.8%) | 4 (5.6%) |
| $75,000 to $99,999 | 57 (16.2%) | 7 (9.9%) |
| $100,000 to $149,999 | 42 (11.9%) | 2 (2.8%) |
| $150,000 or more | 15 (4.3%) | 0 (0.0%) |
| Total | 352 (100.0%) | 71 (100.0%) |
Monthly Housing Cost Tiers in Falkville
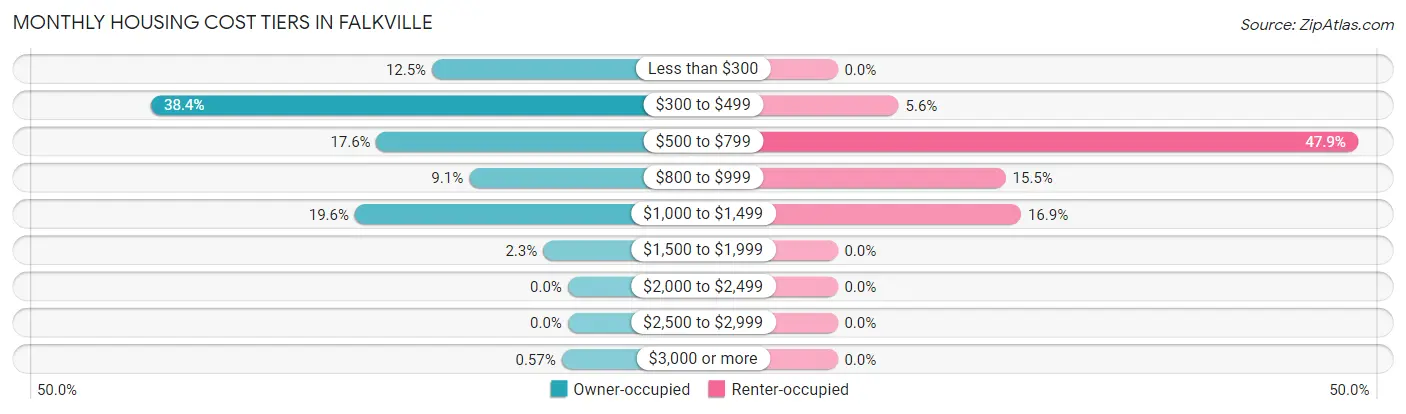
| Monthly Cost | Owner-occupied | Renter-occupied |
| Less than $300 | 44 (12.5%) | 0 (0.0%) |
| $300 to $499 | 135 (38.4%) | 4 (5.6%) |
| $500 to $799 | 62 (17.6%) | 34 (47.9%) |
| $800 to $999 | 32 (9.1%) | 11 (15.5%) |
| $1,000 to $1,499 | 69 (19.6%) | 12 (16.9%) |
| $1,500 to $1,999 | 8 (2.3%) | 0 (0.0%) |
| $2,000 to $2,499 | 0 (0.0%) | 0 (0.0%) |
| $2,500 to $2,999 | 0 (0.0%) | 0 (0.0%) |
| $3,000 or more | 2 (0.6%) | 0 (0.0%) |
| Total | 352 (100.0%) | 71 (100.0%) |
Physical Housing Characteristics in Falkville
Housing Structures in Falkville
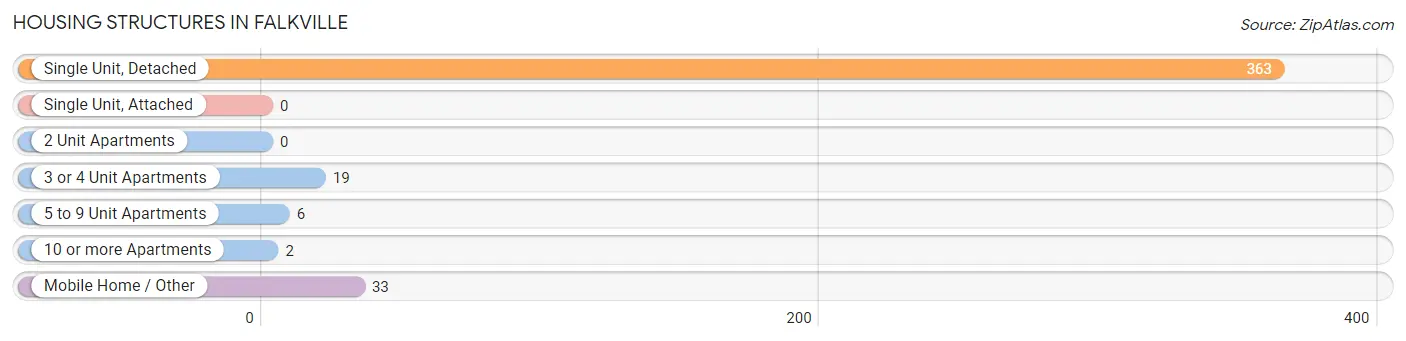
| Structure Type | # Housing Units | % Housing Units |
| Single Unit, Detached | 363 | 85.8% |
| Single Unit, Attached | 0 | 0.0% |
| 2 Unit Apartments | 0 | 0.0% |
| 3 or 4 Unit Apartments | 19 | 4.5% |
| 5 to 9 Unit Apartments | 6 | 1.4% |
| 10 or more Apartments | 2 | 0.5% |
| Mobile Home / Other | 33 | 7.8% |
| Total | 423 | 100.0% |
Housing Structures by Occupancy in Falkville
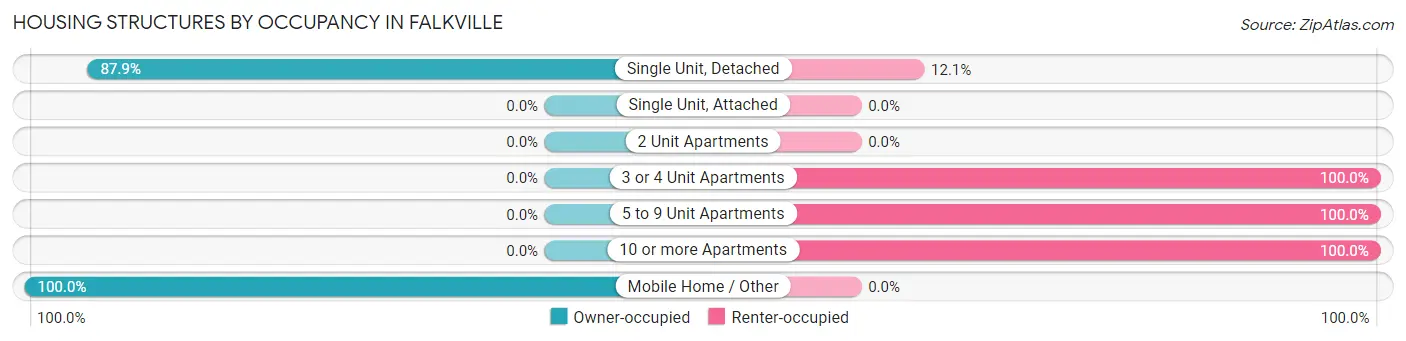
| Structure Type | Owner-occupied | Renter-occupied |
| Single Unit, Detached | 319 (87.9%) | 44 (12.1%) |
| Single Unit, Attached | 0 (0.0%) | 0 (0.0%) |
| 2 Unit Apartments | 0 (0.0%) | 0 (0.0%) |
| 3 or 4 Unit Apartments | 0 (0.0%) | 19 (100.0%) |
| 5 to 9 Unit Apartments | 0 (0.0%) | 6 (100.0%) |
| 10 or more Apartments | 0 (0.0%) | 2 (100.0%) |
| Mobile Home / Other | 33 (100.0%) | 0 (0.0%) |
| Total | 352 (83.2%) | 71 (16.8%) |
Housing Structures by Number of Rooms in Falkville
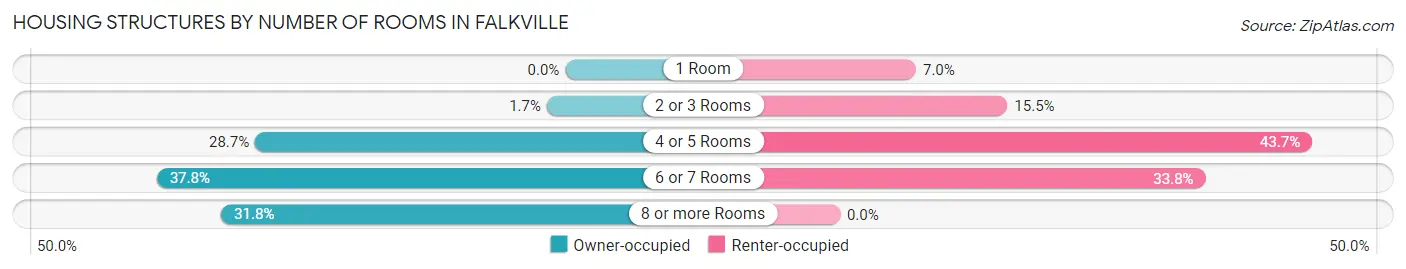
| Number of Rooms | Owner-occupied | Renter-occupied |
| 1 Room | 0 (0.0%) | 5 (7.0%) |
| 2 or 3 Rooms | 6 (1.7%) | 11 (15.5%) |
| 4 or 5 Rooms | 101 (28.7%) | 31 (43.7%) |
| 6 or 7 Rooms | 133 (37.8%) | 24 (33.8%) |
| 8 or more Rooms | 112 (31.8%) | 0 (0.0%) |
| Total | 352 (100.0%) | 71 (100.0%) |
Housing Structure by Heating Type in Falkville
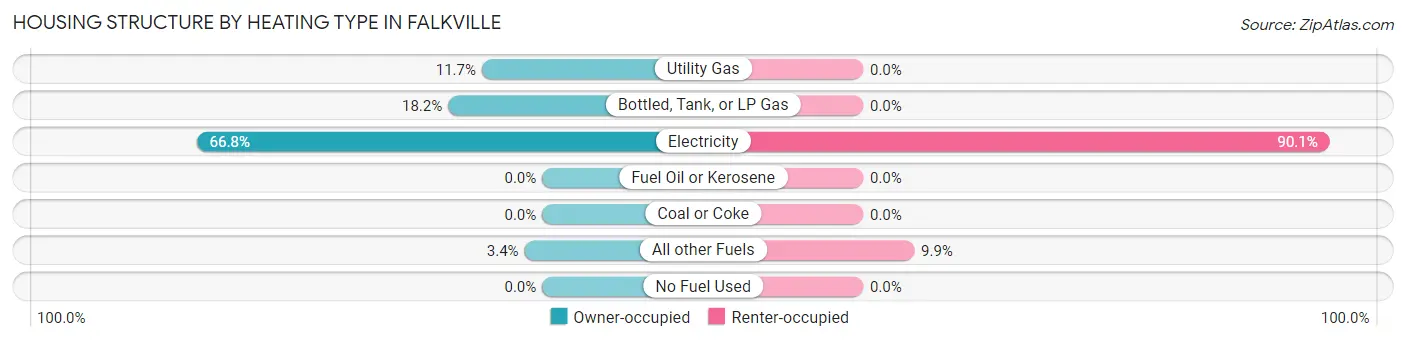
| Heating Type | Owner-occupied | Renter-occupied |
| Utility Gas | 41 (11.7%) | 0 (0.0%) |
| Bottled, Tank, or LP Gas | 64 (18.2%) | 0 (0.0%) |
| Electricity | 235 (66.8%) | 64 (90.1%) |
| Fuel Oil or Kerosene | 0 (0.0%) | 0 (0.0%) |
| Coal or Coke | 0 (0.0%) | 0 (0.0%) |
| All other Fuels | 12 (3.4%) | 7 (9.9%) |
| No Fuel Used | 0 (0.0%) | 0 (0.0%) |
| Total | 352 (100.0%) | 71 (100.0%) |
Household Vehicle Usage in Falkville
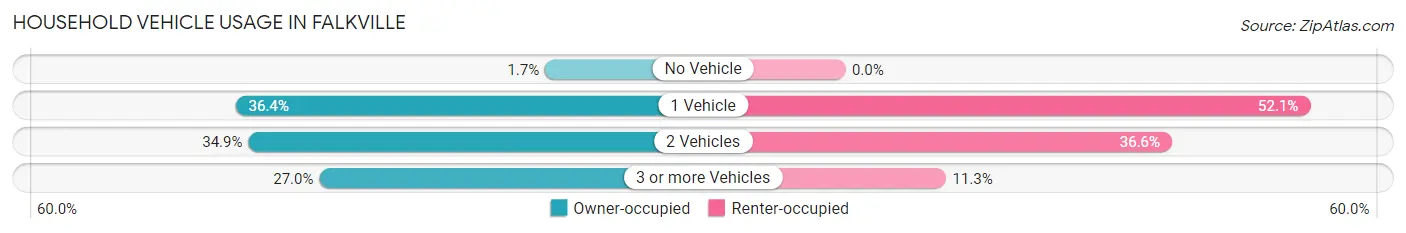
| Vehicles per Household | Owner-occupied | Renter-occupied |
| No Vehicle | 6 (1.7%) | 0 (0.0%) |
| 1 Vehicle | 128 (36.4%) | 37 (52.1%) |
| 2 Vehicles | 123 (34.9%) | 26 (36.6%) |
| 3 or more Vehicles | 95 (27.0%) | 8 (11.3%) |
| Total | 352 (100.0%) | 71 (100.0%) |
Real Estate & Mortgages in Falkville
Real Estate and Mortgage Overview in Falkville
| Characteristic | Without Mortgage | With Mortgage |
| Housing Units | 232 | 120 |
| Median Property Value | $105,500 | $132,200 |
| Median Household Income | $35,000 | $5 |
| Monthly Housing Costs | $341 | $0 |
| Real Estate Taxes | $436 | $17 |
Property Value by Mortgage Status in Falkville
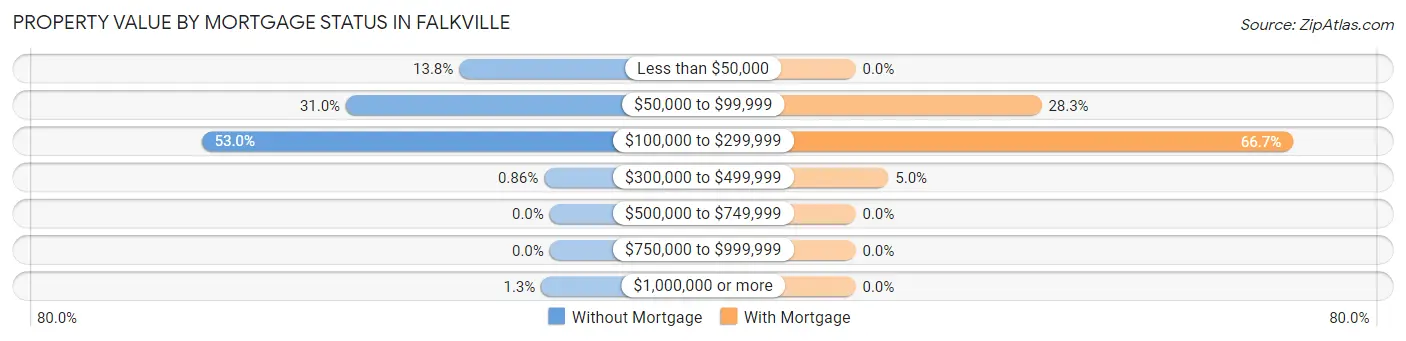
| Property Value | Without Mortgage | With Mortgage |
| Less than $50,000 | 32 (13.8%) | 0 (0.0%) |
| $50,000 to $99,999 | 72 (31.0%) | 34 (28.3%) |
| $100,000 to $299,999 | 123 (53.0%) | 80 (66.7%) |
| $300,000 to $499,999 | 2 (0.9%) | 6 (5.0%) |
| $500,000 to $749,999 | 0 (0.0%) | 0 (0.0%) |
| $750,000 to $999,999 | 0 (0.0%) | 0 (0.0%) |
| $1,000,000 or more | 3 (1.3%) | 0 (0.0%) |
| Total | 232 (100.0%) | 120 (100.0%) |
Household Income by Mortgage Status in Falkville
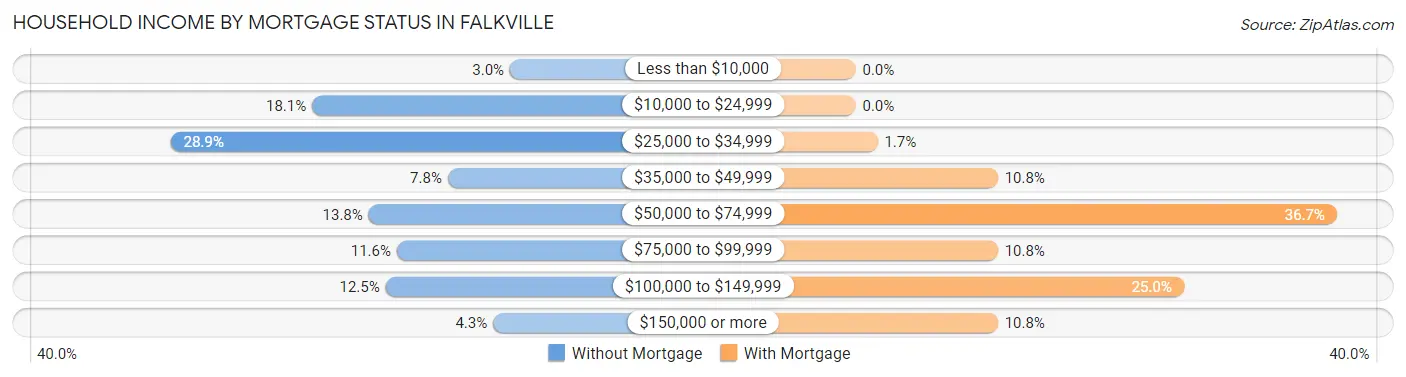
| Household Income | Without Mortgage | With Mortgage |
| Less than $10,000 | 7 (3.0%) | 0 (0.0%) |
| $10,000 to $24,999 | 42 (18.1%) | 0 (0.0%) |
| $25,000 to $34,999 | 67 (28.9%) | 2 (1.7%) |
| $35,000 to $49,999 | 18 (7.8%) | 13 (10.8%) |
| $50,000 to $74,999 | 32 (13.8%) | 44 (36.7%) |
| $75,000 to $99,999 | 27 (11.6%) | 13 (10.8%) |
| $100,000 to $149,999 | 29 (12.5%) | 30 (25.0%) |
| $150,000 or more | 10 (4.3%) | 13 (10.8%) |
| Total | 232 (100.0%) | 120 (100.0%) |
Property Value to Household Income Ratio in Falkville
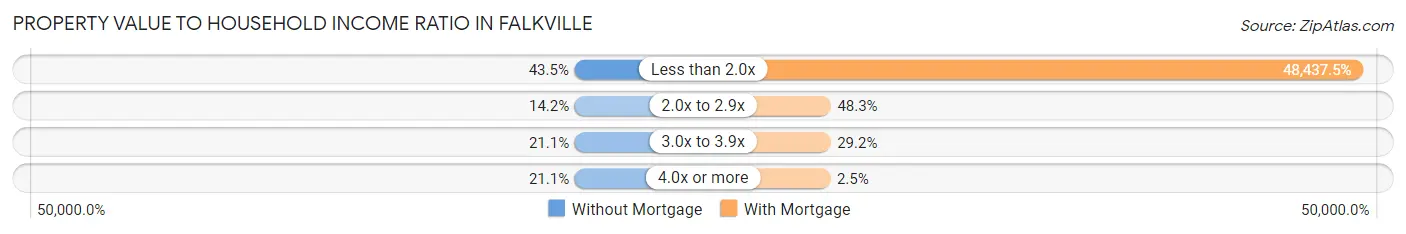
| Value-to-Income Ratio | Without Mortgage | With Mortgage |
| Less than 2.0x | 101 (43.5%) | 58,125 (48,437.5%) |
| 2.0x to 2.9x | 33 (14.2%) | 58 (48.3%) |
| 3.0x to 3.9x | 49 (21.1%) | 35 (29.2%) |
| 4.0x or more | 49 (21.1%) | 3 (2.5%) |
| Total | 232 (100.0%) | 120 (100.0%) |
Real Estate Taxes by Mortgage Status in Falkville
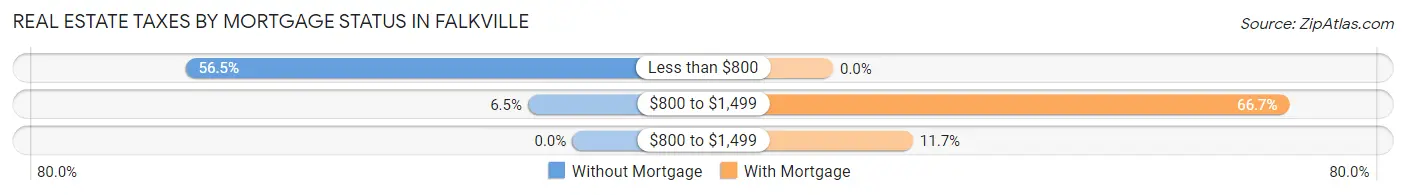
| Property Taxes | Without Mortgage | With Mortgage |
| Less than $800 | 131 (56.5%) | 0 (0.0%) |
| $800 to $1,499 | 15 (6.5%) | 80 (66.7%) |
| $800 to $1,499 | 0 (0.0%) | 14 (11.7%) |
| Total | 232 (100.0%) | 120 (100.0%) |
Health & Disability in Falkville
Health Insurance Coverage by Age in Falkville
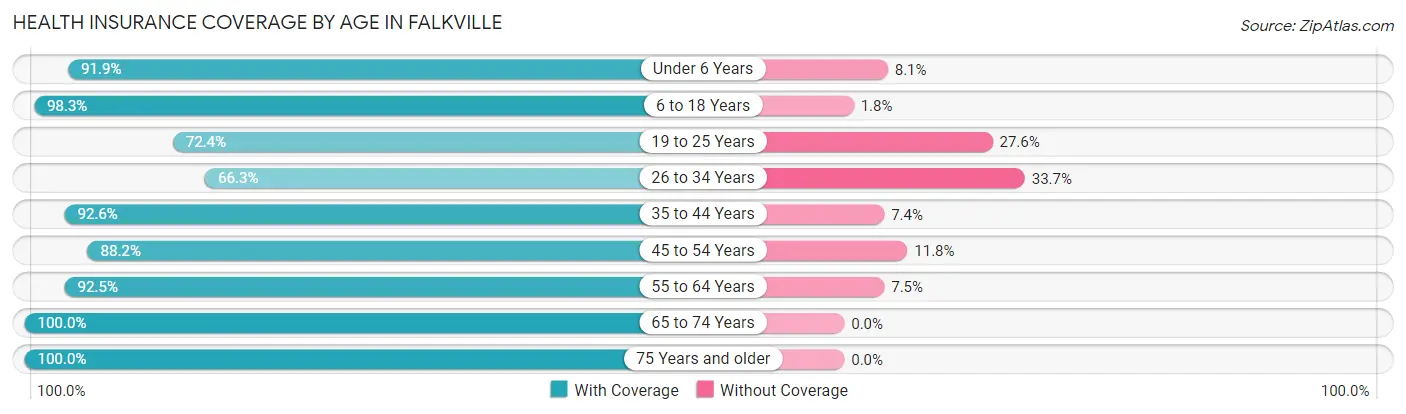
| Age Bracket | With Coverage | Without Coverage |
| Under 6 Years | 68 (91.9%) | 6 (8.1%) |
| 6 to 18 Years | 112 (98.3%) | 2 (1.8%) |
| 19 to 25 Years | 89 (72.4%) | 34 (27.6%) |
| 26 to 34 Years | 67 (66.3%) | 34 (33.7%) |
| 35 to 44 Years | 112 (92.6%) | 9 (7.4%) |
| 45 to 54 Years | 90 (88.2%) | 12 (11.8%) |
| 55 to 64 Years | 124 (92.5%) | 10 (7.5%) |
| 65 to 74 Years | 236 (100.0%) | 0 (0.0%) |
| 75 Years and older | 52 (100.0%) | 0 (0.0%) |
| Total | 950 (89.9%) | 107 (10.1%) |
Health Insurance Coverage by Citizenship Status in Falkville
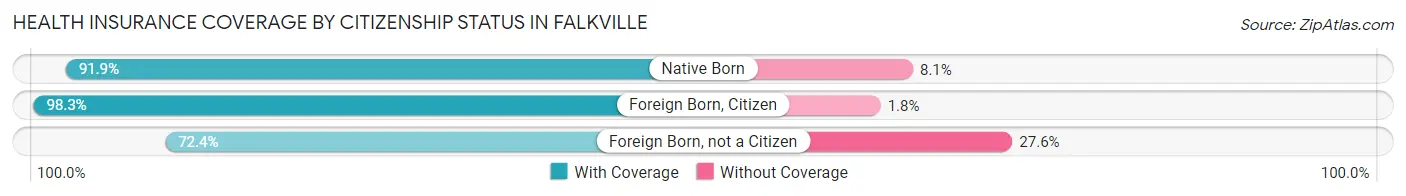
| Citizenship Status | With Coverage | Without Coverage |
| Native Born | 68 (91.9%) | 6 (8.1%) |
| Foreign Born, Citizen | 112 (98.3%) | 2 (1.8%) |
| Foreign Born, not a Citizen | 89 (72.4%) | 34 (27.6%) |
Health Insurance Coverage by Household Income in Falkville
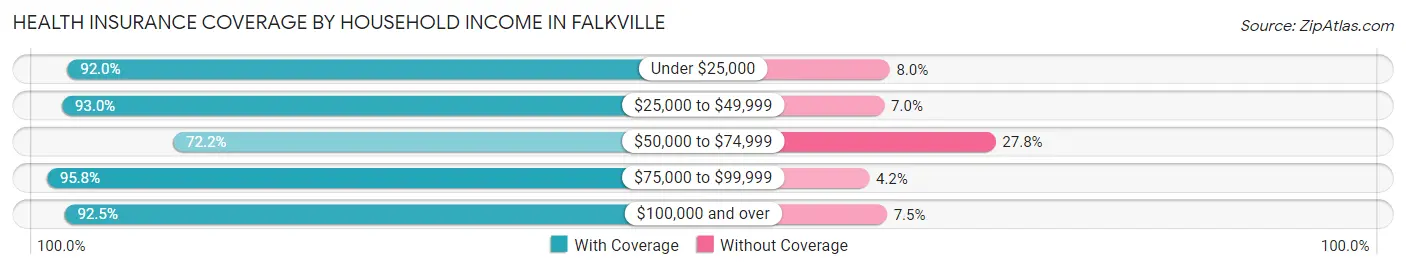
| Household Income | With Coverage | Without Coverage |
| Under $25,000 | 69 (92.0%) | 6 (8.0%) |
| $25,000 to $49,999 | 372 (93.0%) | 28 (7.0%) |
| $50,000 to $74,999 | 127 (72.2%) | 49 (27.8%) |
| $75,000 to $99,999 | 184 (95.8%) | 8 (4.2%) |
| $100,000 and over | 198 (92.5%) | 16 (7.5%) |
Public vs Private Health Insurance Coverage by Age in Falkville
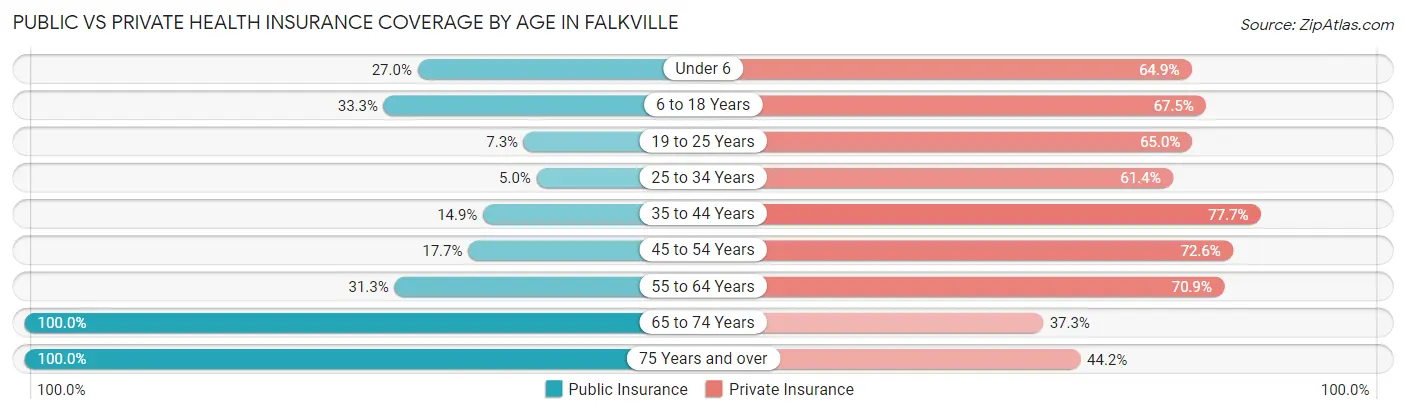
| Age Bracket | Public Insurance | Private Insurance |
| Under 6 | 20 (27.0%) | 48 (64.9%) |
| 6 to 18 Years | 38 (33.3%) | 77 (67.5%) |
| 19 to 25 Years | 9 (7.3%) | 80 (65.0%) |
| 25 to 34 Years | 5 (5.0%) | 62 (61.4%) |
| 35 to 44 Years | 18 (14.9%) | 94 (77.7%) |
| 45 to 54 Years | 18 (17.6%) | 74 (72.6%) |
| 55 to 64 Years | 42 (31.3%) | 95 (70.9%) |
| 65 to 74 Years | 236 (100.0%) | 88 (37.3%) |
| 75 Years and over | 52 (100.0%) | 23 (44.2%) |
| Total | 438 (41.4%) | 641 (60.6%) |
Disability Status by Sex by Age in Falkville
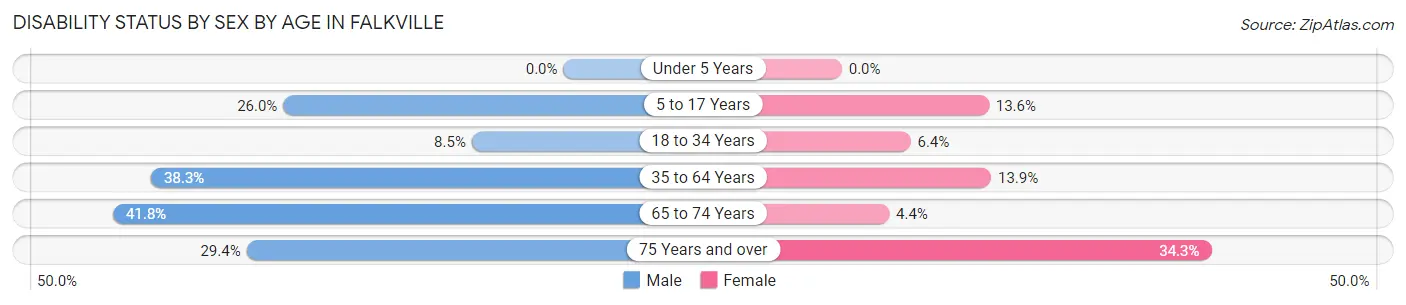
| Age Bracket | Male | Female |
| Under 5 Years | 0 (0.0%) | 0 (0.0%) |
| 5 to 17 Years | 13 (26.0%) | 6 (13.6%) |
| 18 to 34 Years | 13 (8.5%) | 6 (6.4%) |
| 35 to 64 Years | 62 (38.3%) | 27 (13.9%) |
| 65 to 74 Years | 51 (41.8%) | 5 (4.4%) |
| 75 Years and over | 5 (29.4%) | 12 (34.3%) |
Disability Class by Sex by Age in Falkville
Disability Class: Hearing Difficulty
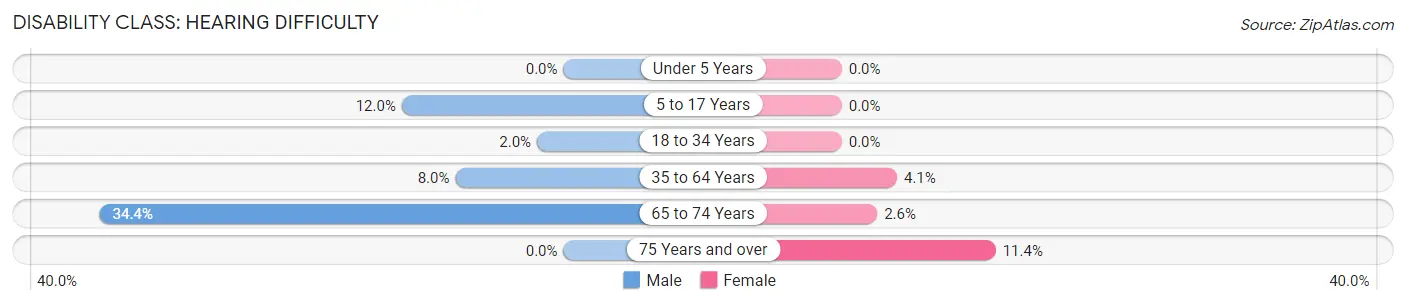
| Age Bracket | Male | Female |
| Under 5 Years | 0 (0.0%) | 0 (0.0%) |
| 5 to 17 Years | 6 (12.0%) | 0 (0.0%) |
| 18 to 34 Years | 3 (2.0%) | 0 (0.0%) |
| 35 to 64 Years | 13 (8.0%) | 8 (4.1%) |
| 65 to 74 Years | 42 (34.4%) | 3 (2.6%) |
| 75 Years and over | 0 (0.0%) | 4 (11.4%) |
Disability Class: Vision Difficulty
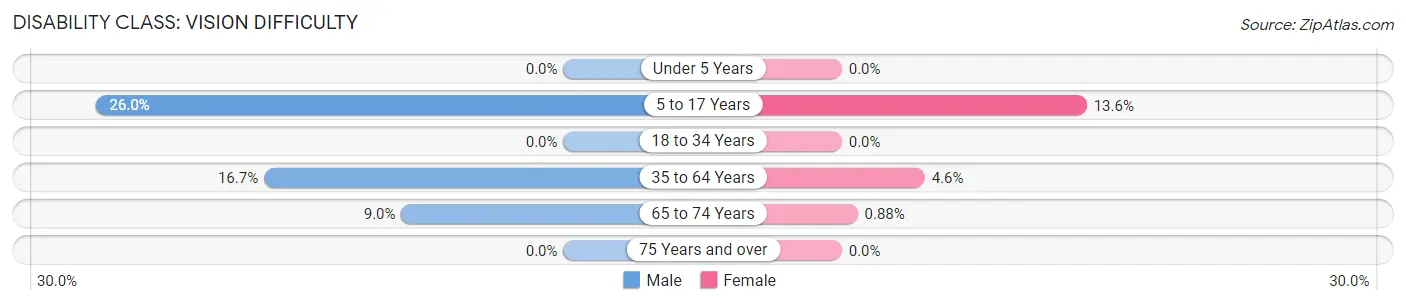
| Age Bracket | Male | Female |
| Under 5 Years | 0 (0.0%) | 0 (0.0%) |
| 5 to 17 Years | 13 (26.0%) | 6 (13.6%) |
| 18 to 34 Years | 0 (0.0%) | 0 (0.0%) |
| 35 to 64 Years | 27 (16.7%) | 9 (4.6%) |
| 65 to 74 Years | 11 (9.0%) | 1 (0.9%) |
| 75 Years and over | 0 (0.0%) | 0 (0.0%) |
Disability Class: Cognitive Difficulty
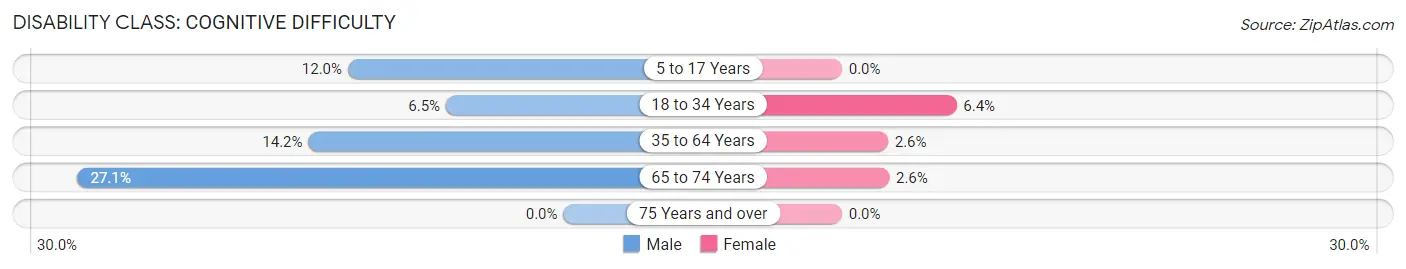
| Age Bracket | Male | Female |
| 5 to 17 Years | 6 (12.0%) | 0 (0.0%) |
| 18 to 34 Years | 10 (6.5%) | 6 (6.4%) |
| 35 to 64 Years | 23 (14.2%) | 5 (2.6%) |
| 65 to 74 Years | 33 (27.1%) | 3 (2.6%) |
| 75 Years and over | 0 (0.0%) | 0 (0.0%) |
Disability Class: Ambulatory Difficulty
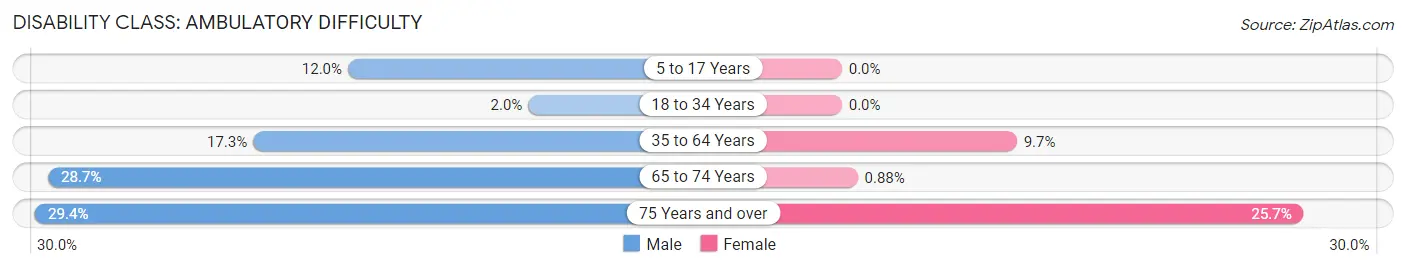
| Age Bracket | Male | Female |
| 5 to 17 Years | 6 (12.0%) | 0 (0.0%) |
| 18 to 34 Years | 3 (2.0%) | 0 (0.0%) |
| 35 to 64 Years | 28 (17.3%) | 19 (9.7%) |
| 65 to 74 Years | 35 (28.7%) | 1 (0.9%) |
| 75 Years and over | 5 (29.4%) | 9 (25.7%) |
Disability Class: Self-Care Difficulty
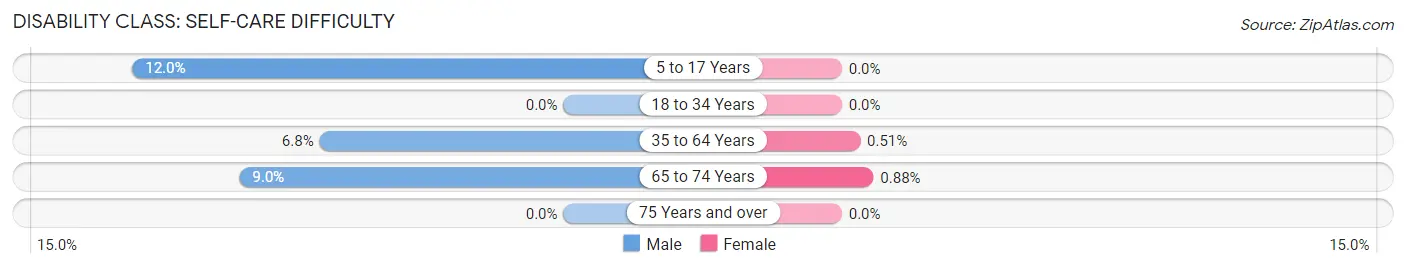
| Age Bracket | Male | Female |
| 5 to 17 Years | 6 (12.0%) | 0 (0.0%) |
| 18 to 34 Years | 0 (0.0%) | 0 (0.0%) |
| 35 to 64 Years | 11 (6.8%) | 1 (0.5%) |
| 65 to 74 Years | 11 (9.0%) | 1 (0.9%) |
| 75 Years and over | 0 (0.0%) | 0 (0.0%) |
Technology Access in Falkville
Computing Device Access in Falkville
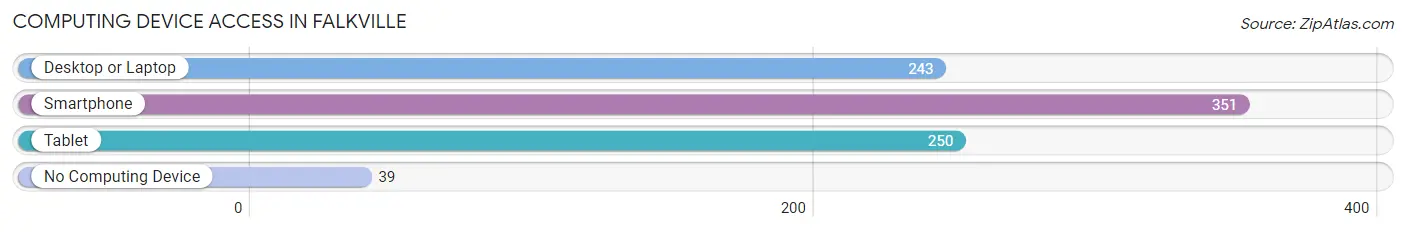
| Device Type | # Households | % Households |
| Desktop or Laptop | 243 | 57.5% |
| Smartphone | 351 | 83.0% |
| Tablet | 250 | 59.1% |
| No Computing Device | 39 | 9.2% |
| Total | 423 | 100.0% |
Internet Access in Falkville
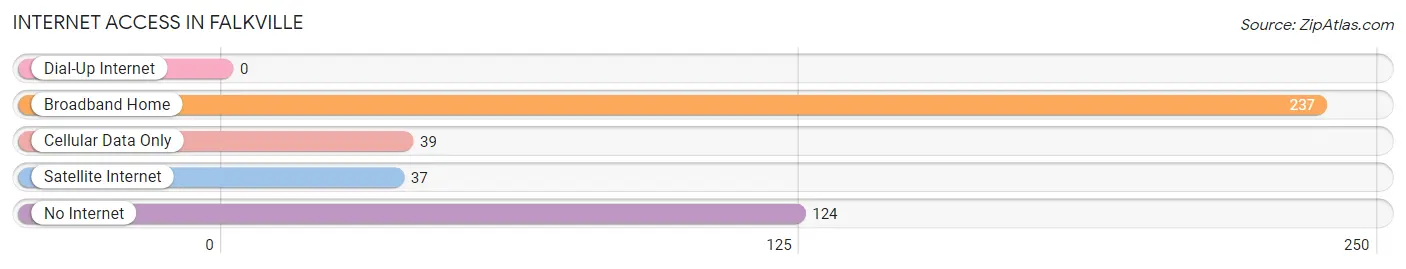
| Internet Type | # Households | % Households |
| Dial-Up Internet | 0 | 0.0% |
| Broadband Home | 237 | 56.0% |
| Cellular Data Only | 39 | 9.2% |
| Satellite Internet | 37 | 8.7% |
| No Internet | 124 | 29.3% |
| Total | 423 | 100.0% |
Falkville Summary
Falkville is a small town located in Morgan County, Alabama. It is situated in the northern part of the state, about 20 miles south of Huntsville. The town was founded in 1872 and has a population of approximately 1,500 people.
History
Falkville was founded in 1872 by a group of settlers from Germany. The town was named after one of the settlers, John Falk. The settlers were attracted to the area due to its fertile soil and abundant natural resources. The town quickly grew and by the early 1900s, it had become a thriving agricultural community.
In the early 1900s, Falkville was home to several businesses, including a cotton gin, a grist mill, a sawmill, and a blacksmith shop. The town also had a post office, a bank, and a hotel.
In the 1920s, the town began to experience a decline in population due to the Great Depression. However, the town was able to survive and by the 1950s, it had become a popular tourist destination. The town was home to several attractions, including a golf course, a swimming pool, and a movie theater.
Geography
Falkville is located in the northern part of Morgan County, Alabama. It is situated in the foothills of the Appalachian Mountains and is surrounded by rolling hills and forests. The town is located about 20 miles south of Huntsville and is accessible via Interstate 65.
The town has a total area of 1.3 square miles, all of which is land. The town is located at an elevation of 845 feet above sea level.
Economy
Falkville’s economy is largely based on agriculture. The town is home to several farms, which produce a variety of crops, including corn, soybeans, and cotton. The town is also home to several businesses, including a grocery store, a hardware store, and a restaurant.
Demographics
As of the 2010 census, Falkville had a population of 1,521 people. The racial makeup of the town was 97.3% White, 0.7% African American, 0.2% Native American, 0.2% Asian, 0.2% from other races, and 1.6% from two or more races. Hispanic or Latino of any race were 1.2% of the population.
The median income for a household in the town was $37,500, and the median income for a family was $45,000. The per capita income for the town was $18,945. About 11.2% of families and 14.2% of the population were below the poverty line, including 18.2% of those under age 18 and 8.3% of those age 65 or over.
Conclusion
Falkville is a small town located in Morgan County, Alabama. It was founded in 1872 by a group of settlers from Germany and has a population of approximately 1,500 people. The town’s economy is largely based on agriculture and it is home to several businesses. The town has a total area of 1.3 square miles and the racial makeup of the town is 97.3% White, 0.7% African American, 0.2% Native American, 0.2% Asian, 0.2% from other races, and 1.6% from two or more races. The median income for a household in the town was $37,500 and the per capita income for the town was $18,945.
Common Questions
What is Per Capita Income in Falkville?
Per Capita income in Falkville is $22,462.
What is the Median Family Income in Falkville?
Median Family Income in Falkville is $64,375.
What is the Median Household income in Falkville?
Median Household Income in Falkville is $42,863.
What is Income or Wage Gap in Falkville?
Income or Wage Gap in Falkville is 38.4%.
Women in Falkville earn 61.6 cents for every dollar earned by a man.
What is Inequality or Gini Index in Falkville?
Inequality or Gini Index in Falkville is 0.36.
What is the Total Population of Falkville?
Total Population of Falkville is 1,422.
What is the Total Male Population of Falkville?
Total Male Population of Falkville is 685.
What is the Total Female Population of Falkville?
Total Female Population of Falkville is 737.
What is the Ratio of Males per 100 Females in Falkville?
There are 92.94 Males per 100 Females in Falkville.
What is the Ratio of Females per 100 Males in Falkville?
There are 107.59 Females per 100 Males in Falkville.
What is the Median Population Age in Falkville?
Median Population Age in Falkville is 56.5 Years.
What is the Average Family Size in Falkville
Average Family Size in Falkville is 3.2 People.
What is the Average Household Size in Falkville
Average Household Size in Falkville is 2.5 People.
How Large is the Labor Force in Falkville?
There are 561 People in the Labor Forcein in Falkville.
What is the Percentage of People in the Labor Force in Falkville?
43.8% of People are in the Labor Force in Falkville.
What is the Unemployment Rate in Falkville?
Unemployment Rate in Falkville is 4.3%.