Coker, AL Map & Demographics
Coker Map
Coker Overview
$30,540
PER CAPITA INCOME
$83,523
AVG FAMILY INCOME
$54,559
AVG HOUSEHOLD INCOME
15.7%
WAGE / INCOME GAP [ % ]
84.3¢/ $1
WAGE / INCOME GAP [ $ ]
0.44
INEQUALITY / GINI INDEX
1,006
TOTAL POPULATION
508
MALE POPULATION
498
FEMALE POPULATION
102.01
MALES / 100 FEMALES
98.03
FEMALES / 100 MALES
43.4
MEDIAN AGE
3.2
AVG FAMILY SIZE
2.6
AVG HOUSEHOLD SIZE
445
LABOR FORCE [ PEOPLE ]
55.2%
PERCENT IN LABOR FORCE
Coker Zip Codes
Coker Area Codes
Income in Coker
Income Overview in Coker
Per Capita Income in Coker is $30,540, while median incomes of families and households are $83,523 and $54,559 respectively.
| Characteristic | Number | Measure |
| Per Capita Income | 1,006 | $30,540 |
| Median Family Income | 269 | $83,523 |
| Mean Family Income | 269 | $92,734 |
| Median Household Income | 386 | $54,559 |
| Mean Household Income | 386 | $75,299 |
| Income Deficit | 269 | $0 |
| Wage / Income Gap (%) | 1,006 | 15.67% |
| Wage / Income Gap ($) | 1,006 | 84.33¢ per $1 |
| Gini / Inequality Index | 1,006 | 0.44 |
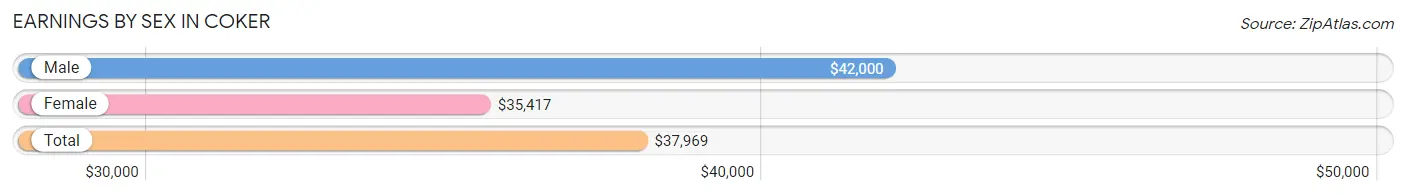
Earnings by Sex in Coker
Average Earnings in Coker are $37,969, $42,000 for men and $35,417 for women, a difference of 15.7%.
| Sex | Number | Average Earnings |
| Male | 290 (58.8%) | $42,000 |
| Female | 203 (41.2%) | $35,417 |
| Total | 493 (100.0%) | $37,969 |
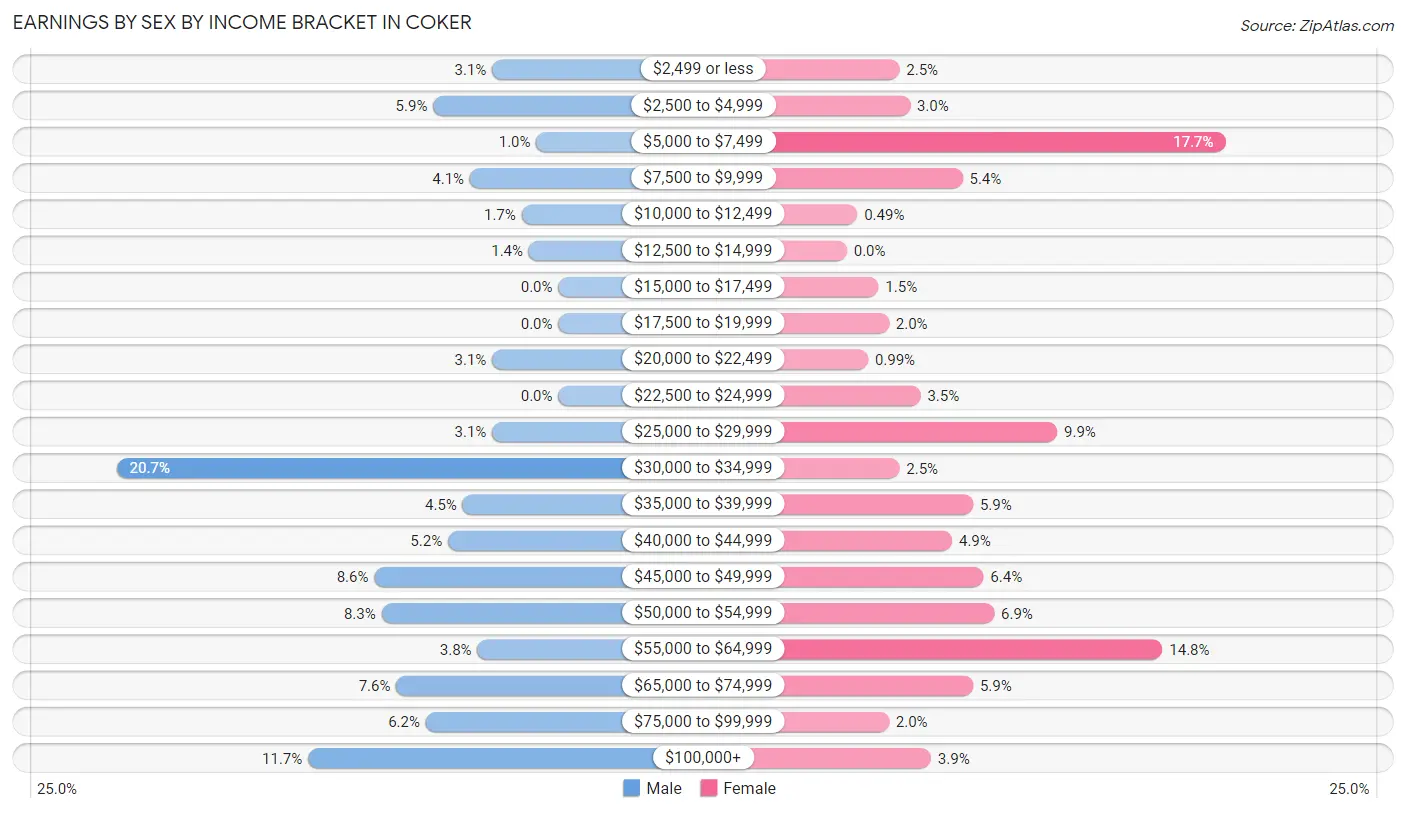
Earnings by Sex by Income Bracket in Coker
The most common earnings brackets in Coker are $30,000 to $34,999 for men (60 | 20.7%) and $5,000 to $7,499 for women (36 | 17.7%).
| Income | Male | Female |
| $2,499 or less | 9 (3.1%) | 5 (2.5%) |
| $2,500 to $4,999 | 17 (5.9%) | 6 (3.0%) |
| $5,000 to $7,499 | 3 (1.0%) | 36 (17.7%) |
| $7,500 to $9,999 | 12 (4.1%) | 11 (5.4%) |
| $10,000 to $12,499 | 5 (1.7%) | 1 (0.5%) |
| $12,500 to $14,999 | 4 (1.4%) | 0 (0.0%) |
| $15,000 to $17,499 | 0 (0.0%) | 3 (1.5%) |
| $17,500 to $19,999 | 0 (0.0%) | 4 (2.0%) |
| $20,000 to $22,499 | 9 (3.1%) | 2 (1.0%) |
| $22,500 to $24,999 | 0 (0.0%) | 7 (3.5%) |
| $25,000 to $29,999 | 9 (3.1%) | 20 (9.9%) |
| $30,000 to $34,999 | 60 (20.7%) | 5 (2.5%) |
| $35,000 to $39,999 | 13 (4.5%) | 12 (5.9%) |
| $40,000 to $44,999 | 15 (5.2%) | 10 (4.9%) |
| $45,000 to $49,999 | 25 (8.6%) | 13 (6.4%) |
| $50,000 to $54,999 | 24 (8.3%) | 14 (6.9%) |
| $55,000 to $64,999 | 11 (3.8%) | 30 (14.8%) |
| $65,000 to $74,999 | 22 (7.6%) | 12 (5.9%) |
| $75,000 to $99,999 | 18 (6.2%) | 4 (2.0%) |
| $100,000+ | 34 (11.7%) | 8 (3.9%) |
| Total | 290 (100.0%) | 203 (100.0%) |
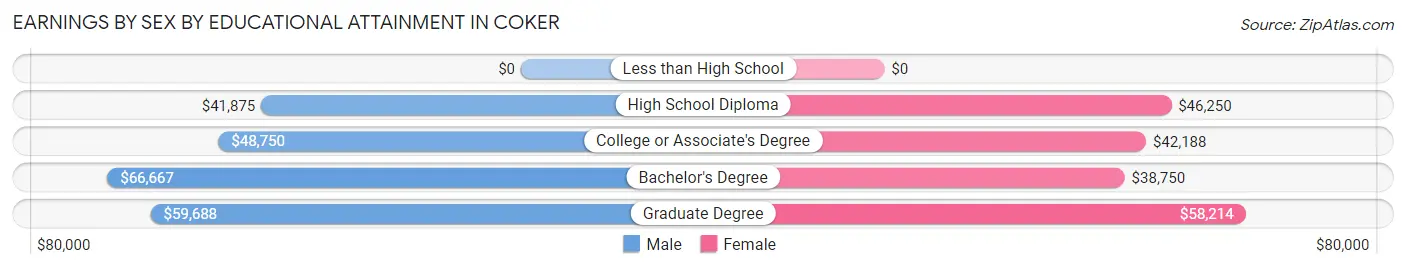
Earnings by Sex by Educational Attainment in Coker
Average earnings in Coker are $47,917 for men and $44,500 for women, a difference of 7.1%. Men with an educational attainment of bachelor's degree enjoy the highest average annual earnings of $66,667, while those with high school diploma education earn the least with $41,875. Women with an educational attainment of graduate degree earn the most with the average annual earnings of $58,214, while those with bachelor's degree education have the smallest earnings of $38,750.
| Educational Attainment | Male Income | Female Income |
| Less than High School | - | - |
| High School Diploma | $41,875 | $46,250 |
| College or Associate's Degree | $48,750 | $42,188 |
| Bachelor's Degree | $66,667 | $38,750 |
| Graduate Degree | $59,688 | $58,214 |
| Total | $47,917 | $44,500 |
Family Income in Coker
Family Income Brackets in Coker
According to the Coker family income data, there are 60 families falling into the $75,000 to $99,999 income range, which is the most common income bracket and makes up 22.3% of all families. Conversely, the $10,000 to $14,999 income bracket is the least frequent group with only 1 families (0.4%) belonging to this category.
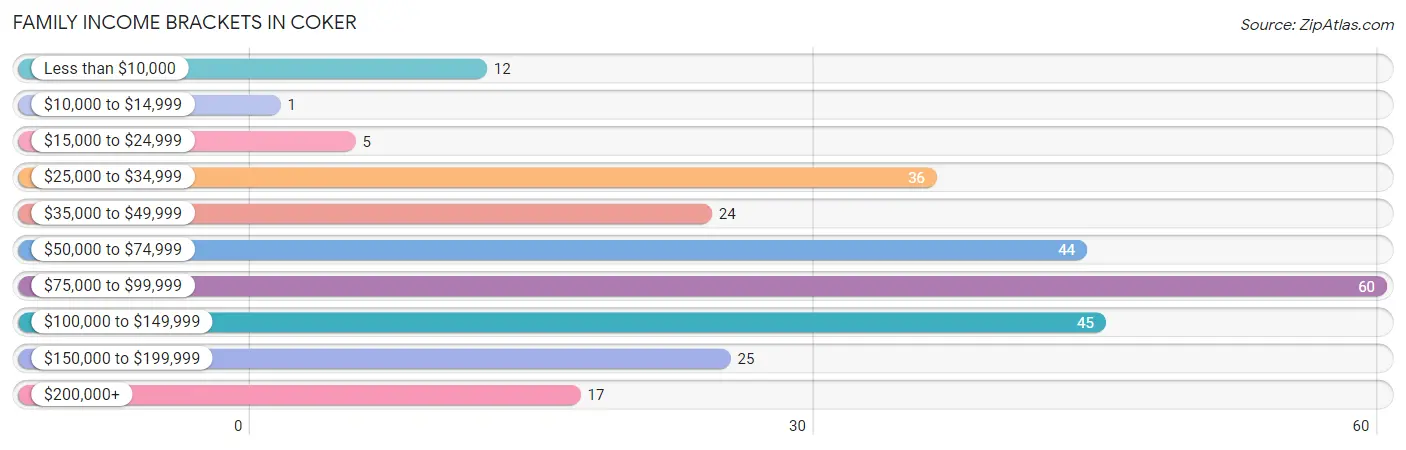
| Income Bracket | # Families | % Families |
| Less than $10,000 | 12 | 4.5% |
| $10,000 to $14,999 | 1 | 0.4% |
| $15,000 to $24,999 | 5 | 1.9% |
| $25,000 to $34,999 | 36 | 13.4% |
| $35,000 to $49,999 | 24 | 8.9% |
| $50,000 to $74,999 | 44 | 16.4% |
| $75,000 to $99,999 | 60 | 22.3% |
| $100,000 to $149,999 | 45 | 16.7% |
| $150,000 to $199,999 | 25 | 9.3% |
| $200,000+ | 17 | 6.3% |
Family Income by Famaliy Size in Coker
5-person families (17 | 6.3%) account for the highest median family income in Coker with $172,708 per family, while 5-person families (17 | 6.3%) have the highest median income of $34,542 per family member.
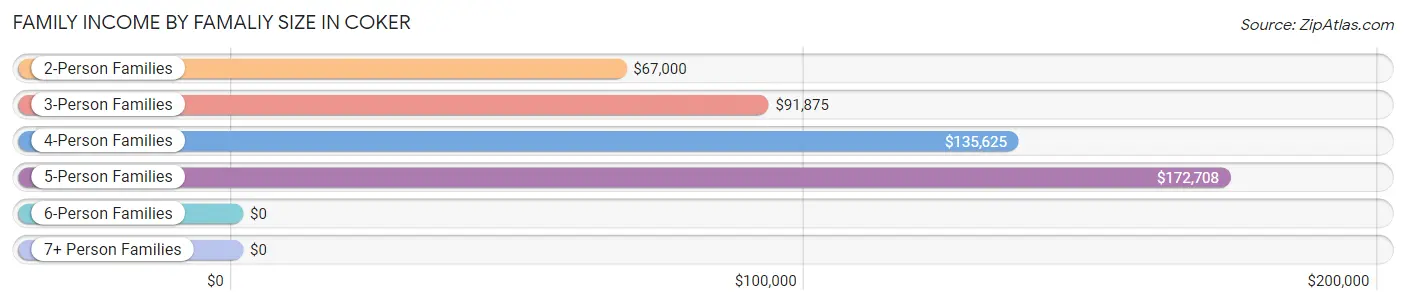
| Income Bracket | # Families | Median Income |
| 2-Person Families | 112 (41.6%) | $67,000 |
| 3-Person Families | 71 (26.4%) | $91,875 |
| 4-Person Families | 40 (14.9%) | $135,625 |
| 5-Person Families | 17 (6.3%) | $172,708 |
| 6-Person Families | 29 (10.8%) | $0 |
| 7+ Person Families | 0 (0.0%) | $0 |
| Total | 269 (100.0%) | $83,523 |
Family Income by Number of Earners in Coker
The median family income in Coker is $83,523, with families comprising 3+ earners (41) having the highest median family income of $135,938, while families with no earners (49) have the lowest median family income of $43,125, accounting for 15.2% and 18.2% of families, respectively.
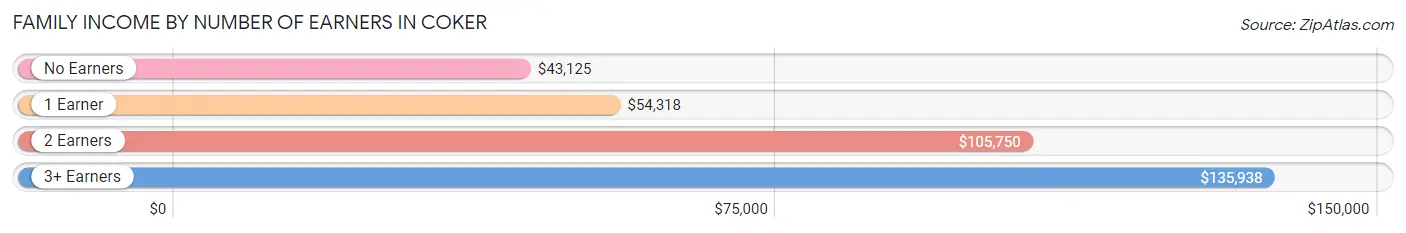
| Number of Earners | # Families | Median Income |
| No Earners | 49 (18.2%) | $43,125 |
| 1 Earner | 92 (34.2%) | $54,318 |
| 2 Earners | 87 (32.3%) | $105,750 |
| 3+ Earners | 41 (15.2%) | $135,938 |
| Total | 269 (100.0%) | $83,523 |
Household Income in Coker
Household Income Brackets in Coker
With 64 households falling in the category, the $75,000 to $99,999 income range is the most frequent in Coker, accounting for 16.6% of all households. In contrast, only 4 households (1.0%) fall into the $10,000 to $14,999 income bracket, making it the least populous group.
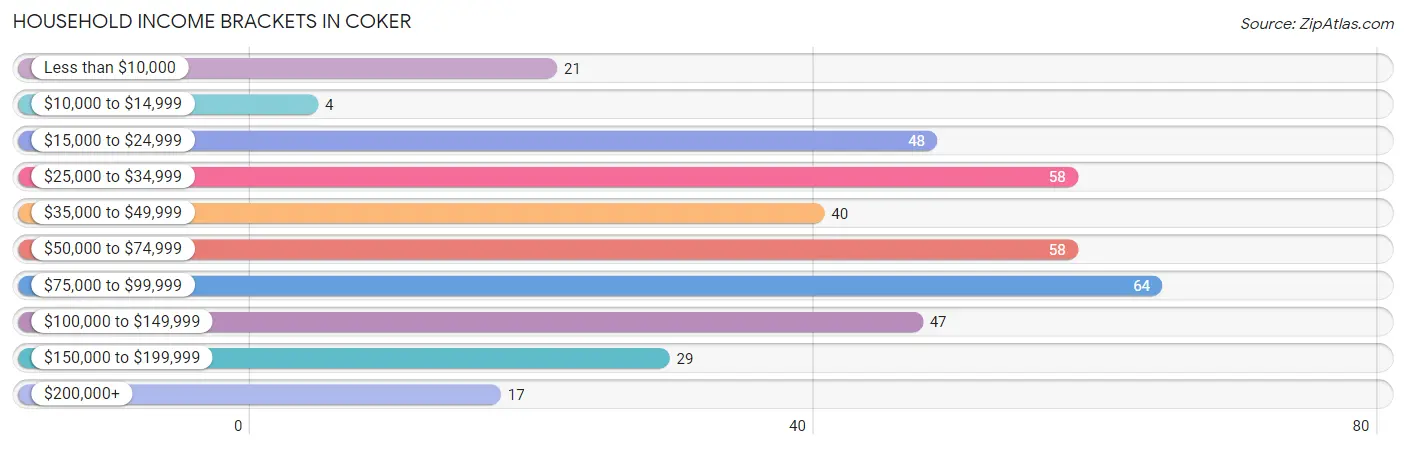
| Income Bracket | # Households | % Households |
| Less than $10,000 | 21 | 5.4% |
| $10,000 to $14,999 | 4 | 1.0% |
| $15,000 to $24,999 | 48 | 12.4% |
| $25,000 to $34,999 | 58 | 15.0% |
| $35,000 to $49,999 | 40 | 10.4% |
| $50,000 to $74,999 | 58 | 15.0% |
| $75,000 to $99,999 | 64 | 16.6% |
| $100,000 to $149,999 | 47 | 12.2% |
| $150,000 to $199,999 | 29 | 7.5% |
| $200,000+ | 17 | 4.4% |
Household Income by Householder Age in Coker
The median household income in Coker is $54,559, with the highest median household income of $90,357 found in the 45 to 64 years age bracket for the primary householder. A total of 158 households (40.9%) fall into this category. Meanwhile, the 15 to 24 years age bracket for the primary householder has the lowest median household income of $0, with 7 households (1.8%) in this group.
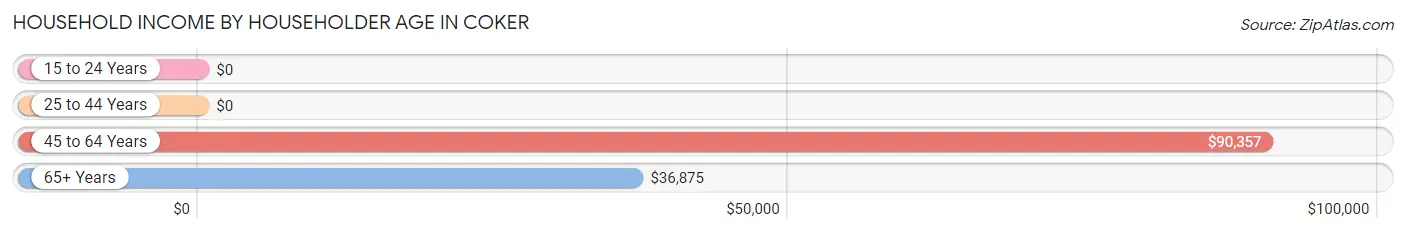
| Income Bracket | # Households | Median Income |
| 15 to 24 Years | 7 (1.8%) | $0 |
| 25 to 44 Years | 87 (22.5%) | $0 |
| 45 to 64 Years | 158 (40.9%) | $90,357 |
| 65+ Years | 134 (34.7%) | $36,875 |
| Total | 386 (100.0%) | $54,559 |
Poverty in Coker
Income Below Poverty by Sex and Age in Coker
With 14.0% poverty level for males and 19.8% for females among the residents of Coker, 35 to 44 year old males and 6 to 11 year old females are the most vulnerable to poverty, with 39 males (45.9%) and 61 females (87.1%) in their respective age groups living below the poverty level.
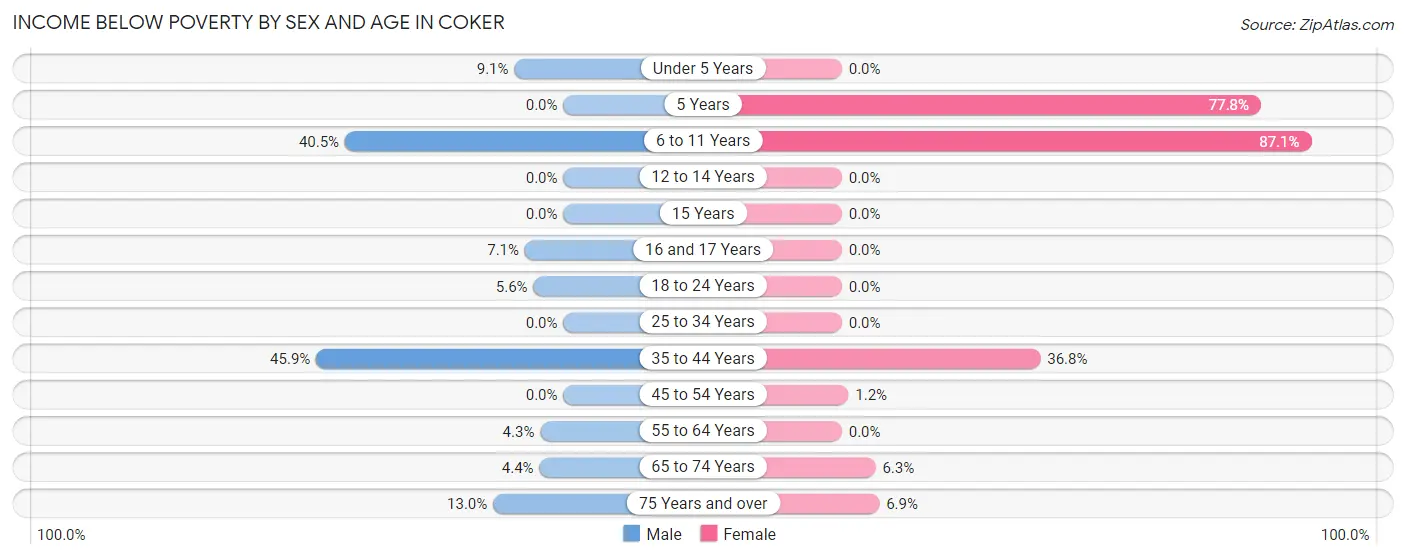
| Age Bracket | Male | Female |
| Under 5 Years | 2 (9.1%) | 0 (0.0%) |
| 5 Years | 0 (0.0%) | 7 (77.8%) |
| 6 to 11 Years | 15 (40.5%) | 61 (87.1%) |
| 12 to 14 Years | 0 (0.0%) | 0 (0.0%) |
| 15 Years | 0 (0.0%) | 0 (0.0%) |
| 16 and 17 Years | 1 (7.1%) | 0 (0.0%) |
| 18 to 24 Years | 5 (5.6%) | 0 (0.0%) |
| 25 to 34 Years | 0 (0.0%) | 0 (0.0%) |
| 35 to 44 Years | 39 (45.9%) | 21 (36.8%) |
| 45 to 54 Years | 0 (0.0%) | 1 (1.2%) |
| 55 to 64 Years | 3 (4.3%) | 0 (0.0%) |
| 65 to 74 Years | 2 (4.4%) | 3 (6.2%) |
| 75 Years and over | 3 (13.0%) | 5 (6.9%) |
| Total | 70 (14.0%) | 98 (19.8%) |
Income Above Poverty by Sex and Age in Coker
According to the poverty statistics in Coker, males aged 12 to 14 years and females aged under 5 years are the age groups that are most secure financially, with 100.0% of males and 100.0% of females in these age groups living above the poverty line.
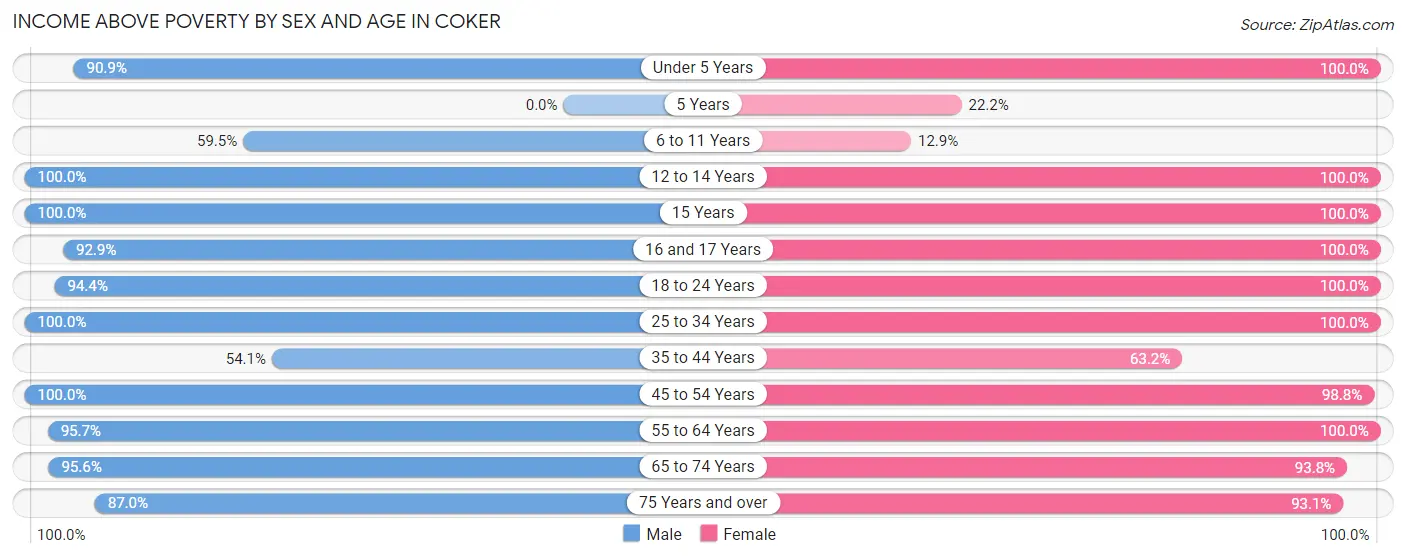
| Age Bracket | Male | Female |
| Under 5 Years | 20 (90.9%) | 10 (100.0%) |
| 5 Years | 0 (0.0%) | 2 (22.2%) |
| 6 to 11 Years | 22 (59.5%) | 9 (12.9%) |
| 12 to 14 Years | 4 (100.0%) | 26 (100.0%) |
| 15 Years | 3 (100.0%) | 6 (100.0%) |
| 16 and 17 Years | 13 (92.9%) | 4 (100.0%) |
| 18 to 24 Years | 85 (94.4%) | 37 (100.0%) |
| 25 to 34 Years | 30 (100.0%) | 20 (100.0%) |
| 35 to 44 Years | 46 (54.1%) | 36 (63.2%) |
| 45 to 54 Years | 76 (100.0%) | 81 (98.8%) |
| 55 to 64 Years | 67 (95.7%) | 53 (100.0%) |
| 65 to 74 Years | 43 (95.6%) | 45 (93.8%) |
| 75 Years and over | 20 (87.0%) | 67 (93.1%) |
| Total | 429 (86.0%) | 396 (80.2%) |
Income Below Poverty Among Married-Couple Families in Coker
The poverty statistics for married-couple families in Coker show that 16.3% or 41 of the total 251 families live below the poverty line. Families with 3 or 4 children have the highest poverty rate of 67.4%, comprising of 29 families. On the other hand, families with no children have the lowest poverty rate of 1.3%, which includes 2 families.
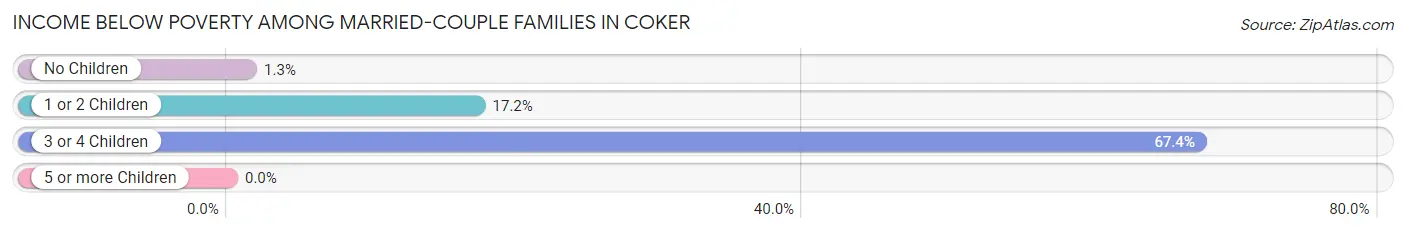
| Children | Above Poverty | Below Poverty |
| No Children | 148 (98.7%) | 2 (1.3%) |
| 1 or 2 Children | 48 (82.8%) | 10 (17.2%) |
| 3 or 4 Children | 14 (32.6%) | 29 (67.4%) |
| 5 or more Children | 0 (0.0%) | 0 (0.0%) |
| Total | 210 (83.7%) | 41 (16.3%) |
Income Below Poverty Among Single-Parent Households in Coker
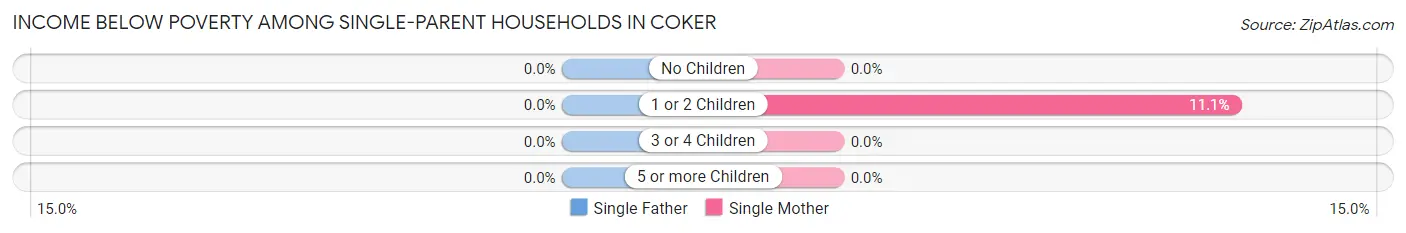
| Children | Single Father | Single Mother |
| No Children | 0 (0.0%) | 0 (0.0%) |
| 1 or 2 Children | 0 (0.0%) | 1 (11.1%) |
| 3 or 4 Children | 0 (0.0%) | 0 (0.0%) |
| 5 or more Children | 0 (0.0%) | 0 (0.0%) |
| Total | 0 (0.0%) | 1 (7.7%) |
Income Below Poverty Among Married-Couple vs Single-Parent Households in Coker
The poverty data for Coker shows that 41 of the married-couple family households (16.3%) and 1 of the single-parent households (5.6%) are living below the poverty level. Within the married-couple family households, those with 3 or 4 children have the highest poverty rate, with 29 households (67.4%) falling below the poverty line. Among the single-parent households, those with 1 or 2 children have the highest poverty rate, with 1 household (8.3%) living below poverty.
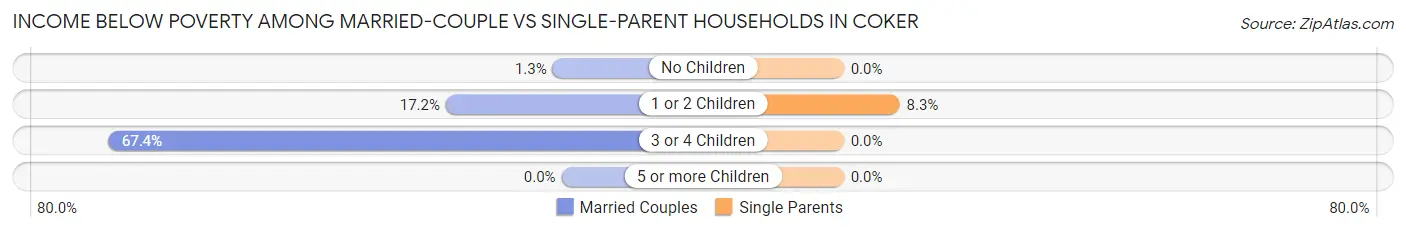
| Children | Married-Couple Families | Single-Parent Households |
| No Children | 2 (1.3%) | 0 (0.0%) |
| 1 or 2 Children | 10 (17.2%) | 1 (8.3%) |
| 3 or 4 Children | 29 (67.4%) | 0 (0.0%) |
| 5 or more Children | 0 (0.0%) | 0 (0.0%) |
| Total | 41 (16.3%) | 1 (5.6%) |
Race in Coker
The most populous races in Coker are White / Caucasian (870 | 86.5%), Two or more Races (120 | 11.9%), and Black / African American (16 | 1.6%).
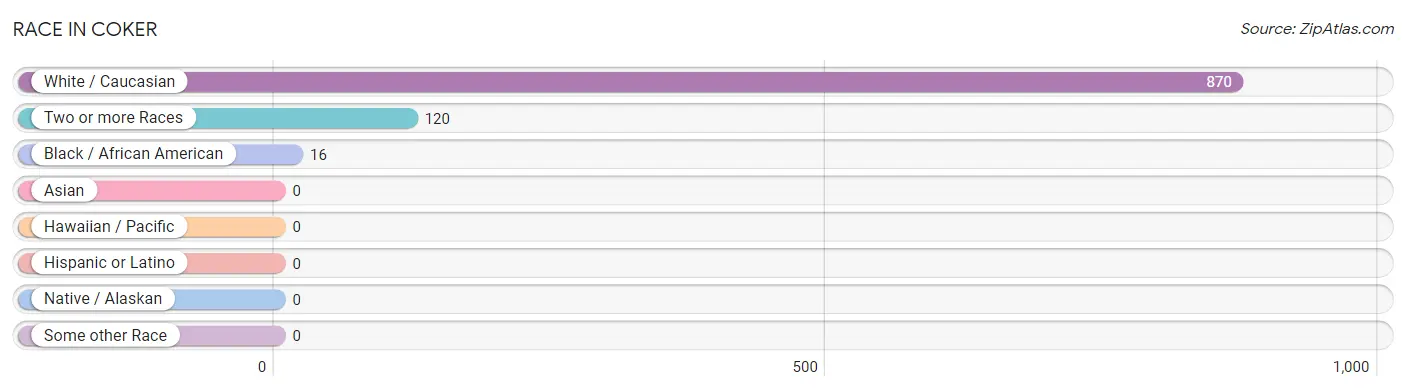
| Race | # Population | % Population |
| Asian | 0 | 0.0% |
| Black / African American | 16 | 1.6% |
| Hawaiian / Pacific | 0 | 0.0% |
| Hispanic or Latino | 0 | 0.0% |
| Native / Alaskan | 0 | 0.0% |
| White / Caucasian | 870 | 86.5% |
| Two or more Races | 120 | 11.9% |
| Some other Race | 0 | 0.0% |
| Total | 1,006 | 100.0% |
Ancestry in Coker
The most populous ancestries reported in Coker are American (237 | 23.6%), Irish (165 | 16.4%), Swiss (106 | 10.5%), English (81 | 8.1%), and German (61 | 6.1%), together accounting for 64.6% of all Coker residents.
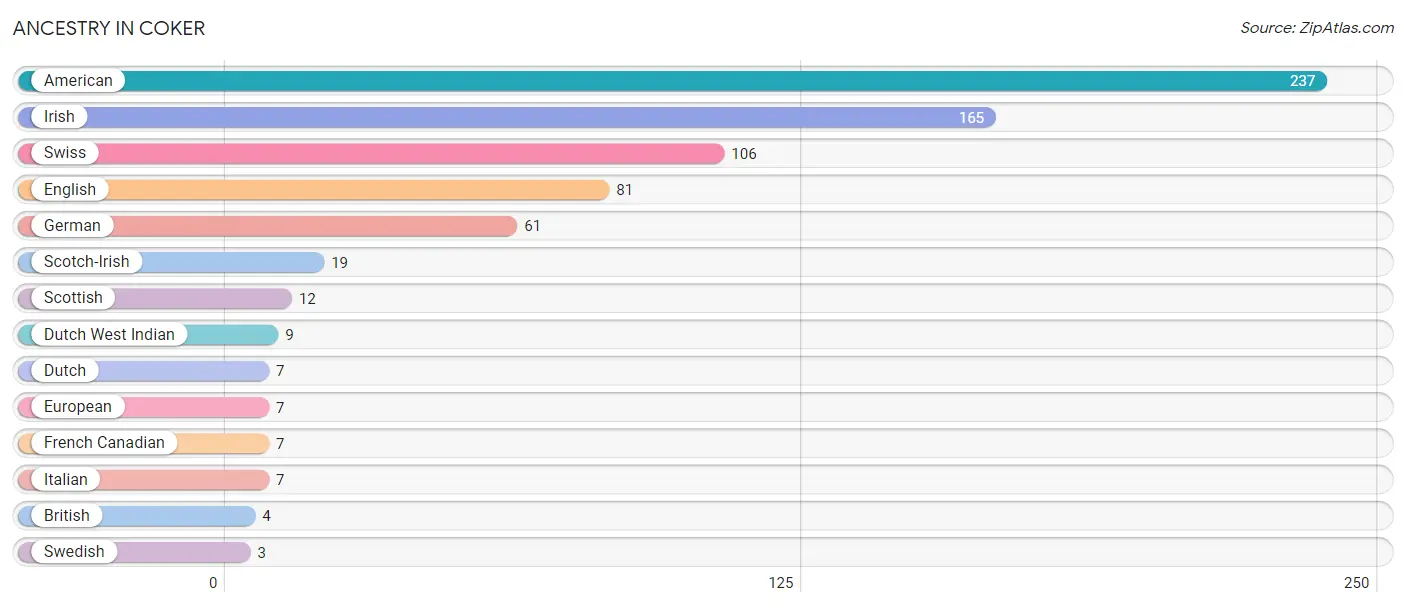
| Ancestry | # Population | % Population |
| American | 237 | 23.6% |
| British | 4 | 0.4% |
| Dutch | 7 | 0.7% |
| Dutch West Indian | 9 | 0.9% |
| English | 81 | 8.1% |
| European | 7 | 0.7% |
| French Canadian | 7 | 0.7% |
| German | 61 | 6.1% |
| Irish | 165 | 16.4% |
| Italian | 7 | 0.7% |
| Scotch-Irish | 19 | 1.9% |
| Scottish | 12 | 1.2% |
| Swedish | 3 | 0.3% |
| Swiss | 106 | 10.5% | View All 14 Rows |
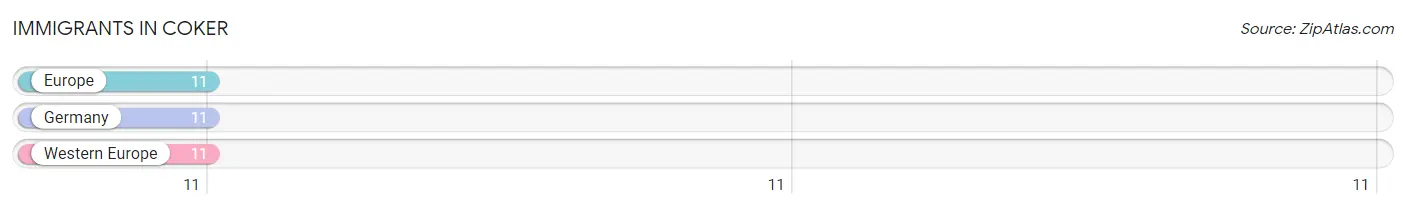
Immigrants in Coker
The most numerous immigrant groups reported in Coker came from Europe (11 | 1.1%), Germany (11 | 1.1%), and Western Europe (11 | 1.1%), together accounting for 3.3% of all Coker residents.
| Immigration Origin | # Population | % Population |
| Europe | 11 | 1.1% |
| Germany | 11 | 1.1% |
| Western Europe | 11 | 1.1% | View All 3 Rows |
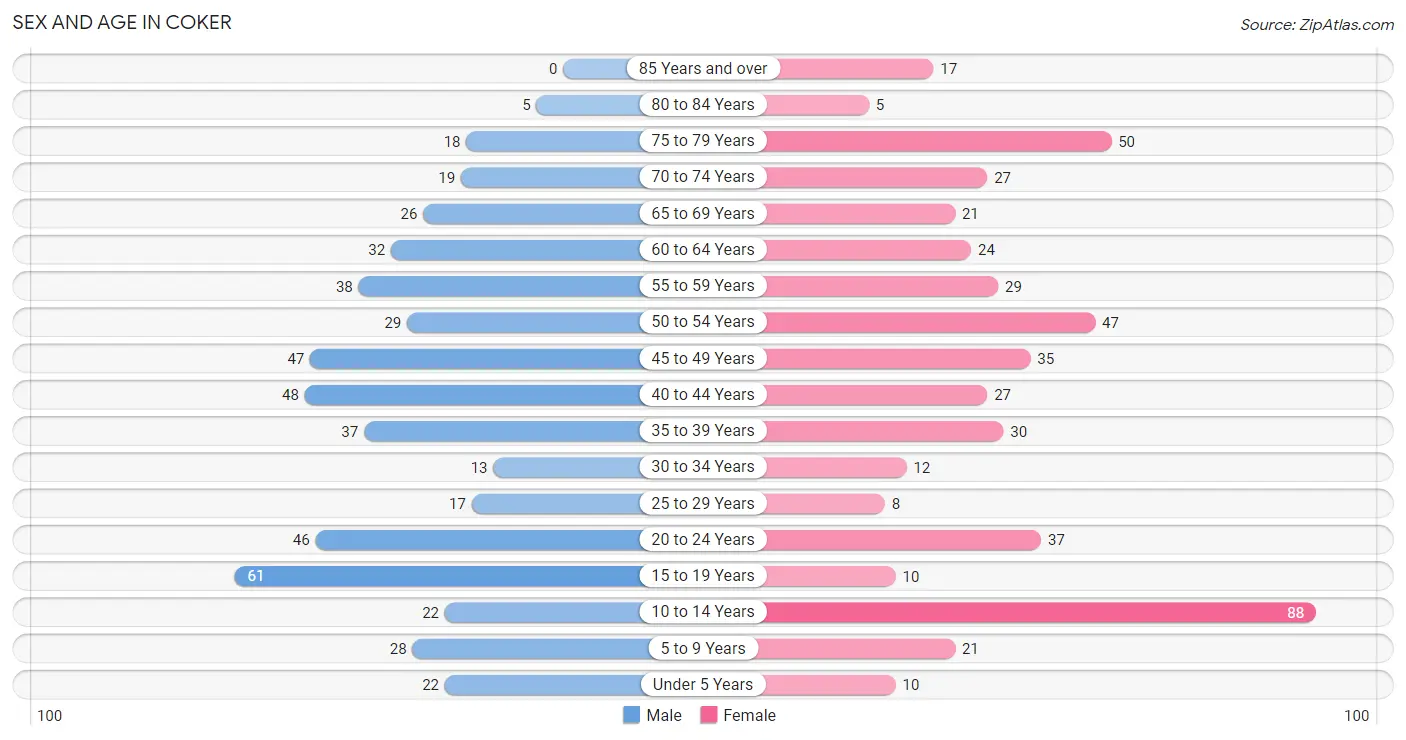
Sex and Age in Coker
Sex and Age in Coker
The most populous age groups in Coker are 15 to 19 Years (61 | 12.0%) for men and 10 to 14 Years (88 | 17.7%) for women.
| Age Bracket | Male | Female |
| Under 5 Years | 22 (4.3%) | 10 (2.0%) |
| 5 to 9 Years | 28 (5.5%) | 21 (4.2%) |
| 10 to 14 Years | 22 (4.3%) | 88 (17.7%) |
| 15 to 19 Years | 61 (12.0%) | 10 (2.0%) |
| 20 to 24 Years | 46 (9.1%) | 37 (7.4%) |
| 25 to 29 Years | 17 (3.4%) | 8 (1.6%) |
| 30 to 34 Years | 13 (2.6%) | 12 (2.4%) |
| 35 to 39 Years | 37 (7.3%) | 30 (6.0%) |
| 40 to 44 Years | 48 (9.5%) | 27 (5.4%) |
| 45 to 49 Years | 47 (9.2%) | 35 (7.0%) |
| 50 to 54 Years | 29 (5.7%) | 47 (9.4%) |
| 55 to 59 Years | 38 (7.5%) | 29 (5.8%) |
| 60 to 64 Years | 32 (6.3%) | 24 (4.8%) |
| 65 to 69 Years | 26 (5.1%) | 21 (4.2%) |
| 70 to 74 Years | 19 (3.7%) | 27 (5.4%) |
| 75 to 79 Years | 18 (3.5%) | 50 (10.0%) |
| 80 to 84 Years | 5 (1.0%) | 5 (1.0%) |
| 85 Years and over | 0 (0.0%) | 17 (3.4%) |
| Total | 508 (100.0%) | 498 (100.0%) |
Families and Households in Coker
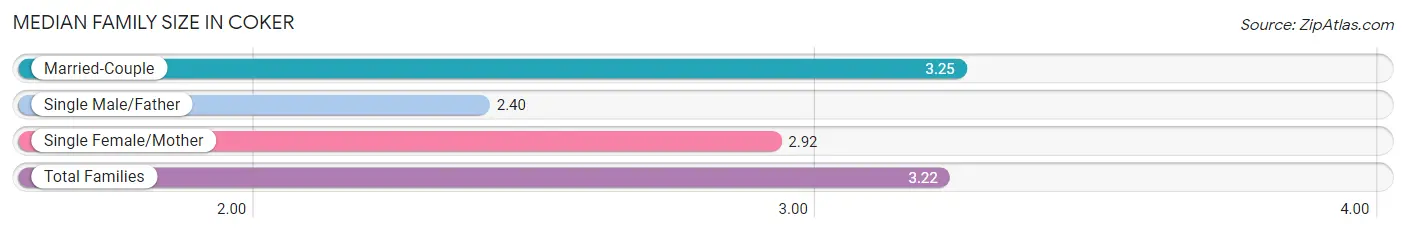
Median Family Size in Coker
The median family size in Coker is 3.22 persons per family, with married-couple families (251 | 93.3%) accounting for the largest median family size of 3.25 persons per family. On the other hand, single male/father families (5 | 1.9%) represent the smallest median family size with 2.40 persons per family.
| Family Type | # Families | Family Size |
| Married-Couple | 251 (93.3%) | 3.25 |
| Single Male/Father | 5 (1.9%) | 2.40 |
| Single Female/Mother | 13 (4.8%) | 2.92 |
| Total Families | 269 (100.0%) | 3.22 |
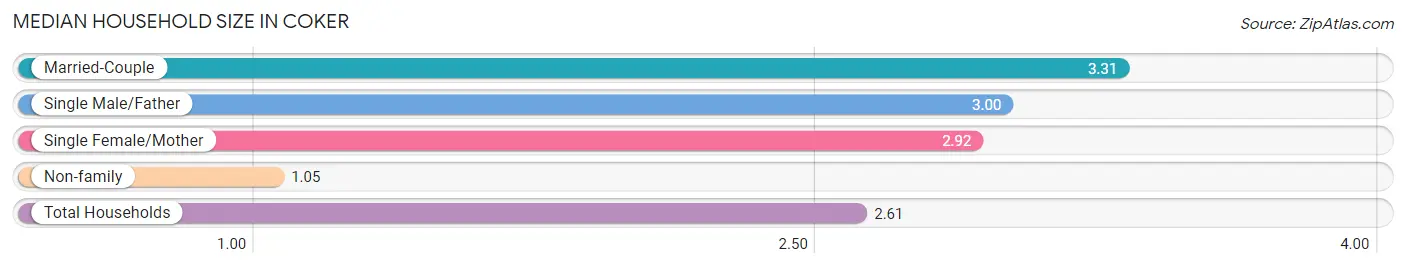
Median Household Size in Coker
The median household size in Coker is 2.61 persons per household, with married-couple households (251 | 65.0%) accounting for the largest median household size of 3.31 persons per household. non-family households (117 | 30.3%) represent the smallest median household size with 1.05 persons per household.
| Household Type | # Households | Household Size |
| Married-Couple | 251 (65.0%) | 3.31 |
| Single Male/Father | 5 (1.3%) | 3.00 |
| Single Female/Mother | 13 (3.4%) | 2.92 |
| Non-family | 117 (30.3%) | 1.05 |
| Total Households | 386 (100.0%) | 2.61 |
Household Size by Marriage Status in Coker
Out of a total of 386 households in Coker, 269 (69.7%) are family households, while 117 (30.3%) are nonfamily households. The most numerous type of family households are 2-person households, comprising 109, and the most common type of nonfamily households are 1-person households, comprising 111.
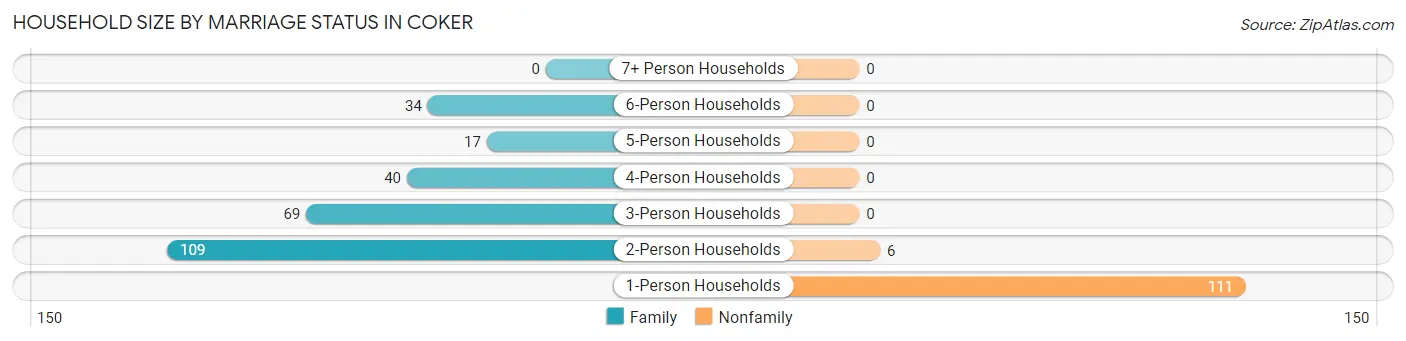
| Household Size | Family Households | Nonfamily Households |
| 1-Person Households | - | 111 (28.8%) |
| 2-Person Households | 109 (28.2%) | 6 (1.5%) |
| 3-Person Households | 69 (17.9%) | 0 (0.0%) |
| 4-Person Households | 40 (10.4%) | 0 (0.0%) |
| 5-Person Households | 17 (4.4%) | 0 (0.0%) |
| 6-Person Households | 34 (8.8%) | 0 (0.0%) |
| 7+ Person Households | 0 (0.0%) | 0 (0.0%) |
| Total | 269 (69.7%) | 117 (30.3%) |
Female Fertility in Coker
Fertility by Age in Coker
Average fertility rate in Coker is 29.0 births per 1,000 women. Women in the age bracket of 20 to 34 years have the highest fertility rate with 53.0 births per 1,000 women. Women in the age bracket of 20 to 34 years acount for 60.0% of all women with births.
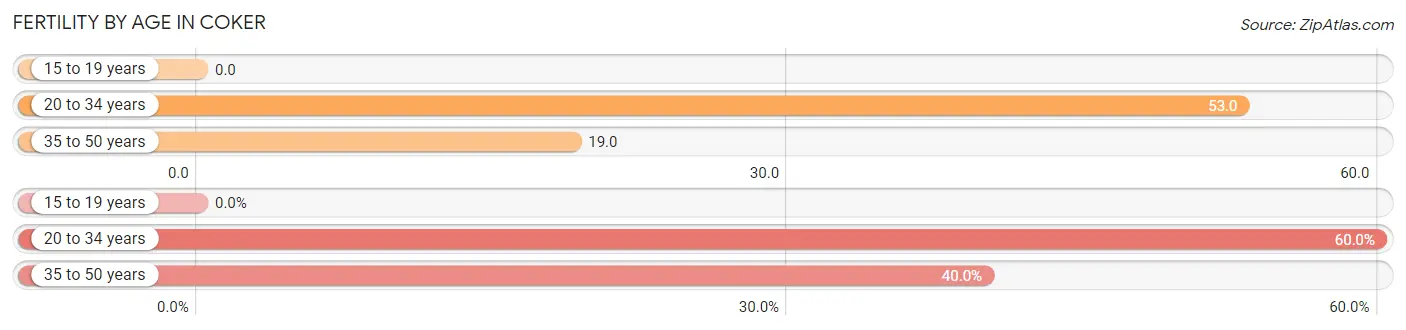
| Age Bracket | Women with Births | Births / 1,000 Women |
| 15 to 19 years | 0 (0.0%) | 0.0 |
| 20 to 34 years | 3 (60.0%) | 53.0 |
| 35 to 50 years | 2 (40.0%) | 19.0 |
| Total | 5 (100.0%) | 29.0 |
Fertility by Age by Marriage Status in Coker
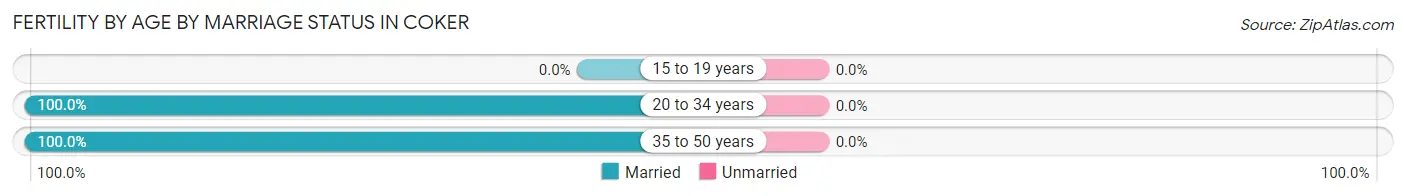
| Age Bracket | Married | Unmarried |
| 15 to 19 years | 0 (0.0%) | 0 (0.0%) |
| 20 to 34 years | 3 (100.0%) | 0 (0.0%) |
| 35 to 50 years | 2 (100.0%) | 0 (0.0%) |
| Total | 5 (100.0%) | 0 (0.0%) |
Fertility by Education in Coker
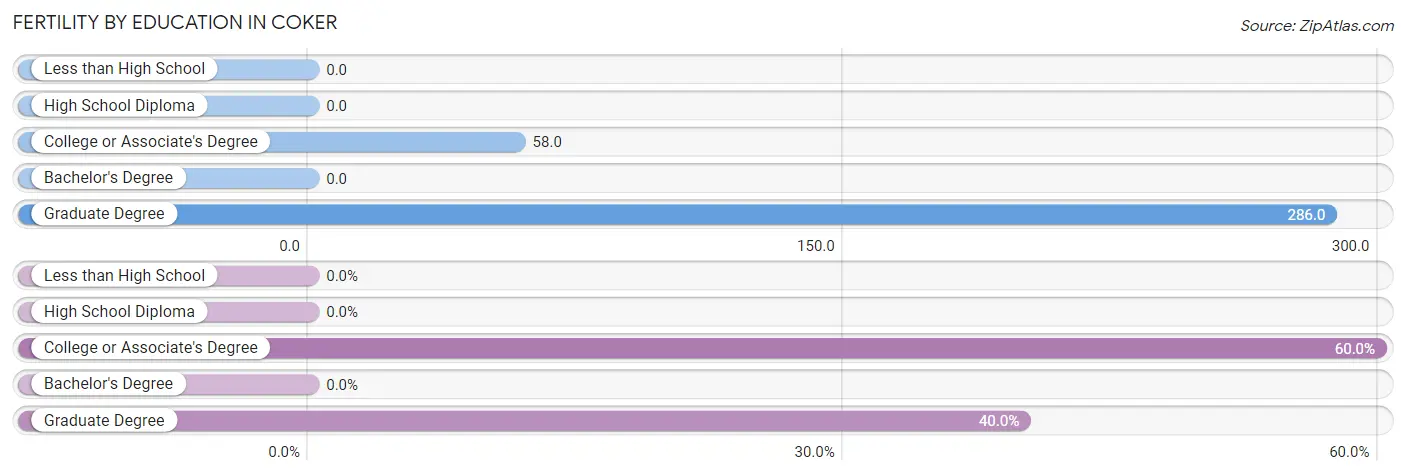
| Educational Attainment | Women with Births | Births / 1,000 Women |
| Less than High School | 0 (0.0%) | 0.0 |
| High School Diploma | 0 (0.0%) | 0.0 |
| College or Associate's Degree | 3 (60.0%) | 58.0 |
| Bachelor's Degree | 0 (0.0%) | 0.0 |
| Graduate Degree | 2 (40.0%) | 286.0 |
| Total | 5 (100.0%) | 29.0 |
Fertility by Education by Marriage Status in Coker
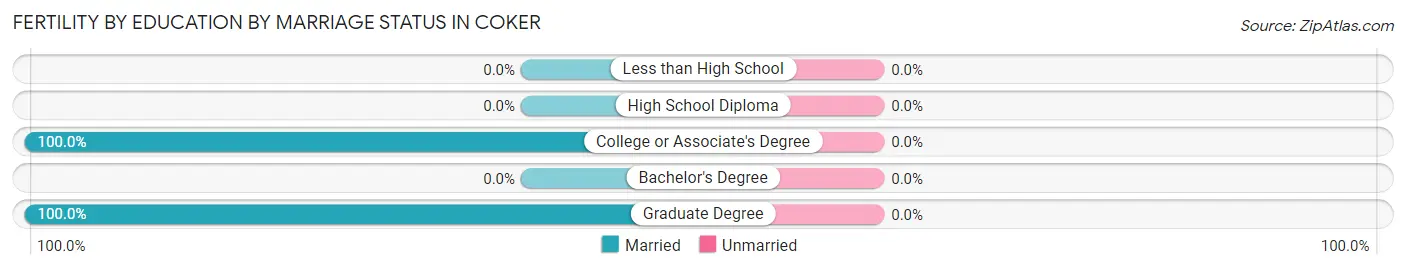
| Educational Attainment | Married | Unmarried |
| Less than High School | 0 (0.0%) | 0 (0.0%) |
| High School Diploma | 0 (0.0%) | 0 (0.0%) |
| College or Associate's Degree | 3 (100.0%) | 0 (0.0%) |
| Bachelor's Degree | 0 (0.0%) | 0 (0.0%) |
| Graduate Degree | 2 (100.0%) | 0 (0.0%) |
| Total | 5 (100.0%) | 0 (0.0%) |
Employment Characteristics in Coker
Employment by Class of Employer in Coker
Among the 440 employed individuals in Coker, private company employees (256 | 58.2%), local government employees (62 | 14.1%), and not-for-profit organizations (36 | 8.2%) make up the most common classes of employment.
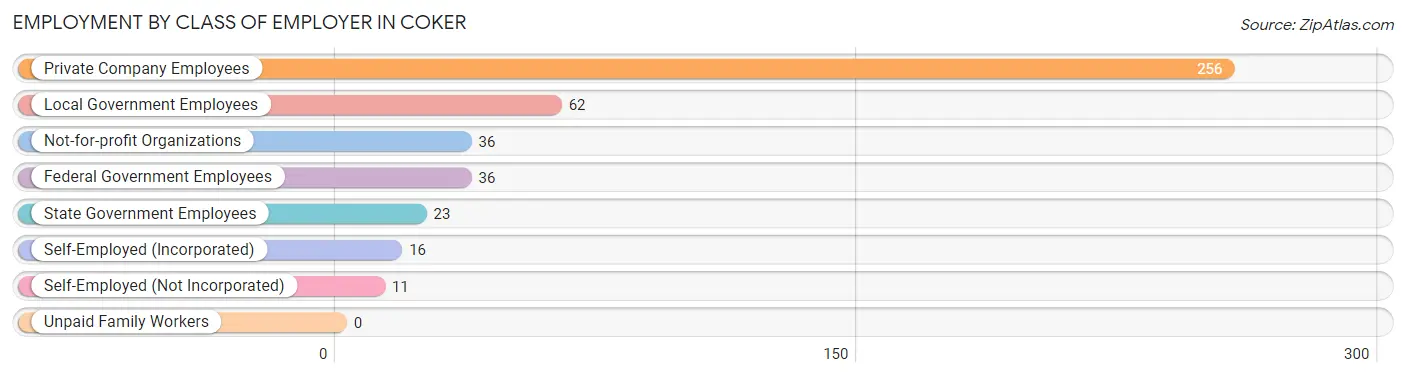
| Employer Class | # Employees | % Employees |
| Private Company Employees | 256 | 58.2% |
| Self-Employed (Incorporated) | 16 | 3.6% |
| Self-Employed (Not Incorporated) | 11 | 2.5% |
| Not-for-profit Organizations | 36 | 8.2% |
| Local Government Employees | 62 | 14.1% |
| State Government Employees | 23 | 5.2% |
| Federal Government Employees | 36 | 8.2% |
| Unpaid Family Workers | 0 | 0.0% |
| Total | 440 | 100.0% |
Employment Status by Age in Coker
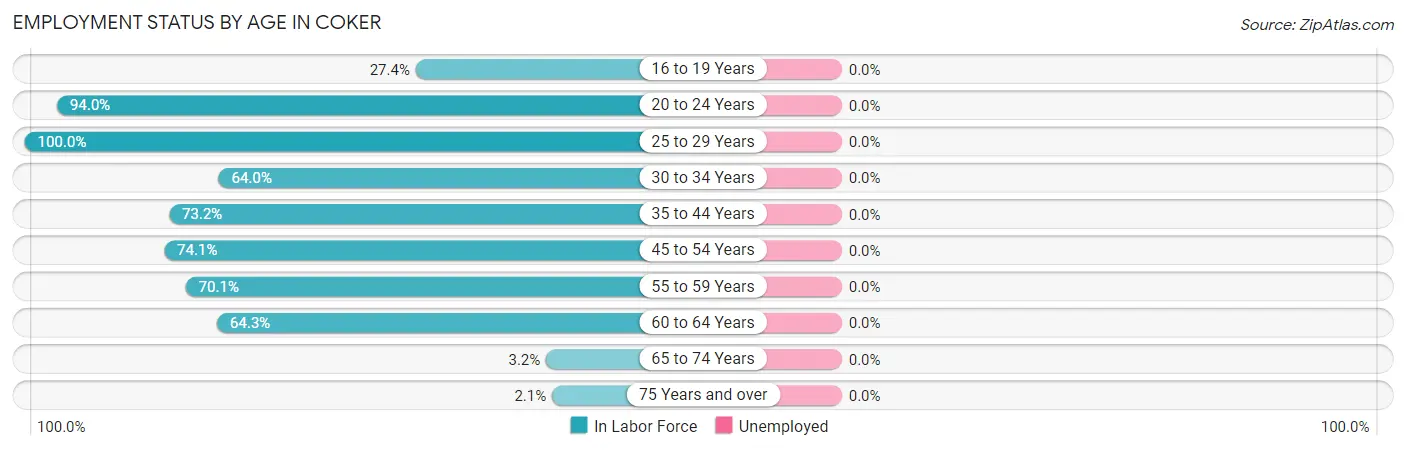
| Age Bracket | In Labor Force | Unemployed |
| 16 to 19 Years | 17 (27.4%) | 0 (0.0%) |
| 20 to 24 Years | 78 (94.0%) | 0 (0.0%) |
| 25 to 29 Years | 25 (100.0%) | 0 (0.0%) |
| 30 to 34 Years | 16 (64.0%) | 0 (0.0%) |
| 35 to 44 Years | 104 (73.2%) | 0 (0.0%) |
| 45 to 54 Years | 117 (74.1%) | 0 (0.0%) |
| 55 to 59 Years | 47 (70.1%) | 0 (0.0%) |
| 60 to 64 Years | 36 (64.3%) | 0 (0.0%) |
| 65 to 74 Years | 3 (3.2%) | 0 (0.0%) |
| 75 Years and over | 2 (2.1%) | 0 (0.0%) |
| Total | 445 (55.2%) | 0 (0.0%) |
Employment Status by Educational Attainment in Coker
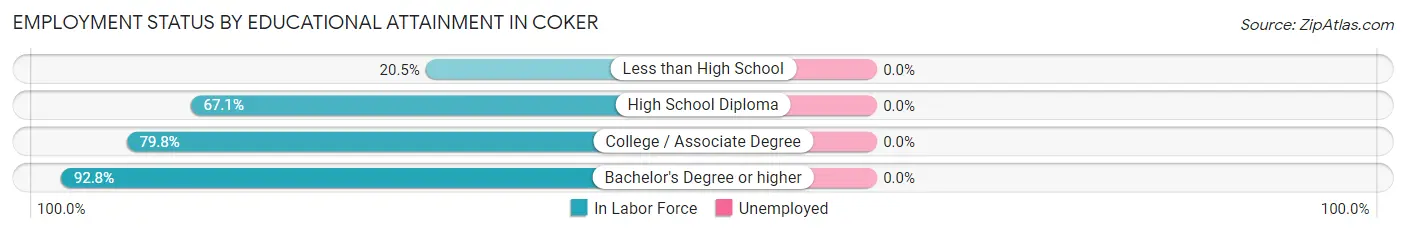
| Educational Attainment | In Labor Force | Unemployed |
| Less than High School | 9 (20.5%) | 0 (0.0%) |
| High School Diploma | 100 (67.1%) | 0 (0.0%) |
| College / Associate Degree | 146 (79.8%) | 0 (0.0%) |
| Bachelor's Degree or higher | 90 (92.8%) | 0 (0.0%) |
| Total | 345 (72.9%) | 0 (0.0%) |
Employment Occupations by Sex in Coker
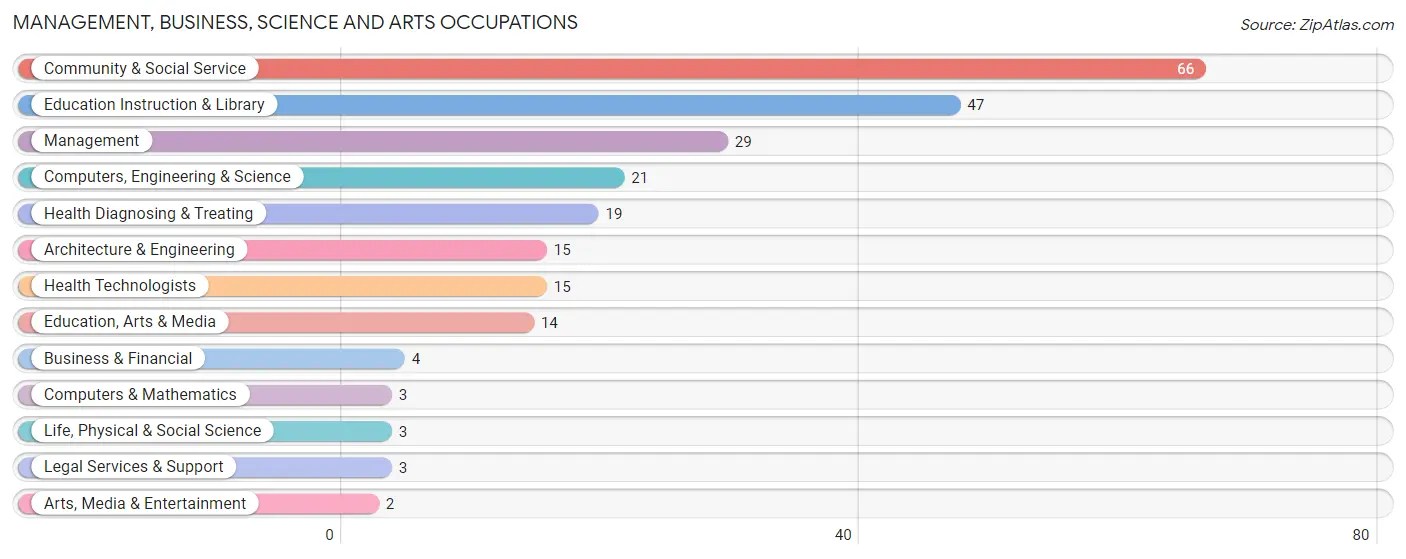
Management, Business, Science and Arts Occupations
The most common Management, Business, Science and Arts occupations in Coker are Community & Social Service (66 | 14.8%), Education Instruction & Library (47 | 10.6%), Management (29 | 6.5%), Computers, Engineering & Science (21 | 4.7%), and Health Diagnosing & Treating (19 | 4.3%).
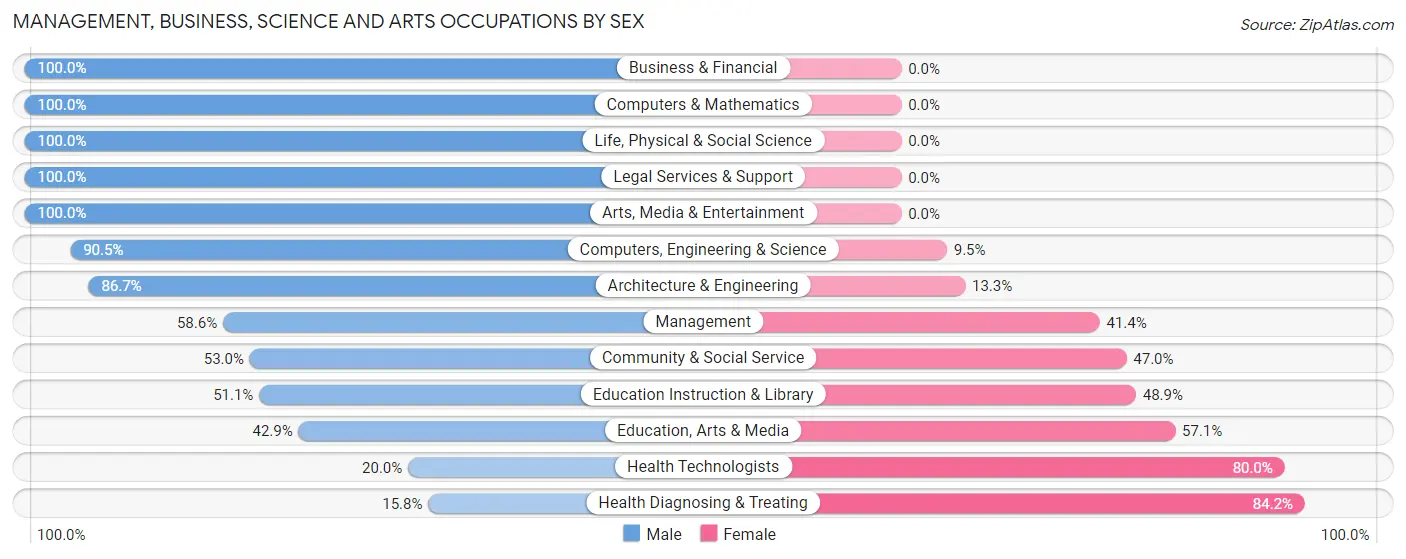
Management, Business, Science and Arts Occupations by Sex
Within the Management, Business, Science and Arts occupations in Coker, the most male-oriented occupations are Business & Financial (100.0%), Computers & Mathematics (100.0%), and Life, Physical & Social Science (100.0%), while the most female-oriented occupations are Health Diagnosing & Treating (84.2%), Health Technologists (80.0%), and Education, Arts & Media (57.1%).
| Occupation | Male | Female |
| Management | 17 (58.6%) | 12 (41.4%) |
| Business & Financial | 4 (100.0%) | 0 (0.0%) |
| Computers, Engineering & Science | 19 (90.5%) | 2 (9.5%) |
| Computers & Mathematics | 3 (100.0%) | 0 (0.0%) |
| Architecture & Engineering | 13 (86.7%) | 2 (13.3%) |
| Life, Physical & Social Science | 3 (100.0%) | 0 (0.0%) |
| Community & Social Service | 35 (53.0%) | 31 (47.0%) |
| Education, Arts & Media | 6 (42.9%) | 8 (57.1%) |
| Legal Services & Support | 3 (100.0%) | 0 (0.0%) |
| Education Instruction & Library | 24 (51.1%) | 23 (48.9%) |
| Arts, Media & Entertainment | 2 (100.0%) | 0 (0.0%) |
| Health Diagnosing & Treating | 3 (15.8%) | 16 (84.2%) |
| Health Technologists | 3 (20.0%) | 12 (80.0%) |
| Total (Category) | 78 (56.1%) | 61 (43.9%) |
| Total (Overall) | 258 (58.0%) | 187 (42.0%) |
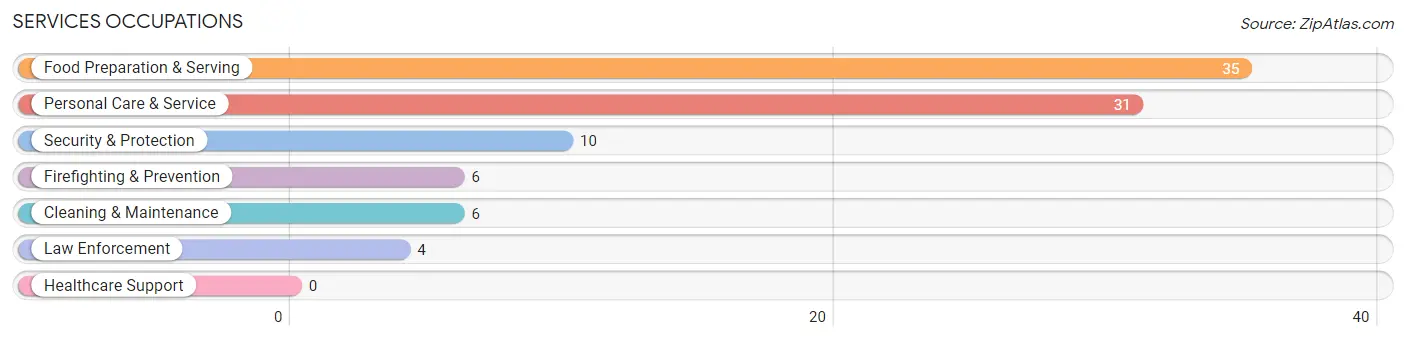
Services Occupations
The most common Services occupations in Coker are Food Preparation & Serving (35 | 7.9%), Personal Care & Service (31 | 7.0%), Security & Protection (10 | 2.2%), Firefighting & Prevention (6 | 1.3%), and Cleaning & Maintenance (6 | 1.3%).
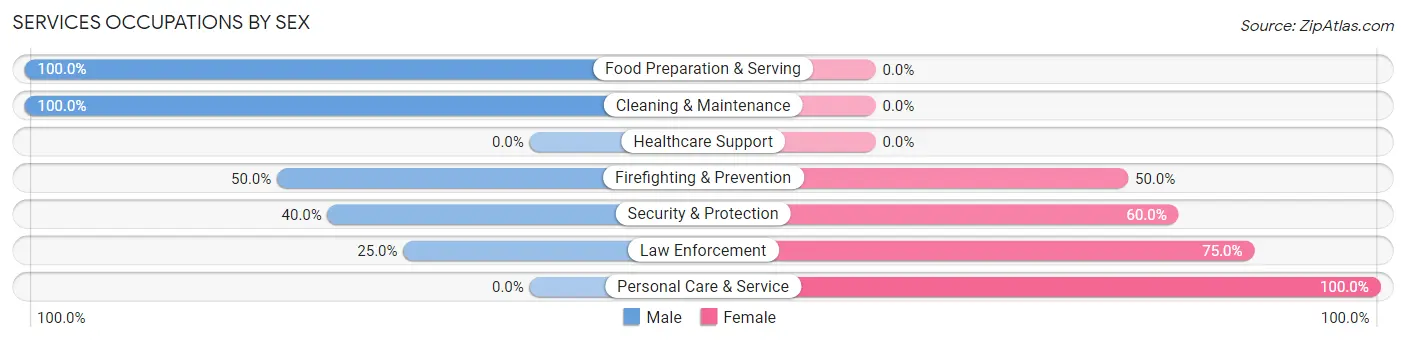
Services Occupations by Sex
Within the Services occupations in Coker, the most male-oriented occupations are Food Preparation & Serving (100.0%), Cleaning & Maintenance (100.0%), and Firefighting & Prevention (50.0%), while the most female-oriented occupations are Personal Care & Service (100.0%), Law Enforcement (75.0%), and Security & Protection (60.0%).
| Occupation | Male | Female |
| Healthcare Support | 0 (0.0%) | 0 (0.0%) |
| Security & Protection | 4 (40.0%) | 6 (60.0%) |
| Firefighting & Prevention | 3 (50.0%) | 3 (50.0%) |
| Law Enforcement | 1 (25.0%) | 3 (75.0%) |
| Food Preparation & Serving | 35 (100.0%) | 0 (0.0%) |
| Cleaning & Maintenance | 6 (100.0%) | 0 (0.0%) |
| Personal Care & Service | 0 (0.0%) | 31 (100.0%) |
| Total (Category) | 45 (54.9%) | 37 (45.1%) |
| Total (Overall) | 258 (58.0%) | 187 (42.0%) |
Sales and Office Occupations
The most common Sales and Office occupations in Coker are Office & Administration (66 | 14.8%), and Sales & Related (56 | 12.6%).
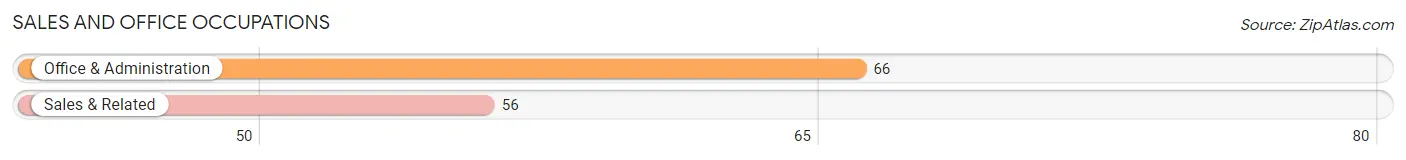
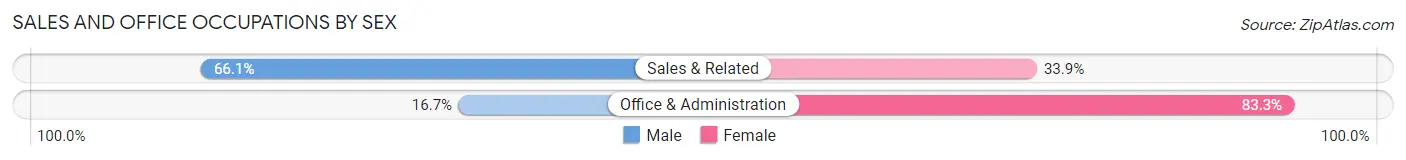
Sales and Office Occupations by Sex
| Occupation | Male | Female |
| Sales & Related | 37 (66.1%) | 19 (33.9%) |
| Office & Administration | 11 (16.7%) | 55 (83.3%) |
| Total (Category) | 48 (39.3%) | 74 (60.7%) |
| Total (Overall) | 258 (58.0%) | 187 (42.0%) |
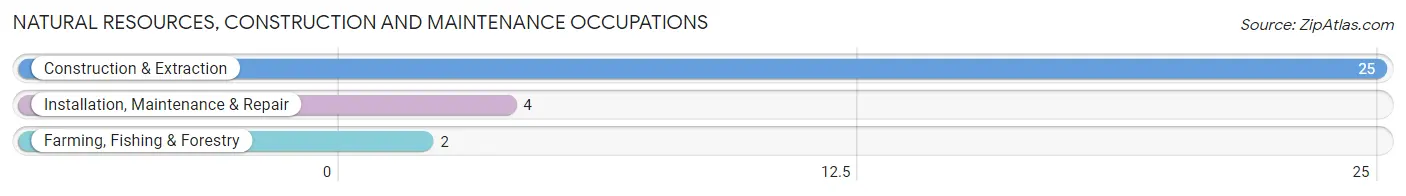
Natural Resources, Construction and Maintenance Occupations
The most common Natural Resources, Construction and Maintenance occupations in Coker are Construction & Extraction (25 | 5.6%), Installation, Maintenance & Repair (4 | 0.9%), and Farming, Fishing & Forestry (2 | 0.4%).
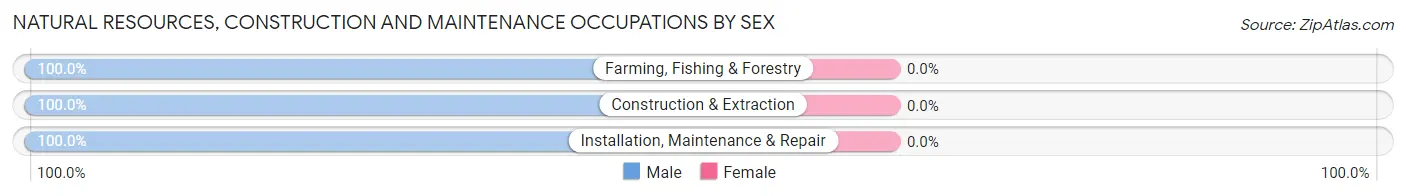
Natural Resources, Construction and Maintenance Occupations by Sex
| Occupation | Male | Female |
| Farming, Fishing & Forestry | 2 (100.0%) | 0 (0.0%) |
| Construction & Extraction | 25 (100.0%) | 0 (0.0%) |
| Installation, Maintenance & Repair | 4 (100.0%) | 0 (0.0%) |
| Total (Category) | 31 (100.0%) | 0 (0.0%) |
| Total (Overall) | 258 (58.0%) | 187 (42.0%) |
Production, Transportation and Moving Occupations
The most common Production, Transportation and Moving occupations in Coker are Production (35 | 7.9%), Material Moving (26 | 5.8%), and Transportation (10 | 2.2%).
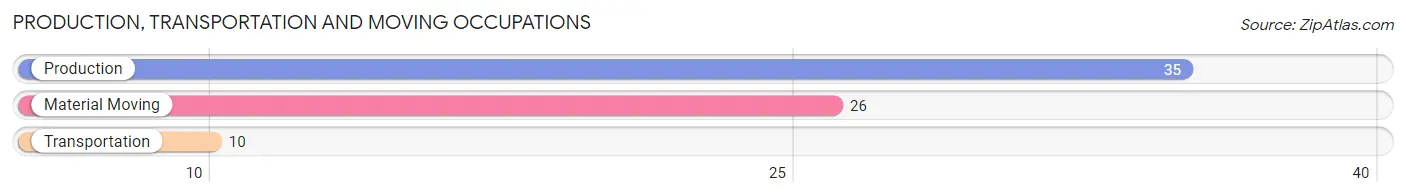
Production, Transportation and Moving Occupations by Sex
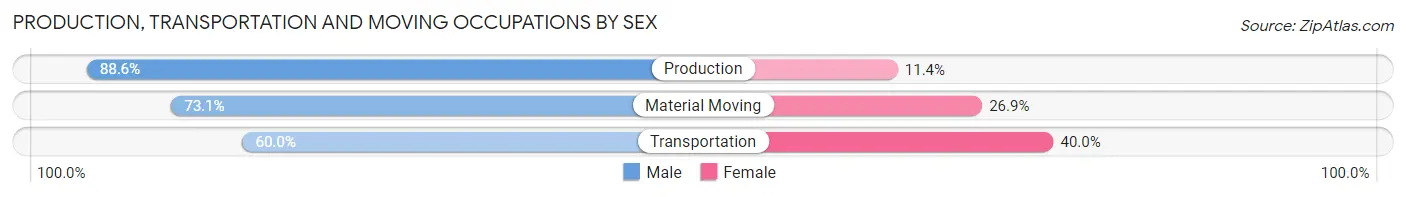
| Occupation | Male | Female |
| Production | 31 (88.6%) | 4 (11.4%) |
| Transportation | 6 (60.0%) | 4 (40.0%) |
| Material Moving | 19 (73.1%) | 7 (26.9%) |
| Total (Category) | 56 (78.9%) | 15 (21.1%) |
| Total (Overall) | 258 (58.0%) | 187 (42.0%) |
Employment Industries by Sex in Coker
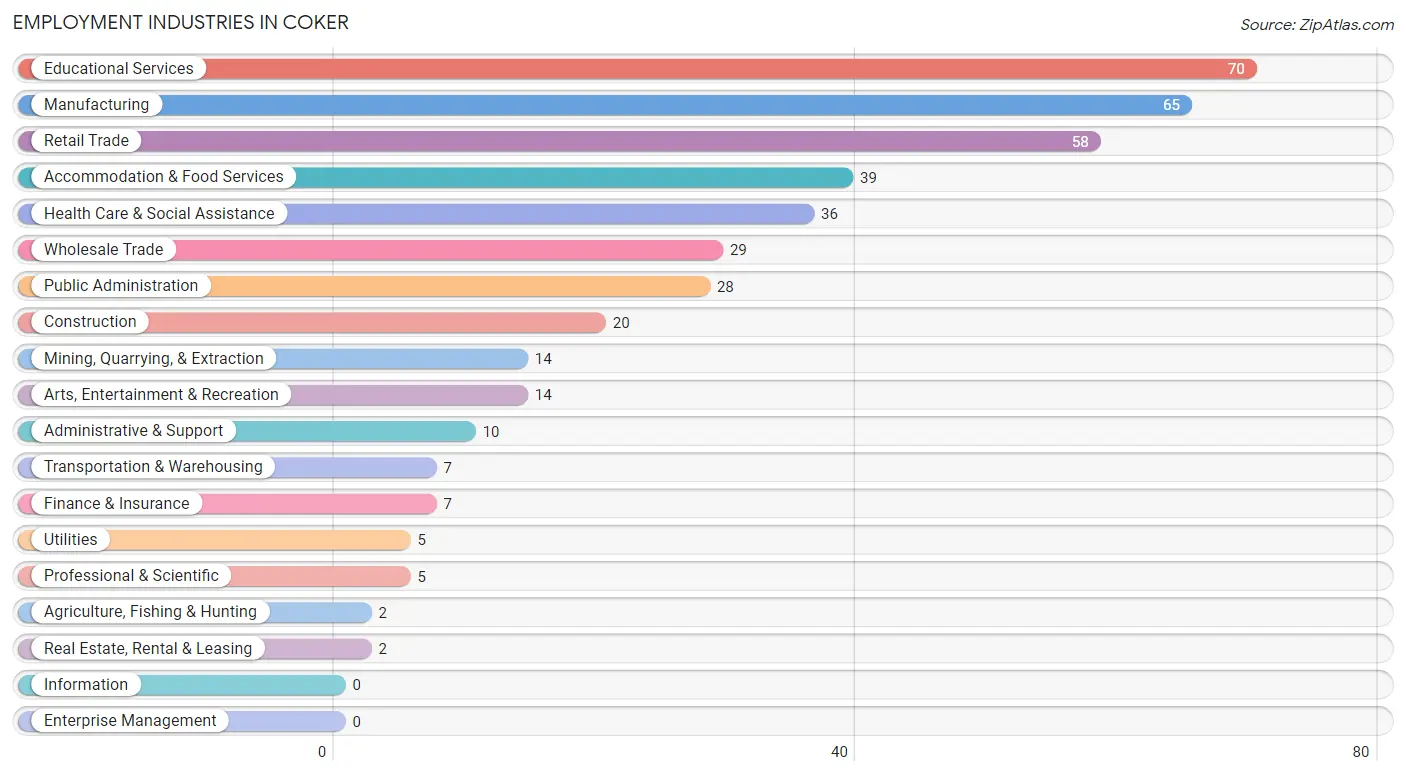
Employment Industries in Coker
The major employment industries in Coker include Educational Services (70 | 15.7%), Manufacturing (65 | 14.6%), Retail Trade (58 | 13.0%), Accommodation & Food Services (39 | 8.8%), and Health Care & Social Assistance (36 | 8.1%).
Employment Industries by Sex in Coker
The Coker industries that see more men than women are Agriculture, Fishing & Hunting (100.0%), Mining, Quarrying, & Extraction (100.0%), and Construction (100.0%), whereas the industries that tend to have a higher number of women are Real Estate, Rental & Leasing (100.0%), Health Care & Social Assistance (94.4%), and Arts, Entertainment & Recreation (92.9%).
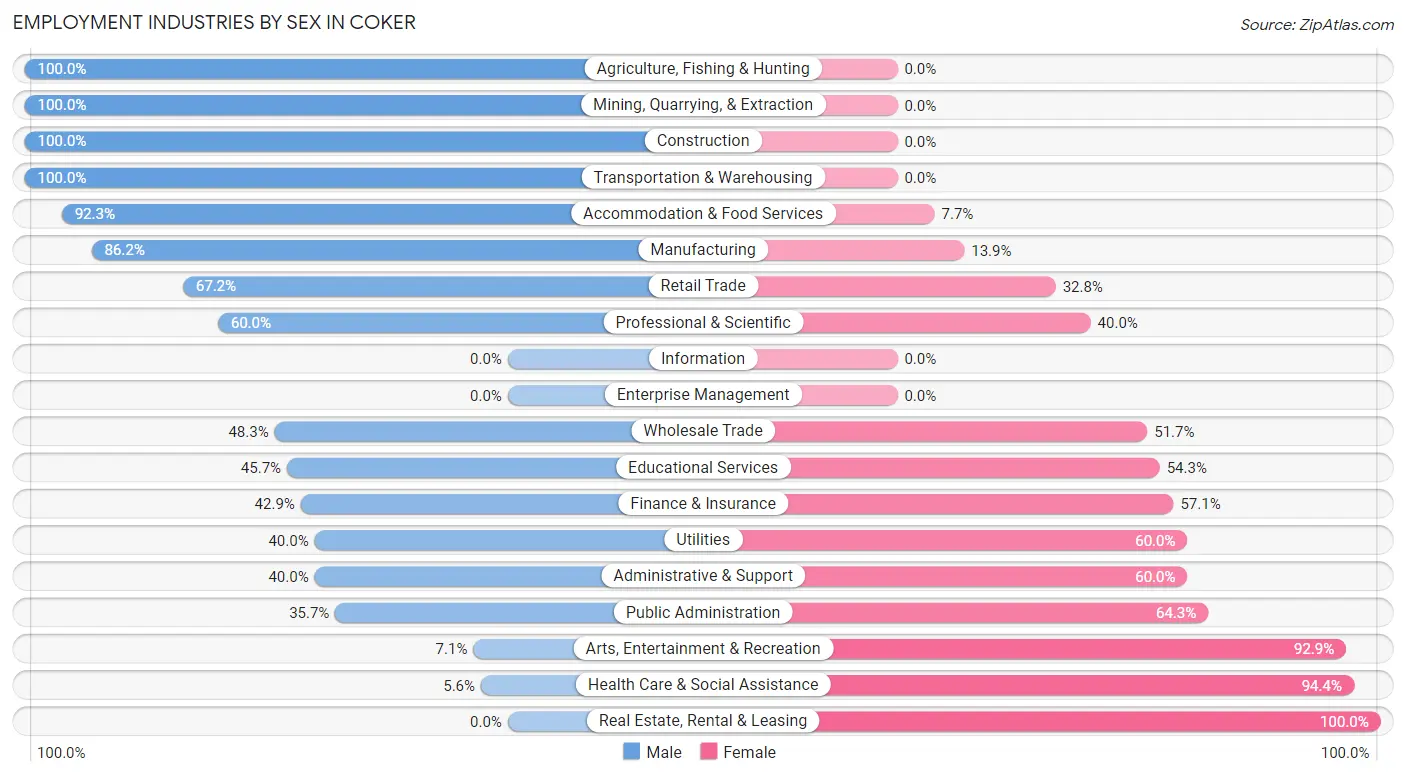
| Industry | Male | Female |
| Agriculture, Fishing & Hunting | 2 (100.0%) | 0 (0.0%) |
| Mining, Quarrying, & Extraction | 14 (100.0%) | 0 (0.0%) |
| Construction | 20 (100.0%) | 0 (0.0%) |
| Manufacturing | 56 (86.2%) | 9 (13.9%) |
| Wholesale Trade | 14 (48.3%) | 15 (51.7%) |
| Retail Trade | 39 (67.2%) | 19 (32.8%) |
| Transportation & Warehousing | 7 (100.0%) | 0 (0.0%) |
| Utilities | 2 (40.0%) | 3 (60.0%) |
| Information | 0 (0.0%) | 0 (0.0%) |
| Finance & Insurance | 3 (42.9%) | 4 (57.1%) |
| Real Estate, Rental & Leasing | 0 (0.0%) | 2 (100.0%) |
| Professional & Scientific | 3 (60.0%) | 2 (40.0%) |
| Enterprise Management | 0 (0.0%) | 0 (0.0%) |
| Administrative & Support | 4 (40.0%) | 6 (60.0%) |
| Educational Services | 32 (45.7%) | 38 (54.3%) |
| Health Care & Social Assistance | 2 (5.6%) | 34 (94.4%) |
| Arts, Entertainment & Recreation | 1 (7.1%) | 13 (92.9%) |
| Accommodation & Food Services | 36 (92.3%) | 3 (7.7%) |
| Public Administration | 10 (35.7%) | 18 (64.3%) |
| Total | 258 (58.0%) | 187 (42.0%) |
Education in Coker
School Enrollment in Coker
The most common levels of schooling among the 257 students in Coker are middle school (94 | 36.6%), high school (54 | 21.0%), and college / undergraduate (53 | 20.6%).
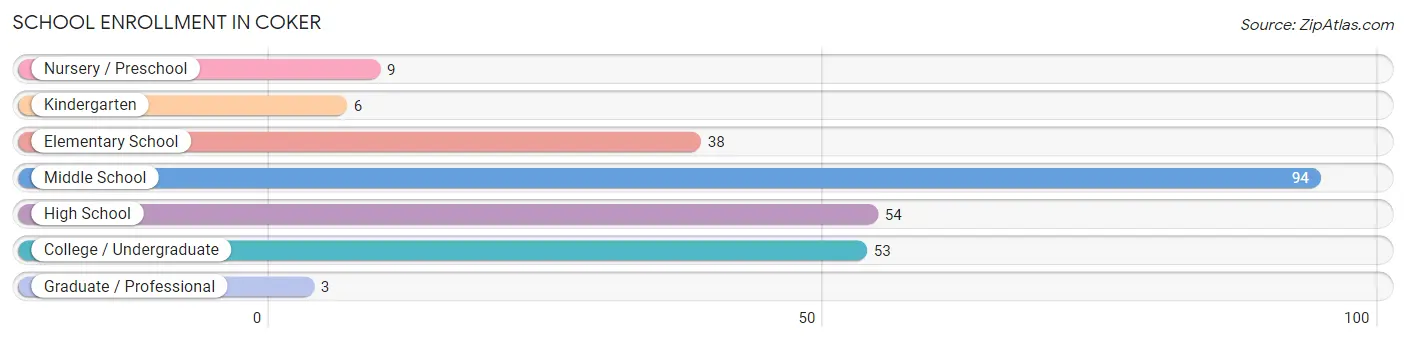
| School Level | # Students | % Students |
| Nursery / Preschool | 9 | 3.5% |
| Kindergarten | 6 | 2.3% |
| Elementary School | 38 | 14.8% |
| Middle School | 94 | 36.6% |
| High School | 54 | 21.0% |
| College / Undergraduate | 53 | 20.6% |
| Graduate / Professional | 3 | 1.2% |
| Total | 257 | 100.0% |
School Enrollment by Age by Funding Source in Coker
Out of a total of 257 students who are enrolled in schools in Coker, 115 (44.7%) attend a private institution, while the remaining 142 (55.3%) are enrolled in public schools. The age group of 5 to 9 year old has the highest likelihood of being enrolled in private schools, with 28 (71.8% in the age bracket) enrolled. Conversely, the age group of 18 to 19 year olds has the lowest likelihood of being enrolled in a private school, with 42 (100.0% in the age bracket) attending a public institution.
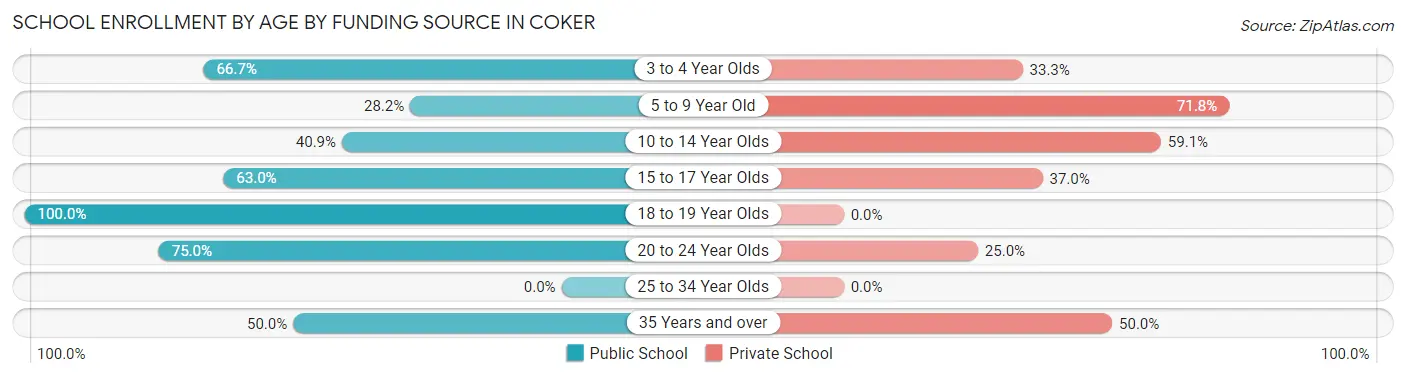
| Age Bracket | Public School | Private School |
| 3 to 4 Year Olds | 6 (66.7%) | 3 (33.3%) |
| 5 to 9 Year Old | 11 (28.2%) | 28 (71.8%) |
| 10 to 14 Year Olds | 45 (40.9%) | 65 (59.1%) |
| 15 to 17 Year Olds | 17 (63.0%) | 10 (37.0%) |
| 18 to 19 Year Olds | 42 (100.0%) | 0 (0.0%) |
| 20 to 24 Year Olds | 18 (75.0%) | 6 (25.0%) |
| 25 to 34 Year Olds | 0 (0.0%) | 0 (0.0%) |
| 35 Years and over | 3 (50.0%) | 3 (50.0%) |
| Total | 142 (55.3%) | 115 (44.7%) |
Educational Attainment by Field of Study in Coker
Education (32 | 22.9%), science & technology (18 | 12.9%), communications (14 | 10.0%), business (13 | 9.3%), and arts & humanities (12 | 8.6%) are the most common fields of study among 140 individuals in Coker who have obtained a bachelor's degree or higher.
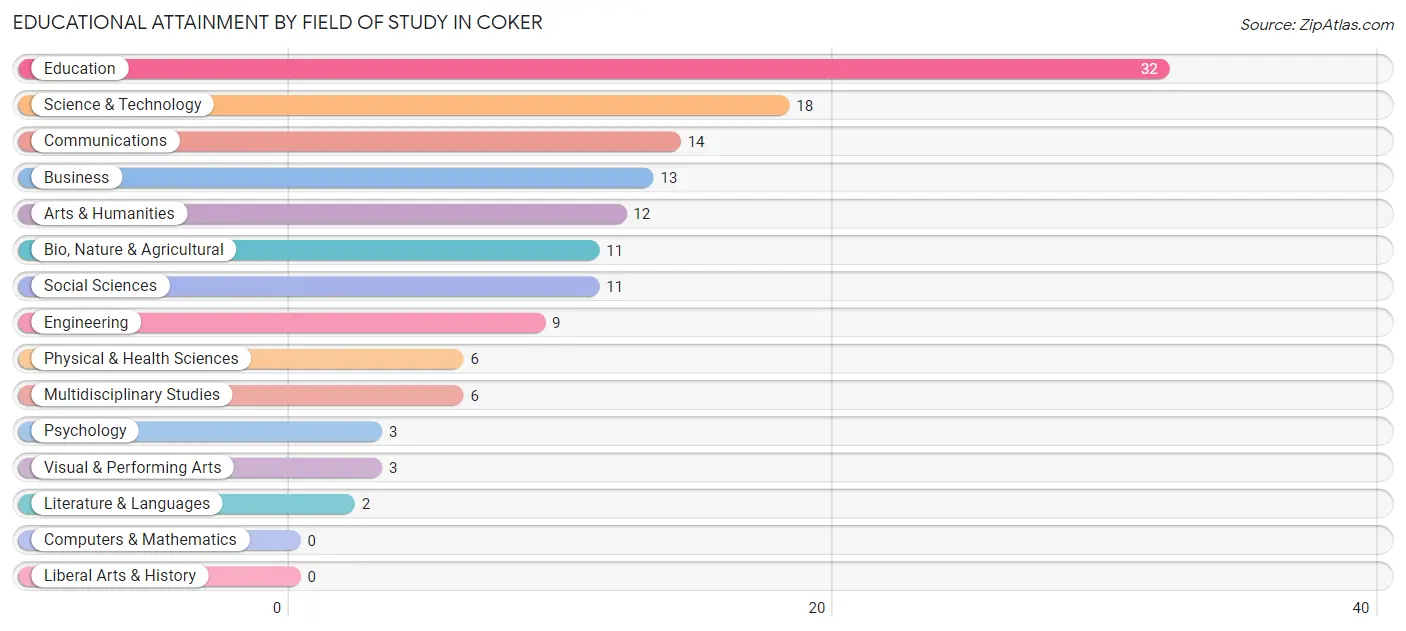
| Field of Study | # Graduates | % Graduates |
| Computers & Mathematics | 0 | 0.0% |
| Bio, Nature & Agricultural | 11 | 7.9% |
| Physical & Health Sciences | 6 | 4.3% |
| Psychology | 3 | 2.1% |
| Social Sciences | 11 | 7.9% |
| Engineering | 9 | 6.4% |
| Multidisciplinary Studies | 6 | 4.3% |
| Science & Technology | 18 | 12.9% |
| Business | 13 | 9.3% |
| Education | 32 | 22.9% |
| Literature & Languages | 2 | 1.4% |
| Liberal Arts & History | 0 | 0.0% |
| Visual & Performing Arts | 3 | 2.1% |
| Communications | 14 | 10.0% |
| Arts & Humanities | 12 | 8.6% |
| Total | 140 | 100.0% |
Transportation & Commute in Coker
Vehicle Availability by Sex in Coker
The most prevalent vehicle ownership categories in Coker are males with 3 vehicles (104, accounting for 40.5%) and females with 3 vehicles (41, making up 56.8%).

| Vehicles Available | Male | Female |
| No Vehicle | 9 (3.5%) | 4 (2.2%) |
| 1 Vehicle | 19 (7.4%) | 15 (8.2%) |
| 2 Vehicles | 85 (33.1%) | 57 (31.1%) |
| 3 Vehicles | 104 (40.5%) | 41 (22.4%) |
| 4 Vehicles | 31 (12.1%) | 60 (32.8%) |
| 5 or more Vehicles | 9 (3.5%) | 6 (3.3%) |
| Total | 257 (100.0%) | 183 (100.0%) |
Commute Time in Coker
The most frequently occuring commute durations in Coker are 10 to 14 minutes (89 commuters, 20.5%), 20 to 24 minutes (86 commuters, 19.8%), and 15 to 19 minutes (73 commuters, 16.8%).
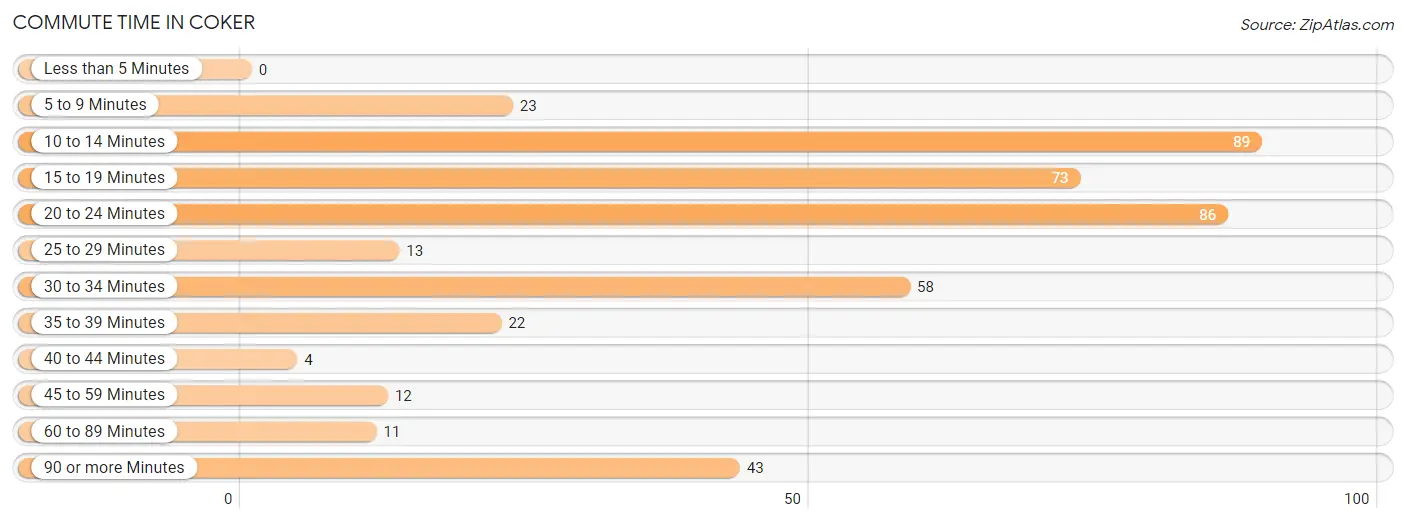
| Commute Time | # Commuters | % Commuters |
| Less than 5 Minutes | 0 | 0.0% |
| 5 to 9 Minutes | 23 | 5.3% |
| 10 to 14 Minutes | 89 | 20.5% |
| 15 to 19 Minutes | 73 | 16.8% |
| 20 to 24 Minutes | 86 | 19.8% |
| 25 to 29 Minutes | 13 | 3.0% |
| 30 to 34 Minutes | 58 | 13.4% |
| 35 to 39 Minutes | 22 | 5.1% |
| 40 to 44 Minutes | 4 | 0.9% |
| 45 to 59 Minutes | 12 | 2.8% |
| 60 to 89 Minutes | 11 | 2.5% |
| 90 or more Minutes | 43 | 9.9% |
Commute Time by Sex in Coker
The most common commute times in Coker are 10 to 14 minutes (47 commuters, 18.3%) for males and 20 to 24 minutes (48 commuters, 27.1%) for females.
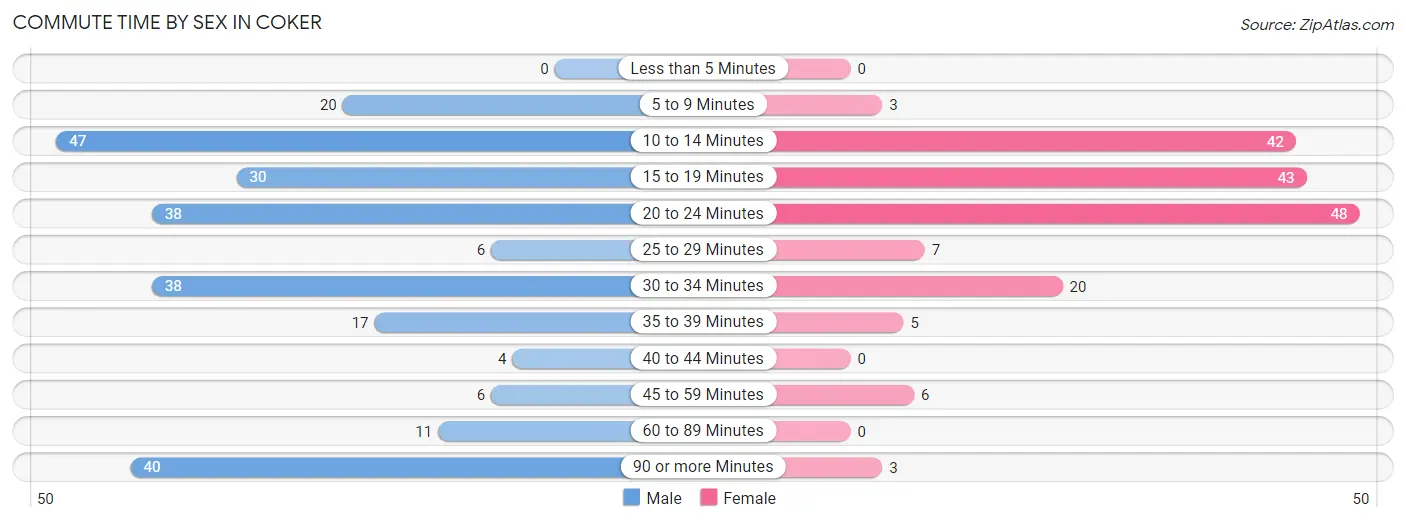
| Commute Time | Male | Female |
| Less than 5 Minutes | 0 (0.0%) | 0 (0.0%) |
| 5 to 9 Minutes | 20 (7.8%) | 3 (1.7%) |
| 10 to 14 Minutes | 47 (18.3%) | 42 (23.7%) |
| 15 to 19 Minutes | 30 (11.7%) | 43 (24.3%) |
| 20 to 24 Minutes | 38 (14.8%) | 48 (27.1%) |
| 25 to 29 Minutes | 6 (2.3%) | 7 (4.0%) |
| 30 to 34 Minutes | 38 (14.8%) | 20 (11.3%) |
| 35 to 39 Minutes | 17 (6.6%) | 5 (2.8%) |
| 40 to 44 Minutes | 4 (1.6%) | 0 (0.0%) |
| 45 to 59 Minutes | 6 (2.3%) | 6 (3.4%) |
| 60 to 89 Minutes | 11 (4.3%) | 0 (0.0%) |
| 90 or more Minutes | 40 (15.6%) | 3 (1.7%) |
Time of Departure to Work by Sex in Coker
The most frequent times of departure to work in Coker are 5:30 AM to 5:59 AM (53, 20.6%) for males and 7:00 AM to 7:29 AM (44, 24.9%) for females.
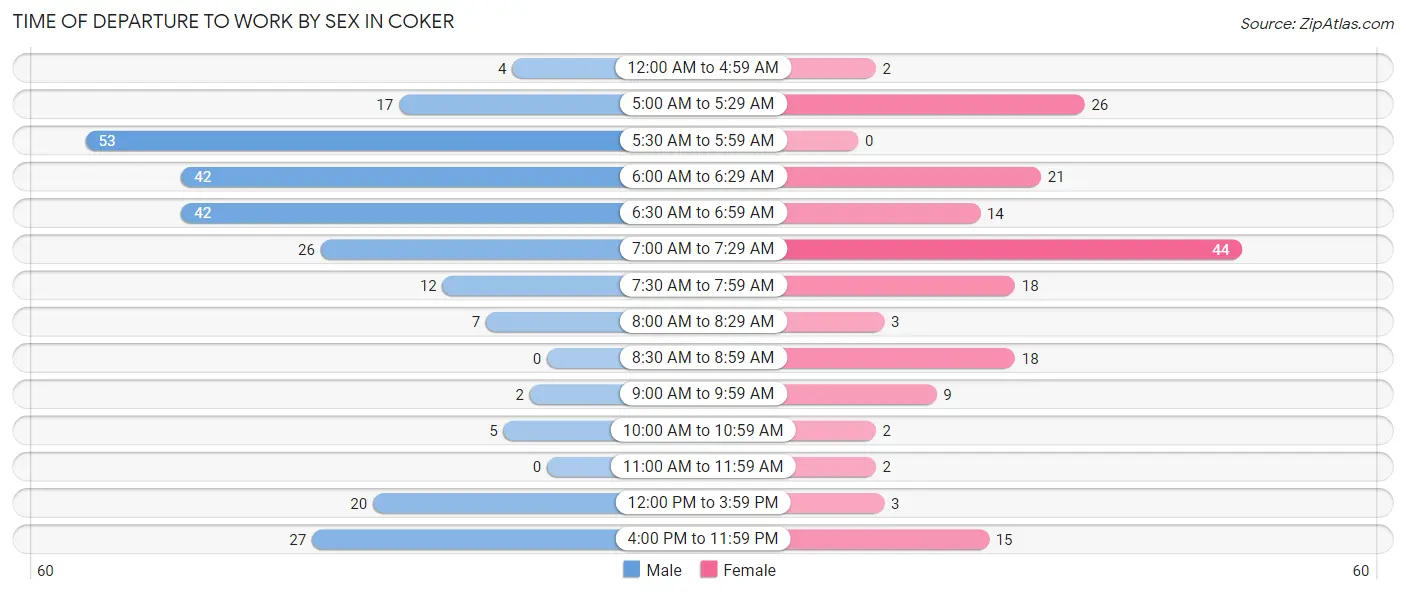
| Time of Departure | Male | Female |
| 12:00 AM to 4:59 AM | 4 (1.6%) | 2 (1.1%) |
| 5:00 AM to 5:29 AM | 17 (6.6%) | 26 (14.7%) |
| 5:30 AM to 5:59 AM | 53 (20.6%) | 0 (0.0%) |
| 6:00 AM to 6:29 AM | 42 (16.3%) | 21 (11.9%) |
| 6:30 AM to 6:59 AM | 42 (16.3%) | 14 (7.9%) |
| 7:00 AM to 7:29 AM | 26 (10.1%) | 44 (24.9%) |
| 7:30 AM to 7:59 AM | 12 (4.7%) | 18 (10.2%) |
| 8:00 AM to 8:29 AM | 7 (2.7%) | 3 (1.7%) |
| 8:30 AM to 8:59 AM | 0 (0.0%) | 18 (10.2%) |
| 9:00 AM to 9:59 AM | 2 (0.8%) | 9 (5.1%) |
| 10:00 AM to 10:59 AM | 5 (1.9%) | 2 (1.1%) |
| 11:00 AM to 11:59 AM | 0 (0.0%) | 2 (1.1%) |
| 12:00 PM to 3:59 PM | 20 (7.8%) | 3 (1.7%) |
| 4:00 PM to 11:59 PM | 27 (10.5%) | 15 (8.5%) |
| Total | 257 (100.0%) | 177 (100.0%) |
Housing Occupancy in Coker
Occupancy by Ownership in Coker
Of the total 386 dwellings in Coker, owner-occupied units account for 341 (88.3%), while renter-occupied units make up 45 (11.7%).
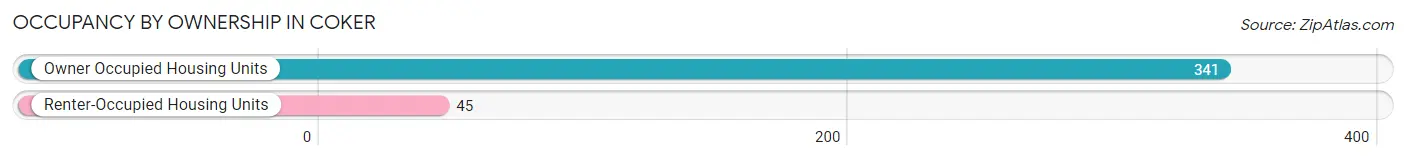
| Occupancy | # Housing Units | % Housing Units |
| Owner Occupied Housing Units | 341 | 88.3% |
| Renter-Occupied Housing Units | 45 | 11.7% |
| Total Occupied Housing Units | 386 | 100.0% |
Occupancy by Household Size in Coker
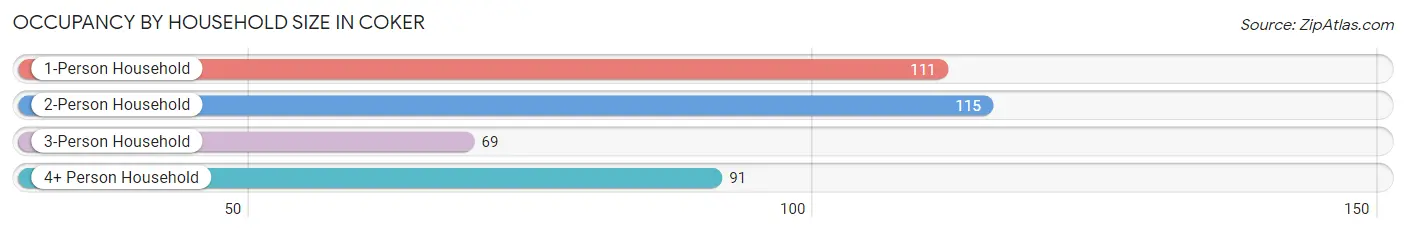
| Household Size | # Housing Units | % Housing Units |
| 1-Person Household | 111 | 28.8% |
| 2-Person Household | 115 | 29.8% |
| 3-Person Household | 69 | 17.9% |
| 4+ Person Household | 91 | 23.6% |
| Total Housing Units | 386 | 100.0% |
Occupancy by Ownership by Household Size in Coker
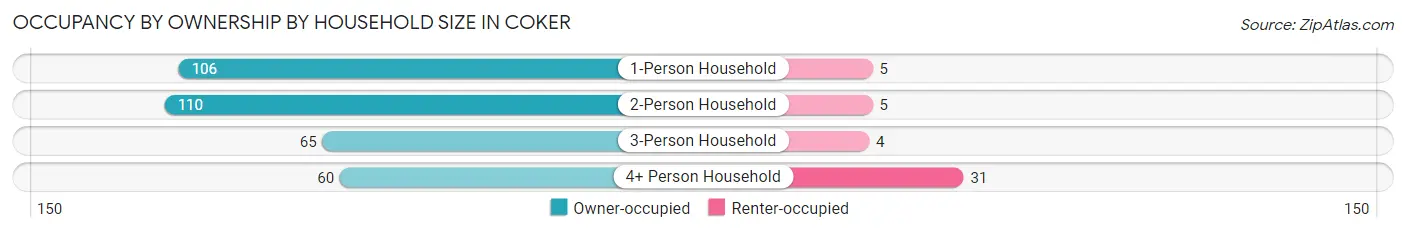
| Household Size | Owner-occupied | Renter-occupied |
| 1-Person Household | 106 (95.5%) | 5 (4.5%) |
| 2-Person Household | 110 (95.7%) | 5 (4.3%) |
| 3-Person Household | 65 (94.2%) | 4 (5.8%) |
| 4+ Person Household | 60 (65.9%) | 31 (34.1%) |
| Total Housing Units | 341 (88.3%) | 45 (11.7%) |
Occupancy by Educational Attainment in Coker
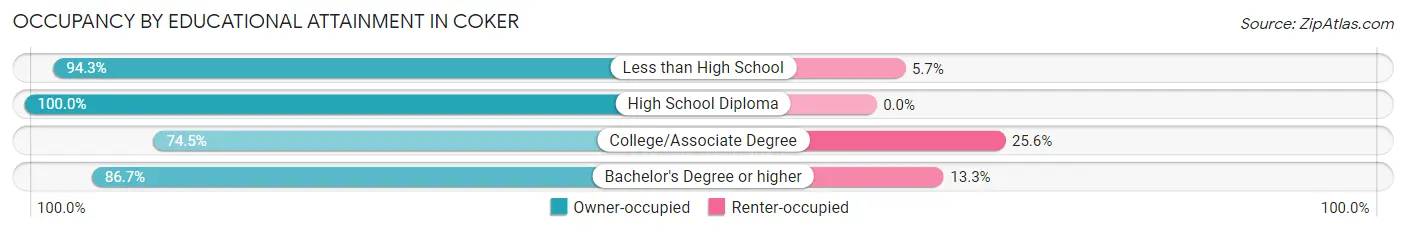
| Household Size | Owner-occupied | Renter-occupied |
| Less than High School | 33 (94.3%) | 2 (5.7%) |
| High School Diploma | 154 (100.0%) | 0 (0.0%) |
| College/Associate Degree | 102 (74.5%) | 35 (25.6%) |
| Bachelor's Degree or higher | 52 (86.7%) | 8 (13.3%) |
Occupancy by Age of Householder in Coker
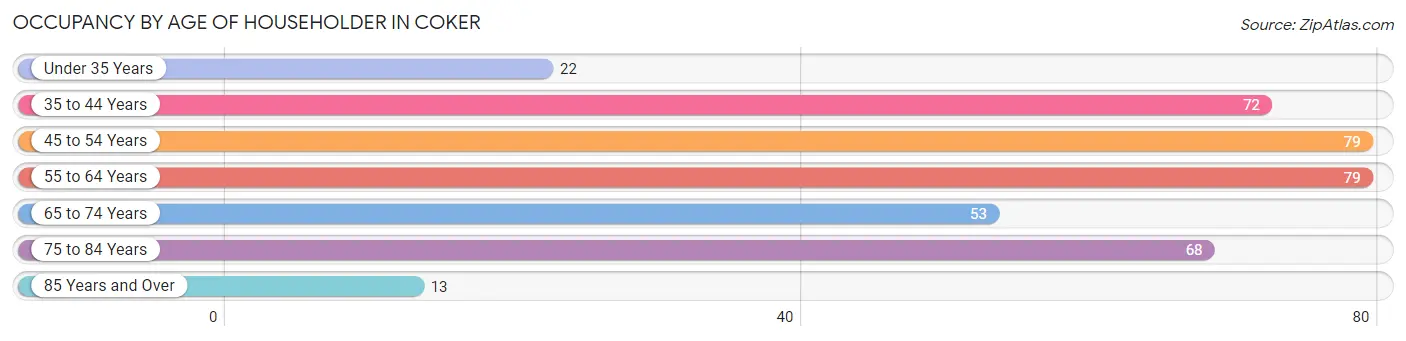
| Age Bracket | # Households | % Households |
| Under 35 Years | 22 | 5.7% |
| 35 to 44 Years | 72 | 18.6% |
| 45 to 54 Years | 79 | 20.5% |
| 55 to 64 Years | 79 | 20.5% |
| 65 to 74 Years | 53 | 13.7% |
| 75 to 84 Years | 68 | 17.6% |
| 85 Years and Over | 13 | 3.4% |
| Total | 386 | 100.0% |
Housing Finances in Coker
Median Income by Occupancy in Coker
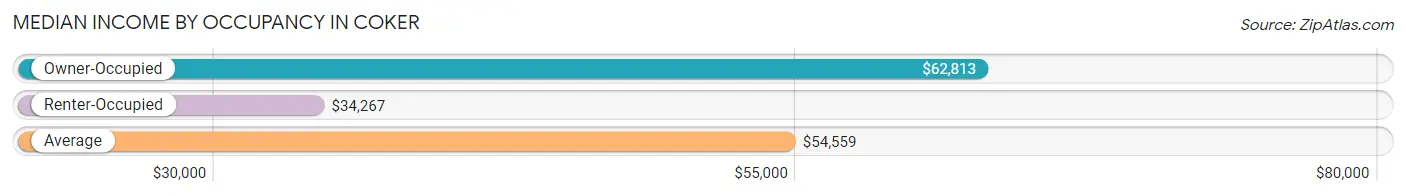
| Occupancy Type | # Households | Median Income |
| Owner-Occupied | 341 (88.3%) | $62,813 |
| Renter-Occupied | 45 (11.7%) | $34,267 |
| Average | 386 (100.0%) | $54,559 |
Occupancy by Householder Income Bracket in Coker
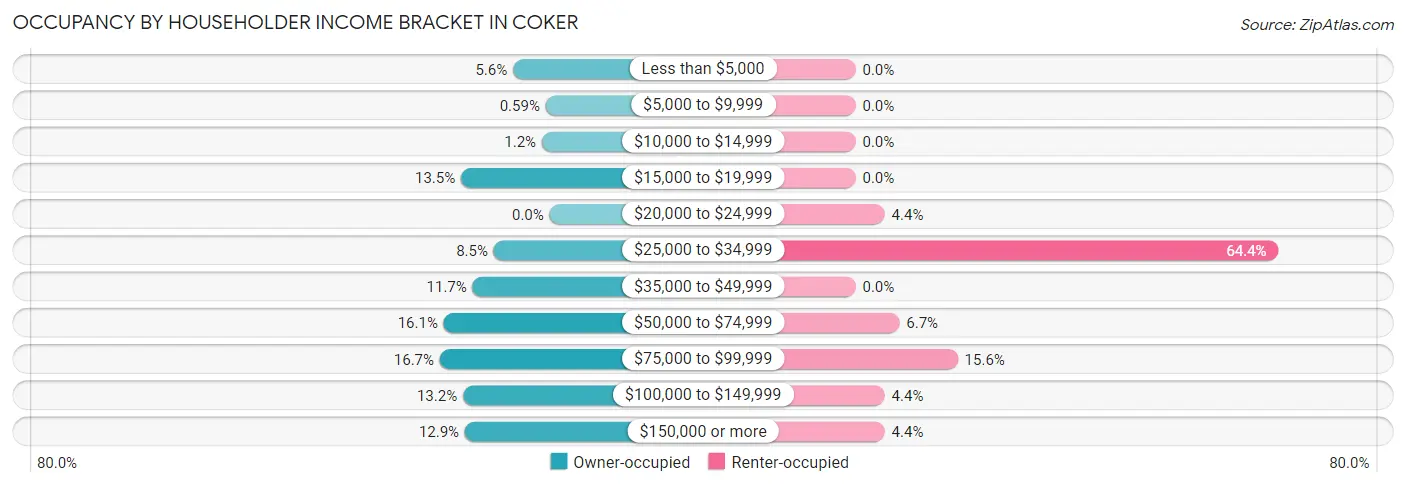
| Income Bracket | Owner-occupied | Renter-occupied |
| Less than $5,000 | 19 (5.6%) | 0 (0.0%) |
| $5,000 to $9,999 | 2 (0.6%) | 0 (0.0%) |
| $10,000 to $14,999 | 4 (1.2%) | 0 (0.0%) |
| $15,000 to $19,999 | 46 (13.5%) | 0 (0.0%) |
| $20,000 to $24,999 | 0 (0.0%) | 2 (4.4%) |
| $25,000 to $34,999 | 29 (8.5%) | 29 (64.4%) |
| $35,000 to $49,999 | 40 (11.7%) | 0 (0.0%) |
| $50,000 to $74,999 | 55 (16.1%) | 3 (6.7%) |
| $75,000 to $99,999 | 57 (16.7%) | 7 (15.6%) |
| $100,000 to $149,999 | 45 (13.2%) | 2 (4.4%) |
| $150,000 or more | 44 (12.9%) | 2 (4.4%) |
| Total | 341 (100.0%) | 45 (100.0%) |
Monthly Housing Cost Tiers in Coker
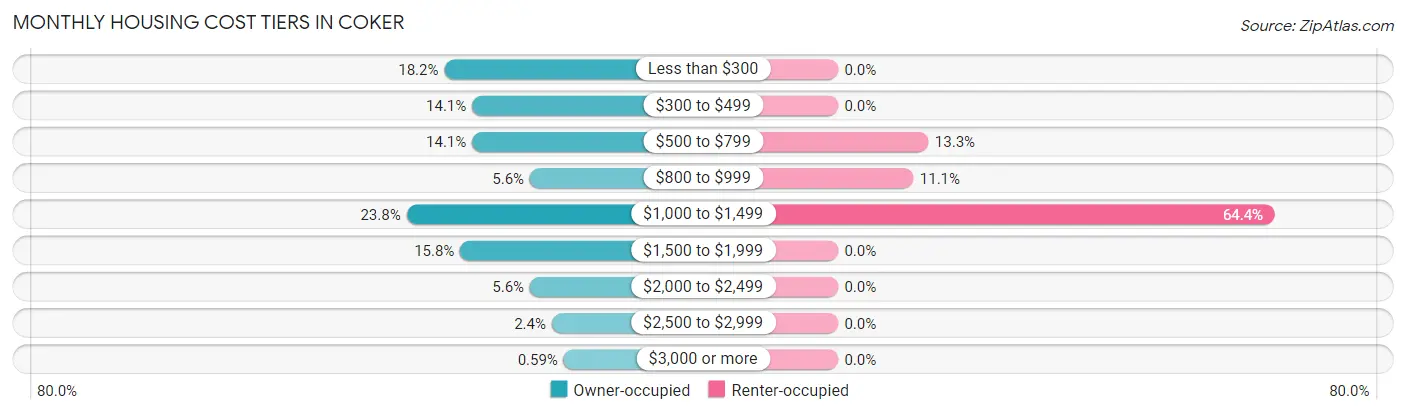
| Monthly Cost | Owner-occupied | Renter-occupied |
| Less than $300 | 62 (18.2%) | 0 (0.0%) |
| $300 to $499 | 48 (14.1%) | 0 (0.0%) |
| $500 to $799 | 48 (14.1%) | 6 (13.3%) |
| $800 to $999 | 19 (5.6%) | 5 (11.1%) |
| $1,000 to $1,499 | 81 (23.7%) | 29 (64.4%) |
| $1,500 to $1,999 | 54 (15.8%) | 0 (0.0%) |
| $2,000 to $2,499 | 19 (5.6%) | 0 (0.0%) |
| $2,500 to $2,999 | 8 (2.4%) | 0 (0.0%) |
| $3,000 or more | 2 (0.6%) | 0 (0.0%) |
| Total | 341 (100.0%) | 45 (100.0%) |
Physical Housing Characteristics in Coker
Housing Structures in Coker
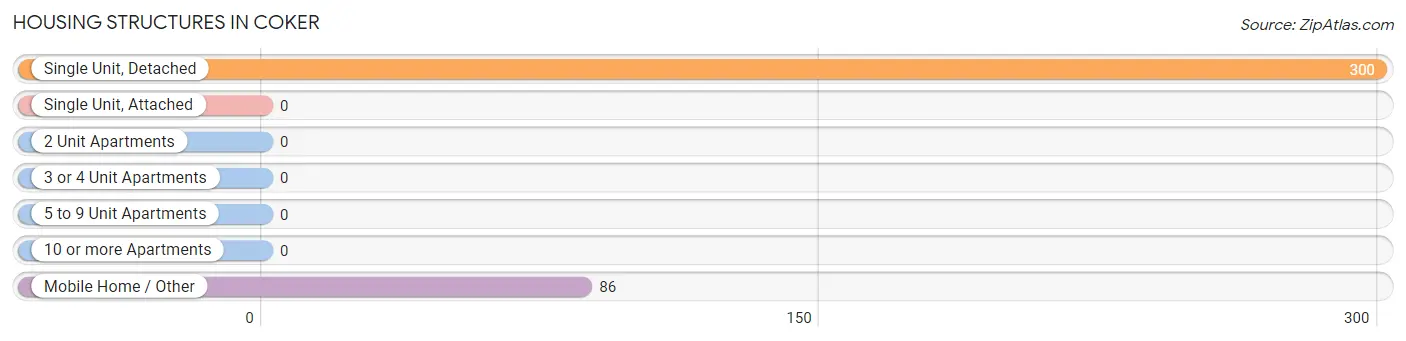
| Structure Type | # Housing Units | % Housing Units |
| Single Unit, Detached | 300 | 77.7% |
| Single Unit, Attached | 0 | 0.0% |
| 2 Unit Apartments | 0 | 0.0% |
| 3 or 4 Unit Apartments | 0 | 0.0% |
| 5 to 9 Unit Apartments | 0 | 0.0% |
| 10 or more Apartments | 0 | 0.0% |
| Mobile Home / Other | 86 | 22.3% |
| Total | 386 | 100.0% |
Housing Structures by Occupancy in Coker
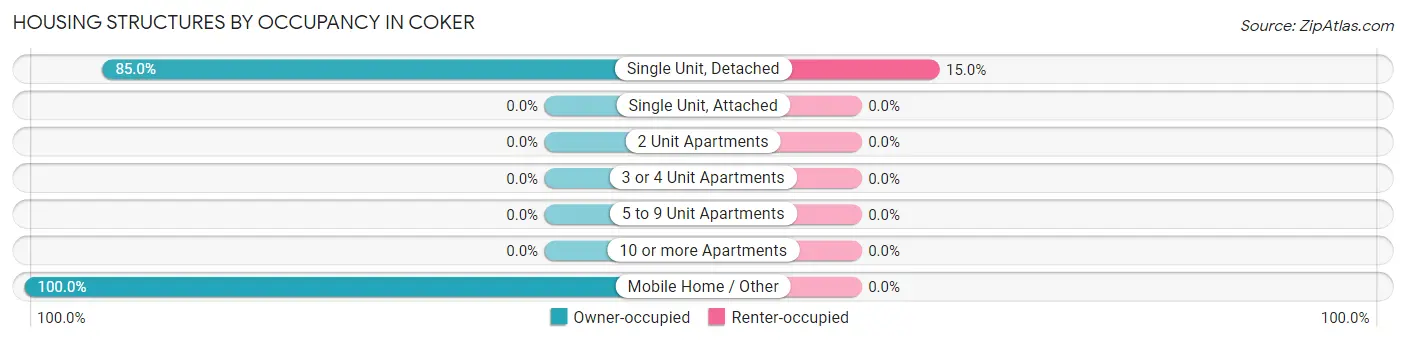
| Structure Type | Owner-occupied | Renter-occupied |
| Single Unit, Detached | 255 (85.0%) | 45 (15.0%) |
| Single Unit, Attached | 0 (0.0%) | 0 (0.0%) |
| 2 Unit Apartments | 0 (0.0%) | 0 (0.0%) |
| 3 or 4 Unit Apartments | 0 (0.0%) | 0 (0.0%) |
| 5 to 9 Unit Apartments | 0 (0.0%) | 0 (0.0%) |
| 10 or more Apartments | 0 (0.0%) | 0 (0.0%) |
| Mobile Home / Other | 86 (100.0%) | 0 (0.0%) |
| Total | 341 (88.3%) | 45 (11.7%) |
Housing Structures by Number of Rooms in Coker
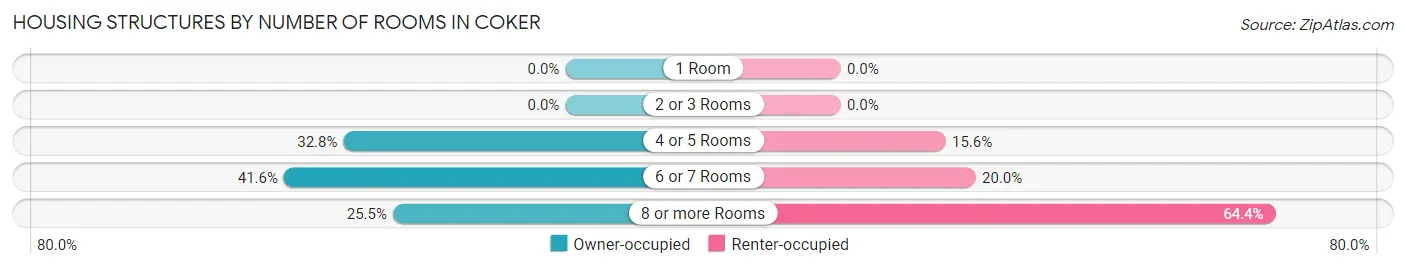
| Number of Rooms | Owner-occupied | Renter-occupied |
| 1 Room | 0 (0.0%) | 0 (0.0%) |
| 2 or 3 Rooms | 0 (0.0%) | 0 (0.0%) |
| 4 or 5 Rooms | 112 (32.8%) | 7 (15.6%) |
| 6 or 7 Rooms | 142 (41.6%) | 9 (20.0%) |
| 8 or more Rooms | 87 (25.5%) | 29 (64.4%) |
| Total | 341 (100.0%) | 45 (100.0%) |
Housing Structure by Heating Type in Coker
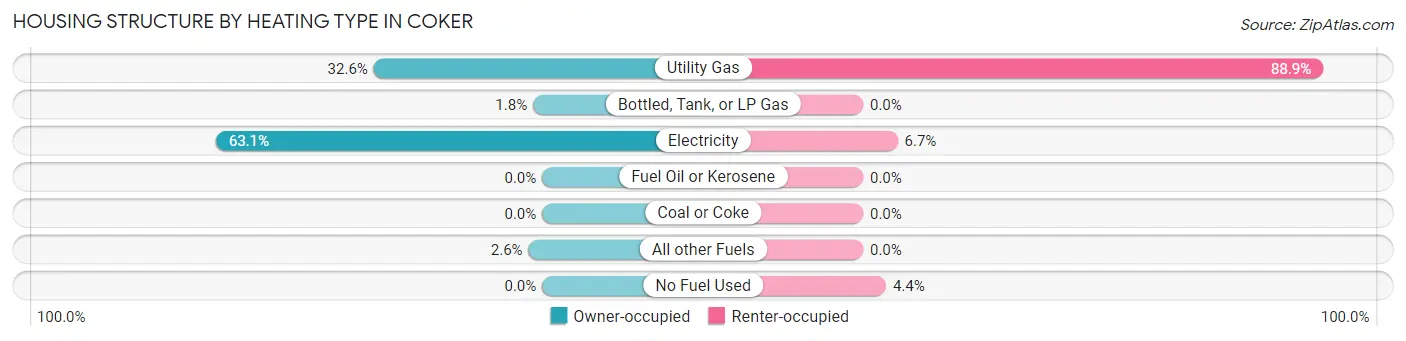
| Heating Type | Owner-occupied | Renter-occupied |
| Utility Gas | 111 (32.6%) | 40 (88.9%) |
| Bottled, Tank, or LP Gas | 6 (1.8%) | 0 (0.0%) |
| Electricity | 215 (63.0%) | 3 (6.7%) |
| Fuel Oil or Kerosene | 0 (0.0%) | 0 (0.0%) |
| Coal or Coke | 0 (0.0%) | 0 (0.0%) |
| All other Fuels | 9 (2.6%) | 0 (0.0%) |
| No Fuel Used | 0 (0.0%) | 2 (4.4%) |
| Total | 341 (100.0%) | 45 (100.0%) |
Household Vehicle Usage in Coker
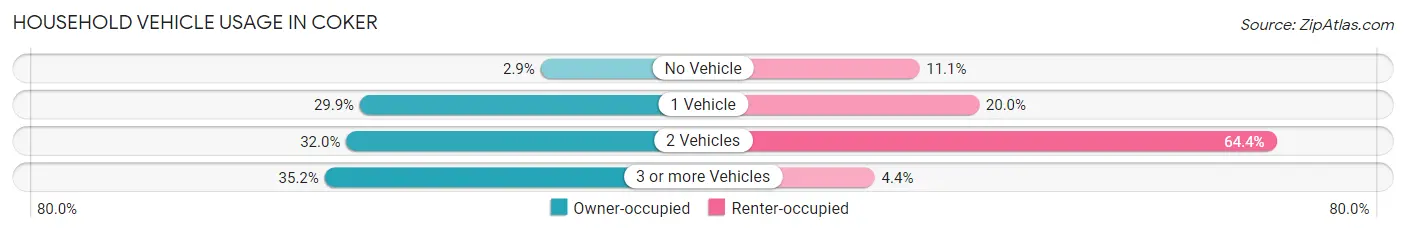
| Vehicles per Household | Owner-occupied | Renter-occupied |
| No Vehicle | 10 (2.9%) | 5 (11.1%) |
| 1 Vehicle | 102 (29.9%) | 9 (20.0%) |
| 2 Vehicles | 109 (32.0%) | 29 (64.4%) |
| 3 or more Vehicles | 120 (35.2%) | 2 (4.4%) |
| Total | 341 (100.0%) | 45 (100.0%) |
Real Estate & Mortgages in Coker
Real Estate and Mortgage Overview in Coker
| Characteristic | Without Mortgage | With Mortgage |
| Housing Units | 155 | 186 |
| Median Property Value | $130,200 | $215,700 |
| Median Household Income | $31,641 | $35 |
| Monthly Housing Costs | $351 | $2 |
| Real Estate Taxes | $256 | $28 |
Property Value by Mortgage Status in Coker
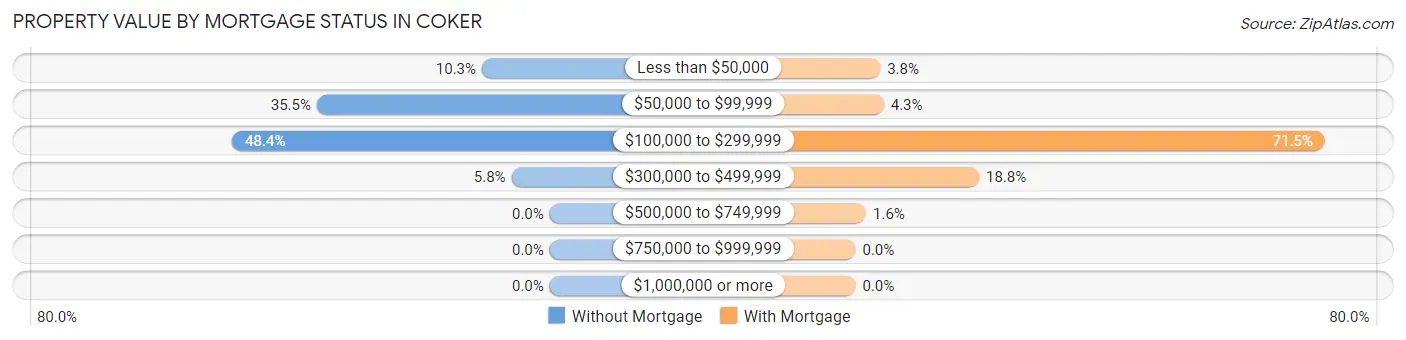
| Property Value | Without Mortgage | With Mortgage |
| Less than $50,000 | 16 (10.3%) | 7 (3.8%) |
| $50,000 to $99,999 | 55 (35.5%) | 8 (4.3%) |
| $100,000 to $299,999 | 75 (48.4%) | 133 (71.5%) |
| $300,000 to $499,999 | 9 (5.8%) | 35 (18.8%) |
| $500,000 to $749,999 | 0 (0.0%) | 3 (1.6%) |
| $750,000 to $999,999 | 0 (0.0%) | 0 (0.0%) |
| $1,000,000 or more | 0 (0.0%) | 0 (0.0%) |
| Total | 155 (100.0%) | 186 (100.0%) |
Household Income by Mortgage Status in Coker
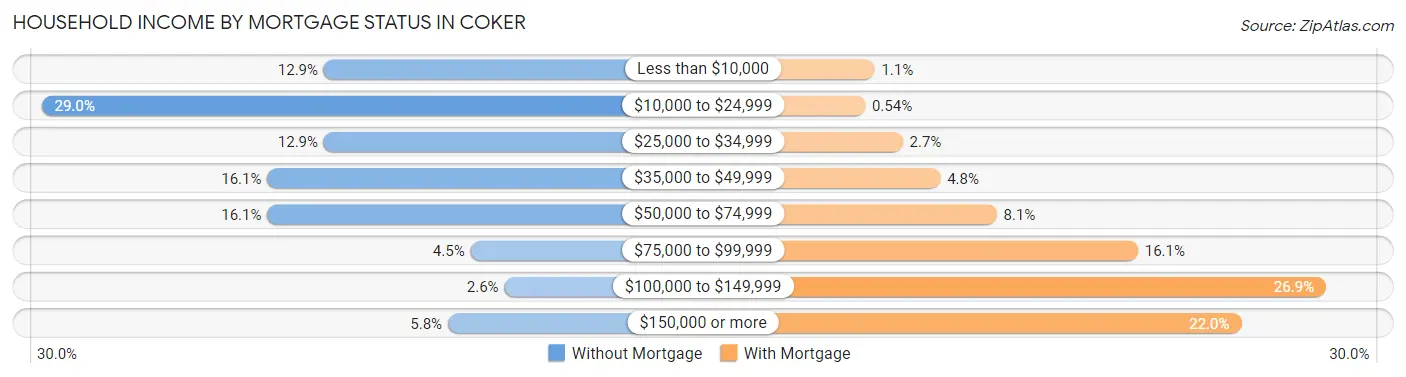
| Household Income | Without Mortgage | With Mortgage |
| Less than $10,000 | 20 (12.9%) | 2 (1.1%) |
| $10,000 to $24,999 | 45 (29.0%) | 1 (0.5%) |
| $25,000 to $34,999 | 20 (12.9%) | 5 (2.7%) |
| $35,000 to $49,999 | 25 (16.1%) | 9 (4.8%) |
| $50,000 to $74,999 | 25 (16.1%) | 15 (8.1%) |
| $75,000 to $99,999 | 7 (4.5%) | 30 (16.1%) |
| $100,000 to $149,999 | 4 (2.6%) | 50 (26.9%) |
| $150,000 or more | 9 (5.8%) | 41 (22.0%) |
| Total | 155 (100.0%) | 186 (100.0%) |
Property Value to Household Income Ratio in Coker
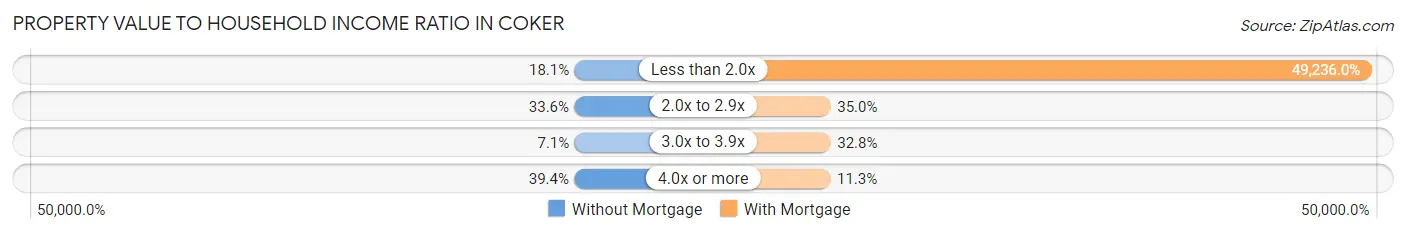
| Value-to-Income Ratio | Without Mortgage | With Mortgage |
| Less than 2.0x | 28 (18.1%) | 91,579 (49,236.0%) |
| 2.0x to 2.9x | 52 (33.6%) | 65 (34.9%) |
| 3.0x to 3.9x | 11 (7.1%) | 61 (32.8%) |
| 4.0x or more | 61 (39.4%) | 21 (11.3%) |
| Total | 155 (100.0%) | 186 (100.0%) |
Real Estate Taxes by Mortgage Status in Coker
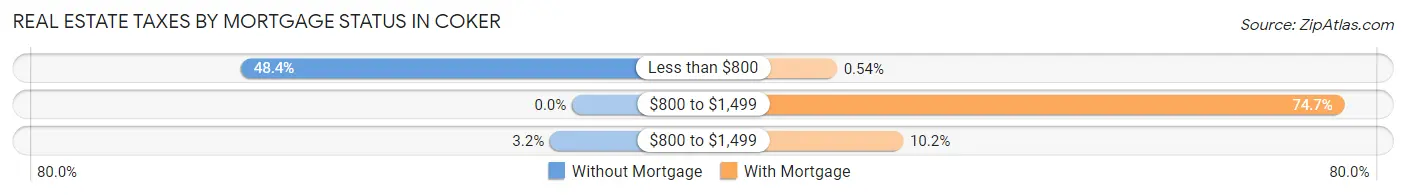
| Property Taxes | Without Mortgage | With Mortgage |
| Less than $800 | 75 (48.4%) | 1 (0.5%) |
| $800 to $1,499 | 0 (0.0%) | 139 (74.7%) |
| $800 to $1,499 | 5 (3.2%) | 19 (10.2%) |
| Total | 155 (100.0%) | 186 (100.0%) |
Health & Disability in Coker
Health Insurance Coverage by Age in Coker
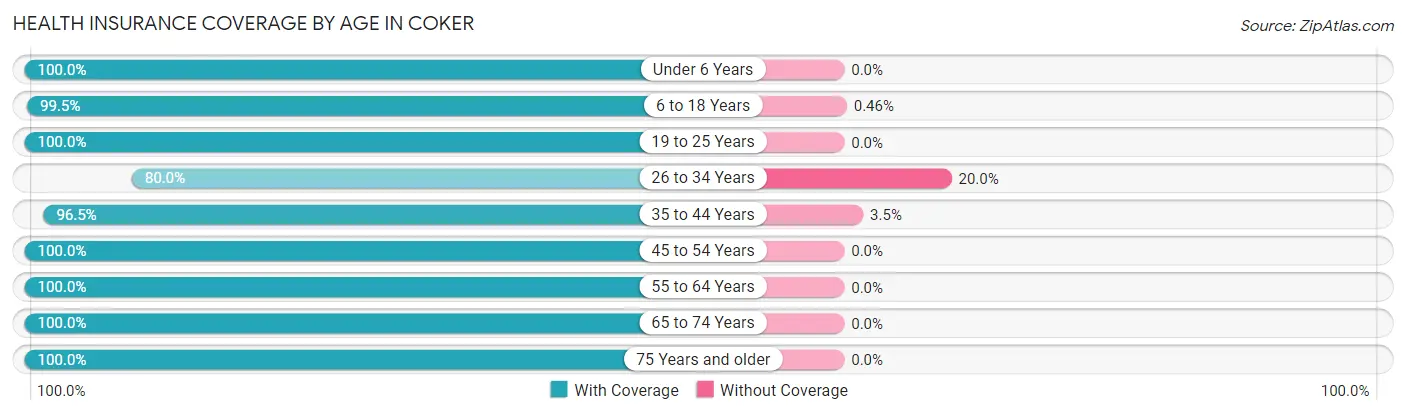
| Age Bracket | With Coverage | Without Coverage |
| Under 6 Years | 41 (100.0%) | 0 (0.0%) |
| 6 to 18 Years | 218 (99.5%) | 1 (0.5%) |
| 19 to 25 Years | 90 (100.0%) | 0 (0.0%) |
| 26 to 34 Years | 36 (80.0%) | 9 (20.0%) |
| 35 to 44 Years | 137 (96.5%) | 5 (3.5%) |
| 45 to 54 Years | 158 (100.0%) | 0 (0.0%) |
| 55 to 64 Years | 123 (100.0%) | 0 (0.0%) |
| 65 to 74 Years | 93 (100.0%) | 0 (0.0%) |
| 75 Years and older | 95 (100.0%) | 0 (0.0%) |
| Total | 991 (98.5%) | 15 (1.5%) |
Health Insurance Coverage by Citizenship Status in Coker
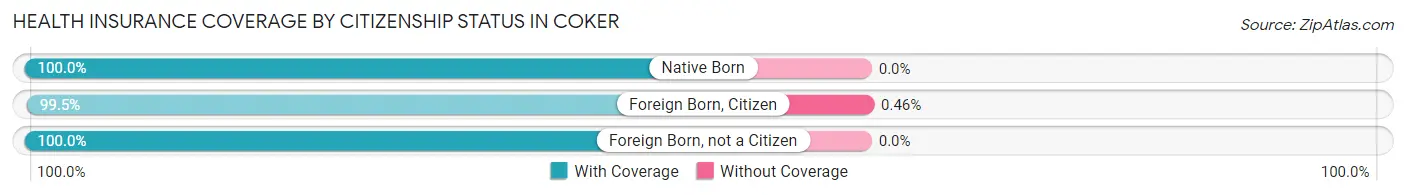
| Citizenship Status | With Coverage | Without Coverage |
| Native Born | 41 (100.0%) | 0 (0.0%) |
| Foreign Born, Citizen | 218 (99.5%) | 1 (0.5%) |
| Foreign Born, not a Citizen | 90 (100.0%) | 0 (0.0%) |
Health Insurance Coverage by Household Income in Coker
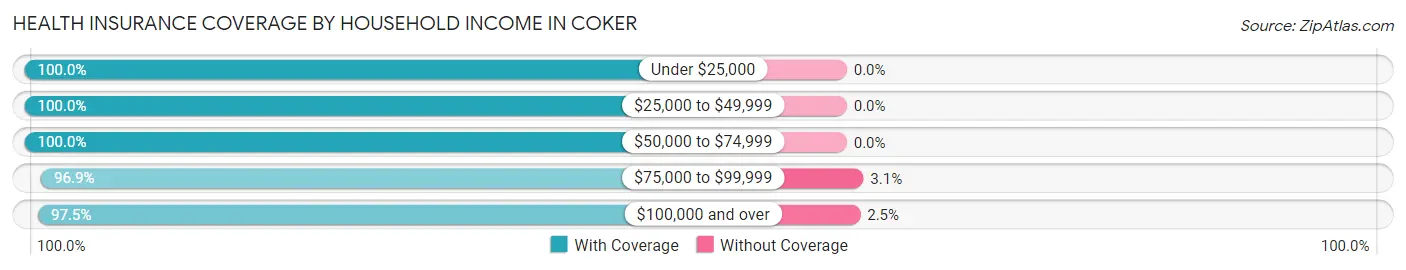
| Household Income | With Coverage | Without Coverage |
| Under $25,000 | 103 (100.0%) | 0 (0.0%) |
| $25,000 to $49,999 | 236 (100.0%) | 0 (0.0%) |
| $50,000 to $74,999 | 118 (100.0%) | 0 (0.0%) |
| $75,000 to $99,999 | 187 (96.9%) | 6 (3.1%) |
| $100,000 and over | 347 (97.5%) | 9 (2.5%) |
Public vs Private Health Insurance Coverage by Age in Coker
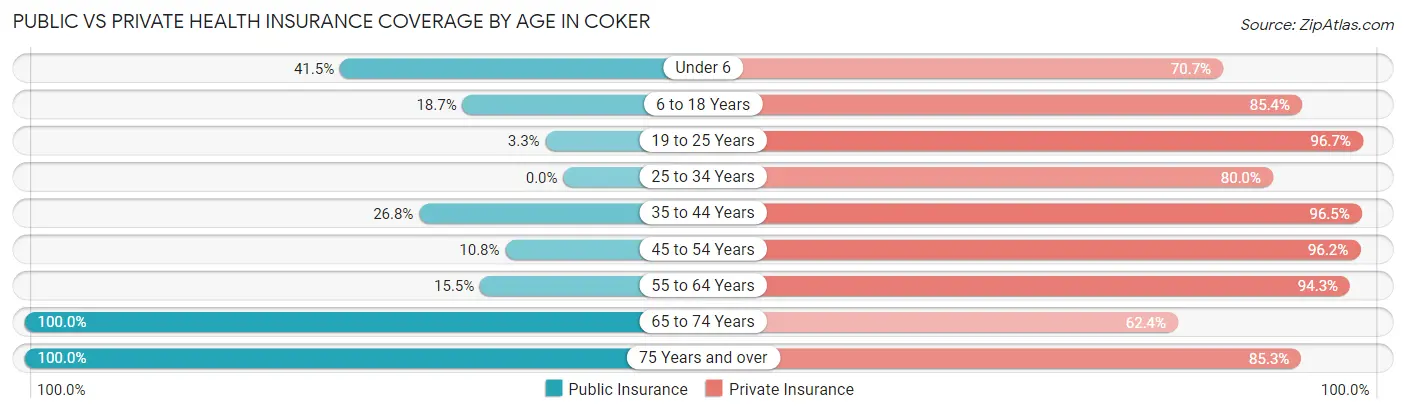
| Age Bracket | Public Insurance | Private Insurance |
| Under 6 | 17 (41.5%) | 29 (70.7%) |
| 6 to 18 Years | 41 (18.7%) | 187 (85.4%) |
| 19 to 25 Years | 3 (3.3%) | 87 (96.7%) |
| 25 to 34 Years | 0 (0.0%) | 36 (80.0%) |
| 35 to 44 Years | 38 (26.8%) | 137 (96.5%) |
| 45 to 54 Years | 17 (10.8%) | 152 (96.2%) |
| 55 to 64 Years | 19 (15.4%) | 116 (94.3%) |
| 65 to 74 Years | 93 (100.0%) | 58 (62.4%) |
| 75 Years and over | 95 (100.0%) | 81 (85.3%) |
| Total | 323 (32.1%) | 883 (87.8%) |
Disability Status by Sex by Age in Coker
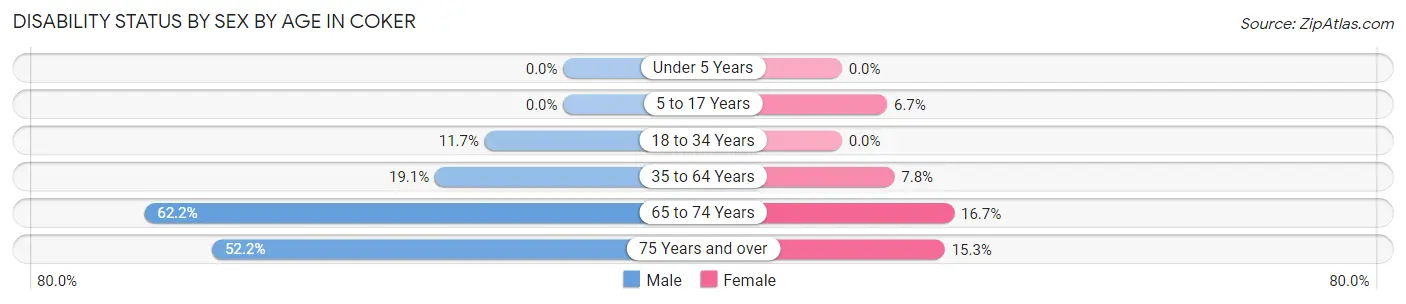
| Age Bracket | Male | Female |
| Under 5 Years | 0 (0.0%) | 0 (0.0%) |
| 5 to 17 Years | 0 (0.0%) | 8 (6.7%) |
| 18 to 34 Years | 14 (11.7%) | 0 (0.0%) |
| 35 to 64 Years | 44 (19.1%) | 15 (7.8%) |
| 65 to 74 Years | 28 (62.2%) | 8 (16.7%) |
| 75 Years and over | 12 (52.2%) | 11 (15.3%) |
Disability Class by Sex by Age in Coker
Disability Class: Hearing Difficulty
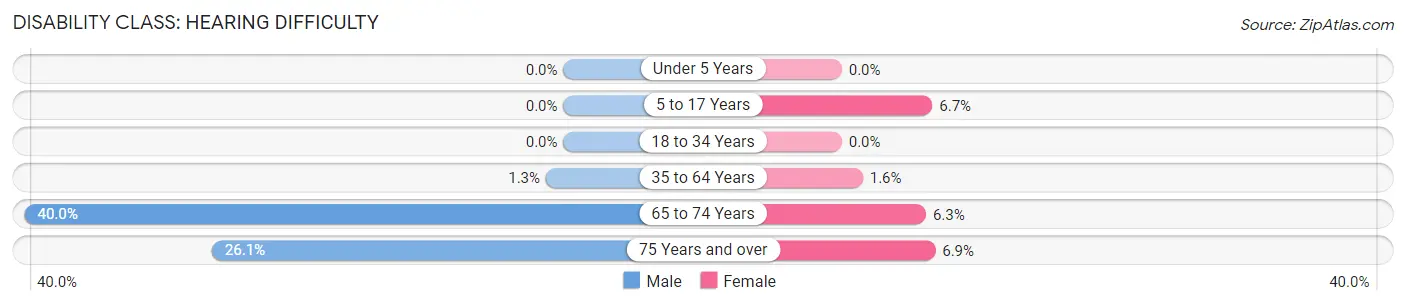
| Age Bracket | Male | Female |
| Under 5 Years | 0 (0.0%) | 0 (0.0%) |
| 5 to 17 Years | 0 (0.0%) | 8 (6.7%) |
| 18 to 34 Years | 0 (0.0%) | 0 (0.0%) |
| 35 to 64 Years | 3 (1.3%) | 3 (1.6%) |
| 65 to 74 Years | 18 (40.0%) | 3 (6.2%) |
| 75 Years and over | 6 (26.1%) | 5 (6.9%) |
Disability Class: Vision Difficulty
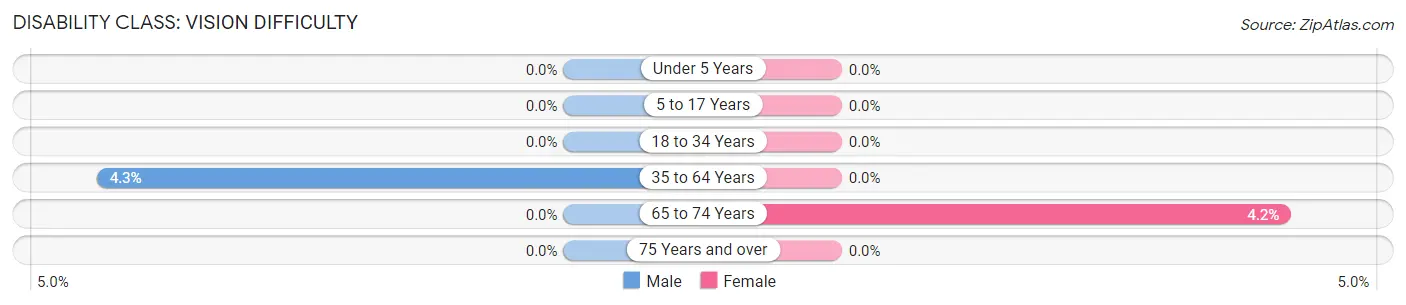
| Age Bracket | Male | Female |
| Under 5 Years | 0 (0.0%) | 0 (0.0%) |
| 5 to 17 Years | 0 (0.0%) | 0 (0.0%) |
| 18 to 34 Years | 0 (0.0%) | 0 (0.0%) |
| 35 to 64 Years | 10 (4.3%) | 0 (0.0%) |
| 65 to 74 Years | 0 (0.0%) | 2 (4.2%) |
| 75 Years and over | 0 (0.0%) | 0 (0.0%) |
Disability Class: Cognitive Difficulty
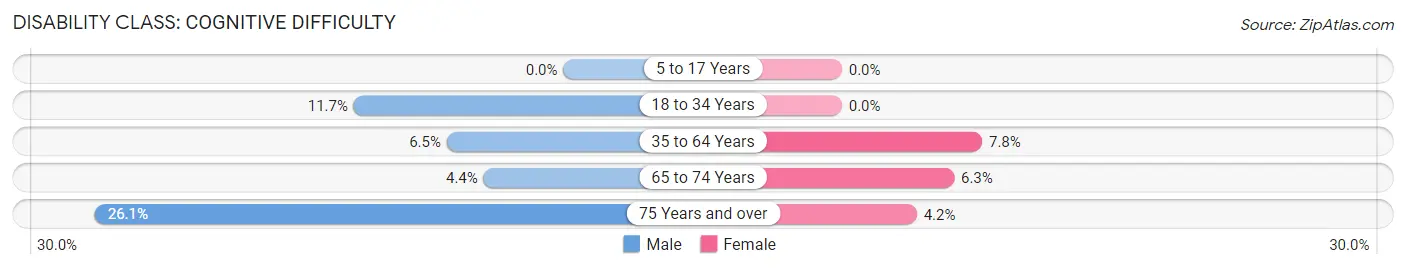
| Age Bracket | Male | Female |
| 5 to 17 Years | 0 (0.0%) | 0 (0.0%) |
| 18 to 34 Years | 14 (11.7%) | 0 (0.0%) |
| 35 to 64 Years | 15 (6.5%) | 15 (7.8%) |
| 65 to 74 Years | 2 (4.4%) | 3 (6.2%) |
| 75 Years and over | 6 (26.1%) | 3 (4.2%) |
Disability Class: Ambulatory Difficulty
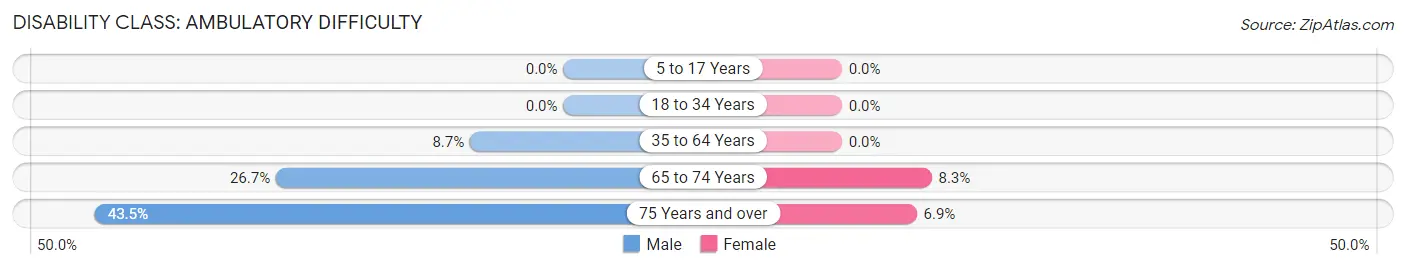
| Age Bracket | Male | Female |
| 5 to 17 Years | 0 (0.0%) | 0 (0.0%) |
| 18 to 34 Years | 0 (0.0%) | 0 (0.0%) |
| 35 to 64 Years | 20 (8.7%) | 0 (0.0%) |
| 65 to 74 Years | 12 (26.7%) | 4 (8.3%) |
| 75 Years and over | 10 (43.5%) | 5 (6.9%) |
Disability Class: Self-Care Difficulty
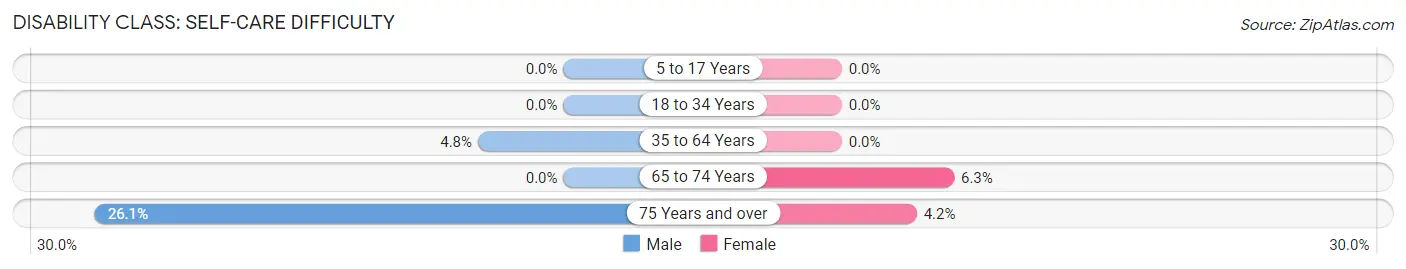
| Age Bracket | Male | Female |
| 5 to 17 Years | 0 (0.0%) | 0 (0.0%) |
| 18 to 34 Years | 0 (0.0%) | 0 (0.0%) |
| 35 to 64 Years | 11 (4.8%) | 0 (0.0%) |
| 65 to 74 Years | 0 (0.0%) | 3 (6.2%) |
| 75 Years and over | 6 (26.1%) | 3 (4.2%) |
Technology Access in Coker
Computing Device Access in Coker
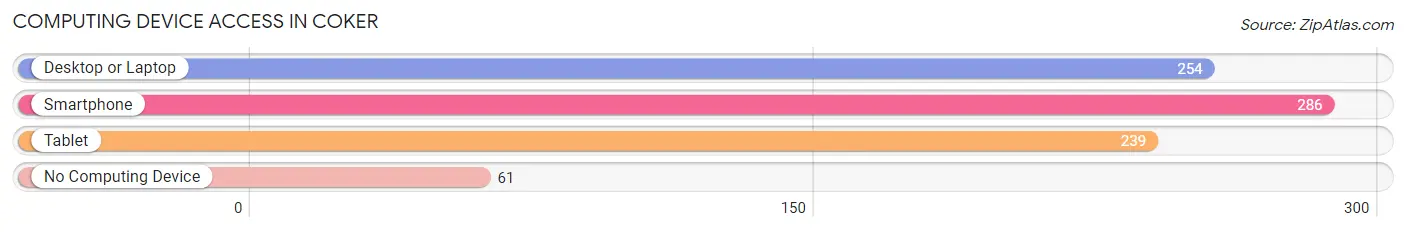
| Device Type | # Households | % Households |
| Desktop or Laptop | 254 | 65.8% |
| Smartphone | 286 | 74.1% |
| Tablet | 239 | 61.9% |
| No Computing Device | 61 | 15.8% |
| Total | 386 | 100.0% |
Internet Access in Coker
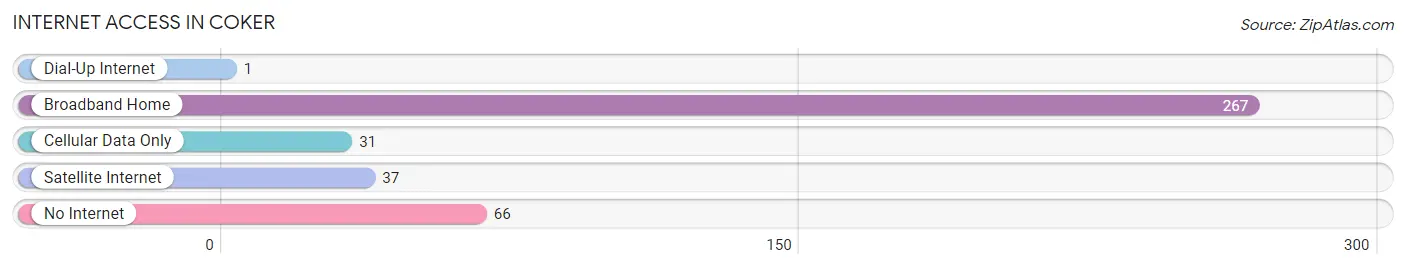
| Internet Type | # Households | % Households |
| Dial-Up Internet | 1 | 0.3% |
| Broadband Home | 267 | 69.2% |
| Cellular Data Only | 31 | 8.0% |
| Satellite Internet | 37 | 9.6% |
| No Internet | 66 | 17.1% |
| Total | 386 | 100.0% |
Coker Summary
Coker, Alabama is a small town located in Tuscaloosa County, Alabama. It is situated on the banks of the Black Warrior River, approximately 10 miles north of Tuscaloosa. The town was founded in 1818 and is named after the Coker family, who were early settlers in the area. The population of Coker was 1,845 in the 2010 census.
History
The area that is now Coker was originally inhabited by the Choctaw Indians. The first settlers in the area were the Coker family, who arrived in 1818. The family established a trading post and a ferry service across the Black Warrior River. The town was officially incorporated in 1837 and was named after the Coker family.
In the late 19th century, Coker was a thriving agricultural community. Cotton was the main crop grown in the area, and the town was home to several cotton gins and sawmills. The town also had a number of stores and businesses, including a hotel, a bank, and a post office.
In the early 20th century, Coker began to decline as the cotton industry declined. The town was bypassed by the railroad and the population began to decline. In the 1950s, the town was revitalized with the construction of a new bridge across the Black Warrior River. This allowed for increased access to the town and helped to spur economic growth.
Geography
Coker is located in Tuscaloosa County, Alabama. It is situated on the banks of the Black Warrior River, approximately 10 miles north of Tuscaloosa. The town is located in the foothills of the Appalachian Mountains and is surrounded by rolling hills and forests. The climate in Coker is humid subtropical, with hot summers and mild winters.
Economy
The economy of Coker is largely based on agriculture. Cotton is still the main crop grown in the area, although other crops such as corn, soybeans, and wheat are also grown. The town is also home to several small businesses, including restaurants, retail stores, and service providers.
Demographics
As of the 2010 census, the population of Coker was 1,845. The racial makeup of the town was 79.3% White, 17.7% African American, 0.3% Native American, 0.2% Asian, 0.1% Pacific Islander, and 2.4% from other races. The median household income was $31,250 and the median family income was $37,500. The per capita income was $17,845.
Conclusion
Coker, Alabama is a small town located in Tuscaloosa County, Alabama. It was founded in 1818 and is named after the Coker family, who were early settlers in the area. The economy of Coker is largely based on agriculture, with cotton being the main crop grown in the area. The population of Coker was 1,845 in the 2010 census, with the racial makeup of the town being 79.3% White, 17.7% African American, 0.3% Native American, 0.2% Asian, 0.1% Pacific Islander, and 2.4% from other races. The median household income was $31,250 and the median family income was $37,500. The per capita income was $17,845.
Common Questions
What is Per Capita Income in Coker?
Per Capita income in Coker is $30,540.
What is the Median Family Income in Coker?
Median Family Income in Coker is $83,523.
What is the Median Household income in Coker?
Median Household Income in Coker is $54,559.
What is Income or Wage Gap in Coker?
Income or Wage Gap in Coker is 15.7%.
Women in Coker earn 84.3 cents for every dollar earned by a man.
What is Inequality or Gini Index in Coker?
Inequality or Gini Index in Coker is 0.44.
What is the Total Population of Coker?
Total Population of Coker is 1,006.
What is the Total Male Population of Coker?
Total Male Population of Coker is 508.
What is the Total Female Population of Coker?
Total Female Population of Coker is 498.
What is the Ratio of Males per 100 Females in Coker?
There are 102.01 Males per 100 Females in Coker.
What is the Ratio of Females per 100 Males in Coker?
There are 98.03 Females per 100 Males in Coker.
What is the Median Population Age in Coker?
Median Population Age in Coker is 43.4 Years.
What is the Average Family Size in Coker
Average Family Size in Coker is 3.2 People.
What is the Average Household Size in Coker
Average Household Size in Coker is 2.6 People.
How Large is the Labor Force in Coker?
There are 445 People in the Labor Forcein in Coker.
What is the Percentage of People in the Labor Force in Coker?
55.2% of People are in the Labor Force in Coker.