Summerdale, AL Map & Demographics
Summerdale Map
Summerdale Overview
$36,416
PER CAPITA INCOME
$76,250
AVG FAMILY INCOME
$70,500
AVG HOUSEHOLD INCOME
30.0%
WAGE / INCOME GAP [ % ]
70.0¢/ $1
WAGE / INCOME GAP [ $ ]
0.41
INEQUALITY / GINI INDEX
1,497
TOTAL POPULATION
692
MALE POPULATION
805
FEMALE POPULATION
85.96
MALES / 100 FEMALES
116.33
FEMALES / 100 MALES
44.1
MEDIAN AGE
3.0
AVG FAMILY SIZE
2.6
AVG HOUSEHOLD SIZE
738
LABOR FORCE [ PEOPLE ]
57.2%
PERCENT IN LABOR FORCE
1.1%
UNEMPLOYMENT RATE
Summerdale Zip Codes
Summerdale Area Codes
Income in Summerdale
Income Overview in Summerdale
Per Capita Income in Summerdale is $36,416, while median incomes of families and households are $76,250 and $70,500 respectively.
| Characteristic | Number | Measure |
| Per Capita Income | 1,497 | $36,416 |
| Median Family Income | 407 | $76,250 |
| Mean Family Income | 407 | $108,534 |
| Median Household Income | 558 | $70,500 |
| Mean Household Income | 558 | $93,138 |
| Income Deficit | 407 | $0 |
| Wage / Income Gap (%) | 1,497 | 29.98% |
| Wage / Income Gap ($) | 1,497 | 70.02¢ per $1 |
| Gini / Inequality Index | 1,497 | 0.41 |
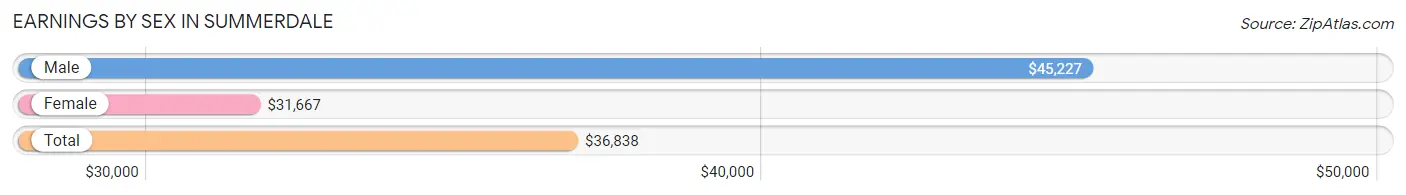
Earnings by Sex in Summerdale
Average Earnings in Summerdale are $36,838, $45,227 for men and $31,667 for women, a difference of 30.0%.
| Sex | Number | Average Earnings |
| Male | 402 (49.4%) | $45,227 |
| Female | 412 (50.6%) | $31,667 |
| Total | 814 (100.0%) | $36,838 |
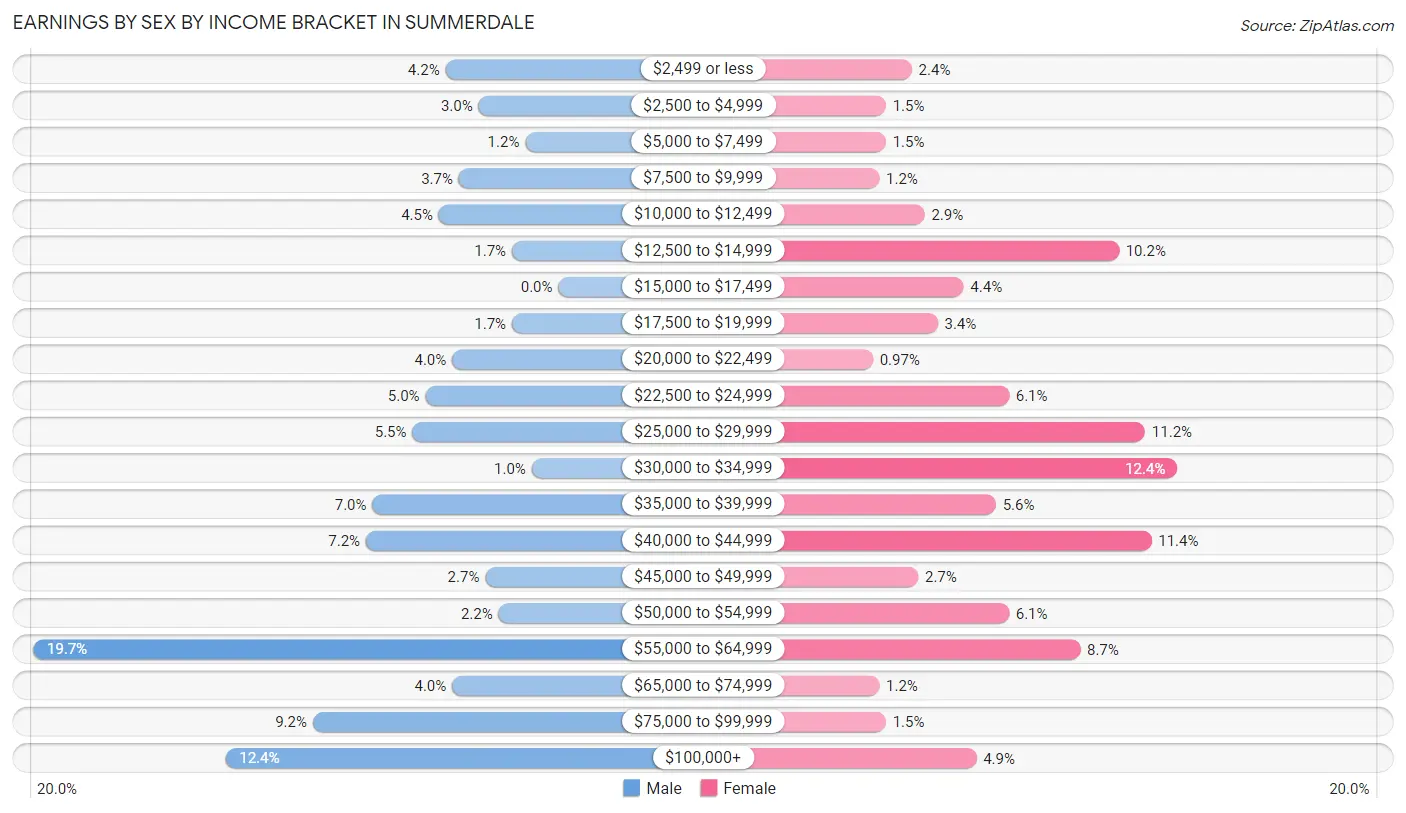
Earnings by Sex by Income Bracket in Summerdale
The most common earnings brackets in Summerdale are $55,000 to $64,999 for men (79 | 19.7%) and $30,000 to $34,999 for women (51 | 12.4%).
| Income | Male | Female |
| $2,499 or less | 17 (4.2%) | 10 (2.4%) |
| $2,500 to $4,999 | 12 (3.0%) | 6 (1.5%) |
| $5,000 to $7,499 | 5 (1.2%) | 6 (1.5%) |
| $7,500 to $9,999 | 15 (3.7%) | 5 (1.2%) |
| $10,000 to $12,499 | 18 (4.5%) | 12 (2.9%) |
| $12,500 to $14,999 | 7 (1.7%) | 42 (10.2%) |
| $15,000 to $17,499 | 0 (0.0%) | 18 (4.4%) |
| $17,500 to $19,999 | 7 (1.7%) | 14 (3.4%) |
| $20,000 to $22,499 | 16 (4.0%) | 4 (1.0%) |
| $22,500 to $24,999 | 20 (5.0%) | 25 (6.1%) |
| $25,000 to $29,999 | 22 (5.5%) | 46 (11.2%) |
| $30,000 to $34,999 | 4 (1.0%) | 51 (12.4%) |
| $35,000 to $39,999 | 28 (7.0%) | 23 (5.6%) |
| $40,000 to $44,999 | 29 (7.2%) | 47 (11.4%) |
| $45,000 to $49,999 | 11 (2.7%) | 11 (2.7%) |
| $50,000 to $54,999 | 9 (2.2%) | 25 (6.1%) |
| $55,000 to $64,999 | 79 (19.7%) | 36 (8.7%) |
| $65,000 to $74,999 | 16 (4.0%) | 5 (1.2%) |
| $75,000 to $99,999 | 37 (9.2%) | 6 (1.5%) |
| $100,000+ | 50 (12.4%) | 20 (4.9%) |
| Total | 402 (100.0%) | 412 (100.0%) |
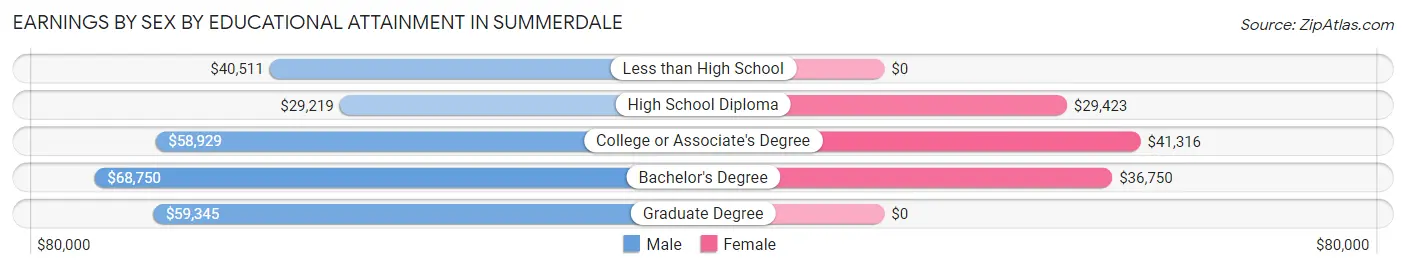
Earnings by Sex by Educational Attainment in Summerdale
Average earnings in Summerdale are $57,386 for men and $35,357 for women, a difference of 38.4%. Men with an educational attainment of bachelor's degree enjoy the highest average annual earnings of $68,750, while those with high school diploma education earn the least with $29,219. Women with an educational attainment of college or associate's degree earn the most with the average annual earnings of $41,316, while those with high school diploma education have the smallest earnings of $29,423.
| Educational Attainment | Male Income | Female Income |
| Less than High School | $40,511 | $0 |
| High School Diploma | $29,219 | $29,423 |
| College or Associate's Degree | $58,929 | $41,316 |
| Bachelor's Degree | $68,750 | $36,750 |
| Graduate Degree | $59,345 | $0 |
| Total | $57,386 | $35,357 |
Family Income in Summerdale
Family Income Brackets in Summerdale
According to the Summerdale family income data, there are 125 families falling into the $50,000 to $74,999 income range, which is the most common income bracket and makes up 30.7% of all families.
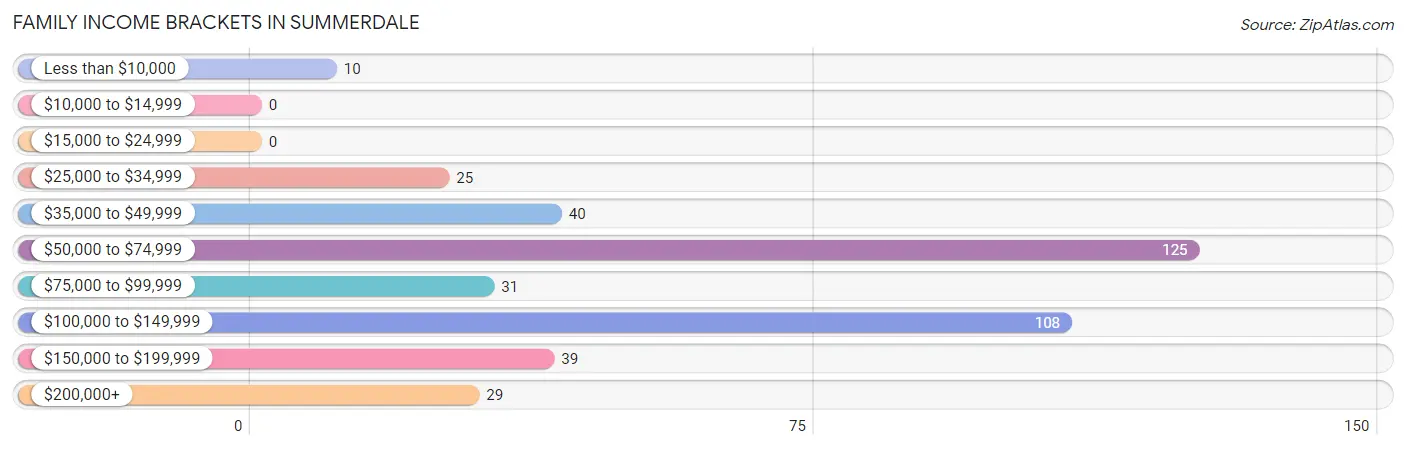
| Income Bracket | # Families | % Families |
| Less than $10,000 | 10 | 2.5% |
| $10,000 to $14,999 | 0 | 0.0% |
| $15,000 to $24,999 | 0 | 0.0% |
| $25,000 to $34,999 | 25 | 6.1% |
| $35,000 to $49,999 | 40 | 9.8% |
| $50,000 to $74,999 | 125 | 30.7% |
| $75,000 to $99,999 | 31 | 7.6% |
| $100,000 to $149,999 | 108 | 26.5% |
| $150,000 to $199,999 | 39 | 9.6% |
| $200,000+ | 29 | 7.1% |
Family Income by Famaliy Size in Summerdale
4-person families (49 | 12.0%) account for the highest median family income in Summerdale with $141,250 per family, while 2-person families (243 | 59.7%) have the highest median income of $36,986 per family member.
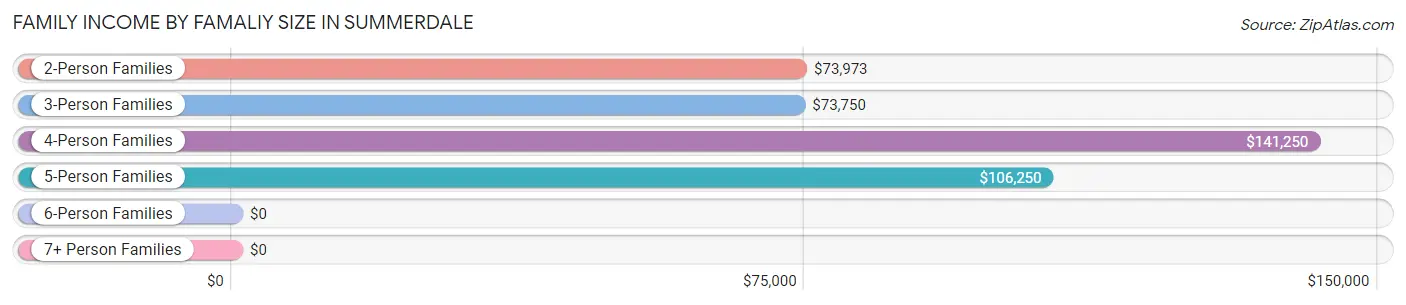
| Income Bracket | # Families | Median Income |
| 2-Person Families | 243 (59.7%) | $73,973 |
| 3-Person Families | 84 (20.6%) | $73,750 |
| 4-Person Families | 49 (12.0%) | $141,250 |
| 5-Person Families | 22 (5.4%) | $106,250 |
| 6-Person Families | 8 (2.0%) | $0 |
| 7+ Person Families | 1 (0.3%) | $0 |
| Total | 407 (100.0%) | $76,250 |
Family Income by Number of Earners in Summerdale
The median family income in Summerdale is $76,250, with families comprising 3+ earners (35) having the highest median family income of $180,417, while families with 1 earner (71) have the lowest median family income of $54,250, accounting for 8.6% and 17.4% of families, respectively.
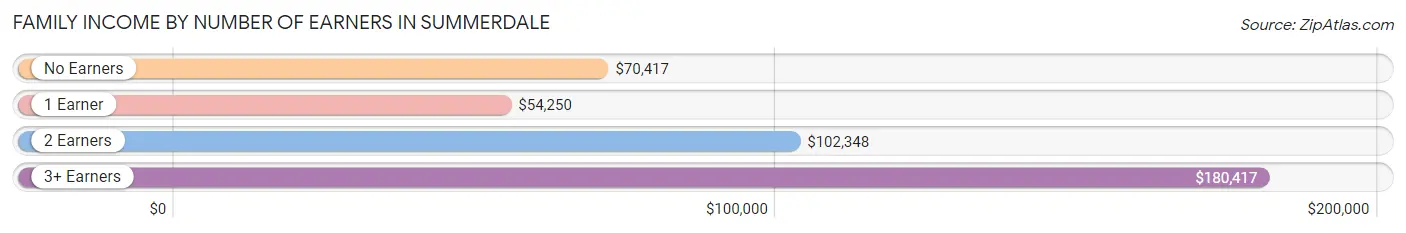
| Number of Earners | # Families | Median Income |
| No Earners | 101 (24.8%) | $70,417 |
| 1 Earner | 71 (17.4%) | $54,250 |
| 2 Earners | 200 (49.1%) | $102,348 |
| 3+ Earners | 35 (8.6%) | $180,417 |
| Total | 407 (100.0%) | $76,250 |
Household Income in Summerdale
Household Income Brackets in Summerdale
With 148 households falling in the category, the $50,000 to $74,999 income range is the most frequent in Summerdale, accounting for 26.5% of all households. In contrast, only 11 households (2.0%) fall into the $10,000 to $14,999 income bracket, making it the least populous group.
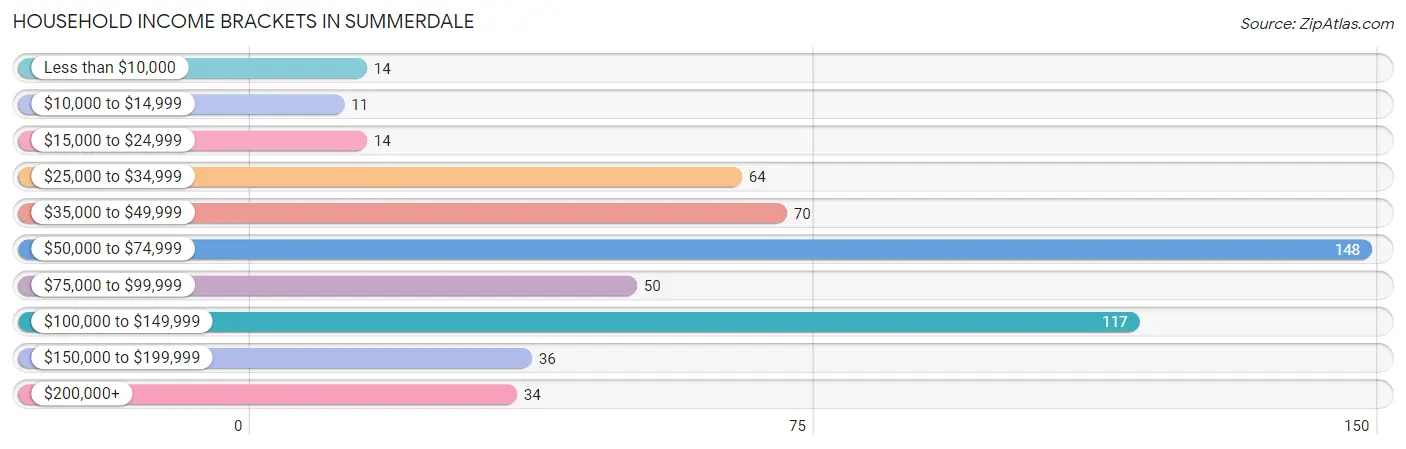
| Income Bracket | # Households | % Households |
| Less than $10,000 | 14 | 2.5% |
| $10,000 to $14,999 | 11 | 2.0% |
| $15,000 to $24,999 | 14 | 2.5% |
| $25,000 to $34,999 | 64 | 11.5% |
| $35,000 to $49,999 | 70 | 12.5% |
| $50,000 to $74,999 | 148 | 26.5% |
| $75,000 to $99,999 | 50 | 9.0% |
| $100,000 to $149,999 | 117 | 21.0% |
| $150,000 to $199,999 | 36 | 6.5% |
| $200,000+ | 34 | 6.1% |
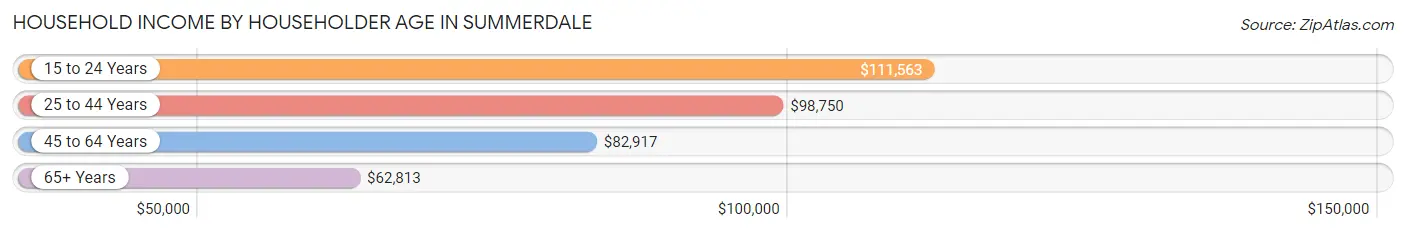
Household Income by Householder Age in Summerdale
The median household income in Summerdale is $70,500, with the highest median household income of $111,563 found in the 15 to 24 years age bracket for the primary householder. A total of 9 households (1.6%) fall into this category. Meanwhile, the 65+ years age bracket for the primary householder has the lowest median household income of $62,813, with 229 households (41.0%) in this group.
| Income Bracket | # Households | Median Income |
| 15 to 24 Years | 9 (1.6%) | $111,563 |
| 25 to 44 Years | 130 (23.3%) | $98,750 |
| 45 to 64 Years | 190 (34.1%) | $82,917 |
| 65+ Years | 229 (41.0%) | $62,813 |
| Total | 558 (100.0%) | $70,500 |
Poverty in Summerdale
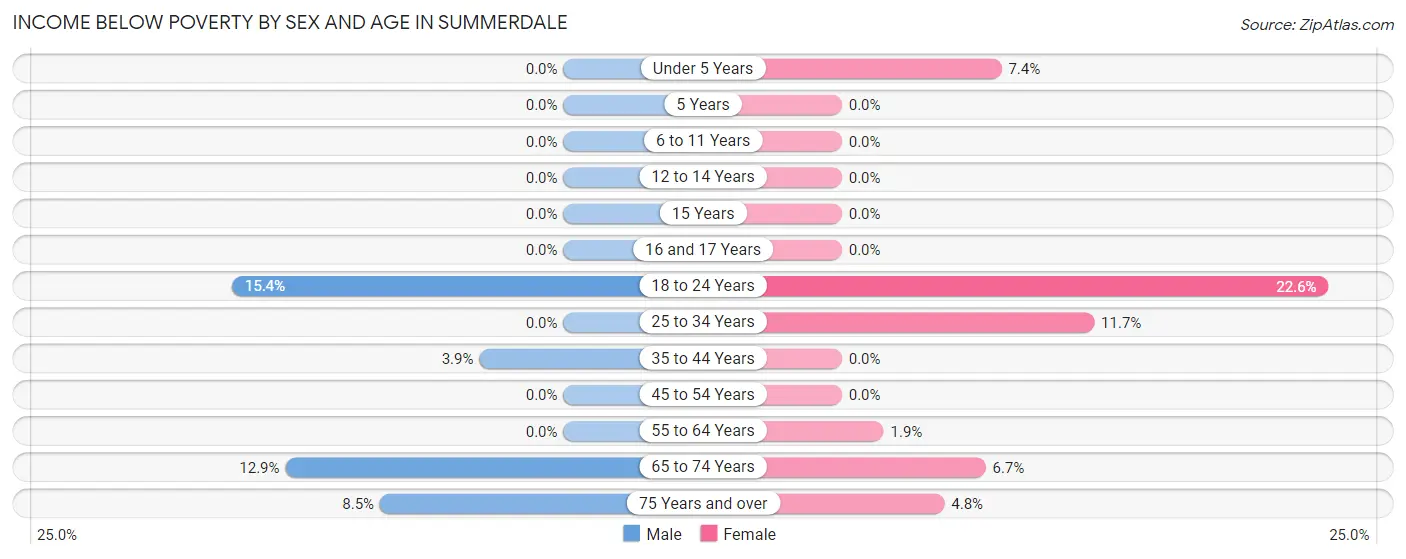
Income Below Poverty by Sex and Age in Summerdale
With 5.5% poverty level for males and 6.2% for females among the residents of Summerdale, 18 to 24 year old males and 18 to 24 year old females are the most vulnerable to poverty, with 10 males (15.4%) and 21 females (22.6%) in their respective age groups living below the poverty level.
| Age Bracket | Male | Female |
| Under 5 Years | 0 (0.0%) | 2 (7.4%) |
| 5 Years | 0 (0.0%) | 0 (0.0%) |
| 6 to 11 Years | 0 (0.0%) | 0 (0.0%) |
| 12 to 14 Years | 0 (0.0%) | 0 (0.0%) |
| 15 Years | 0 (0.0%) | 0 (0.0%) |
| 16 and 17 Years | 0 (0.0%) | 0 (0.0%) |
| 18 to 24 Years | 10 (15.4%) | 21 (22.6%) |
| 25 to 34 Years | 0 (0.0%) | 13 (11.7%) |
| 35 to 44 Years | 3 (3.9%) | 0 (0.0%) |
| 45 to 54 Years | 0 (0.0%) | 0 (0.0%) |
| 55 to 64 Years | 0 (0.0%) | 2 (1.9%) |
| 65 to 74 Years | 20 (12.9%) | 8 (6.7%) |
| 75 Years and over | 4 (8.5%) | 3 (4.8%) |
| Total | 37 (5.5%) | 49 (6.2%) |
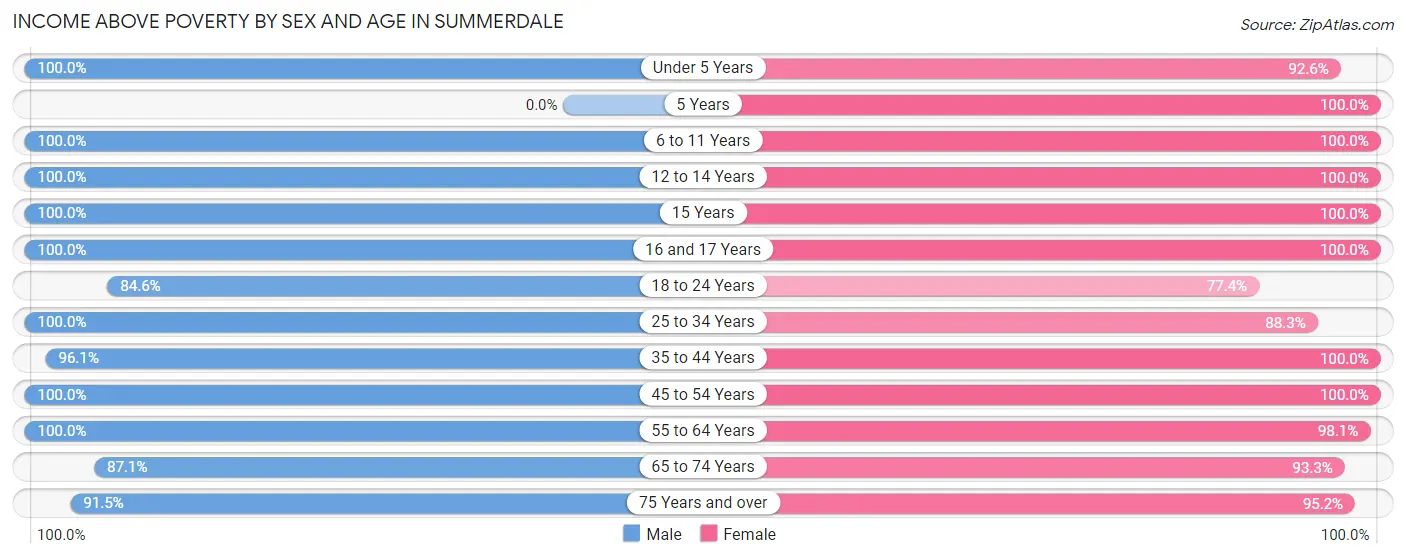
Income Above Poverty by Sex and Age in Summerdale
According to the poverty statistics in Summerdale, males aged under 5 years and females aged 5 years are the age groups that are most secure financially, with 100.0% of males and 100.0% of females in these age groups living above the poverty line.
| Age Bracket | Male | Female |
| Under 5 Years | 48 (100.0%) | 25 (92.6%) |
| 5 Years | 0 (0.0%) | 1 (100.0%) |
| 6 to 11 Years | 22 (100.0%) | 37 (100.0%) |
| 12 to 14 Years | 11 (100.0%) | 18 (100.0%) |
| 15 Years | 20 (100.0%) | 9 (100.0%) |
| 16 and 17 Years | 8 (100.0%) | 13 (100.0%) |
| 18 to 24 Years | 55 (84.6%) | 72 (77.4%) |
| 25 to 34 Years | 97 (100.0%) | 98 (88.3%) |
| 35 to 44 Years | 74 (96.1%) | 71 (100.0%) |
| 45 to 54 Years | 34 (100.0%) | 124 (100.0%) |
| 55 to 64 Years | 86 (100.0%) | 101 (98.1%) |
| 65 to 74 Years | 135 (87.1%) | 112 (93.3%) |
| 75 Years and over | 43 (91.5%) | 60 (95.2%) |
| Total | 633 (94.5%) | 741 (93.8%) |
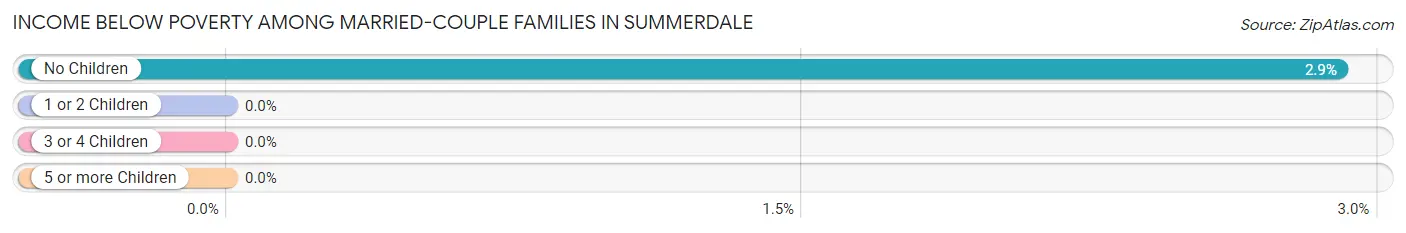
Income Below Poverty Among Married-Couple Families in Summerdale
The poverty statistics for married-couple families in Summerdale show that 2.2% or 8 of the total 361 families live below the poverty line. Families with no children have the highest poverty rate of 2.9%, comprising of 8 families. On the other hand, families with 1 or 2 children have the lowest poverty rate of 0.0%, which includes 0 families.
| Children | Above Poverty | Below Poverty |
| No Children | 268 (97.1%) | 8 (2.9%) |
| 1 or 2 Children | 76 (100.0%) | 0 (0.0%) |
| 3 or 4 Children | 8 (100.0%) | 0 (0.0%) |
| 5 or more Children | 1 (100.0%) | 0 (0.0%) |
| Total | 353 (97.8%) | 8 (2.2%) |
Income Below Poverty Among Single-Parent Households in Summerdale
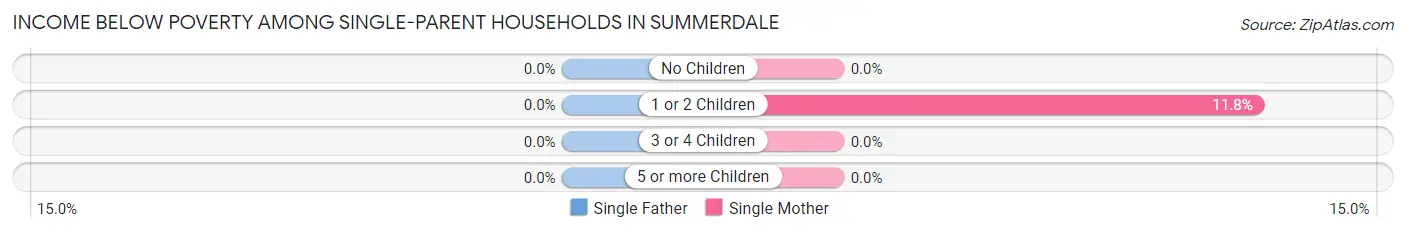
| Children | Single Father | Single Mother |
| No Children | 0 (0.0%) | 0 (0.0%) |
| 1 or 2 Children | 0 (0.0%) | 2 (11.8%) |
| 3 or 4 Children | 0 (0.0%) | 0 (0.0%) |
| 5 or more Children | 0 (0.0%) | 0 (0.0%) |
| Total | 0 (0.0%) | 2 (5.1%) |
Income Below Poverty Among Married-Couple vs Single-Parent Households in Summerdale
The poverty data for Summerdale shows that 8 of the married-couple family households (2.2%) and 2 of the single-parent households (4.3%) are living below the poverty level. Within the married-couple family households, those with no children have the highest poverty rate, with 8 households (2.9%) falling below the poverty line. Among the single-parent households, those with 1 or 2 children have the highest poverty rate, with 2 household (10.5%) living below poverty.
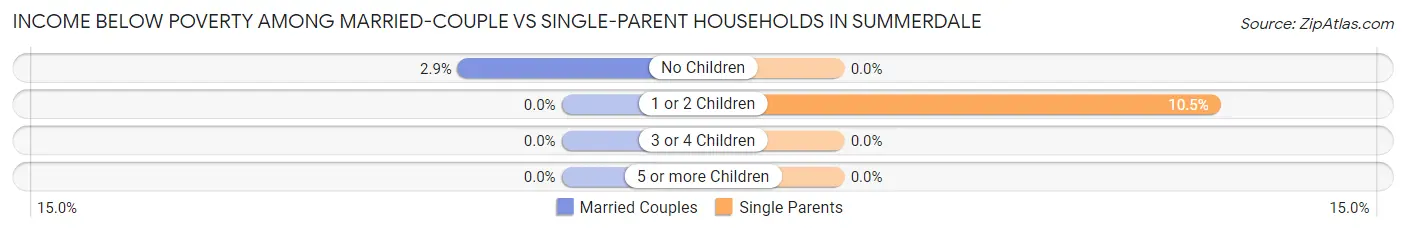
| Children | Married-Couple Families | Single-Parent Households |
| No Children | 8 (2.9%) | 0 (0.0%) |
| 1 or 2 Children | 0 (0.0%) | 2 (10.5%) |
| 3 or 4 Children | 0 (0.0%) | 0 (0.0%) |
| 5 or more Children | 0 (0.0%) | 0 (0.0%) |
| Total | 8 (2.2%) | 2 (4.3%) |
Race in Summerdale
The most populous races in Summerdale are White / Caucasian (1,410 | 94.2%), Two or more Races (57 | 3.8%), and Black / African American (30 | 2.0%).
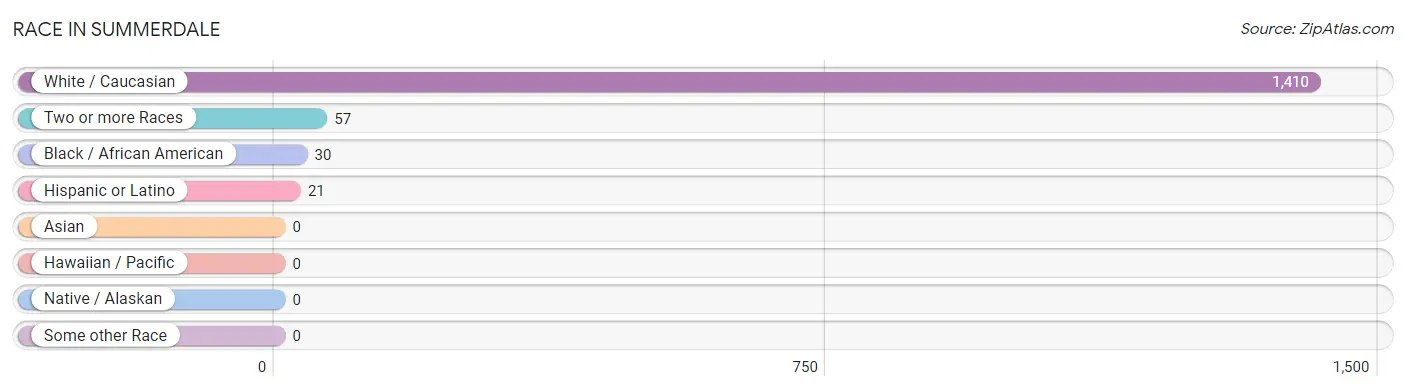
| Race | # Population | % Population |
| Asian | 0 | 0.0% |
| Black / African American | 30 | 2.0% |
| Hawaiian / Pacific | 0 | 0.0% |
| Hispanic or Latino | 21 | 1.4% |
| Native / Alaskan | 0 | 0.0% |
| White / Caucasian | 1,410 | 94.2% |
| Two or more Races | 57 | 3.8% |
| Some other Race | 0 | 0.0% |
| Total | 1,497 | 100.0% |
Ancestry in Summerdale
The most populous ancestries reported in Summerdale are American (454 | 30.3%), English (296 | 19.8%), German (113 | 7.5%), Irish (97 | 6.5%), and Scottish (35 | 2.3%), together accounting for 66.5% of all Summerdale residents.
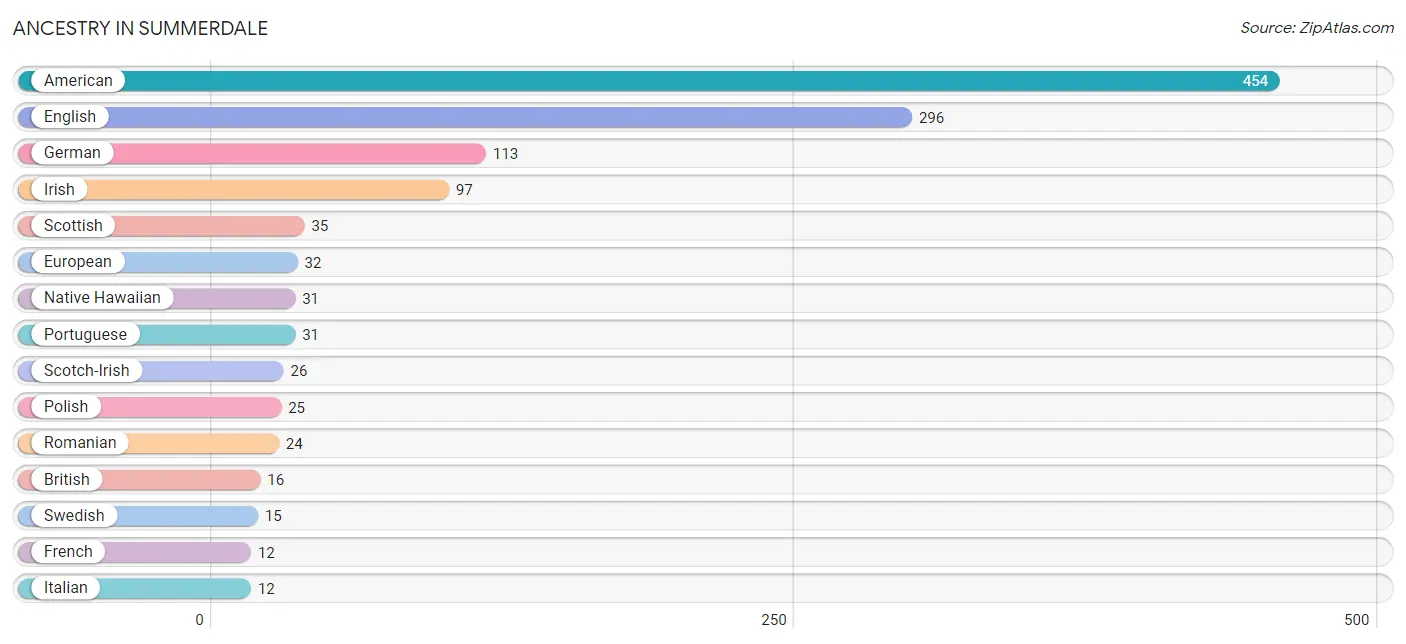
| Ancestry | # Population | % Population |
| African | 1 | 0.1% |
| American | 454 | 30.3% |
| British | 16 | 1.1% |
| Central American | 1 | 0.1% |
| Cherokee | 5 | 0.3% |
| Choctaw | 2 | 0.1% |
| Creek | 3 | 0.2% |
| Czech | 8 | 0.5% |
| Czechoslovakian | 3 | 0.2% |
| Danish | 11 | 0.7% |
| Dutch | 2 | 0.1% |
| Eastern European | 2 | 0.1% |
| English | 296 | 19.8% |
| European | 32 | 2.1% |
| French | 12 | 0.8% |
| German | 113 | 7.5% |
| Greek | 8 | 0.5% |
| Irish | 97 | 6.5% |
| Italian | 12 | 0.8% |
| Mexican | 11 | 0.7% |
| Native Hawaiian | 31 | 2.1% |
| Polish | 25 | 1.7% |
| Portuguese | 31 | 2.1% |
| Romanian | 24 | 1.6% |
| Salvadoran | 1 | 0.1% |
| Scotch-Irish | 26 | 1.7% |
| Scottish | 35 | 2.3% |
| Slovak | 3 | 0.2% |
| Spanish | 7 | 0.5% |
| Subsaharan African | 1 | 0.1% |
| Swedish | 15 | 1.0% |
| Welsh | 7 | 0.5% | View All 32 Rows |
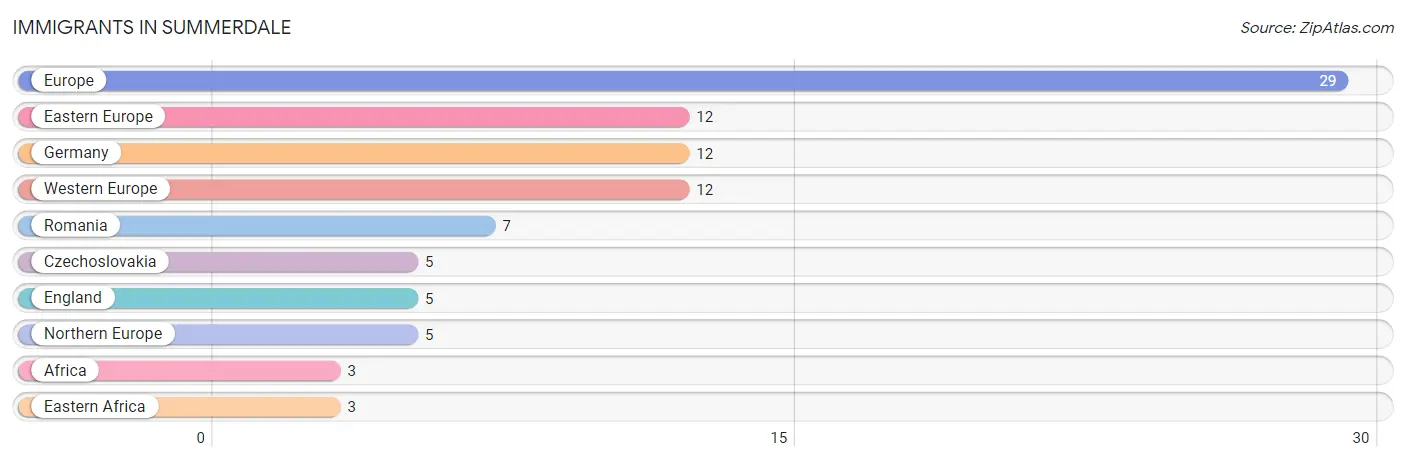
Immigrants in Summerdale
The most numerous immigrant groups reported in Summerdale came from Europe (29 | 1.9%), Eastern Europe (12 | 0.8%), Germany (12 | 0.8%), Western Europe (12 | 0.8%), and Romania (7 | 0.5%), together accounting for 4.8% of all Summerdale residents.
| Immigration Origin | # Population | % Population |
| Africa | 3 | 0.2% |
| Czechoslovakia | 5 | 0.3% |
| Eastern Africa | 3 | 0.2% |
| Eastern Europe | 12 | 0.8% |
| England | 5 | 0.3% |
| Europe | 29 | 1.9% |
| Germany | 12 | 0.8% |
| Northern Europe | 5 | 0.3% |
| Romania | 7 | 0.5% |
| Western Europe | 12 | 0.8% | View All 10 Rows |
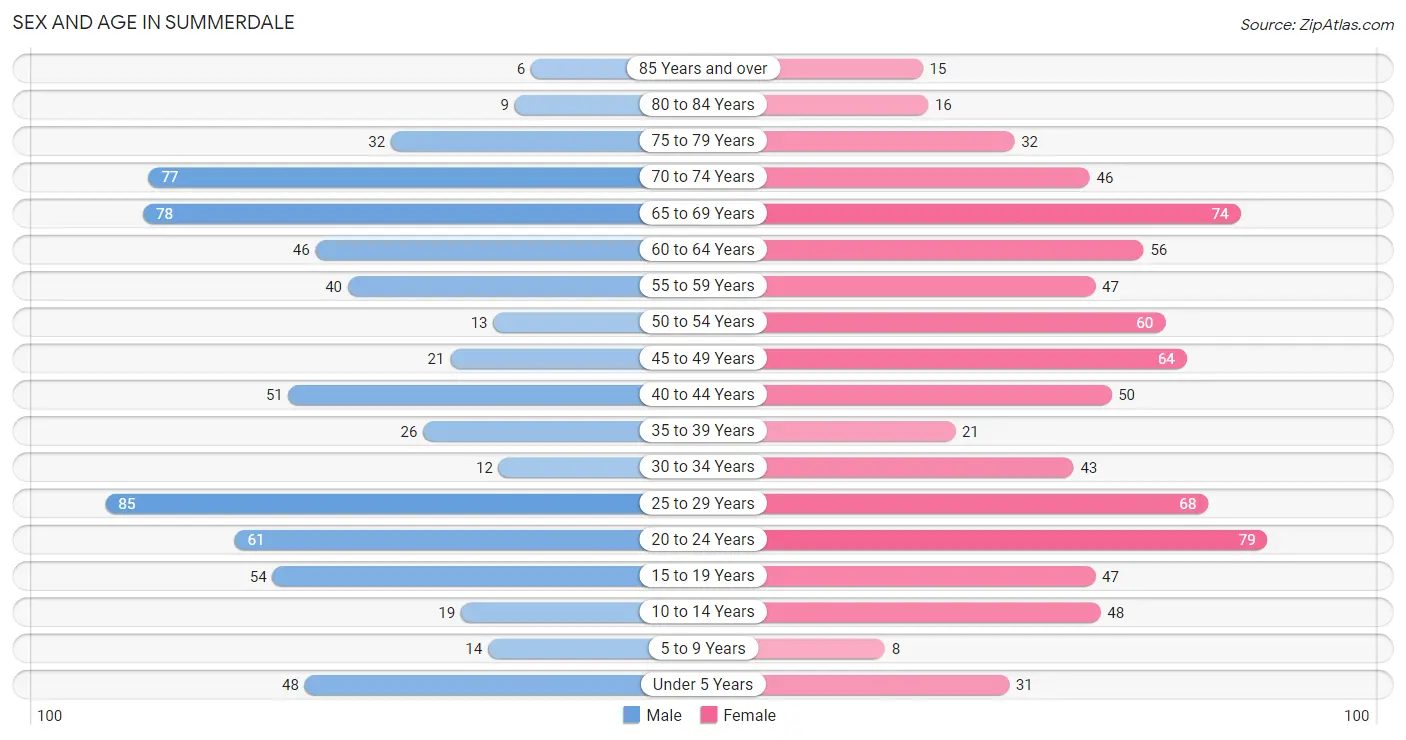
Sex and Age in Summerdale
Sex and Age in Summerdale
The most populous age groups in Summerdale are 25 to 29 Years (85 | 12.3%) for men and 20 to 24 Years (79 | 9.8%) for women.
| Age Bracket | Male | Female |
| Under 5 Years | 48 (6.9%) | 31 (3.8%) |
| 5 to 9 Years | 14 (2.0%) | 8 (1.0%) |
| 10 to 14 Years | 19 (2.8%) | 48 (6.0%) |
| 15 to 19 Years | 54 (7.8%) | 47 (5.8%) |
| 20 to 24 Years | 61 (8.8%) | 79 (9.8%) |
| 25 to 29 Years | 85 (12.3%) | 68 (8.5%) |
| 30 to 34 Years | 12 (1.7%) | 43 (5.3%) |
| 35 to 39 Years | 26 (3.8%) | 21 (2.6%) |
| 40 to 44 Years | 51 (7.4%) | 50 (6.2%) |
| 45 to 49 Years | 21 (3.0%) | 64 (8.0%) |
| 50 to 54 Years | 13 (1.9%) | 60 (7.4%) |
| 55 to 59 Years | 40 (5.8%) | 47 (5.8%) |
| 60 to 64 Years | 46 (6.7%) | 56 (7.0%) |
| 65 to 69 Years | 78 (11.3%) | 74 (9.2%) |
| 70 to 74 Years | 77 (11.1%) | 46 (5.7%) |
| 75 to 79 Years | 32 (4.6%) | 32 (4.0%) |
| 80 to 84 Years | 9 (1.3%) | 16 (2.0%) |
| 85 Years and over | 6 (0.9%) | 15 (1.9%) |
| Total | 692 (100.0%) | 805 (100.0%) |
Families and Households in Summerdale
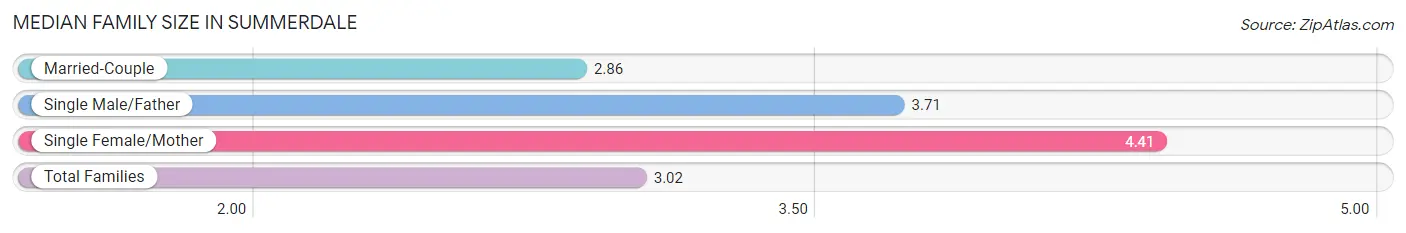
Median Family Size in Summerdale
The median family size in Summerdale is 3.02 persons per family, with single female/mother families (39 | 9.6%) accounting for the largest median family size of 4.41 persons per family. On the other hand, married-couple families (361 | 88.7%) represent the smallest median family size with 2.86 persons per family.
| Family Type | # Families | Family Size |
| Married-Couple | 361 (88.7%) | 2.86 |
| Single Male/Father | 7 (1.7%) | 3.71 |
| Single Female/Mother | 39 (9.6%) | 4.41 |
| Total Families | 407 (100.0%) | 3.02 |
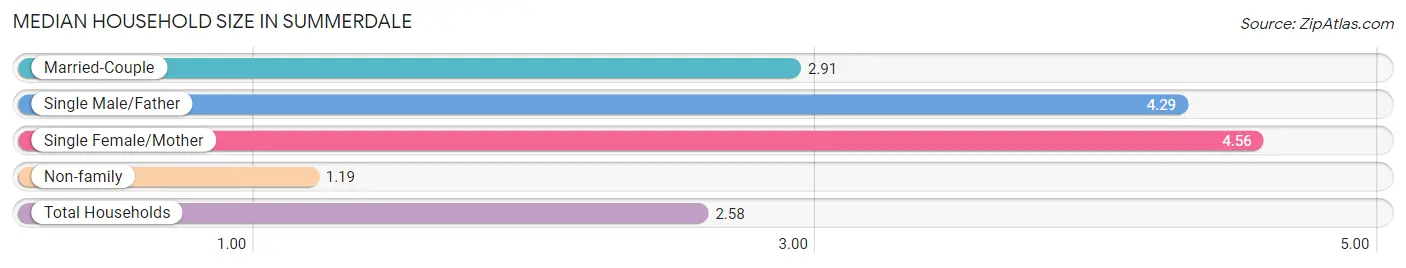
Median Household Size in Summerdale
The median household size in Summerdale is 2.58 persons per household, with single female/mother households (39 | 7.0%) accounting for the largest median household size of 4.56 persons per household. non-family households (151 | 27.1%) represent the smallest median household size with 1.19 persons per household.
| Household Type | # Households | Household Size |
| Married-Couple | 361 (64.7%) | 2.91 |
| Single Male/Father | 7 (1.3%) | 4.29 |
| Single Female/Mother | 39 (7.0%) | 4.56 |
| Non-family | 151 (27.1%) | 1.19 |
| Total Households | 558 (100.0%) | 2.58 |
Household Size by Marriage Status in Summerdale
Out of a total of 558 households in Summerdale, 407 (72.9%) are family households, while 151 (27.1%) are nonfamily households. The most numerous type of family households are 2-person households, comprising 241, and the most common type of nonfamily households are 1-person households, comprising 134.
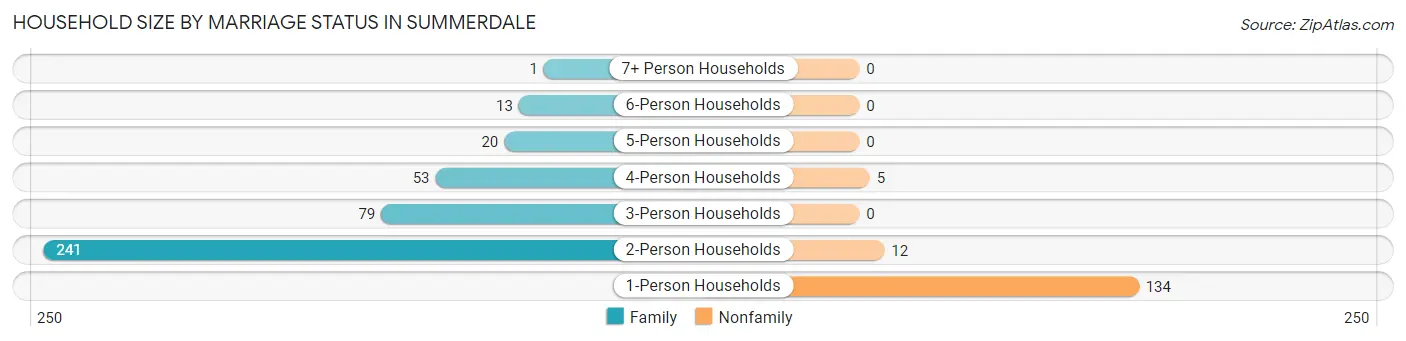
| Household Size | Family Households | Nonfamily Households |
| 1-Person Households | - | 134 (24.0%) |
| 2-Person Households | 241 (43.2%) | 12 (2.1%) |
| 3-Person Households | 79 (14.2%) | 0 (0.0%) |
| 4-Person Households | 53 (9.5%) | 5 (0.9%) |
| 5-Person Households | 20 (3.6%) | 0 (0.0%) |
| 6-Person Households | 13 (2.3%) | 0 (0.0%) |
| 7+ Person Households | 1 (0.2%) | 0 (0.0%) |
| Total | 407 (72.9%) | 151 (27.1%) |
Female Fertility in Summerdale
Fertility by Age in Summerdale
Average fertility rate in Summerdale is 41.0 births per 1,000 women. Women in the age bracket of 20 to 34 years have the highest fertility rate with 84.0 births per 1,000 women. Women in the age bracket of 20 to 34 years acount for 100.0% of all women with births.
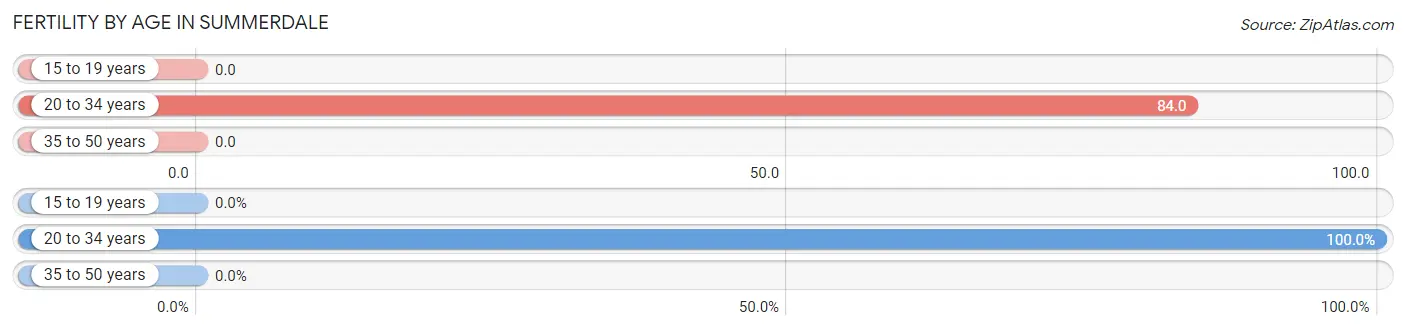
| Age Bracket | Women with Births | Births / 1,000 Women |
| 15 to 19 years | 0 (0.0%) | 0.0 |
| 20 to 34 years | 16 (100.0%) | 84.0 |
| 35 to 50 years | 0 (0.0%) | 0.0 |
| Total | 16 (100.0%) | 41.0 |
Fertility by Age by Marriage Status in Summerdale
87.5% of women with births (16) in Summerdale are married. The highest percentage of unmarried women with births falls into 20 to 34 years age bracket with 12.5% of them unmarried at the time of birth, while the lowest percentage of unmarried women with births belong to 20 to 34 years age bracket with 12.5% of them unmarried.
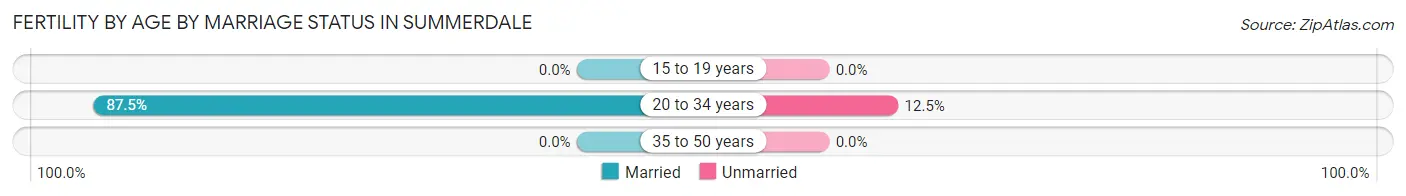
| Age Bracket | Married | Unmarried |
| 15 to 19 years | 0 (0.0%) | 0 (0.0%) |
| 20 to 34 years | 14 (87.5%) | 2 (12.5%) |
| 35 to 50 years | 0 (0.0%) | 0 (0.0%) |
| Total | 14 (87.5%) | 2 (12.5%) |
Fertility by Education in Summerdale
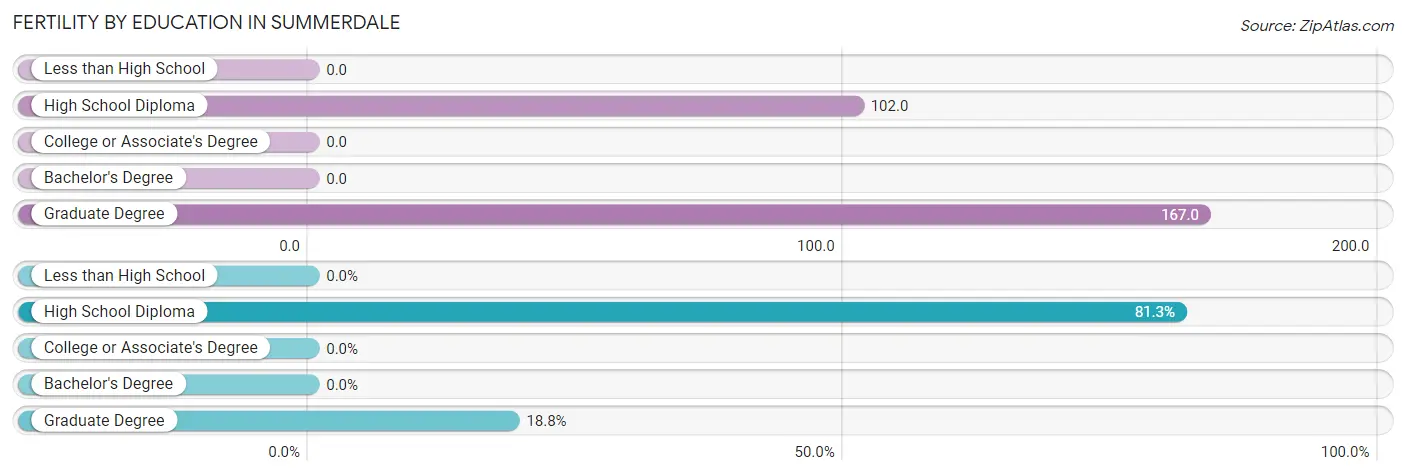
| Educational Attainment | Women with Births | Births / 1,000 Women |
| Less than High School | 0 (0.0%) | 0.0 |
| High School Diploma | 13 (81.2%) | 102.0 |
| College or Associate's Degree | 0 (0.0%) | 0.0 |
| Bachelor's Degree | 0 (0.0%) | 0.0 |
| Graduate Degree | 3 (18.8%) | 167.0 |
| Total | 16 (100.0%) | 41.0 |
Fertility by Education by Marriage Status in Summerdale
12.5% of women with births in Summerdale are unmarried. Women with the educational attainment of graduate degree are most likely to be married with 100.0% of them married at childbirth, while women with the educational attainment of high school diploma are least likely to be married with 15.4% of them unmarried at childbirth.
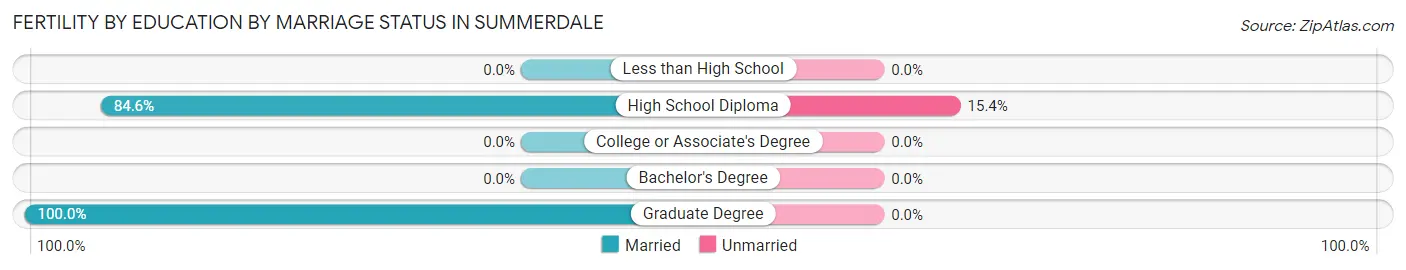
| Educational Attainment | Married | Unmarried |
| Less than High School | 0 (0.0%) | 0 (0.0%) |
| High School Diploma | 11 (84.6%) | 2 (15.4%) |
| College or Associate's Degree | 0 (0.0%) | 0 (0.0%) |
| Bachelor's Degree | 0 (0.0%) | 0 (0.0%) |
| Graduate Degree | 3 (100.0%) | 0 (0.0%) |
| Total | 14 (87.5%) | 2 (12.5%) |
Employment Characteristics in Summerdale
Employment by Class of Employer in Summerdale
Among the 723 employed individuals in Summerdale, private company employees (522 | 72.2%), not-for-profit organizations (63 | 8.7%), and self-employed (incorporated) (42 | 5.8%) make up the most common classes of employment.
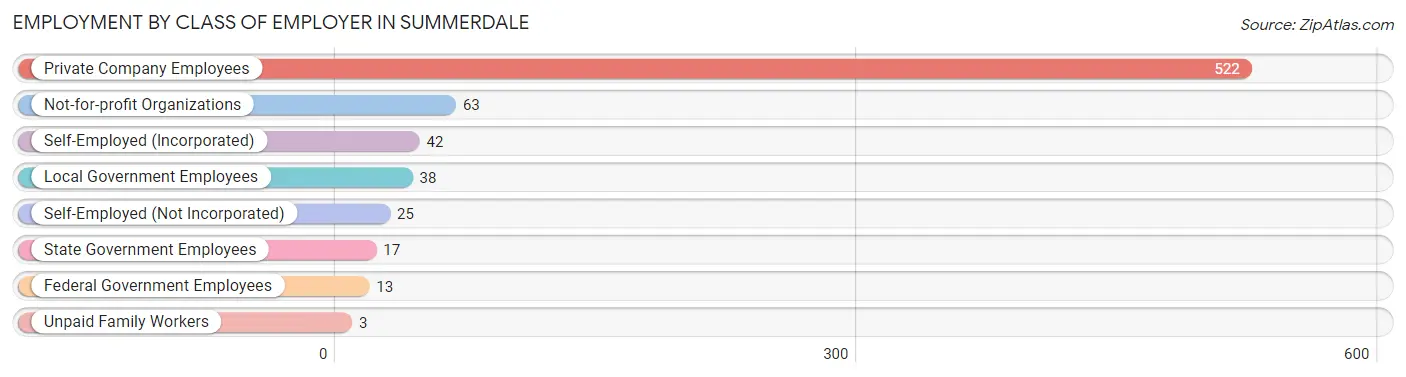
| Employer Class | # Employees | % Employees |
| Private Company Employees | 522 | 72.2% |
| Self-Employed (Incorporated) | 42 | 5.8% |
| Self-Employed (Not Incorporated) | 25 | 3.5% |
| Not-for-profit Organizations | 63 | 8.7% |
| Local Government Employees | 38 | 5.3% |
| State Government Employees | 17 | 2.4% |
| Federal Government Employees | 13 | 1.8% |
| Unpaid Family Workers | 3 | 0.4% |
| Total | 723 | 100.0% |
Employment Status by Age in Summerdale
According to the labor force statistics for Summerdale, out of the total population over 16 years of age (1,291), 57.2% or 738 individuals are in the labor force, with 1.1% or 8 of them unemployed. The age group with the highest labor force participation rate is 35 to 44 years, with 93.2% or 138 individuals in the labor force. Within the labor force, the 55 to 59 years age range has the highest percentage of unemployed individuals, with 5.2% or 3 of them being unemployed.
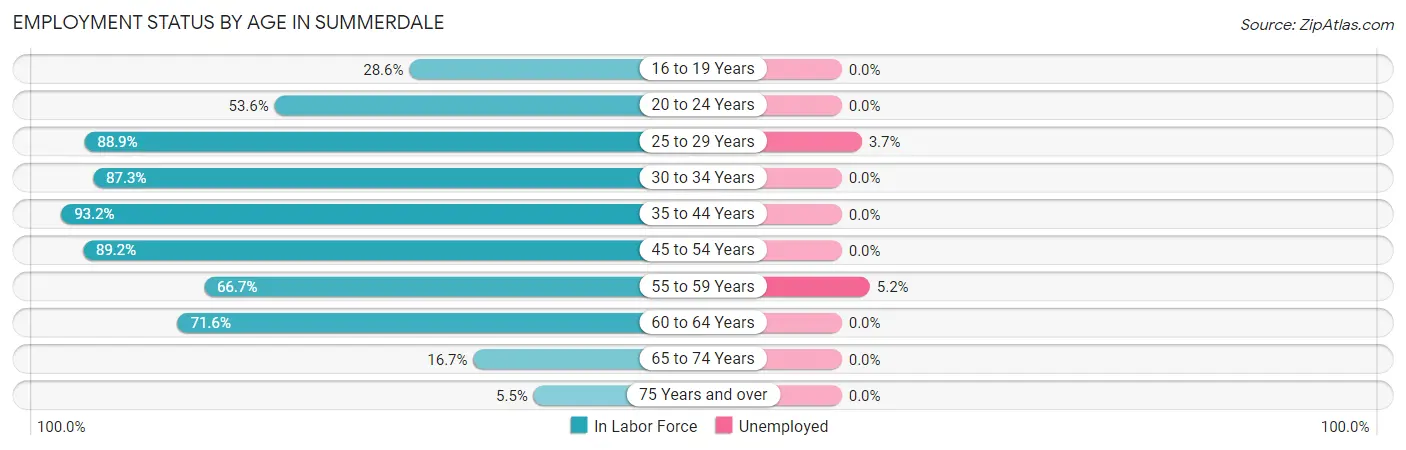
| Age Bracket | In Labor Force | Unemployed |
| 16 to 19 Years | 18 (28.6%) | 0 (0.0%) |
| 20 to 24 Years | 75 (53.6%) | 0 (0.0%) |
| 25 to 29 Years | 136 (88.9%) | 5 (3.7%) |
| 30 to 34 Years | 48 (87.3%) | 0 (0.0%) |
| 35 to 44 Years | 138 (93.2%) | 0 (0.0%) |
| 45 to 54 Years | 141 (89.2%) | 0 (0.0%) |
| 55 to 59 Years | 58 (66.7%) | 3 (5.2%) |
| 60 to 64 Years | 73 (71.6%) | 0 (0.0%) |
| 65 to 74 Years | 46 (16.7%) | 0 (0.0%) |
| 75 Years and over | 6 (5.5%) | 0 (0.0%) |
| Total | 738 (57.2%) | 8 (1.1%) |
Employment Status by Educational Attainment in Summerdale
According to labor force statistics for Summerdale, 84.5% of individuals (594) out of the total population between 25 and 64 years of age (703) are in the labor force, with 1.3% or 8 of them being unemployed. The group with the highest labor force participation rate are those with the educational attainment of bachelor's degree or higher, with 97.4% or 148 individuals in the labor force. Within the labor force, individuals with high school diploma education have the highest percentage of unemployment, with 3.6% or 5 of them being unemployed.
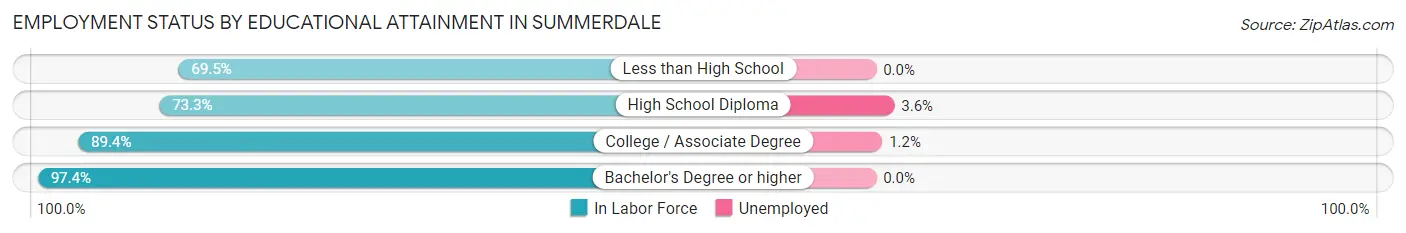
| Educational Attainment | In Labor Force | Unemployed |
| Less than High School | 57 (69.5%) | 0 (0.0%) |
| High School Diploma | 137 (73.3%) | 7 (3.6%) |
| College / Associate Degree | 252 (89.4%) | 3 (1.2%) |
| Bachelor's Degree or higher | 148 (97.4%) | 0 (0.0%) |
| Total | 594 (84.5%) | 9 (1.3%) |
Employment Occupations by Sex in Summerdale
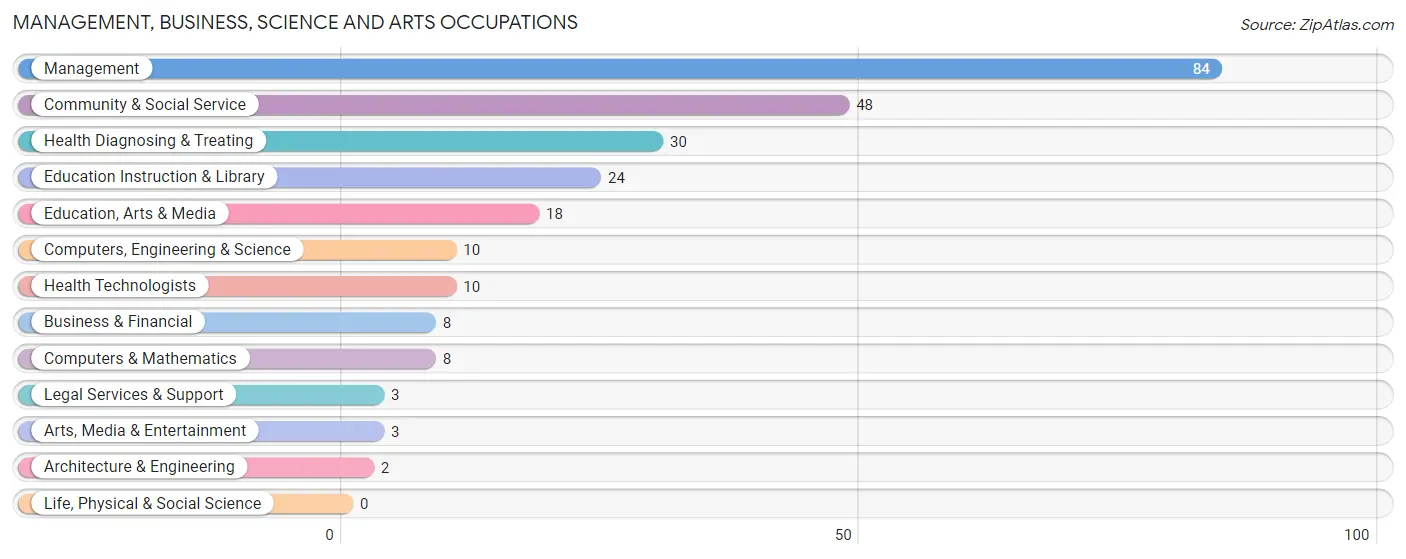
Management, Business, Science and Arts Occupations
The most common Management, Business, Science and Arts occupations in Summerdale are Management (84 | 11.5%), Community & Social Service (48 | 6.6%), Health Diagnosing & Treating (30 | 4.1%), Education Instruction & Library (24 | 3.3%), and Education, Arts & Media (18 | 2.5%).
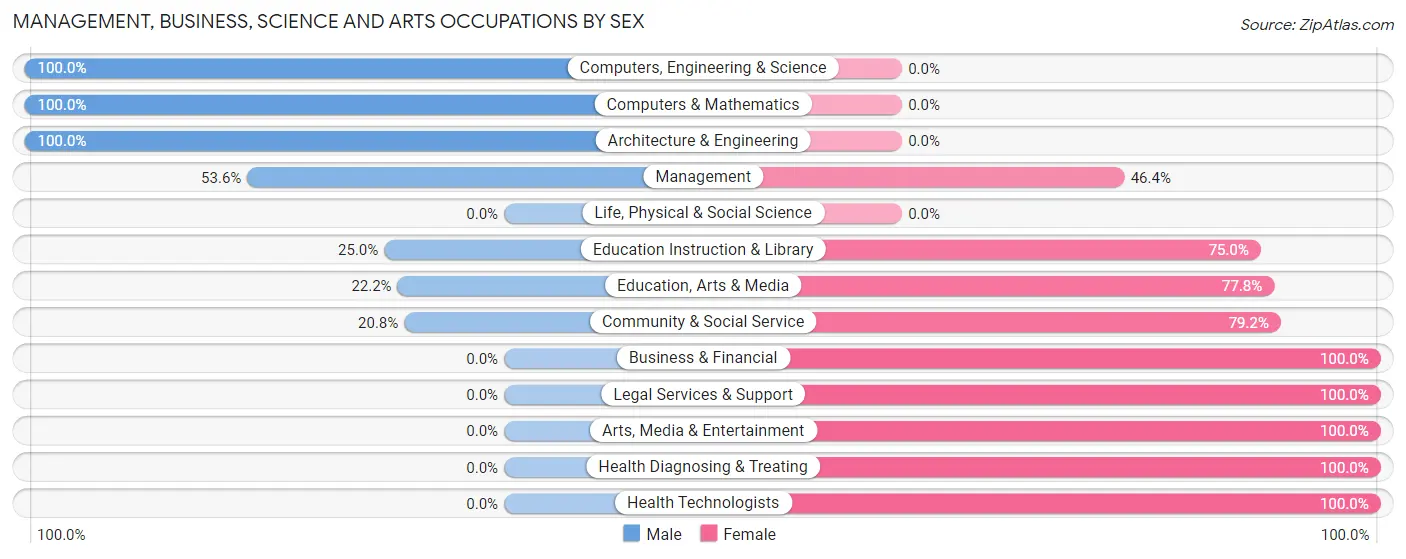
Management, Business, Science and Arts Occupations by Sex
Within the Management, Business, Science and Arts occupations in Summerdale, the most male-oriented occupations are Computers, Engineering & Science (100.0%), Computers & Mathematics (100.0%), and Architecture & Engineering (100.0%), while the most female-oriented occupations are Business & Financial (100.0%), Legal Services & Support (100.0%), and Arts, Media & Entertainment (100.0%).
| Occupation | Male | Female |
| Management | 45 (53.6%) | 39 (46.4%) |
| Business & Financial | 0 (0.0%) | 8 (100.0%) |
| Computers, Engineering & Science | 10 (100.0%) | 0 (0.0%) |
| Computers & Mathematics | 8 (100.0%) | 0 (0.0%) |
| Architecture & Engineering | 2 (100.0%) | 0 (0.0%) |
| Life, Physical & Social Science | 0 (0.0%) | 0 (0.0%) |
| Community & Social Service | 10 (20.8%) | 38 (79.2%) |
| Education, Arts & Media | 4 (22.2%) | 14 (77.8%) |
| Legal Services & Support | 0 (0.0%) | 3 (100.0%) |
| Education Instruction & Library | 6 (25.0%) | 18 (75.0%) |
| Arts, Media & Entertainment | 0 (0.0%) | 3 (100.0%) |
| Health Diagnosing & Treating | 0 (0.0%) | 30 (100.0%) |
| Health Technologists | 0 (0.0%) | 10 (100.0%) |
| Total (Category) | 65 (36.1%) | 115 (63.9%) |
| Total (Overall) | 356 (48.7%) | 375 (51.3%) |
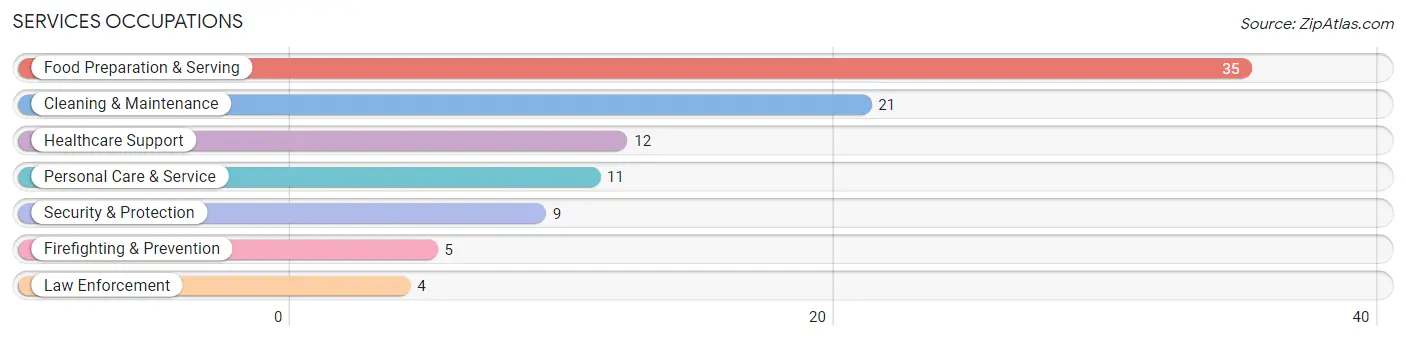
Services Occupations
The most common Services occupations in Summerdale are Food Preparation & Serving (35 | 4.8%), Cleaning & Maintenance (21 | 2.9%), Healthcare Support (12 | 1.6%), Personal Care & Service (11 | 1.5%), and Security & Protection (9 | 1.2%).
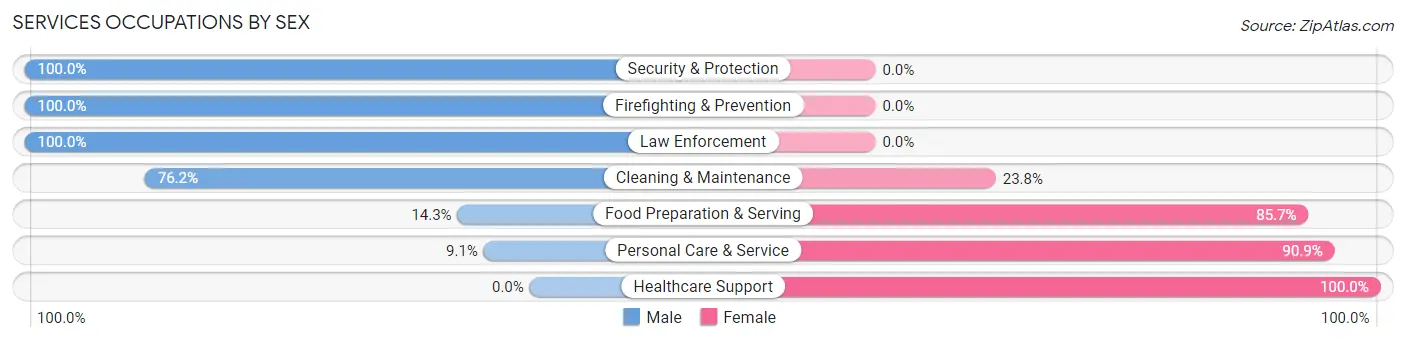
Services Occupations by Sex
Within the Services occupations in Summerdale, the most male-oriented occupations are Security & Protection (100.0%), Firefighting & Prevention (100.0%), and Law Enforcement (100.0%), while the most female-oriented occupations are Healthcare Support (100.0%), Personal Care & Service (90.9%), and Food Preparation & Serving (85.7%).
| Occupation | Male | Female |
| Healthcare Support | 0 (0.0%) | 12 (100.0%) |
| Security & Protection | 9 (100.0%) | 0 (0.0%) |
| Firefighting & Prevention | 5 (100.0%) | 0 (0.0%) |
| Law Enforcement | 4 (100.0%) | 0 (0.0%) |
| Food Preparation & Serving | 5 (14.3%) | 30 (85.7%) |
| Cleaning & Maintenance | 16 (76.2%) | 5 (23.8%) |
| Personal Care & Service | 1 (9.1%) | 10 (90.9%) |
| Total (Category) | 31 (35.2%) | 57 (64.8%) |
| Total (Overall) | 356 (48.7%) | 375 (51.3%) |
Sales and Office Occupations
The most common Sales and Office occupations in Summerdale are Sales & Related (109 | 14.9%), and Office & Administration (96 | 13.1%).
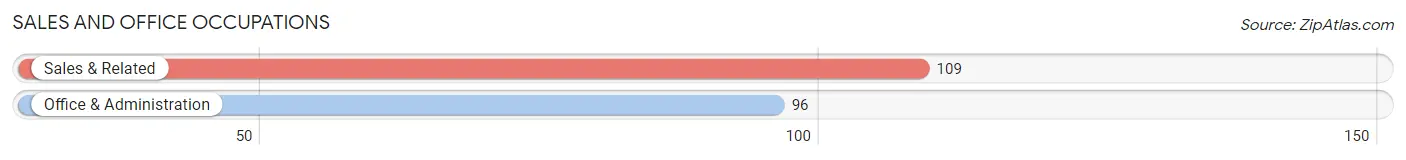
Sales and Office Occupations by Sex
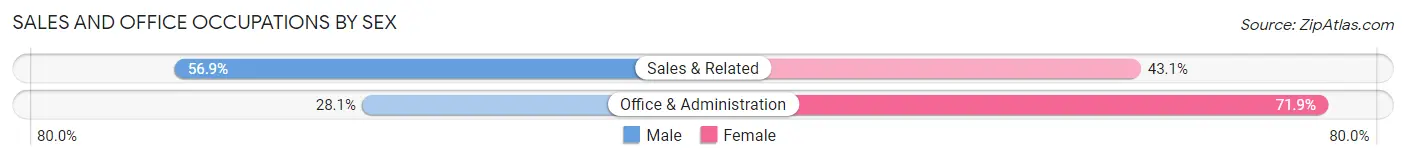
| Occupation | Male | Female |
| Sales & Related | 62 (56.9%) | 47 (43.1%) |
| Office & Administration | 27 (28.1%) | 69 (71.9%) |
| Total (Category) | 89 (43.4%) | 116 (56.6%) |
| Total (Overall) | 356 (48.7%) | 375 (51.3%) |
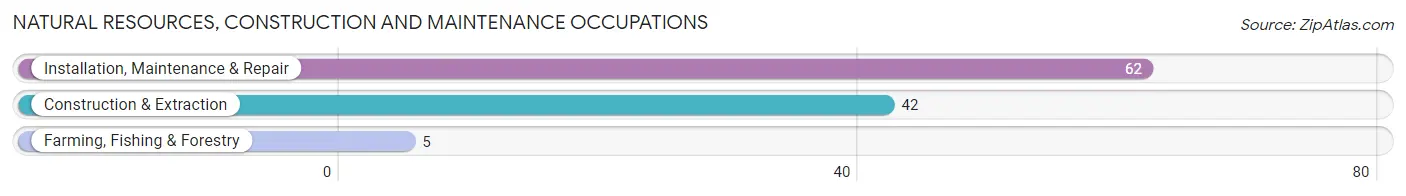
Natural Resources, Construction and Maintenance Occupations
The most common Natural Resources, Construction and Maintenance occupations in Summerdale are Installation, Maintenance & Repair (62 | 8.5%), Construction & Extraction (42 | 5.8%), and Farming, Fishing & Forestry (5 | 0.7%).
Natural Resources, Construction and Maintenance Occupations by Sex
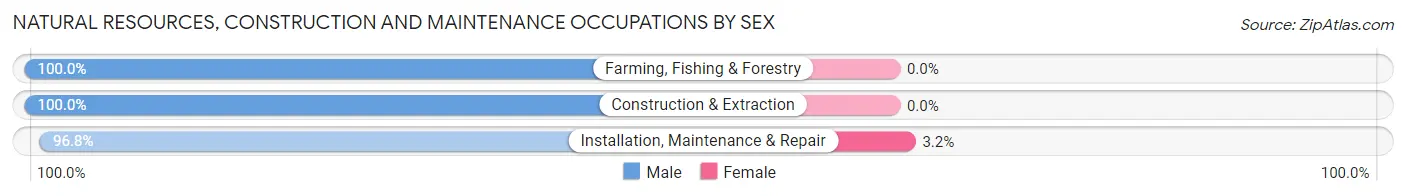
| Occupation | Male | Female |
| Farming, Fishing & Forestry | 5 (100.0%) | 0 (0.0%) |
| Construction & Extraction | 42 (100.0%) | 0 (0.0%) |
| Installation, Maintenance & Repair | 60 (96.8%) | 2 (3.2%) |
| Total (Category) | 107 (98.2%) | 2 (1.8%) |
| Total (Overall) | 356 (48.7%) | 375 (51.3%) |
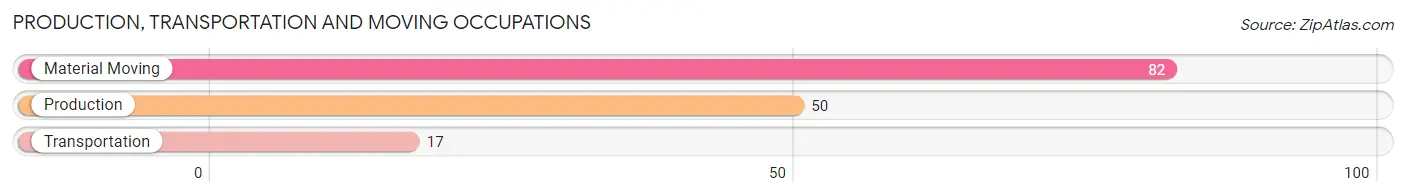
Production, Transportation and Moving Occupations
The most common Production, Transportation and Moving occupations in Summerdale are Material Moving (82 | 11.2%), Production (50 | 6.8%), and Transportation (17 | 2.3%).
Production, Transportation and Moving Occupations by Sex
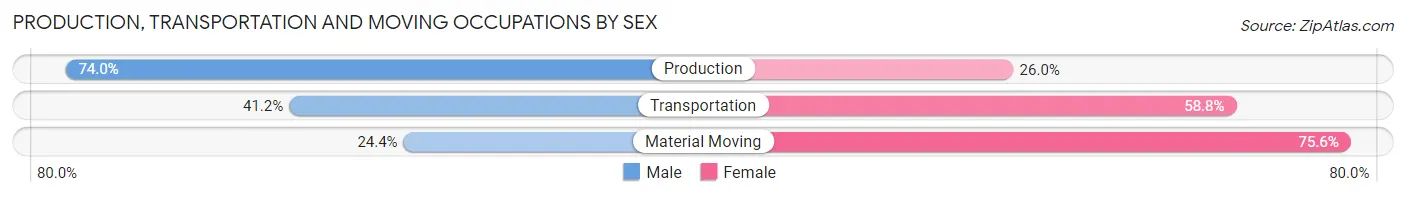
| Occupation | Male | Female |
| Production | 37 (74.0%) | 13 (26.0%) |
| Transportation | 7 (41.2%) | 10 (58.8%) |
| Material Moving | 20 (24.4%) | 62 (75.6%) |
| Total (Category) | 64 (42.9%) | 85 (57.1%) |
| Total (Overall) | 356 (48.7%) | 375 (51.3%) |
Employment Industries by Sex in Summerdale
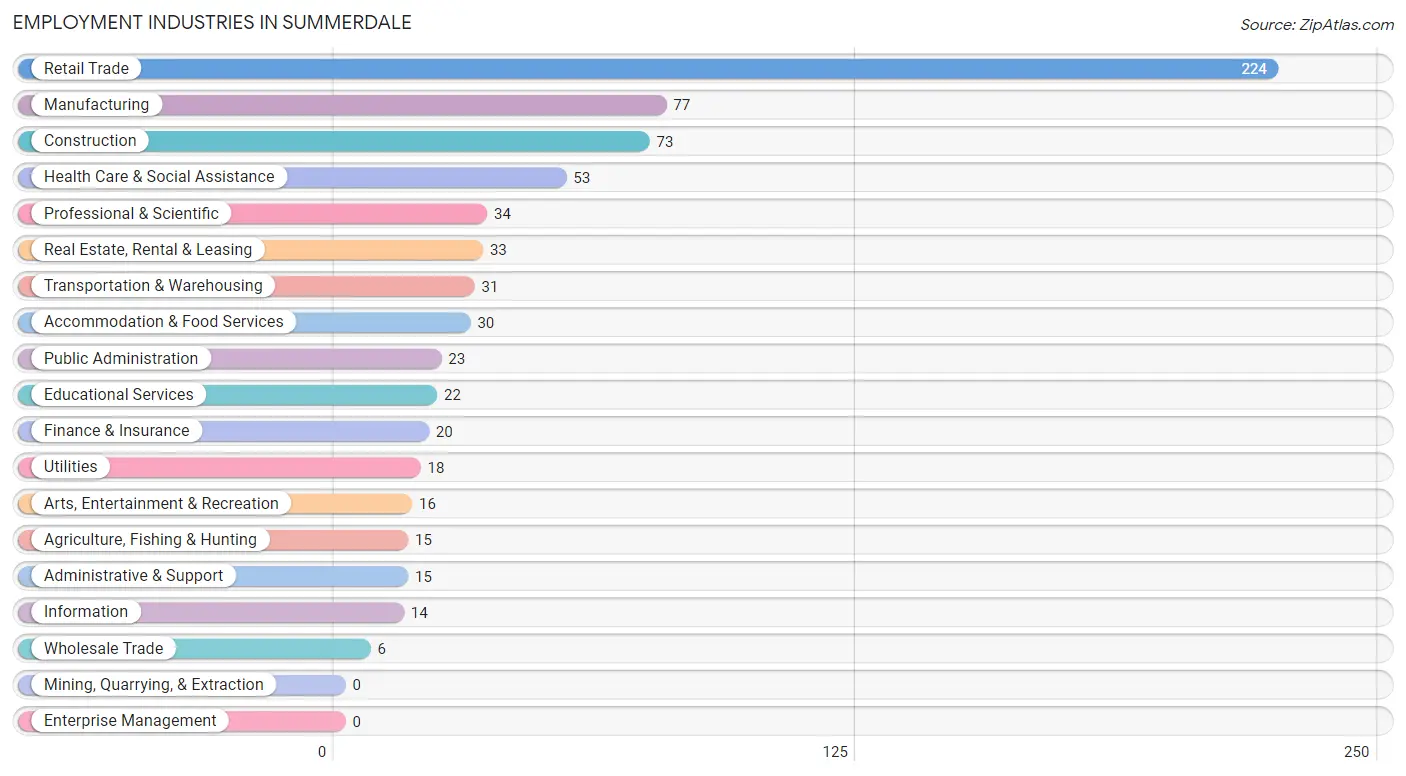
Employment Industries in Summerdale
The major employment industries in Summerdale include Retail Trade (224 | 30.6%), Manufacturing (77 | 10.5%), Construction (73 | 10.0%), Health Care & Social Assistance (53 | 7.2%), and Professional & Scientific (34 | 4.6%).
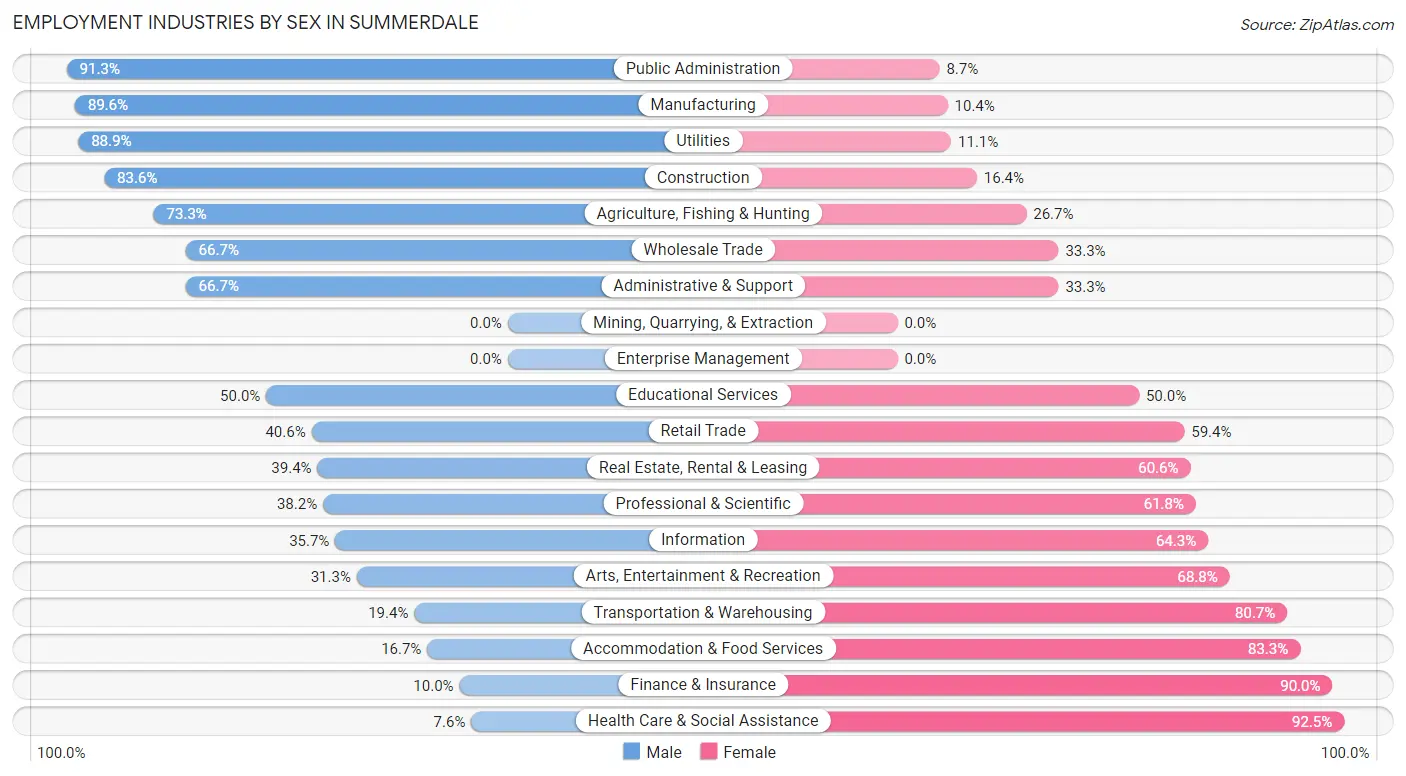
Employment Industries by Sex in Summerdale
The Summerdale industries that see more men than women are Public Administration (91.3%), Manufacturing (89.6%), and Utilities (88.9%), whereas the industries that tend to have a higher number of women are Health Care & Social Assistance (92.4%), Finance & Insurance (90.0%), and Accommodation & Food Services (83.3%).
| Industry | Male | Female |
| Agriculture, Fishing & Hunting | 11 (73.3%) | 4 (26.7%) |
| Mining, Quarrying, & Extraction | 0 (0.0%) | 0 (0.0%) |
| Construction | 61 (83.6%) | 12 (16.4%) |
| Manufacturing | 69 (89.6%) | 8 (10.4%) |
| Wholesale Trade | 4 (66.7%) | 2 (33.3%) |
| Retail Trade | 91 (40.6%) | 133 (59.4%) |
| Transportation & Warehousing | 6 (19.4%) | 25 (80.6%) |
| Utilities | 16 (88.9%) | 2 (11.1%) |
| Information | 5 (35.7%) | 9 (64.3%) |
| Finance & Insurance | 2 (10.0%) | 18 (90.0%) |
| Real Estate, Rental & Leasing | 13 (39.4%) | 20 (60.6%) |
| Professional & Scientific | 13 (38.2%) | 21 (61.8%) |
| Enterprise Management | 0 (0.0%) | 0 (0.0%) |
| Administrative & Support | 10 (66.7%) | 5 (33.3%) |
| Educational Services | 11 (50.0%) | 11 (50.0%) |
| Health Care & Social Assistance | 4 (7.5%) | 49 (92.4%) |
| Arts, Entertainment & Recreation | 5 (31.2%) | 11 (68.8%) |
| Accommodation & Food Services | 5 (16.7%) | 25 (83.3%) |
| Public Administration | 21 (91.3%) | 2 (8.7%) |
| Total | 356 (48.7%) | 375 (51.3%) |
Education in Summerdale
School Enrollment in Summerdale
The most common levels of schooling among the 209 students in Summerdale are high school (76 | 36.4%), middle school (50 | 23.9%), and college / undergraduate (33 | 15.8%).
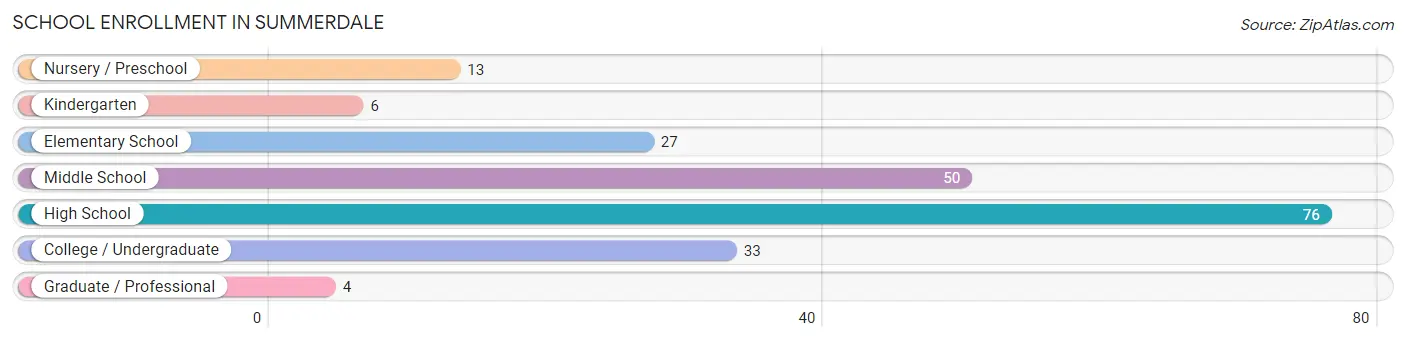
| School Level | # Students | % Students |
| Nursery / Preschool | 13 | 6.2% |
| Kindergarten | 6 | 2.9% |
| Elementary School | 27 | 12.9% |
| Middle School | 50 | 23.9% |
| High School | 76 | 36.4% |
| College / Undergraduate | 33 | 15.8% |
| Graduate / Professional | 4 | 1.9% |
| Total | 209 | 100.0% |
School Enrollment by Age by Funding Source in Summerdale
Out of a total of 209 students who are enrolled in schools in Summerdale, 16 (7.7%) attend a private institution, while the remaining 193 (92.3%) are enrolled in public schools. The age group of 3 to 4 year olds has the highest likelihood of being enrolled in private schools, with 9 (69.2% in the age bracket) enrolled. Conversely, the age group of 15 to 17 year olds has the lowest likelihood of being enrolled in a private school, with 64 (100.0% in the age bracket) attending a public institution.
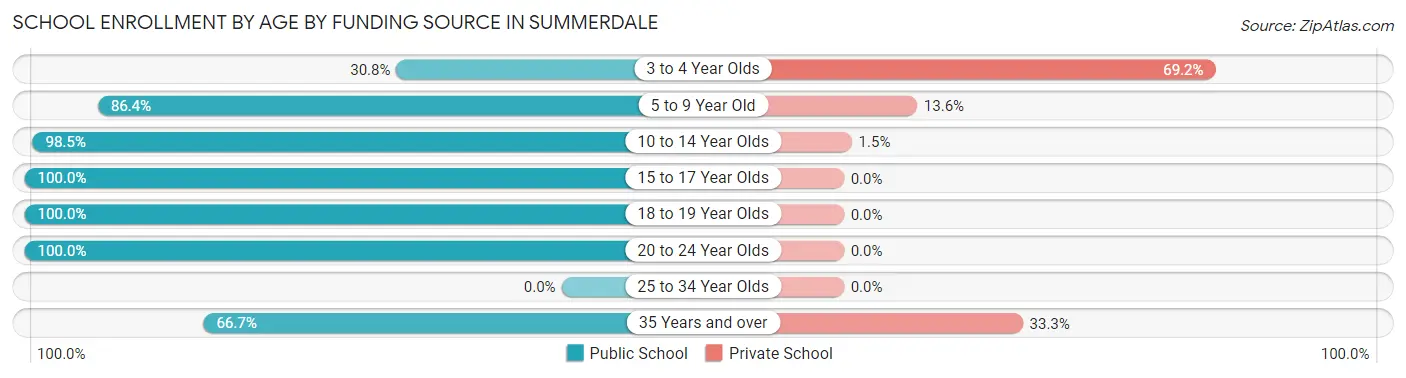
| Age Bracket | Public School | Private School |
| 3 to 4 Year Olds | 4 (30.8%) | 9 (69.2%) |
| 5 to 9 Year Old | 19 (86.4%) | 3 (13.6%) |
| 10 to 14 Year Olds | 66 (98.5%) | 1 (1.5%) |
| 15 to 17 Year Olds | 64 (100.0%) | 0 (0.0%) |
| 18 to 19 Year Olds | 14 (100.0%) | 0 (0.0%) |
| 20 to 24 Year Olds | 20 (100.0%) | 0 (0.0%) |
| 25 to 34 Year Olds | 0 (0.0%) | 0 (0.0%) |
| 35 Years and over | 6 (66.7%) | 3 (33.3%) |
| Total | 193 (92.3%) | 16 (7.7%) |
Educational Attainment by Field of Study in Summerdale
Business (45 | 18.6%), education (40 | 16.5%), arts & humanities (31 | 12.8%), computers & mathematics (23 | 9.5%), and science & technology (22 | 9.1%) are the most common fields of study among 242 individuals in Summerdale who have obtained a bachelor's degree or higher.
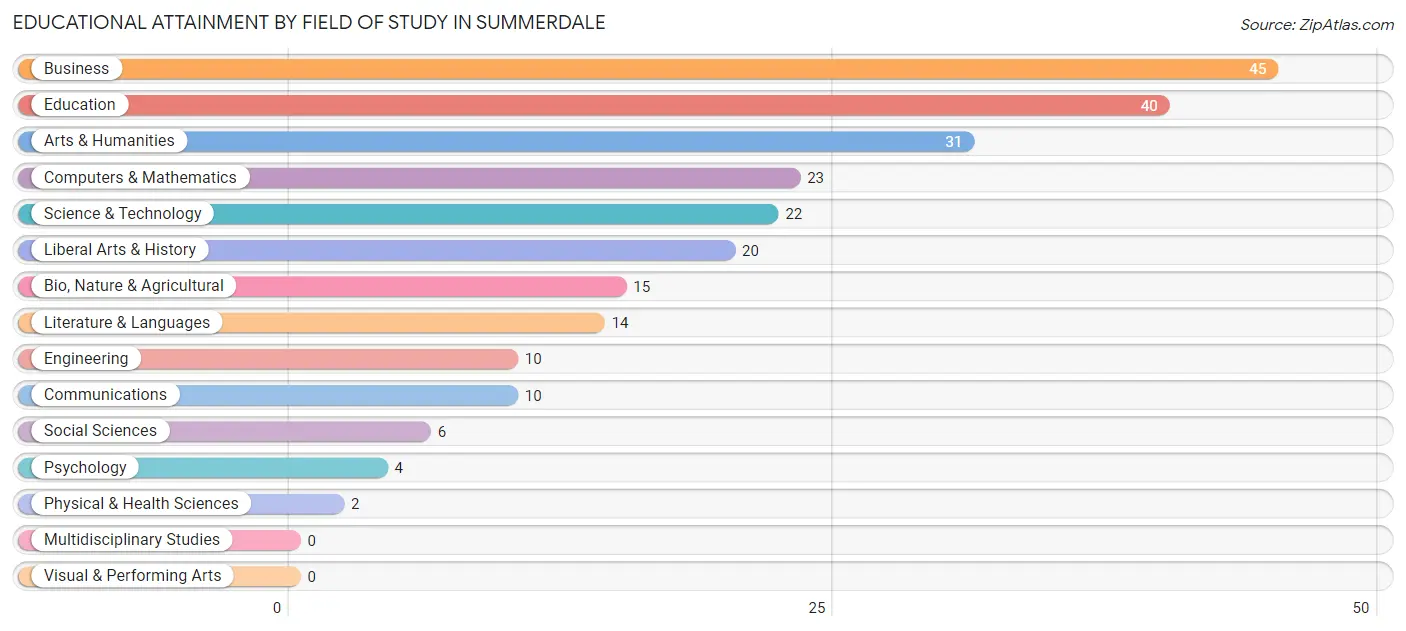
| Field of Study | # Graduates | % Graduates |
| Computers & Mathematics | 23 | 9.5% |
| Bio, Nature & Agricultural | 15 | 6.2% |
| Physical & Health Sciences | 2 | 0.8% |
| Psychology | 4 | 1.7% |
| Social Sciences | 6 | 2.5% |
| Engineering | 10 | 4.1% |
| Multidisciplinary Studies | 0 | 0.0% |
| Science & Technology | 22 | 9.1% |
| Business | 45 | 18.6% |
| Education | 40 | 16.5% |
| Literature & Languages | 14 | 5.8% |
| Liberal Arts & History | 20 | 8.3% |
| Visual & Performing Arts | 0 | 0.0% |
| Communications | 10 | 4.1% |
| Arts & Humanities | 31 | 12.8% |
| Total | 242 | 100.0% |
Transportation & Commute in Summerdale
Vehicle Availability by Sex in Summerdale
The most prevalent vehicle ownership categories in Summerdale are males with 2 vehicles (147, accounting for 41.3%) and females with 2 vehicles (167, making up 40.1%).
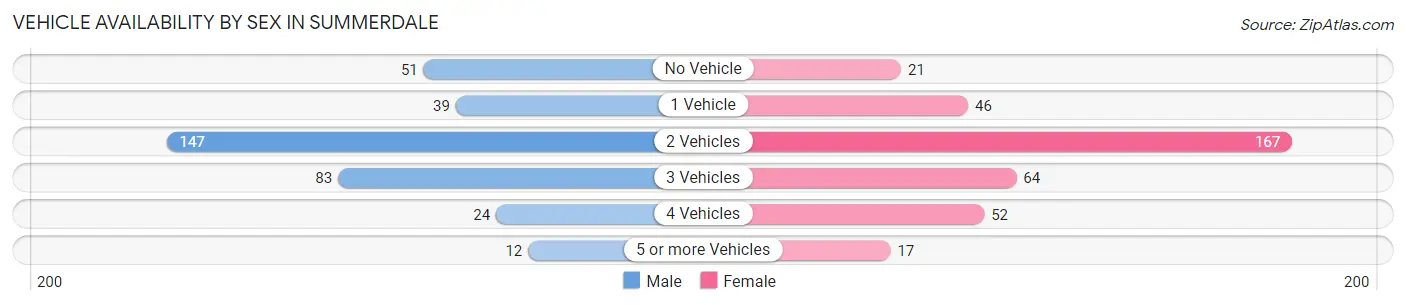
| Vehicles Available | Male | Female |
| No Vehicle | 51 (14.3%) | 21 (5.7%) |
| 1 Vehicle | 39 (11.0%) | 46 (12.5%) |
| 2 Vehicles | 147 (41.3%) | 167 (45.5%) |
| 3 Vehicles | 83 (23.3%) | 64 (17.4%) |
| 4 Vehicles | 24 (6.7%) | 52 (14.2%) |
| 5 or more Vehicles | 12 (3.4%) | 17 (4.6%) |
| Total | 356 (100.0%) | 367 (100.0%) |
Commute Time in Summerdale
The most frequently occuring commute durations in Summerdale are 15 to 19 minutes (138 commuters, 19.6%), 30 to 34 minutes (112 commuters, 15.9%), and 10 to 14 minutes (98 commuters, 13.9%).
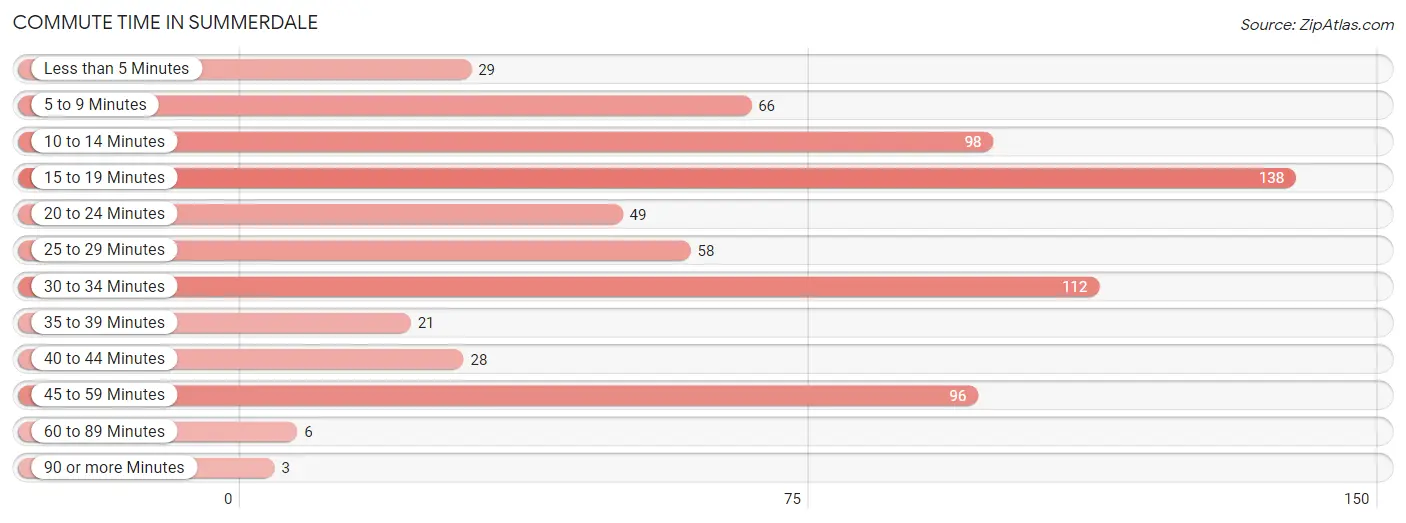
| Commute Time | # Commuters | % Commuters |
| Less than 5 Minutes | 29 | 4.1% |
| 5 to 9 Minutes | 66 | 9.4% |
| 10 to 14 Minutes | 98 | 13.9% |
| 15 to 19 Minutes | 138 | 19.6% |
| 20 to 24 Minutes | 49 | 7.0% |
| 25 to 29 Minutes | 58 | 8.2% |
| 30 to 34 Minutes | 112 | 15.9% |
| 35 to 39 Minutes | 21 | 3.0% |
| 40 to 44 Minutes | 28 | 4.0% |
| 45 to 59 Minutes | 96 | 13.6% |
| 60 to 89 Minutes | 6 | 0.9% |
| 90 or more Minutes | 3 | 0.4% |
Commute Time by Sex in Summerdale
The most common commute times in Summerdale are 15 to 19 minutes (72 commuters, 20.7%) for males and 15 to 19 minutes (66 commuters, 18.5%) for females.
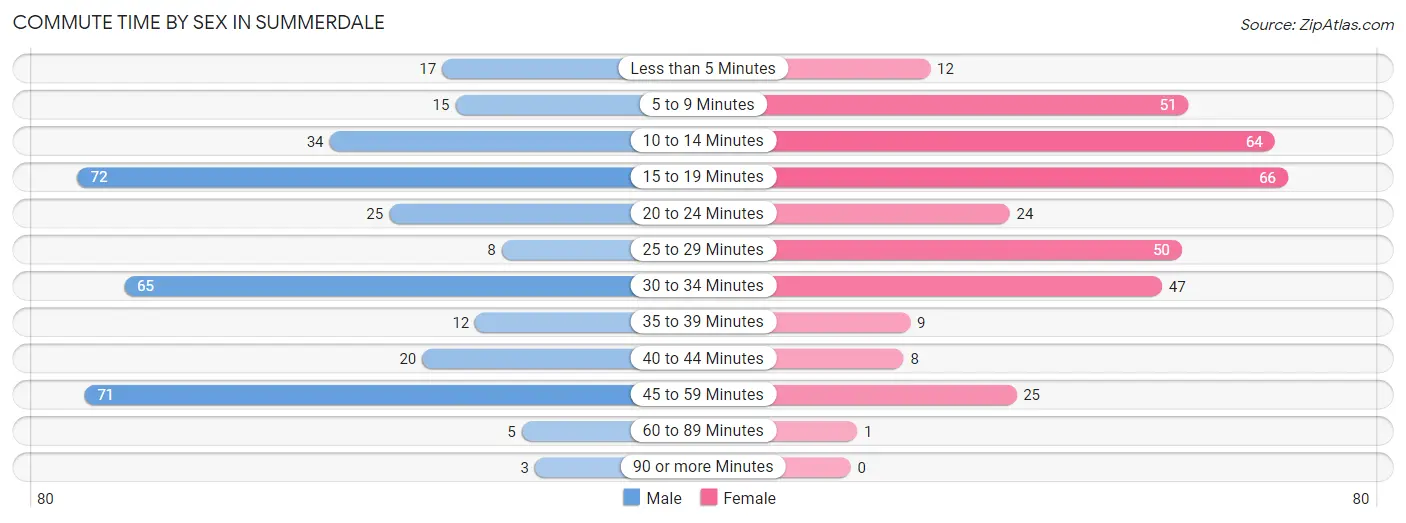
| Commute Time | Male | Female |
| Less than 5 Minutes | 17 (4.9%) | 12 (3.4%) |
| 5 to 9 Minutes | 15 (4.3%) | 51 (14.3%) |
| 10 to 14 Minutes | 34 (9.8%) | 64 (17.9%) |
| 15 to 19 Minutes | 72 (20.7%) | 66 (18.5%) |
| 20 to 24 Minutes | 25 (7.2%) | 24 (6.7%) |
| 25 to 29 Minutes | 8 (2.3%) | 50 (14.0%) |
| 30 to 34 Minutes | 65 (18.7%) | 47 (13.2%) |
| 35 to 39 Minutes | 12 (3.5%) | 9 (2.5%) |
| 40 to 44 Minutes | 20 (5.8%) | 8 (2.2%) |
| 45 to 59 Minutes | 71 (20.5%) | 25 (7.0%) |
| 60 to 89 Minutes | 5 (1.4%) | 1 (0.3%) |
| 90 or more Minutes | 3 (0.9%) | 0 (0.0%) |
Time of Departure to Work by Sex in Summerdale
The most frequent times of departure to work in Summerdale are 7:00 AM to 7:29 AM (95, 27.4%) for males and 7:00 AM to 7:29 AM (66, 18.5%) for females.
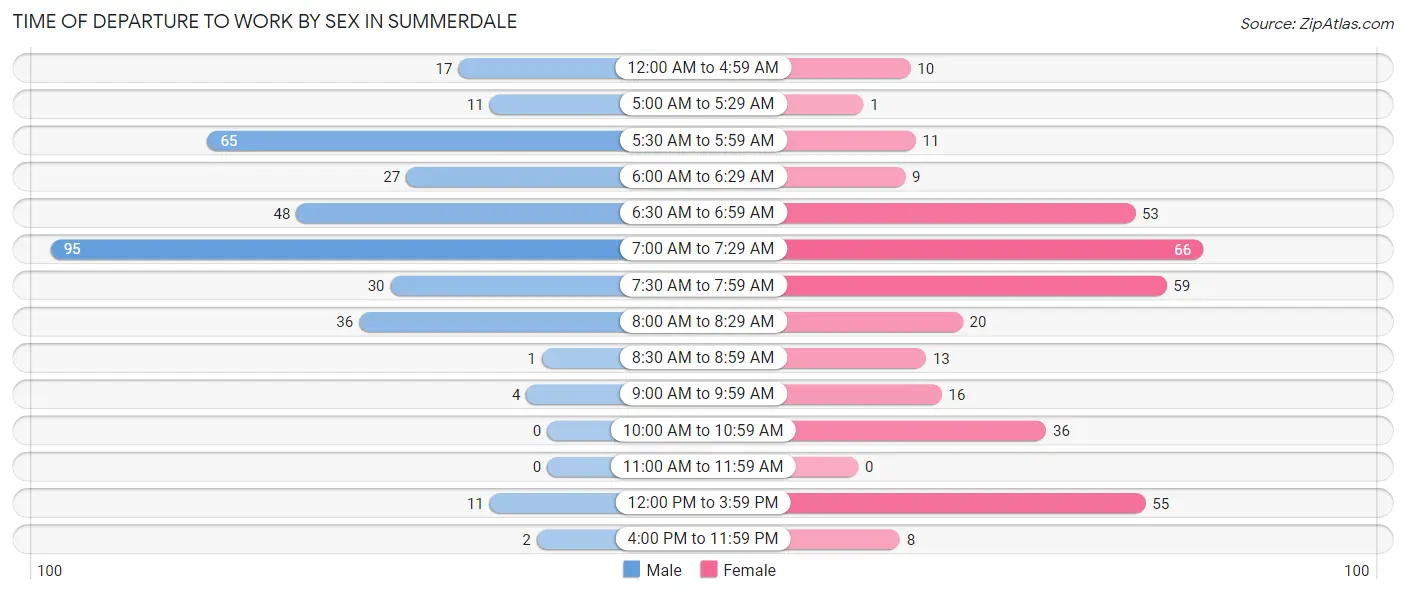
| Time of Departure | Male | Female |
| 12:00 AM to 4:59 AM | 17 (4.9%) | 10 (2.8%) |
| 5:00 AM to 5:29 AM | 11 (3.2%) | 1 (0.3%) |
| 5:30 AM to 5:59 AM | 65 (18.7%) | 11 (3.1%) |
| 6:00 AM to 6:29 AM | 27 (7.8%) | 9 (2.5%) |
| 6:30 AM to 6:59 AM | 48 (13.8%) | 53 (14.8%) |
| 7:00 AM to 7:29 AM | 95 (27.4%) | 66 (18.5%) |
| 7:30 AM to 7:59 AM | 30 (8.6%) | 59 (16.5%) |
| 8:00 AM to 8:29 AM | 36 (10.4%) | 20 (5.6%) |
| 8:30 AM to 8:59 AM | 1 (0.3%) | 13 (3.6%) |
| 9:00 AM to 9:59 AM | 4 (1.1%) | 16 (4.5%) |
| 10:00 AM to 10:59 AM | 0 (0.0%) | 36 (10.1%) |
| 11:00 AM to 11:59 AM | 0 (0.0%) | 0 (0.0%) |
| 12:00 PM to 3:59 PM | 11 (3.2%) | 55 (15.4%) |
| 4:00 PM to 11:59 PM | 2 (0.6%) | 8 (2.2%) |
| Total | 347 (100.0%) | 357 (100.0%) |
Housing Occupancy in Summerdale
Occupancy by Ownership in Summerdale
Of the total 558 dwellings in Summerdale, owner-occupied units account for 487 (87.3%), while renter-occupied units make up 71 (12.7%).
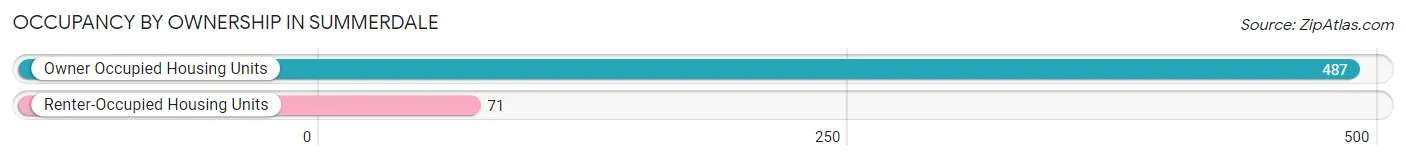
| Occupancy | # Housing Units | % Housing Units |
| Owner Occupied Housing Units | 487 | 87.3% |
| Renter-Occupied Housing Units | 71 | 12.7% |
| Total Occupied Housing Units | 558 | 100.0% |
Occupancy by Household Size in Summerdale
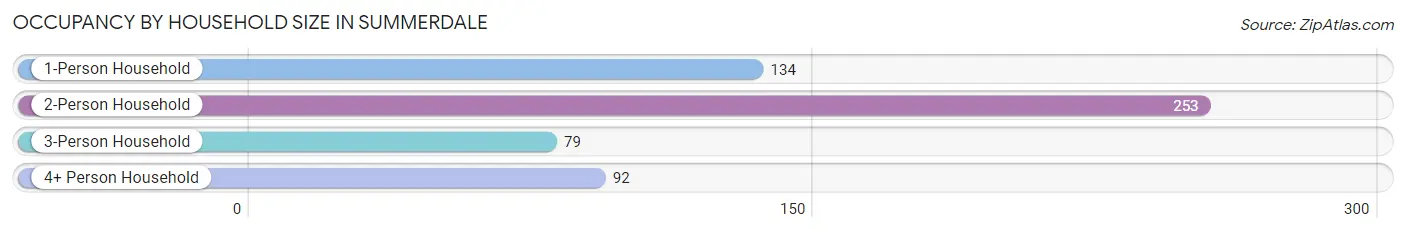
| Household Size | # Housing Units | % Housing Units |
| 1-Person Household | 134 | 24.0% |
| 2-Person Household | 253 | 45.3% |
| 3-Person Household | 79 | 14.2% |
| 4+ Person Household | 92 | 16.5% |
| Total Housing Units | 558 | 100.0% |
Occupancy by Ownership by Household Size in Summerdale
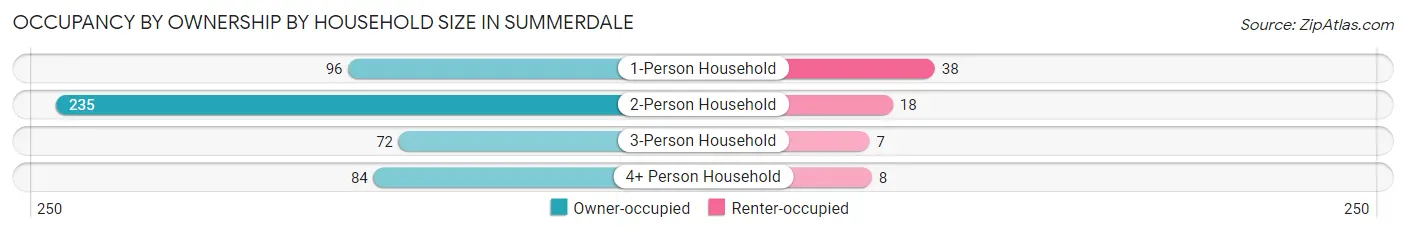
| Household Size | Owner-occupied | Renter-occupied |
| 1-Person Household | 96 (71.6%) | 38 (28.4%) |
| 2-Person Household | 235 (92.9%) | 18 (7.1%) |
| 3-Person Household | 72 (91.1%) | 7 (8.9%) |
| 4+ Person Household | 84 (91.3%) | 8 (8.7%) |
| Total Housing Units | 487 (87.3%) | 71 (12.7%) |
Occupancy by Educational Attainment in Summerdale
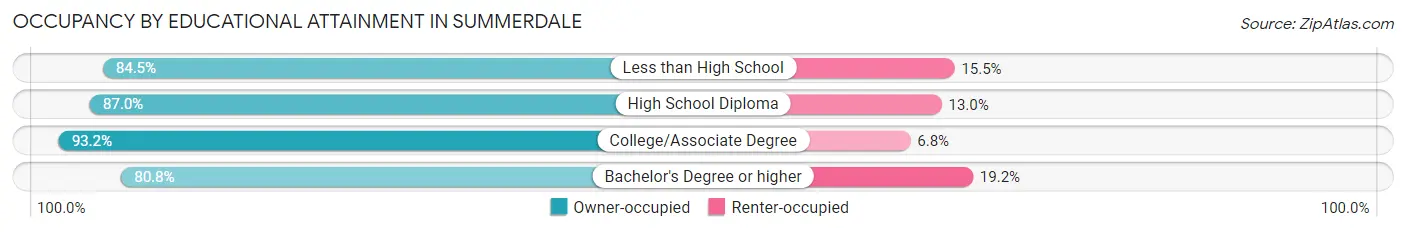
| Household Size | Owner-occupied | Renter-occupied |
| Less than High School | 49 (84.5%) | 9 (15.5%) |
| High School Diploma | 141 (87.0%) | 21 (13.0%) |
| College/Associate Degree | 179 (93.2%) | 13 (6.8%) |
| Bachelor's Degree or higher | 118 (80.8%) | 28 (19.2%) |
Occupancy by Age of Householder in Summerdale
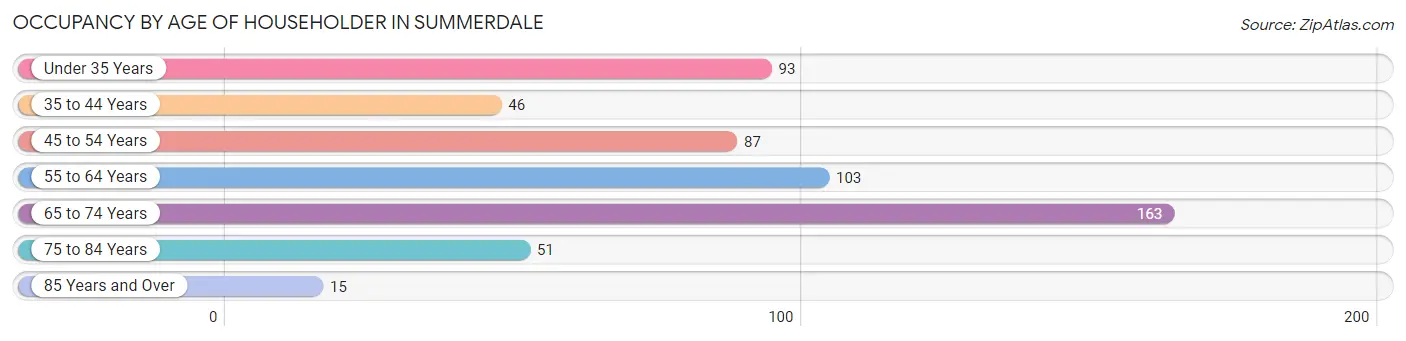
| Age Bracket | # Households | % Households |
| Under 35 Years | 93 | 16.7% |
| 35 to 44 Years | 46 | 8.2% |
| 45 to 54 Years | 87 | 15.6% |
| 55 to 64 Years | 103 | 18.5% |
| 65 to 74 Years | 163 | 29.2% |
| 75 to 84 Years | 51 | 9.1% |
| 85 Years and Over | 15 | 2.7% |
| Total | 558 | 100.0% |
Housing Finances in Summerdale
Median Income by Occupancy in Summerdale
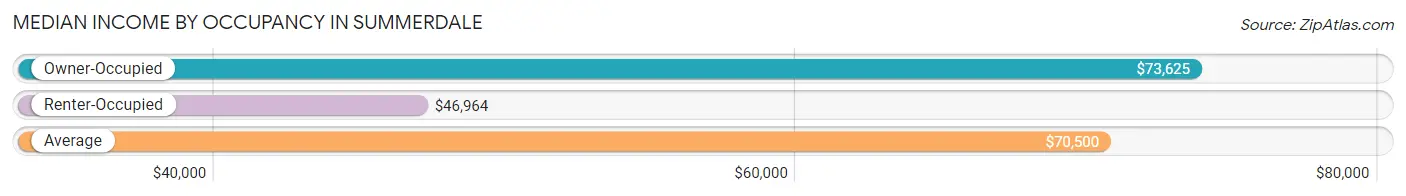
| Occupancy Type | # Households | Median Income |
| Owner-Occupied | 487 (87.3%) | $73,625 |
| Renter-Occupied | 71 (12.7%) | $46,964 |
| Average | 558 (100.0%) | $70,500 |
Occupancy by Householder Income Bracket in Summerdale
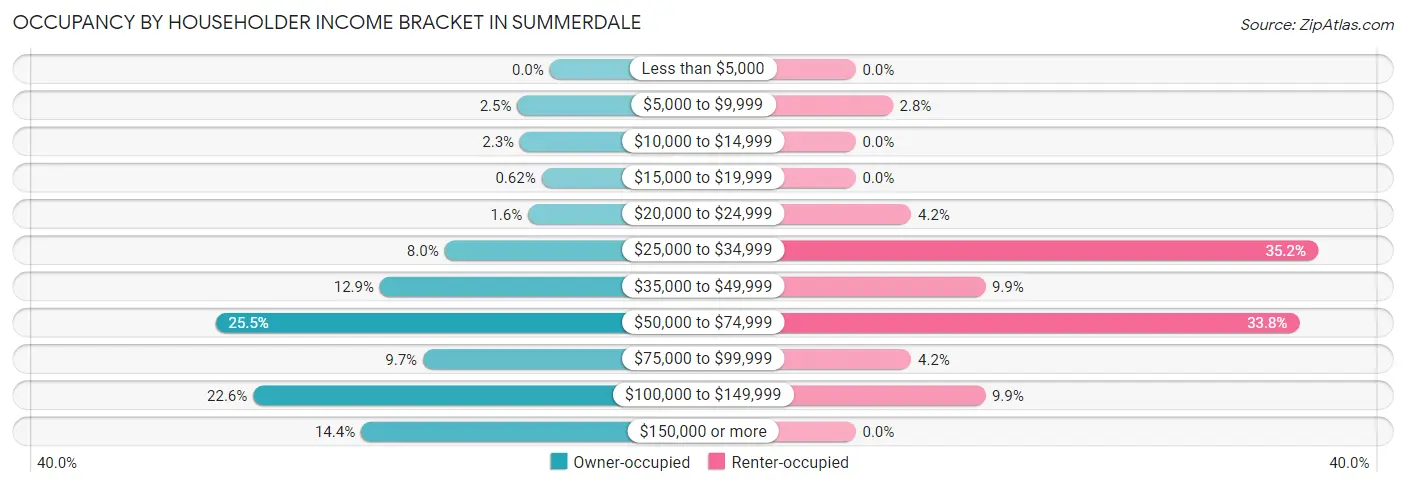
| Income Bracket | Owner-occupied | Renter-occupied |
| Less than $5,000 | 0 (0.0%) | 0 (0.0%) |
| $5,000 to $9,999 | 12 (2.5%) | 2 (2.8%) |
| $10,000 to $14,999 | 11 (2.3%) | 0 (0.0%) |
| $15,000 to $19,999 | 3 (0.6%) | 0 (0.0%) |
| $20,000 to $24,999 | 8 (1.6%) | 3 (4.2%) |
| $25,000 to $34,999 | 39 (8.0%) | 25 (35.2%) |
| $35,000 to $49,999 | 63 (12.9%) | 7 (9.9%) |
| $50,000 to $74,999 | 124 (25.5%) | 24 (33.8%) |
| $75,000 to $99,999 | 47 (9.7%) | 3 (4.2%) |
| $100,000 to $149,999 | 110 (22.6%) | 7 (9.9%) |
| $150,000 or more | 70 (14.4%) | 0 (0.0%) |
| Total | 487 (100.0%) | 71 (100.0%) |
Monthly Housing Cost Tiers in Summerdale
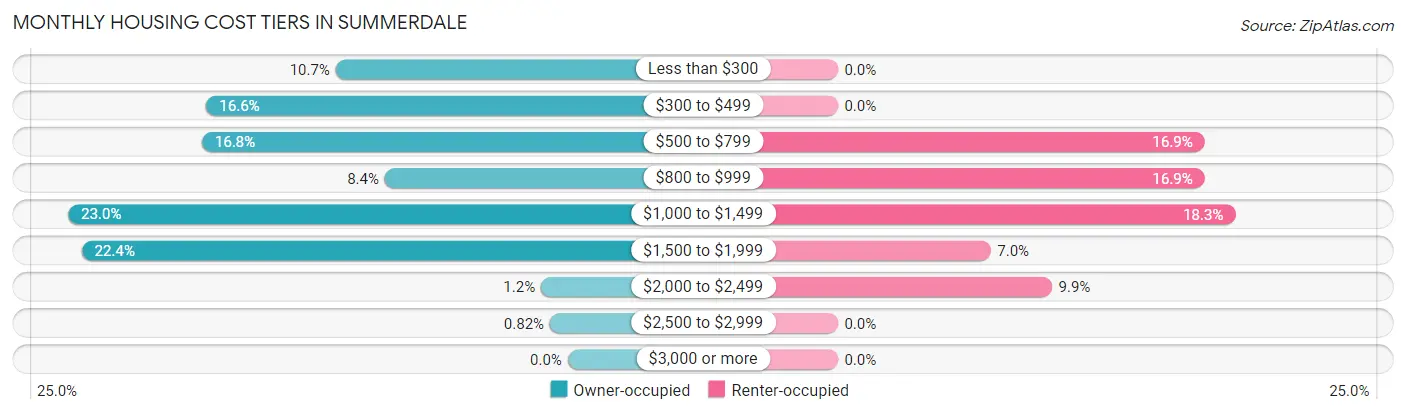
| Monthly Cost | Owner-occupied | Renter-occupied |
| Less than $300 | 52 (10.7%) | 0 (0.0%) |
| $300 to $499 | 81 (16.6%) | 0 (0.0%) |
| $500 to $799 | 82 (16.8%) | 12 (16.9%) |
| $800 to $999 | 41 (8.4%) | 12 (16.9%) |
| $1,000 to $1,499 | 112 (23.0%) | 13 (18.3%) |
| $1,500 to $1,999 | 109 (22.4%) | 5 (7.0%) |
| $2,000 to $2,499 | 6 (1.2%) | 7 (9.9%) |
| $2,500 to $2,999 | 4 (0.8%) | 0 (0.0%) |
| $3,000 or more | 0 (0.0%) | 0 (0.0%) |
| Total | 487 (100.0%) | 71 (100.0%) |
Physical Housing Characteristics in Summerdale
Housing Structures in Summerdale
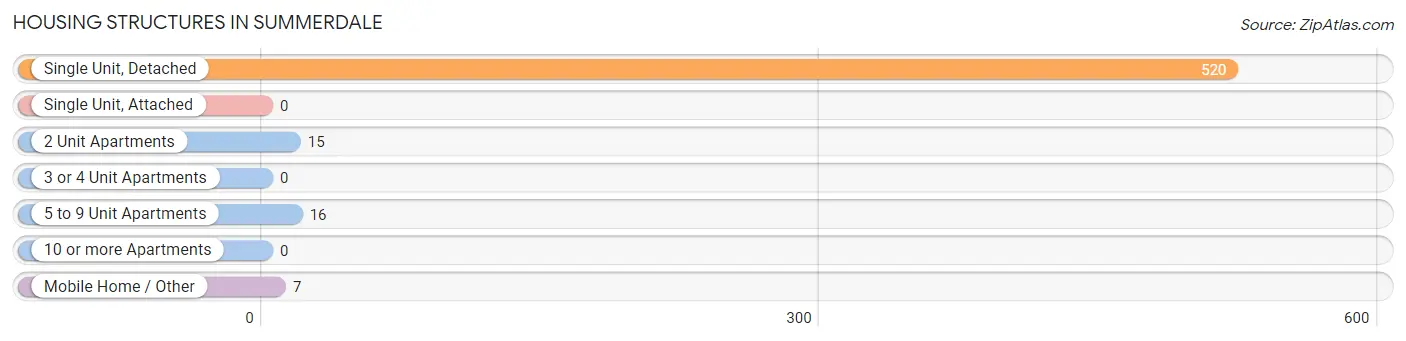
| Structure Type | # Housing Units | % Housing Units |
| Single Unit, Detached | 520 | 93.2% |
| Single Unit, Attached | 0 | 0.0% |
| 2 Unit Apartments | 15 | 2.7% |
| 3 or 4 Unit Apartments | 0 | 0.0% |
| 5 to 9 Unit Apartments | 16 | 2.9% |
| 10 or more Apartments | 0 | 0.0% |
| Mobile Home / Other | 7 | 1.3% |
| Total | 558 | 100.0% |
Housing Structures by Occupancy in Summerdale
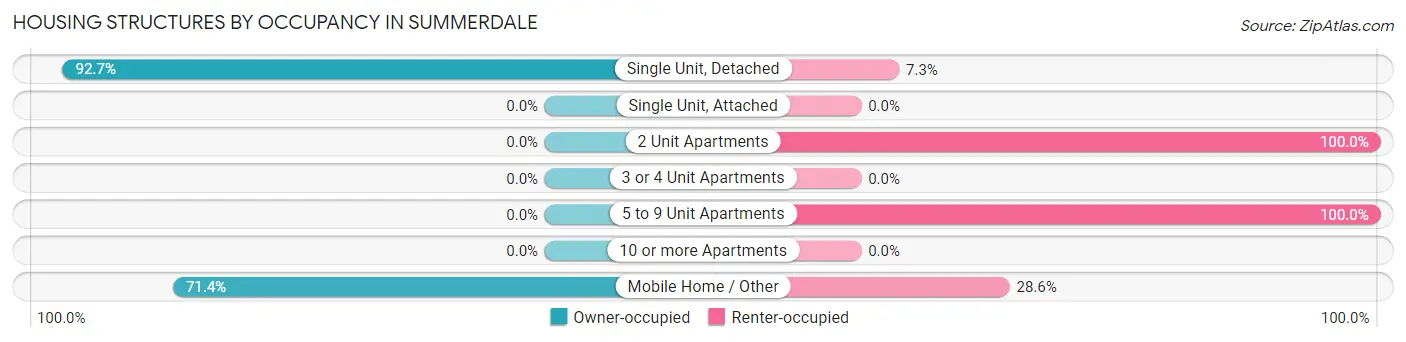
| Structure Type | Owner-occupied | Renter-occupied |
| Single Unit, Detached | 482 (92.7%) | 38 (7.3%) |
| Single Unit, Attached | 0 (0.0%) | 0 (0.0%) |
| 2 Unit Apartments | 0 (0.0%) | 15 (100.0%) |
| 3 or 4 Unit Apartments | 0 (0.0%) | 0 (0.0%) |
| 5 to 9 Unit Apartments | 0 (0.0%) | 16 (100.0%) |
| 10 or more Apartments | 0 (0.0%) | 0 (0.0%) |
| Mobile Home / Other | 5 (71.4%) | 2 (28.6%) |
| Total | 487 (87.3%) | 71 (12.7%) |
Housing Structures by Number of Rooms in Summerdale

| Number of Rooms | Owner-occupied | Renter-occupied |
| 1 Room | 8 (1.6%) | 4 (5.6%) |
| 2 or 3 Rooms | 7 (1.4%) | 9 (12.7%) |
| 4 or 5 Rooms | 132 (27.1%) | 44 (62.0%) |
| 6 or 7 Rooms | 177 (36.3%) | 11 (15.5%) |
| 8 or more Rooms | 163 (33.5%) | 3 (4.2%) |
| Total | 487 (100.0%) | 71 (100.0%) |
Housing Structure by Heating Type in Summerdale
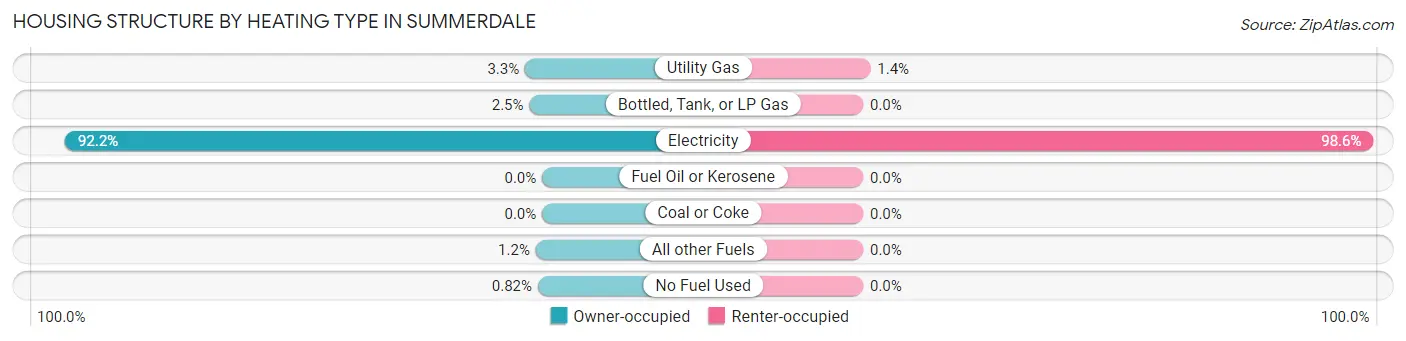
| Heating Type | Owner-occupied | Renter-occupied |
| Utility Gas | 16 (3.3%) | 1 (1.4%) |
| Bottled, Tank, or LP Gas | 12 (2.5%) | 0 (0.0%) |
| Electricity | 449 (92.2%) | 70 (98.6%) |
| Fuel Oil or Kerosene | 0 (0.0%) | 0 (0.0%) |
| Coal or Coke | 0 (0.0%) | 0 (0.0%) |
| All other Fuels | 6 (1.2%) | 0 (0.0%) |
| No Fuel Used | 4 (0.8%) | 0 (0.0%) |
| Total | 487 (100.0%) | 71 (100.0%) |
Household Vehicle Usage in Summerdale
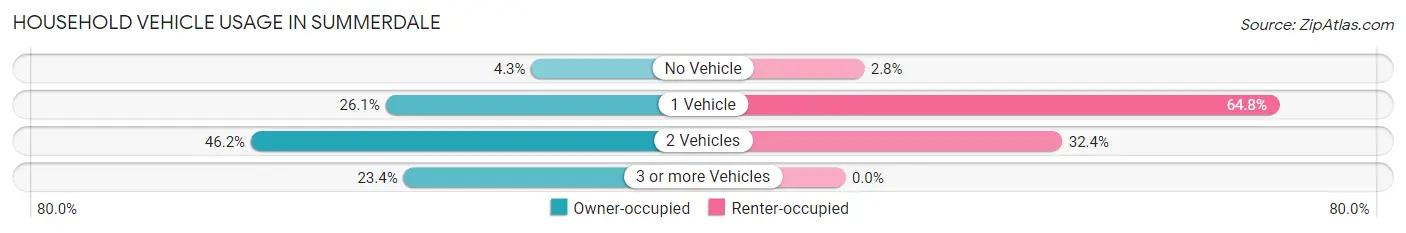
| Vehicles per Household | Owner-occupied | Renter-occupied |
| No Vehicle | 21 (4.3%) | 2 (2.8%) |
| 1 Vehicle | 127 (26.1%) | 46 (64.8%) |
| 2 Vehicles | 225 (46.2%) | 23 (32.4%) |
| 3 or more Vehicles | 114 (23.4%) | 0 (0.0%) |
| Total | 487 (100.0%) | 71 (100.0%) |
Real Estate & Mortgages in Summerdale
Real Estate and Mortgage Overview in Summerdale
| Characteristic | Without Mortgage | With Mortgage |
| Housing Units | 211 | 276 |
| Median Property Value | $263,900 | $222,800 |
| Median Household Income | $72,865 | $30 |
| Monthly Housing Costs | $424 | $0 |
| Real Estate Taxes | $627 | $10 |
Property Value by Mortgage Status in Summerdale
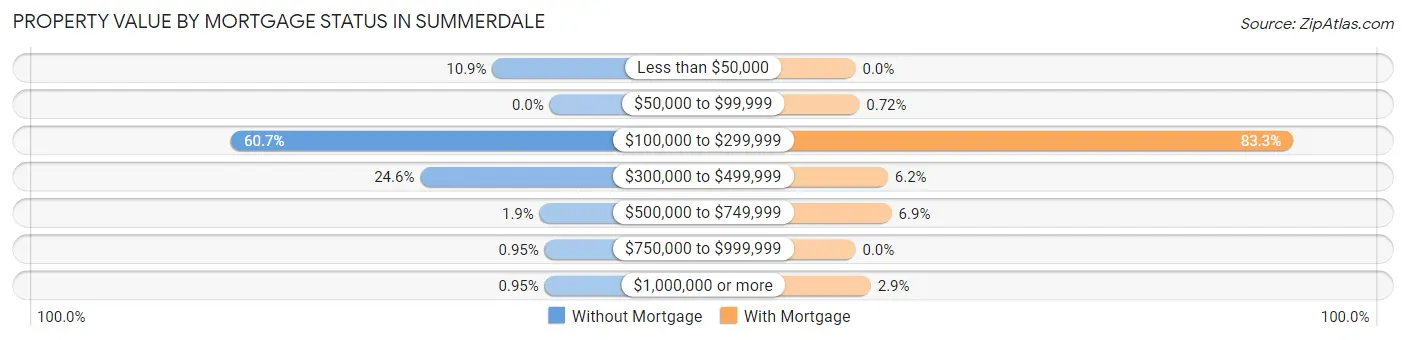
| Property Value | Without Mortgage | With Mortgage |
| Less than $50,000 | 23 (10.9%) | 0 (0.0%) |
| $50,000 to $99,999 | 0 (0.0%) | 2 (0.7%) |
| $100,000 to $299,999 | 128 (60.7%) | 230 (83.3%) |
| $300,000 to $499,999 | 52 (24.6%) | 17 (6.2%) |
| $500,000 to $749,999 | 4 (1.9%) | 19 (6.9%) |
| $750,000 to $999,999 | 2 (0.9%) | 0 (0.0%) |
| $1,000,000 or more | 2 (0.9%) | 8 (2.9%) |
| Total | 211 (100.0%) | 276 (100.0%) |
Household Income by Mortgage Status in Summerdale
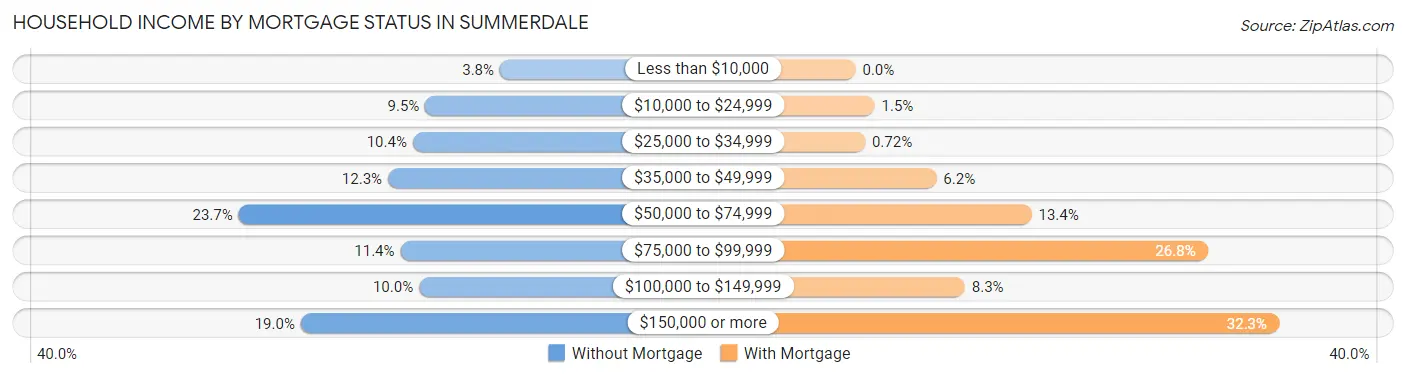
| Household Income | Without Mortgage | With Mortgage |
| Less than $10,000 | 8 (3.8%) | 0 (0.0%) |
| $10,000 to $24,999 | 20 (9.5%) | 4 (1.5%) |
| $25,000 to $34,999 | 22 (10.4%) | 2 (0.7%) |
| $35,000 to $49,999 | 26 (12.3%) | 17 (6.2%) |
| $50,000 to $74,999 | 50 (23.7%) | 37 (13.4%) |
| $75,000 to $99,999 | 24 (11.4%) | 74 (26.8%) |
| $100,000 to $149,999 | 21 (10.0%) | 23 (8.3%) |
| $150,000 or more | 40 (19.0%) | 89 (32.3%) |
| Total | 211 (100.0%) | 276 (100.0%) |
Property Value to Household Income Ratio in Summerdale
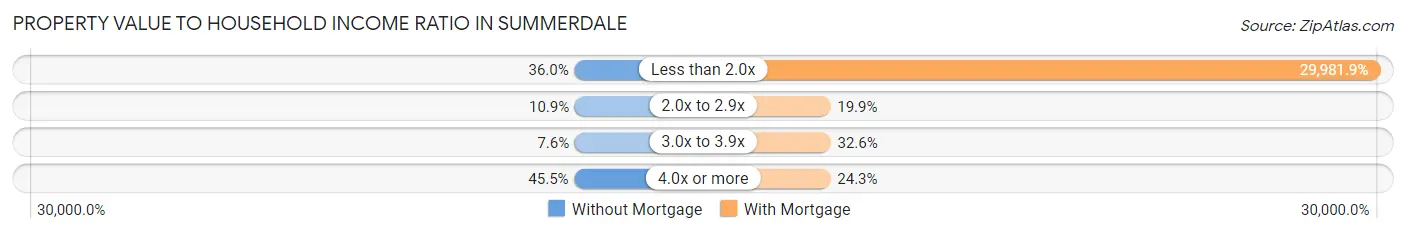
| Value-to-Income Ratio | Without Mortgage | With Mortgage |
| Less than 2.0x | 76 (36.0%) | 82,750 (29,981.9%) |
| 2.0x to 2.9x | 23 (10.9%) | 55 (19.9%) |
| 3.0x to 3.9x | 16 (7.6%) | 90 (32.6%) |
| 4.0x or more | 96 (45.5%) | 67 (24.3%) |
| Total | 211 (100.0%) | 276 (100.0%) |
Real Estate Taxes by Mortgage Status in Summerdale
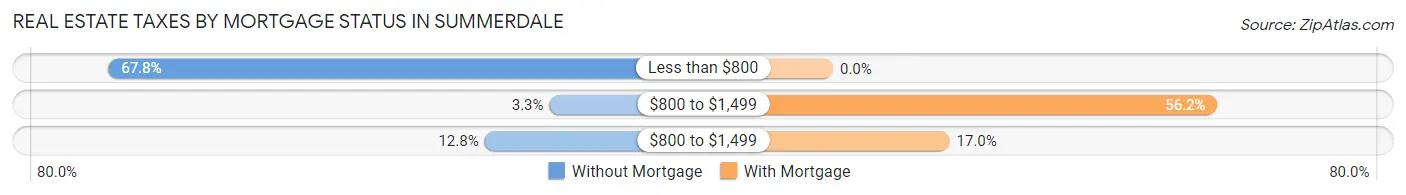
| Property Taxes | Without Mortgage | With Mortgage |
| Less than $800 | 143 (67.8%) | 0 (0.0%) |
| $800 to $1,499 | 7 (3.3%) | 155 (56.2%) |
| $800 to $1,499 | 27 (12.8%) | 47 (17.0%) |
| Total | 211 (100.0%) | 276 (100.0%) |
Health & Disability in Summerdale
Health Insurance Coverage by Age in Summerdale
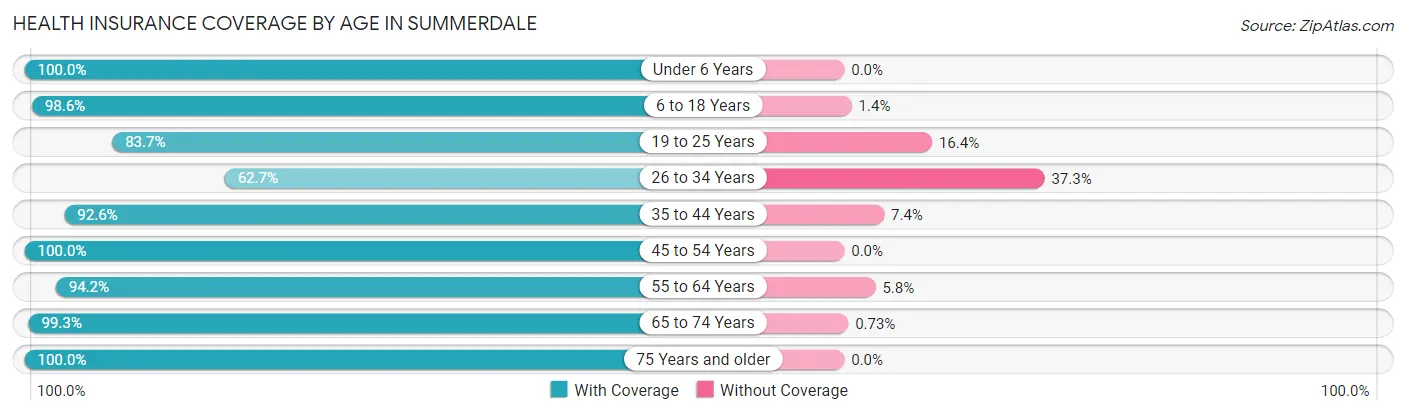
| Age Bracket | With Coverage | Without Coverage |
| Under 6 Years | 80 (100.0%) | 0 (0.0%) |
| 6 to 18 Years | 144 (98.6%) | 2 (1.4%) |
| 19 to 25 Years | 174 (83.7%) | 34 (16.4%) |
| 26 to 34 Years | 94 (62.7%) | 56 (37.3%) |
| 35 to 44 Years | 137 (92.6%) | 11 (7.4%) |
| 45 to 54 Years | 158 (100.0%) | 0 (0.0%) |
| 55 to 64 Years | 178 (94.2%) | 11 (5.8%) |
| 65 to 74 Years | 273 (99.3%) | 2 (0.7%) |
| 75 Years and older | 110 (100.0%) | 0 (0.0%) |
| Total | 1,348 (92.1%) | 116 (7.9%) |
Health Insurance Coverage by Citizenship Status in Summerdale
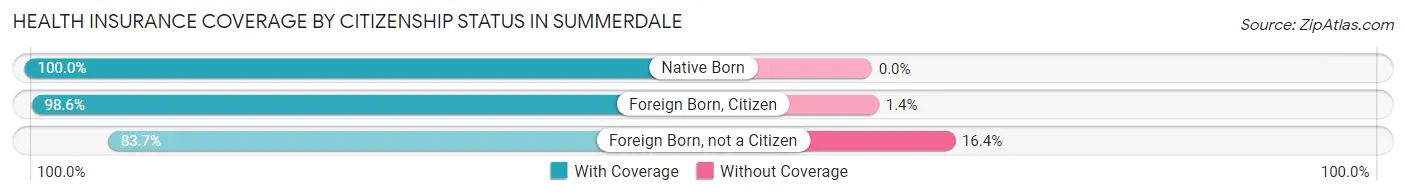
| Citizenship Status | With Coverage | Without Coverage |
| Native Born | 80 (100.0%) | 0 (0.0%) |
| Foreign Born, Citizen | 144 (98.6%) | 2 (1.4%) |
| Foreign Born, not a Citizen | 174 (83.7%) | 34 (16.4%) |
Health Insurance Coverage by Household Income in Summerdale
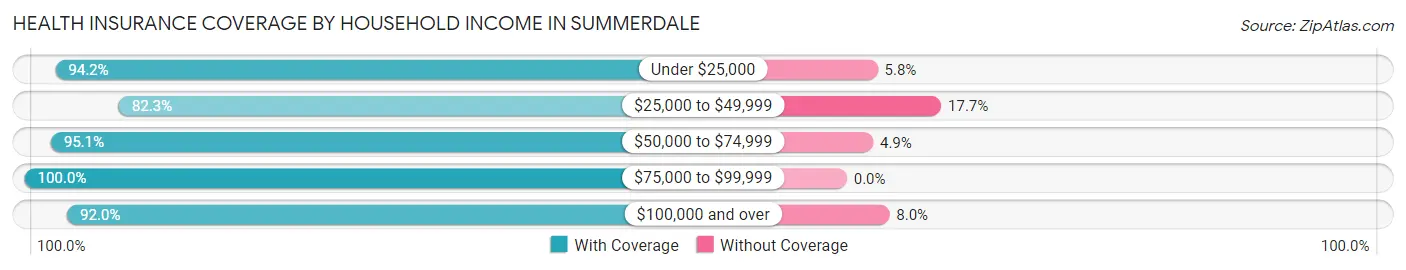
| Household Income | With Coverage | Without Coverage |
| Under $25,000 | 49 (94.2%) | 3 (5.8%) |
| $25,000 to $49,999 | 219 (82.3%) | 47 (17.7%) |
| $50,000 to $74,999 | 367 (95.1%) | 19 (4.9%) |
| $75,000 to $99,999 | 144 (100.0%) | 0 (0.0%) |
| $100,000 and over | 543 (92.0%) | 47 (8.0%) |
Public vs Private Health Insurance Coverage by Age in Summerdale
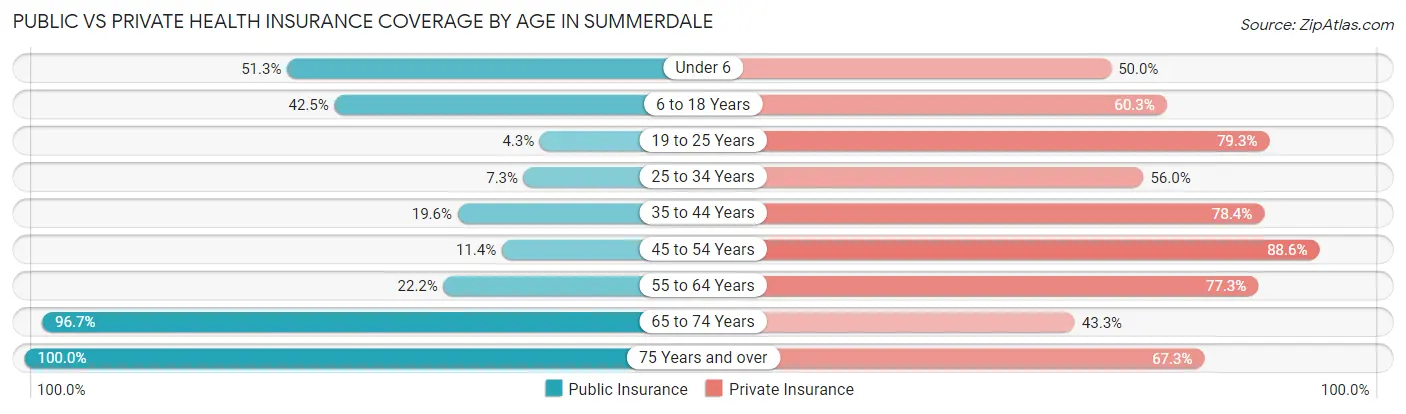
| Age Bracket | Public Insurance | Private Insurance |
| Under 6 | 41 (51.2%) | 40 (50.0%) |
| 6 to 18 Years | 62 (42.5%) | 88 (60.3%) |
| 19 to 25 Years | 9 (4.3%) | 165 (79.3%) |
| 25 to 34 Years | 11 (7.3%) | 84 (56.0%) |
| 35 to 44 Years | 29 (19.6%) | 116 (78.4%) |
| 45 to 54 Years | 18 (11.4%) | 140 (88.6%) |
| 55 to 64 Years | 42 (22.2%) | 146 (77.2%) |
| 65 to 74 Years | 266 (96.7%) | 119 (43.3%) |
| 75 Years and over | 110 (100.0%) | 74 (67.3%) |
| Total | 588 (40.2%) | 972 (66.4%) |
Disability Status by Sex by Age in Summerdale
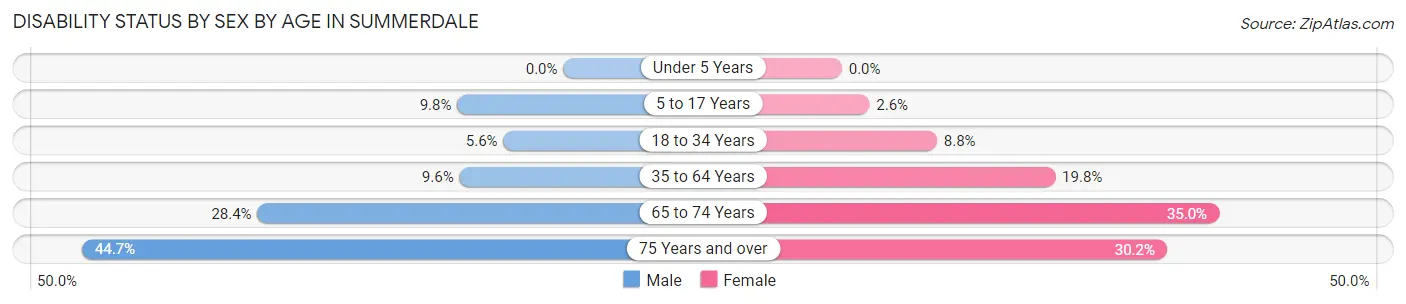
| Age Bracket | Male | Female |
| Under 5 Years | 0 (0.0%) | 0 (0.0%) |
| 5 to 17 Years | 6 (9.8%) | 2 (2.6%) |
| 18 to 34 Years | 9 (5.6%) | 18 (8.8%) |
| 35 to 64 Years | 19 (9.6%) | 59 (19.8%) |
| 65 to 74 Years | 44 (28.4%) | 42 (35.0%) |
| 75 Years and over | 21 (44.7%) | 19 (30.2%) |
Disability Class by Sex by Age in Summerdale
Disability Class: Hearing Difficulty
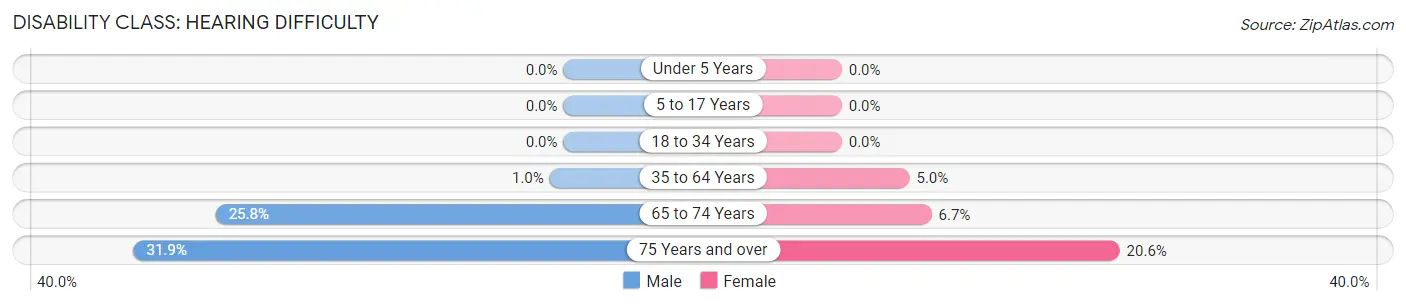
| Age Bracket | Male | Female |
| Under 5 Years | 0 (0.0%) | 0 (0.0%) |
| 5 to 17 Years | 0 (0.0%) | 0 (0.0%) |
| 18 to 34 Years | 0 (0.0%) | 0 (0.0%) |
| 35 to 64 Years | 2 (1.0%) | 15 (5.0%) |
| 65 to 74 Years | 40 (25.8%) | 8 (6.7%) |
| 75 Years and over | 15 (31.9%) | 13 (20.6%) |
Disability Class: Vision Difficulty
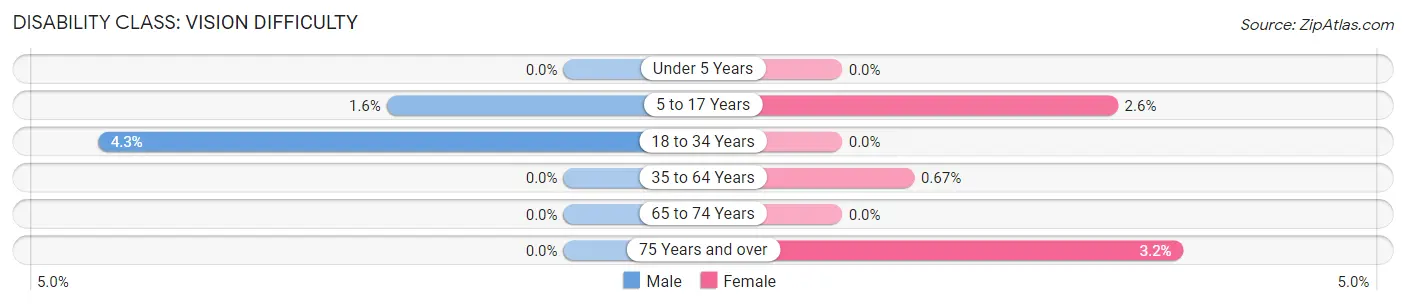
| Age Bracket | Male | Female |
| Under 5 Years | 0 (0.0%) | 0 (0.0%) |
| 5 to 17 Years | 1 (1.6%) | 2 (2.6%) |
| 18 to 34 Years | 7 (4.3%) | 0 (0.0%) |
| 35 to 64 Years | 0 (0.0%) | 2 (0.7%) |
| 65 to 74 Years | 0 (0.0%) | 0 (0.0%) |
| 75 Years and over | 0 (0.0%) | 2 (3.2%) |
Disability Class: Cognitive Difficulty
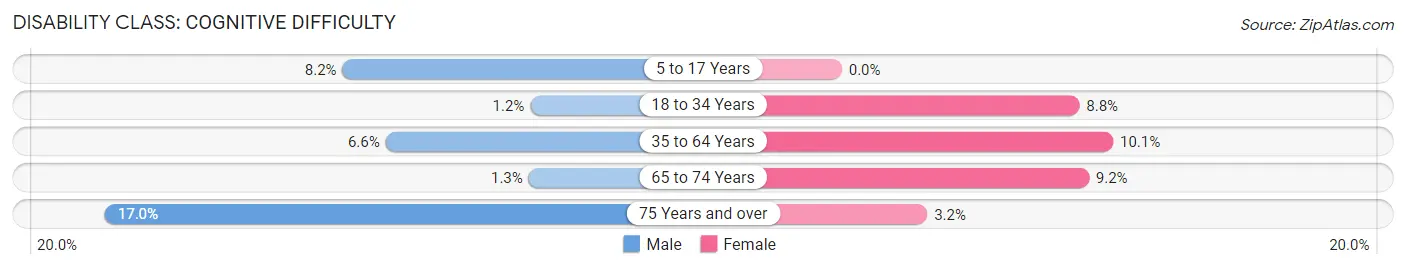
| Age Bracket | Male | Female |
| 5 to 17 Years | 5 (8.2%) | 0 (0.0%) |
| 18 to 34 Years | 2 (1.2%) | 18 (8.8%) |
| 35 to 64 Years | 13 (6.6%) | 30 (10.1%) |
| 65 to 74 Years | 2 (1.3%) | 11 (9.2%) |
| 75 Years and over | 8 (17.0%) | 2 (3.2%) |
Disability Class: Ambulatory Difficulty
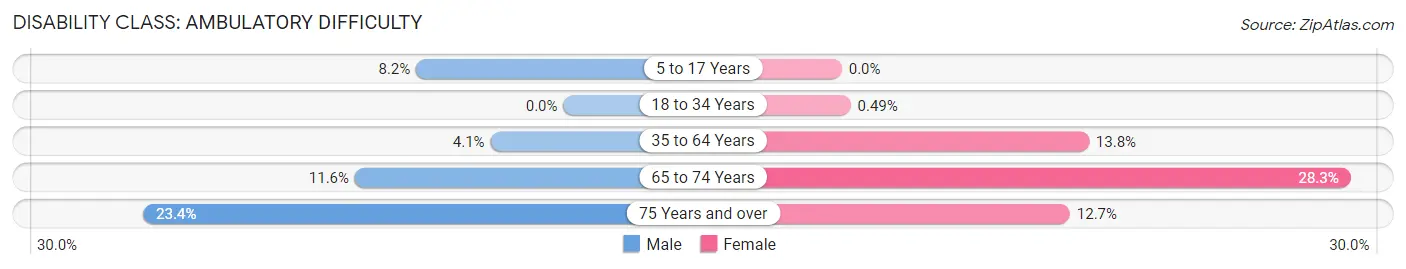
| Age Bracket | Male | Female |
| 5 to 17 Years | 5 (8.2%) | 0 (0.0%) |
| 18 to 34 Years | 0 (0.0%) | 1 (0.5%) |
| 35 to 64 Years | 8 (4.1%) | 41 (13.8%) |
| 65 to 74 Years | 18 (11.6%) | 34 (28.3%) |
| 75 Years and over | 11 (23.4%) | 8 (12.7%) |
Disability Class: Self-Care Difficulty
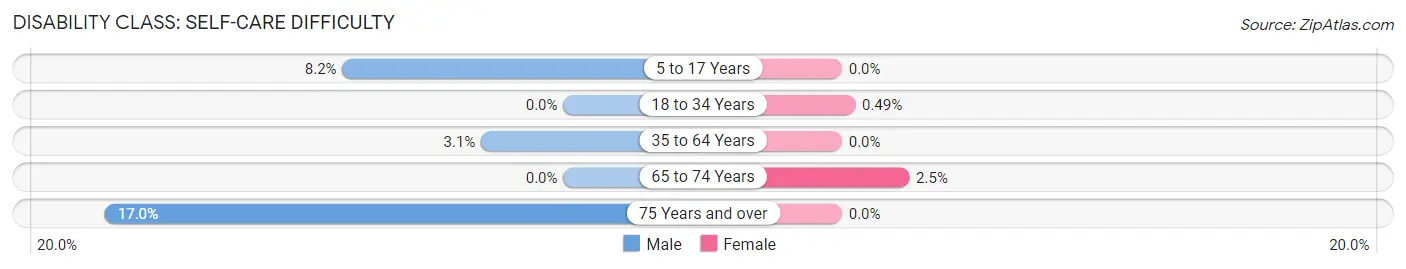
| Age Bracket | Male | Female |
| 5 to 17 Years | 5 (8.2%) | 0 (0.0%) |
| 18 to 34 Years | 0 (0.0%) | 1 (0.5%) |
| 35 to 64 Years | 6 (3.0%) | 0 (0.0%) |
| 65 to 74 Years | 0 (0.0%) | 3 (2.5%) |
| 75 Years and over | 8 (17.0%) | 0 (0.0%) |
Technology Access in Summerdale
Computing Device Access in Summerdale
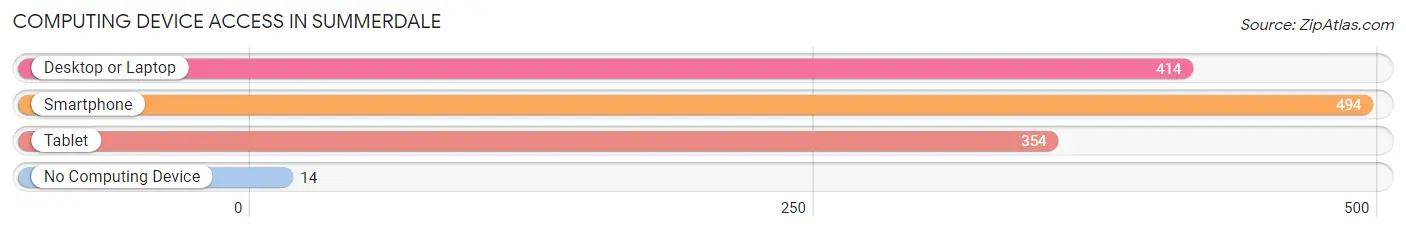
| Device Type | # Households | % Households |
| Desktop or Laptop | 414 | 74.2% |
| Smartphone | 494 | 88.5% |
| Tablet | 354 | 63.4% |
| No Computing Device | 14 | 2.5% |
| Total | 558 | 100.0% |
Internet Access in Summerdale
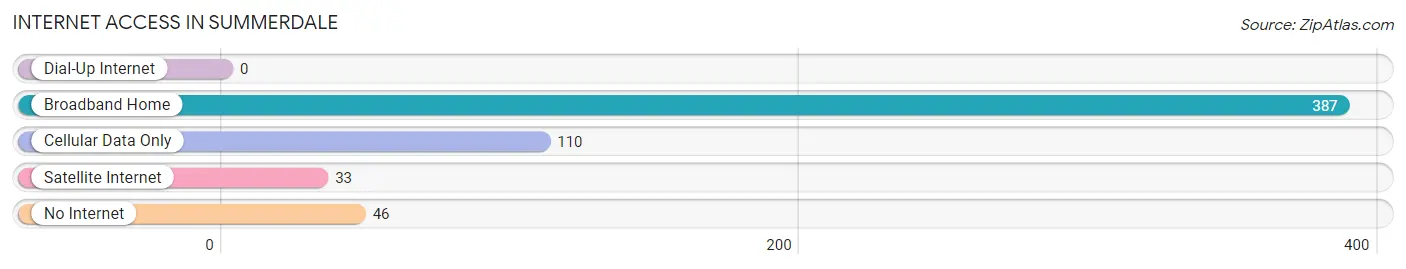
| Internet Type | # Households | % Households |
| Dial-Up Internet | 0 | 0.0% |
| Broadband Home | 387 | 69.4% |
| Cellular Data Only | 110 | 19.7% |
| Satellite Internet | 33 | 5.9% |
| No Internet | 46 | 8.2% |
| Total | 558 | 100.0% |
Summerdale Summary
History
The town of Summerdale, Alabama is located in Baldwin County, and is part of the Daphne-Fairhope-Foley Metropolitan Statistical Area. The town was founded in 1887 by the Summerdale Land Company, which was formed by a group of investors from Mobile, Alabama. The town was named after the Summerdale Plantation, which was located nearby. The town was originally a farming community, and the main crops grown were cotton, corn, and peanuts.
In the early 1900s, the town began to grow and develop. The first post office was established in 1906, and the first school was built in 1908. The town also had a general store, a blacksmith shop, and a cotton gin. In the 1920s, the town began to expand and more businesses were established. The first bank was opened in 1923, and the first newspaper was published in 1925.
In the 1950s, the town began to experience a population boom. The population grew from 1,000 in 1950 to over 3,000 in 1960. This growth was due to the influx of people from other parts of the state and the country who were looking for work in the area.
Geography
Summerdale is located in Baldwin County, Alabama, and is part of the Daphne-Fairhope-Foley Metropolitan Statistical Area. The town is situated on the eastern shore of Mobile Bay, and is bordered by the cities of Daphne, Fairhope, and Foley. The town is located approximately 30 miles east of Mobile, and is about 20 miles west of Pensacola, Florida.
The town has a total area of 4.2 square miles, all of which is land. The town is located at an elevation of 30 feet above sea level. The climate in Summerdale is classified as humid subtropical, with hot, humid summers and mild winters. The average annual temperature is around 70 degrees Fahrenheit.
Economy
The economy of Summerdale is largely based on tourism and retail. The town is home to several tourist attractions, including the Summerdale Beach, the Summerdale Golf Course, and the Summerdale Water Park. The town also has several retail stores, including a Walmart Supercenter, a Lowe’s Home Improvement store, and a variety of other stores.
The town is also home to several manufacturing companies, including a paper mill, a plastics factory, and a furniture factory. The town is also home to several seafood processing plants, which process and package seafood for distribution throughout the region.
Demographics
As of the 2010 census, the population of Summerdale was 3,717. The racial makeup of the town was 87.3% White, 8.2% African American, 0.5% Native American, 0.7% Asian, 0.1% Pacific Islander, 1.3% from other races, and 1.9% from two or more races. Hispanic or Latino of any race were 3.2% of the population.
The median household income in Summerdale was $41,944, and the median family income was $50,917. The per capita income for the town was $20,945. About 11.3% of families and 14.2% of the population were below the poverty line, including 19.2% of those under age 18 and 8.2% of those age 65 or over.
Common Questions
What is Per Capita Income in Summerdale?
Per Capita income in Summerdale is $36,416.
What is the Median Family Income in Summerdale?
Median Family Income in Summerdale is $76,250.
What is the Median Household income in Summerdale?
Median Household Income in Summerdale is $70,500.
What is Income or Wage Gap in Summerdale?
Income or Wage Gap in Summerdale is 30.0%.
Women in Summerdale earn 70.0 cents for every dollar earned by a man.
What is Inequality or Gini Index in Summerdale?
Inequality or Gini Index in Summerdale is 0.41.
What is the Total Population of Summerdale?
Total Population of Summerdale is 1,497.
What is the Total Male Population of Summerdale?
Total Male Population of Summerdale is 692.
What is the Total Female Population of Summerdale?
Total Female Population of Summerdale is 805.
What is the Ratio of Males per 100 Females in Summerdale?
There are 85.96 Males per 100 Females in Summerdale.
What is the Ratio of Females per 100 Males in Summerdale?
There are 116.33 Females per 100 Males in Summerdale.
What is the Median Population Age in Summerdale?
Median Population Age in Summerdale is 44.1 Years.
What is the Average Family Size in Summerdale
Average Family Size in Summerdale is 3.0 People.
What is the Average Household Size in Summerdale
Average Household Size in Summerdale is 2.6 People.
How Large is the Labor Force in Summerdale?
There are 738 People in the Labor Forcein in Summerdale.
What is the Percentage of People in the Labor Force in Summerdale?
57.2% of People are in the Labor Force in Summerdale.
What is the Unemployment Rate in Summerdale?
Unemployment Rate in Summerdale is 1.1%.