Kimberly, AL
Kimberly Map
Kimberly Overview
4,045
TOTAL POPULATION
1,932
MALE POPULATION
2,113
FEMALE POPULATION
91.43
MALES / 100 FEMALES
109.37
FEMALES / 100 MALES
36.8
MEDIAN AGE
3.3
AVG FAMILY SIZE
3.0
AVG HOUSEHOLD SIZE
$36,757
PER CAPITA INCOME
$109,441
AVG FAMILY INCOME
$107,670
AVG HOUSEHOLD INCOME
41.7%
WAGE / INCOME GAP [ % ]
58.3¢/ $1
WAGE / INCOME GAP [ $ ]
0.28
INEQUALITY / GINI INDEX
2,193
LABOR FORCE [ PEOPLE ]
75.9%
PERCENT IN LABOR FORCE
0.7%
UNEMPLOYMENT RATE
Kimberly Zip Codes
Kimberly Area Codes
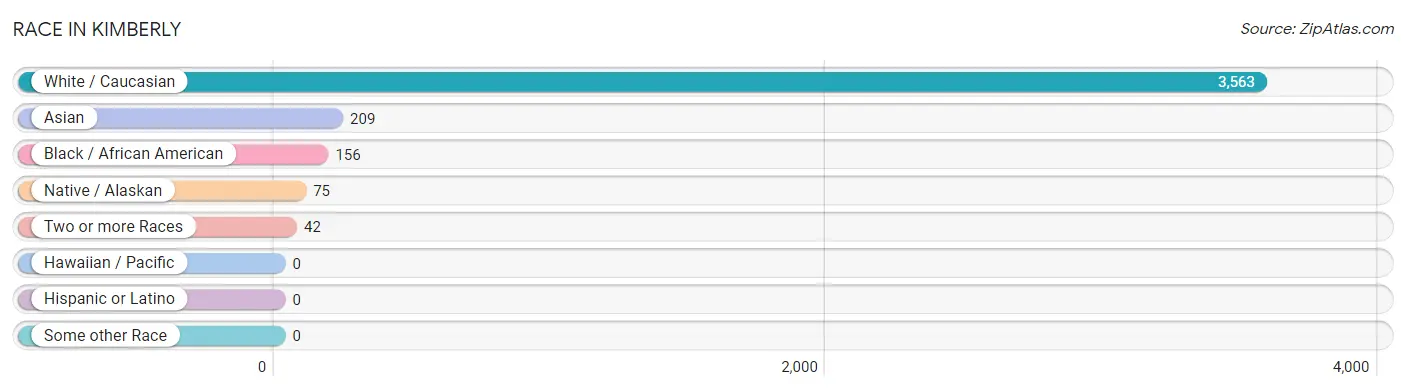
Race in Kimberly
The most populous races in Kimberly are White / Caucasian (3,563 | 88.1%), Asian (209 | 5.2%), and Black / African American (156 | 3.9%).
| Race | # Population | % Population |
| Asian | 209 | 5.2% |
| Black / African American | 156 | 3.9% |
| Hawaiian / Pacific | 0 | 0.0% |
| Hispanic or Latino | 0 | 0.0% |
| Native / Alaskan | 75 | 1.8% |
| White / Caucasian | 3,563 | 88.1% |
| Two or more Races | 42 | 1.0% |
| Some other Race | 0 | 0.0% |
| Total | 4,045 | 100.0% |
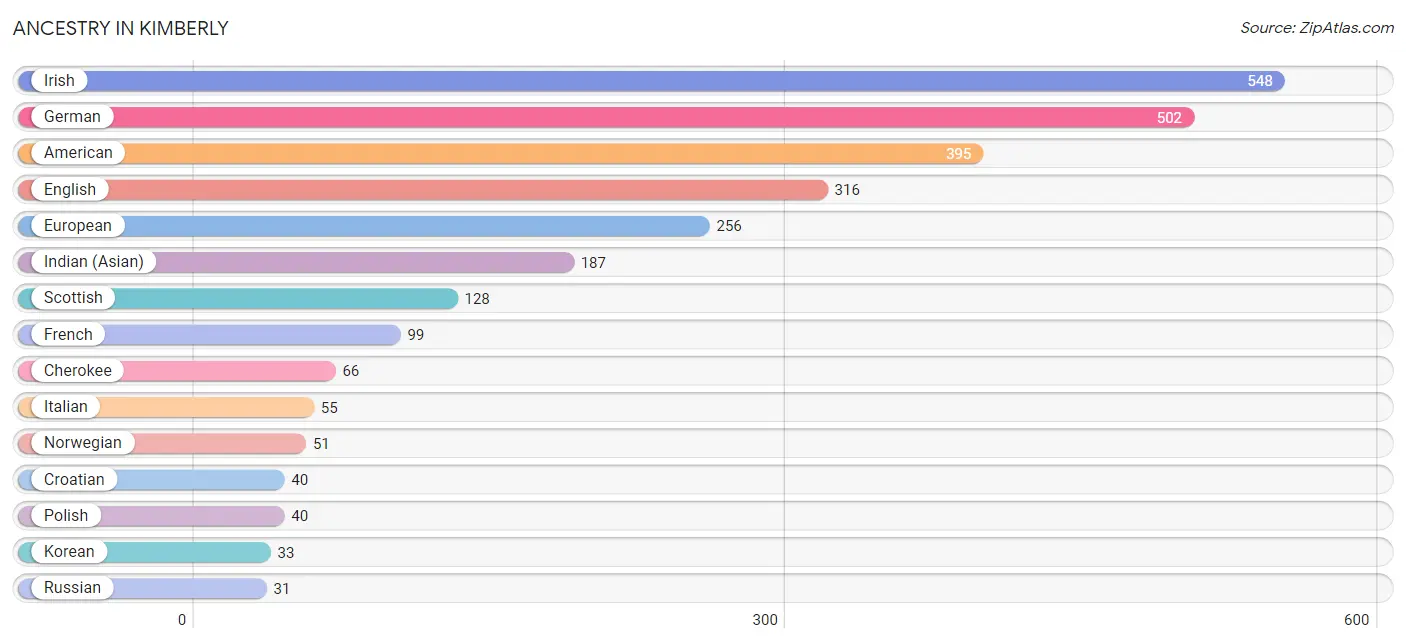
Ancestry in Kimberly
The most populous ancestries reported in Kimberly are Irish (548 | 13.6%), German (502 | 12.4%), American (395 | 9.8%), English (316 | 7.8%), and European (256 | 6.3%), together accounting for 49.9% of all Kimberly residents.
| Ancestry | # Population | % Population |
| American | 395 | 9.8% |
| British | 6 | 0.2% |
| Burmese | 16 | 0.4% |
| Cherokee | 66 | 1.6% |
| Croatian | 40 | 1.0% |
| English | 316 | 7.8% |
| European | 256 | 6.3% |
| French | 99 | 2.5% |
| German | 502 | 12.4% |
| Hungarian | 15 | 0.4% |
| Indian (Asian) | 187 | 4.6% |
| Irish | 548 | 13.6% |
| Italian | 55 | 1.4% |
| Korean | 33 | 0.8% |
| Norwegian | 51 | 1.3% |
| Polish | 40 | 1.0% |
| Russian | 31 | 0.8% |
| Scotch-Irish | 26 | 0.6% |
| Scottish | 128 | 3.2% |
| Welsh | 13 | 0.3% | View All 20 Rows |
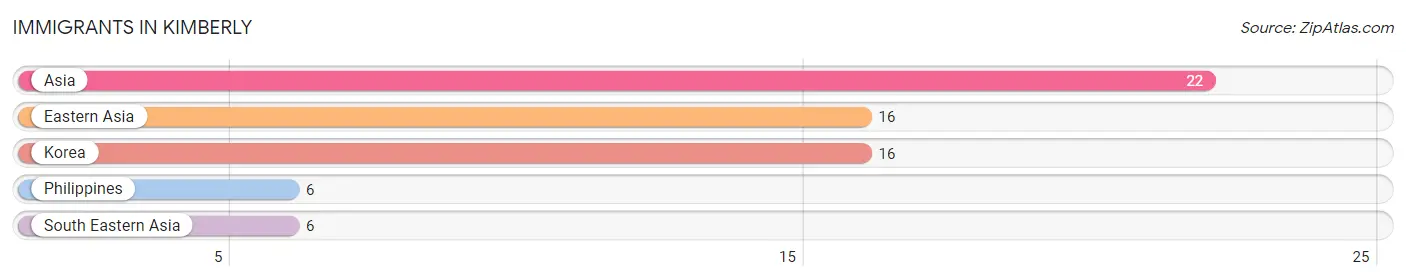
Immigrants in Kimberly
The most numerous immigrant groups reported in Kimberly came from Asia (22 | 0.5%), Eastern Asia (16 | 0.4%), Korea (16 | 0.4%), Philippines (6 | 0.2%), and South Eastern Asia (6 | 0.2%), together accounting for 1.6% of all Kimberly residents.
| Immigration Origin | # Population | % Population |
| Asia | 22 | 0.5% |
| Eastern Asia | 16 | 0.4% |
| Korea | 16 | 0.4% |
| Philippines | 6 | 0.2% |
| South Eastern Asia | 6 | 0.2% | View All 5 Rows |
Sex and Age in Kimberly
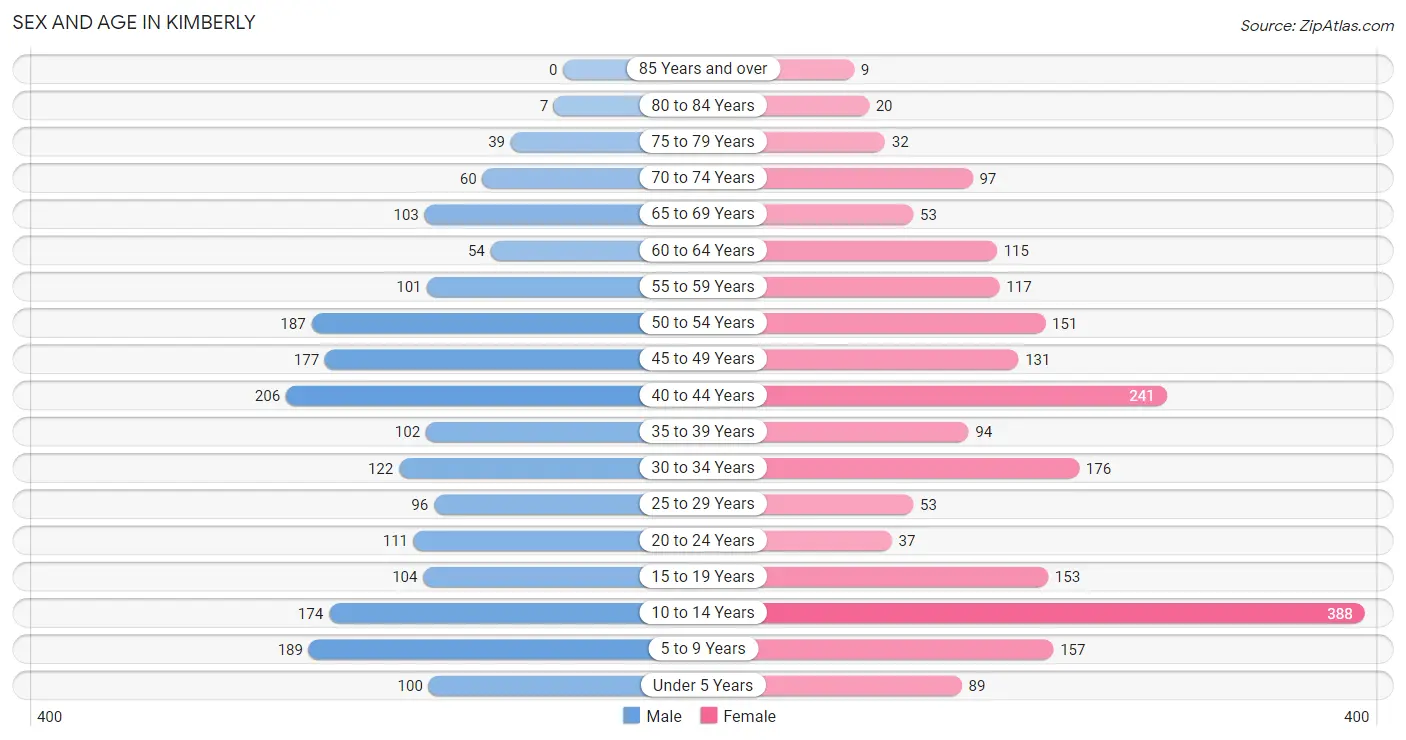
Sex and Age in Kimberly
The most populous age groups in Kimberly are 40 to 44 Years (206 | 10.7%) for men and 10 to 14 Years (388 | 18.4%) for women.
| Age Bracket | Male | Female |
| Under 5 Years | 100 (5.2%) | 89 (4.2%) |
| 5 to 9 Years | 189 (9.8%) | 157 (7.4%) |
| 10 to 14 Years | 174 (9.0%) | 388 (18.4%) |
| 15 to 19 Years | 104 (5.4%) | 153 (7.2%) |
| 20 to 24 Years | 111 (5.8%) | 37 (1.8%) |
| 25 to 29 Years | 96 (5.0%) | 53 (2.5%) |
| 30 to 34 Years | 122 (6.3%) | 176 (8.3%) |
| 35 to 39 Years | 102 (5.3%) | 94 (4.4%) |
| 40 to 44 Years | 206 (10.7%) | 241 (11.4%) |
| 45 to 49 Years | 177 (9.2%) | 131 (6.2%) |
| 50 to 54 Years | 187 (9.7%) | 151 (7.1%) |
| 55 to 59 Years | 101 (5.2%) | 117 (5.5%) |
| 60 to 64 Years | 54 (2.8%) | 115 (5.4%) |
| 65 to 69 Years | 103 (5.3%) | 53 (2.5%) |
| 70 to 74 Years | 60 (3.1%) | 97 (4.6%) |
| 75 to 79 Years | 39 (2.0%) | 32 (1.5%) |
| 80 to 84 Years | 7 (0.4%) | 20 (0.9%) |
| 85 Years and over | 0 (0.0%) | 9 (0.4%) |
| Total | 1,932 (100.0%) | 2,113 (100.0%) |
Families and Households in Kimberly
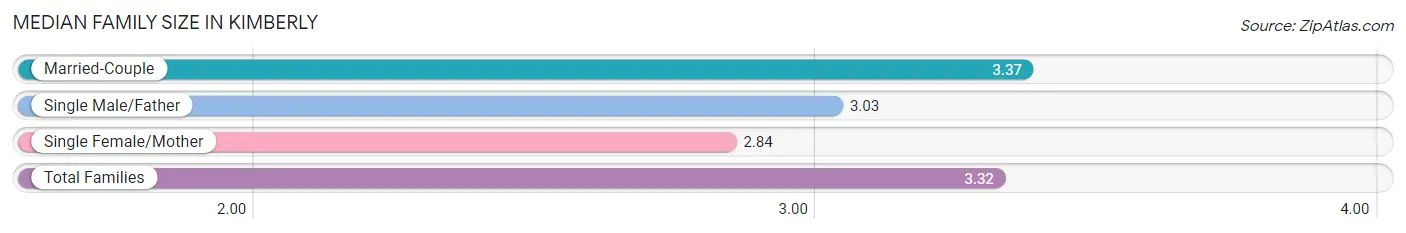
Median Family Size in Kimberly
The median family size in Kimberly is 3.32 persons per family, with married-couple families (989 | 87.3%) accounting for the largest median family size of 3.37 persons per family. On the other hand, single female/mother families (80 | 7.1%) represent the smallest median family size with 2.84 persons per family.
| Family Type | # Families | Family Size |
| Married-Couple | 989 (87.3%) | 3.37 |
| Single Male/Father | 64 (5.7%) | 3.03 |
| Single Female/Mother | 80 (7.1%) | 2.84 |
| Total Families | 1,133 (100.0%) | 3.32 |
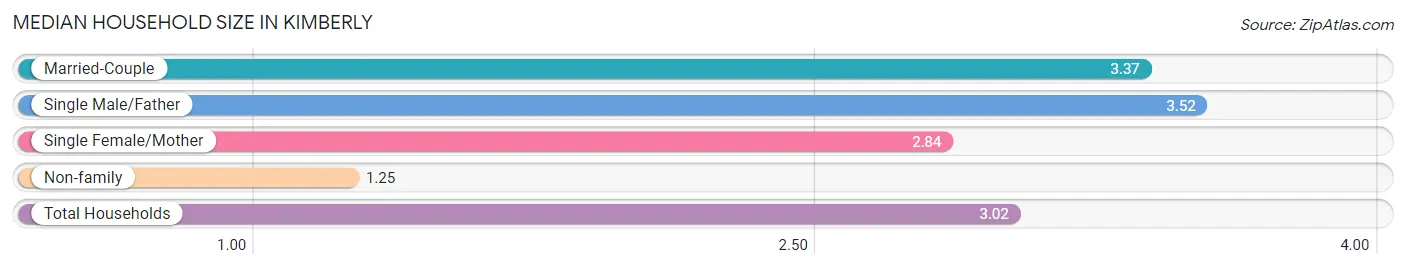
Median Household Size in Kimberly
The median household size in Kimberly is 3.02 persons per household, with single male/father households (64 | 4.8%) accounting for the largest median household size of 3.52 persons per household. non-family households (205 | 15.3%) represent the smallest median household size with 1.25 persons per household.
| Household Type | # Households | Household Size |
| Married-Couple | 989 (73.9%) | 3.37 |
| Single Male/Father | 64 (4.8%) | 3.52 |
| Single Female/Mother | 80 (6.0%) | 2.84 |
| Non-family | 205 (15.3%) | 1.25 |
| Total Households | 1,338 (100.0%) | 3.02 |
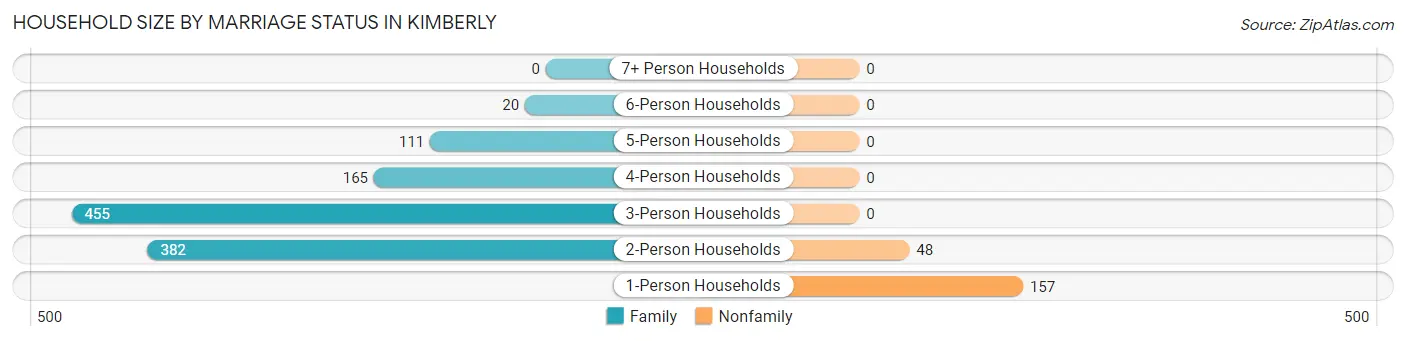
Household Size by Marriage Status in Kimberly
Out of a total of 1,338 households in Kimberly, 1,133 (84.7%) are family households, while 205 (15.3%) are nonfamily households. The most numerous type of family households are 3-person households, comprising 455, and the most common type of nonfamily households are 1-person households, comprising 157.
| Household Size | Family Households | Nonfamily Households |
| 1-Person Households | - | 157 (11.7%) |
| 2-Person Households | 382 (28.5%) | 48 (3.6%) |
| 3-Person Households | 455 (34.0%) | 0 (0.0%) |
| 4-Person Households | 165 (12.3%) | 0 (0.0%) |
| 5-Person Households | 111 (8.3%) | 0 (0.0%) |
| 6-Person Households | 20 (1.5%) | 0 (0.0%) |
| 7+ Person Households | 0 (0.0%) | 0 (0.0%) |
| Total | 1,133 (84.7%) | 205 (15.3%) |
Female Fertility in Kimberly
Fertility by Age in Kimberly
Average fertility rate in Kimberly is 53.0 births per 1,000 women. Women in the age bracket of 20 to 34 years have the highest fertility rate with 117.0 births per 1,000 women. Women in the age bracket of 20 to 34 years acount for 66.0% of all women with births.
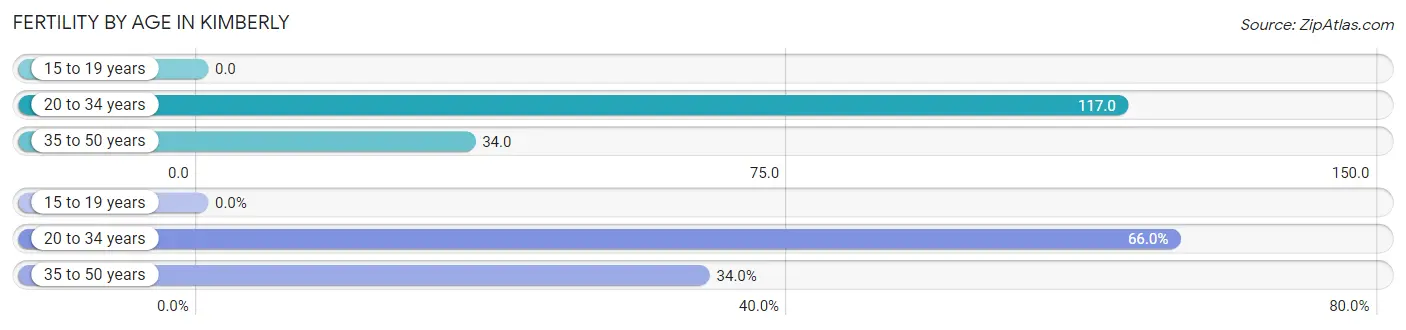
| Age Bracket | Women with Births | Births / 1,000 Women |
| 15 to 19 years | 0 (0.0%) | 0.0 |
| 20 to 34 years | 31 (66.0%) | 117.0 |
| 35 to 50 years | 16 (34.0%) | 34.0 |
| Total | 47 (100.0%) | 53.0 |
Fertility by Age by Marriage Status in Kimberly
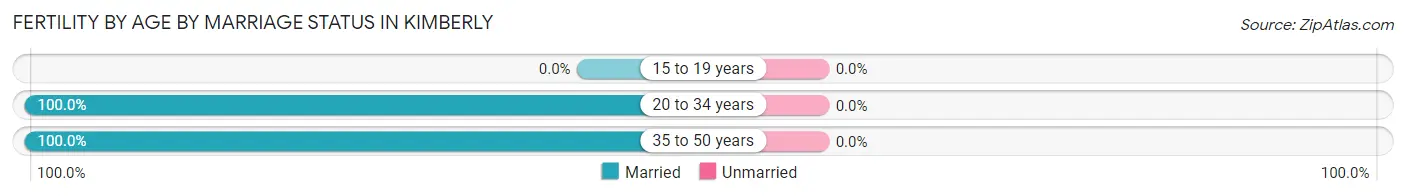
| Age Bracket | Married | Unmarried |
| 15 to 19 years | 0 (0.0%) | 0 (0.0%) |
| 20 to 34 years | 31 (100.0%) | 0 (0.0%) |
| 35 to 50 years | 16 (100.0%) | 0 (0.0%) |
| Total | 47 (100.0%) | 0 (0.0%) |
Fertility by Education in Kimberly
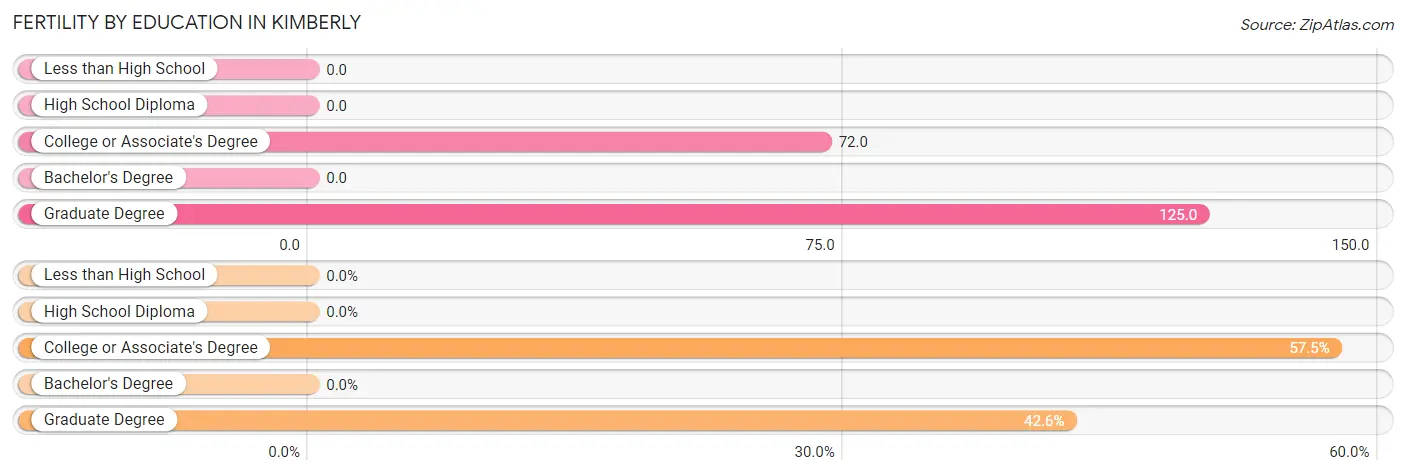
| Educational Attainment | Women with Births | Births / 1,000 Women |
| Less than High School | 0 (0.0%) | 0.0 |
| High School Diploma | 0 (0.0%) | 0.0 |
| College or Associate's Degree | 27 (57.5%) | 72.0 |
| Bachelor's Degree | 0 (0.0%) | 0.0 |
| Graduate Degree | 20 (42.5%) | 125.0 |
| Total | 47 (100.0%) | 53.0 |
Fertility by Education by Marriage Status in Kimberly
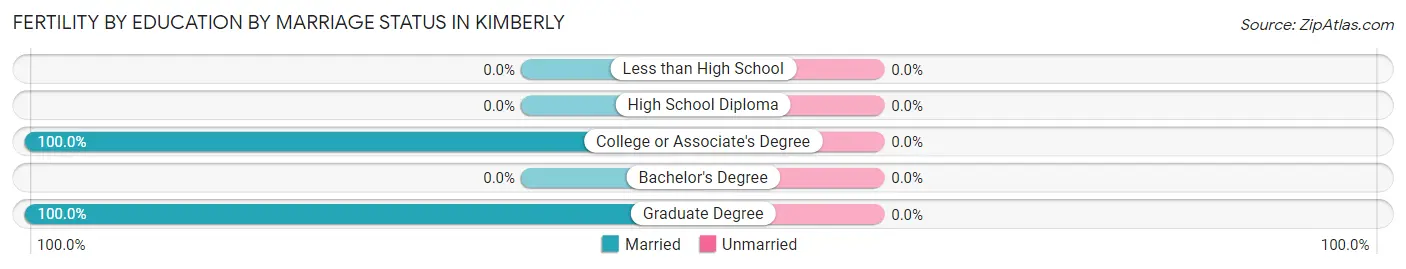
| Educational Attainment | Married | Unmarried |
| Less than High School | 0 (0.0%) | 0 (0.0%) |
| High School Diploma | 0 (0.0%) | 0 (0.0%) |
| College or Associate's Degree | 27 (100.0%) | 0 (0.0%) |
| Bachelor's Degree | 0 (0.0%) | 0 (0.0%) |
| Graduate Degree | 20 (100.0%) | 0 (0.0%) |
| Total | 47 (100.0%) | 0 (0.0%) |
Income in Kimberly
Income Overview in Kimberly
Per Capita Income in Kimberly is $36,757, while median incomes of families and households are $109,441 and $107,670 respectively.
| Characteristic | Number | Measure |
| Per Capita Income | 4,045 | $36,757 |
| Median Family Income | 1,133 | $109,441 |
| Mean Family Income | 1,133 | $116,759 |
| Median Household Income | 1,338 | $107,670 |
| Mean Household Income | 1,338 | $108,162 |
| Income Deficit | 1,133 | $0 |
| Wage / Income Gap (%) | 4,045 | 41.73% |
| Wage / Income Gap ($) | 4,045 | 58.27¢ per $1 |
| Gini / Inequality Index | 4,045 | 0.28 |
Earnings by Sex in Kimberly
Average Earnings in Kimberly are $58,026, $66,107 for men and $38,523 for women, a difference of 41.7%.
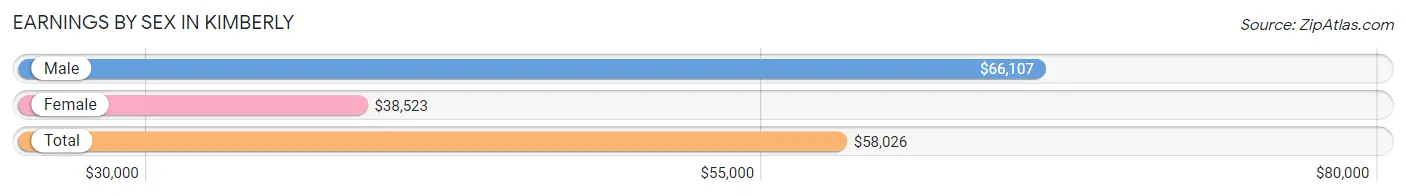
| Sex | Number | Average Earnings |
| Male | 1,141 (51.4%) | $66,107 |
| Female | 1,079 (48.6%) | $38,523 |
| Total | 2,220 (100.0%) | $58,026 |
Earnings by Sex by Income Bracket in Kimberly
The most common earnings brackets in Kimberly are $75,000 to $99,999 for men (352 | 30.8%) and $55,000 to $64,999 for women (235 | 21.8%).
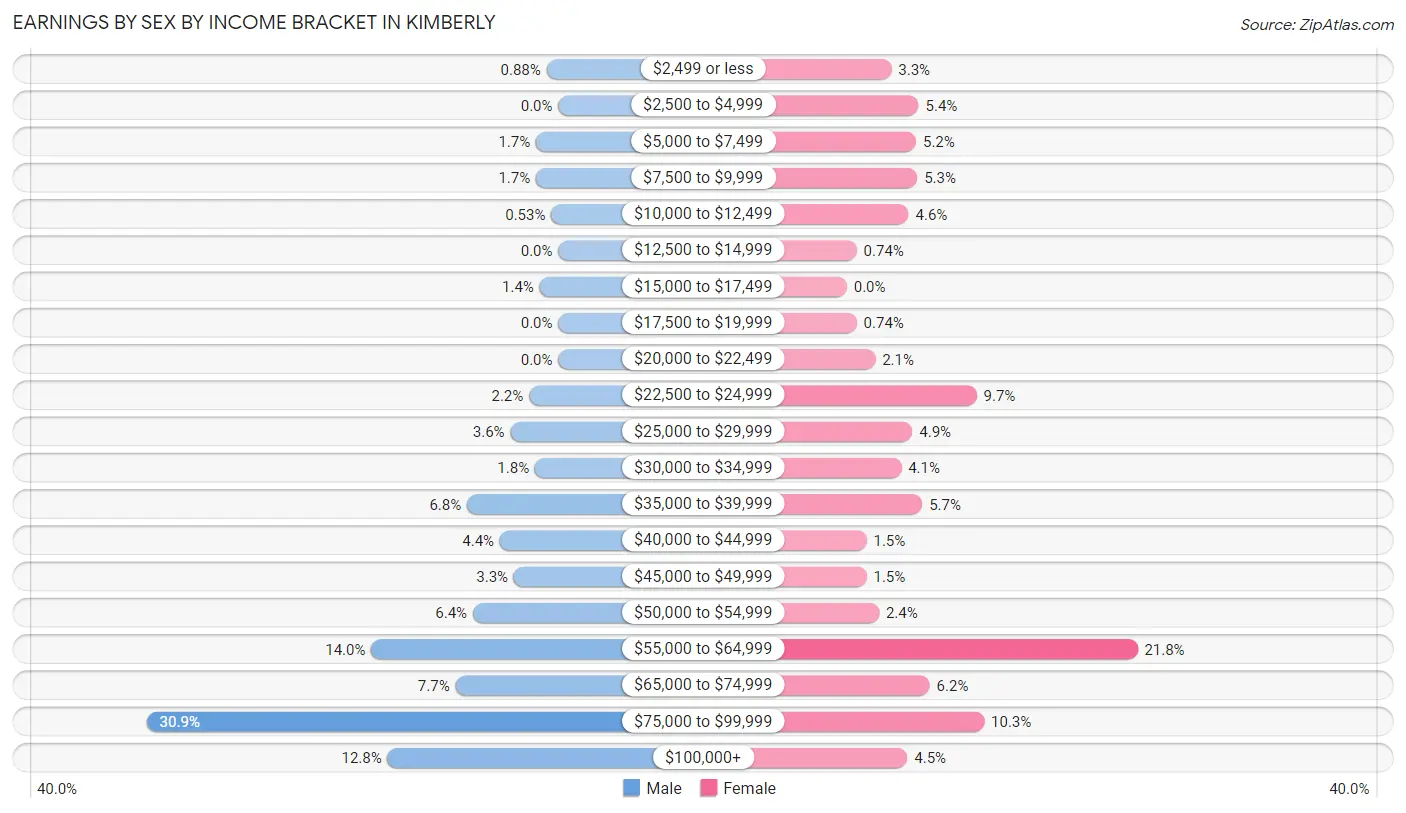
| Income | Male | Female |
| $2,499 or less | 10 (0.9%) | 36 (3.3%) |
| $2,500 to $4,999 | 0 (0.0%) | 58 (5.4%) |
| $5,000 to $7,499 | 19 (1.7%) | 56 (5.2%) |
| $7,500 to $9,999 | 19 (1.7%) | 57 (5.3%) |
| $10,000 to $12,499 | 6 (0.5%) | 50 (4.6%) |
| $12,500 to $14,999 | 0 (0.0%) | 8 (0.7%) |
| $15,000 to $17,499 | 16 (1.4%) | 0 (0.0%) |
| $17,500 to $19,999 | 0 (0.0%) | 8 (0.7%) |
| $20,000 to $22,499 | 0 (0.0%) | 23 (2.1%) |
| $22,500 to $24,999 | 25 (2.2%) | 105 (9.7%) |
| $25,000 to $29,999 | 41 (3.6%) | 53 (4.9%) |
| $30,000 to $34,999 | 20 (1.8%) | 44 (4.1%) |
| $35,000 to $39,999 | 78 (6.8%) | 61 (5.7%) |
| $40,000 to $44,999 | 50 (4.4%) | 16 (1.5%) |
| $45,000 to $49,999 | 38 (3.3%) | 16 (1.5%) |
| $50,000 to $54,999 | 73 (6.4%) | 26 (2.4%) |
| $55,000 to $64,999 | 160 (14.0%) | 235 (21.8%) |
| $65,000 to $74,999 | 88 (7.7%) | 67 (6.2%) |
| $75,000 to $99,999 | 352 (30.8%) | 111 (10.3%) |
| $100,000+ | 146 (12.8%) | 49 (4.5%) |
| Total | 1,141 (100.0%) | 1,079 (100.0%) |
Earnings by Sex by Educational Attainment in Kimberly
Average earnings in Kimberly are $72,418 for men and $51,683 for women, a difference of 28.6%. Men with an educational attainment of graduate degree enjoy the highest average annual earnings of $86,641, while those with high school diploma education earn the least with $65,800. Women with an educational attainment of graduate degree earn the most with the average annual earnings of $67,787, while those with college or associate's degree education have the smallest earnings of $29,764.
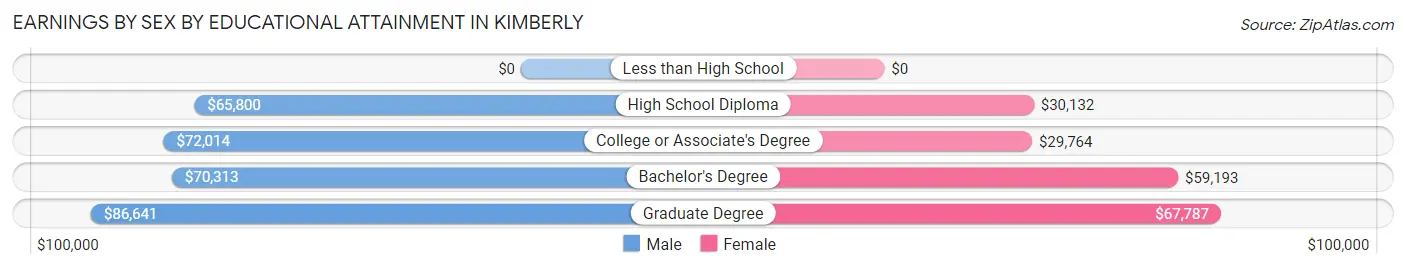
| Educational Attainment | Male Income | Female Income |
| Less than High School | - | - |
| High School Diploma | $65,800 | $30,132 |
| College or Associate's Degree | $72,014 | $29,764 |
| Bachelor's Degree | $70,313 | $59,193 |
| Graduate Degree | $86,641 | $67,787 |
| Total | $72,418 | $51,683 |
Family Income in Kimberly
Family Income Brackets in Kimberly
According to the Kimberly family income data, there are 451 families falling into the $100,000 to $149,999 income range, which is the most common income bracket and makes up 39.8% of all families. Conversely, the $10,000 to $14,999 income bracket is the least frequent group with only 7 families (0.6%) belonging to this category.
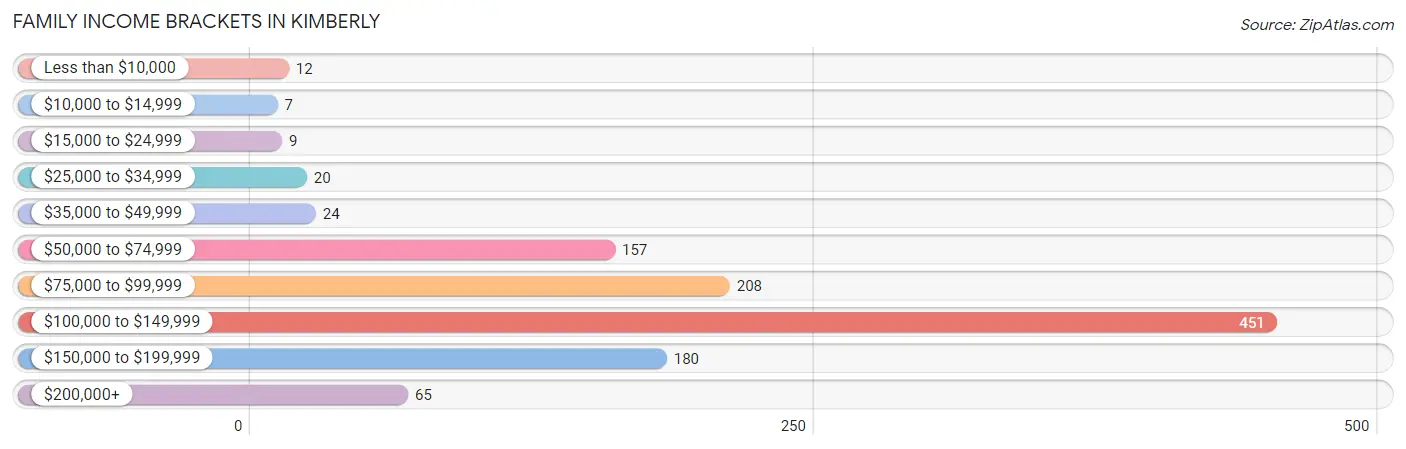
| Income Bracket | # Families | % Families |
| Less than $10,000 | 12 | 1.1% |
| $10,000 to $14,999 | 7 | 0.6% |
| $15,000 to $24,999 | 9 | 0.8% |
| $25,000 to $34,999 | 20 | 1.8% |
| $35,000 to $49,999 | 24 | 2.1% |
| $50,000 to $74,999 | 157 | 13.9% |
| $75,000 to $99,999 | 208 | 18.4% |
| $100,000 to $149,999 | 451 | 39.8% |
| $150,000 to $199,999 | 180 | 15.9% |
| $200,000+ | 65 | 5.7% |
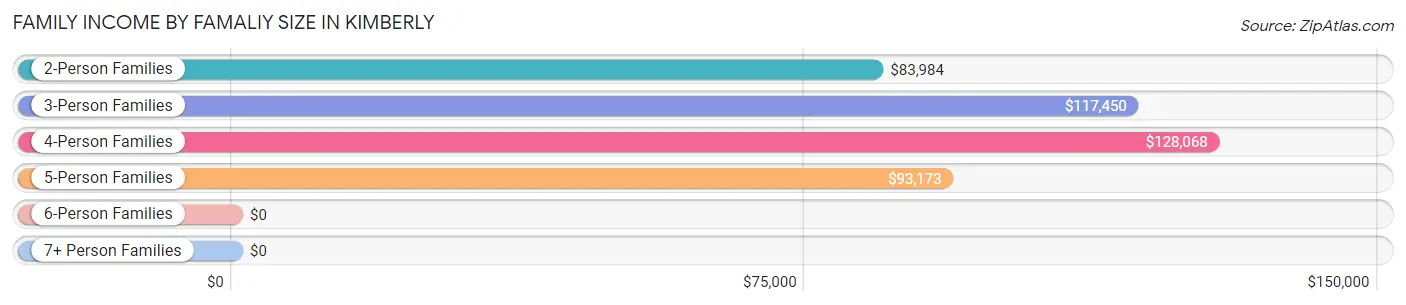
Family Income by Famaliy Size in Kimberly
4-person families (165 | 14.6%) account for the highest median family income in Kimberly with $128,068 per family, while 2-person families (402 | 35.5%) have the highest median income of $41,992 per family member.
| Income Bracket | # Families | Median Income |
| 2-Person Families | 402 (35.5%) | $83,984 |
| 3-Person Families | 435 (38.4%) | $117,450 |
| 4-Person Families | 165 (14.6%) | $128,068 |
| 5-Person Families | 111 (9.8%) | $93,173 |
| 6-Person Families | 20 (1.8%) | $0 |
| 7+ Person Families | 0 (0.0%) | $0 |
| Total | 1,133 (100.0%) | $109,441 |
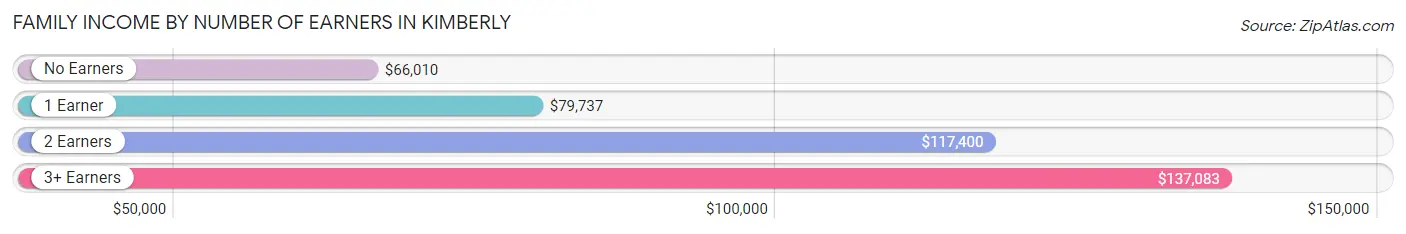
Family Income by Number of Earners in Kimberly
The median family income in Kimberly is $109,441, with families comprising 3+ earners (162) having the highest median family income of $137,083, while families with no earners (91) have the lowest median family income of $66,010, accounting for 14.3% and 8.0% of families, respectively.
| Number of Earners | # Families | Median Income |
| No Earners | 91 (8.0%) | $66,010 |
| 1 Earner | 318 (28.1%) | $79,737 |
| 2 Earners | 562 (49.6%) | $117,400 |
| 3+ Earners | 162 (14.3%) | $137,083 |
| Total | 1,133 (100.0%) | $109,441 |
Household Income in Kimberly
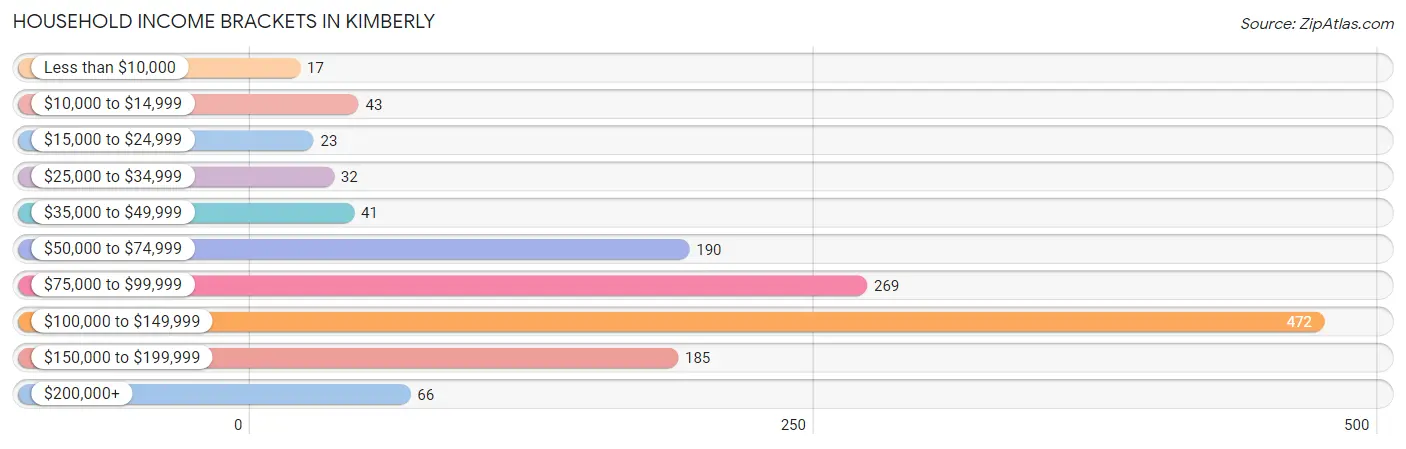
Household Income Brackets in Kimberly
With 472 households falling in the category, the $100,000 to $149,999 income range is the most frequent in Kimberly, accounting for 35.3% of all households. In contrast, only 17 households (1.3%) fall into the less than $10,000 income bracket, making it the least populous group.
| Income Bracket | # Households | % Households |
| Less than $10,000 | 17 | 1.3% |
| $10,000 to $14,999 | 43 | 3.2% |
| $15,000 to $24,999 | 23 | 1.7% |
| $25,000 to $34,999 | 32 | 2.4% |
| $35,000 to $49,999 | 41 | 3.1% |
| $50,000 to $74,999 | 190 | 14.2% |
| $75,000 to $99,999 | 269 | 20.1% |
| $100,000 to $149,999 | 472 | 35.3% |
| $150,000 to $199,999 | 185 | 13.8% |
| $200,000+ | 66 | 4.9% |
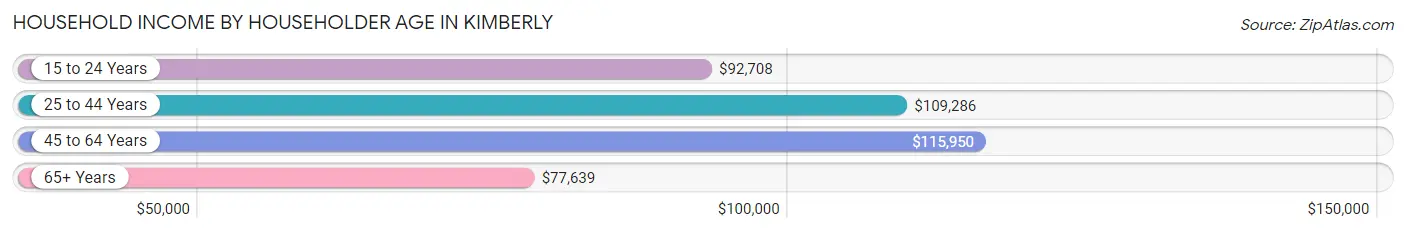
Household Income by Householder Age in Kimberly
The median household income in Kimberly is $107,670, with the highest median household income of $115,950 found in the 45 to 64 years age bracket for the primary householder. A total of 569 households (42.5%) fall into this category. Meanwhile, the 65+ years age bracket for the primary householder has the lowest median household income of $77,639, with 237 households (17.7%) in this group.
| Income Bracket | # Households | Median Income |
| 15 to 24 Years | 58 (4.3%) | $92,708 |
| 25 to 44 Years | 474 (35.4%) | $109,286 |
| 45 to 64 Years | 569 (42.5%) | $115,950 |
| 65+ Years | 237 (17.7%) | $77,639 |
| Total | 1,338 (100.0%) | $107,670 |
Poverty in Kimberly
Income Below Poverty by Sex and Age in Kimberly
With 2.6% poverty level for males and 3.5% for females among the residents of Kimberly, 75 year old and over males and 75 year old and over females are the most vulnerable to poverty, with 7 males (15.2%) and 14 females (23.0%) in their respective age groups living below the poverty level.
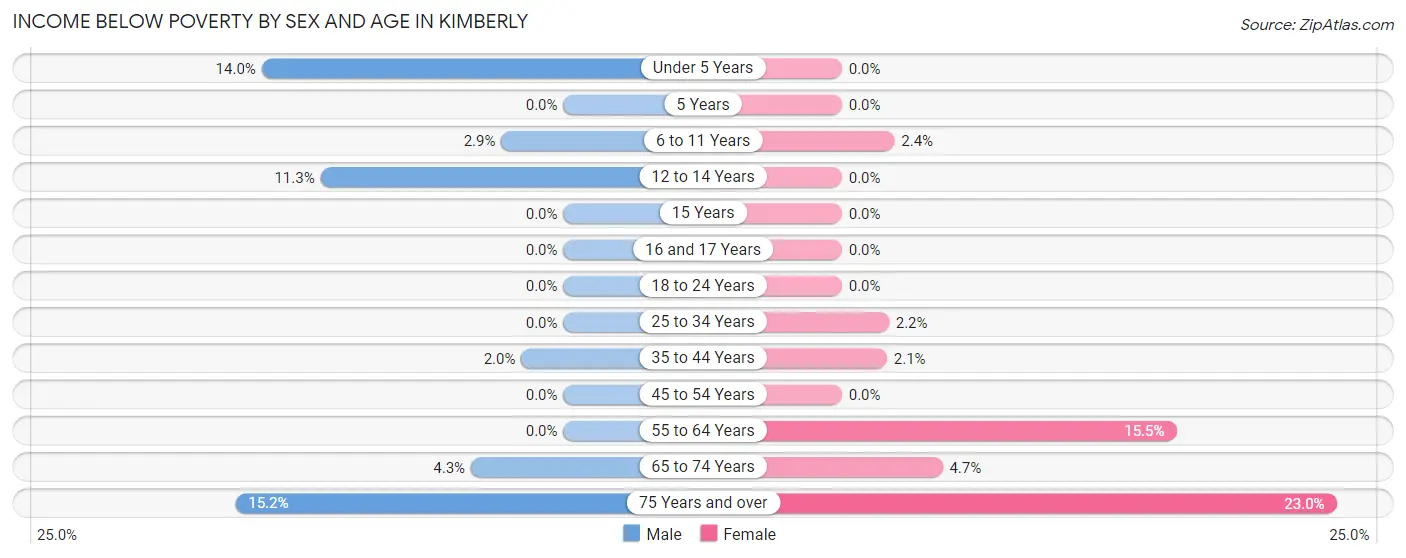
| Age Bracket | Male | Female |
| Under 5 Years | 14 (14.0%) | 0 (0.0%) |
| 5 Years | 0 (0.0%) | 0 (0.0%) |
| 6 to 11 Years | 8 (2.9%) | 5 (2.4%) |
| 12 to 14 Years | 8 (11.3%) | 0 (0.0%) |
| 15 Years | 0 (0.0%) | 0 (0.0%) |
| 16 and 17 Years | 0 (0.0%) | 0 (0.0%) |
| 18 to 24 Years | 0 (0.0%) | 0 (0.0%) |
| 25 to 34 Years | 0 (0.0%) | 5 (2.2%) |
| 35 to 44 Years | 6 (1.9%) | 7 (2.1%) |
| 45 to 54 Years | 0 (0.0%) | 0 (0.0%) |
| 55 to 64 Years | 0 (0.0%) | 36 (15.5%) |
| 65 to 74 Years | 7 (4.3%) | 7 (4.7%) |
| 75 Years and over | 7 (15.2%) | 14 (23.0%) |
| Total | 50 (2.6%) | 74 (3.5%) |
Income Above Poverty by Sex and Age in Kimberly
According to the poverty statistics in Kimberly, males aged 5 years and females aged under 5 years are the age groups that are most secure financially, with 100.0% of males and 100.0% of females in these age groups living above the poverty line.
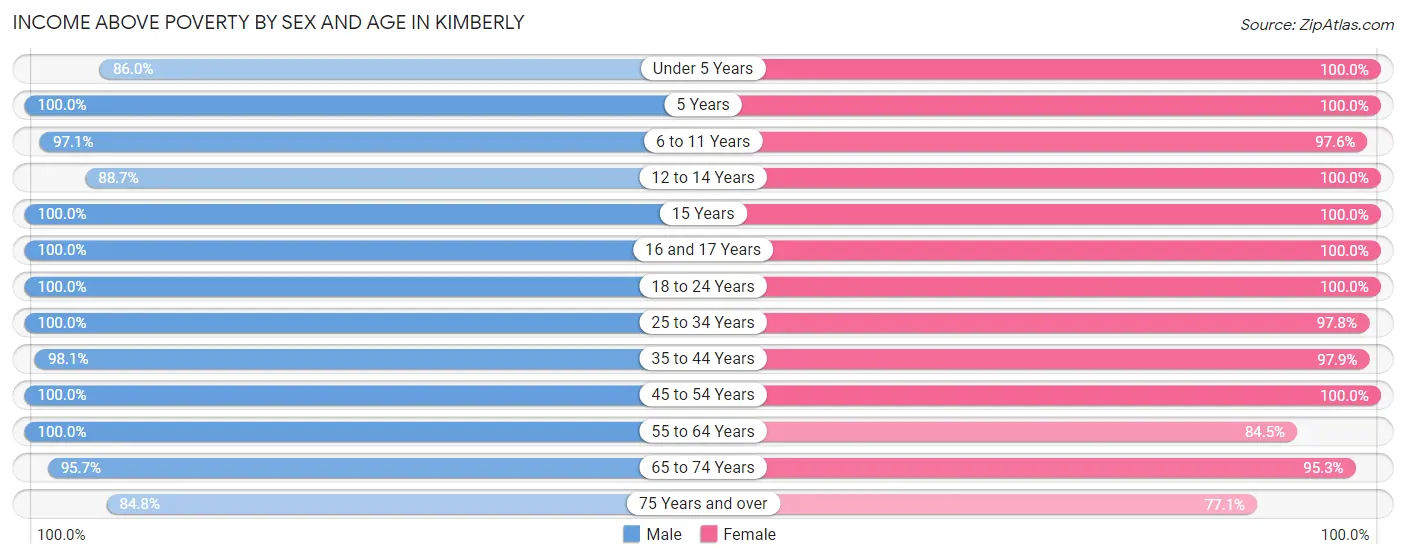
| Age Bracket | Male | Female |
| Under 5 Years | 86 (86.0%) | 89 (100.0%) |
| 5 Years | 14 (100.0%) | 26 (100.0%) |
| 6 to 11 Years | 270 (97.1%) | 200 (97.6%) |
| 12 to 14 Years | 63 (88.7%) | 314 (100.0%) |
| 15 Years | 52 (100.0%) | 7 (100.0%) |
| 16 and 17 Years | 21 (100.0%) | 68 (100.0%) |
| 18 to 24 Years | 142 (100.0%) | 115 (100.0%) |
| 25 to 34 Years | 218 (100.0%) | 224 (97.8%) |
| 35 to 44 Years | 302 (98.1%) | 328 (97.9%) |
| 45 to 54 Years | 364 (100.0%) | 282 (100.0%) |
| 55 to 64 Years | 155 (100.0%) | 196 (84.5%) |
| 65 to 74 Years | 156 (95.7%) | 143 (95.3%) |
| 75 Years and over | 39 (84.8%) | 47 (77.0%) |
| Total | 1,882 (97.4%) | 2,039 (96.5%) |
Income Below Poverty Among Married-Couple Families in Kimberly
The poverty statistics for married-couple families in Kimberly show that 0.7% or 7 of the total 989 families live below the poverty line. Families with no children have the highest poverty rate of 1.6%, comprising of 7 families. On the other hand, families with 1 or 2 children have the lowest poverty rate of 0.0%, which includes 0 families.
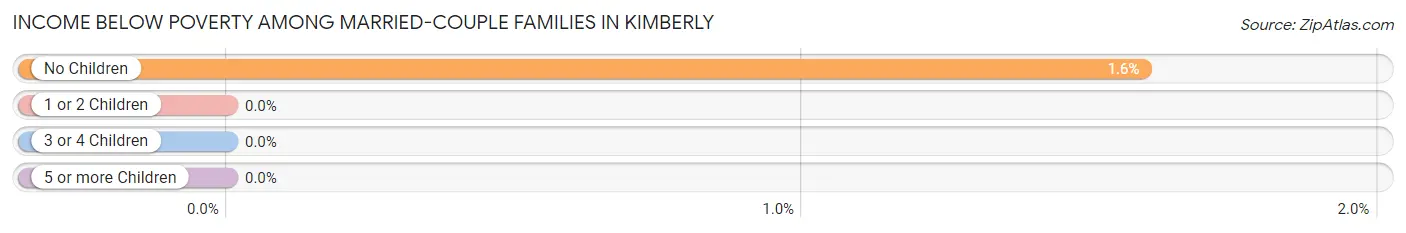
| Children | Above Poverty | Below Poverty |
| No Children | 432 (98.4%) | 7 (1.6%) |
| 1 or 2 Children | 446 (100.0%) | 0 (0.0%) |
| 3 or 4 Children | 104 (100.0%) | 0 (0.0%) |
| 5 or more Children | 0 (0.0%) | 0 (0.0%) |
| Total | 982 (99.3%) | 7 (0.7%) |
Income Below Poverty Among Single-Parent Households in Kimberly
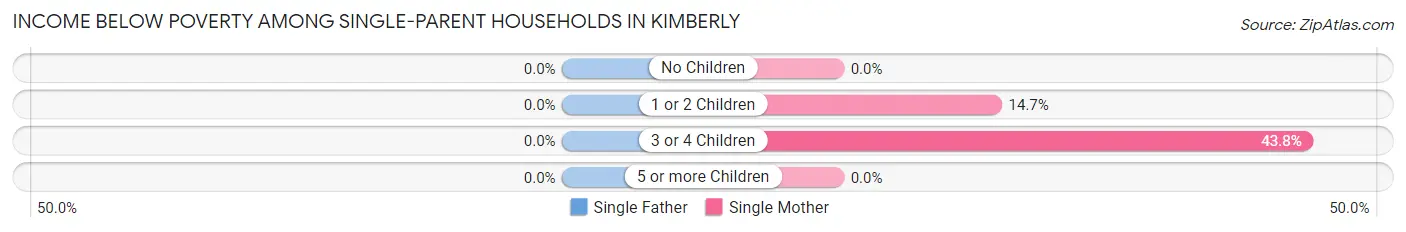
| Children | Single Father | Single Mother |
| No Children | 0 (0.0%) | 0 (0.0%) |
| 1 or 2 Children | 0 (0.0%) | 5 (14.7%) |
| 3 or 4 Children | 0 (0.0%) | 7 (43.8%) |
| 5 or more Children | 0 (0.0%) | 0 (0.0%) |
| Total | 0 (0.0%) | 12 (15.0%) |
Income Below Poverty Among Married-Couple vs Single-Parent Households in Kimberly
The poverty data for Kimberly shows that 7 of the married-couple family households (0.7%) and 12 of the single-parent households (8.3%) are living below the poverty level. Within the married-couple family households, those with no children have the highest poverty rate, with 7 households (1.6%) falling below the poverty line. Among the single-parent households, those with 3 or 4 children have the highest poverty rate, with 7 household (43.8%) living below poverty.
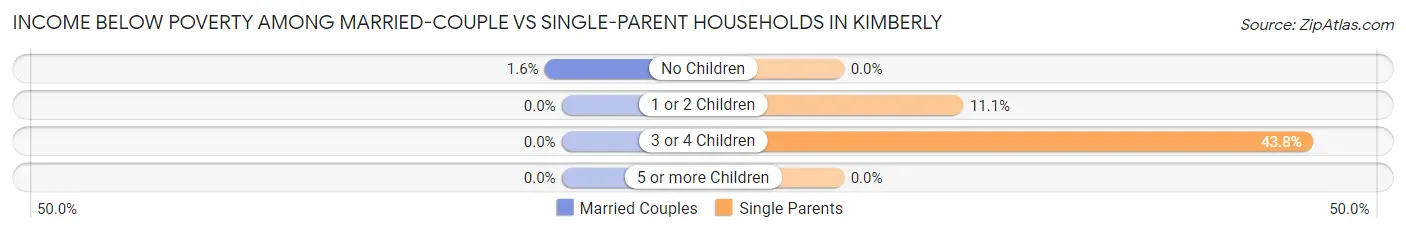
| Children | Married-Couple Families | Single-Parent Households |
| No Children | 7 (1.6%) | 0 (0.0%) |
| 1 or 2 Children | 0 (0.0%) | 5 (11.1%) |
| 3 or 4 Children | 0 (0.0%) | 7 (43.8%) |
| 5 or more Children | 0 (0.0%) | 0 (0.0%) |
| Total | 7 (0.7%) | 12 (8.3%) |
Employment Characteristics in Kimberly
Employment by Class of Employer in Kimberly
Among the 2,133 employed individuals in Kimberly, private company employees (1,407 | 66.0%), local government employees (300 | 14.1%), and state government employees (124 | 5.8%) make up the most common classes of employment.
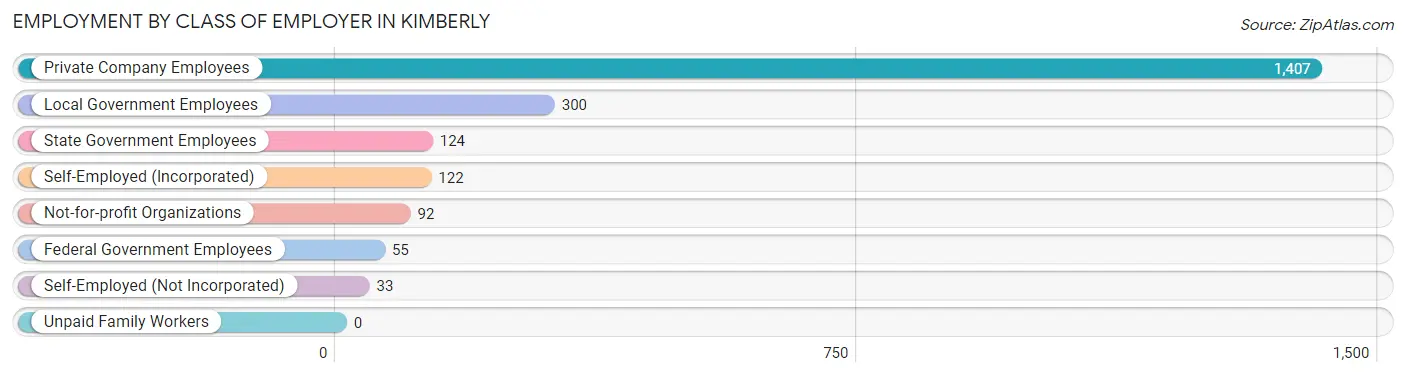
| Employer Class | # Employees | % Employees |
| Private Company Employees | 1,407 | 66.0% |
| Self-Employed (Incorporated) | 122 | 5.7% |
| Self-Employed (Not Incorporated) | 33 | 1.5% |
| Not-for-profit Organizations | 92 | 4.3% |
| Local Government Employees | 300 | 14.1% |
| State Government Employees | 124 | 5.8% |
| Federal Government Employees | 55 | 2.6% |
| Unpaid Family Workers | 0 | 0.0% |
| Total | 2,133 | 100.0% |
Employment Status by Age in Kimberly
According to the labor force statistics for Kimberly, out of the total population over 16 years of age (2,889), 75.9% or 2,193 individuals are in the labor force, with 0.7% or 15 of them unemployed. The age group with the highest labor force participation rate is 45 to 54 years, with 91.6% or 592 individuals in the labor force. Within the labor force, the 45 to 54 years age range has the highest percentage of unemployed individuals, with 2.7% or 16 of them being unemployed.
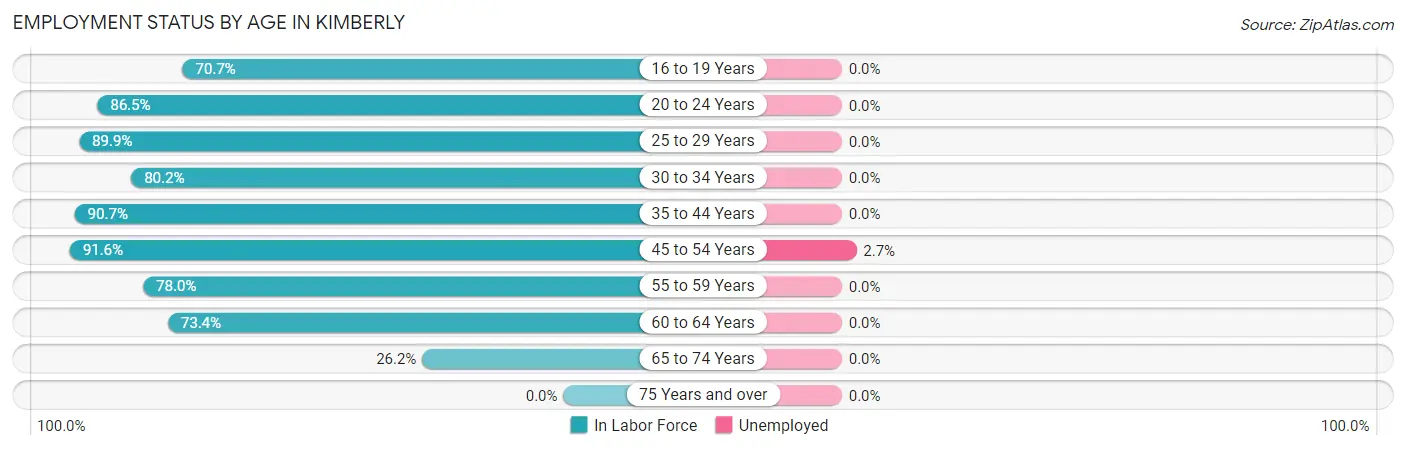
| Age Bracket | In Labor Force | Unemployed |
| 16 to 19 Years | 140 (70.7%) | 0 (0.0%) |
| 20 to 24 Years | 128 (86.5%) | 0 (0.0%) |
| 25 to 29 Years | 134 (89.9%) | 0 (0.0%) |
| 30 to 34 Years | 239 (80.2%) | 0 (0.0%) |
| 35 to 44 Years | 583 (90.7%) | 0 (0.0%) |
| 45 to 54 Years | 592 (91.6%) | 16 (2.7%) |
| 55 to 59 Years | 170 (78.0%) | 0 (0.0%) |
| 60 to 64 Years | 124 (73.4%) | 0 (0.0%) |
| 65 to 74 Years | 82 (26.2%) | 0 (0.0%) |
| 75 Years and over | 0 (0.0%) | 0 (0.0%) |
| Total | 2,193 (75.9%) | 15 (0.7%) |
Employment Status by Educational Attainment in Kimberly
According to labor force statistics for Kimberly, 86.8% of individuals (1,843) out of the total population between 25 and 64 years of age (2,123) are in the labor force, with 0.9% or 17 of them being unemployed. The group with the highest labor force participation rate are those with the educational attainment of bachelor's degree or higher, with 95.4% or 682 individuals in the labor force. Within the labor force, individuals with college / associate degree education have the highest percentage of unemployment, with 1.9% or 16 of them being unemployed.
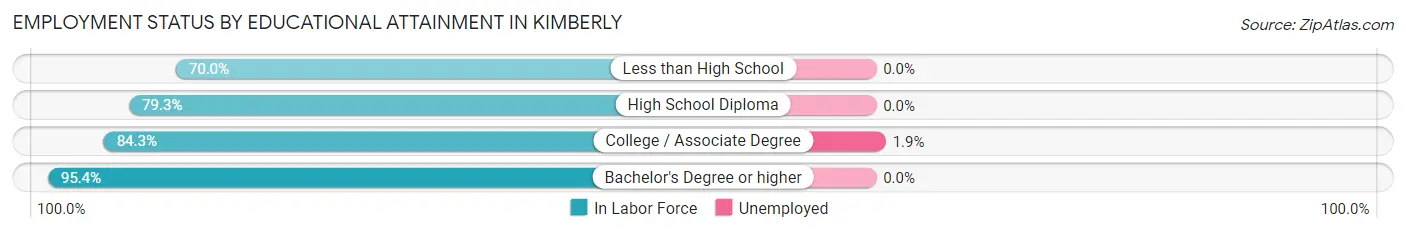
| Educational Attainment | In Labor Force | Unemployed |
| Less than High School | 49 (70.0%) | 0 (0.0%) |
| High School Diploma | 276 (79.3%) | 0 (0.0%) |
| College / Associate Degree | 835 (84.3%) | 19 (1.9%) |
| Bachelor's Degree or higher | 682 (95.4%) | 0 (0.0%) |
| Total | 1,843 (86.8%) | 19 (0.9%) |
Employment Occupations by Sex in Kimberly
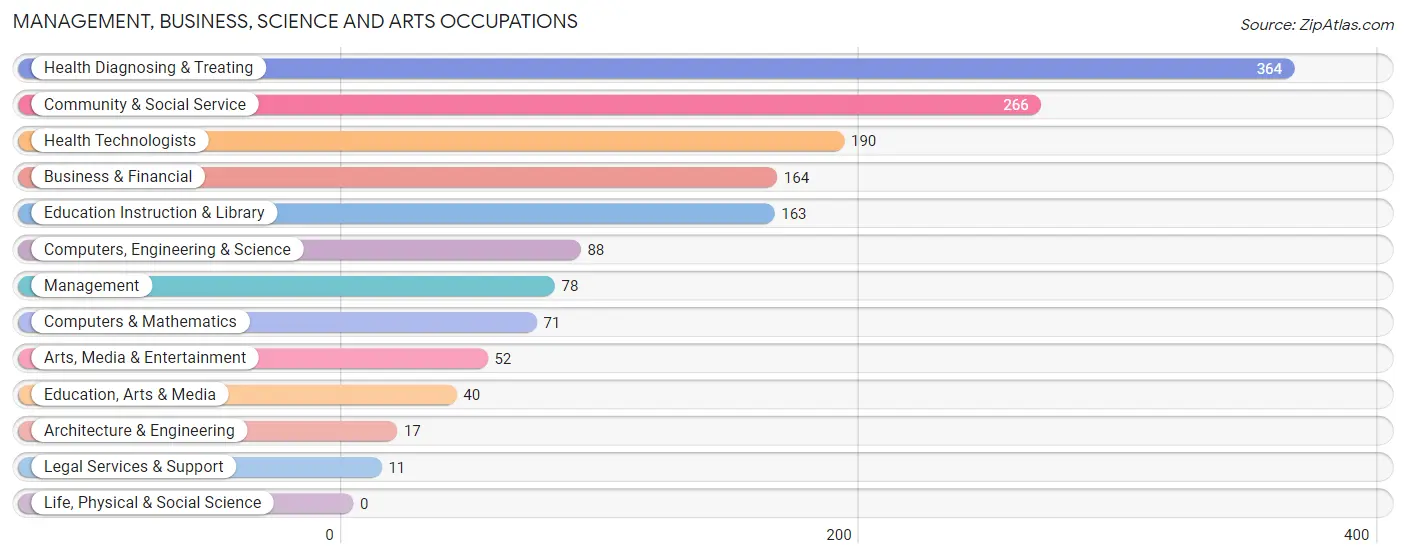
Management, Business, Science and Arts Occupations
The most common Management, Business, Science and Arts occupations in Kimberly are Health Diagnosing & Treating (364 | 16.7%), Community & Social Service (266 | 12.2%), Health Technologists (190 | 8.7%), Business & Financial (164 | 7.5%), and Education Instruction & Library (163 | 7.5%).
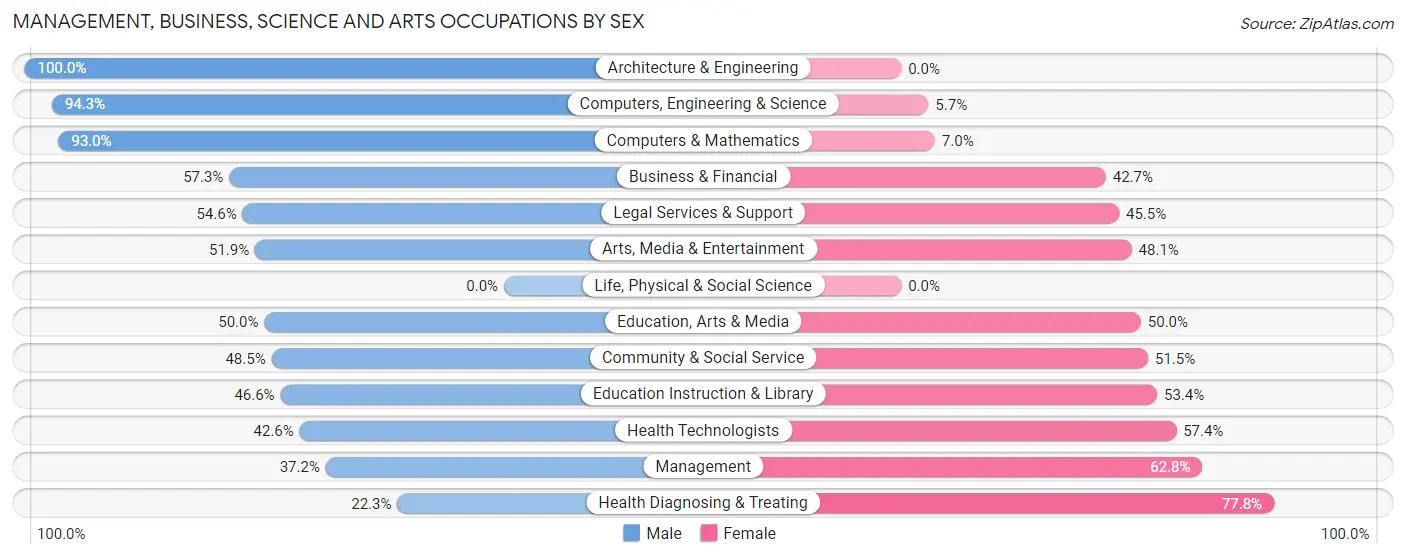
Management, Business, Science and Arts Occupations by Sex
Within the Management, Business, Science and Arts occupations in Kimberly, the most male-oriented occupations are Architecture & Engineering (100.0%), Computers, Engineering & Science (94.3%), and Computers & Mathematics (93.0%), while the most female-oriented occupations are Health Diagnosing & Treating (77.7%), Management (62.8%), and Health Technologists (57.4%).
| Occupation | Male | Female |
| Management | 29 (37.2%) | 49 (62.8%) |
| Business & Financial | 94 (57.3%) | 70 (42.7%) |
| Computers, Engineering & Science | 83 (94.3%) | 5 (5.7%) |
| Computers & Mathematics | 66 (93.0%) | 5 (7.0%) |
| Architecture & Engineering | 17 (100.0%) | 0 (0.0%) |
| Life, Physical & Social Science | 0 (0.0%) | 0 (0.0%) |
| Community & Social Service | 129 (48.5%) | 137 (51.5%) |
| Education, Arts & Media | 20 (50.0%) | 20 (50.0%) |
| Legal Services & Support | 6 (54.5%) | 5 (45.5%) |
| Education Instruction & Library | 76 (46.6%) | 87 (53.4%) |
| Arts, Media & Entertainment | 27 (51.9%) | 25 (48.1%) |
| Health Diagnosing & Treating | 81 (22.3%) | 283 (77.7%) |
| Health Technologists | 81 (42.6%) | 109 (57.4%) |
| Total (Category) | 416 (43.3%) | 544 (56.7%) |
| Total (Overall) | 1,131 (52.0%) | 1,045 (48.0%) |
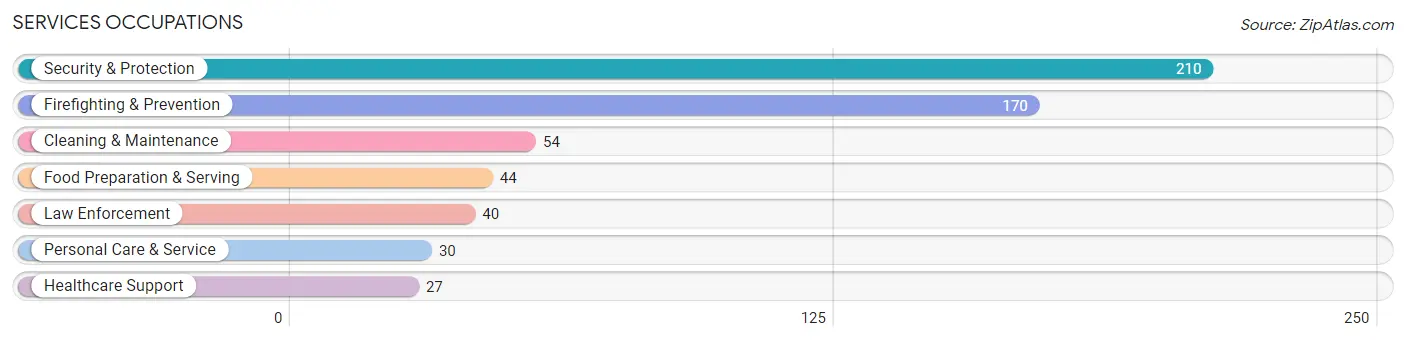
Services Occupations
The most common Services occupations in Kimberly are Security & Protection (210 | 9.7%), Firefighting & Prevention (170 | 7.8%), Cleaning & Maintenance (54 | 2.5%), Food Preparation & Serving (44 | 2.0%), and Law Enforcement (40 | 1.8%).
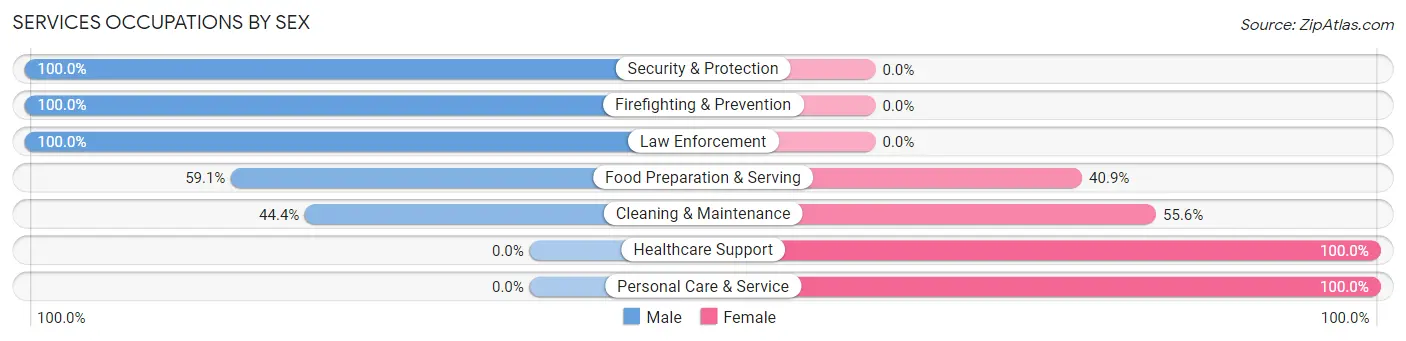
Services Occupations by Sex
Within the Services occupations in Kimberly, the most male-oriented occupations are Security & Protection (100.0%), Firefighting & Prevention (100.0%), and Law Enforcement (100.0%), while the most female-oriented occupations are Healthcare Support (100.0%), Personal Care & Service (100.0%), and Cleaning & Maintenance (55.6%).
| Occupation | Male | Female |
| Healthcare Support | 0 (0.0%) | 27 (100.0%) |
| Security & Protection | 210 (100.0%) | 0 (0.0%) |
| Firefighting & Prevention | 170 (100.0%) | 0 (0.0%) |
| Law Enforcement | 40 (100.0%) | 0 (0.0%) |
| Food Preparation & Serving | 26 (59.1%) | 18 (40.9%) |
| Cleaning & Maintenance | 24 (44.4%) | 30 (55.6%) |
| Personal Care & Service | 0 (0.0%) | 30 (100.0%) |
| Total (Category) | 260 (71.2%) | 105 (28.8%) |
| Total (Overall) | 1,131 (52.0%) | 1,045 (48.0%) |
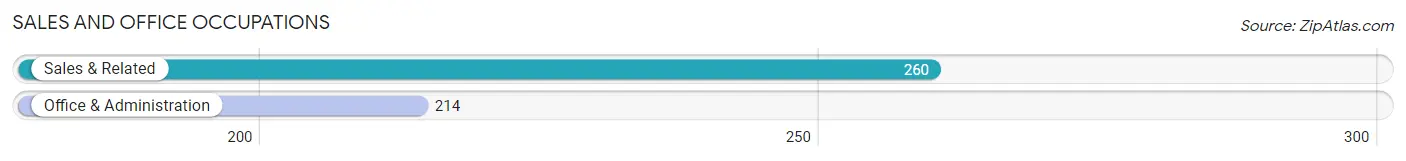
Sales and Office Occupations
The most common Sales and Office occupations in Kimberly are Sales & Related (260 | 11.9%), and Office & Administration (214 | 9.8%).
Sales and Office Occupations by Sex
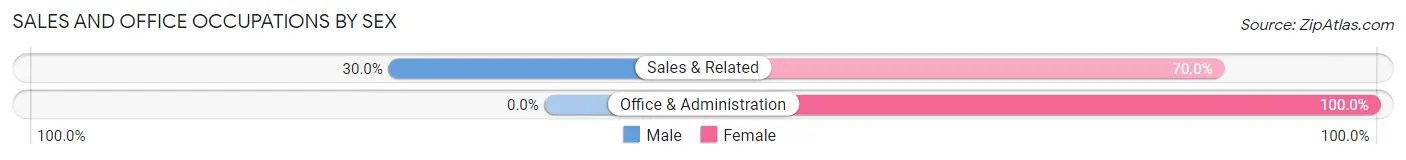
| Occupation | Male | Female |
| Sales & Related | 78 (30.0%) | 182 (70.0%) |
| Office & Administration | 0 (0.0%) | 214 (100.0%) |
| Total (Category) | 78 (16.5%) | 396 (83.5%) |
| Total (Overall) | 1,131 (52.0%) | 1,045 (48.0%) |
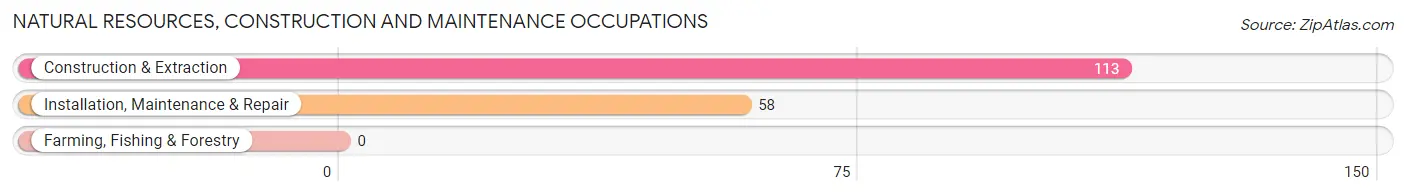
Natural Resources, Construction and Maintenance Occupations
The most common Natural Resources, Construction and Maintenance occupations in Kimberly are Construction & Extraction (113 | 5.2%), and Installation, Maintenance & Repair (58 | 2.7%).
Natural Resources, Construction and Maintenance Occupations by Sex
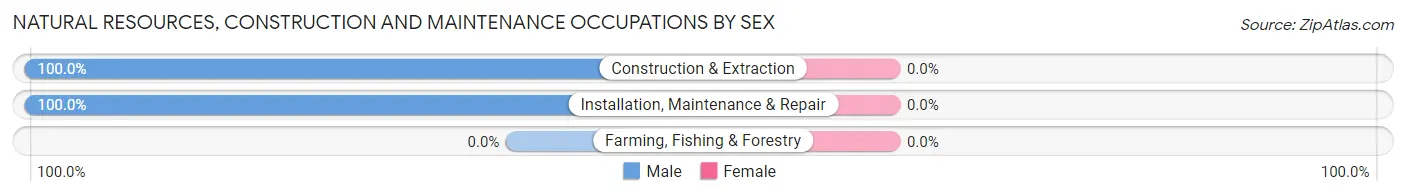
| Occupation | Male | Female |
| Farming, Fishing & Forestry | 0 (0.0%) | 0 (0.0%) |
| Construction & Extraction | 113 (100.0%) | 0 (0.0%) |
| Installation, Maintenance & Repair | 58 (100.0%) | 0 (0.0%) |
| Total (Category) | 171 (100.0%) | 0 (0.0%) |
| Total (Overall) | 1,131 (52.0%) | 1,045 (48.0%) |
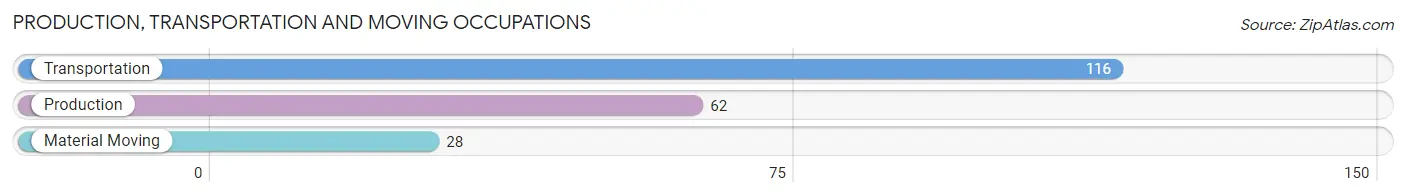
Production, Transportation and Moving Occupations
The most common Production, Transportation and Moving occupations in Kimberly are Transportation (116 | 5.3%), Production (62 | 2.9%), and Material Moving (28 | 1.3%).
Production, Transportation and Moving Occupations by Sex
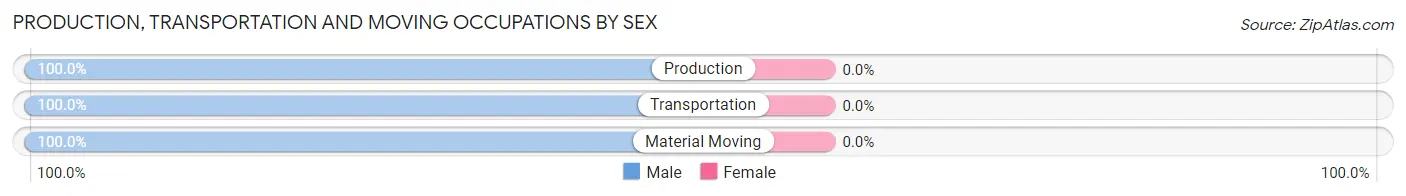
| Occupation | Male | Female |
| Production | 62 (100.0%) | 0 (0.0%) |
| Transportation | 116 (100.0%) | 0 (0.0%) |
| Material Moving | 28 (100.0%) | 0 (0.0%) |
| Total (Category) | 206 (100.0%) | 0 (0.0%) |
| Total (Overall) | 1,131 (52.0%) | 1,045 (48.0%) |
Employment Industries by Sex in Kimberly
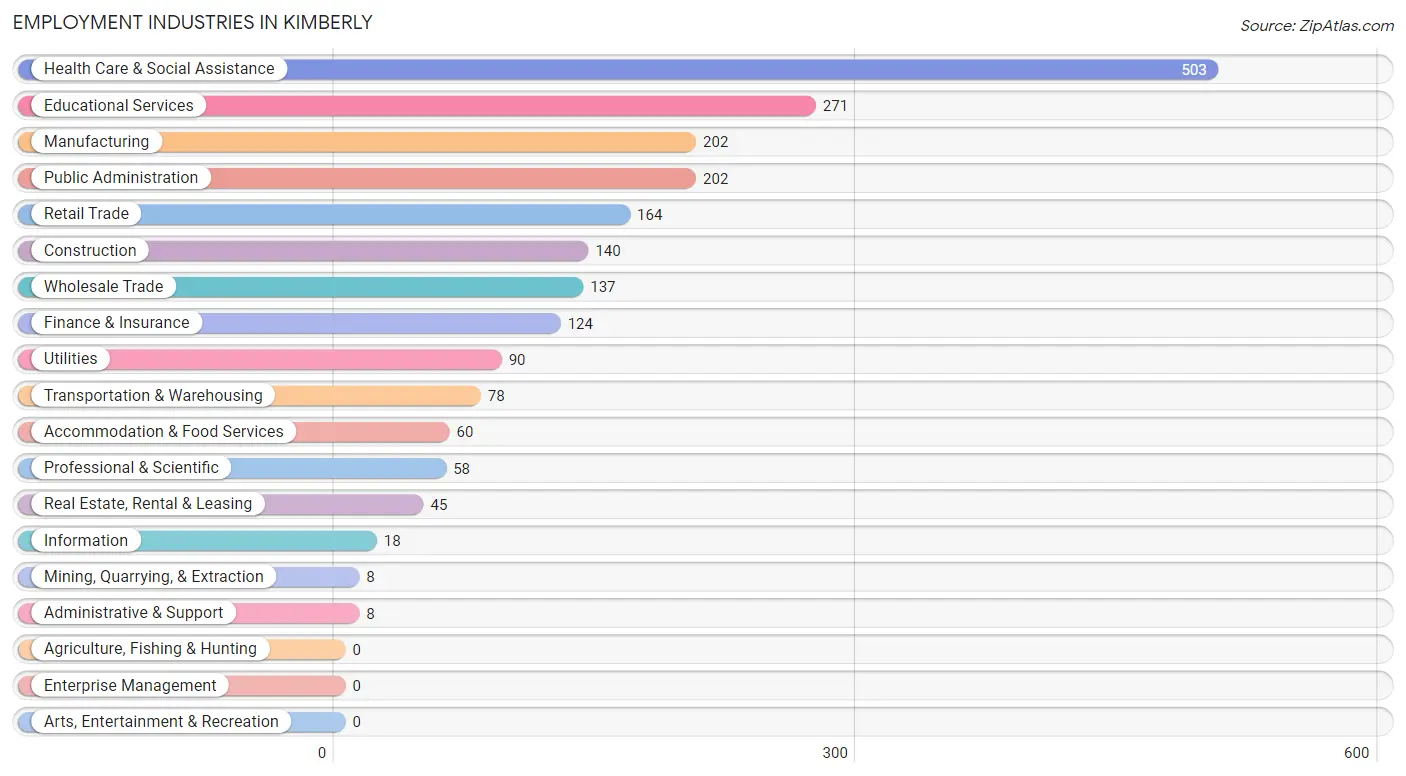
Employment Industries in Kimberly
The major employment industries in Kimberly include Health Care & Social Assistance (503 | 23.1%), Educational Services (271 | 12.4%), Manufacturing (202 | 9.3%), Public Administration (202 | 9.3%), and Retail Trade (164 | 7.5%).
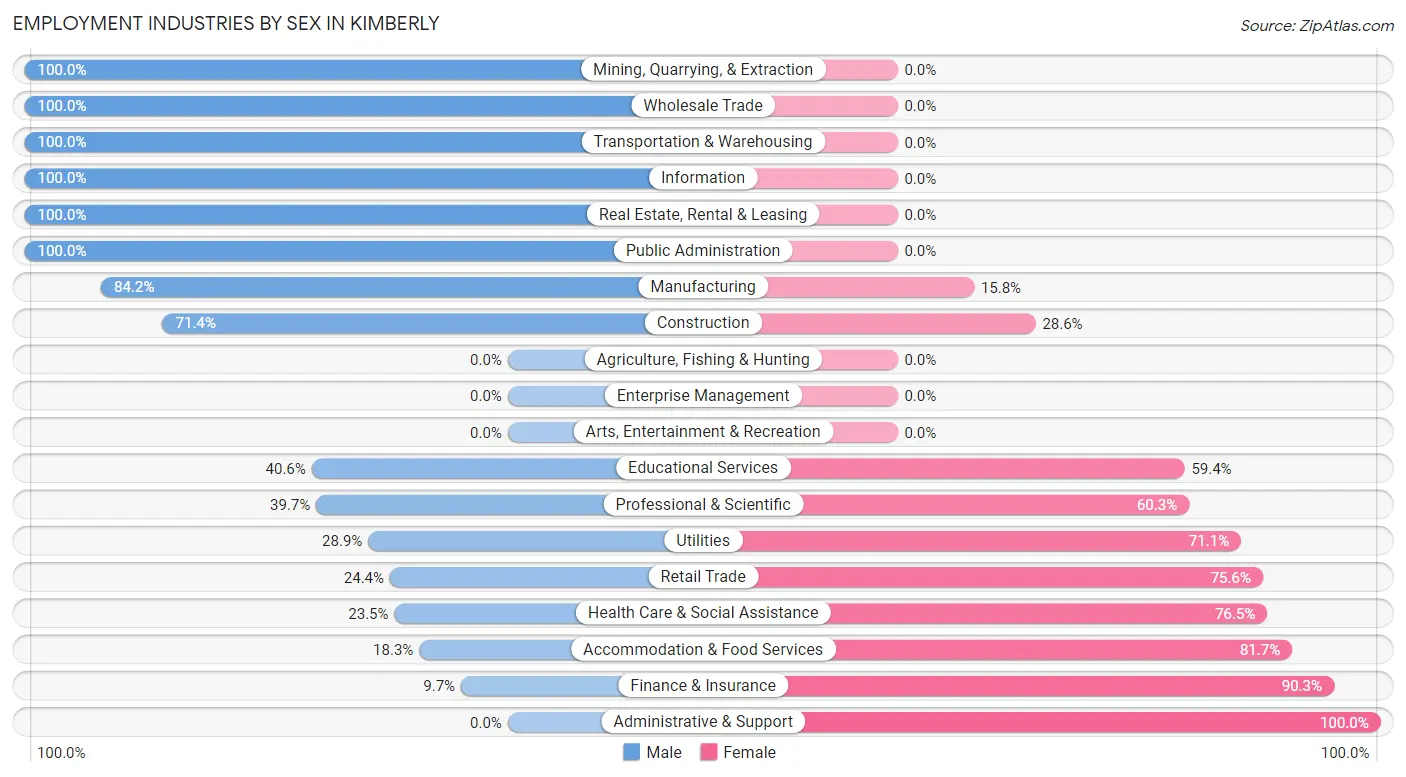
Employment Industries by Sex in Kimberly
The Kimberly industries that see more men than women are Mining, Quarrying, & Extraction (100.0%), Wholesale Trade (100.0%), and Transportation & Warehousing (100.0%), whereas the industries that tend to have a higher number of women are Administrative & Support (100.0%), Finance & Insurance (90.3%), and Accommodation & Food Services (81.7%).
| Industry | Male | Female |
| Agriculture, Fishing & Hunting | 0 (0.0%) | 0 (0.0%) |
| Mining, Quarrying, & Extraction | 8 (100.0%) | 0 (0.0%) |
| Construction | 100 (71.4%) | 40 (28.6%) |
| Manufacturing | 170 (84.2%) | 32 (15.8%) |
| Wholesale Trade | 137 (100.0%) | 0 (0.0%) |
| Retail Trade | 40 (24.4%) | 124 (75.6%) |
| Transportation & Warehousing | 78 (100.0%) | 0 (0.0%) |
| Utilities | 26 (28.9%) | 64 (71.1%) |
| Information | 18 (100.0%) | 0 (0.0%) |
| Finance & Insurance | 12 (9.7%) | 112 (90.3%) |
| Real Estate, Rental & Leasing | 45 (100.0%) | 0 (0.0%) |
| Professional & Scientific | 23 (39.7%) | 35 (60.3%) |
| Enterprise Management | 0 (0.0%) | 0 (0.0%) |
| Administrative & Support | 0 (0.0%) | 8 (100.0%) |
| Educational Services | 110 (40.6%) | 161 (59.4%) |
| Health Care & Social Assistance | 118 (23.5%) | 385 (76.5%) |
| Arts, Entertainment & Recreation | 0 (0.0%) | 0 (0.0%) |
| Accommodation & Food Services | 11 (18.3%) | 49 (81.7%) |
| Public Administration | 202 (100.0%) | 0 (0.0%) |
| Total | 1,131 (52.0%) | 1,045 (48.0%) |
Education in Kimberly
School Enrollment in Kimberly
The most common levels of schooling among the 1,194 students in Kimberly are middle school (485 | 40.6%), elementary school (294 | 24.6%), and high school (131 | 11.0%).
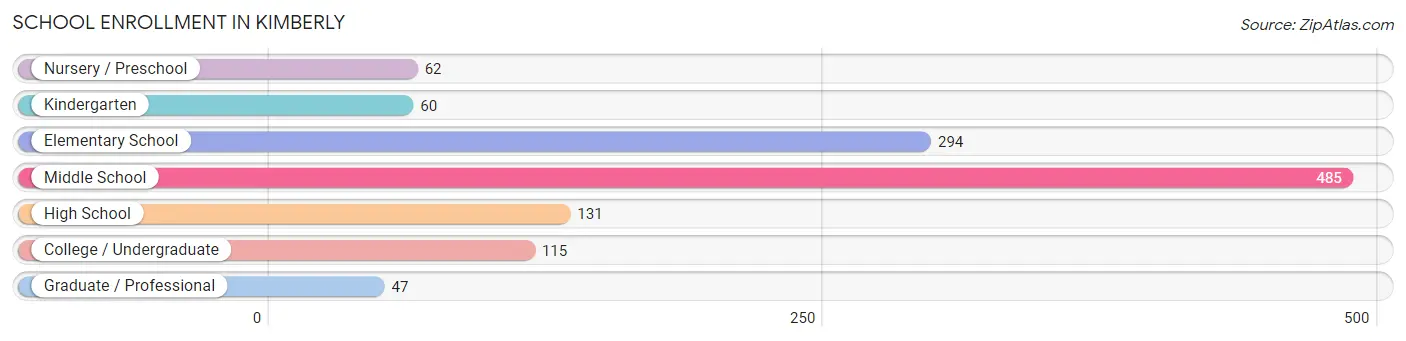
| School Level | # Students | % Students |
| Nursery / Preschool | 62 | 5.2% |
| Kindergarten | 60 | 5.0% |
| Elementary School | 294 | 24.6% |
| Middle School | 485 | 40.6% |
| High School | 131 | 11.0% |
| College / Undergraduate | 115 | 9.6% |
| Graduate / Professional | 47 | 3.9% |
| Total | 1,194 | 100.0% |
School Enrollment by Age by Funding Source in Kimberly
Out of a total of 1,194 students who are enrolled in schools in Kimberly, 92 (7.7%) attend a private institution, while the remaining 1,102 (92.3%) are enrolled in public schools. The age group of 3 to 4 year olds has the highest likelihood of being enrolled in private schools, with 34 (54.8% in the age bracket) enrolled. Conversely, the age group of 15 to 17 year olds has the lowest likelihood of being enrolled in a private school, with 113 (100.0% in the age bracket) attending a public institution.
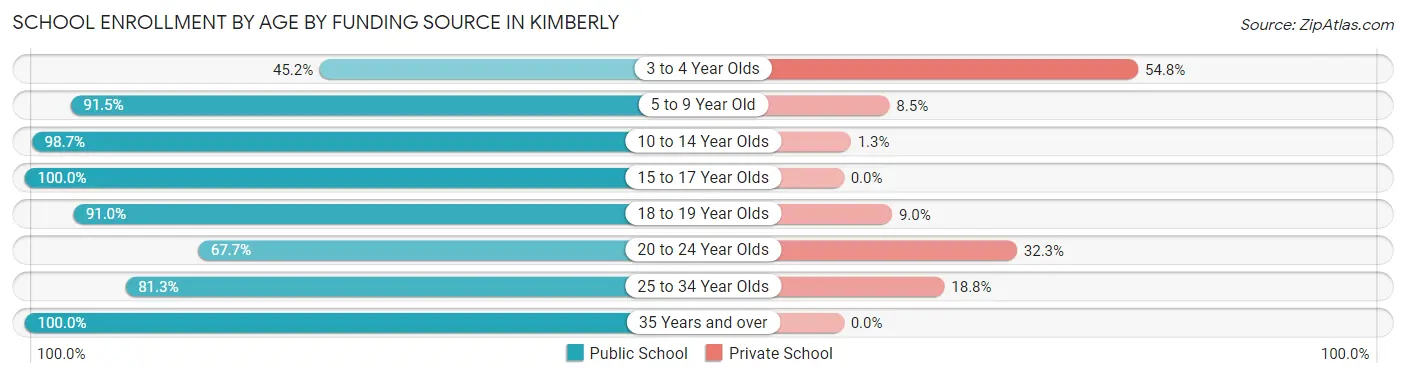
| Age Bracket | Public School | Private School |
| 3 to 4 Year Olds | 28 (45.2%) | 34 (54.8%) |
| 5 to 9 Year Old | 290 (91.5%) | 27 (8.5%) |
| 10 to 14 Year Olds | 522 (98.7%) | 7 (1.3%) |
| 15 to 17 Year Olds | 113 (100.0%) | 0 (0.0%) |
| 18 to 19 Year Olds | 81 (91.0%) | 8 (9.0%) |
| 20 to 24 Year Olds | 21 (67.7%) | 10 (32.3%) |
| 25 to 34 Year Olds | 26 (81.2%) | 6 (18.8%) |
| 35 Years and over | 21 (100.0%) | 0 (0.0%) |
| Total | 1,102 (92.3%) | 92 (7.7%) |
Educational Attainment by Field of Study in Kimberly
Science & technology (189 | 23.0%), business (169 | 20.6%), education (153 | 18.6%), arts & humanities (93 | 11.3%), and computers & mathematics (68 | 8.3%) are the most common fields of study among 821 individuals in Kimberly who have obtained a bachelor's degree or higher.
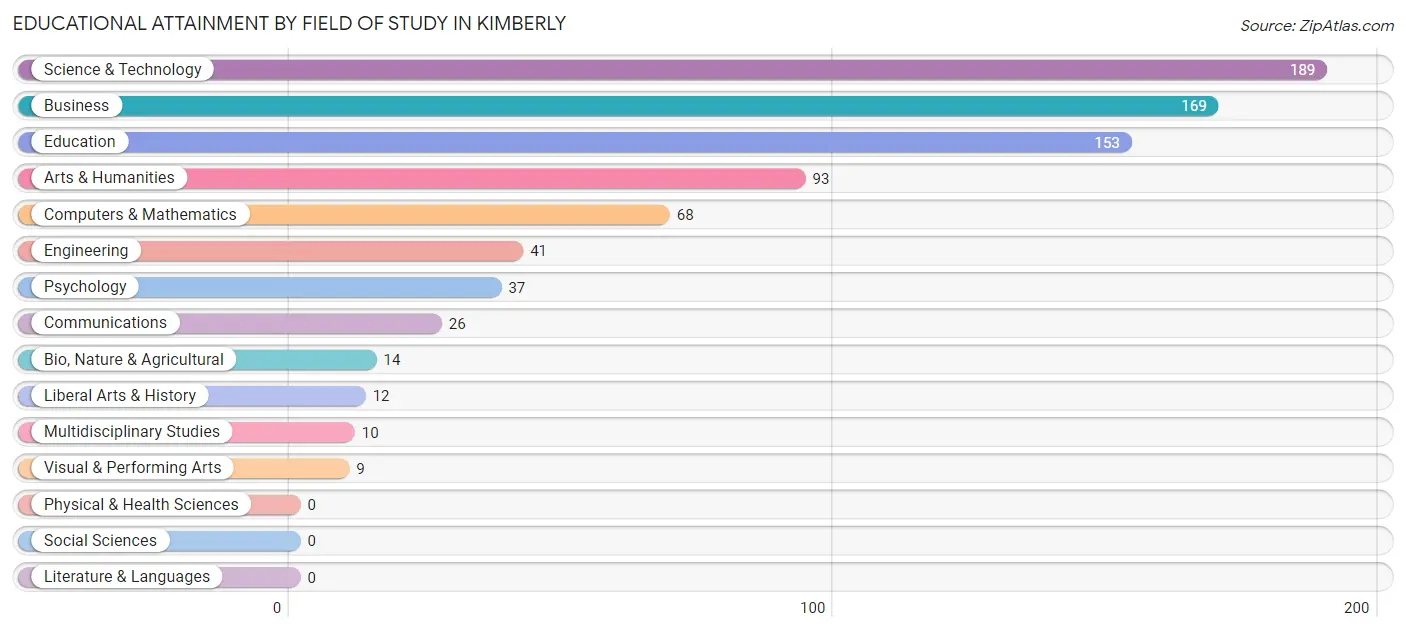
| Field of Study | # Graduates | % Graduates |
| Computers & Mathematics | 68 | 8.3% |
| Bio, Nature & Agricultural | 14 | 1.7% |
| Physical & Health Sciences | 0 | 0.0% |
| Psychology | 37 | 4.5% |
| Social Sciences | 0 | 0.0% |
| Engineering | 41 | 5.0% |
| Multidisciplinary Studies | 10 | 1.2% |
| Science & Technology | 189 | 23.0% |
| Business | 169 | 20.6% |
| Education | 153 | 18.6% |
| Literature & Languages | 0 | 0.0% |
| Liberal Arts & History | 12 | 1.5% |
| Visual & Performing Arts | 9 | 1.1% |
| Communications | 26 | 3.2% |
| Arts & Humanities | 93 | 11.3% |
| Total | 821 | 100.0% |
Transportation & Commute in Kimberly
Vehicle Availability by Sex in Kimberly
The most prevalent vehicle ownership categories in Kimberly are males with 2 vehicles (668, accounting for 59.1%) and females with 2 vehicles (533, making up 66.7%).
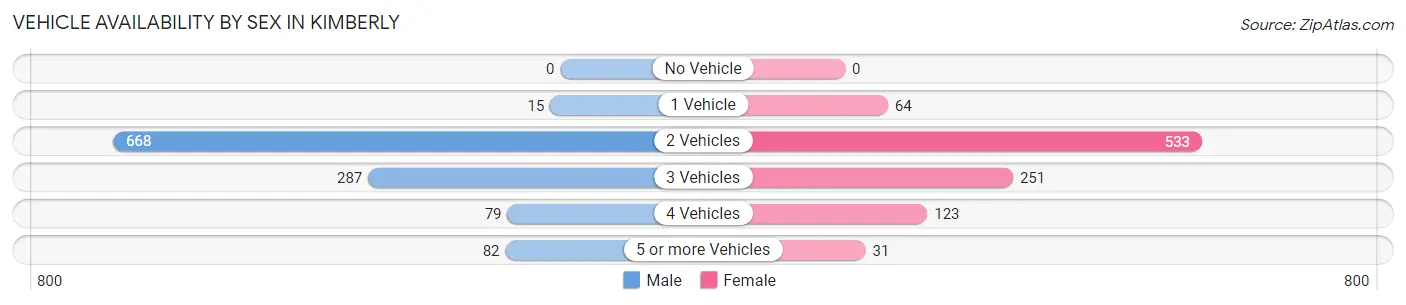
| Vehicles Available | Male | Female |
| No Vehicle | 0 (0.0%) | 0 (0.0%) |
| 1 Vehicle | 15 (1.3%) | 64 (6.4%) |
| 2 Vehicles | 668 (59.1%) | 533 (53.2%) |
| 3 Vehicles | 287 (25.4%) | 251 (25.1%) |
| 4 Vehicles | 79 (7.0%) | 123 (12.3%) |
| 5 or more Vehicles | 82 (7.2%) | 31 (3.1%) |
| Total | 1,131 (100.0%) | 1,002 (100.0%) |
Commute Time in Kimberly
The most frequently occuring commute durations in Kimberly are 30 to 34 minutes (485 commuters, 24.2%), 45 to 59 minutes (307 commuters, 15.3%), and 15 to 19 minutes (274 commuters, 13.7%).
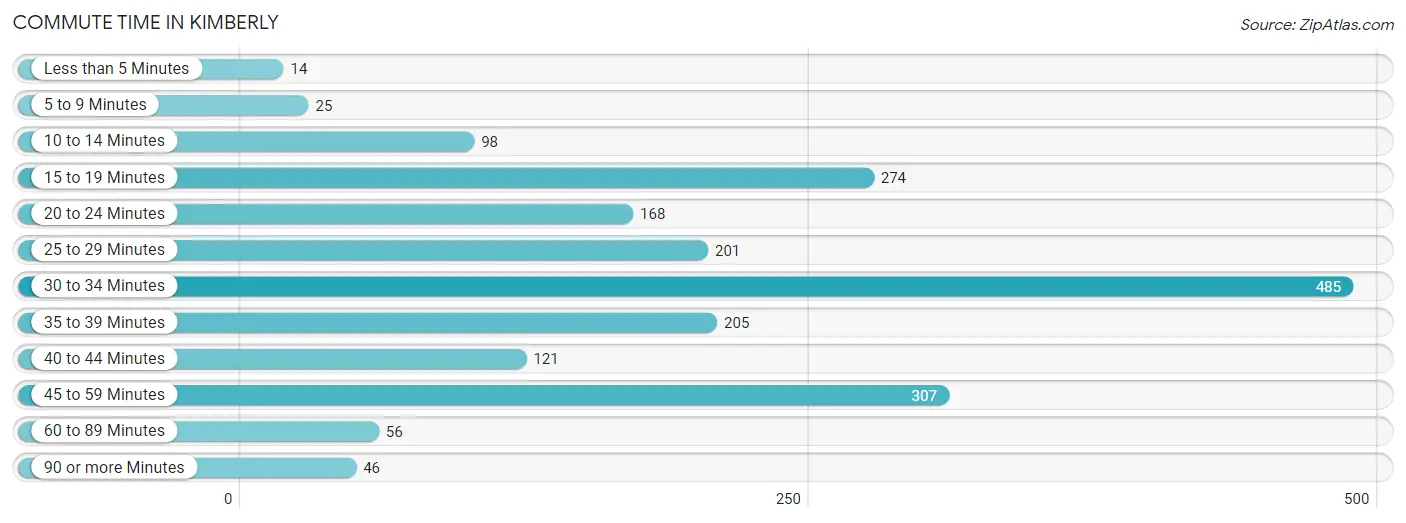
| Commute Time | # Commuters | % Commuters |
| Less than 5 Minutes | 14 | 0.7% |
| 5 to 9 Minutes | 25 | 1.3% |
| 10 to 14 Minutes | 98 | 4.9% |
| 15 to 19 Minutes | 274 | 13.7% |
| 20 to 24 Minutes | 168 | 8.4% |
| 25 to 29 Minutes | 201 | 10.1% |
| 30 to 34 Minutes | 485 | 24.2% |
| 35 to 39 Minutes | 205 | 10.2% |
| 40 to 44 Minutes | 121 | 6.0% |
| 45 to 59 Minutes | 307 | 15.3% |
| 60 to 89 Minutes | 56 | 2.8% |
| 90 or more Minutes | 46 | 2.3% |
Commute Time by Sex in Kimberly
The most common commute times in Kimberly are 30 to 34 minutes (294 commuters, 26.7%) for males and 45 to 59 minutes (211 commuters, 23.4%) for females.
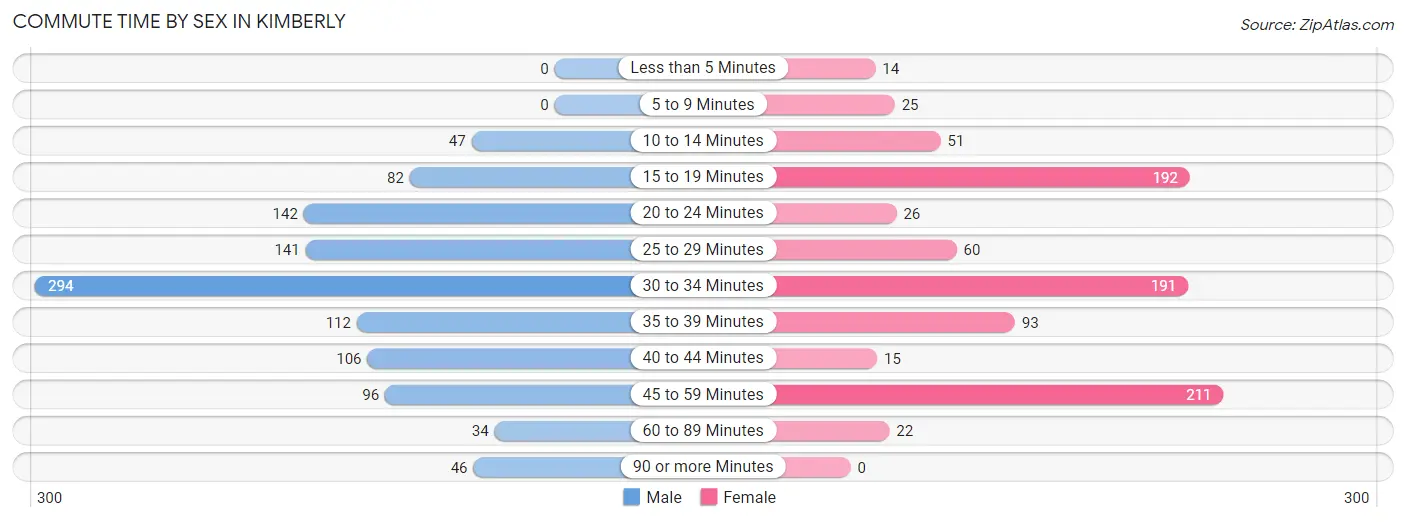
| Commute Time | Male | Female |
| Less than 5 Minutes | 0 (0.0%) | 14 (1.6%) |
| 5 to 9 Minutes | 0 (0.0%) | 25 (2.8%) |
| 10 to 14 Minutes | 47 (4.3%) | 51 (5.7%) |
| 15 to 19 Minutes | 82 (7.4%) | 192 (21.3%) |
| 20 to 24 Minutes | 142 (12.9%) | 26 (2.9%) |
| 25 to 29 Minutes | 141 (12.8%) | 60 (6.7%) |
| 30 to 34 Minutes | 294 (26.7%) | 191 (21.2%) |
| 35 to 39 Minutes | 112 (10.2%) | 93 (10.3%) |
| 40 to 44 Minutes | 106 (9.6%) | 15 (1.7%) |
| 45 to 59 Minutes | 96 (8.7%) | 211 (23.4%) |
| 60 to 89 Minutes | 34 (3.1%) | 22 (2.4%) |
| 90 or more Minutes | 46 (4.2%) | 0 (0.0%) |
Time of Departure to Work by Sex in Kimberly
The most frequent times of departure to work in Kimberly are 6:30 AM to 6:59 AM (290, 26.4%) for males and 6:30 AM to 6:59 AM (212, 23.6%) for females.
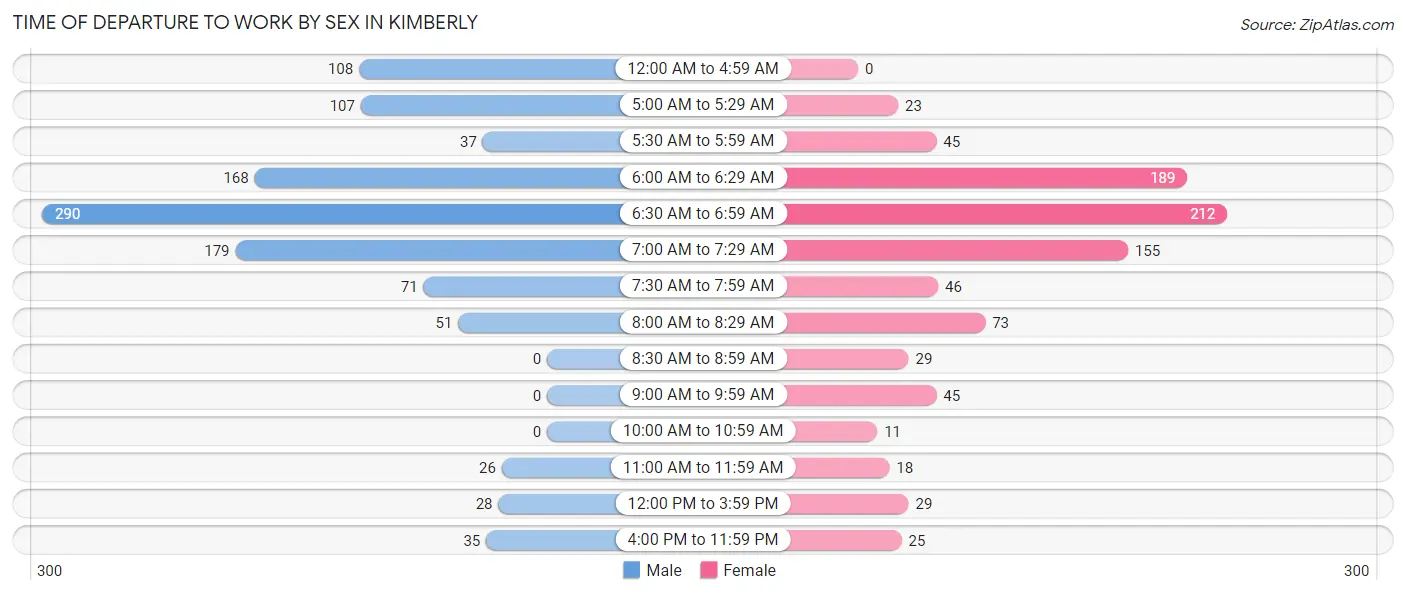
| Time of Departure | Male | Female |
| 12:00 AM to 4:59 AM | 108 (9.8%) | 0 (0.0%) |
| 5:00 AM to 5:29 AM | 107 (9.7%) | 23 (2.6%) |
| 5:30 AM to 5:59 AM | 37 (3.4%) | 45 (5.0%) |
| 6:00 AM to 6:29 AM | 168 (15.3%) | 189 (21.0%) |
| 6:30 AM to 6:59 AM | 290 (26.4%) | 212 (23.6%) |
| 7:00 AM to 7:29 AM | 179 (16.3%) | 155 (17.2%) |
| 7:30 AM to 7:59 AM | 71 (6.5%) | 46 (5.1%) |
| 8:00 AM to 8:29 AM | 51 (4.6%) | 73 (8.1%) |
| 8:30 AM to 8:59 AM | 0 (0.0%) | 29 (3.2%) |
| 9:00 AM to 9:59 AM | 0 (0.0%) | 45 (5.0%) |
| 10:00 AM to 10:59 AM | 0 (0.0%) | 11 (1.2%) |
| 11:00 AM to 11:59 AM | 26 (2.4%) | 18 (2.0%) |
| 12:00 PM to 3:59 PM | 28 (2.5%) | 29 (3.2%) |
| 4:00 PM to 11:59 PM | 35 (3.2%) | 25 (2.8%) |
| Total | 1,100 (100.0%) | 900 (100.0%) |
Housing Occupancy in Kimberly
Occupancy by Ownership in Kimberly
Of the total 1,338 dwellings in Kimberly, owner-occupied units account for 1,267 (94.7%), while renter-occupied units make up 71 (5.3%).
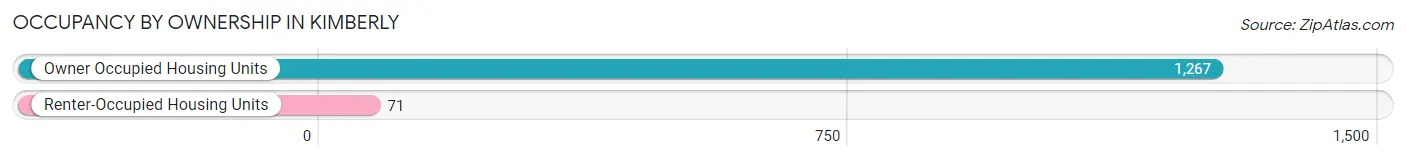
| Occupancy | # Housing Units | % Housing Units |
| Owner Occupied Housing Units | 1,267 | 94.7% |
| Renter-Occupied Housing Units | 71 | 5.3% |
| Total Occupied Housing Units | 1,338 | 100.0% |
Occupancy by Household Size in Kimberly
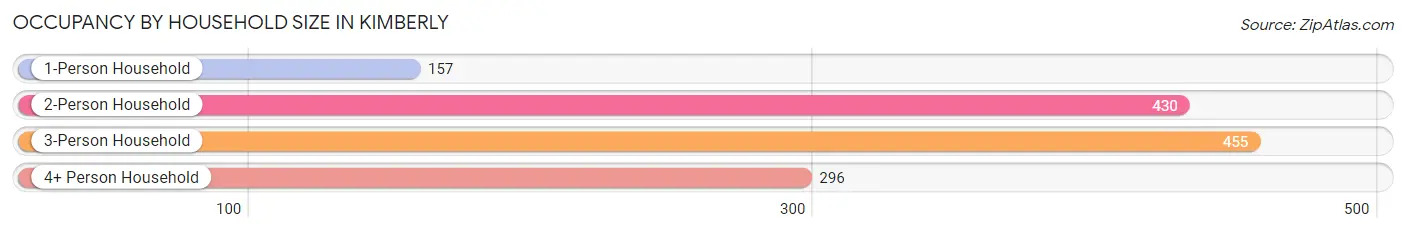
| Household Size | # Housing Units | % Housing Units |
| 1-Person Household | 157 | 11.7% |
| 2-Person Household | 430 | 32.1% |
| 3-Person Household | 455 | 34.0% |
| 4+ Person Household | 296 | 22.1% |
| Total Housing Units | 1,338 | 100.0% |
Occupancy by Ownership by Household Size in Kimberly
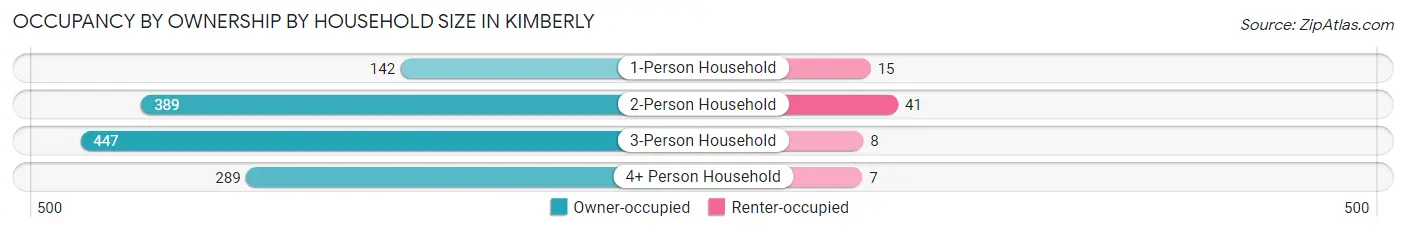
| Household Size | Owner-occupied | Renter-occupied |
| 1-Person Household | 142 (90.4%) | 15 (9.6%) |
| 2-Person Household | 389 (90.5%) | 41 (9.5%) |
| 3-Person Household | 447 (98.2%) | 8 (1.8%) |
| 4+ Person Household | 289 (97.6%) | 7 (2.4%) |
| Total Housing Units | 1,267 (94.7%) | 71 (5.3%) |
Occupancy by Educational Attainment in Kimberly
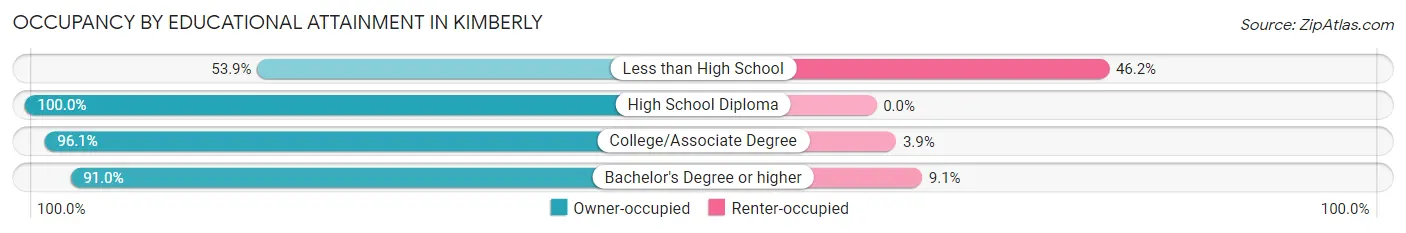
| Household Size | Owner-occupied | Renter-occupied |
| Less than High School | 7 (53.8%) | 6 (46.2%) |
| High School Diploma | 259 (100.0%) | 0 (0.0%) |
| College/Associate Degree | 589 (96.1%) | 24 (3.9%) |
| Bachelor's Degree or higher | 412 (90.9%) | 41 (9.0%) |
Occupancy by Age of Householder in Kimberly
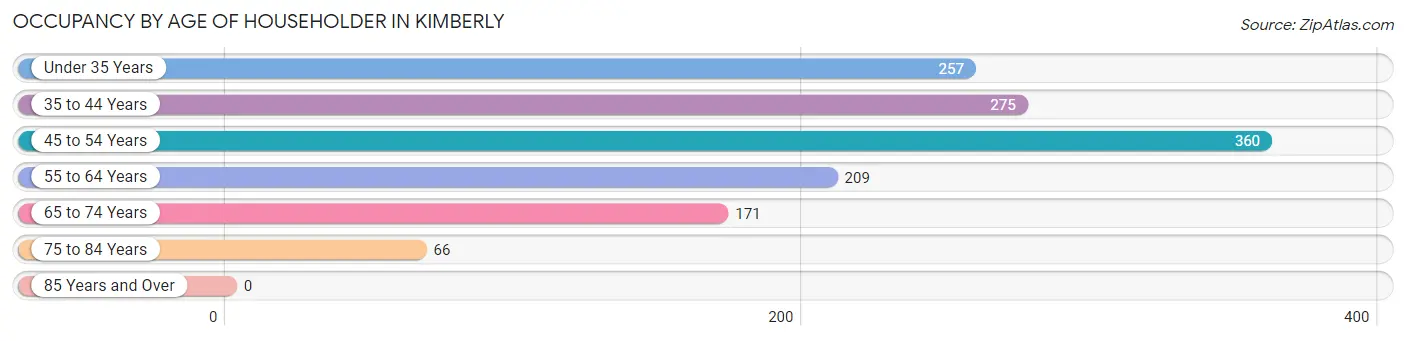
| Age Bracket | # Households | % Households |
| Under 35 Years | 257 | 19.2% |
| 35 to 44 Years | 275 | 20.5% |
| 45 to 54 Years | 360 | 26.9% |
| 55 to 64 Years | 209 | 15.6% |
| 65 to 74 Years | 171 | 12.8% |
| 75 to 84 Years | 66 | 4.9% |
| 85 Years and Over | 0 | 0.0% |
| Total | 1,338 | 100.0% |
Housing Finances in Kimberly
Median Income by Occupancy in Kimberly
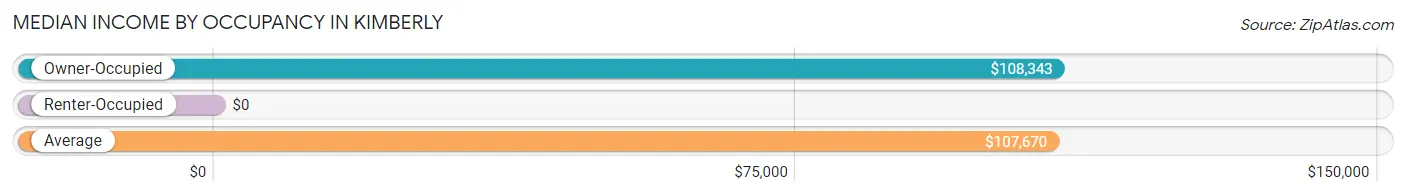
| Occupancy Type | # Households | Median Income |
| Owner-Occupied | 1,267 (94.7%) | $108,343 |
| Renter-Occupied | 71 (5.3%) | $0 |
| Average | 1,338 (100.0%) | $107,670 |
Occupancy by Householder Income Bracket in Kimberly
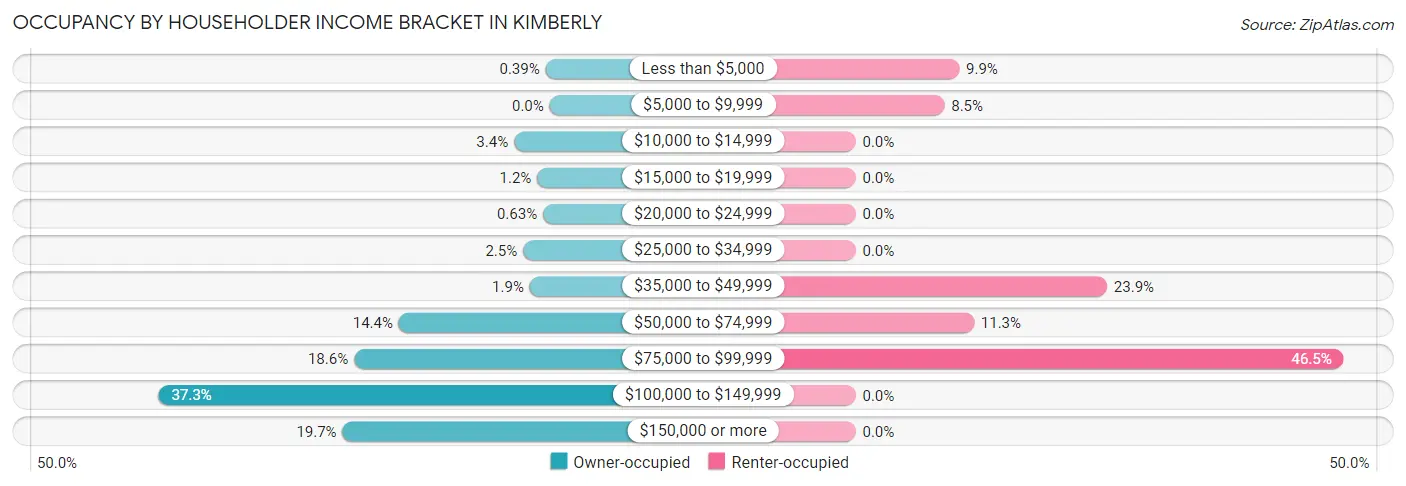
| Income Bracket | Owner-occupied | Renter-occupied |
| Less than $5,000 | 5 (0.4%) | 7 (9.9%) |
| $5,000 to $9,999 | 0 (0.0%) | 6 (8.5%) |
| $10,000 to $14,999 | 43 (3.4%) | 0 (0.0%) |
| $15,000 to $19,999 | 15 (1.2%) | 0 (0.0%) |
| $20,000 to $24,999 | 8 (0.6%) | 0 (0.0%) |
| $25,000 to $34,999 | 32 (2.5%) | 0 (0.0%) |
| $35,000 to $49,999 | 24 (1.9%) | 17 (23.9%) |
| $50,000 to $74,999 | 182 (14.4%) | 8 (11.3%) |
| $75,000 to $99,999 | 236 (18.6%) | 33 (46.5%) |
| $100,000 to $149,999 | 472 (37.2%) | 0 (0.0%) |
| $150,000 or more | 250 (19.7%) | 0 (0.0%) |
| Total | 1,267 (100.0%) | 71 (100.0%) |
Monthly Housing Cost Tiers in Kimberly
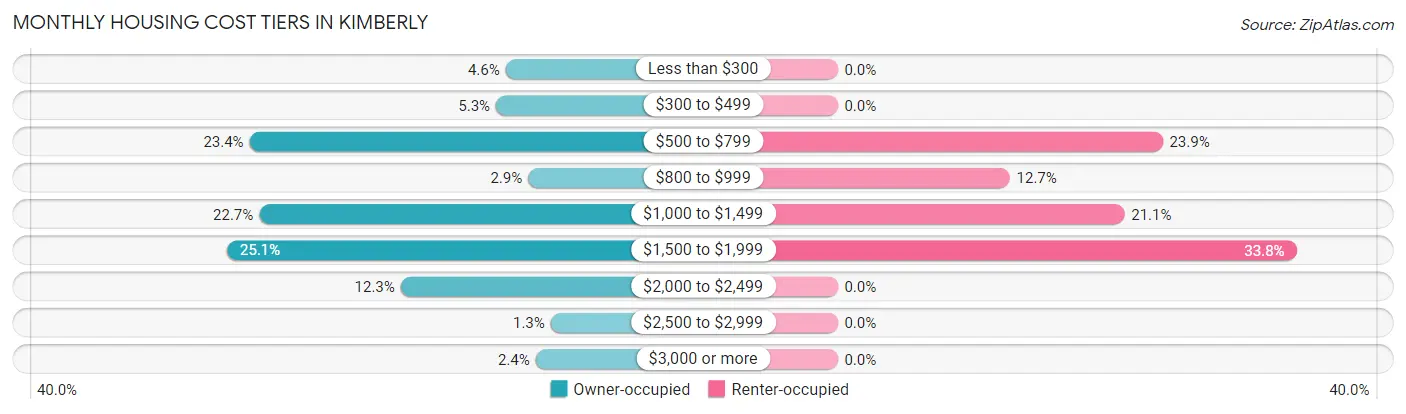
| Monthly Cost | Owner-occupied | Renter-occupied |
| Less than $300 | 58 (4.6%) | 0 (0.0%) |
| $300 to $499 | 67 (5.3%) | 0 (0.0%) |
| $500 to $799 | 297 (23.4%) | 17 (23.9%) |
| $800 to $999 | 37 (2.9%) | 9 (12.7%) |
| $1,000 to $1,499 | 288 (22.7%) | 15 (21.1%) |
| $1,500 to $1,999 | 318 (25.1%) | 24 (33.8%) |
| $2,000 to $2,499 | 156 (12.3%) | 0 (0.0%) |
| $2,500 to $2,999 | 16 (1.3%) | 0 (0.0%) |
| $3,000 or more | 30 (2.4%) | 0 (0.0%) |
| Total | 1,267 (100.0%) | 71 (100.0%) |
Physical Housing Characteristics in Kimberly
Housing Structures in Kimberly
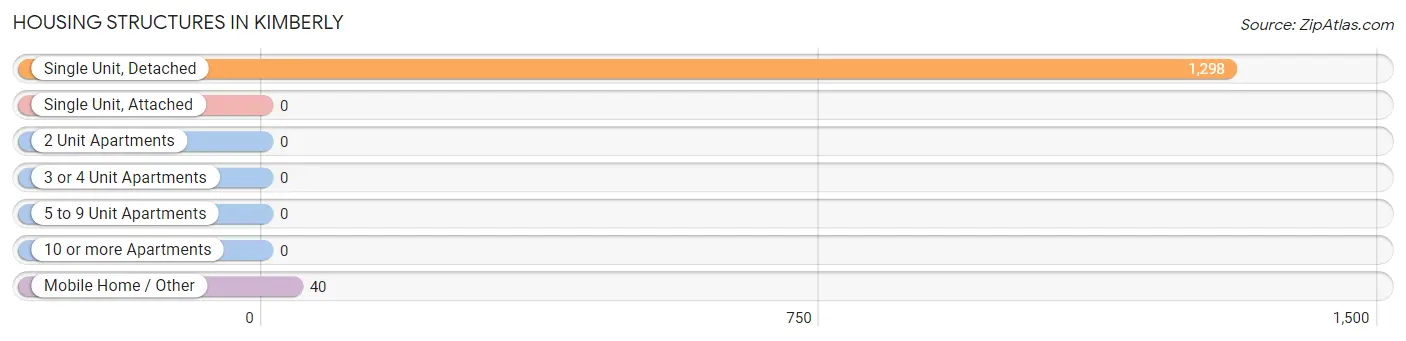
| Structure Type | # Housing Units | % Housing Units |
| Single Unit, Detached | 1,298 | 97.0% |
| Single Unit, Attached | 0 | 0.0% |
| 2 Unit Apartments | 0 | 0.0% |
| 3 or 4 Unit Apartments | 0 | 0.0% |
| 5 to 9 Unit Apartments | 0 | 0.0% |
| 10 or more Apartments | 0 | 0.0% |
| Mobile Home / Other | 40 | 3.0% |
| Total | 1,338 | 100.0% |
Housing Structures by Occupancy in Kimberly
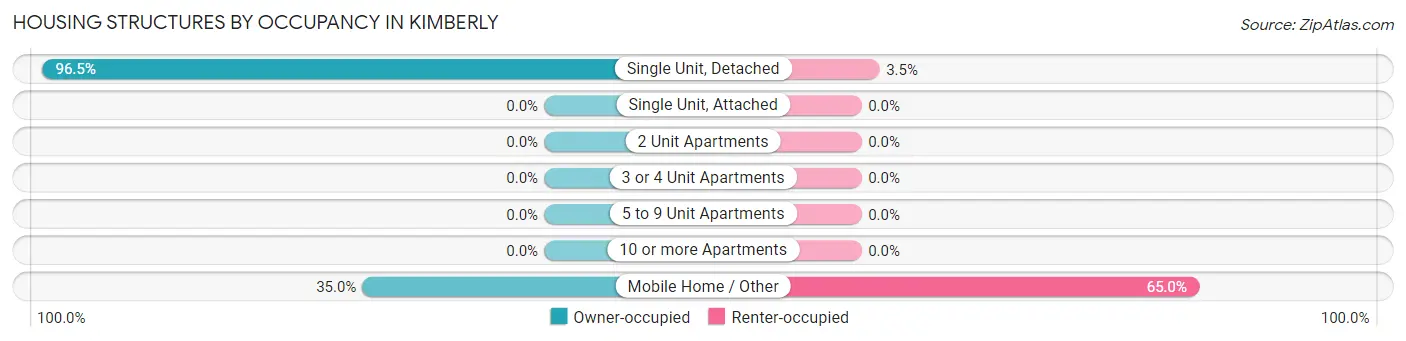
| Structure Type | Owner-occupied | Renter-occupied |
| Single Unit, Detached | 1,253 (96.5%) | 45 (3.5%) |
| Single Unit, Attached | 0 (0.0%) | 0 (0.0%) |
| 2 Unit Apartments | 0 (0.0%) | 0 (0.0%) |
| 3 or 4 Unit Apartments | 0 (0.0%) | 0 (0.0%) |
| 5 to 9 Unit Apartments | 0 (0.0%) | 0 (0.0%) |
| 10 or more Apartments | 0 (0.0%) | 0 (0.0%) |
| Mobile Home / Other | 14 (35.0%) | 26 (65.0%) |
| Total | 1,267 (94.7%) | 71 (5.3%) |
Housing Structures by Number of Rooms in Kimberly
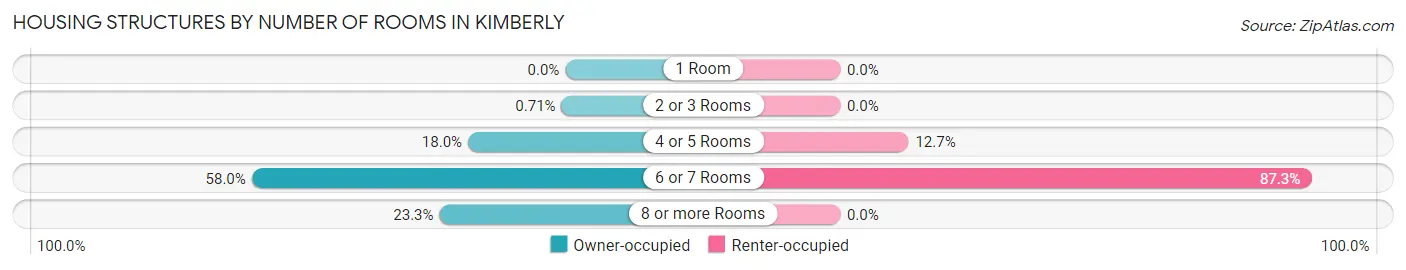
| Number of Rooms | Owner-occupied | Renter-occupied |
| 1 Room | 0 (0.0%) | 0 (0.0%) |
| 2 or 3 Rooms | 9 (0.7%) | 0 (0.0%) |
| 4 or 5 Rooms | 228 (18.0%) | 9 (12.7%) |
| 6 or 7 Rooms | 735 (58.0%) | 62 (87.3%) |
| 8 or more Rooms | 295 (23.3%) | 0 (0.0%) |
| Total | 1,267 (100.0%) | 71 (100.0%) |
Housing Structure by Heating Type in Kimberly
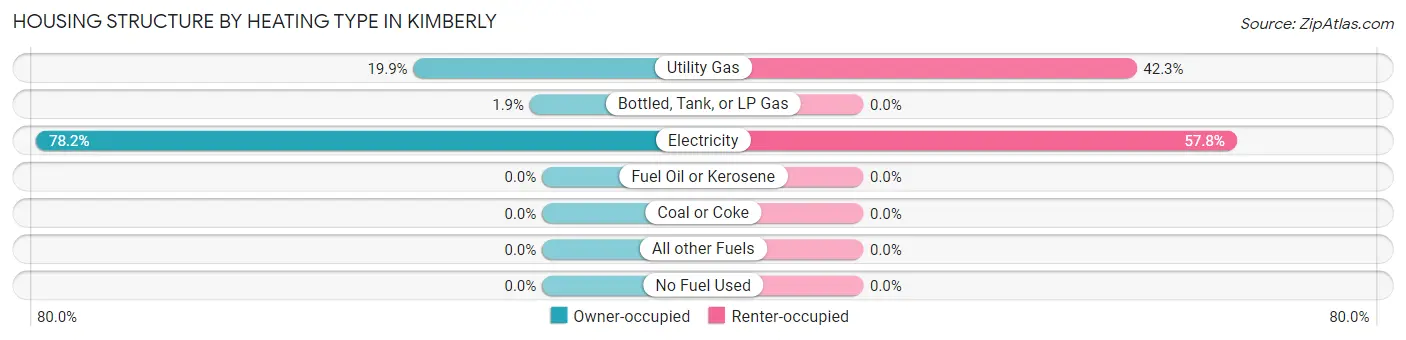
| Heating Type | Owner-occupied | Renter-occupied |
| Utility Gas | 252 (19.9%) | 30 (42.2%) |
| Bottled, Tank, or LP Gas | 24 (1.9%) | 0 (0.0%) |
| Electricity | 991 (78.2%) | 41 (57.8%) |
| Fuel Oil or Kerosene | 0 (0.0%) | 0 (0.0%) |
| Coal or Coke | 0 (0.0%) | 0 (0.0%) |
| All other Fuels | 0 (0.0%) | 0 (0.0%) |
| No Fuel Used | 0 (0.0%) | 0 (0.0%) |
| Total | 1,267 (100.0%) | 71 (100.0%) |
Household Vehicle Usage in Kimberly
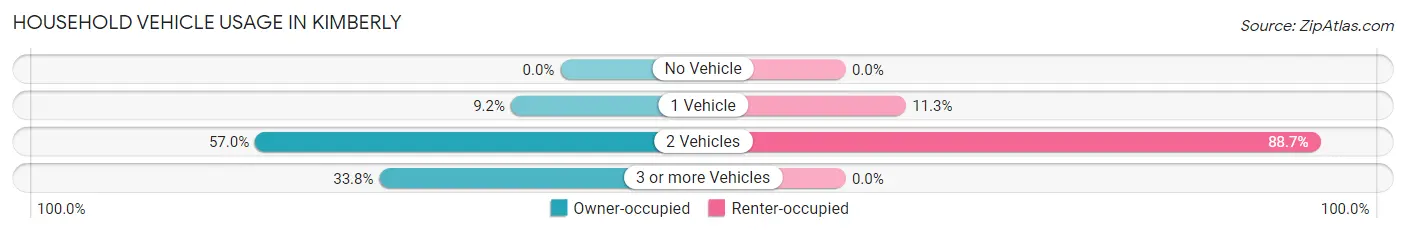
| Vehicles per Household | Owner-occupied | Renter-occupied |
| No Vehicle | 0 (0.0%) | 0 (0.0%) |
| 1 Vehicle | 117 (9.2%) | 8 (11.3%) |
| 2 Vehicles | 722 (57.0%) | 63 (88.7%) |
| 3 or more Vehicles | 428 (33.8%) | 0 (0.0%) |
| Total | 1,267 (100.0%) | 71 (100.0%) |
Real Estate & Mortgages in Kimberly
Real Estate and Mortgage Overview in Kimberly
| Characteristic | Without Mortgage | With Mortgage |
| Housing Units | 364 | 903 |
| Median Property Value | $300,600 | $255,800 |
| Median Household Income | $108,061 | $200 |
| Monthly Housing Costs | $593 | $30 |
| Real Estate Taxes | $1,218 | $53 |
Property Value by Mortgage Status in Kimberly
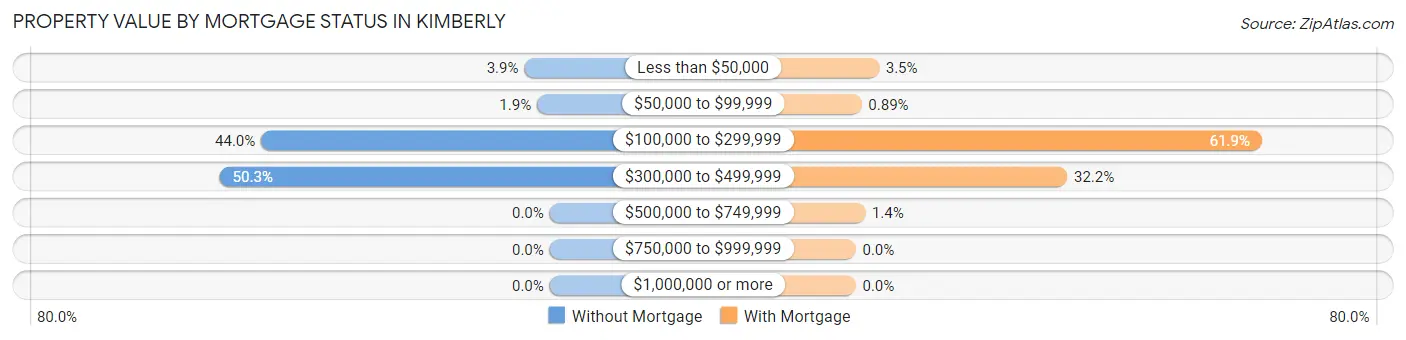
| Property Value | Without Mortgage | With Mortgage |
| Less than $50,000 | 14 (3.8%) | 32 (3.5%) |
| $50,000 to $99,999 | 7 (1.9%) | 8 (0.9%) |
| $100,000 to $299,999 | 160 (44.0%) | 559 (61.9%) |
| $300,000 to $499,999 | 183 (50.3%) | 291 (32.2%) |
| $500,000 to $749,999 | 0 (0.0%) | 13 (1.4%) |
| $750,000 to $999,999 | 0 (0.0%) | 0 (0.0%) |
| $1,000,000 or more | 0 (0.0%) | 0 (0.0%) |
| Total | 364 (100.0%) | 903 (100.0%) |
Household Income by Mortgage Status in Kimberly
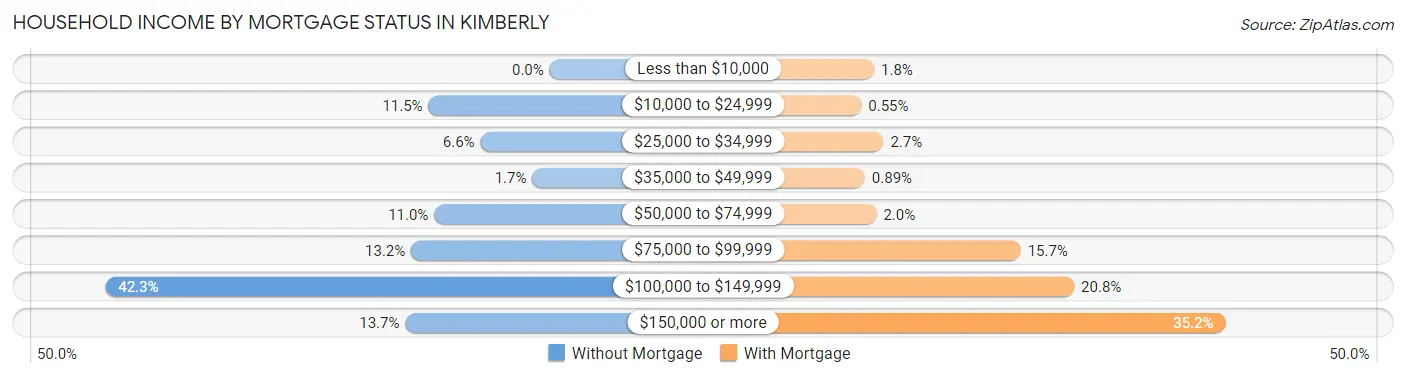
| Household Income | Without Mortgage | With Mortgage |
| Less than $10,000 | 0 (0.0%) | 16 (1.8%) |
| $10,000 to $24,999 | 42 (11.5%) | 5 (0.5%) |
| $25,000 to $34,999 | 24 (6.6%) | 24 (2.7%) |
| $35,000 to $49,999 | 6 (1.7%) | 8 (0.9%) |
| $50,000 to $74,999 | 40 (11.0%) | 18 (2.0%) |
| $75,000 to $99,999 | 48 (13.2%) | 142 (15.7%) |
| $100,000 to $149,999 | 154 (42.3%) | 188 (20.8%) |
| $150,000 or more | 50 (13.7%) | 318 (35.2%) |
| Total | 364 (100.0%) | 903 (100.0%) |
Property Value to Household Income Ratio in Kimberly
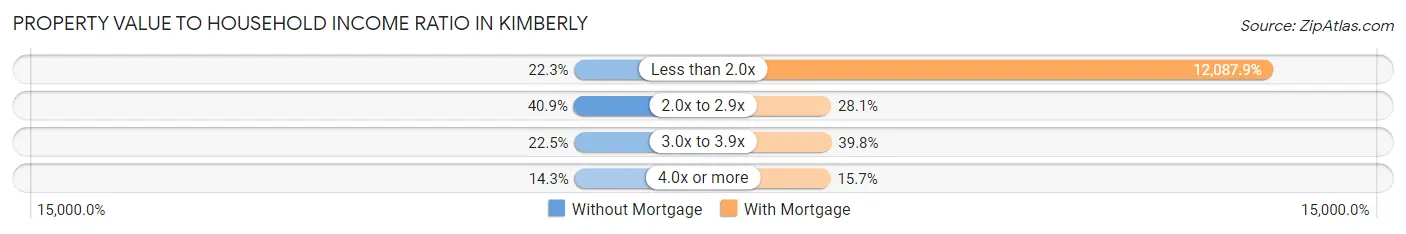
| Value-to-Income Ratio | Without Mortgage | With Mortgage |
| Less than 2.0x | 81 (22.3%) | 109,154 (12,087.9%) |
| 2.0x to 2.9x | 149 (40.9%) | 254 (28.1%) |
| 3.0x to 3.9x | 82 (22.5%) | 359 (39.8%) |
| 4.0x or more | 52 (14.3%) | 142 (15.7%) |
| Total | 364 (100.0%) | 903 (100.0%) |
Real Estate Taxes by Mortgage Status in Kimberly
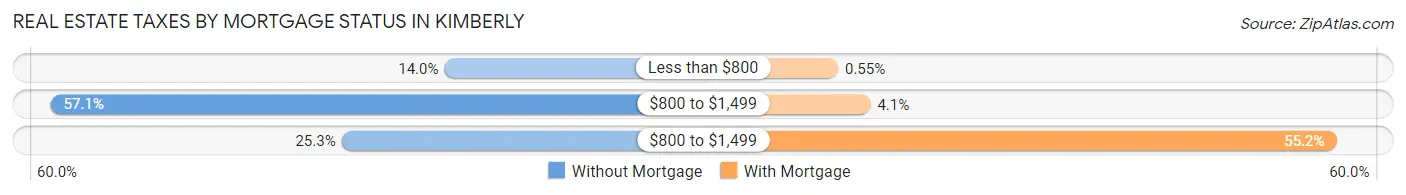
| Property Taxes | Without Mortgage | With Mortgage |
| Less than $800 | 51 (14.0%) | 5 (0.5%) |
| $800 to $1,499 | 208 (57.1%) | 37 (4.1%) |
| $800 to $1,499 | 92 (25.3%) | 498 (55.1%) |
| Total | 364 (100.0%) | 903 (100.0%) |
Health & Disability in Kimberly
Health Insurance Coverage by Age in Kimberly
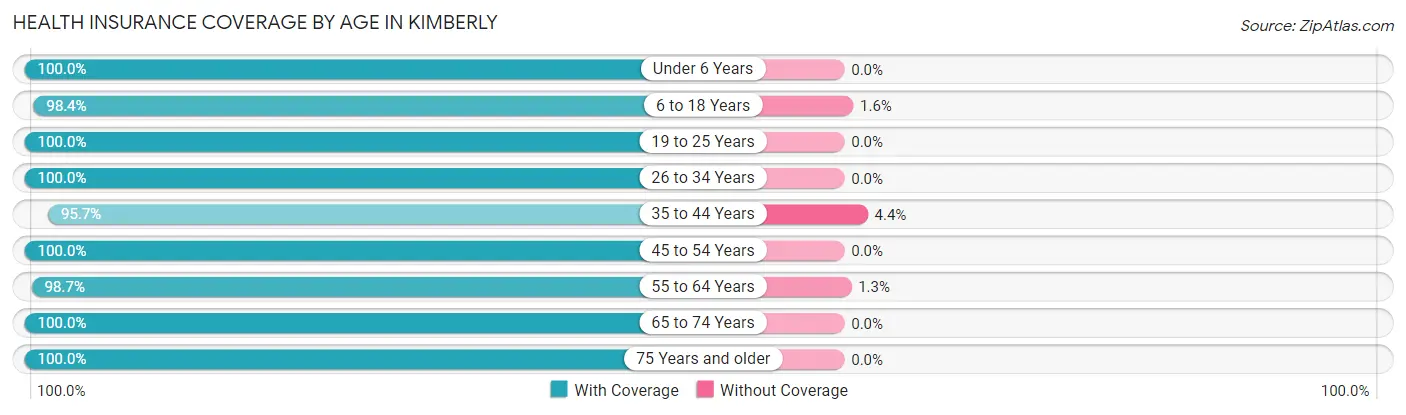
| Age Bracket | With Coverage | Without Coverage |
| Under 6 Years | 229 (100.0%) | 0 (0.0%) |
| 6 to 18 Years | 1,022 (98.4%) | 17 (1.6%) |
| 19 to 25 Years | 234 (100.0%) | 0 (0.0%) |
| 26 to 34 Years | 447 (100.0%) | 0 (0.0%) |
| 35 to 44 Years | 615 (95.7%) | 28 (4.3%) |
| 45 to 54 Years | 646 (100.0%) | 0 (0.0%) |
| 55 to 64 Years | 382 (98.7%) | 5 (1.3%) |
| 65 to 74 Years | 313 (100.0%) | 0 (0.0%) |
| 75 Years and older | 107 (100.0%) | 0 (0.0%) |
| Total | 3,995 (98.8%) | 50 (1.2%) |
Health Insurance Coverage by Citizenship Status in Kimberly
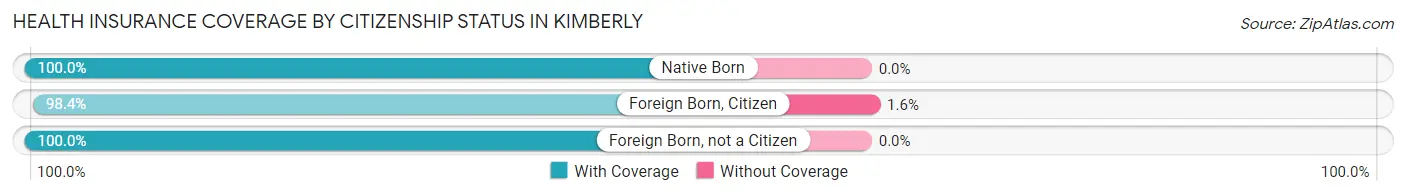
| Citizenship Status | With Coverage | Without Coverage |
| Native Born | 229 (100.0%) | 0 (0.0%) |
| Foreign Born, Citizen | 1,022 (98.4%) | 17 (1.6%) |
| Foreign Born, not a Citizen | 234 (100.0%) | 0 (0.0%) |
Health Insurance Coverage by Household Income in Kimberly
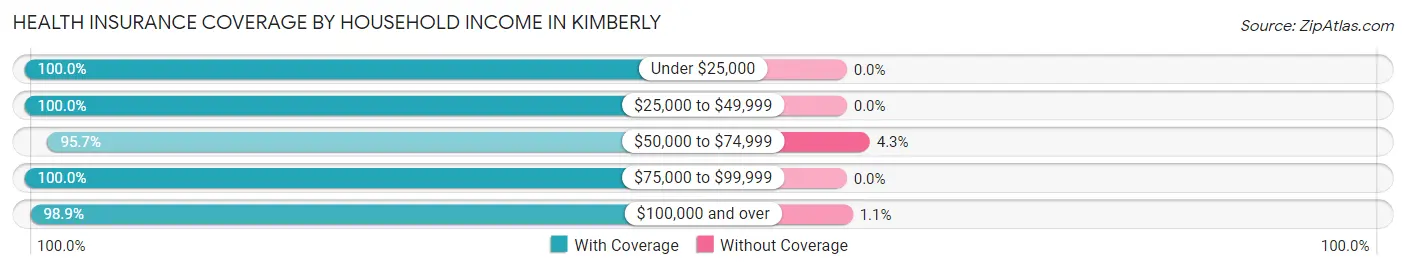
| Household Income | With Coverage | Without Coverage |
| Under $25,000 | 131 (100.0%) | 0 (0.0%) |
| $25,000 to $49,999 | 155 (100.0%) | 0 (0.0%) |
| $50,000 to $74,999 | 488 (95.7%) | 22 (4.3%) |
| $75,000 to $99,999 | 720 (100.0%) | 0 (0.0%) |
| $100,000 and over | 2,501 (98.9%) | 28 (1.1%) |
Public vs Private Health Insurance Coverage by Age in Kimberly
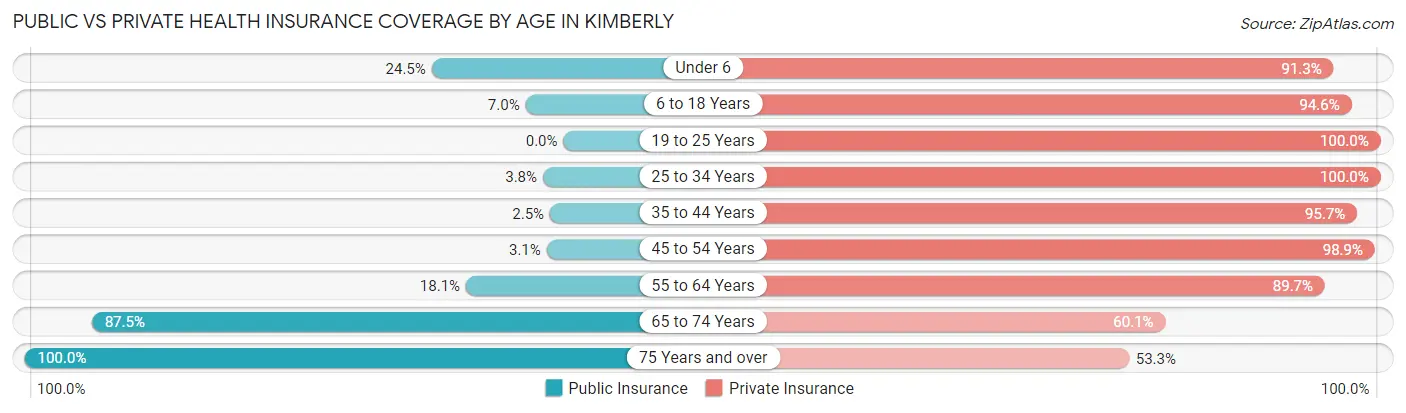
| Age Bracket | Public Insurance | Private Insurance |
| Under 6 | 56 (24.4%) | 209 (91.3%) |
| 6 to 18 Years | 73 (7.0%) | 983 (94.6%) |
| 19 to 25 Years | 0 (0.0%) | 234 (100.0%) |
| 25 to 34 Years | 17 (3.8%) | 447 (100.0%) |
| 35 to 44 Years | 16 (2.5%) | 615 (95.7%) |
| 45 to 54 Years | 20 (3.1%) | 639 (98.9%) |
| 55 to 64 Years | 70 (18.1%) | 347 (89.7%) |
| 65 to 74 Years | 274 (87.5%) | 188 (60.1%) |
| 75 Years and over | 107 (100.0%) | 57 (53.3%) |
| Total | 633 (15.7%) | 3,719 (91.9%) |
Disability Status by Sex by Age in Kimberly
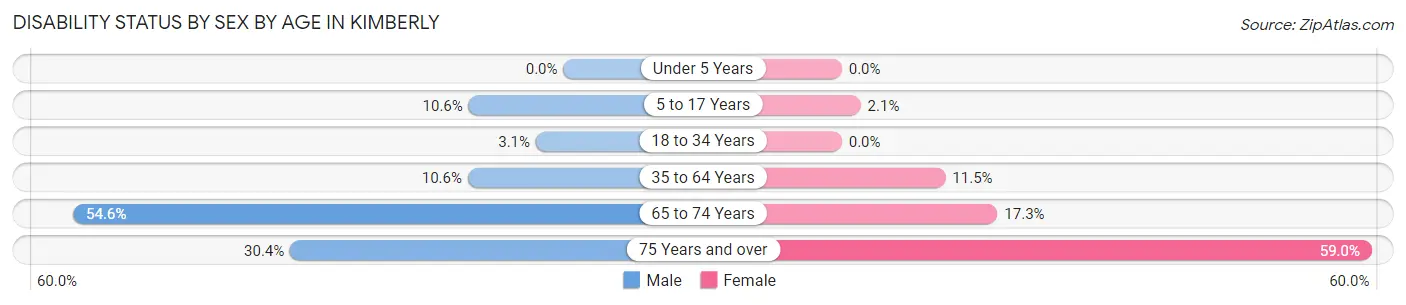
| Age Bracket | Male | Female |
| Under 5 Years | 0 (0.0%) | 0 (0.0%) |
| 5 to 17 Years | 46 (10.5%) | 13 (2.1%) |
| 18 to 34 Years | 11 (3.1%) | 0 (0.0%) |
| 35 to 64 Years | 88 (10.6%) | 98 (11.5%) |
| 65 to 74 Years | 89 (54.6%) | 26 (17.3%) |
| 75 Years and over | 14 (30.4%) | 36 (59.0%) |
Disability Class by Sex by Age in Kimberly
Disability Class: Hearing Difficulty
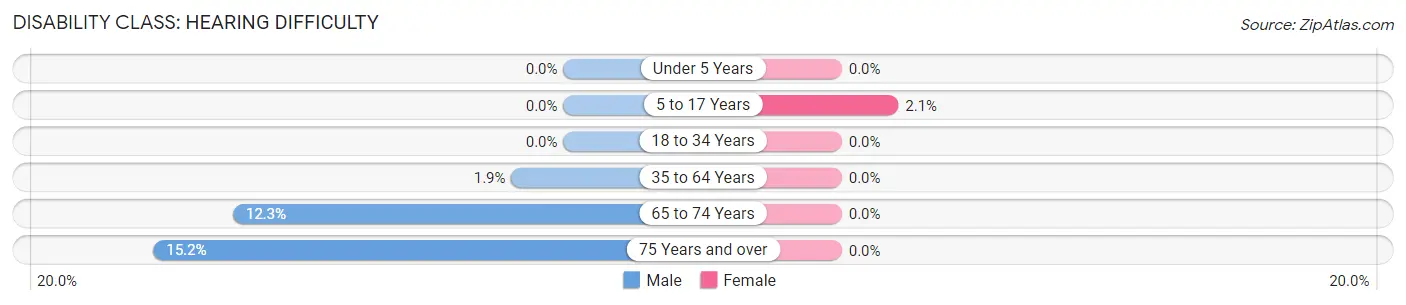
| Age Bracket | Male | Female |
| Under 5 Years | 0 (0.0%) | 0 (0.0%) |
| 5 to 17 Years | 0 (0.0%) | 13 (2.1%) |
| 18 to 34 Years | 0 (0.0%) | 0 (0.0%) |
| 35 to 64 Years | 16 (1.9%) | 0 (0.0%) |
| 65 to 74 Years | 20 (12.3%) | 0 (0.0%) |
| 75 Years and over | 7 (15.2%) | 0 (0.0%) |
Disability Class: Vision Difficulty
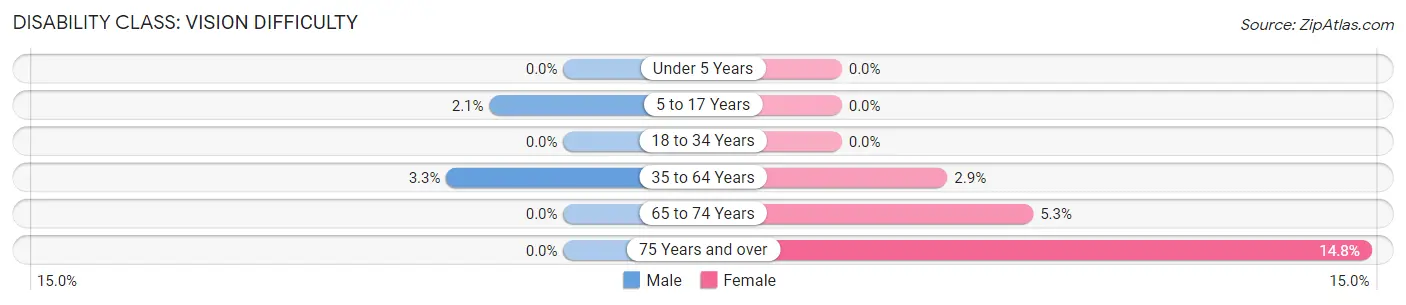
| Age Bracket | Male | Female |
| Under 5 Years | 0 (0.0%) | 0 (0.0%) |
| 5 to 17 Years | 9 (2.1%) | 0 (0.0%) |
| 18 to 34 Years | 0 (0.0%) | 0 (0.0%) |
| 35 to 64 Years | 27 (3.3%) | 25 (2.9%) |
| 65 to 74 Years | 0 (0.0%) | 8 (5.3%) |
| 75 Years and over | 0 (0.0%) | 9 (14.7%) |
Disability Class: Cognitive Difficulty
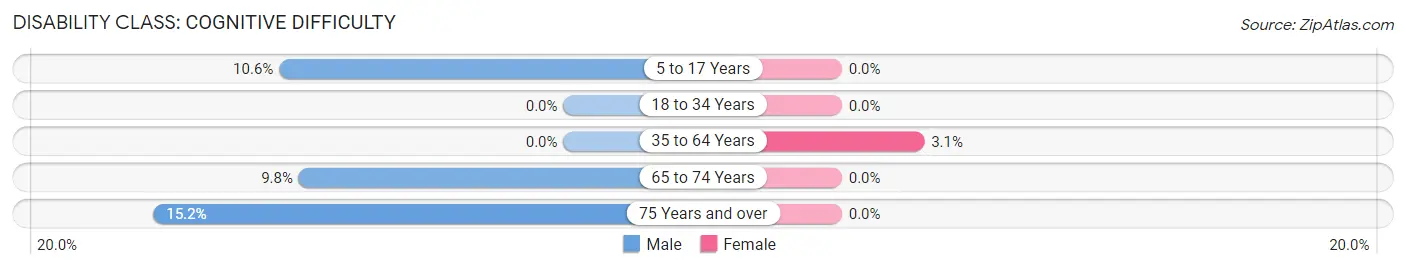
| Age Bracket | Male | Female |
| 5 to 17 Years | 46 (10.5%) | 0 (0.0%) |
| 18 to 34 Years | 0 (0.0%) | 0 (0.0%) |
| 35 to 64 Years | 0 (0.0%) | 26 (3.1%) |
| 65 to 74 Years | 16 (9.8%) | 0 (0.0%) |
| 75 Years and over | 7 (15.2%) | 0 (0.0%) |
Disability Class: Ambulatory Difficulty
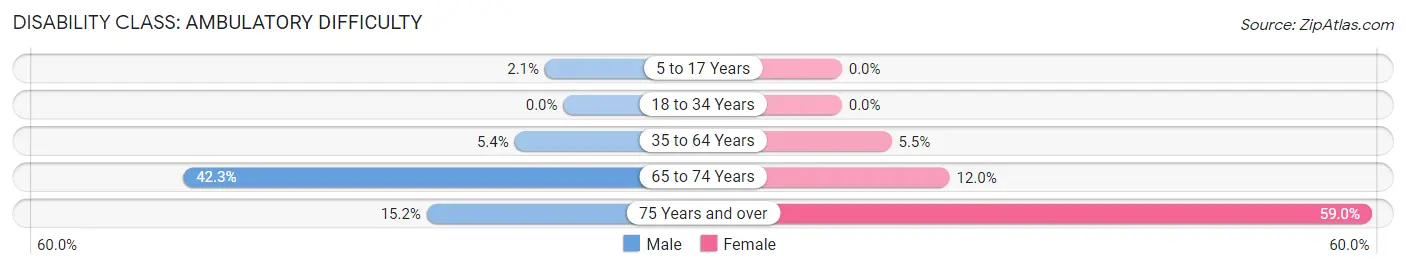
| Age Bracket | Male | Female |
| 5 to 17 Years | 9 (2.1%) | 0 (0.0%) |
| 18 to 34 Years | 0 (0.0%) | 0 (0.0%) |
| 35 to 64 Years | 45 (5.4%) | 47 (5.5%) |
| 65 to 74 Years | 69 (42.3%) | 18 (12.0%) |
| 75 Years and over | 7 (15.2%) | 36 (59.0%) |
Disability Class: Self-Care Difficulty
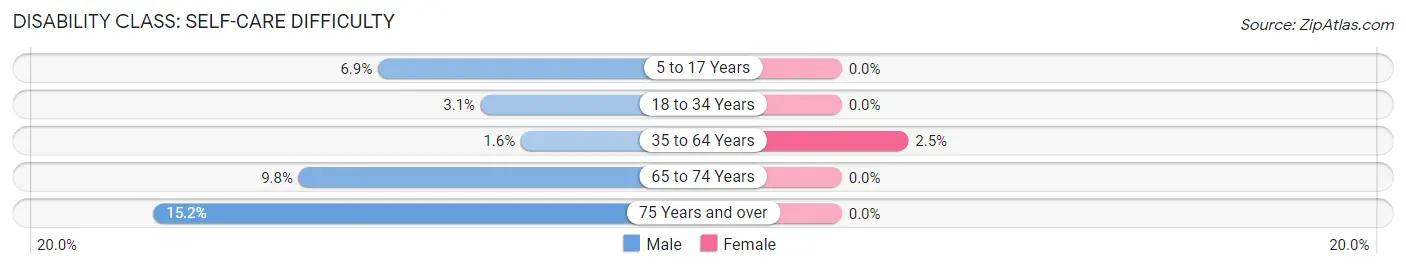
| Age Bracket | Male | Female |
| 5 to 17 Years | 30 (6.9%) | 0 (0.0%) |
| 18 to 34 Years | 11 (3.1%) | 0 (0.0%) |
| 35 to 64 Years | 13 (1.6%) | 21 (2.5%) |
| 65 to 74 Years | 16 (9.8%) | 0 (0.0%) |
| 75 Years and over | 7 (15.2%) | 0 (0.0%) |
Technology Access in Kimberly
Computing Device Access in Kimberly
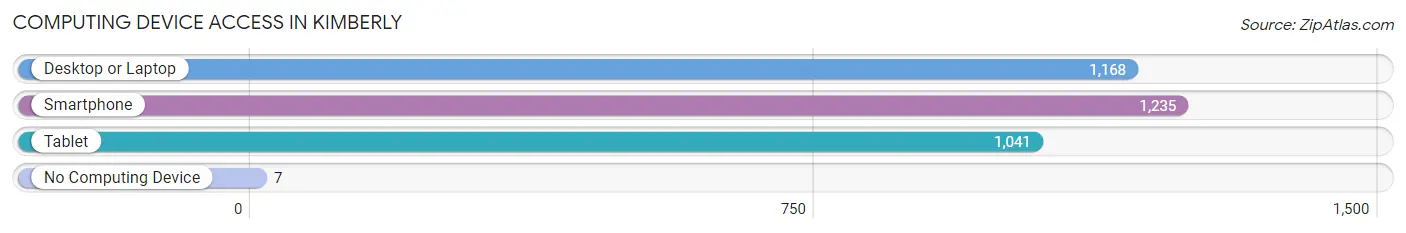
| Device Type | # Households | % Households |
| Desktop or Laptop | 1,168 | 87.3% |
| Smartphone | 1,235 | 92.3% |
| Tablet | 1,041 | 77.8% |
| No Computing Device | 7 | 0.5% |
| Total | 1,338 | 100.0% |
Internet Access in Kimberly
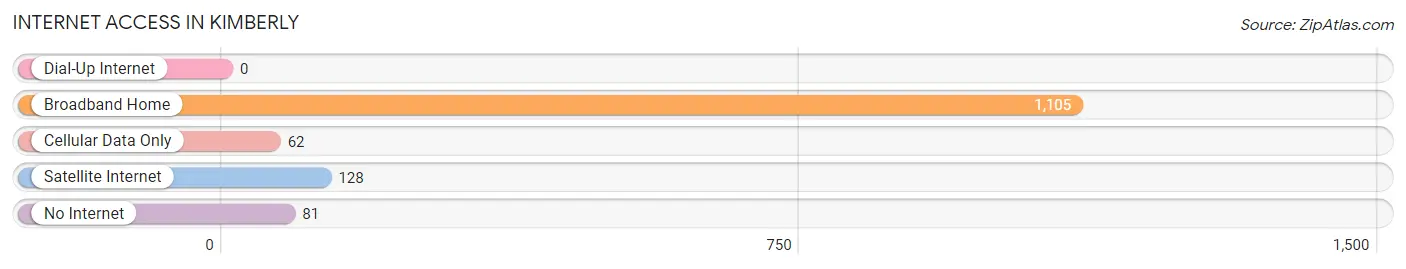
| Internet Type | # Households | % Households |
| Dial-Up Internet | 0 | 0.0% |
| Broadband Home | 1,105 | 82.6% |
| Cellular Data Only | 62 | 4.6% |
| Satellite Internet | 128 | 9.6% |
| No Internet | 81 | 6.0% |
| Total | 1,338 | 100.0% |
Kimberly Summary
Kimberly, Alabama is a small town located in Jefferson County, Alabama. It is situated in the foothills of the Appalachian Mountains and is part of the Birmingham-Hoover Metropolitan Statistical Area. The town was founded in 1887 and has a population of approximately 2,000 people.
Geography
Kimberly is located in the foothills of the Appalachian Mountains in Jefferson County, Alabama. The town is situated at an elevation of 830 feet above sea level and is located approximately 20 miles north of Birmingham. The town is surrounded by the cities of Gardendale, Fultondale, and Morris. The town is located in the Central Time Zone and has a humid subtropical climate.
History
Kimberly was founded in 1887 by a group of settlers from the nearby town of Morris. The town was named after the Kimberly family, who were among the first settlers. The town was incorporated in 1901 and has remained a small, rural community ever since.
Economy
Kimberly’s economy is largely based on agriculture and manufacturing. The town is home to several small businesses, including a feed store, a hardware store, and a grocery store. The town also has a few restaurants and a few small retail stores. The town is also home to a few small manufacturing companies, including a furniture manufacturer and a metal fabrication company.
Demographics
As of the 2010 census, Kimberly had a population of 2,000 people. The racial makeup of the town was 95.2% White, 1.7% African American, 0.3% Native American, 0.3% Asian, 0.1% Pacific Islander, and 2.5% from other races. The median household income was $37,500 and the median family income was $45,000.
Conclusion
Kimberly, Alabama is a small town located in Jefferson County, Alabama. It is situated in the foothills of the Appalachian Mountains and is part of the Birmingham-Hoover Metropolitan Statistical Area. The town was founded in 1887 and has a population of approximately 2,000 people. The town’s economy is largely based on agriculture and manufacturing, and the town is home to several small businesses. The racial makeup of the town is 95.2% White, 1.7% African American, 0.3% Native American, 0.3% Asian, 0.1% Pacific Islander, and 2.5% from other races. The median household income was $37,500 and the median family income was $45,000.
Common Questions
What is the Total Population of Kimberly?
Total Population of Kimberly is 4,045.
What is the Total Male Population of Kimberly?
Total Male Population of Kimberly is 1,932.
What is the Total Female Population of Kimberly?
Total Female Population of Kimberly is 2,113.
What is the Ratio of Males per 100 Females in Kimberly?
There are 91.43 Males per 100 Females in Kimberly.
What is the Ratio of Females per 100 Males in Kimberly?
There are 109.37 Females per 100 Males in Kimberly.
What is the Median Population Age in Kimberly?
Median Population Age in Kimberly is 36.8 Years.
What is the Average Family Size in Kimberly
Average Family Size in Kimberly is 3.3 People.
What is the Average Household Size in Kimberly
Average Household Size in Kimberly is 3.0 People.
What is Per Capita Income in Kimberly?
Per Capita income in Kimberly is $36,757.
What is the Median Family Income in Kimberly?
Median Family Income in Kimberly is $109,441.
What is the Median Household income in Kimberly?
Median Household Income in Kimberly is $107,670.
What is Income or Wage Gap in Kimberly?
Income or Wage Gap in Kimberly is 41.7%.
Women in Kimberly earn 58.3 cents for every dollar earned by a man.
What is Inequality or Gini Index in Kimberly?
Inequality or Gini Index in Kimberly is 0.28.
How Large is the Labor Force in Kimberly?
There are 2,193 People in the Labor Forcein in Kimberly.
What is the Percentage of People in the Labor Force in Kimberly?
75.9% of People are in the Labor Force in Kimberly.
What is the Unemployment Rate in Kimberly?
Unemployment Rate in Kimberly is 0.7%.