Woodstock, AL
Woodstock Map
Woodstock Overview
1,391
TOTAL POPULATION
655
MALE POPULATION
736
FEMALE POPULATION
88.99
MALES / 100 FEMALES
112.37
FEMALES / 100 MALES
34.9
MEDIAN AGE
4.7
AVG FAMILY SIZE
3.6
AVG HOUSEHOLD SIZE
$22,539
PER CAPITA INCOME
$70,769
AVG FAMILY INCOME
$65,469
AVG HOUSEHOLD INCOME
49.3%
WAGE / INCOME GAP [ % ]
50.7¢/ $1
WAGE / INCOME GAP [ $ ]
0.37
INEQUALITY / GINI INDEX
617
LABOR FORCE [ PEOPLE ]
59.7%
PERCENT IN LABOR FORCE
13.3%
UNEMPLOYMENT RATE
Woodstock Zip Codes
Woodstock Area Codes
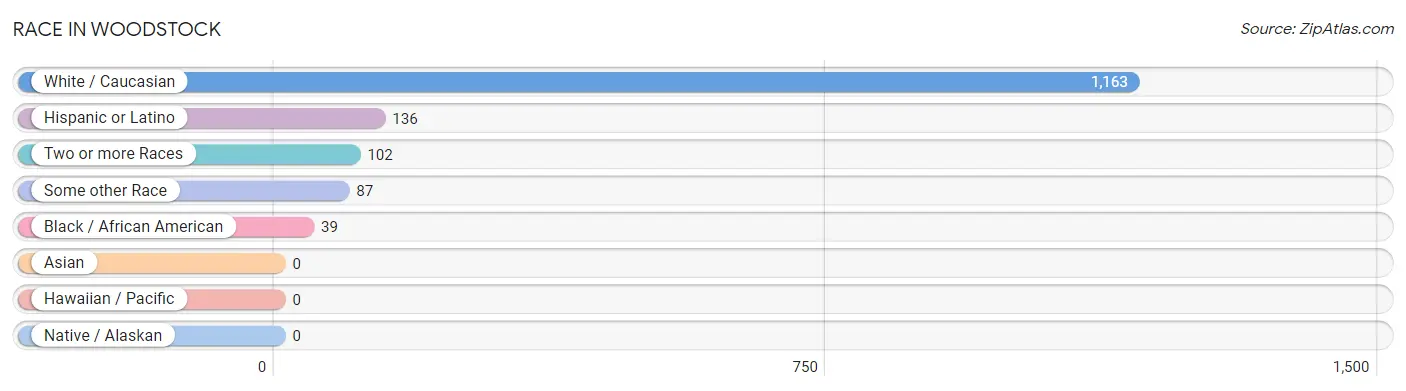
Race in Woodstock
The most populous races in Woodstock are White / Caucasian (1,163 | 83.6%), Hispanic or Latino (136 | 9.8%), and Two or more Races (102 | 7.3%).
| Race | # Population | % Population |
| Asian | 0 | 0.0% |
| Black / African American | 39 | 2.8% |
| Hawaiian / Pacific | 0 | 0.0% |
| Hispanic or Latino | 136 | 9.8% |
| Native / Alaskan | 0 | 0.0% |
| White / Caucasian | 1,163 | 83.6% |
| Two or more Races | 102 | 7.3% |
| Some other Race | 87 | 6.2% |
| Total | 1,391 | 100.0% |
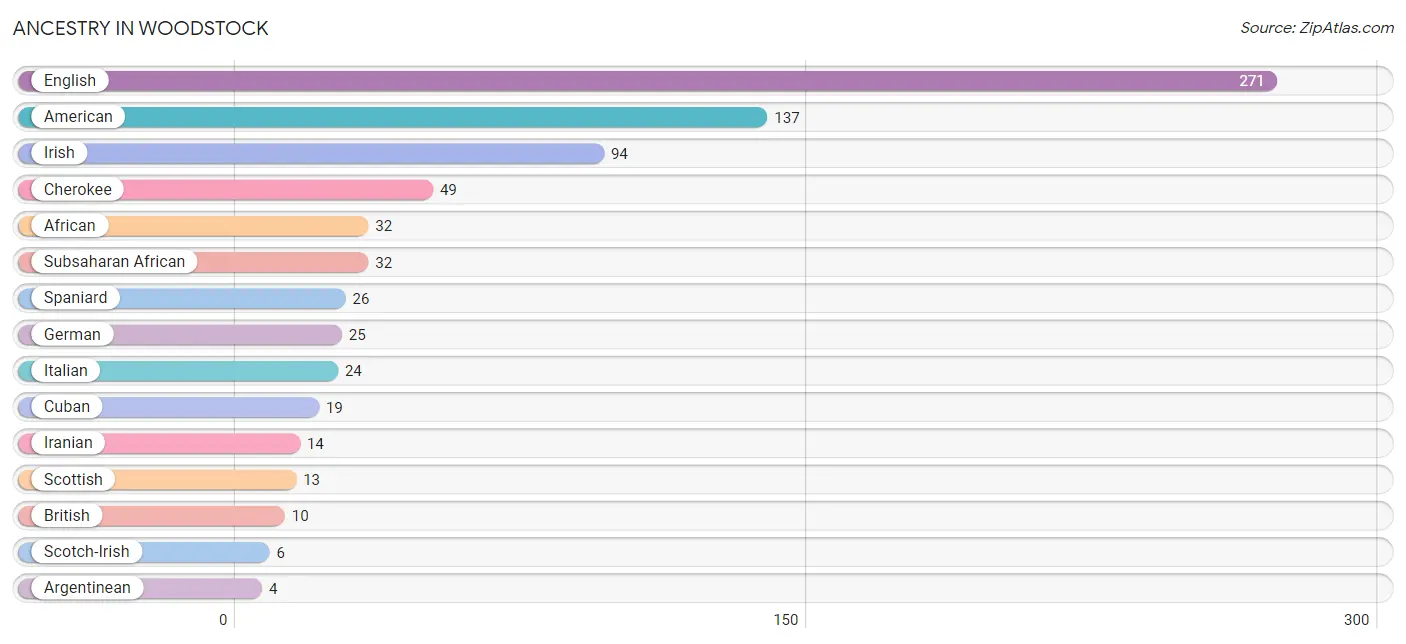
Ancestry in Woodstock
The most populous ancestries reported in Woodstock are English (271 | 19.5%), American (137 | 9.9%), Irish (94 | 6.8%), Cherokee (49 | 3.5%), and African (32 | 2.3%), together accounting for 41.9% of all Woodstock residents.
| Ancestry | # Population | % Population |
| African | 32 | 2.3% |
| American | 137 | 9.9% |
| Argentinean | 4 | 0.3% |
| Bhutanese | 4 | 0.3% |
| British | 10 | 0.7% |
| Cherokee | 49 | 3.5% |
| Cuban | 19 | 1.4% |
| Czech | 3 | 0.2% |
| Dutch | 1 | 0.1% |
| English | 271 | 19.5% |
| European | 3 | 0.2% |
| French | 4 | 0.3% |
| German | 25 | 1.8% |
| Iranian | 14 | 1.0% |
| Irish | 94 | 6.8% |
| Italian | 24 | 1.7% |
| Northern European | 3 | 0.2% |
| Polish | 3 | 0.2% |
| Scotch-Irish | 6 | 0.4% |
| Scottish | 13 | 0.9% |
| South American | 4 | 0.3% |
| Spaniard | 26 | 1.9% |
| Subsaharan African | 32 | 2.3% | View All 23 Rows |
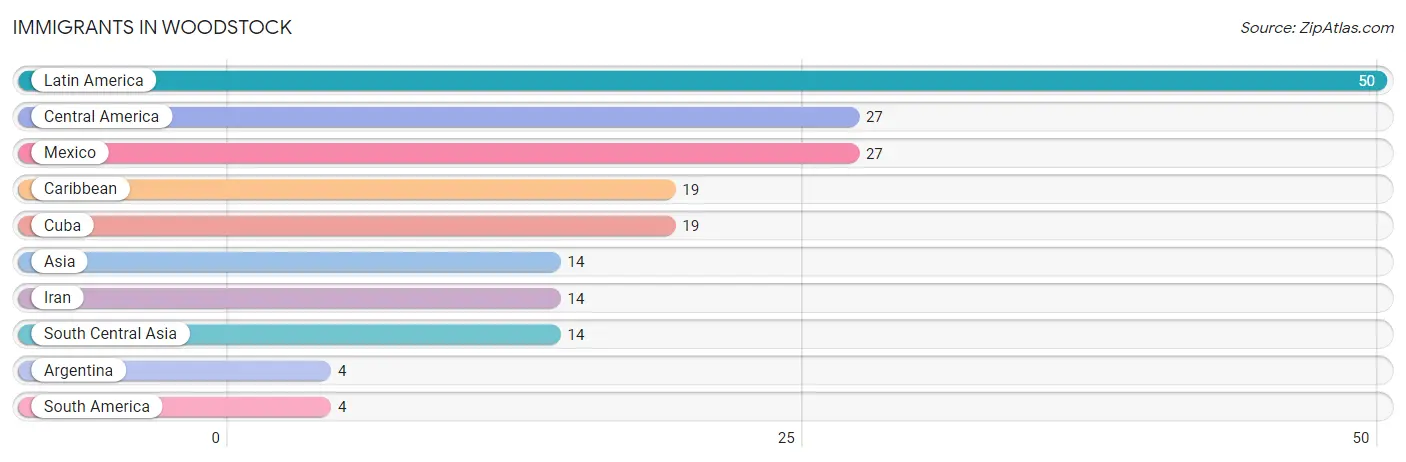
Immigrants in Woodstock
The most numerous immigrant groups reported in Woodstock came from Latin America (50 | 3.6%), Central America (27 | 1.9%), Mexico (27 | 1.9%), Caribbean (19 | 1.4%), and Cuba (19 | 1.4%), together accounting for 10.2% of all Woodstock residents.
| Immigration Origin | # Population | % Population |
| Argentina | 4 | 0.3% |
| Asia | 14 | 1.0% |
| Caribbean | 19 | 1.4% |
| Central America | 27 | 1.9% |
| Cuba | 19 | 1.4% |
| Iran | 14 | 1.0% |
| Latin America | 50 | 3.6% |
| Mexico | 27 | 1.9% |
| South America | 4 | 0.3% |
| South Central Asia | 14 | 1.0% | View All 10 Rows |
Sex and Age in Woodstock
Sex and Age in Woodstock
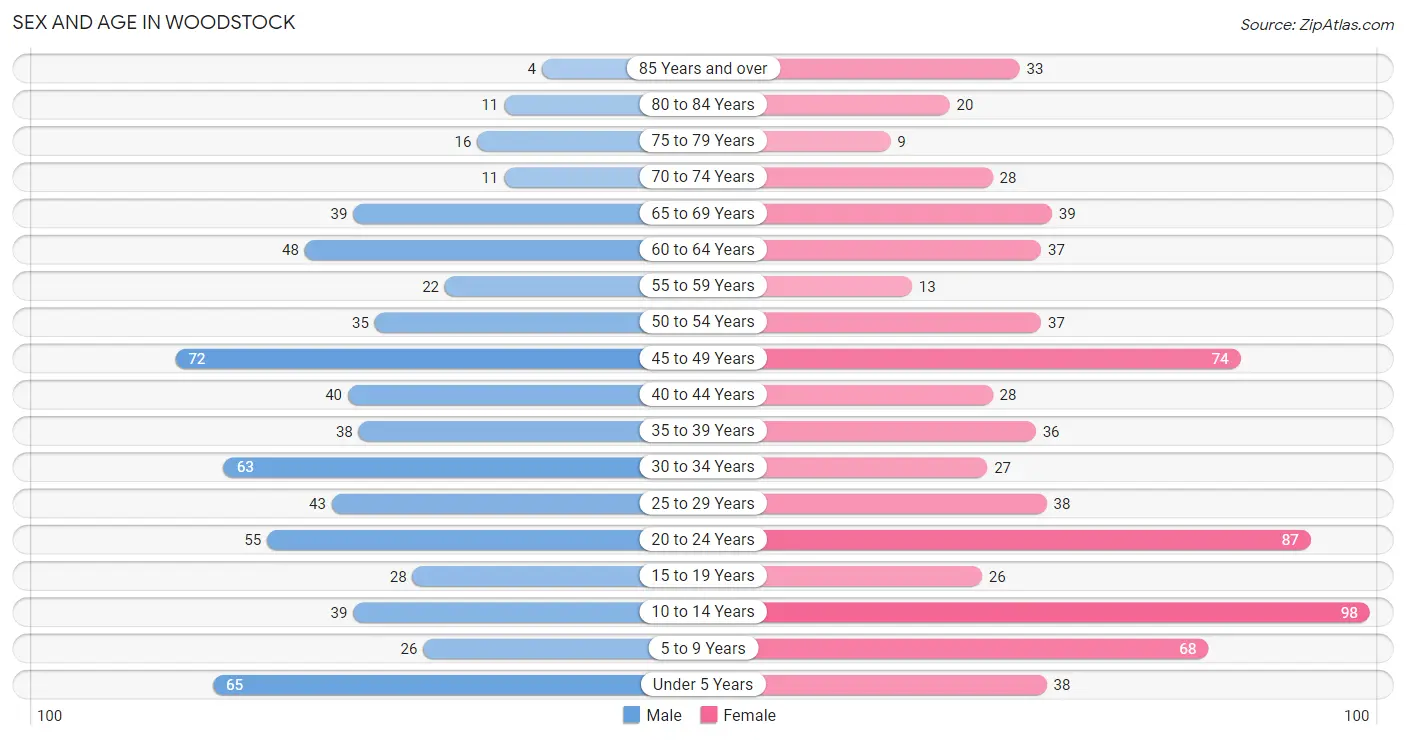
The most populous age groups in Woodstock are 45 to 49 Years (72 | 11.0%) for men and 10 to 14 Years (98 | 13.3%) for women.
| Age Bracket | Male | Female |
| Under 5 Years | 65 (9.9%) | 38 (5.2%) |
| 5 to 9 Years | 26 (4.0%) | 68 (9.2%) |
| 10 to 14 Years | 39 (5.9%) | 98 (13.3%) |
| 15 to 19 Years | 28 (4.3%) | 26 (3.5%) |
| 20 to 24 Years | 55 (8.4%) | 87 (11.8%) |
| 25 to 29 Years | 43 (6.6%) | 38 (5.2%) |
| 30 to 34 Years | 63 (9.6%) | 27 (3.7%) |
| 35 to 39 Years | 38 (5.8%) | 36 (4.9%) |
| 40 to 44 Years | 40 (6.1%) | 28 (3.8%) |
| 45 to 49 Years | 72 (11.0%) | 74 (10.1%) |
| 50 to 54 Years | 35 (5.3%) | 37 (5.0%) |
| 55 to 59 Years | 22 (3.4%) | 13 (1.8%) |
| 60 to 64 Years | 48 (7.3%) | 37 (5.0%) |
| 65 to 69 Years | 39 (5.9%) | 39 (5.3%) |
| 70 to 74 Years | 11 (1.7%) | 28 (3.8%) |
| 75 to 79 Years | 16 (2.4%) | 9 (1.2%) |
| 80 to 84 Years | 11 (1.7%) | 20 (2.7%) |
| 85 Years and over | 4 (0.6%) | 33 (4.5%) |
| Total | 655 (100.0%) | 736 (100.0%) |
Families and Households in Woodstock
Median Family Size in Woodstock
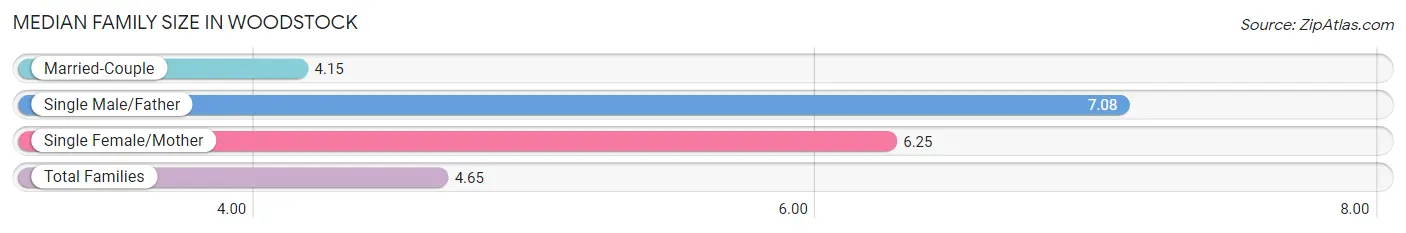
The median family size in Woodstock is 4.65 persons per family, with single male/father families (12 | 4.8%) accounting for the largest median family size of 7.08 persons per family. On the other hand, married-couple families (196 | 77.8%) represent the smallest median family size with 4.15 persons per family.
| Family Type | # Families | Family Size |
| Married-Couple | 196 (77.8%) | 4.15 |
| Single Male/Father | 12 (4.8%) | 7.08 |
| Single Female/Mother | 44 (17.5%) | 6.25 |
| Total Families | 252 (100.0%) | 4.65 |
Median Household Size in Woodstock
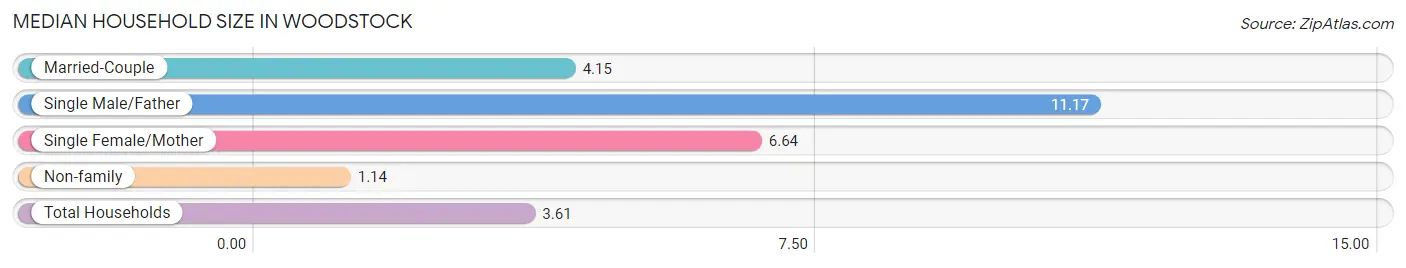
The median household size in Woodstock is 3.61 persons per household, with single male/father households (12 | 3.1%) accounting for the largest median household size of 11.17 persons per household. non-family households (133 | 34.5%) represent the smallest median household size with 1.14 persons per household.
| Household Type | # Households | Household Size |
| Married-Couple | 196 (50.9%) | 4.15 |
| Single Male/Father | 12 (3.1%) | 11.17 |
| Single Female/Mother | 44 (11.4%) | 6.64 |
| Non-family | 133 (34.5%) | 1.14 |
| Total Households | 385 (100.0%) | 3.61 |
Household Size by Marriage Status in Woodstock
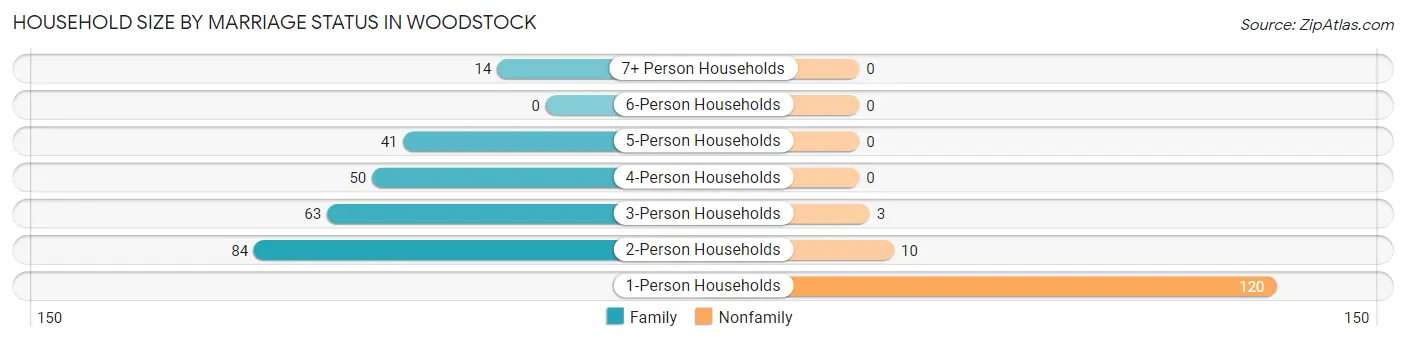
Out of a total of 385 households in Woodstock, 252 (65.4%) are family households, while 133 (34.5%) are nonfamily households. The most numerous type of family households are 2-person households, comprising 84, and the most common type of nonfamily households are 1-person households, comprising 120.
| Household Size | Family Households | Nonfamily Households |
| 1-Person Households | - | 120 (31.2%) |
| 2-Person Households | 84 (21.8%) | 10 (2.6%) |
| 3-Person Households | 63 (16.4%) | 3 (0.8%) |
| 4-Person Households | 50 (13.0%) | 0 (0.0%) |
| 5-Person Households | 41 (10.6%) | 0 (0.0%) |
| 6-Person Households | 0 (0.0%) | 0 (0.0%) |
| 7+ Person Households | 14 (3.6%) | 0 (0.0%) |
| Total | 252 (65.4%) | 133 (34.5%) |
Female Fertility in Woodstock
Fertility by Age in Woodstock
Average fertility rate in Woodstock is 30.0 births per 1,000 women. Women in the age bracket of 20 to 34 years have the highest fertility rate with 66.0 births per 1,000 women. Women in the age bracket of 20 to 34 years acount for 100.0% of all women with births.
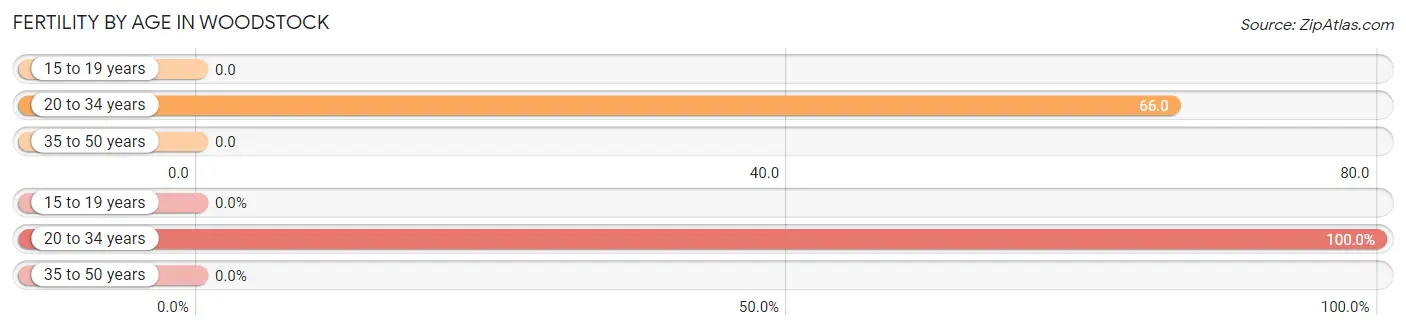
| Age Bracket | Women with Births | Births / 1,000 Women |
| 15 to 19 years | 0 (0.0%) | 0.0 |
| 20 to 34 years | 10 (100.0%) | 66.0 |
| 35 to 50 years | 0 (0.0%) | 0.0 |
| Total | 10 (100.0%) | 30.0 |
Fertility by Age by Marriage Status in Woodstock
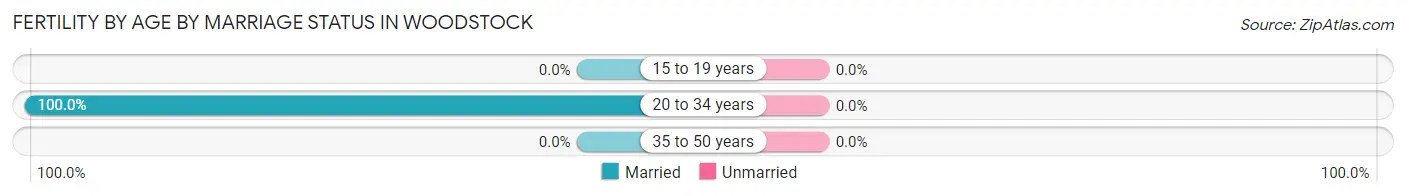
| Age Bracket | Married | Unmarried |
| 15 to 19 years | 0 (0.0%) | 0 (0.0%) |
| 20 to 34 years | 10 (100.0%) | 0 (0.0%) |
| 35 to 50 years | 0 (0.0%) | 0 (0.0%) |
| Total | 10 (100.0%) | 0 (0.0%) |
Fertility by Education in Woodstock
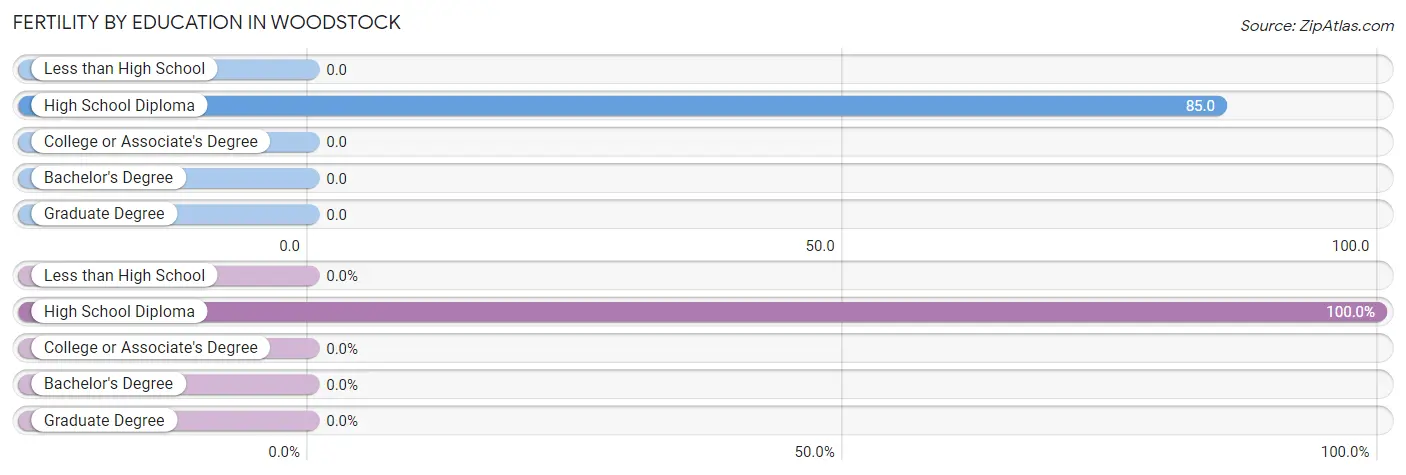
| Educational Attainment | Women with Births | Births / 1,000 Women |
| Less than High School | 0 (0.0%) | 0.0 |
| High School Diploma | 10 (100.0%) | 85.0 |
| College or Associate's Degree | 0 (0.0%) | 0.0 |
| Bachelor's Degree | 0 (0.0%) | 0.0 |
| Graduate Degree | 0 (0.0%) | 0.0 |
| Total | 10 (100.0%) | 30.0 |
Fertility by Education by Marriage Status in Woodstock
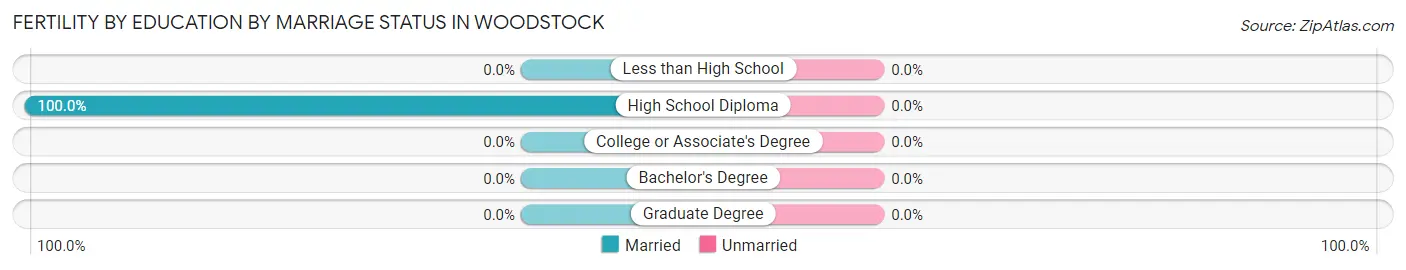
| Educational Attainment | Married | Unmarried |
| Less than High School | 0 (0.0%) | 0 (0.0%) |
| High School Diploma | 10 (100.0%) | 0 (0.0%) |
| College or Associate's Degree | 0 (0.0%) | 0 (0.0%) |
| Bachelor's Degree | 0 (0.0%) | 0 (0.0%) |
| Graduate Degree | 0 (0.0%) | 0 (0.0%) |
| Total | 10 (100.0%) | 0 (0.0%) |
Income in Woodstock
Income Overview in Woodstock
Per Capita Income in Woodstock is $22,539, while median incomes of families and households are $70,769 and $65,469 respectively.
| Characteristic | Number | Measure |
| Per Capita Income | 1,391 | $22,539 |
| Median Family Income | 252 | $70,769 |
| Mean Family Income | 252 | $84,203 |
| Median Household Income | 385 | $65,469 |
| Mean Household Income | 385 | $69,910 |
| Income Deficit | 252 | $0 |
| Wage / Income Gap (%) | 1,391 | 49.29% |
| Wage / Income Gap ($) | 1,391 | 50.71¢ per $1 |
| Gini / Inequality Index | 1,391 | 0.37 |
Earnings by Sex in Woodstock
Average Earnings in Woodstock are $30,325, $34,219 for men and $17,353 for women, a difference of 49.3%.
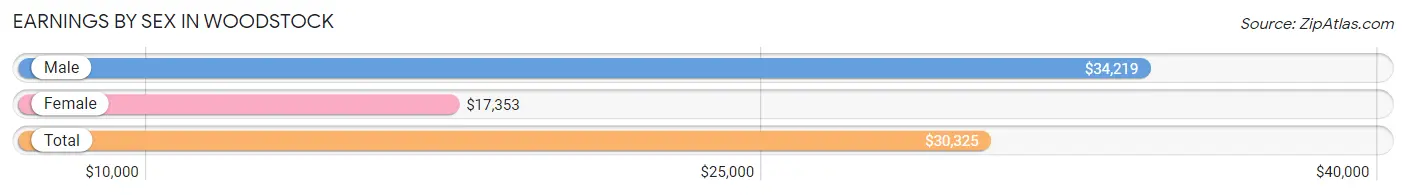
| Sex | Number | Average Earnings |
| Male | 349 (54.4%) | $34,219 |
| Female | 292 (45.6%) | $17,353 |
| Total | 641 (100.0%) | $30,325 |
Earnings by Sex by Income Bracket in Woodstock
The most common earnings brackets in Woodstock are $30,000 to $34,999 for men (68 | 19.5%) and $2,499 or less for women (58 | 19.9%).
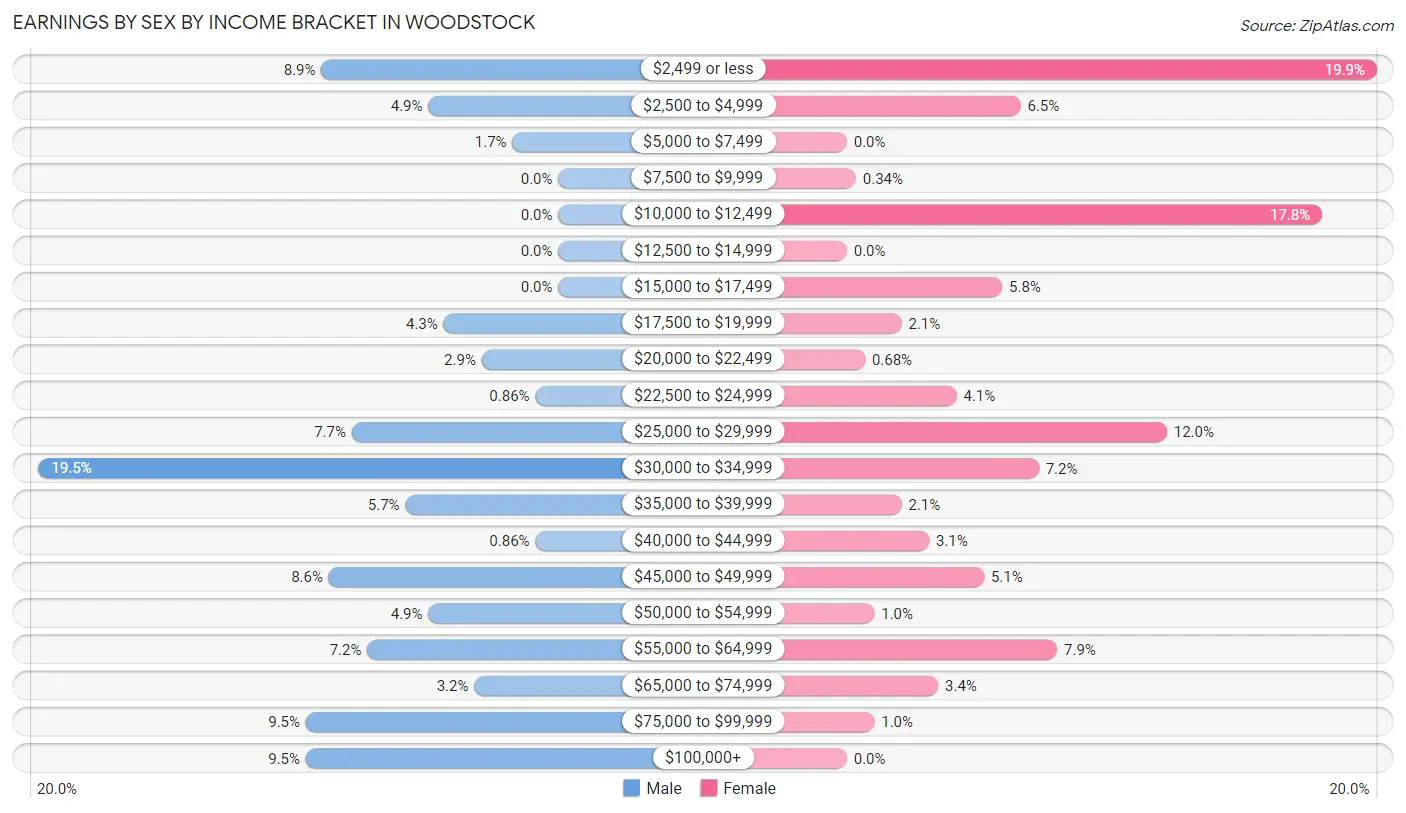
| Income | Male | Female |
| $2,499 or less | 31 (8.9%) | 58 (19.9%) |
| $2,500 to $4,999 | 17 (4.9%) | 19 (6.5%) |
| $5,000 to $7,499 | 6 (1.7%) | 0 (0.0%) |
| $7,500 to $9,999 | 0 (0.0%) | 1 (0.3%) |
| $10,000 to $12,499 | 0 (0.0%) | 52 (17.8%) |
| $12,500 to $14,999 | 0 (0.0%) | 0 (0.0%) |
| $15,000 to $17,499 | 0 (0.0%) | 17 (5.8%) |
| $17,500 to $19,999 | 15 (4.3%) | 6 (2.1%) |
| $20,000 to $22,499 | 10 (2.9%) | 2 (0.7%) |
| $22,500 to $24,999 | 3 (0.9%) | 12 (4.1%) |
| $25,000 to $29,999 | 27 (7.7%) | 35 (12.0%) |
| $30,000 to $34,999 | 68 (19.5%) | 21 (7.2%) |
| $35,000 to $39,999 | 20 (5.7%) | 6 (2.1%) |
| $40,000 to $44,999 | 3 (0.9%) | 9 (3.1%) |
| $45,000 to $49,999 | 30 (8.6%) | 15 (5.1%) |
| $50,000 to $54,999 | 17 (4.9%) | 3 (1.0%) |
| $55,000 to $64,999 | 25 (7.2%) | 23 (7.9%) |
| $65,000 to $74,999 | 11 (3.2%) | 10 (3.4%) |
| $75,000 to $99,999 | 33 (9.5%) | 3 (1.0%) |
| $100,000+ | 33 (9.5%) | 0 (0.0%) |
| Total | 349 (100.0%) | 292 (100.0%) |
Earnings by Sex by Educational Attainment in Woodstock
Average earnings in Woodstock are $36,838 for men and $28,466 for women, a difference of 22.7%. Men with an educational attainment of bachelor's degree enjoy the highest average annual earnings of $71,250, while those with high school diploma education earn the least with $31,438. Women with an educational attainment of college or associate's degree earn the most with the average annual earnings of $58,125, while those with graduate degree education have the smallest earnings of $24,000.
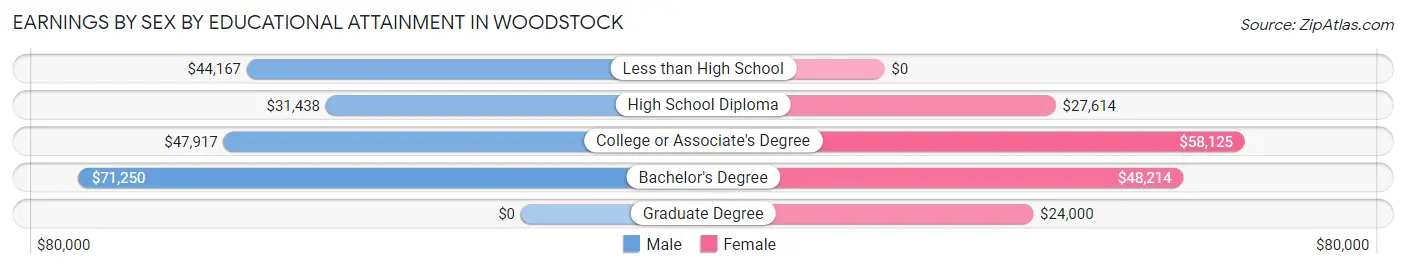
| Educational Attainment | Male Income | Female Income |
| Less than High School | $44,167 | $0 |
| High School Diploma | $31,438 | $27,614 |
| College or Associate's Degree | $47,917 | $58,125 |
| Bachelor's Degree | $71,250 | $48,214 |
| Graduate Degree | - | - |
| Total | $36,838 | $28,466 |
Family Income in Woodstock
Family Income Brackets in Woodstock
According to the Woodstock family income data, there are 77 families falling into the $50,000 to $74,999 income range, which is the most common income bracket and makes up 30.6% of all families.
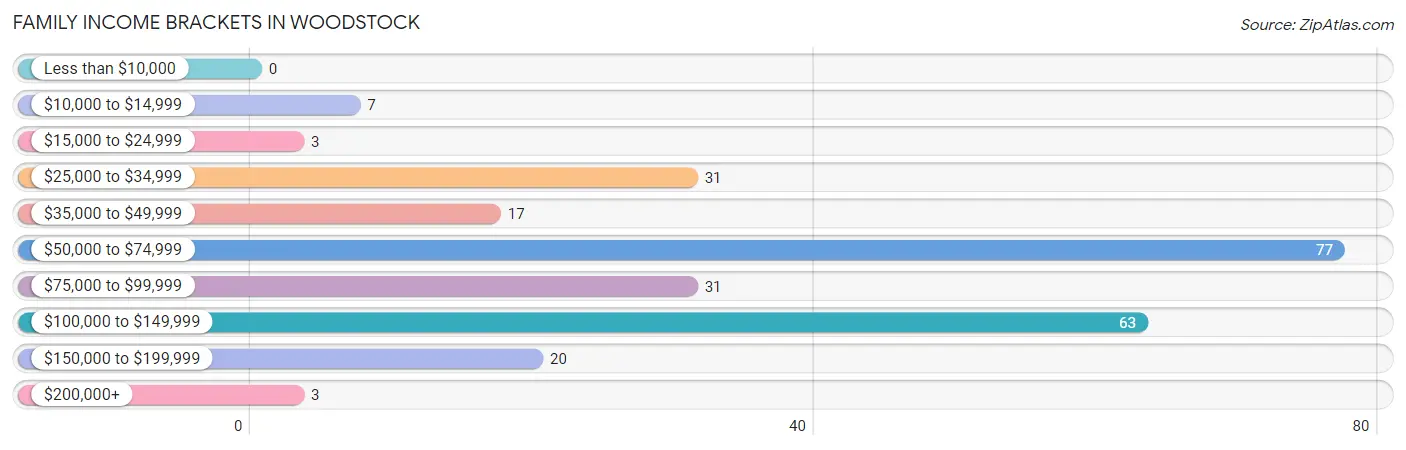
| Income Bracket | # Families | % Families |
| Less than $10,000 | 0 | 0.0% |
| $10,000 to $14,999 | 7 | 2.8% |
| $15,000 to $24,999 | 3 | 1.2% |
| $25,000 to $34,999 | 31 | 12.3% |
| $35,000 to $49,999 | 17 | 6.7% |
| $50,000 to $74,999 | 77 | 30.6% |
| $75,000 to $99,999 | 31 | 12.3% |
| $100,000 to $149,999 | 63 | 25.0% |
| $150,000 to $199,999 | 20 | 7.9% |
| $200,000+ | 3 | 1.2% |
Family Income by Famaliy Size in Woodstock
4-person families (45 | 17.9%) account for the highest median family income in Woodstock with $138,036 per family, while 2-person families (87 | 34.5%) have the highest median income of $35,625 per family member.
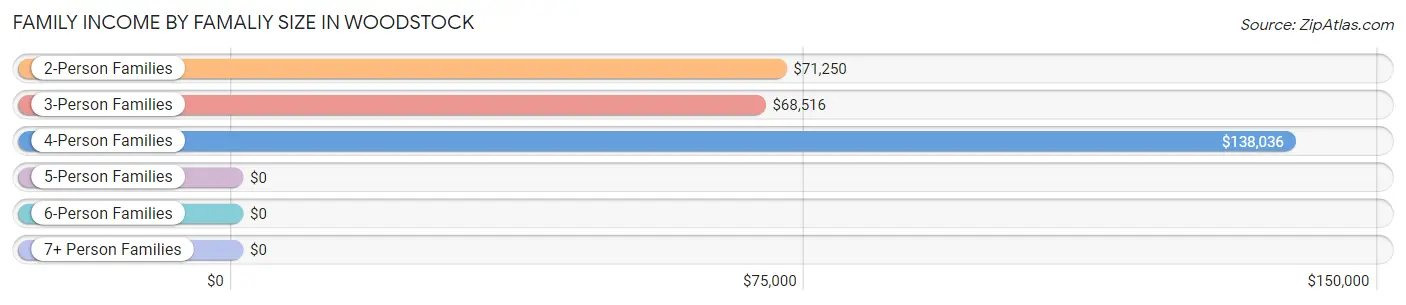
| Income Bracket | # Families | Median Income |
| 2-Person Families | 87 (34.5%) | $71,250 |
| 3-Person Families | 67 (26.6%) | $68,516 |
| 4-Person Families | 45 (17.9%) | $138,036 |
| 5-Person Families | 44 (17.5%) | $0 |
| 6-Person Families | 0 (0.0%) | $0 |
| 7+ Person Families | 9 (3.6%) | $0 |
| Total | 252 (100.0%) | $70,769 |
Family Income by Number of Earners in Woodstock
The median family income in Woodstock is $70,769, with families comprising 3+ earners (29) having the highest median family income of $146,750, while families with 1 earner (89) have the lowest median family income of $52,054, accounting for 11.5% and 35.3% of families, respectively.
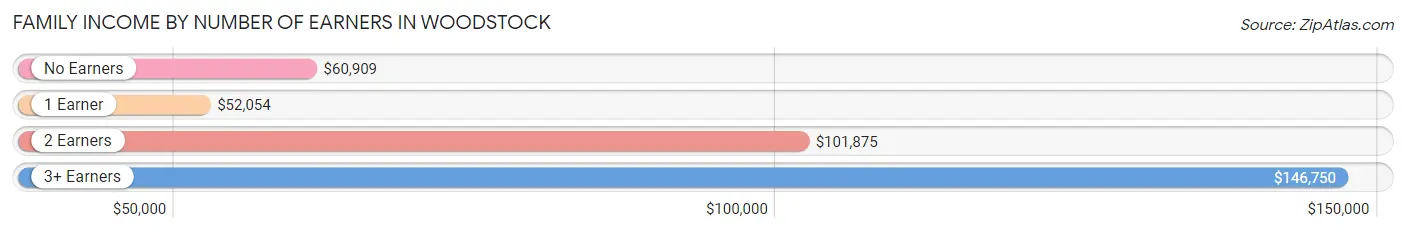
| Number of Earners | # Families | Median Income |
| No Earners | 44 (17.5%) | $60,909 |
| 1 Earner | 89 (35.3%) | $52,054 |
| 2 Earners | 90 (35.7%) | $101,875 |
| 3+ Earners | 29 (11.5%) | $146,750 |
| Total | 252 (100.0%) | $70,769 |
Household Income in Woodstock
Household Income Brackets in Woodstock
With 120 households falling in the category, the $50,000 to $74,999 income range is the most frequent in Woodstock, accounting for 31.2% of all households. In contrast, only 3 households (0.8%) fall into the $200,000+ income bracket, making it the least populous group.
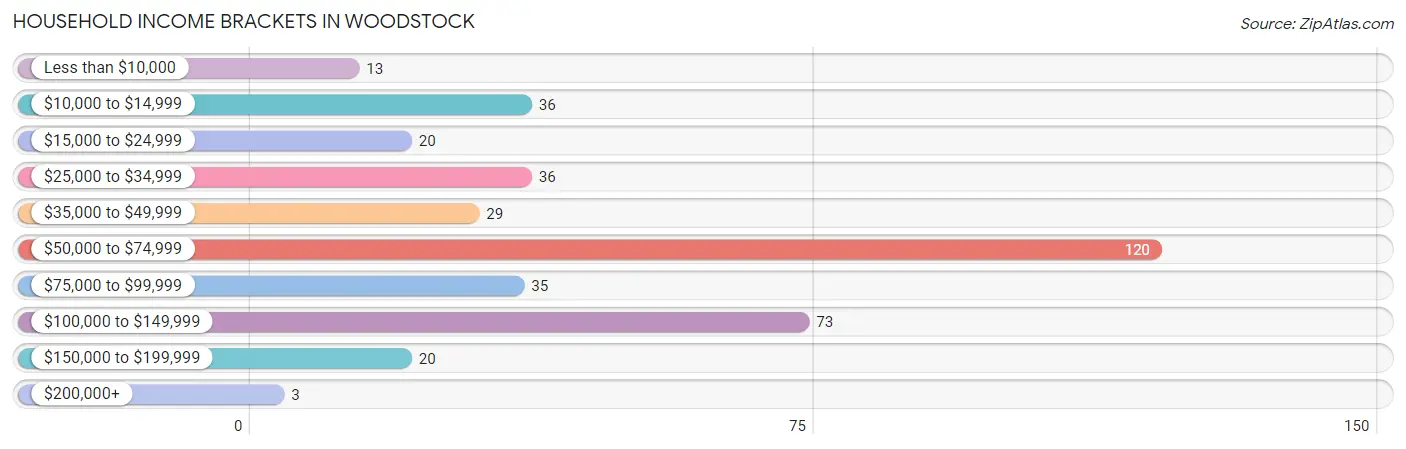
| Income Bracket | # Households | % Households |
| Less than $10,000 | 13 | 3.4% |
| $10,000 to $14,999 | 36 | 9.4% |
| $15,000 to $24,999 | 20 | 5.2% |
| $25,000 to $34,999 | 36 | 9.4% |
| $35,000 to $49,999 | 29 | 7.5% |
| $50,000 to $74,999 | 120 | 31.2% |
| $75,000 to $99,999 | 35 | 9.1% |
| $100,000 to $149,999 | 73 | 19.0% |
| $150,000 to $199,999 | 20 | 5.2% |
| $200,000+ | 3 | 0.8% |
Household Income by Householder Age in Woodstock
The median household income in Woodstock is $65,469, with the highest median household income of $96,250 found in the 25 to 44 years age bracket for the primary householder. A total of 84 households (21.8%) fall into this category. Meanwhile, the 15 to 24 years age bracket for the primary householder has the lowest median household income of $0, with 1 households (0.3%) in this group.
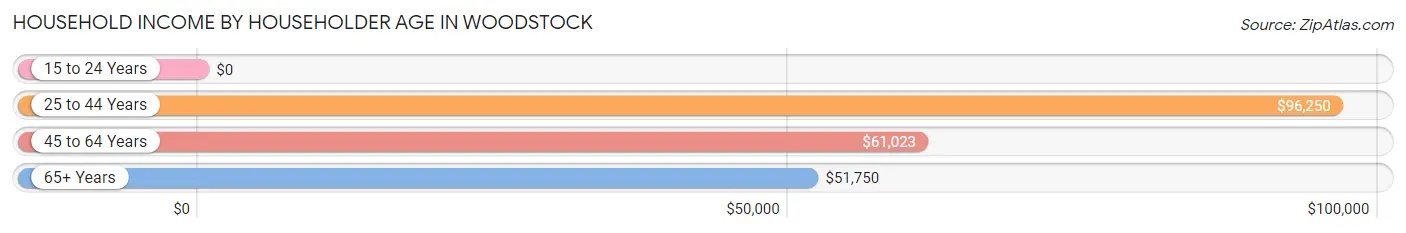
| Income Bracket | # Households | Median Income |
| 15 to 24 Years | 1 (0.3%) | $0 |
| 25 to 44 Years | 84 (21.8%) | $96,250 |
| 45 to 64 Years | 169 (43.9%) | $61,023 |
| 65+ Years | 131 (34.0%) | $51,750 |
| Total | 385 (100.0%) | $65,469 |
Poverty in Woodstock
Income Below Poverty by Sex and Age in Woodstock
With 12.3% poverty level for males and 20.4% for females among the residents of Woodstock, 15 year old males and 45 to 54 year old females are the most vulnerable to poverty, with 11 males (100.0%) and 63 females (56.8%) in their respective age groups living below the poverty level.
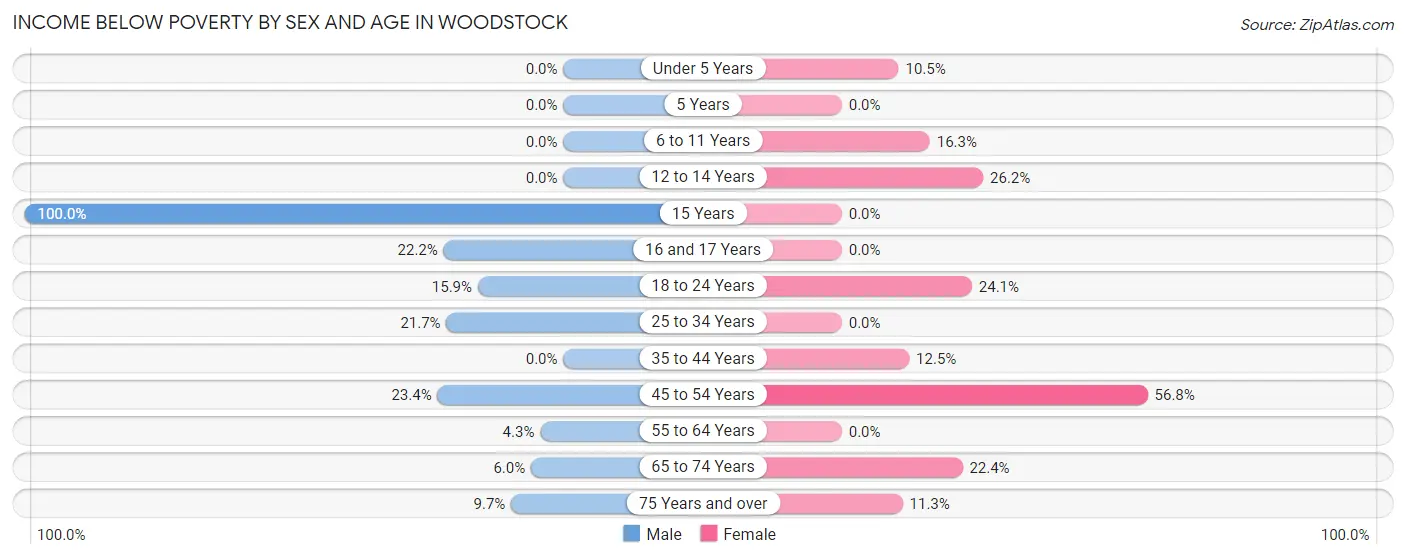
| Age Bracket | Male | Female |
| Under 5 Years | 0 (0.0%) | 4 (10.5%) |
| 5 Years | 0 (0.0%) | 0 (0.0%) |
| 6 to 11 Years | 0 (0.0%) | 16 (16.3%) |
| 12 to 14 Years | 0 (0.0%) | 16 (26.2%) |
| 15 Years | 11 (100.0%) | 0 (0.0%) |
| 16 and 17 Years | 2 (22.2%) | 0 (0.0%) |
| 18 to 24 Years | 10 (15.9%) | 21 (24.1%) |
| 25 to 34 Years | 23 (21.7%) | 0 (0.0%) |
| 35 to 44 Years | 0 (0.0%) | 8 (12.5%) |
| 45 to 54 Years | 25 (23.4%) | 63 (56.8%) |
| 55 to 64 Years | 3 (4.3%) | 0 (0.0%) |
| 65 to 74 Years | 3 (6.0%) | 15 (22.4%) |
| 75 Years and over | 3 (9.7%) | 7 (11.3%) |
| Total | 80 (12.3%) | 150 (20.4%) |
Income Above Poverty by Sex and Age in Woodstock
According to the poverty statistics in Woodstock, males aged under 5 years and females aged 5 years are the age groups that are most secure financially, with 100.0% of males and 100.0% of females in these age groups living above the poverty line.
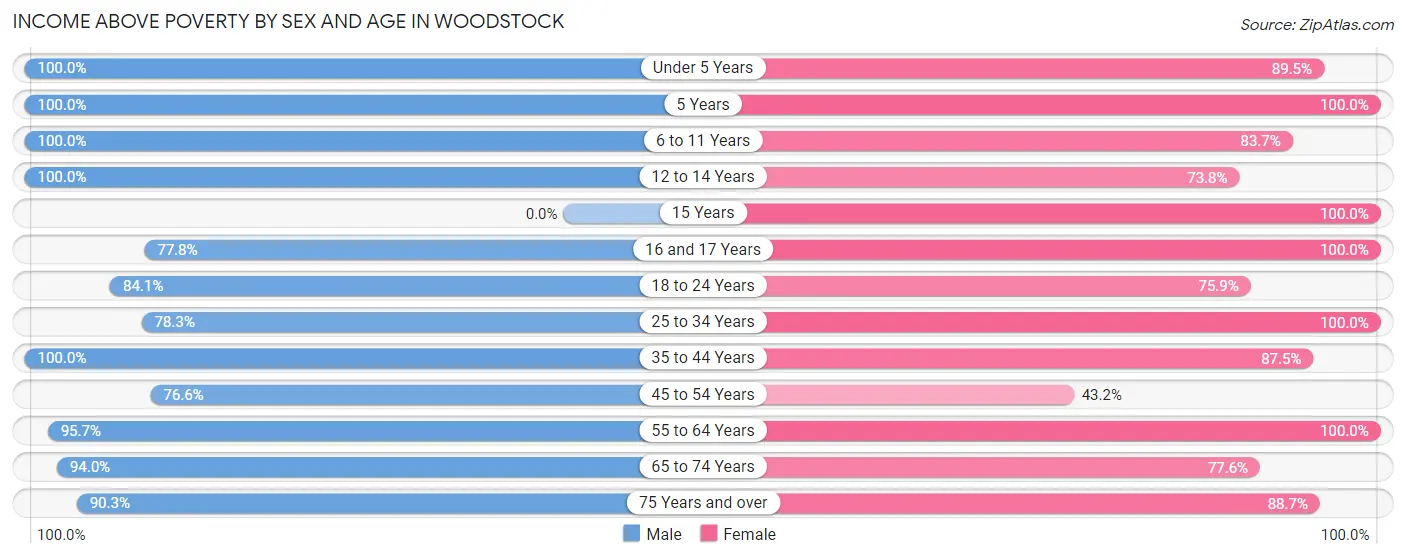
| Age Bracket | Male | Female |
| Under 5 Years | 65 (100.0%) | 34 (89.5%) |
| 5 Years | 15 (100.0%) | 7 (100.0%) |
| 6 to 11 Years | 26 (100.0%) | 82 (83.7%) |
| 12 to 14 Years | 21 (100.0%) | 45 (73.8%) |
| 15 Years | 0 (0.0%) | 12 (100.0%) |
| 16 and 17 Years | 7 (77.8%) | 14 (100.0%) |
| 18 to 24 Years | 53 (84.1%) | 66 (75.9%) |
| 25 to 34 Years | 83 (78.3%) | 65 (100.0%) |
| 35 to 44 Years | 78 (100.0%) | 56 (87.5%) |
| 45 to 54 Years | 82 (76.6%) | 48 (43.2%) |
| 55 to 64 Years | 67 (95.7%) | 50 (100.0%) |
| 65 to 74 Years | 47 (94.0%) | 52 (77.6%) |
| 75 Years and over | 28 (90.3%) | 55 (88.7%) |
| Total | 572 (87.7%) | 586 (79.6%) |
Income Below Poverty Among Married-Couple Families in Woodstock
The poverty statistics for married-couple families in Woodstock show that 5.6% or 11 of the total 196 families live below the poverty line. Families with 3 or 4 children have the highest poverty rate of 68.8%, comprising of 11 families. On the other hand, families with no children have the lowest poverty rate of 0.0%, which includes 0 families.
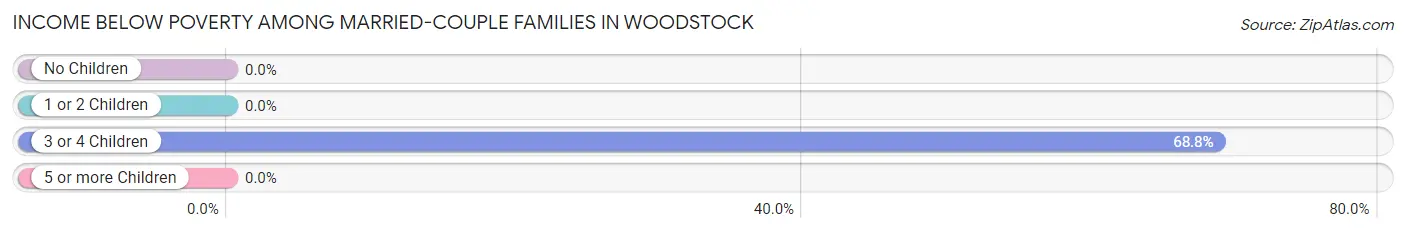
| Children | Above Poverty | Below Poverty |
| No Children | 111 (100.0%) | 0 (0.0%) |
| 1 or 2 Children | 60 (100.0%) | 0 (0.0%) |
| 3 or 4 Children | 5 (31.2%) | 11 (68.8%) |
| 5 or more Children | 9 (100.0%) | 0 (0.0%) |
| Total | 185 (94.4%) | 11 (5.6%) |
Income Below Poverty Among Single-Parent Households in Woodstock
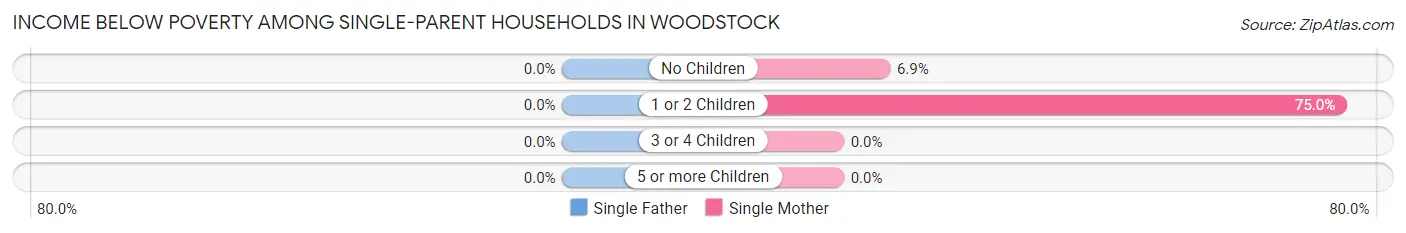
| Children | Single Father | Single Mother |
| No Children | 0 (0.0%) | 2 (6.9%) |
| 1 or 2 Children | 0 (0.0%) | 6 (75.0%) |
| 3 or 4 Children | 0 (0.0%) | 0 (0.0%) |
| 5 or more Children | 0 (0.0%) | 0 (0.0%) |
| Total | 0 (0.0%) | 8 (18.2%) |
Income Below Poverty Among Married-Couple vs Single-Parent Households in Woodstock
The poverty data for Woodstock shows that 11 of the married-couple family households (5.6%) and 8 of the single-parent households (14.3%) are living below the poverty level. Within the married-couple family households, those with 3 or 4 children have the highest poverty rate, with 11 households (68.8%) falling below the poverty line. Among the single-parent households, those with 1 or 2 children have the highest poverty rate, with 6 household (33.3%) living below poverty.
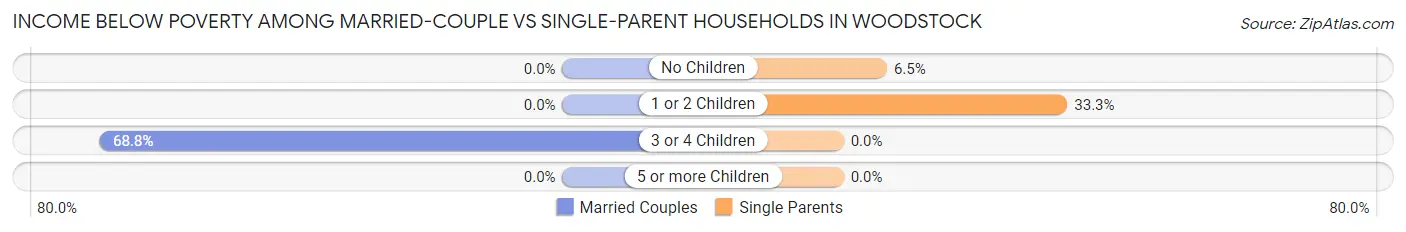
| Children | Married-Couple Families | Single-Parent Households |
| No Children | 0 (0.0%) | 2 (6.5%) |
| 1 or 2 Children | 0 (0.0%) | 6 (33.3%) |
| 3 or 4 Children | 11 (68.8%) | 0 (0.0%) |
| 5 or more Children | 0 (0.0%) | 0 (0.0%) |
| Total | 11 (5.6%) | 8 (14.3%) |
Employment Characteristics in Woodstock
Employment by Class of Employer in Woodstock
Among the 521 employed individuals in Woodstock, private company employees (430 | 82.5%), self-employed (incorporated) (28 | 5.4%), and local government employees (27 | 5.2%) make up the most common classes of employment.
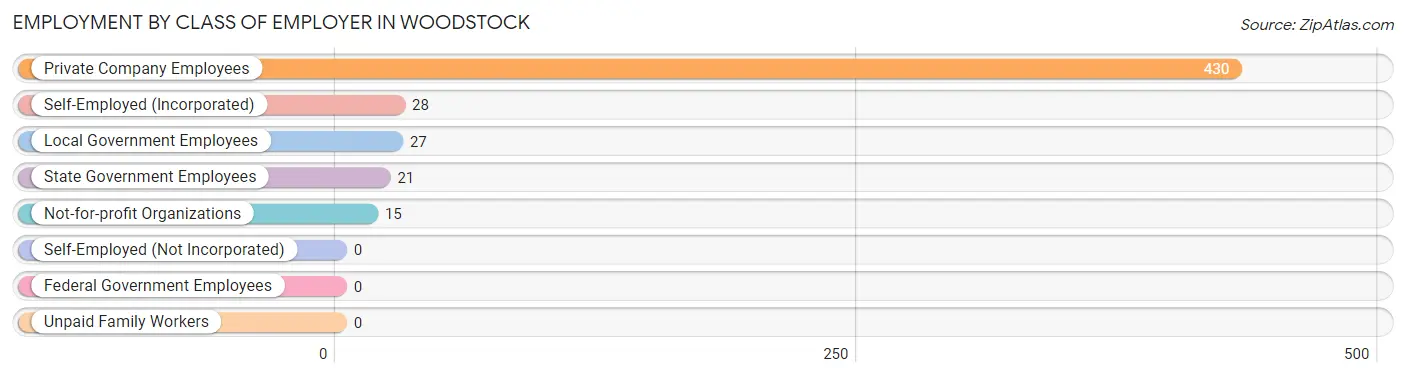
| Employer Class | # Employees | % Employees |
| Private Company Employees | 430 | 82.5% |
| Self-Employed (Incorporated) | 28 | 5.4% |
| Self-Employed (Not Incorporated) | 0 | 0.0% |
| Not-for-profit Organizations | 15 | 2.9% |
| Local Government Employees | 27 | 5.2% |
| State Government Employees | 21 | 4.0% |
| Federal Government Employees | 0 | 0.0% |
| Unpaid Family Workers | 0 | 0.0% |
| Total | 521 | 100.0% |
Employment Status by Age in Woodstock
According to the labor force statistics for Woodstock, out of the total population over 16 years of age (1,034), 59.7% or 617 individuals are in the labor force, with 13.3% or 82 of them unemployed. The age group with the highest labor force participation rate is 20 to 24 years, with 93.0% or 132 individuals in the labor force. Within the labor force, the 20 to 24 years age range has the highest percentage of unemployed individuals, with 30.3% or 40 of them being unemployed.
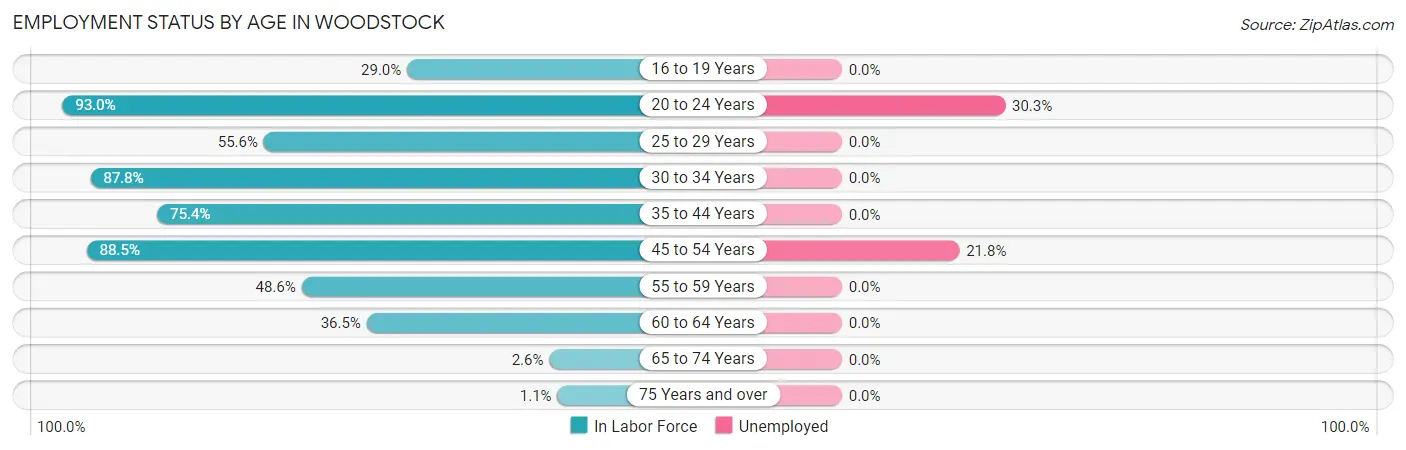
| Age Bracket | In Labor Force | Unemployed |
| 16 to 19 Years | 9 (29.0%) | 0 (0.0%) |
| 20 to 24 Years | 132 (93.0%) | 40 (30.3%) |
| 25 to 29 Years | 45 (55.6%) | 0 (0.0%) |
| 30 to 34 Years | 79 (87.8%) | 0 (0.0%) |
| 35 to 44 Years | 107 (75.4%) | 0 (0.0%) |
| 45 to 54 Years | 193 (88.5%) | 42 (21.8%) |
| 55 to 59 Years | 17 (48.6%) | 0 (0.0%) |
| 60 to 64 Years | 31 (36.5%) | 0 (0.0%) |
| 65 to 74 Years | 3 (2.6%) | 0 (0.0%) |
| 75 Years and over | 1 (1.1%) | 0 (0.0%) |
| Total | 617 (59.7%) | 82 (13.3%) |
Employment Status by Educational Attainment in Woodstock
According to labor force statistics for Woodstock, 72.5% of individuals (472) out of the total population between 25 and 64 years of age (651) are in the labor force, with 8.9% or 42 of them being unemployed. The group with the highest labor force participation rate are those with the educational attainment of bachelor's degree or higher, with 100.0% or 54 individuals in the labor force. Within the labor force, individuals with less than high school education have the highest percentage of unemployment, with 40.3% or 27 of them being unemployed.
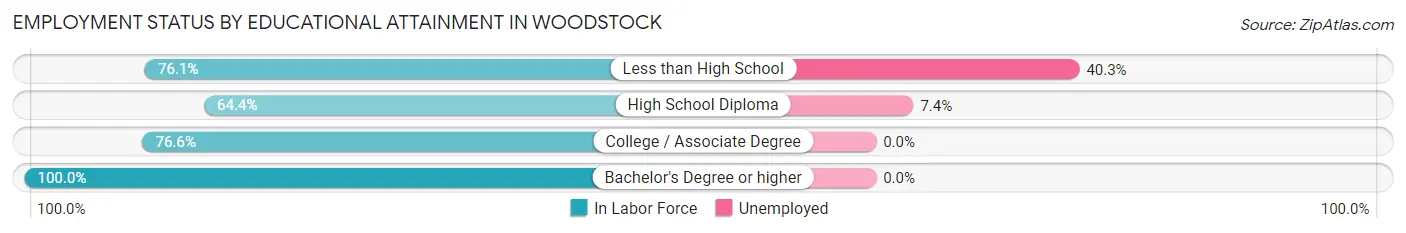
| Educational Attainment | In Labor Force | Unemployed |
| Less than High School | 67 (76.1%) | 35 (40.3%) |
| High School Diploma | 204 (64.4%) | 23 (7.4%) |
| College / Associate Degree | 147 (76.6%) | 0 (0.0%) |
| Bachelor's Degree or higher | 54 (100.0%) | 0 (0.0%) |
| Total | 472 (72.5%) | 58 (8.9%) |
Employment Occupations by Sex in Woodstock
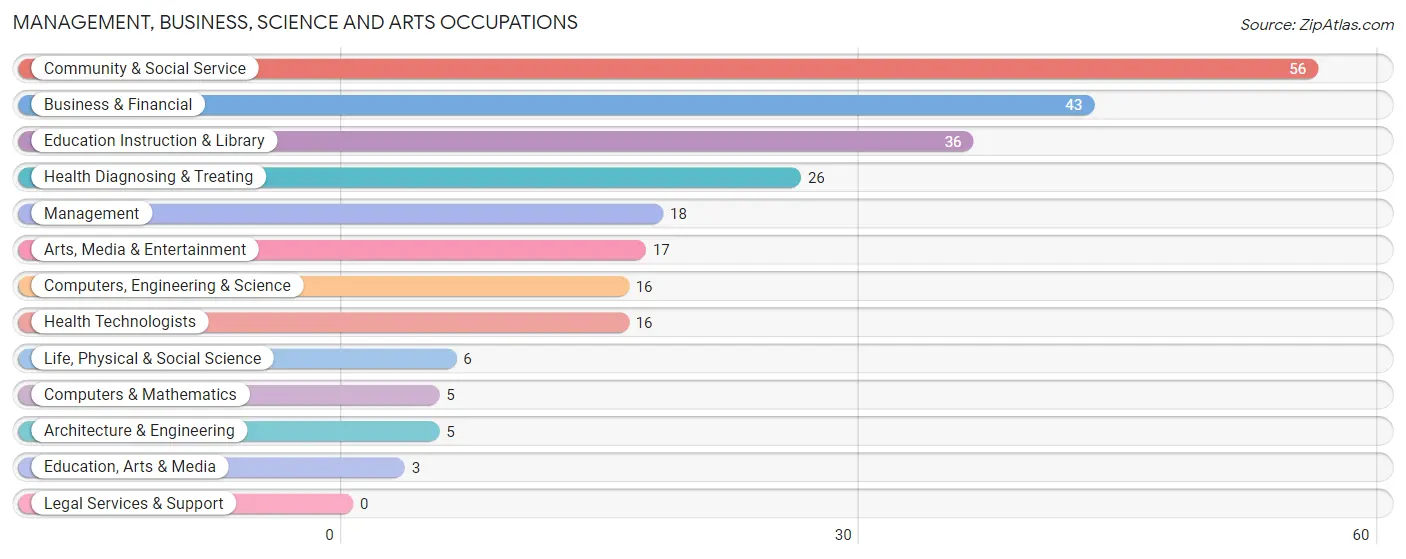
Management, Business, Science and Arts Occupations
The most common Management, Business, Science and Arts occupations in Woodstock are Community & Social Service (56 | 10.5%), Business & Financial (43 | 8.0%), Education Instruction & Library (36 | 6.7%), Health Diagnosing & Treating (26 | 4.9%), and Management (18 | 3.4%).
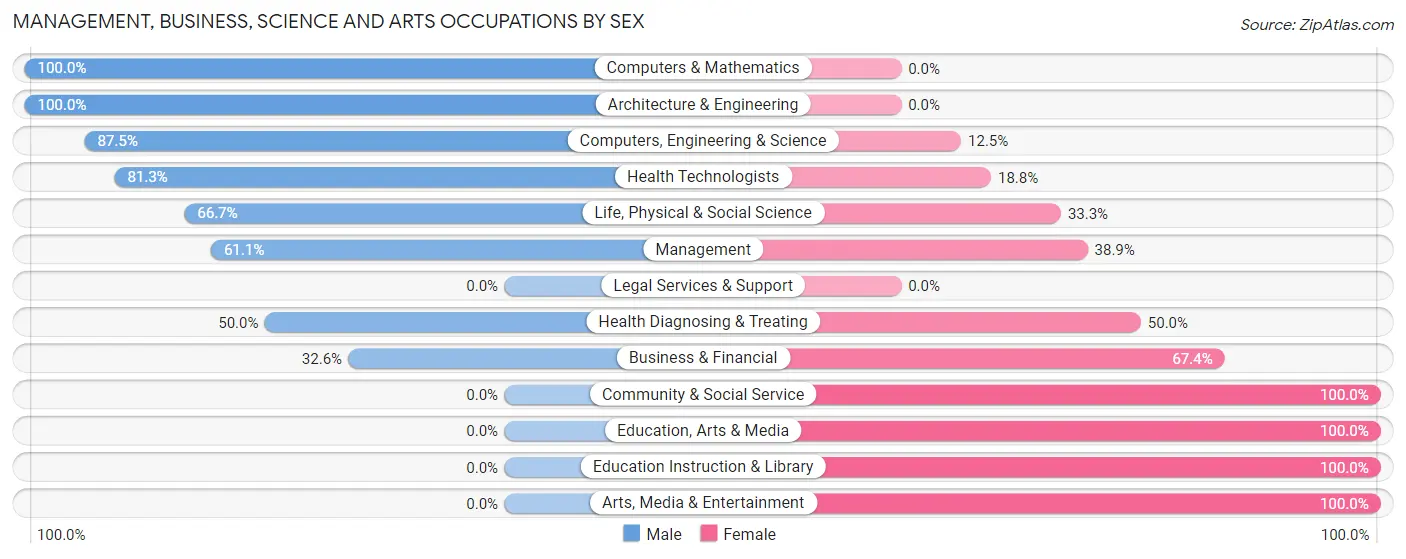
Management, Business, Science and Arts Occupations by Sex
Within the Management, Business, Science and Arts occupations in Woodstock, the most male-oriented occupations are Computers & Mathematics (100.0%), Architecture & Engineering (100.0%), and Computers, Engineering & Science (87.5%), while the most female-oriented occupations are Community & Social Service (100.0%), Education, Arts & Media (100.0%), and Education Instruction & Library (100.0%).
| Occupation | Male | Female |
| Management | 11 (61.1%) | 7 (38.9%) |
| Business & Financial | 14 (32.6%) | 29 (67.4%) |
| Computers, Engineering & Science | 14 (87.5%) | 2 (12.5%) |
| Computers & Mathematics | 5 (100.0%) | 0 (0.0%) |
| Architecture & Engineering | 5 (100.0%) | 0 (0.0%) |
| Life, Physical & Social Science | 4 (66.7%) | 2 (33.3%) |
| Community & Social Service | 0 (0.0%) | 56 (100.0%) |
| Education, Arts & Media | 0 (0.0%) | 3 (100.0%) |
| Legal Services & Support | 0 (0.0%) | 0 (0.0%) |
| Education Instruction & Library | 0 (0.0%) | 36 (100.0%) |
| Arts, Media & Entertainment | 0 (0.0%) | 17 (100.0%) |
| Health Diagnosing & Treating | 13 (50.0%) | 13 (50.0%) |
| Health Technologists | 13 (81.2%) | 3 (18.8%) |
| Total (Category) | 52 (32.7%) | 107 (67.3%) |
| Total (Overall) | 318 (59.4%) | 217 (40.6%) |
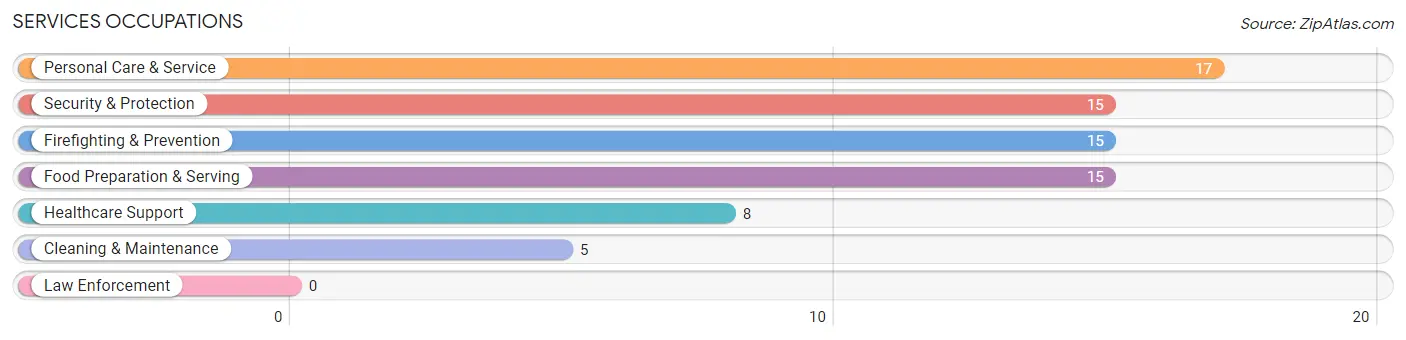
Services Occupations
The most common Services occupations in Woodstock are Personal Care & Service (17 | 3.2%), Security & Protection (15 | 2.8%), Firefighting & Prevention (15 | 2.8%), Food Preparation & Serving (15 | 2.8%), and Healthcare Support (8 | 1.5%).
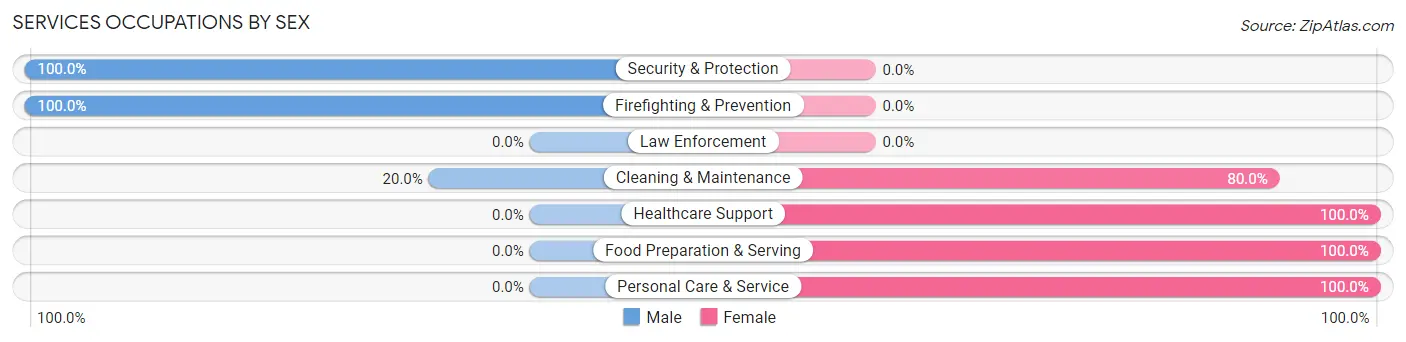
Services Occupations by Sex
Within the Services occupations in Woodstock, the most male-oriented occupations are Security & Protection (100.0%), Firefighting & Prevention (100.0%), and Cleaning & Maintenance (20.0%), while the most female-oriented occupations are Healthcare Support (100.0%), Food Preparation & Serving (100.0%), and Personal Care & Service (100.0%).
| Occupation | Male | Female |
| Healthcare Support | 0 (0.0%) | 8 (100.0%) |
| Security & Protection | 15 (100.0%) | 0 (0.0%) |
| Firefighting & Prevention | 15 (100.0%) | 0 (0.0%) |
| Law Enforcement | 0 (0.0%) | 0 (0.0%) |
| Food Preparation & Serving | 0 (0.0%) | 15 (100.0%) |
| Cleaning & Maintenance | 1 (20.0%) | 4 (80.0%) |
| Personal Care & Service | 0 (0.0%) | 17 (100.0%) |
| Total (Category) | 16 (26.7%) | 44 (73.3%) |
| Total (Overall) | 318 (59.4%) | 217 (40.6%) |
Sales and Office Occupations
The most common Sales and Office occupations in Woodstock are Sales & Related (85 | 15.9%), and Office & Administration (38 | 7.1%).
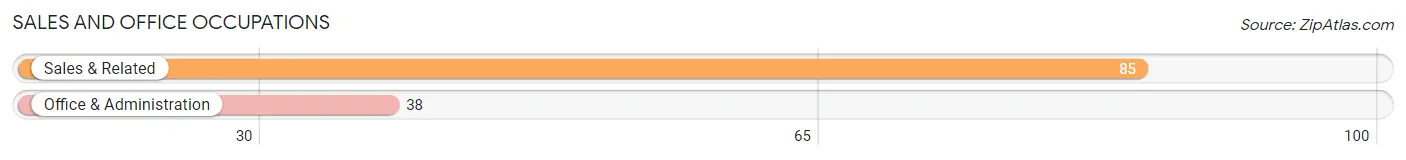
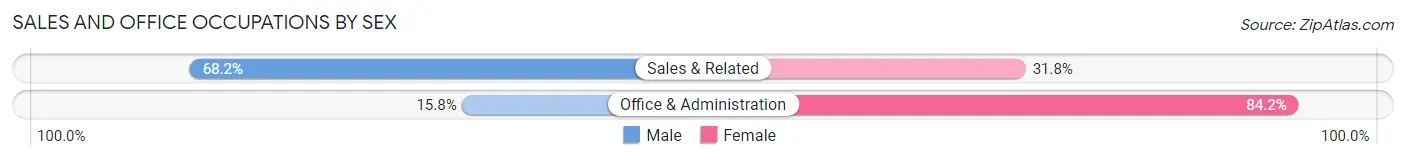
Sales and Office Occupations by Sex
| Occupation | Male | Female |
| Sales & Related | 58 (68.2%) | 27 (31.8%) |
| Office & Administration | 6 (15.8%) | 32 (84.2%) |
| Total (Category) | 64 (52.0%) | 59 (48.0%) |
| Total (Overall) | 318 (59.4%) | 217 (40.6%) |
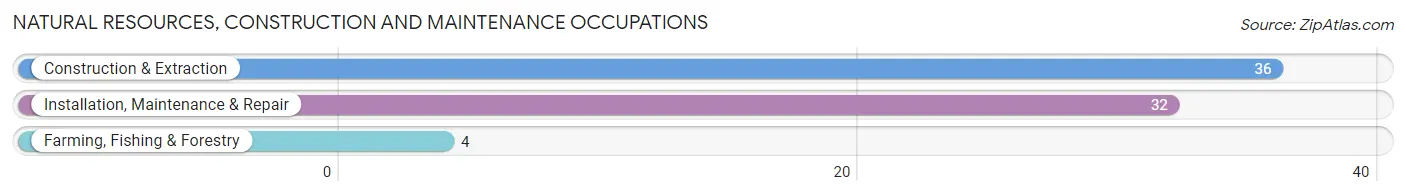
Natural Resources, Construction and Maintenance Occupations
The most common Natural Resources, Construction and Maintenance occupations in Woodstock are Construction & Extraction (36 | 6.7%), Installation, Maintenance & Repair (32 | 6.0%), and Farming, Fishing & Forestry (4 | 0.7%).
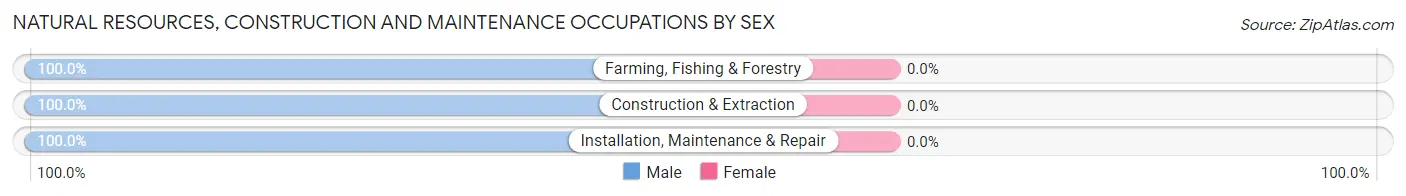
Natural Resources, Construction and Maintenance Occupations by Sex
| Occupation | Male | Female |
| Farming, Fishing & Forestry | 4 (100.0%) | 0 (0.0%) |
| Construction & Extraction | 36 (100.0%) | 0 (0.0%) |
| Installation, Maintenance & Repair | 32 (100.0%) | 0 (0.0%) |
| Total (Category) | 72 (100.0%) | 0 (0.0%) |
| Total (Overall) | 318 (59.4%) | 217 (40.6%) |
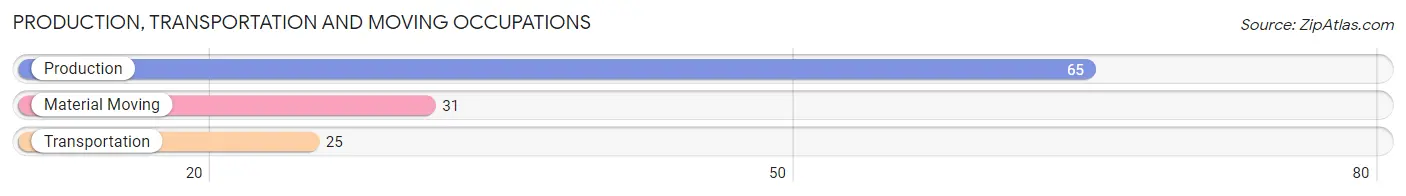
Production, Transportation and Moving Occupations
The most common Production, Transportation and Moving occupations in Woodstock are Production (65 | 12.1%), Material Moving (31 | 5.8%), and Transportation (25 | 4.7%).
Production, Transportation and Moving Occupations by Sex
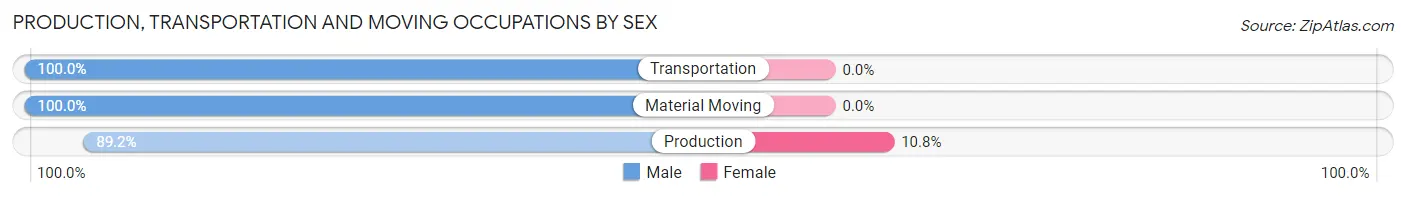
| Occupation | Male | Female |
| Production | 58 (89.2%) | 7 (10.8%) |
| Transportation | 25 (100.0%) | 0 (0.0%) |
| Material Moving | 31 (100.0%) | 0 (0.0%) |
| Total (Category) | 114 (94.2%) | 7 (5.8%) |
| Total (Overall) | 318 (59.4%) | 217 (40.6%) |
Employment Industries by Sex in Woodstock
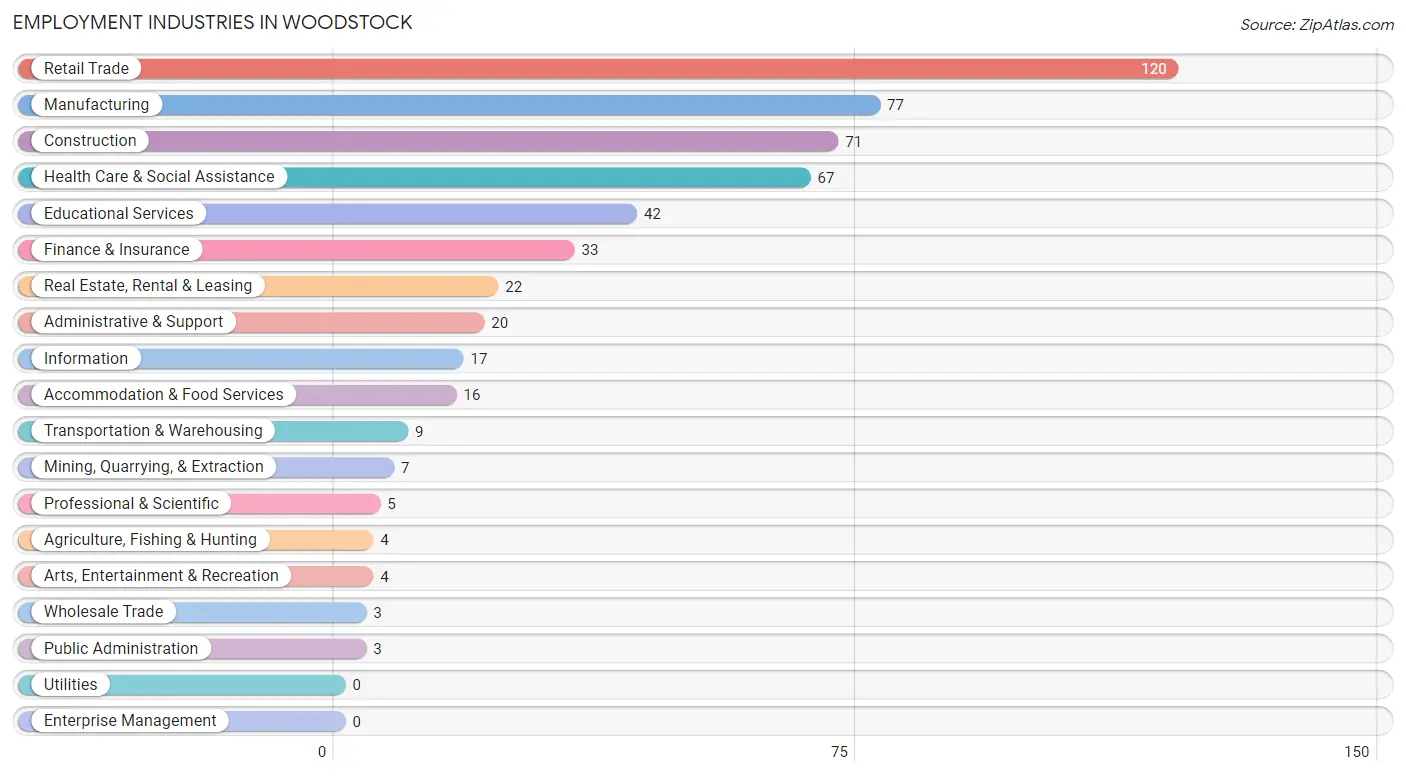
Employment Industries in Woodstock
The major employment industries in Woodstock include Retail Trade (120 | 22.4%), Manufacturing (77 | 14.4%), Construction (71 | 13.3%), Health Care & Social Assistance (67 | 12.5%), and Educational Services (42 | 7.9%).
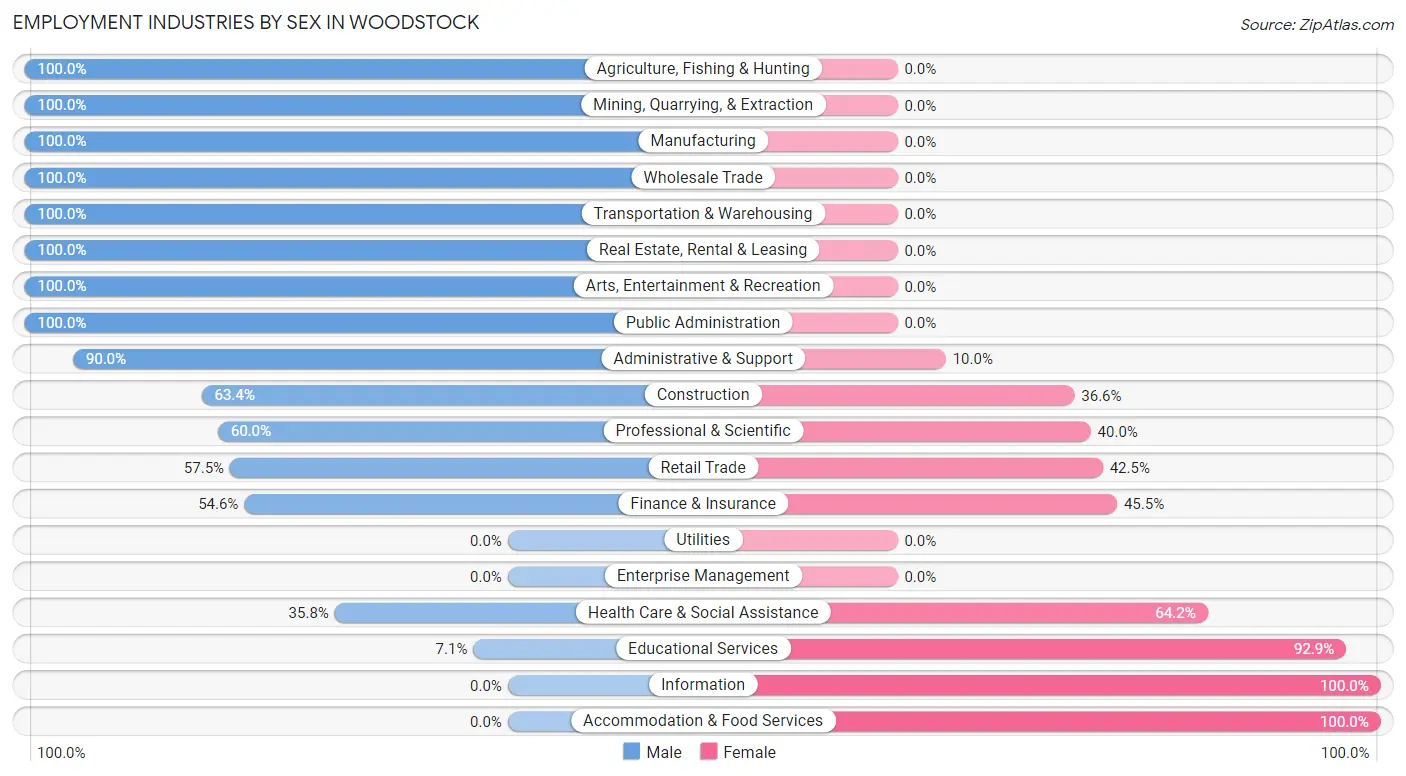
Employment Industries by Sex in Woodstock
The Woodstock industries that see more men than women are Agriculture, Fishing & Hunting (100.0%), Mining, Quarrying, & Extraction (100.0%), and Manufacturing (100.0%), whereas the industries that tend to have a higher number of women are Information (100.0%), Accommodation & Food Services (100.0%), and Educational Services (92.9%).
| Industry | Male | Female |
| Agriculture, Fishing & Hunting | 4 (100.0%) | 0 (0.0%) |
| Mining, Quarrying, & Extraction | 7 (100.0%) | 0 (0.0%) |
| Construction | 45 (63.4%) | 26 (36.6%) |
| Manufacturing | 77 (100.0%) | 0 (0.0%) |
| Wholesale Trade | 3 (100.0%) | 0 (0.0%) |
| Retail Trade | 69 (57.5%) | 51 (42.5%) |
| Transportation & Warehousing | 9 (100.0%) | 0 (0.0%) |
| Utilities | 0 (0.0%) | 0 (0.0%) |
| Information | 0 (0.0%) | 17 (100.0%) |
| Finance & Insurance | 18 (54.5%) | 15 (45.5%) |
| Real Estate, Rental & Leasing | 22 (100.0%) | 0 (0.0%) |
| Professional & Scientific | 3 (60.0%) | 2 (40.0%) |
| Enterprise Management | 0 (0.0%) | 0 (0.0%) |
| Administrative & Support | 18 (90.0%) | 2 (10.0%) |
| Educational Services | 3 (7.1%) | 39 (92.9%) |
| Health Care & Social Assistance | 24 (35.8%) | 43 (64.2%) |
| Arts, Entertainment & Recreation | 4 (100.0%) | 0 (0.0%) |
| Accommodation & Food Services | 0 (0.0%) | 16 (100.0%) |
| Public Administration | 3 (100.0%) | 0 (0.0%) |
| Total | 318 (59.4%) | 217 (40.6%) |
Education in Woodstock
School Enrollment in Woodstock
The most common levels of schooling among the 307 students in Woodstock are middle school (115 | 37.5%), elementary school (81 | 26.4%), and high school (59 | 19.2%).
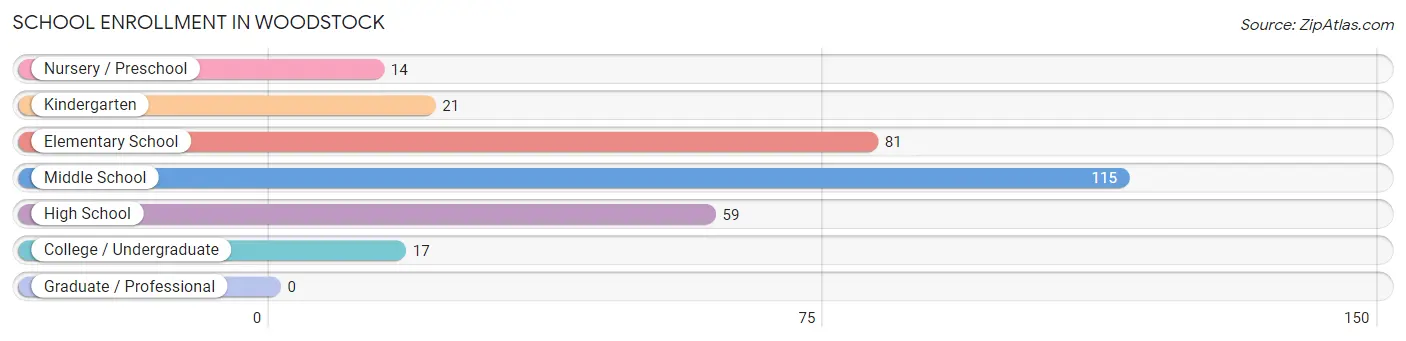
| School Level | # Students | % Students |
| Nursery / Preschool | 14 | 4.6% |
| Kindergarten | 21 | 6.8% |
| Elementary School | 81 | 26.4% |
| Middle School | 115 | 37.5% |
| High School | 59 | 19.2% |
| College / Undergraduate | 17 | 5.5% |
| Graduate / Professional | 0 | 0.0% |
| Total | 307 | 100.0% |
School Enrollment by Age by Funding Source in Woodstock
Out of a total of 307 students who are enrolled in schools in Woodstock, 34 (11.1%) attend a private institution, while the remaining 273 (88.9%) are enrolled in public schools. The age group of 3 to 4 year olds has the highest likelihood of being enrolled in private schools, with 14 (100.0% in the age bracket) enrolled. Conversely, the age group of 15 to 17 year olds has the lowest likelihood of being enrolled in a private school, with 46 (100.0% in the age bracket) attending a public institution.
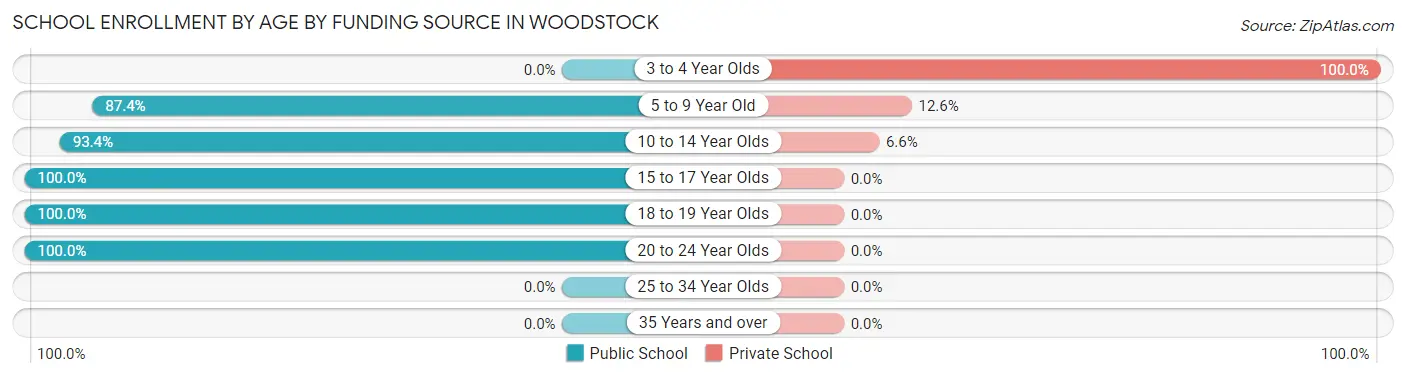
| Age Bracket | Public School | Private School |
| 3 to 4 Year Olds | 0 (0.0%) | 14 (100.0%) |
| 5 to 9 Year Old | 76 (87.4%) | 11 (12.6%) |
| 10 to 14 Year Olds | 128 (93.4%) | 9 (6.6%) |
| 15 to 17 Year Olds | 46 (100.0%) | 0 (0.0%) |
| 18 to 19 Year Olds | 6 (100.0%) | 0 (0.0%) |
| 20 to 24 Year Olds | 17 (100.0%) | 0 (0.0%) |
| 25 to 34 Year Olds | 0 (0.0%) | 0 (0.0%) |
| 35 Years and over | 0 (0.0%) | 0 (0.0%) |
| Total | 273 (88.9%) | 34 (11.1%) |
Educational Attainment by Field of Study in Woodstock
Education (18 | 27.7%), business (15 | 23.1%), science & technology (12 | 18.5%), psychology (7 | 10.8%), and social sciences (4 | 6.1%) are the most common fields of study among 65 individuals in Woodstock who have obtained a bachelor's degree or higher.
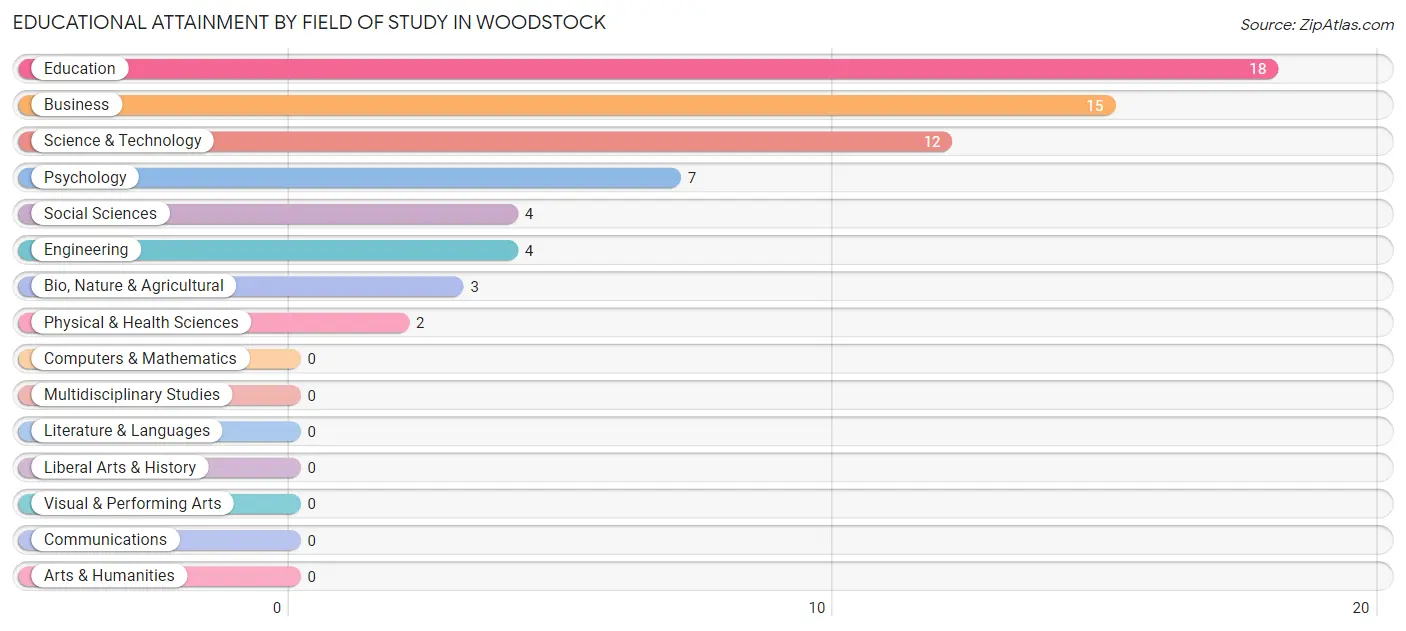
| Field of Study | # Graduates | % Graduates |
| Computers & Mathematics | 0 | 0.0% |
| Bio, Nature & Agricultural | 3 | 4.6% |
| Physical & Health Sciences | 2 | 3.1% |
| Psychology | 7 | 10.8% |
| Social Sciences | 4 | 6.1% |
| Engineering | 4 | 6.1% |
| Multidisciplinary Studies | 0 | 0.0% |
| Science & Technology | 12 | 18.5% |
| Business | 15 | 23.1% |
| Education | 18 | 27.7% |
| Literature & Languages | 0 | 0.0% |
| Liberal Arts & History | 0 | 0.0% |
| Visual & Performing Arts | 0 | 0.0% |
| Communications | 0 | 0.0% |
| Arts & Humanities | 0 | 0.0% |
| Total | 65 | 100.0% |
Transportation & Commute in Woodstock
Vehicle Availability by Sex in Woodstock
The most prevalent vehicle ownership categories in Woodstock are males with 3 vehicles (109, accounting for 35.0%) and females with 3 vehicles (39, making up 51.9%).
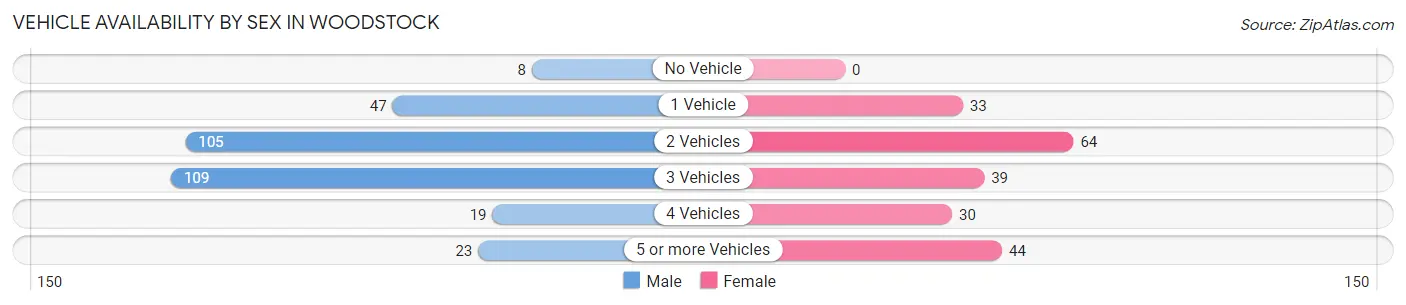
| Vehicles Available | Male | Female |
| No Vehicle | 8 (2.6%) | 0 (0.0%) |
| 1 Vehicle | 47 (15.1%) | 33 (15.7%) |
| 2 Vehicles | 105 (33.8%) | 64 (30.5%) |
| 3 Vehicles | 109 (35.0%) | 39 (18.6%) |
| 4 Vehicles | 19 (6.1%) | 30 (14.3%) |
| 5 or more Vehicles | 23 (7.4%) | 44 (20.9%) |
| Total | 311 (100.0%) | 210 (100.0%) |
Commute Time in Woodstock
The most frequently occuring commute durations in Woodstock are 5 to 9 minutes (82 commuters, 15.9%), 30 to 34 minutes (69 commuters, 13.4%), and 10 to 14 minutes (64 commuters, 12.4%).
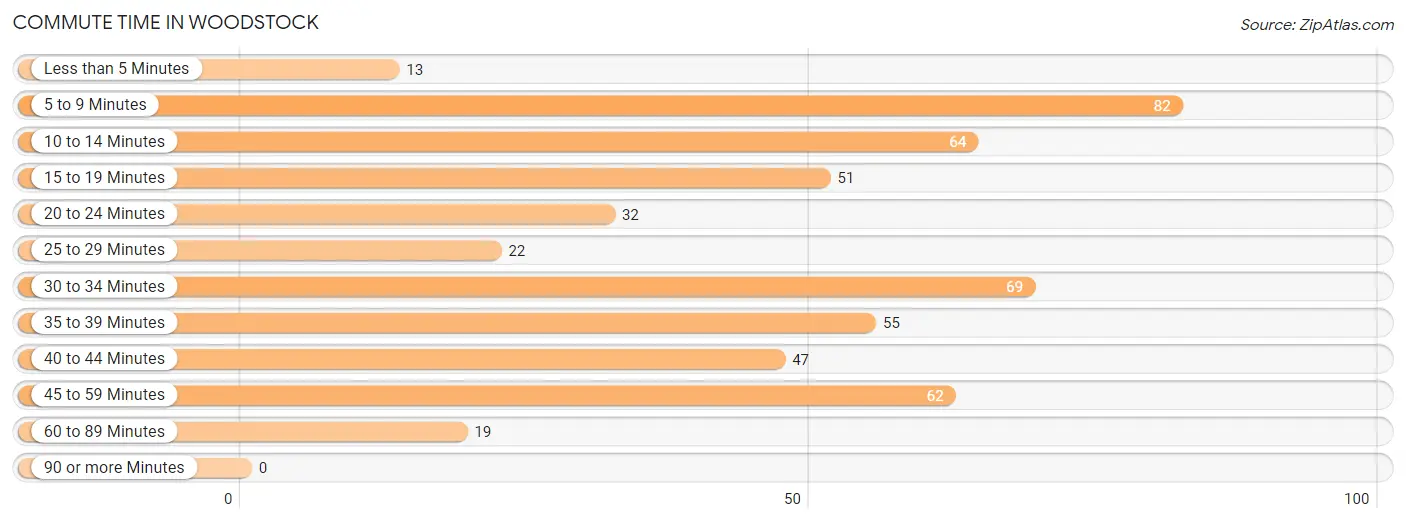
| Commute Time | # Commuters | % Commuters |
| Less than 5 Minutes | 13 | 2.5% |
| 5 to 9 Minutes | 82 | 15.9% |
| 10 to 14 Minutes | 64 | 12.4% |
| 15 to 19 Minutes | 51 | 9.9% |
| 20 to 24 Minutes | 32 | 6.2% |
| 25 to 29 Minutes | 22 | 4.3% |
| 30 to 34 Minutes | 69 | 13.4% |
| 35 to 39 Minutes | 55 | 10.7% |
| 40 to 44 Minutes | 47 | 9.1% |
| 45 to 59 Minutes | 62 | 12.0% |
| 60 to 89 Minutes | 19 | 3.7% |
| 90 or more Minutes | 0 | 0.0% |
Commute Time by Sex in Woodstock
The most common commute times in Woodstock are 5 to 9 minutes (66 commuters, 21.6%) for males and 30 to 34 minutes (36 commuters, 17.1%) for females.
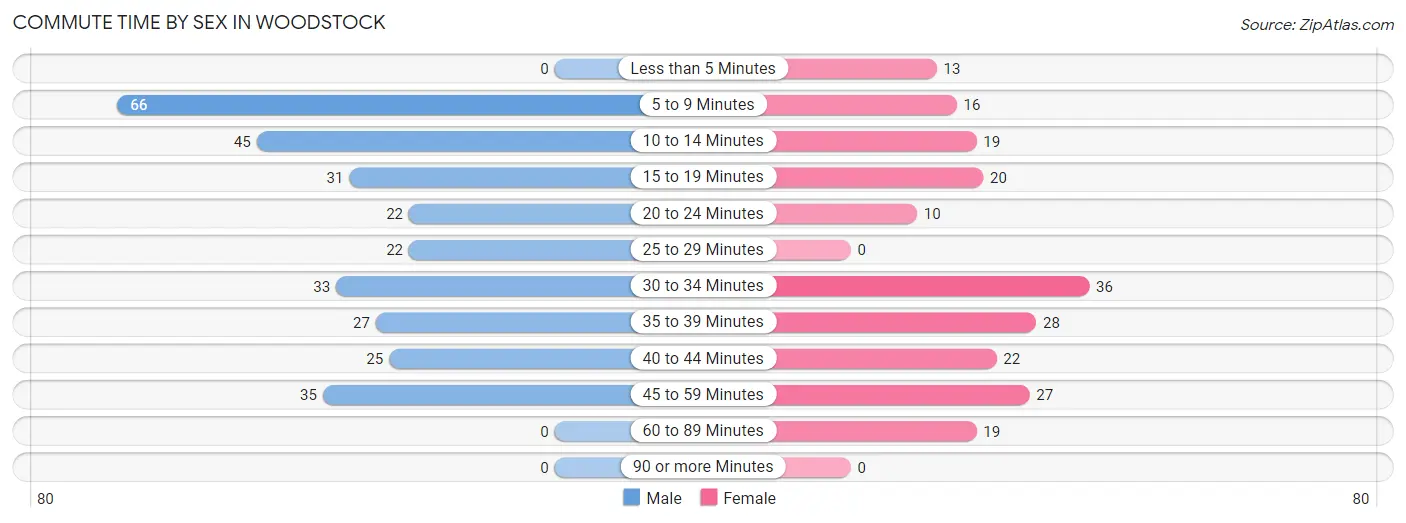
| Commute Time | Male | Female |
| Less than 5 Minutes | 0 (0.0%) | 13 (6.2%) |
| 5 to 9 Minutes | 66 (21.6%) | 16 (7.6%) |
| 10 to 14 Minutes | 45 (14.7%) | 19 (9.0%) |
| 15 to 19 Minutes | 31 (10.1%) | 20 (9.5%) |
| 20 to 24 Minutes | 22 (7.2%) | 10 (4.8%) |
| 25 to 29 Minutes | 22 (7.2%) | 0 (0.0%) |
| 30 to 34 Minutes | 33 (10.8%) | 36 (17.1%) |
| 35 to 39 Minutes | 27 (8.8%) | 28 (13.3%) |
| 40 to 44 Minutes | 25 (8.2%) | 22 (10.5%) |
| 45 to 59 Minutes | 35 (11.4%) | 27 (12.9%) |
| 60 to 89 Minutes | 0 (0.0%) | 19 (9.0%) |
| 90 or more Minutes | 0 (0.0%) | 0 (0.0%) |
Time of Departure to Work by Sex in Woodstock
The most frequent times of departure to work in Woodstock are 5:30 AM to 5:59 AM (69, 22.6%) for males and 8:00 AM to 8:29 AM (63, 30.0%) for females.
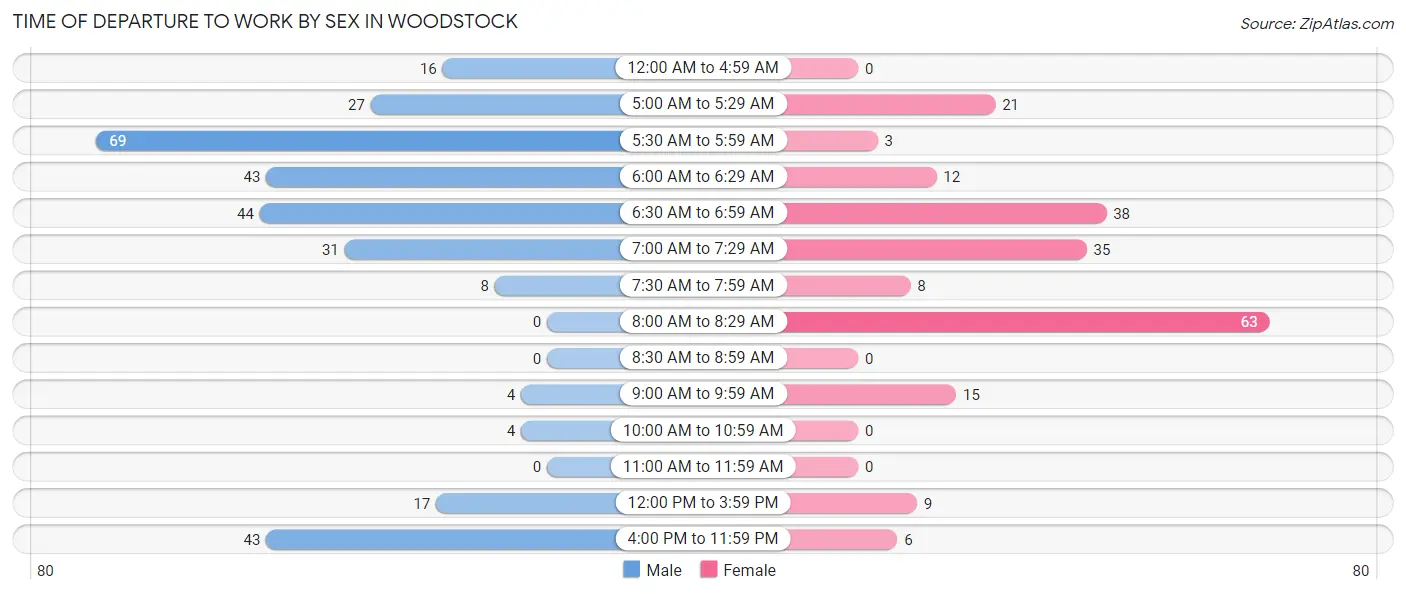
| Time of Departure | Male | Female |
| 12:00 AM to 4:59 AM | 16 (5.2%) | 0 (0.0%) |
| 5:00 AM to 5:29 AM | 27 (8.8%) | 21 (10.0%) |
| 5:30 AM to 5:59 AM | 69 (22.6%) | 3 (1.4%) |
| 6:00 AM to 6:29 AM | 43 (14.1%) | 12 (5.7%) |
| 6:30 AM to 6:59 AM | 44 (14.4%) | 38 (18.1%) |
| 7:00 AM to 7:29 AM | 31 (10.1%) | 35 (16.7%) |
| 7:30 AM to 7:59 AM | 8 (2.6%) | 8 (3.8%) |
| 8:00 AM to 8:29 AM | 0 (0.0%) | 63 (30.0%) |
| 8:30 AM to 8:59 AM | 0 (0.0%) | 0 (0.0%) |
| 9:00 AM to 9:59 AM | 4 (1.3%) | 15 (7.1%) |
| 10:00 AM to 10:59 AM | 4 (1.3%) | 0 (0.0%) |
| 11:00 AM to 11:59 AM | 0 (0.0%) | 0 (0.0%) |
| 12:00 PM to 3:59 PM | 17 (5.6%) | 9 (4.3%) |
| 4:00 PM to 11:59 PM | 43 (14.1%) | 6 (2.9%) |
| Total | 306 (100.0%) | 210 (100.0%) |
Housing Occupancy in Woodstock
Occupancy by Ownership in Woodstock
Of the total 385 dwellings in Woodstock, owner-occupied units account for 339 (88.0%), while renter-occupied units make up 46 (11.9%).
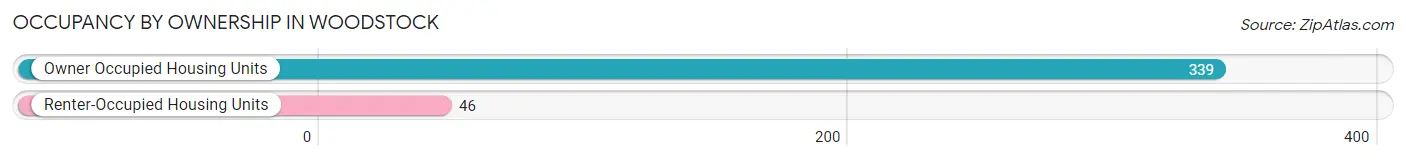
| Occupancy | # Housing Units | % Housing Units |
| Owner Occupied Housing Units | 339 | 88.0% |
| Renter-Occupied Housing Units | 46 | 11.9% |
| Total Occupied Housing Units | 385 | 100.0% |
Occupancy by Household Size in Woodstock
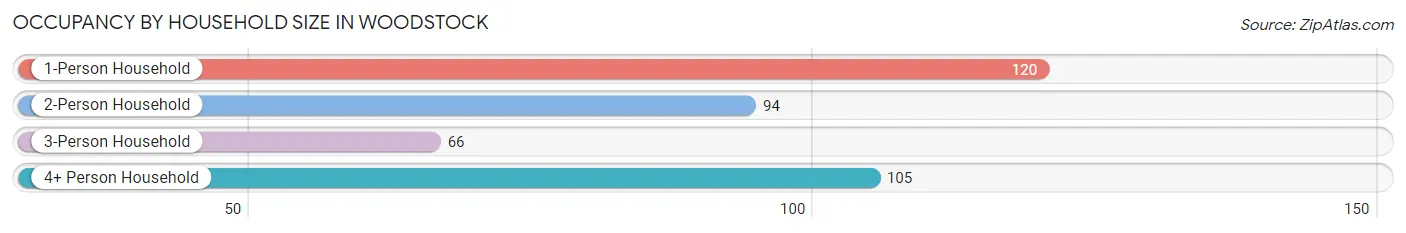
| Household Size | # Housing Units | % Housing Units |
| 1-Person Household | 120 | 31.2% |
| 2-Person Household | 94 | 24.4% |
| 3-Person Household | 66 | 17.1% |
| 4+ Person Household | 105 | 27.3% |
| Total Housing Units | 385 | 100.0% |
Occupancy by Ownership by Household Size in Woodstock
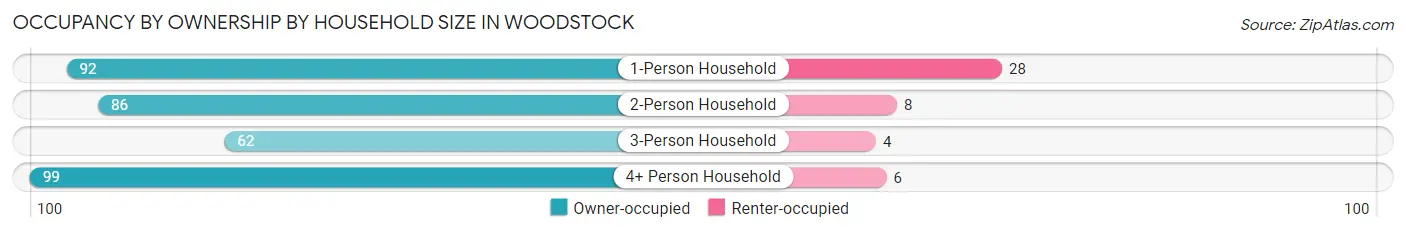
| Household Size | Owner-occupied | Renter-occupied |
| 1-Person Household | 92 (76.7%) | 28 (23.3%) |
| 2-Person Household | 86 (91.5%) | 8 (8.5%) |
| 3-Person Household | 62 (93.9%) | 4 (6.1%) |
| 4+ Person Household | 99 (94.3%) | 6 (5.7%) |
| Total Housing Units | 339 (88.0%) | 46 (11.9%) |
Occupancy by Educational Attainment in Woodstock
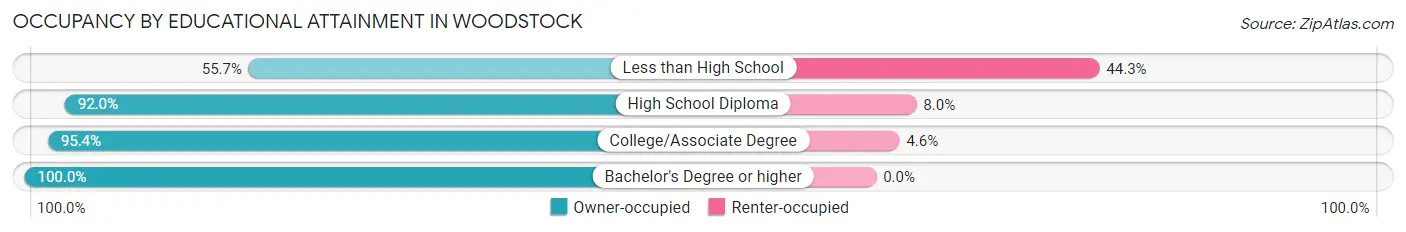
| Household Size | Owner-occupied | Renter-occupied |
| Less than High School | 34 (55.7%) | 27 (44.3%) |
| High School Diploma | 150 (92.0%) | 13 (8.0%) |
| College/Associate Degree | 124 (95.4%) | 6 (4.6%) |
| Bachelor's Degree or higher | 31 (100.0%) | 0 (0.0%) |
Occupancy by Age of Householder in Woodstock
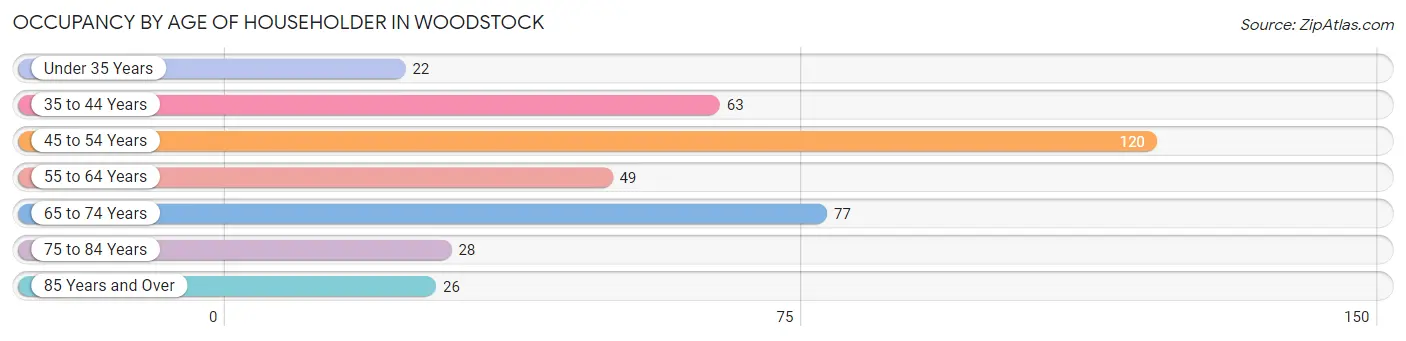
| Age Bracket | # Households | % Households |
| Under 35 Years | 22 | 5.7% |
| 35 to 44 Years | 63 | 16.4% |
| 45 to 54 Years | 120 | 31.2% |
| 55 to 64 Years | 49 | 12.7% |
| 65 to 74 Years | 77 | 20.0% |
| 75 to 84 Years | 28 | 7.3% |
| 85 Years and Over | 26 | 6.8% |
| Total | 385 | 100.0% |
Housing Finances in Woodstock
Median Income by Occupancy in Woodstock
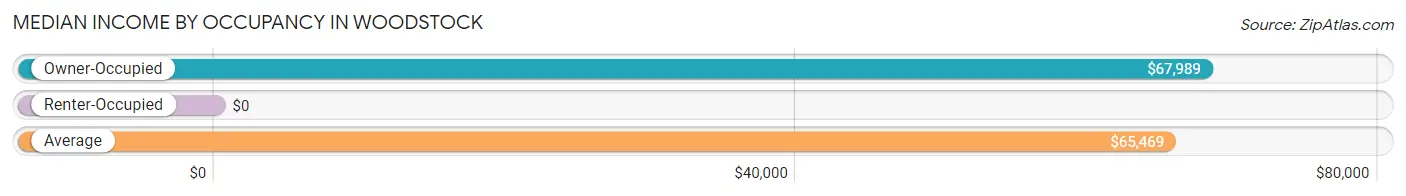
| Occupancy Type | # Households | Median Income |
| Owner-Occupied | 339 (88.0%) | $67,989 |
| Renter-Occupied | 46 (11.9%) | $0 |
| Average | 385 (100.0%) | $65,469 |
Occupancy by Householder Income Bracket in Woodstock
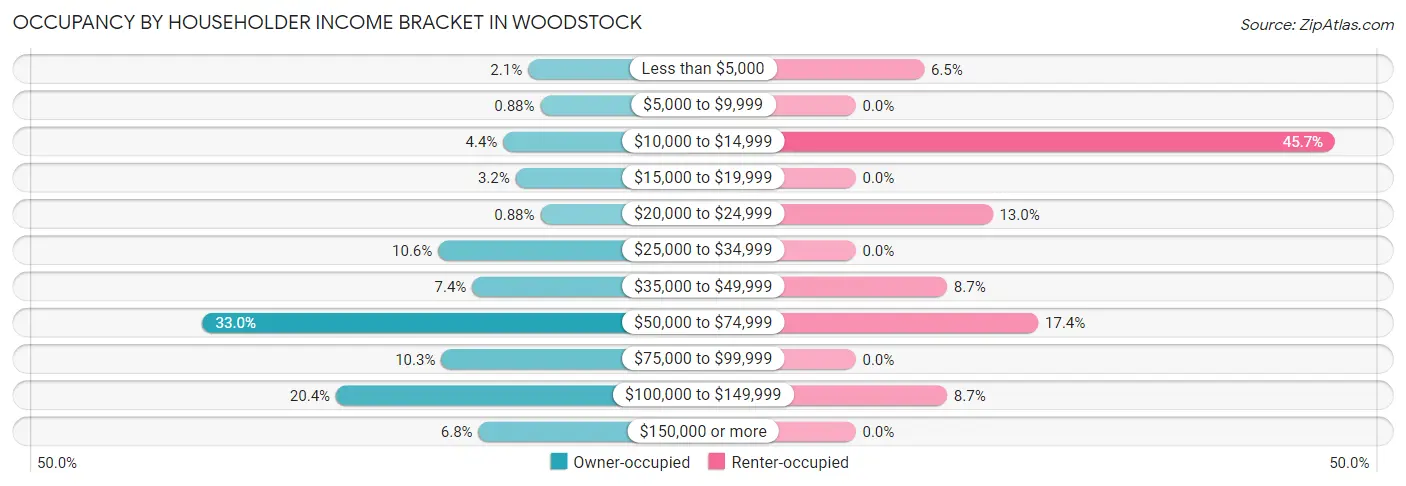
| Income Bracket | Owner-occupied | Renter-occupied |
| Less than $5,000 | 7 (2.1%) | 3 (6.5%) |
| $5,000 to $9,999 | 3 (0.9%) | 0 (0.0%) |
| $10,000 to $14,999 | 15 (4.4%) | 21 (45.7%) |
| $15,000 to $19,999 | 11 (3.2%) | 0 (0.0%) |
| $20,000 to $24,999 | 3 (0.9%) | 6 (13.0%) |
| $25,000 to $34,999 | 36 (10.6%) | 0 (0.0%) |
| $35,000 to $49,999 | 25 (7.4%) | 4 (8.7%) |
| $50,000 to $74,999 | 112 (33.0%) | 8 (17.4%) |
| $75,000 to $99,999 | 35 (10.3%) | 0 (0.0%) |
| $100,000 to $149,999 | 69 (20.3%) | 4 (8.7%) |
| $150,000 or more | 23 (6.8%) | 0 (0.0%) |
| Total | 339 (100.0%) | 46 (100.0%) |
Monthly Housing Cost Tiers in Woodstock
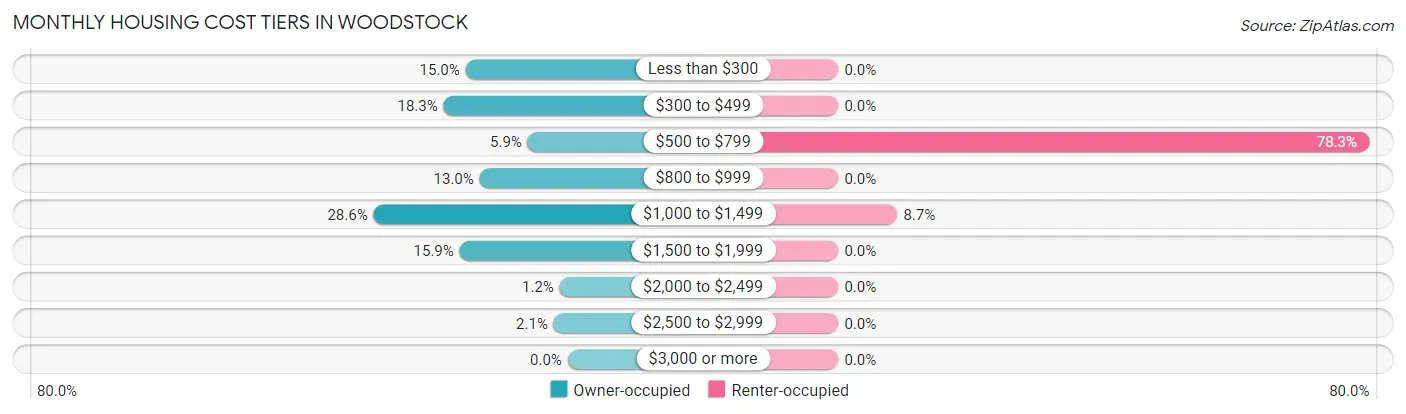
| Monthly Cost | Owner-occupied | Renter-occupied |
| Less than $300 | 51 (15.0%) | 0 (0.0%) |
| $300 to $499 | 62 (18.3%) | 0 (0.0%) |
| $500 to $799 | 20 (5.9%) | 36 (78.3%) |
| $800 to $999 | 44 (13.0%) | 0 (0.0%) |
| $1,000 to $1,499 | 97 (28.6%) | 4 (8.7%) |
| $1,500 to $1,999 | 54 (15.9%) | 0 (0.0%) |
| $2,000 to $2,499 | 4 (1.2%) | 0 (0.0%) |
| $2,500 to $2,999 | 7 (2.1%) | 0 (0.0%) |
| $3,000 or more | 0 (0.0%) | 0 (0.0%) |
| Total | 339 (100.0%) | 46 (100.0%) |
Physical Housing Characteristics in Woodstock
Housing Structures in Woodstock
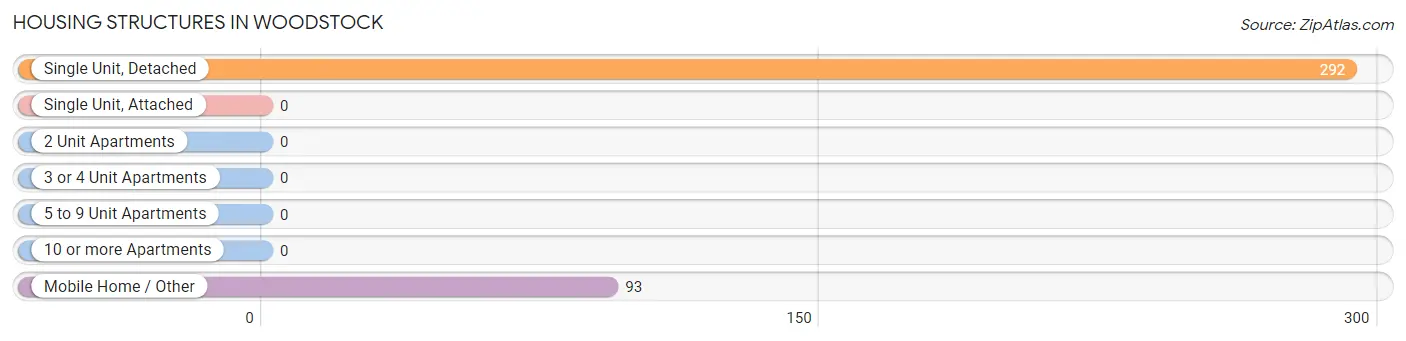
| Structure Type | # Housing Units | % Housing Units |
| Single Unit, Detached | 292 | 75.8% |
| Single Unit, Attached | 0 | 0.0% |
| 2 Unit Apartments | 0 | 0.0% |
| 3 or 4 Unit Apartments | 0 | 0.0% |
| 5 to 9 Unit Apartments | 0 | 0.0% |
| 10 or more Apartments | 0 | 0.0% |
| Mobile Home / Other | 93 | 24.2% |
| Total | 385 | 100.0% |
Housing Structures by Occupancy in Woodstock
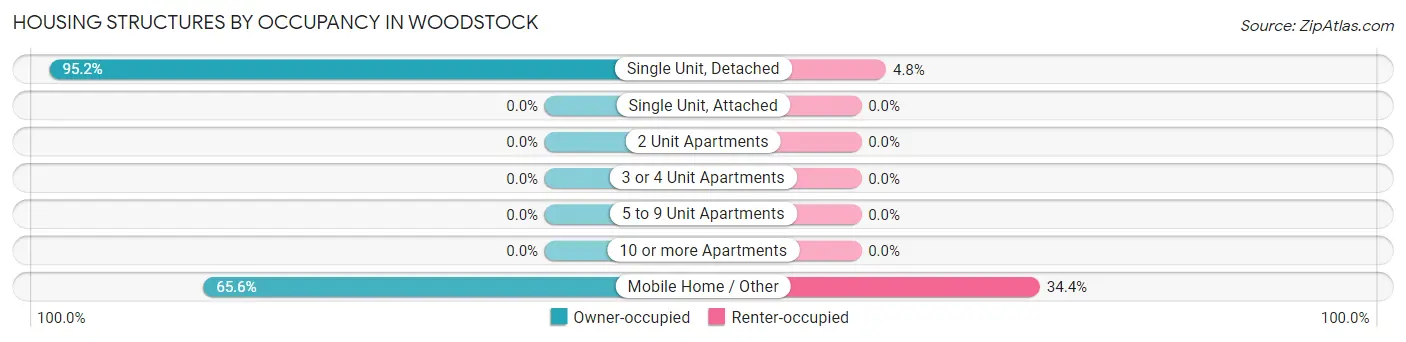
| Structure Type | Owner-occupied | Renter-occupied |
| Single Unit, Detached | 278 (95.2%) | 14 (4.8%) |
| Single Unit, Attached | 0 (0.0%) | 0 (0.0%) |
| 2 Unit Apartments | 0 (0.0%) | 0 (0.0%) |
| 3 or 4 Unit Apartments | 0 (0.0%) | 0 (0.0%) |
| 5 to 9 Unit Apartments | 0 (0.0%) | 0 (0.0%) |
| 10 or more Apartments | 0 (0.0%) | 0 (0.0%) |
| Mobile Home / Other | 61 (65.6%) | 32 (34.4%) |
| Total | 339 (88.0%) | 46 (11.9%) |
Housing Structures by Number of Rooms in Woodstock
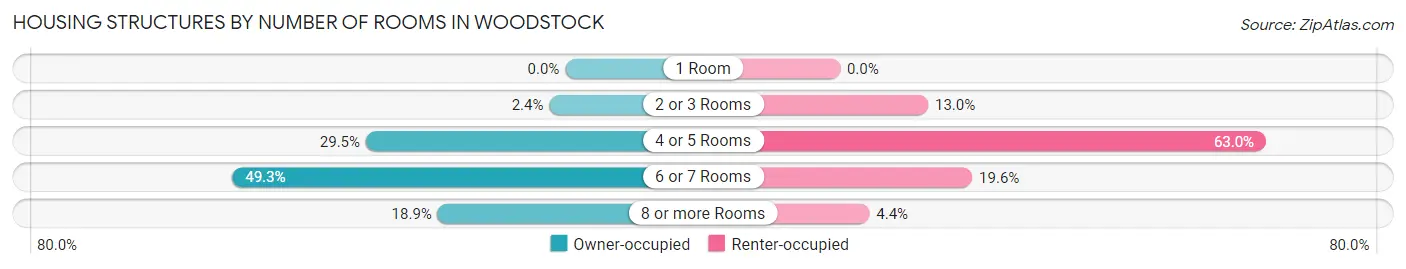
| Number of Rooms | Owner-occupied | Renter-occupied |
| 1 Room | 0 (0.0%) | 0 (0.0%) |
| 2 or 3 Rooms | 8 (2.4%) | 6 (13.0%) |
| 4 or 5 Rooms | 100 (29.5%) | 29 (63.0%) |
| 6 or 7 Rooms | 167 (49.3%) | 9 (19.6%) |
| 8 or more Rooms | 64 (18.9%) | 2 (4.3%) |
| Total | 339 (100.0%) | 46 (100.0%) |
Housing Structure by Heating Type in Woodstock
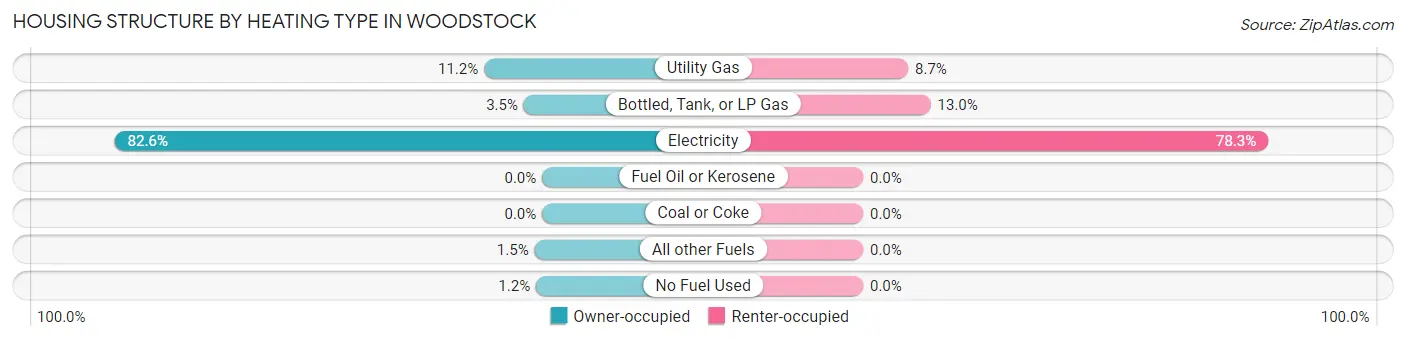
| Heating Type | Owner-occupied | Renter-occupied |
| Utility Gas | 38 (11.2%) | 4 (8.7%) |
| Bottled, Tank, or LP Gas | 12 (3.5%) | 6 (13.0%) |
| Electricity | 280 (82.6%) | 36 (78.3%) |
| Fuel Oil or Kerosene | 0 (0.0%) | 0 (0.0%) |
| Coal or Coke | 0 (0.0%) | 0 (0.0%) |
| All other Fuels | 5 (1.5%) | 0 (0.0%) |
| No Fuel Used | 4 (1.2%) | 0 (0.0%) |
| Total | 339 (100.0%) | 46 (100.0%) |
Household Vehicle Usage in Woodstock
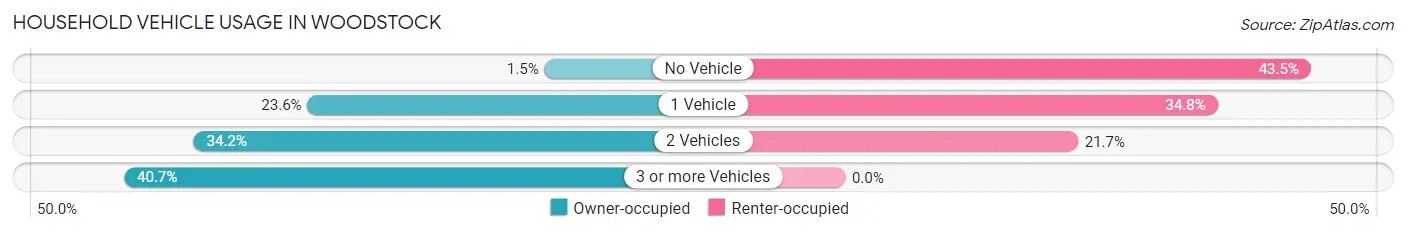
| Vehicles per Household | Owner-occupied | Renter-occupied |
| No Vehicle | 5 (1.5%) | 20 (43.5%) |
| 1 Vehicle | 80 (23.6%) | 16 (34.8%) |
| 2 Vehicles | 116 (34.2%) | 10 (21.7%) |
| 3 or more Vehicles | 138 (40.7%) | 0 (0.0%) |
| Total | 339 (100.0%) | 46 (100.0%) |
Real Estate & Mortgages in Woodstock
Real Estate and Mortgage Overview in Woodstock
| Characteristic | Without Mortgage | With Mortgage |
| Housing Units | 134 | 205 |
| Median Property Value | $125,000 | $175,700 |
| Median Household Income | $67,500 | $23 |
| Monthly Housing Costs | $363 | $0 |
| Real Estate Taxes | $325 | $10 |
Property Value by Mortgage Status in Woodstock
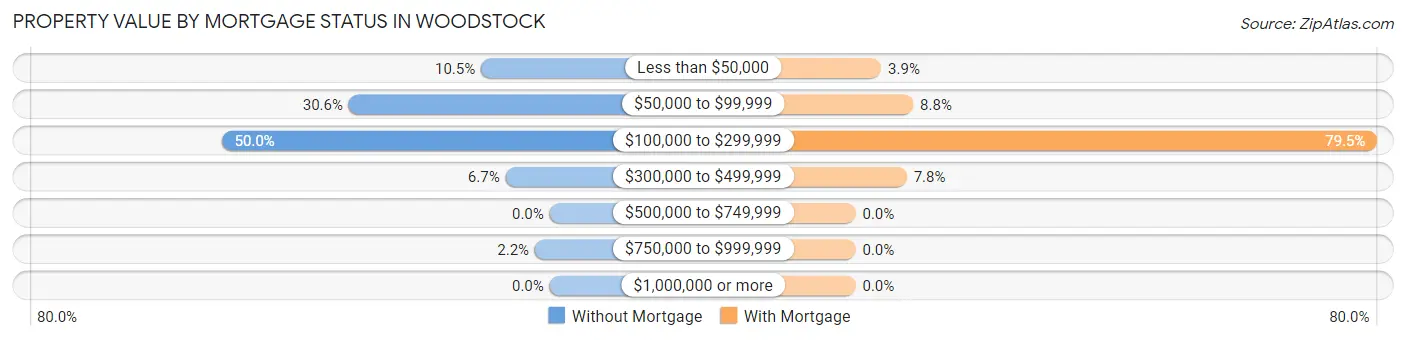
| Property Value | Without Mortgage | With Mortgage |
| Less than $50,000 | 14 (10.4%) | 8 (3.9%) |
| $50,000 to $99,999 | 41 (30.6%) | 18 (8.8%) |
| $100,000 to $299,999 | 67 (50.0%) | 163 (79.5%) |
| $300,000 to $499,999 | 9 (6.7%) | 16 (7.8%) |
| $500,000 to $749,999 | 0 (0.0%) | 0 (0.0%) |
| $750,000 to $999,999 | 3 (2.2%) | 0 (0.0%) |
| $1,000,000 or more | 0 (0.0%) | 0 (0.0%) |
| Total | 134 (100.0%) | 205 (100.0%) |
Household Income by Mortgage Status in Woodstock
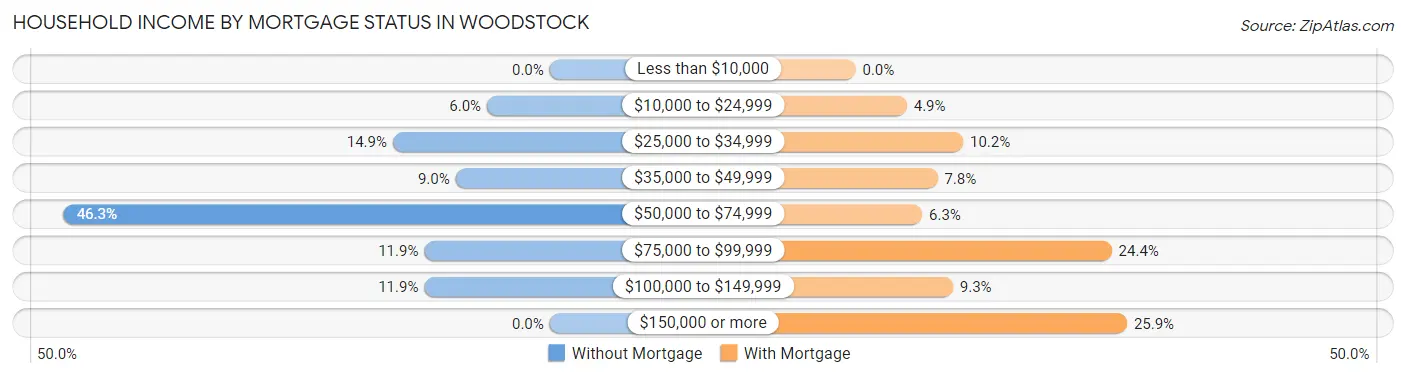
| Household Income | Without Mortgage | With Mortgage |
| Less than $10,000 | 0 (0.0%) | 0 (0.0%) |
| $10,000 to $24,999 | 8 (6.0%) | 10 (4.9%) |
| $25,000 to $34,999 | 20 (14.9%) | 21 (10.2%) |
| $35,000 to $49,999 | 12 (9.0%) | 16 (7.8%) |
| $50,000 to $74,999 | 62 (46.3%) | 13 (6.3%) |
| $75,000 to $99,999 | 16 (11.9%) | 50 (24.4%) |
| $100,000 to $149,999 | 16 (11.9%) | 19 (9.3%) |
| $150,000 or more | 0 (0.0%) | 53 (25.9%) |
| Total | 134 (100.0%) | 205 (100.0%) |
Property Value to Household Income Ratio in Woodstock
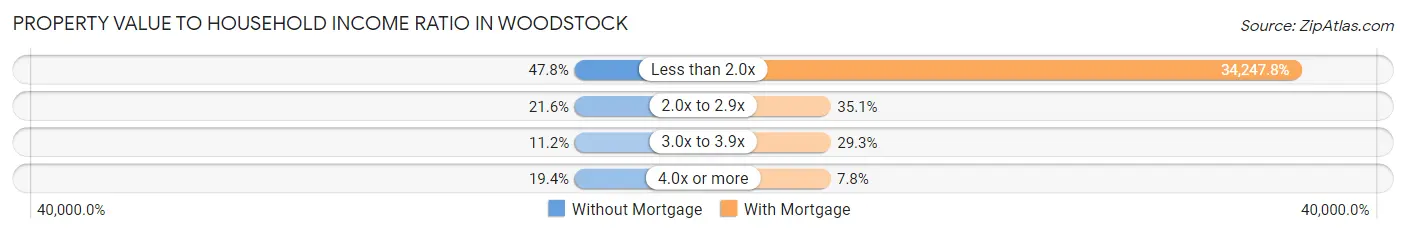
| Value-to-Income Ratio | Without Mortgage | With Mortgage |
| Less than 2.0x | 64 (47.8%) | 70,208 (34,247.8%) |
| 2.0x to 2.9x | 29 (21.6%) | 72 (35.1%) |
| 3.0x to 3.9x | 15 (11.2%) | 60 (29.3%) |
| 4.0x or more | 26 (19.4%) | 16 (7.8%) |
| Total | 134 (100.0%) | 205 (100.0%) |
Real Estate Taxes by Mortgage Status in Woodstock
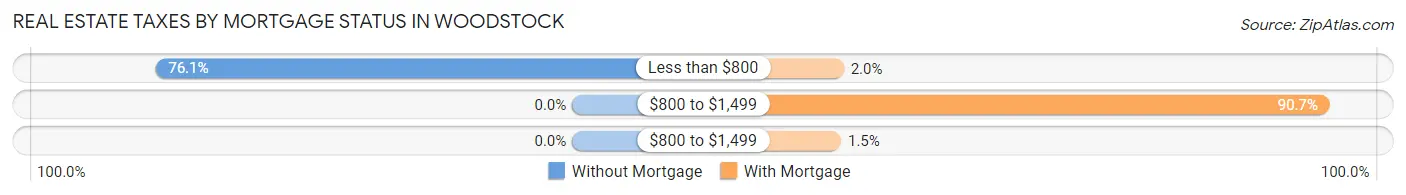
| Property Taxes | Without Mortgage | With Mortgage |
| Less than $800 | 102 (76.1%) | 4 (1.9%) |
| $800 to $1,499 | 0 (0.0%) | 186 (90.7%) |
| $800 to $1,499 | 0 (0.0%) | 3 (1.5%) |
| Total | 134 (100.0%) | 205 (100.0%) |
Health & Disability in Woodstock
Health Insurance Coverage by Age in Woodstock
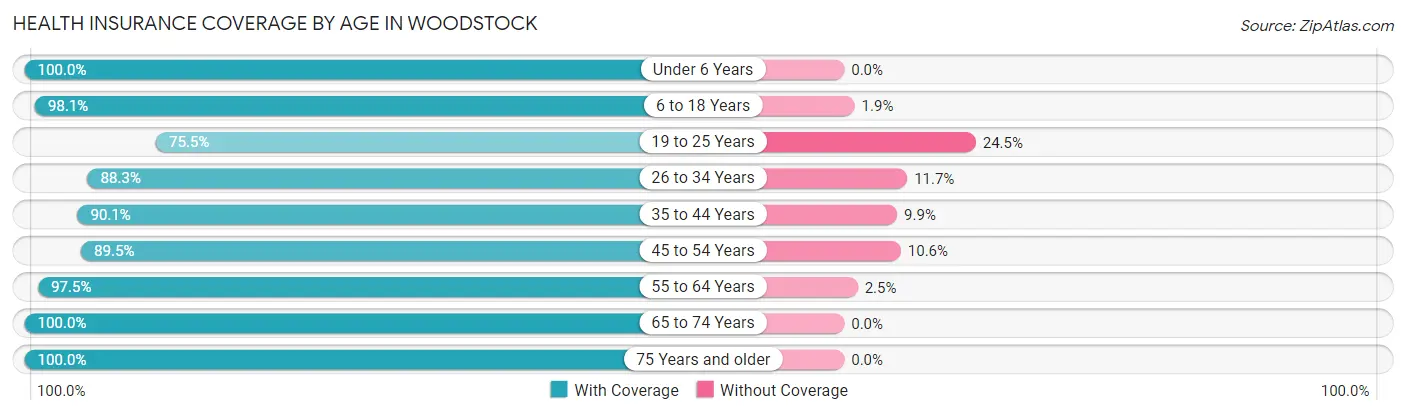
| Age Bracket | With Coverage | Without Coverage |
| Under 6 Years | 125 (100.0%) | 0 (0.0%) |
| 6 to 18 Years | 254 (98.1%) | 5 (1.9%) |
| 19 to 25 Years | 117 (75.5%) | 38 (24.5%) |
| 26 to 34 Years | 143 (88.3%) | 19 (11.7%) |
| 35 to 44 Years | 128 (90.1%) | 14 (9.9%) |
| 45 to 54 Years | 195 (89.4%) | 23 (10.5%) |
| 55 to 64 Years | 117 (97.5%) | 3 (2.5%) |
| 65 to 74 Years | 117 (100.0%) | 0 (0.0%) |
| 75 Years and older | 93 (100.0%) | 0 (0.0%) |
| Total | 1,289 (92.7%) | 102 (7.3%) |
Health Insurance Coverage by Citizenship Status in Woodstock
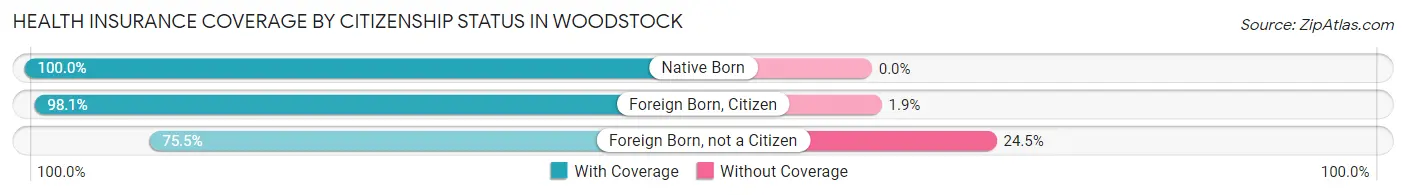
| Citizenship Status | With Coverage | Without Coverage |
| Native Born | 125 (100.0%) | 0 (0.0%) |
| Foreign Born, Citizen | 254 (98.1%) | 5 (1.9%) |
| Foreign Born, not a Citizen | 117 (75.5%) | 38 (24.5%) |
Health Insurance Coverage by Household Income in Woodstock
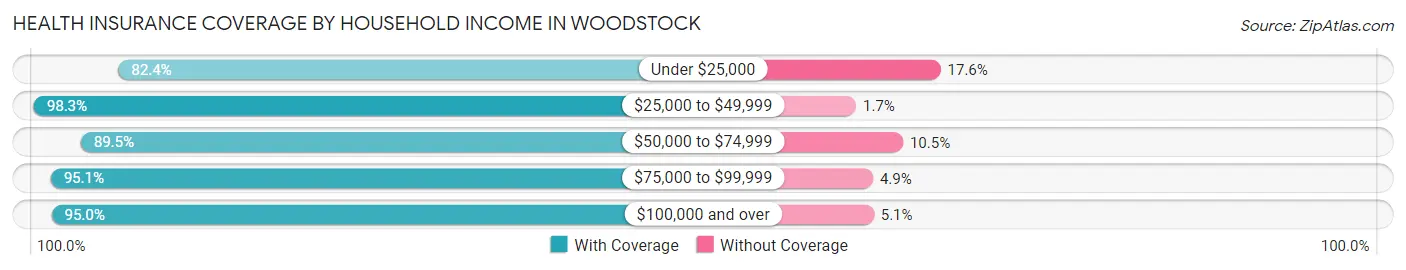
| Household Income | With Coverage | Without Coverage |
| Under $25,000 | 75 (82.4%) | 16 (17.6%) |
| $25,000 to $49,999 | 226 (98.3%) | 4 (1.7%) |
| $50,000 to $74,999 | 459 (89.5%) | 54 (10.5%) |
| $75,000 to $99,999 | 97 (95.1%) | 5 (4.9%) |
| $100,000 and over | 432 (95.0%) | 23 (5.1%) |
Public vs Private Health Insurance Coverage by Age in Woodstock
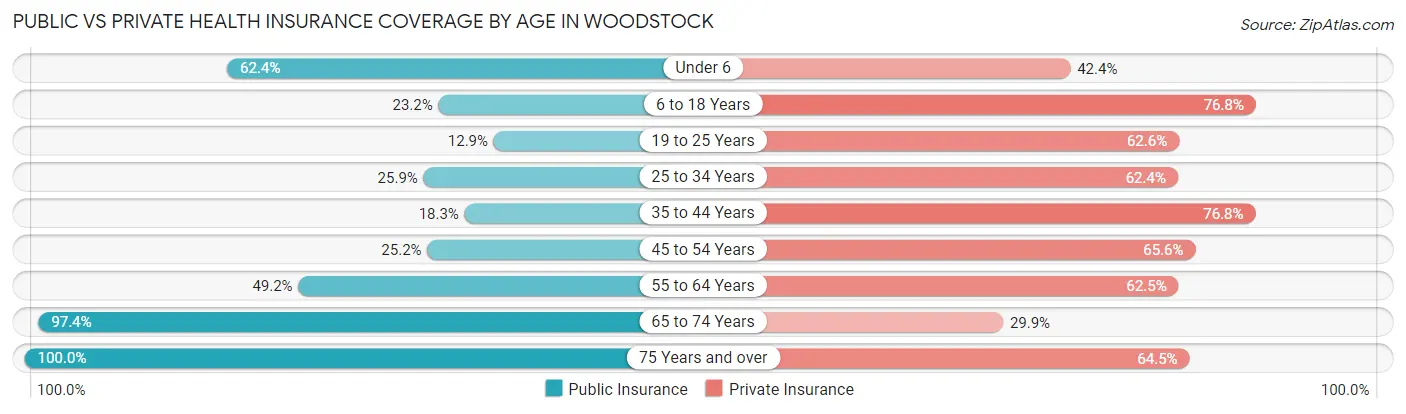
| Age Bracket | Public Insurance | Private Insurance |
| Under 6 | 78 (62.4%) | 53 (42.4%) |
| 6 to 18 Years | 60 (23.2%) | 199 (76.8%) |
| 19 to 25 Years | 20 (12.9%) | 97 (62.6%) |
| 25 to 34 Years | 42 (25.9%) | 101 (62.4%) |
| 35 to 44 Years | 26 (18.3%) | 109 (76.8%) |
| 45 to 54 Years | 55 (25.2%) | 143 (65.6%) |
| 55 to 64 Years | 59 (49.2%) | 75 (62.5%) |
| 65 to 74 Years | 114 (97.4%) | 35 (29.9%) |
| 75 Years and over | 93 (100.0%) | 60 (64.5%) |
| Total | 547 (39.3%) | 872 (62.7%) |
Disability Status by Sex by Age in Woodstock
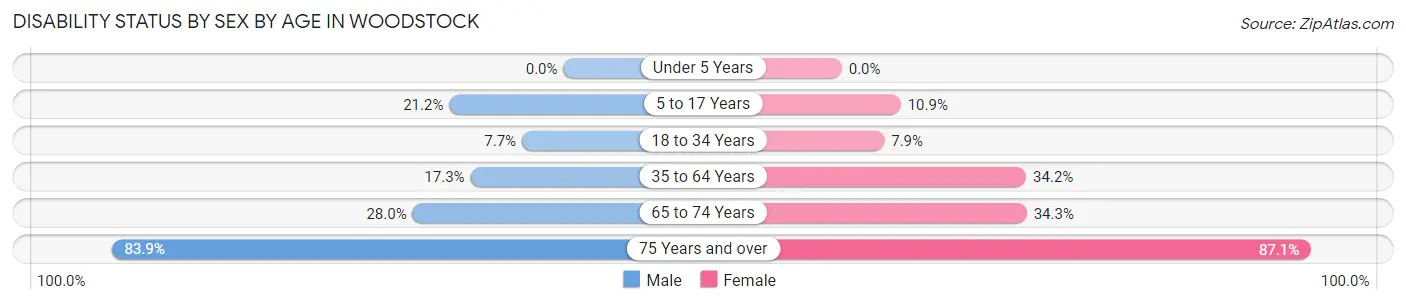
| Age Bracket | Male | Female |
| Under 5 Years | 0 (0.0%) | 0 (0.0%) |
| 5 to 17 Years | 18 (21.2%) | 21 (10.9%) |
| 18 to 34 Years | 13 (7.7%) | 12 (7.9%) |
| 35 to 64 Years | 44 (17.2%) | 77 (34.2%) |
| 65 to 74 Years | 14 (28.0%) | 23 (34.3%) |
| 75 Years and over | 26 (83.9%) | 54 (87.1%) |
Disability Class by Sex by Age in Woodstock
Disability Class: Hearing Difficulty
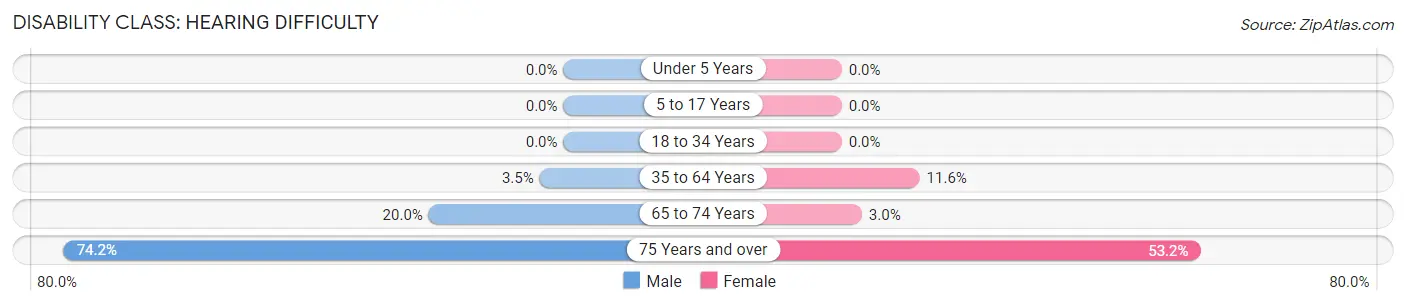
| Age Bracket | Male | Female |
| Under 5 Years | 0 (0.0%) | 0 (0.0%) |
| 5 to 17 Years | 0 (0.0%) | 0 (0.0%) |
| 18 to 34 Years | 0 (0.0%) | 0 (0.0%) |
| 35 to 64 Years | 9 (3.5%) | 26 (11.6%) |
| 65 to 74 Years | 10 (20.0%) | 2 (3.0%) |
| 75 Years and over | 23 (74.2%) | 33 (53.2%) |
Disability Class: Vision Difficulty
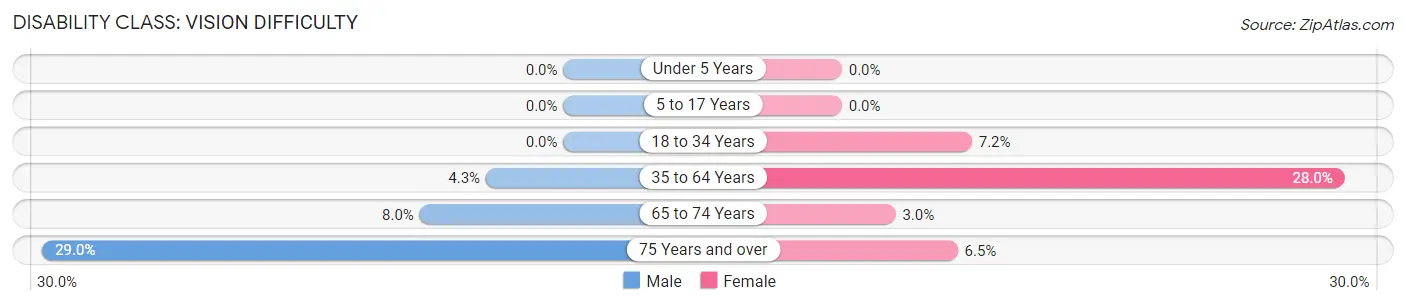
| Age Bracket | Male | Female |
| Under 5 Years | 0 (0.0%) | 0 (0.0%) |
| 5 to 17 Years | 0 (0.0%) | 0 (0.0%) |
| 18 to 34 Years | 0 (0.0%) | 11 (7.2%) |
| 35 to 64 Years | 11 (4.3%) | 63 (28.0%) |
| 65 to 74 Years | 4 (8.0%) | 2 (3.0%) |
| 75 Years and over | 9 (29.0%) | 4 (6.5%) |
Disability Class: Cognitive Difficulty
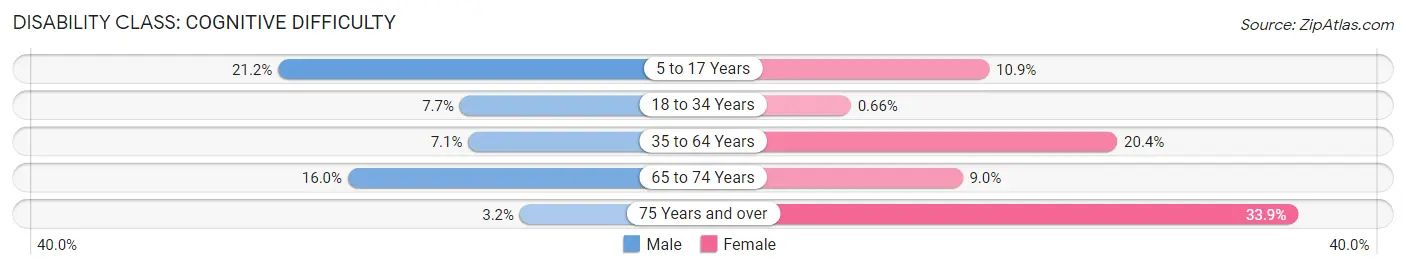
| Age Bracket | Male | Female |
| 5 to 17 Years | 18 (21.2%) | 21 (10.9%) |
| 18 to 34 Years | 13 (7.7%) | 1 (0.7%) |
| 35 to 64 Years | 18 (7.1%) | 46 (20.4%) |
| 65 to 74 Years | 8 (16.0%) | 6 (9.0%) |
| 75 Years and over | 1 (3.2%) | 21 (33.9%) |
Disability Class: Ambulatory Difficulty
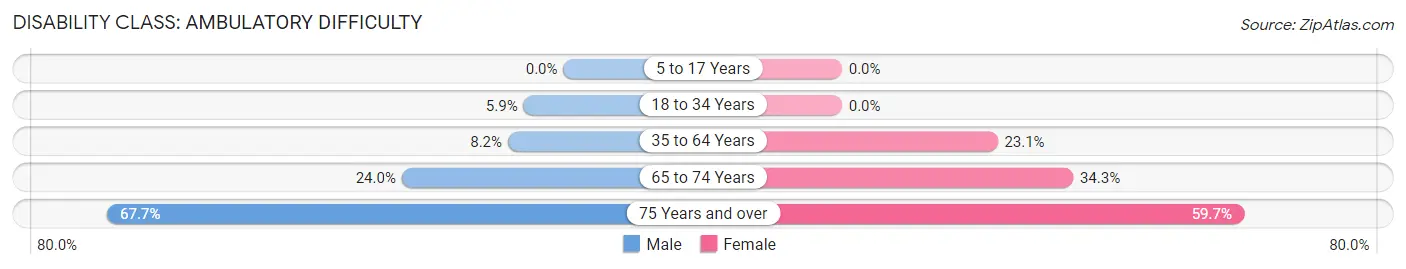
| Age Bracket | Male | Female |
| 5 to 17 Years | 0 (0.0%) | 0 (0.0%) |
| 18 to 34 Years | 10 (5.9%) | 0 (0.0%) |
| 35 to 64 Years | 21 (8.2%) | 52 (23.1%) |
| 65 to 74 Years | 12 (24.0%) | 23 (34.3%) |
| 75 Years and over | 21 (67.7%) | 37 (59.7%) |
Disability Class: Self-Care Difficulty
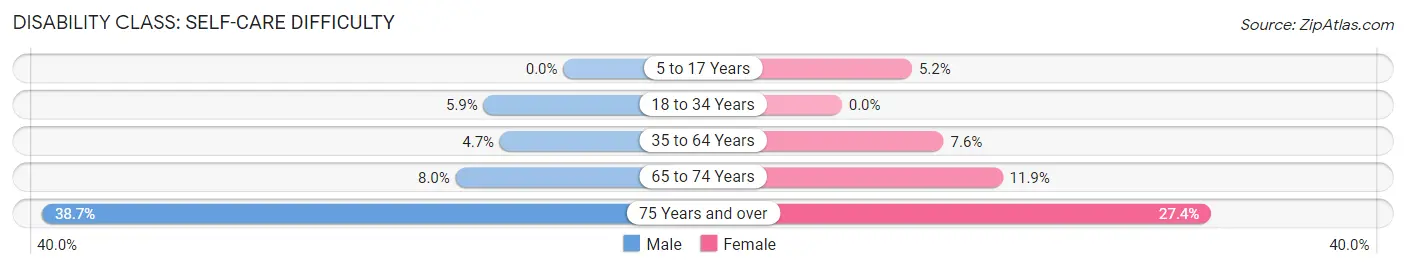
| Age Bracket | Male | Female |
| 5 to 17 Years | 0 (0.0%) | 10 (5.2%) |
| 18 to 34 Years | 10 (5.9%) | 0 (0.0%) |
| 35 to 64 Years | 12 (4.7%) | 17 (7.6%) |
| 65 to 74 Years | 4 (8.0%) | 8 (11.9%) |
| 75 Years and over | 12 (38.7%) | 17 (27.4%) |
Technology Access in Woodstock
Computing Device Access in Woodstock
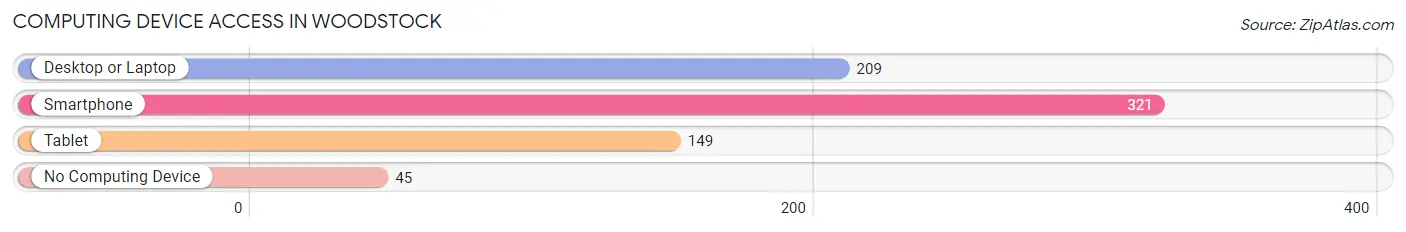
| Device Type | # Households | % Households |
| Desktop or Laptop | 209 | 54.3% |
| Smartphone | 321 | 83.4% |
| Tablet | 149 | 38.7% |
| No Computing Device | 45 | 11.7% |
| Total | 385 | 100.0% |
Internet Access in Woodstock
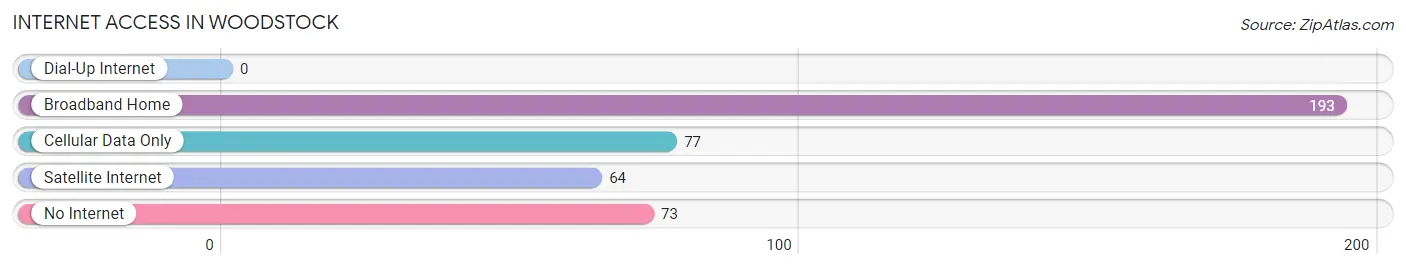
| Internet Type | # Households | % Households |
| Dial-Up Internet | 0 | 0.0% |
| Broadband Home | 193 | 50.1% |
| Cellular Data Only | 77 | 20.0% |
| Satellite Internet | 64 | 16.6% |
| No Internet | 73 | 19.0% |
| Total | 385 | 100.0% |
Woodstock Summary
Stockwood is a small town located in the state of Alabama, in the United States. It is situated in the northwest corner of the state, in the foothills of the Appalachian Mountains. The town is located in the county of Cherokee, and is part of the Gadsden-Anniston-Oxford Metropolitan Statistical Area. The population of Stockwood was estimated to be 1,845 in the year 2020.
History
Stockwood was founded in 1818 by a group of settlers from North Carolina. The town was named after the nearby Stockwood Creek, which was named after a local Native American tribe. The town was originally a farming community, and the main crops grown were corn, cotton, and tobacco. The town was also known for its iron ore deposits, which were mined and used to make tools and weapons.
In the late 19th century, Stockwood began to experience a period of growth and development. The town was incorporated in 1891, and the first mayor was elected in 1892. The town was connected to the rest of the state by the Alabama Great Southern Railroad in 1895. This allowed for the transportation of goods and people to and from Stockwood.
In the early 20th century, Stockwood experienced a period of decline. The Great Depression caused many of the town’s businesses to close, and the population decreased. However, the town was able to recover in the 1950s and 1960s, when the economy began to improve.
Geography
Stockwood is located in the northwest corner of Alabama, in the foothills of the Appalachian Mountains. The town is situated in the county of Cherokee, and is part of the Gadsden-Anniston-Oxford Metropolitan Statistical Area. The town is located at an elevation of 845 feet above sea level.
The town is located in a hilly region, and the terrain is mostly forested. The town is located near the Coosa River, which is a major tributary of the Alabama River. The town is also located near the Little River, which is a tributary of the Coosa River.
Economy
The economy of Stockwood is largely based on agriculture and manufacturing. The town is home to several farms, which produce corn, cotton, and tobacco. The town is also home to several manufacturing companies, which produce a variety of products, including furniture, clothing, and automotive parts.
The town is also home to several retail stores, which sell a variety of goods, including clothing, electronics, and home goods. The town is also home to several restaurants, which serve a variety of cuisines.
Demographics
The population of Stockwood was estimated to be 1,845 in the year 2020. The town has a population that is predominantly white, with a small percentage of African Americans and Hispanics. The median household income in the town is $37,000, and the median age is 38.
The town is served by the Stockwood Public School System, which consists of three elementary schools, one middle school, and one high school. The town is also home to several churches, which serve the religious needs of the community.
Conclusion
Stockwood is a small town located in the northwest corner of Alabama, in the foothills of the Appalachian Mountains. The town was founded in 1818, and has a population of 1,845. The town is largely based on agriculture and manufacturing, and is served by the Stockwood Public School System. The town is also home to several churches, which serve the religious needs of the community.
Common Questions
What is the Total Population of Woodstock?
Total Population of Woodstock is 1,391.
What is the Total Male Population of Woodstock?
Total Male Population of Woodstock is 655.
What is the Total Female Population of Woodstock?
Total Female Population of Woodstock is 736.
What is the Ratio of Males per 100 Females in Woodstock?
There are 88.99 Males per 100 Females in Woodstock.
What is the Ratio of Females per 100 Males in Woodstock?
There are 112.37 Females per 100 Males in Woodstock.
What is the Median Population Age in Woodstock?
Median Population Age in Woodstock is 34.9 Years.
What is the Average Family Size in Woodstock
Average Family Size in Woodstock is 4.7 People.
What is the Average Household Size in Woodstock
Average Household Size in Woodstock is 3.6 People.
What is Per Capita Income in Woodstock?
Per Capita income in Woodstock is $22,539.
What is the Median Family Income in Woodstock?
Median Family Income in Woodstock is $70,769.
What is the Median Household income in Woodstock?
Median Household Income in Woodstock is $65,469.
What is Income or Wage Gap in Woodstock?
Income or Wage Gap in Woodstock is 49.3%.
Women in Woodstock earn 50.7 cents for every dollar earned by a man.
What is Inequality or Gini Index in Woodstock?
Inequality or Gini Index in Woodstock is 0.37.
How Large is the Labor Force in Woodstock?
There are 617 People in the Labor Forcein in Woodstock.
What is the Percentage of People in the Labor Force in Woodstock?
59.7% of People are in the Labor Force in Woodstock.
What is the Unemployment Rate in Woodstock?
Unemployment Rate in Woodstock is 13.3%.