Warrior, AL Map & Demographics
Warrior Map
Warrior Overview
$24,645
PER CAPITA INCOME
$69,907
AVG FAMILY INCOME
$53,258
AVG HOUSEHOLD INCOME
58.7%
WAGE / INCOME GAP [ % ]
41.3¢/ $1
WAGE / INCOME GAP [ $ ]
$6,502
FAMILY INCOME DEFICIT
0.39
INEQUALITY / GINI INDEX
3,206
TOTAL POPULATION
1,540
MALE POPULATION
1,666
FEMALE POPULATION
92.44
MALES / 100 FEMALES
108.18
FEMALES / 100 MALES
49.7
MEDIAN AGE
3.1
AVG FAMILY SIZE
2.4
AVG HOUSEHOLD SIZE
1,028
LABOR FORCE [ PEOPLE ]
34.1%
PERCENT IN LABOR FORCE
9.0%
UNEMPLOYMENT RATE
Warrior Zip Codes
Warrior Area Codes
Income in Warrior
Income Overview in Warrior
Per Capita Income in Warrior is $24,645, while median incomes of families and households are $69,907 and $53,258 respectively.
| Characteristic | Number | Measure |
| Per Capita Income | 3,206 | $24,645 |
| Median Family Income | 824 | $69,907 |
| Mean Family Income | 824 | $68,615 |
| Median Household Income | 1,336 | $53,258 |
| Mean Household Income | 1,336 | $57,544 |
| Income Deficit | 824 | $6,502 |
| Wage / Income Gap (%) | 3,206 | 58.72% |
| Wage / Income Gap ($) | 3,206 | 41.28¢ per $1 |
| Gini / Inequality Index | 3,206 | 0.39 |
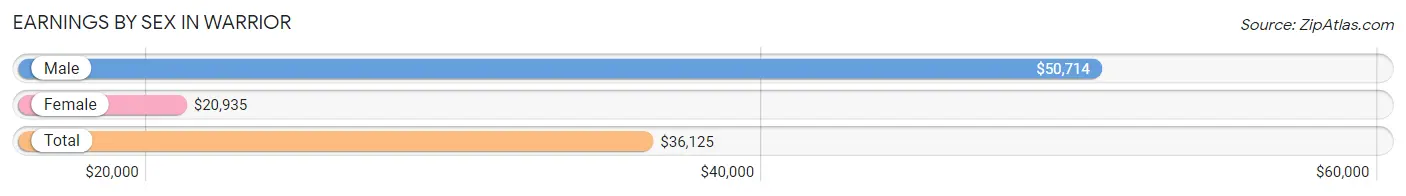
Earnings by Sex in Warrior
Average Earnings in Warrior are $36,125, $50,714 for men and $20,935 for women, a difference of 58.7%.
| Sex | Number | Average Earnings |
| Male | 558 (48.9%) | $50,714 |
| Female | 584 (51.1%) | $20,935 |
| Total | 1,142 (100.0%) | $36,125 |
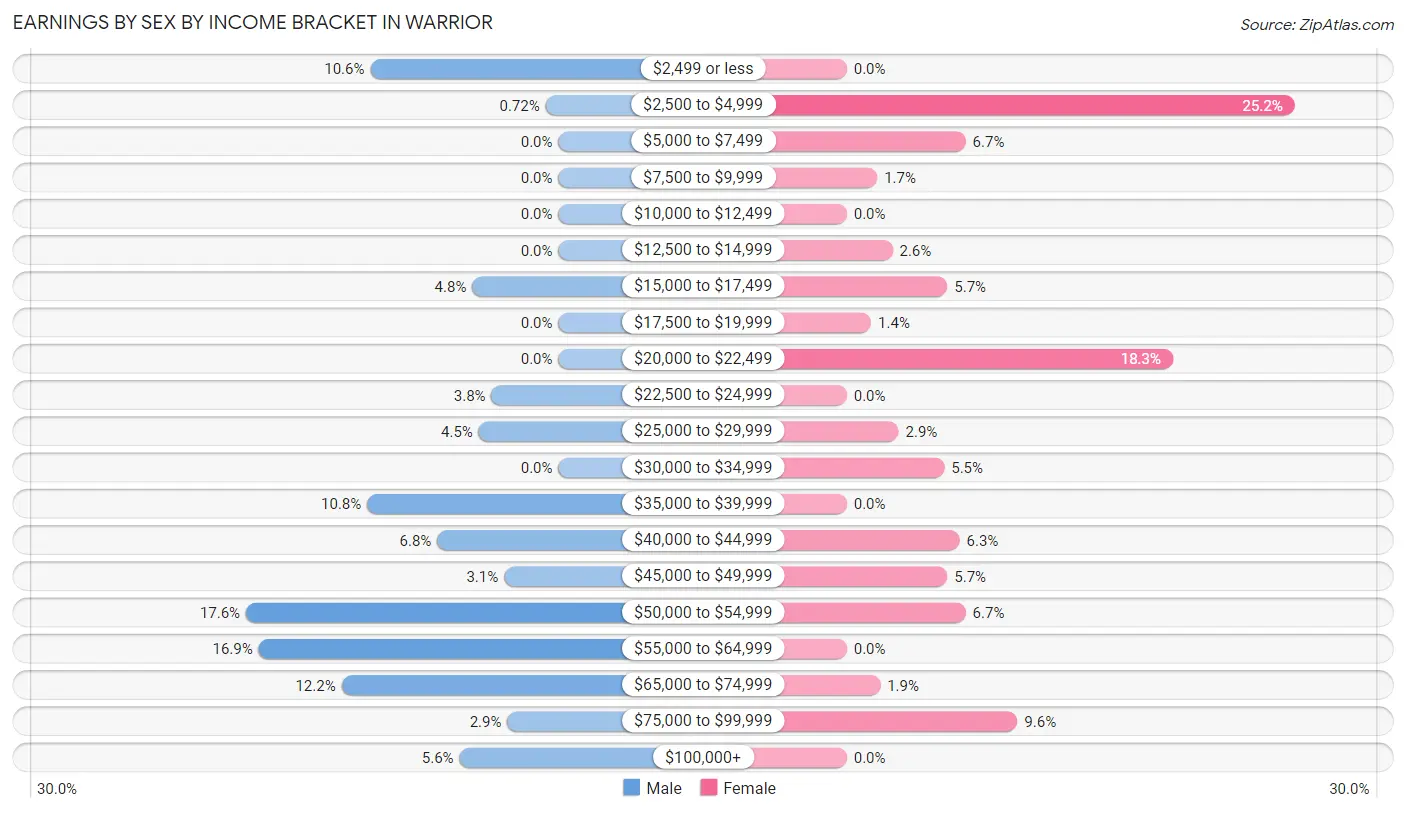
Earnings by Sex by Income Bracket in Warrior
The most common earnings brackets in Warrior are $50,000 to $54,999 for men (98 | 17.6%) and $2,500 to $4,999 for women (147 | 25.2%).
| Income | Male | Female |
| $2,499 or less | 59 (10.6%) | 0 (0.0%) |
| $2,500 to $4,999 | 4 (0.7%) | 147 (25.2%) |
| $5,000 to $7,499 | 0 (0.0%) | 39 (6.7%) |
| $7,500 to $9,999 | 0 (0.0%) | 10 (1.7%) |
| $10,000 to $12,499 | 0 (0.0%) | 0 (0.0%) |
| $12,500 to $14,999 | 0 (0.0%) | 15 (2.6%) |
| $15,000 to $17,499 | 27 (4.8%) | 33 (5.7%) |
| $17,500 to $19,999 | 0 (0.0%) | 8 (1.4%) |
| $20,000 to $22,499 | 0 (0.0%) | 107 (18.3%) |
| $22,500 to $24,999 | 21 (3.8%) | 0 (0.0%) |
| $25,000 to $29,999 | 25 (4.5%) | 17 (2.9%) |
| $30,000 to $34,999 | 0 (0.0%) | 32 (5.5%) |
| $35,000 to $39,999 | 60 (10.7%) | 0 (0.0%) |
| $40,000 to $44,999 | 38 (6.8%) | 37 (6.3%) |
| $45,000 to $49,999 | 17 (3.0%) | 33 (5.7%) |
| $50,000 to $54,999 | 98 (17.6%) | 39 (6.7%) |
| $55,000 to $64,999 | 94 (16.9%) | 0 (0.0%) |
| $65,000 to $74,999 | 68 (12.2%) | 11 (1.9%) |
| $75,000 to $99,999 | 16 (2.9%) | 56 (9.6%) |
| $100,000+ | 31 (5.6%) | 0 (0.0%) |
| Total | 558 (100.0%) | 584 (100.0%) |
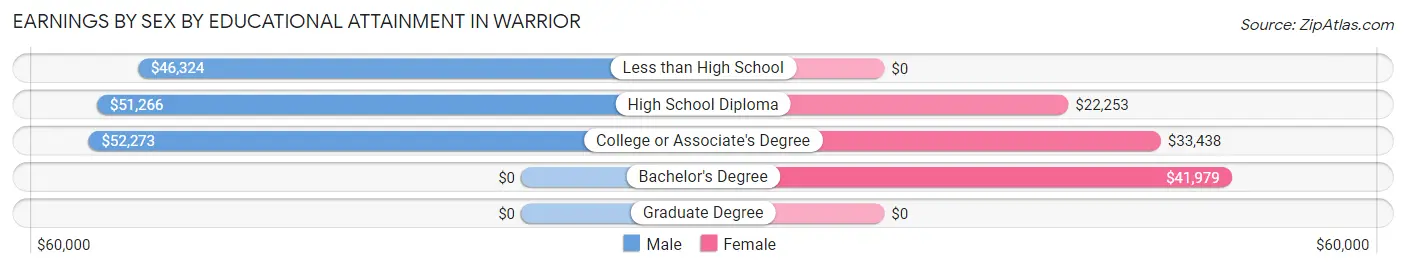
Earnings by Sex by Educational Attainment in Warrior
Average earnings in Warrior are $51,441 for men and $25,588 for women, a difference of 50.3%. Men with an educational attainment of college or associate's degree enjoy the highest average annual earnings of $52,273, while those with less than high school education earn the least with $46,324. Women with an educational attainment of bachelor's degree earn the most with the average annual earnings of $41,979, while those with high school diploma education have the smallest earnings of $22,253.
| Educational Attainment | Male Income | Female Income |
| Less than High School | $46,324 | $0 |
| High School Diploma | $51,266 | $22,253 |
| College or Associate's Degree | $52,273 | $33,438 |
| Bachelor's Degree | - | - |
| Graduate Degree | - | - |
| Total | $51,441 | $25,588 |
Family Income in Warrior
Family Income Brackets in Warrior
According to the Warrior family income data, there are 186 families falling into the $75,000 to $99,999 income range, which is the most common income bracket and makes up 22.6% of all families.
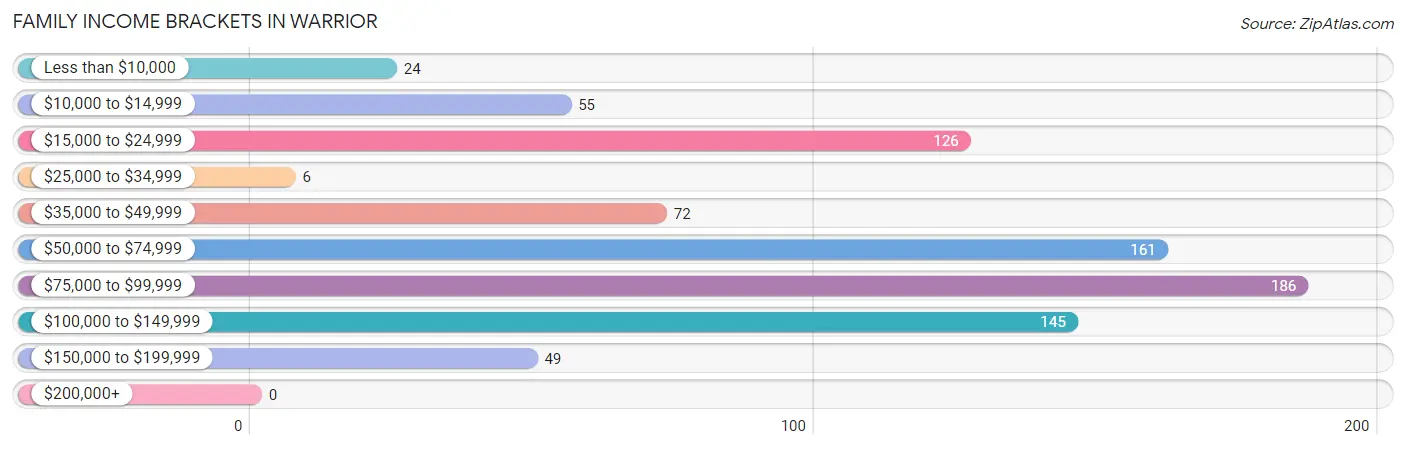
| Income Bracket | # Families | % Families |
| Less than $10,000 | 24 | 2.9% |
| $10,000 to $14,999 | 55 | 6.7% |
| $15,000 to $24,999 | 126 | 15.3% |
| $25,000 to $34,999 | 6 | 0.7% |
| $35,000 to $49,999 | 72 | 8.7% |
| $50,000 to $74,999 | 161 | 19.5% |
| $75,000 to $99,999 | 186 | 22.6% |
| $100,000 to $149,999 | 145 | 17.6% |
| $150,000 to $199,999 | 49 | 5.9% |
| $200,000+ | 0 | 0.0% |
Family Income by Famaliy Size in Warrior
4-person families (121 | 14.7%) account for the highest median family income in Warrior with $113,651 per family, while 4-person families (121 | 14.7%) have the highest median income of $28,413 per family member.
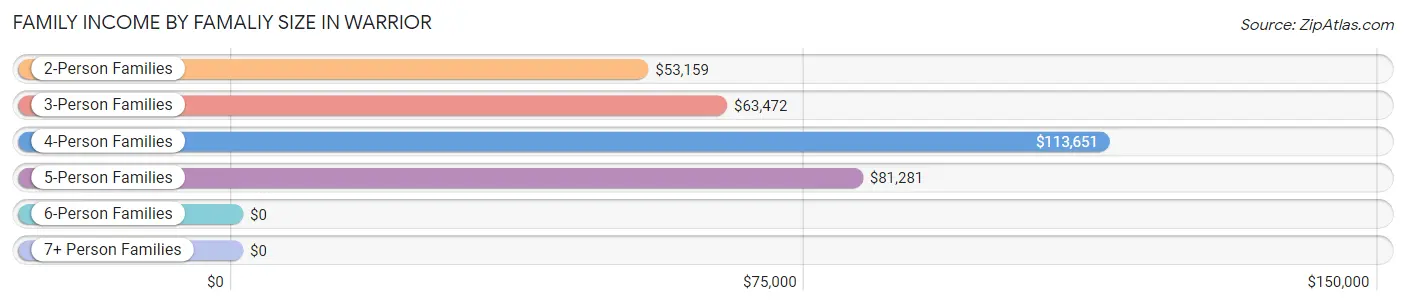
| Income Bracket | # Families | Median Income |
| 2-Person Families | 533 (64.7%) | $53,159 |
| 3-Person Families | 87 (10.6%) | $63,472 |
| 4-Person Families | 121 (14.7%) | $113,651 |
| 5-Person Families | 83 (10.1%) | $81,281 |
| 6-Person Families | 0 (0.0%) | $0 |
| 7+ Person Families | 0 (0.0%) | $0 |
| Total | 824 (100.0%) | $69,907 |
Family Income by Number of Earners in Warrior
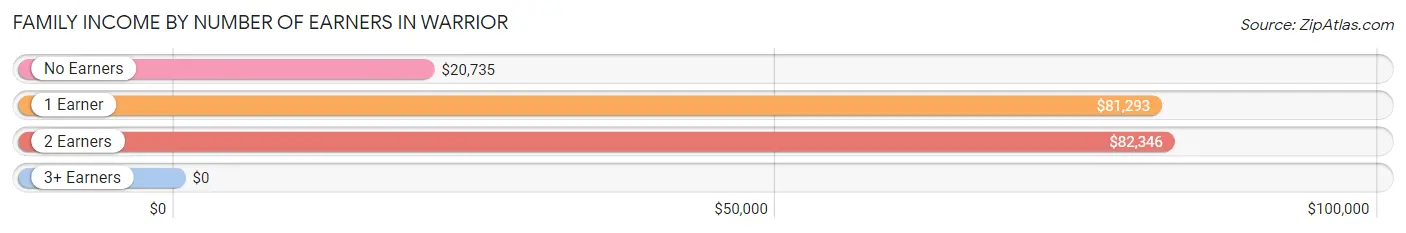
| Number of Earners | # Families | Median Income |
| No Earners | 252 (30.6%) | $20,735 |
| 1 Earner | 338 (41.0%) | $81,293 |
| 2 Earners | 228 (27.7%) | $82,346 |
| 3+ Earners | 6 (0.7%) | $0 |
| Total | 824 (100.0%) | $69,907 |
Household Income in Warrior
Household Income Brackets in Warrior
With 271 households falling in the category, the $50,000 to $74,999 income range is the most frequent in Warrior, accounting for 20.3% of all households.
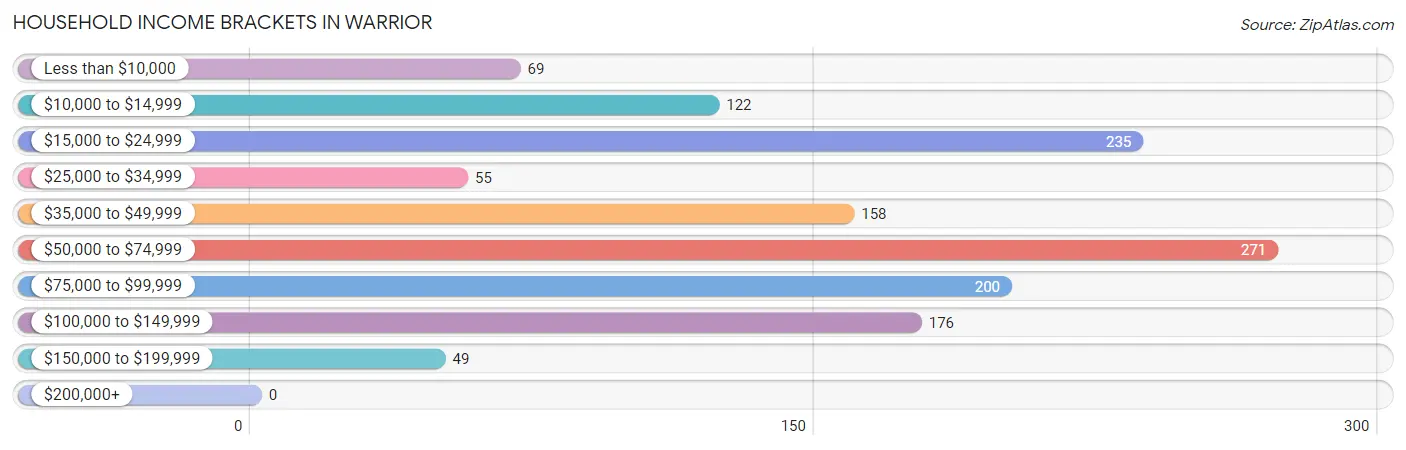
| Income Bracket | # Households | % Households |
| Less than $10,000 | 69 | 5.2% |
| $10,000 to $14,999 | 122 | 9.1% |
| $15,000 to $24,999 | 235 | 17.6% |
| $25,000 to $34,999 | 55 | 4.1% |
| $35,000 to $49,999 | 158 | 11.8% |
| $50,000 to $74,999 | 271 | 20.3% |
| $75,000 to $99,999 | 200 | 15.0% |
| $100,000 to $149,999 | 176 | 13.2% |
| $150,000 to $199,999 | 49 | 3.7% |
| $200,000+ | 0 | 0.0% |
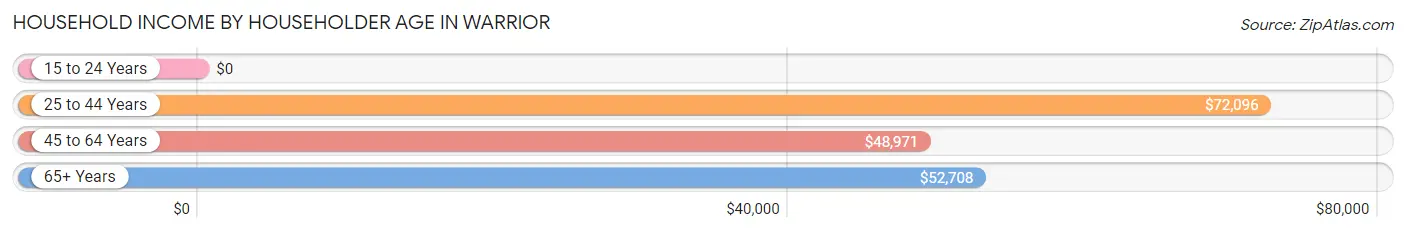
Household Income by Householder Age in Warrior
The median household income in Warrior is $53,258, with the highest median household income of $72,096 found in the 25 to 44 years age bracket for the primary householder. A total of 261 households (19.5%) fall into this category. Meanwhile, the 15 to 24 years age bracket for the primary householder has the lowest median household income of $0, with 14 households (1.1%) in this group.
| Income Bracket | # Households | Median Income |
| 15 to 24 Years | 14 (1.1%) | $0 |
| 25 to 44 Years | 261 (19.5%) | $72,096 |
| 45 to 64 Years | 434 (32.5%) | $48,971 |
| 65+ Years | 627 (46.9%) | $52,708 |
| Total | 1,336 (100.0%) | $53,258 |
Poverty in Warrior
Income Below Poverty by Sex and Age in Warrior
With 11.1% poverty level for males and 19.3% for females among the residents of Warrior, 5 year old males and 35 to 44 year old females are the most vulnerable to poverty, with 9 males (42.9%) and 22 females (44.9%) in their respective age groups living below the poverty level.
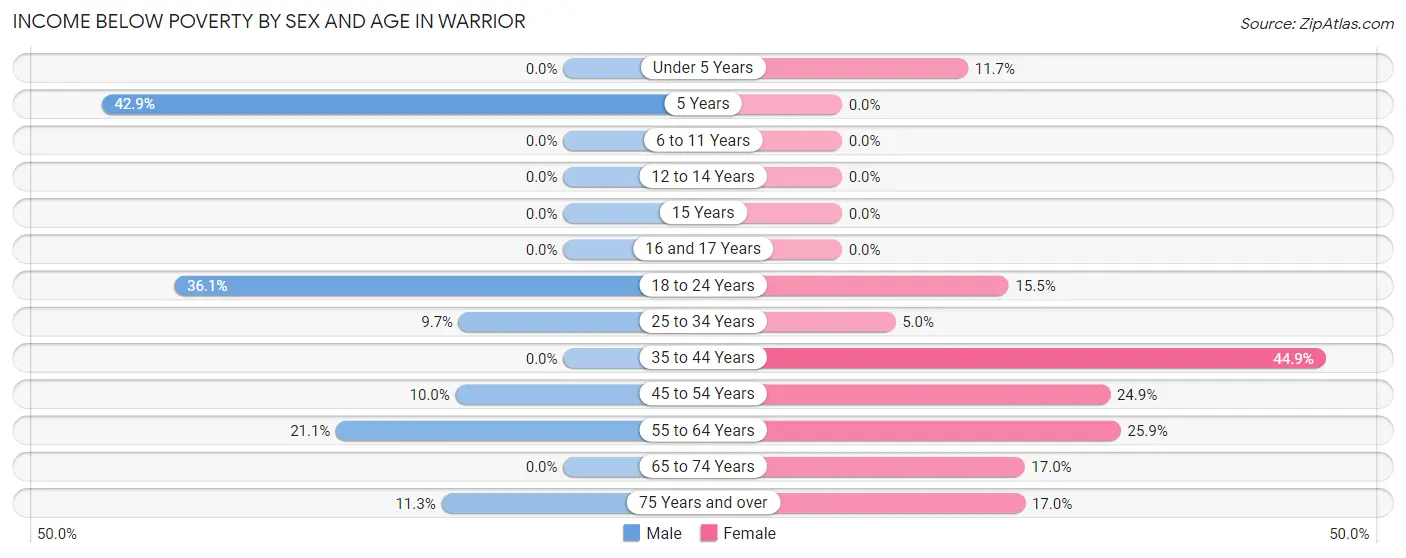
| Age Bracket | Male | Female |
| Under 5 Years | 0 (0.0%) | 9 (11.7%) |
| 5 Years | 9 (42.9%) | 0 (0.0%) |
| 6 to 11 Years | 0 (0.0%) | 0 (0.0%) |
| 12 to 14 Years | 0 (0.0%) | 0 (0.0%) |
| 15 Years | 0 (0.0%) | 0 (0.0%) |
| 16 and 17 Years | 0 (0.0%) | 0 (0.0%) |
| 18 to 24 Years | 69 (36.1%) | 26 (15.5%) |
| 25 to 34 Years | 19 (9.7%) | 7 (5.0%) |
| 35 to 44 Years | 0 (0.0%) | 22 (44.9%) |
| 45 to 54 Years | 15 (10.0%) | 112 (24.9%) |
| 55 to 64 Years | 39 (21.1%) | 52 (25.9%) |
| 65 to 74 Years | 0 (0.0%) | 60 (17.0%) |
| 75 Years and over | 19 (11.3%) | 34 (17.0%) |
| Total | 170 (11.1%) | 322 (19.3%) |
Income Above Poverty by Sex and Age in Warrior
According to the poverty statistics in Warrior, males aged under 5 years and females aged 5 years are the age groups that are most secure financially, with 100.0% of males and 100.0% of females in these age groups living above the poverty line.
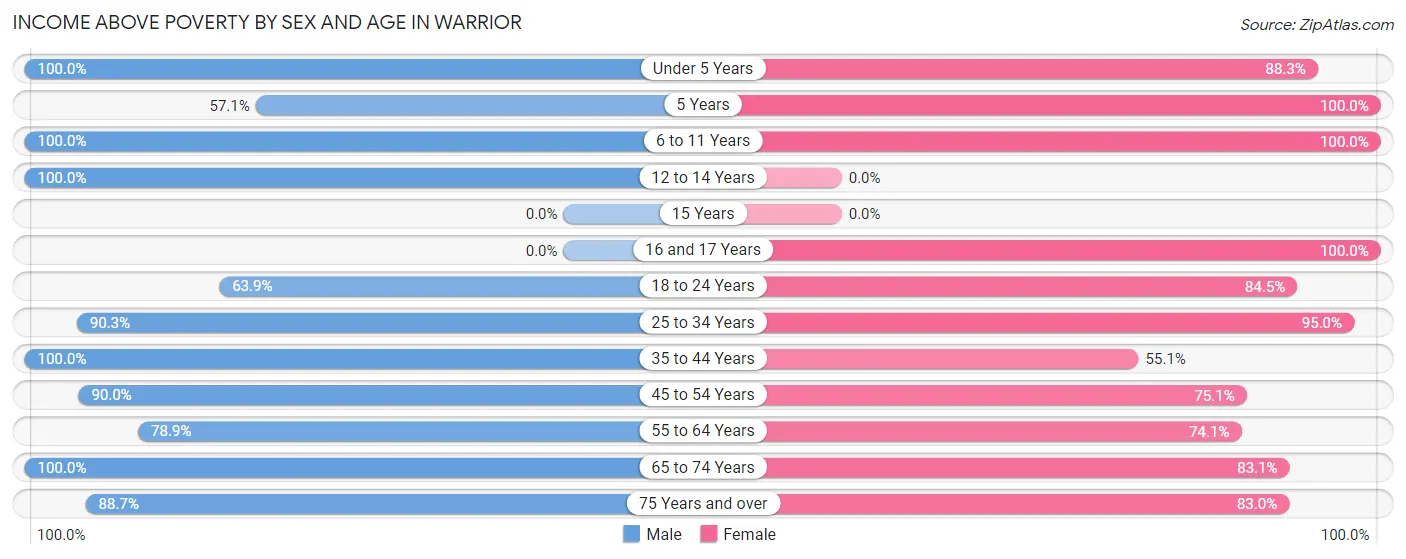
| Age Bracket | Male | Female |
| Under 5 Years | 20 (100.0%) | 68 (88.3%) |
| 5 Years | 12 (57.1%) | 13 (100.0%) |
| 6 to 11 Years | 36 (100.0%) | 4 (100.0%) |
| 12 to 14 Years | 21 (100.0%) | 0 (0.0%) |
| 15 Years | 0 (0.0%) | 0 (0.0%) |
| 16 and 17 Years | 0 (0.0%) | 9 (100.0%) |
| 18 to 24 Years | 122 (63.9%) | 142 (84.5%) |
| 25 to 34 Years | 177 (90.3%) | 134 (95.0%) |
| 35 to 44 Years | 328 (100.0%) | 27 (55.1%) |
| 45 to 54 Years | 135 (90.0%) | 338 (75.1%) |
| 55 to 64 Years | 146 (78.9%) | 149 (74.1%) |
| 65 to 74 Years | 212 (100.0%) | 294 (83.1%) |
| 75 Years and over | 149 (88.7%) | 166 (83.0%) |
| Total | 1,358 (88.9%) | 1,344 (80.7%) |
Income Below Poverty Among Married-Couple Families in Warrior
The poverty statistics for married-couple families in Warrior show that 11.1% or 65 of the total 587 families live below the poverty line. Families with no children have the highest poverty rate of 14.2%, comprising of 65 families. On the other hand, families with 1 or 2 children have the lowest poverty rate of 0.0%, which includes 0 families.
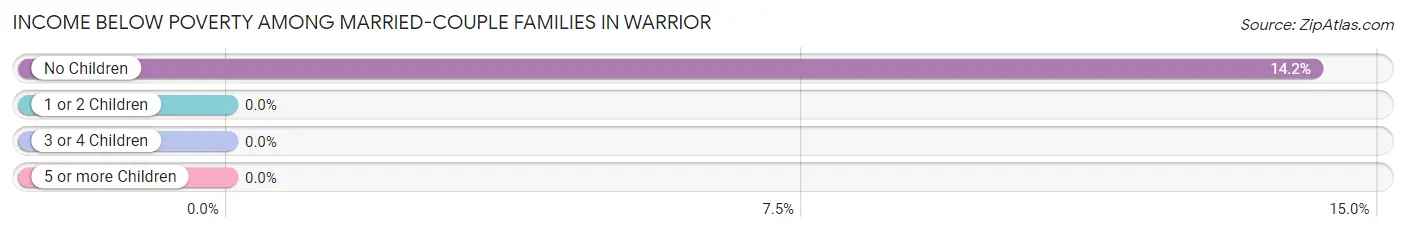
| Children | Above Poverty | Below Poverty |
| No Children | 394 (85.8%) | 65 (14.2%) |
| 1 or 2 Children | 126 (100.0%) | 0 (0.0%) |
| 3 or 4 Children | 2 (100.0%) | 0 (0.0%) |
| 5 or more Children | 0 (0.0%) | 0 (0.0%) |
| Total | 522 (88.9%) | 65 (11.1%) |
Income Below Poverty Among Single-Parent Households in Warrior
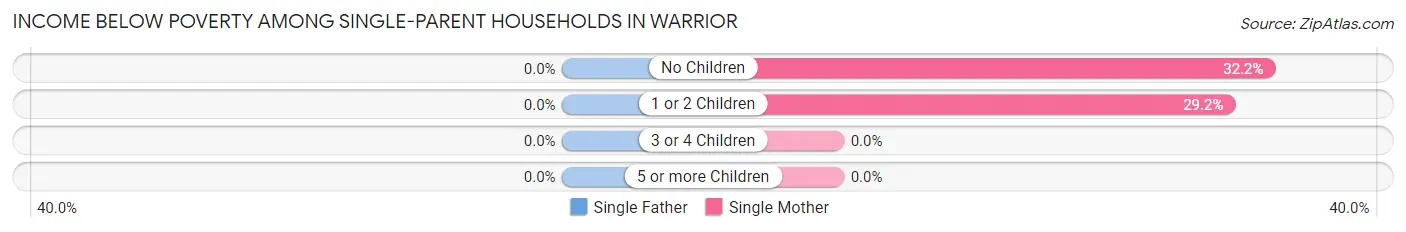
| Children | Single Father | Single Mother |
| No Children | 0 (0.0%) | 55 (32.2%) |
| 1 or 2 Children | 0 (0.0%) | 7 (29.2%) |
| 3 or 4 Children | 0 (0.0%) | 0 (0.0%) |
| 5 or more Children | 0 (0.0%) | 0 (0.0%) |
| Total | 0 (0.0%) | 62 (31.8%) |
Income Below Poverty Among Married-Couple vs Single-Parent Households in Warrior
The poverty data for Warrior shows that 65 of the married-couple family households (11.1%) and 62 of the single-parent households (26.2%) are living below the poverty level. Within the married-couple family households, those with no children have the highest poverty rate, with 65 households (14.2%) falling below the poverty line. Among the single-parent households, those with no children have the highest poverty rate, with 55 household (27.8%) living below poverty.
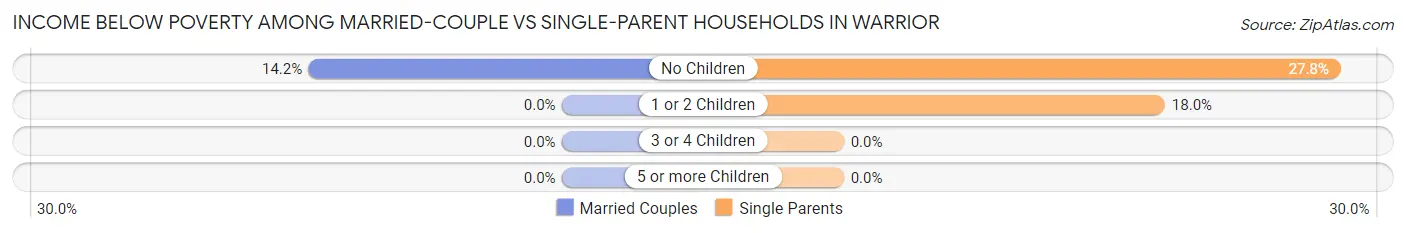
| Children | Married-Couple Families | Single-Parent Households |
| No Children | 65 (14.2%) | 55 (27.8%) |
| 1 or 2 Children | 0 (0.0%) | 7 (17.9%) |
| 3 or 4 Children | 0 (0.0%) | 0 (0.0%) |
| 5 or more Children | 0 (0.0%) | 0 (0.0%) |
| Total | 65 (11.1%) | 62 (26.2%) |
Race in Warrior
The most populous races in Warrior are White / Caucasian (2,225 | 69.4%), Black / African American (843 | 26.3%), and Two or more Races (94 | 2.9%).
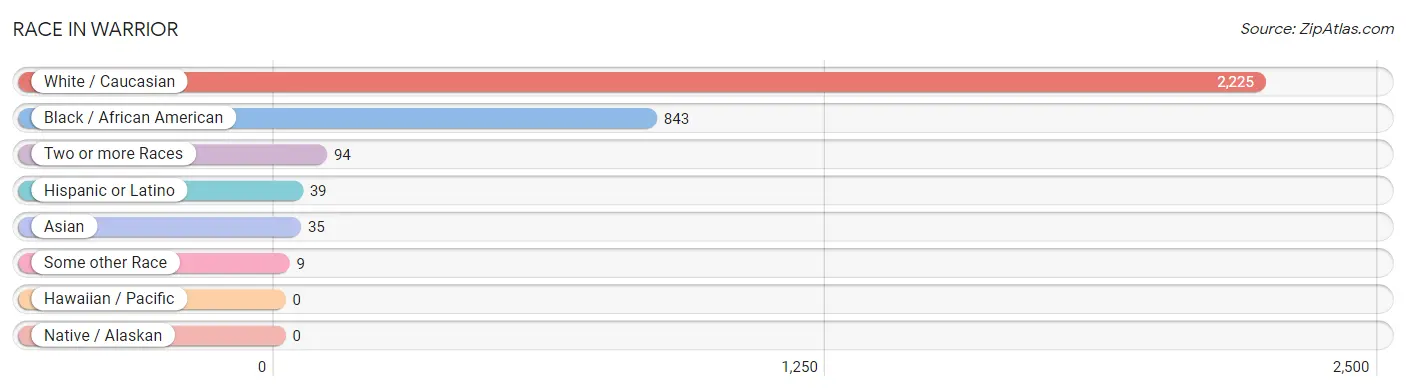
| Race | # Population | % Population |
| Asian | 35 | 1.1% |
| Black / African American | 843 | 26.3% |
| Hawaiian / Pacific | 0 | 0.0% |
| Hispanic or Latino | 39 | 1.2% |
| Native / Alaskan | 0 | 0.0% |
| White / Caucasian | 2,225 | 69.4% |
| Two or more Races | 94 | 2.9% |
| Some other Race | 9 | 0.3% |
| Total | 3,206 | 100.0% |
Ancestry in Warrior
The most populous ancestries reported in Warrior are American (609 | 19.0%), English (343 | 10.7%), Scottish (312 | 9.7%), Irish (297 | 9.3%), and German (203 | 6.3%), together accounting for 55.0% of all Warrior residents.
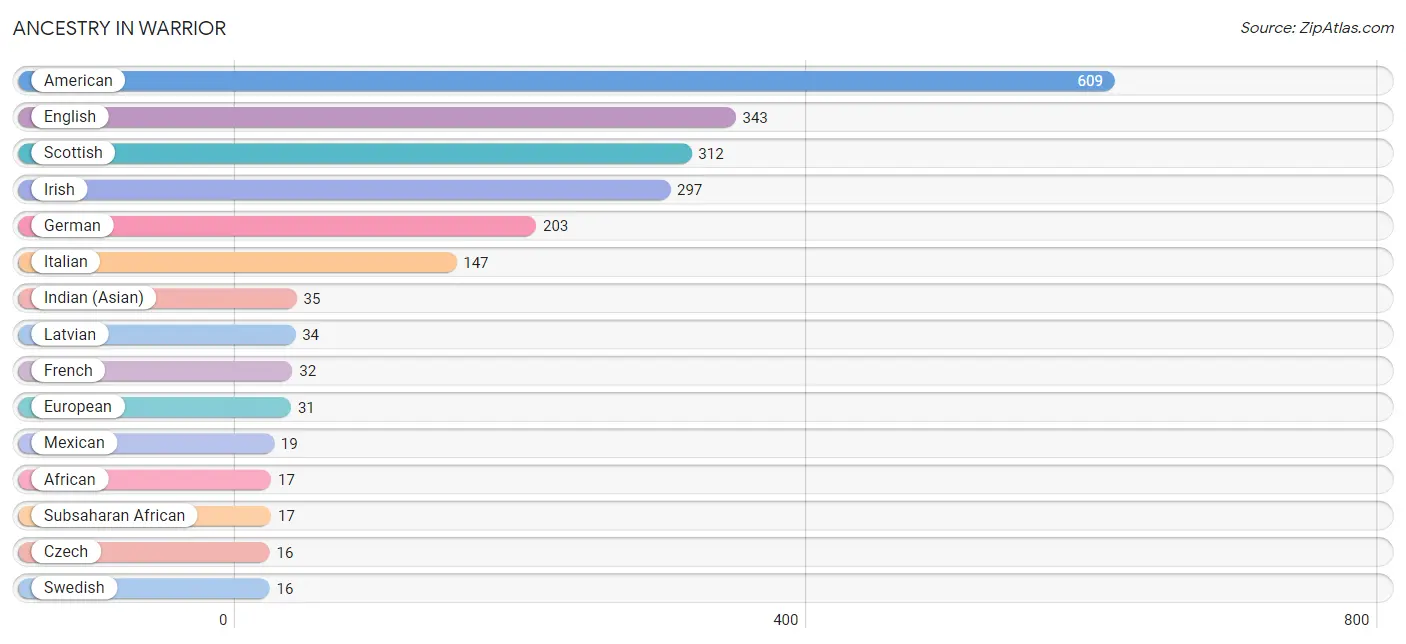
| Ancestry | # Population | % Population |
| African | 17 | 0.5% |
| American | 609 | 19.0% |
| Cherokee | 4 | 0.1% |
| Czech | 16 | 0.5% |
| English | 343 | 10.7% |
| European | 31 | 1.0% |
| French | 32 | 1.0% |
| German | 203 | 6.3% |
| Indian (Asian) | 35 | 1.1% |
| Irish | 297 | 9.3% |
| Italian | 147 | 4.6% |
| Latvian | 34 | 1.1% |
| Mexican | 19 | 0.6% |
| Scottish | 312 | 9.7% |
| Subsaharan African | 17 | 0.5% |
| Swedish | 16 | 0.5% | View All 16 Rows |
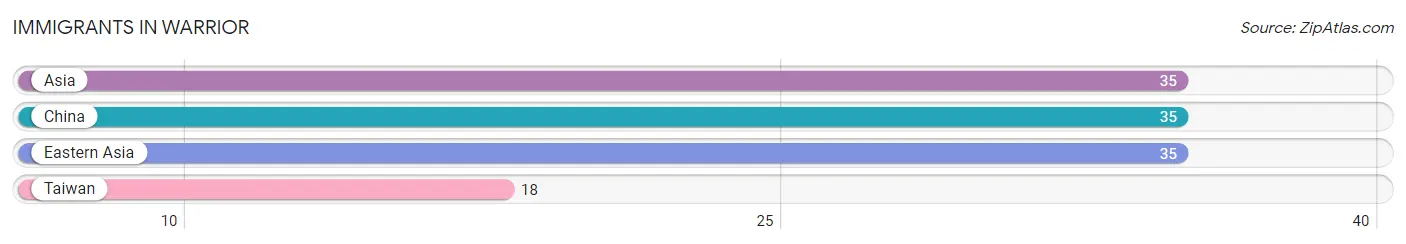
Immigrants in Warrior
The most numerous immigrant groups reported in Warrior came from Asia (35 | 1.1%), China (35 | 1.1%), Eastern Asia (35 | 1.1%), and Taiwan (18 | 0.6%), together accounting for 3.8% of all Warrior residents.
| Immigration Origin | # Population | % Population |
| Asia | 35 | 1.1% |
| China | 35 | 1.1% |
| Eastern Asia | 35 | 1.1% |
| Taiwan | 18 | 0.6% | View All 4 Rows |
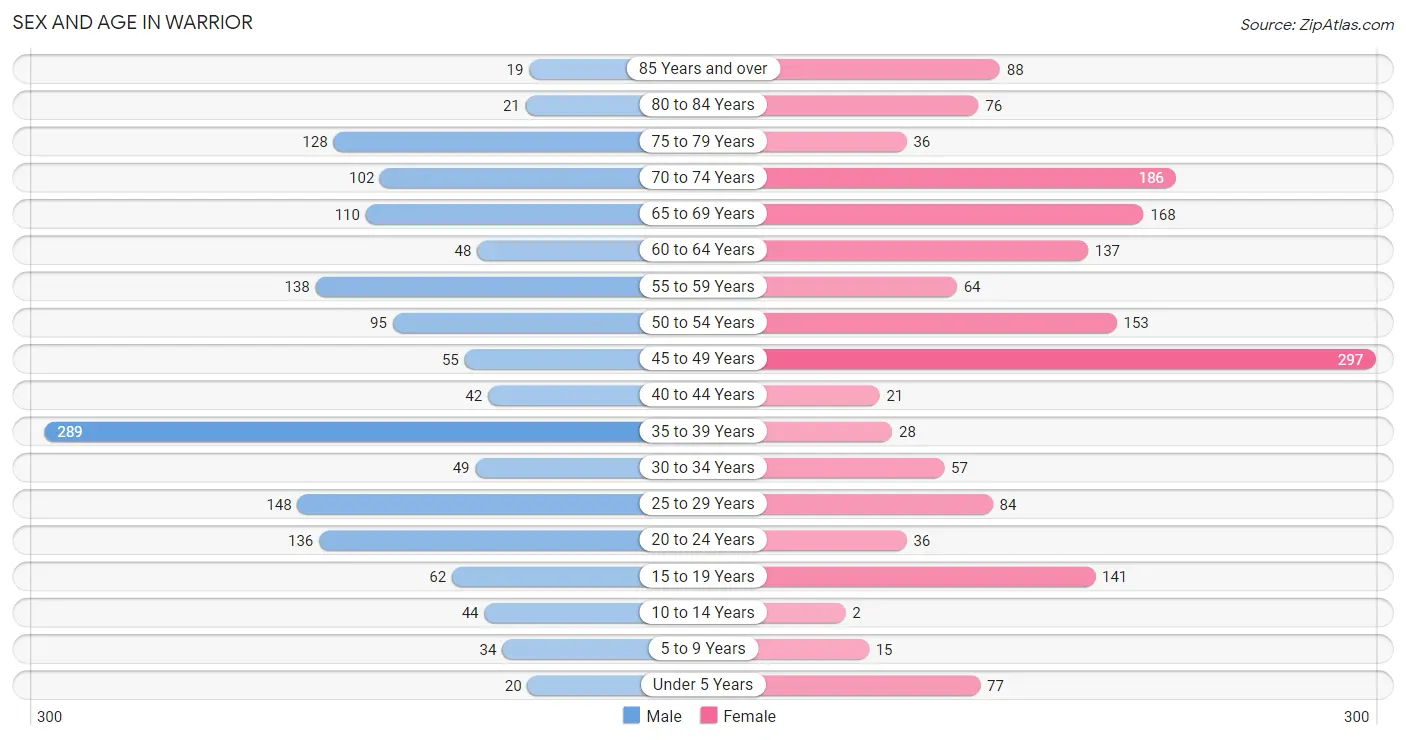
Sex and Age in Warrior
Sex and Age in Warrior
The most populous age groups in Warrior are 35 to 39 Years (289 | 18.8%) for men and 45 to 49 Years (297 | 17.8%) for women.
| Age Bracket | Male | Female |
| Under 5 Years | 20 (1.3%) | 77 (4.6%) |
| 5 to 9 Years | 34 (2.2%) | 15 (0.9%) |
| 10 to 14 Years | 44 (2.9%) | 2 (0.1%) |
| 15 to 19 Years | 62 (4.0%) | 141 (8.5%) |
| 20 to 24 Years | 136 (8.8%) | 36 (2.2%) |
| 25 to 29 Years | 148 (9.6%) | 84 (5.0%) |
| 30 to 34 Years | 49 (3.2%) | 57 (3.4%) |
| 35 to 39 Years | 289 (18.8%) | 28 (1.7%) |
| 40 to 44 Years | 42 (2.7%) | 21 (1.3%) |
| 45 to 49 Years | 55 (3.6%) | 297 (17.8%) |
| 50 to 54 Years | 95 (6.2%) | 153 (9.2%) |
| 55 to 59 Years | 138 (9.0%) | 64 (3.8%) |
| 60 to 64 Years | 48 (3.1%) | 137 (8.2%) |
| 65 to 69 Years | 110 (7.1%) | 168 (10.1%) |
| 70 to 74 Years | 102 (6.6%) | 186 (11.2%) |
| 75 to 79 Years | 128 (8.3%) | 36 (2.2%) |
| 80 to 84 Years | 21 (1.4%) | 76 (4.6%) |
| 85 Years and over | 19 (1.2%) | 88 (5.3%) |
| Total | 1,540 (100.0%) | 1,666 (100.0%) |
Families and Households in Warrior
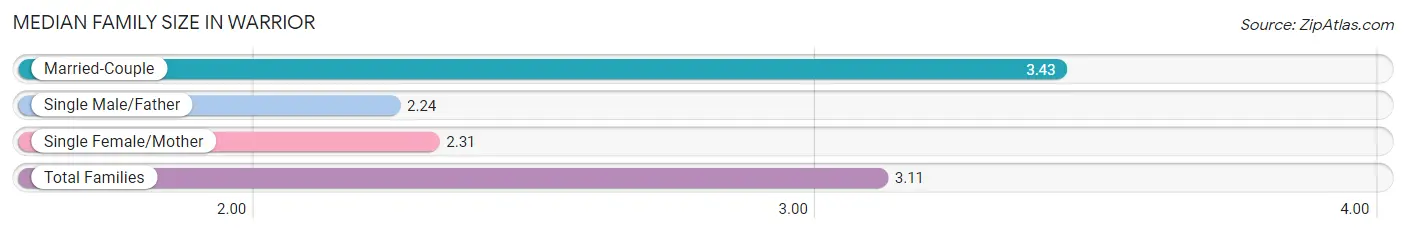
Median Family Size in Warrior
The median family size in Warrior is 3.11 persons per family, with married-couple families (587 | 71.2%) accounting for the largest median family size of 3.43 persons per family. On the other hand, single male/father families (42 | 5.1%) represent the smallest median family size with 2.24 persons per family.
| Family Type | # Families | Family Size |
| Married-Couple | 587 (71.2%) | 3.43 |
| Single Male/Father | 42 (5.1%) | 2.24 |
| Single Female/Mother | 195 (23.7%) | 2.31 |
| Total Families | 824 (100.0%) | 3.11 |
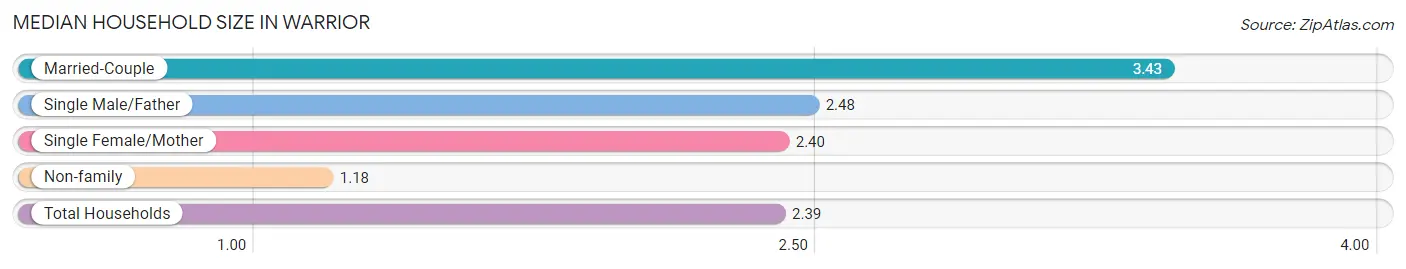
Median Household Size in Warrior
The median household size in Warrior is 2.39 persons per household, with married-couple households (587 | 43.9%) accounting for the largest median household size of 3.43 persons per household. non-family households (512 | 38.3%) represent the smallest median household size with 1.18 persons per household.
| Household Type | # Households | Household Size |
| Married-Couple | 587 (43.9%) | 3.43 |
| Single Male/Father | 42 (3.1%) | 2.48 |
| Single Female/Mother | 195 (14.6%) | 2.40 |
| Non-family | 512 (38.3%) | 1.18 |
| Total Households | 1,336 (100.0%) | 2.39 |
Household Size by Marriage Status in Warrior
Out of a total of 1,336 households in Warrior, 824 (61.7%) are family households, while 512 (38.3%) are nonfamily households. The most numerous type of family households are 2-person households, comprising 504, and the most common type of nonfamily households are 1-person households, comprising 428.
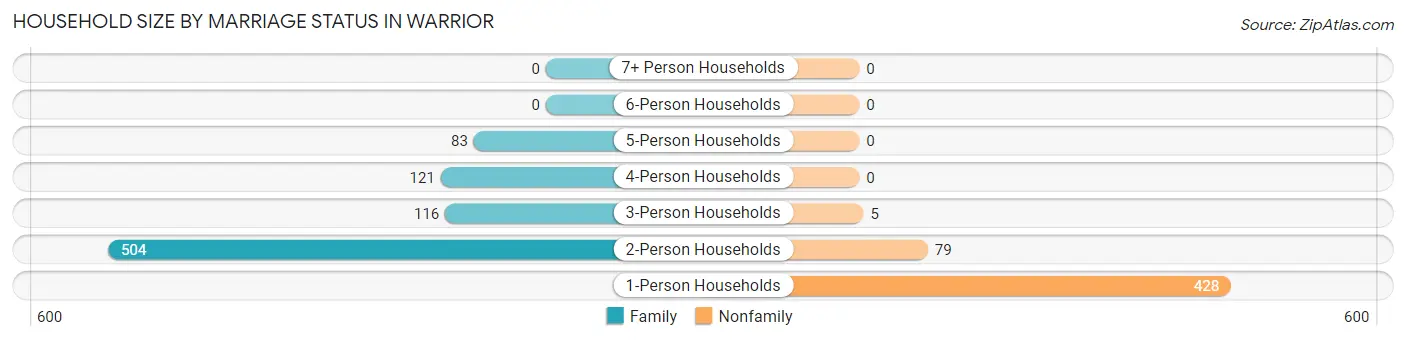
| Household Size | Family Households | Nonfamily Households |
| 1-Person Households | - | 428 (32.0%) |
| 2-Person Households | 504 (37.7%) | 79 (5.9%) |
| 3-Person Households | 116 (8.7%) | 5 (0.4%) |
| 4-Person Households | 121 (9.1%) | 0 (0.0%) |
| 5-Person Households | 83 (6.2%) | 0 (0.0%) |
| 6-Person Households | 0 (0.0%) | 0 (0.0%) |
| 7+ Person Households | 0 (0.0%) | 0 (0.0%) |
| Total | 824 (61.7%) | 512 (38.3%) |
Female Fertility in Warrior
Fertility by Age in Warrior
Average fertility rate in Warrior is 95.0 births per 1,000 women. Women in the age bracket of 20 to 34 years have the highest fertility rate with 379.0 births per 1,000 women. Women in the age bracket of 20 to 34 years acount for 100.0% of all women with births.
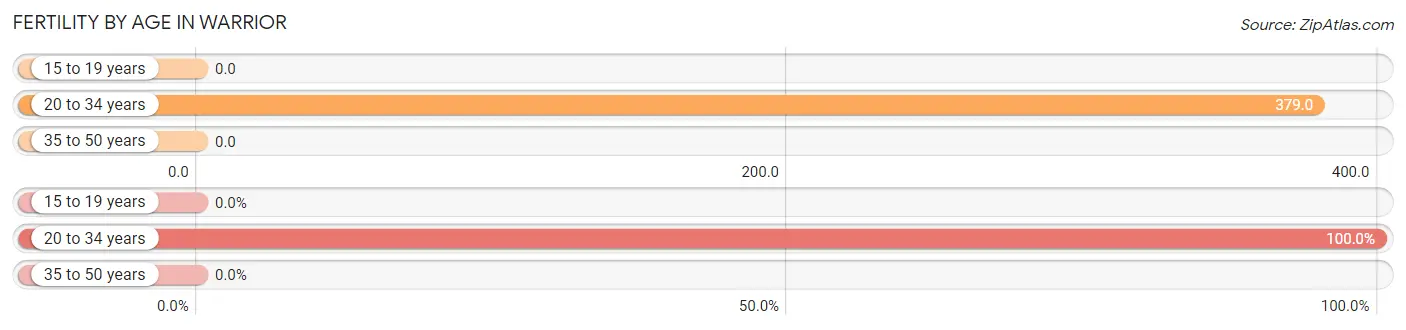
| Age Bracket | Women with Births | Births / 1,000 Women |
| 15 to 19 years | 0 (0.0%) | 0.0 |
| 20 to 34 years | 67 (100.0%) | 379.0 |
| 35 to 50 years | 0 (0.0%) | 0.0 |
| Total | 67 (100.0%) | 95.0 |
Fertility by Age by Marriage Status in Warrior
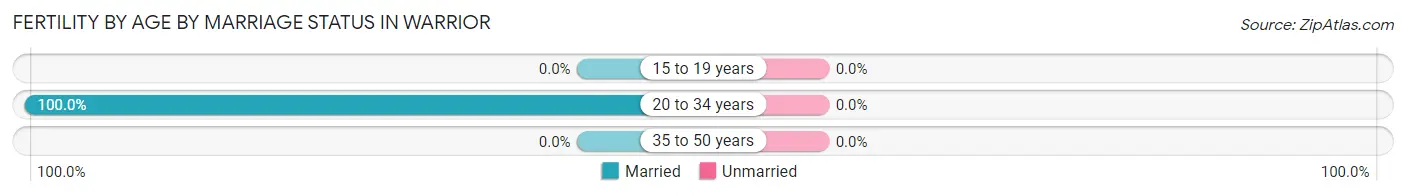
| Age Bracket | Married | Unmarried |
| 15 to 19 years | 0 (0.0%) | 0 (0.0%) |
| 20 to 34 years | 67 (100.0%) | 0 (0.0%) |
| 35 to 50 years | 0 (0.0%) | 0 (0.0%) |
| Total | 67 (100.0%) | 0 (0.0%) |
Fertility by Education in Warrior
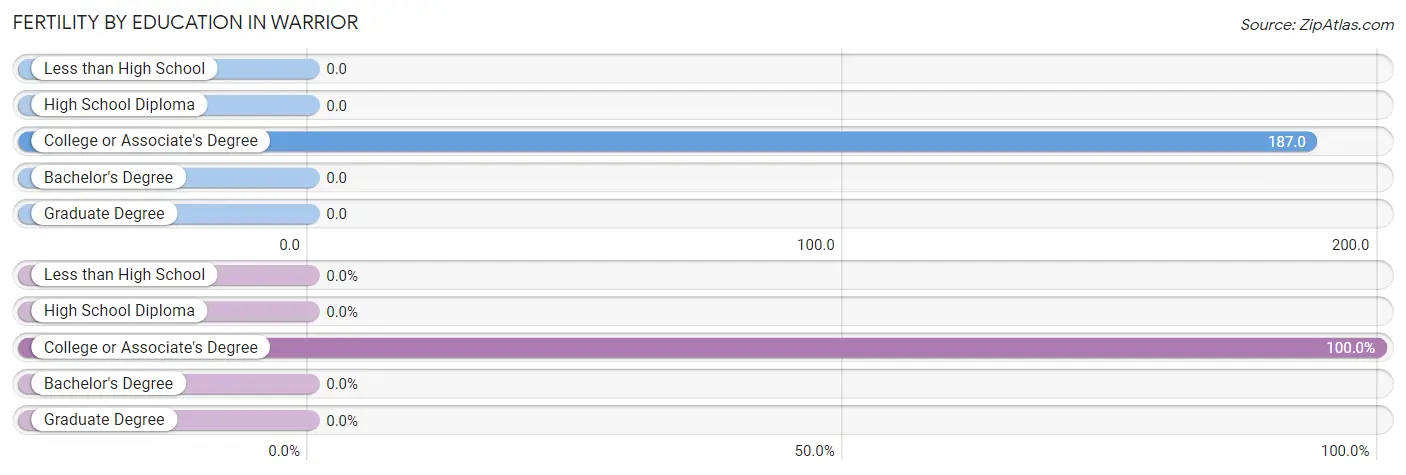
| Educational Attainment | Women with Births | Births / 1,000 Women |
| Less than High School | 0 (0.0%) | 0.0 |
| High School Diploma | 0 (0.0%) | 0.0 |
| College or Associate's Degree | 67 (100.0%) | 187.0 |
| Bachelor's Degree | 0 (0.0%) | 0.0 |
| Graduate Degree | 0 (0.0%) | 0.0 |
| Total | 67 (100.0%) | 95.0 |
Fertility by Education by Marriage Status in Warrior
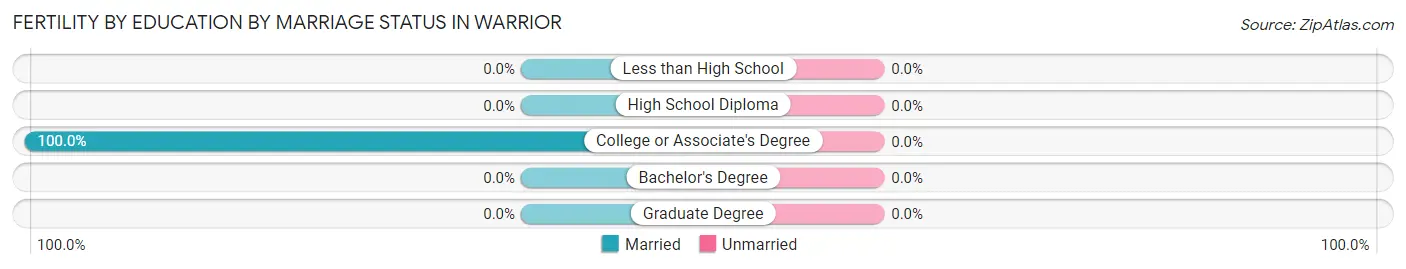
| Educational Attainment | Married | Unmarried |
| Less than High School | 0 (0.0%) | 0 (0.0%) |
| High School Diploma | 0 (0.0%) | 0 (0.0%) |
| College or Associate's Degree | 67 (100.0%) | 0 (0.0%) |
| Bachelor's Degree | 0 (0.0%) | 0 (0.0%) |
| Graduate Degree | 0 (0.0%) | 0 (0.0%) |
| Total | 67 (100.0%) | 0 (0.0%) |
Employment Characteristics in Warrior
Employment by Class of Employer in Warrior
Among the 912 employed individuals in Warrior, private company employees (671 | 73.6%), local government employees (74 | 8.1%), and federal government employees (56 | 6.1%) make up the most common classes of employment.
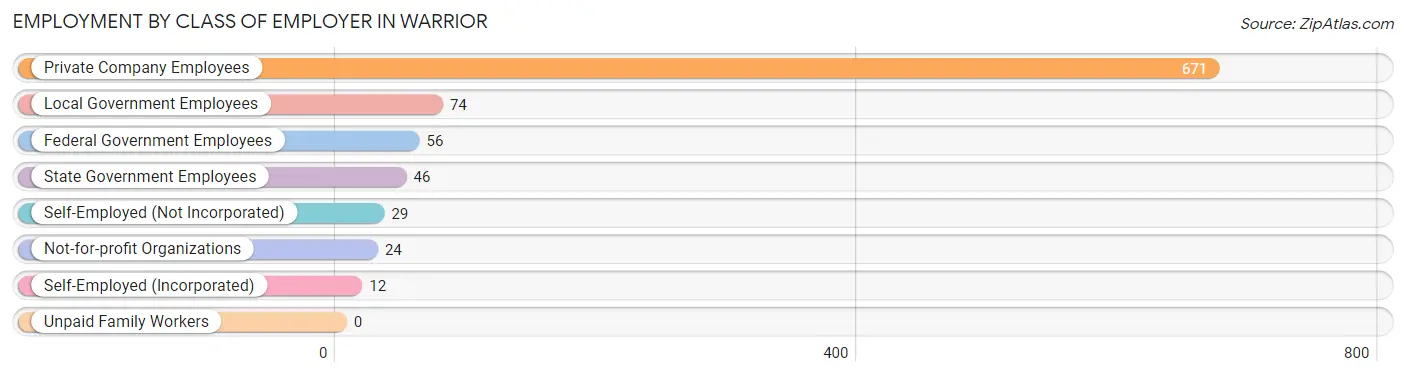
| Employer Class | # Employees | % Employees |
| Private Company Employees | 671 | 73.6% |
| Self-Employed (Incorporated) | 12 | 1.3% |
| Self-Employed (Not Incorporated) | 29 | 3.2% |
| Not-for-profit Organizations | 24 | 2.6% |
| Local Government Employees | 74 | 8.1% |
| State Government Employees | 46 | 5.0% |
| Federal Government Employees | 56 | 6.1% |
| Unpaid Family Workers | 0 | 0.0% |
| Total | 912 | 100.0% |
Employment Status by Age in Warrior
According to the labor force statistics for Warrior, out of the total population over 16 years of age (3,014), 34.1% or 1,028 individuals are in the labor force, with 9.0% or 93 of them unemployed. The age group with the highest labor force participation rate is 55 to 59 years, with 82.7% or 167 individuals in the labor force. Within the labor force, the 30 to 34 years age range has the highest percentage of unemployed individuals, with 23.0% or 20 of them being unemployed.
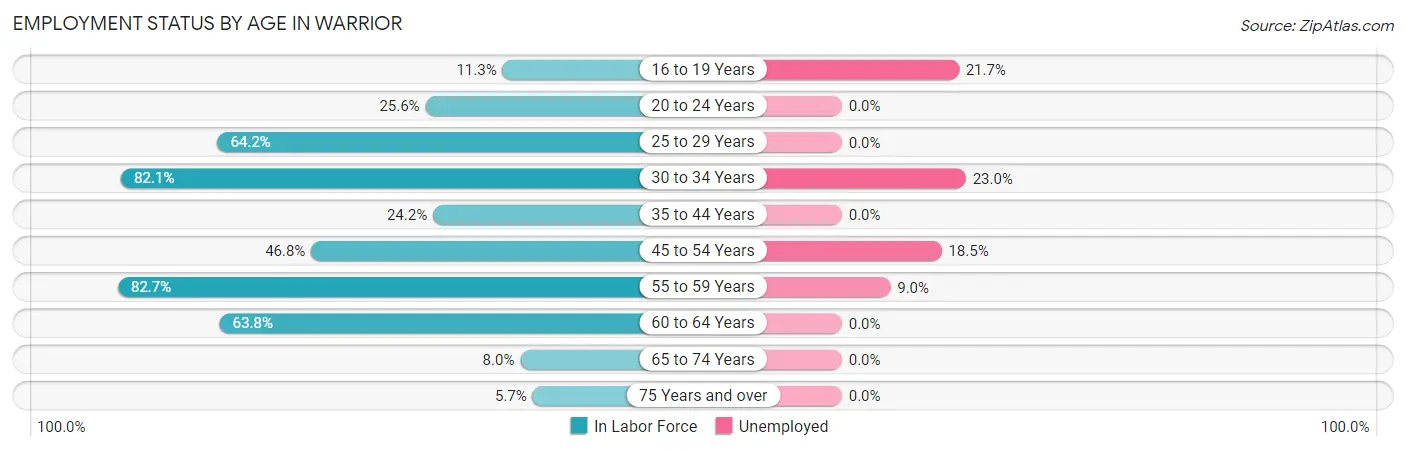
| Age Bracket | In Labor Force | Unemployed |
| 16 to 19 Years | 23 (11.3%) | 5 (21.7%) |
| 20 to 24 Years | 44 (25.6%) | 0 (0.0%) |
| 25 to 29 Years | 149 (64.2%) | 0 (0.0%) |
| 30 to 34 Years | 87 (82.1%) | 20 (23.0%) |
| 35 to 44 Years | 92 (24.2%) | 0 (0.0%) |
| 45 to 54 Years | 281 (46.8%) | 52 (18.5%) |
| 55 to 59 Years | 167 (82.7%) | 15 (9.0%) |
| 60 to 64 Years | 118 (63.8%) | 0 (0.0%) |
| 65 to 74 Years | 45 (8.0%) | 0 (0.0%) |
| 75 Years and over | 21 (5.7%) | 0 (0.0%) |
| Total | 1,028 (34.1%) | 93 (9.0%) |
Employment Status by Educational Attainment in Warrior
According to labor force statistics for Warrior, 52.4% of individuals (893) out of the total population between 25 and 64 years of age (1,705) are in the labor force, with 9.7% or 87 of them being unemployed. The group with the highest labor force participation rate are those with the educational attainment of bachelor's degree or higher, with 87.7% or 93 individuals in the labor force. Within the labor force, individuals with less than high school education have the highest percentage of unemployment, with 41.0% or 34 of them being unemployed.
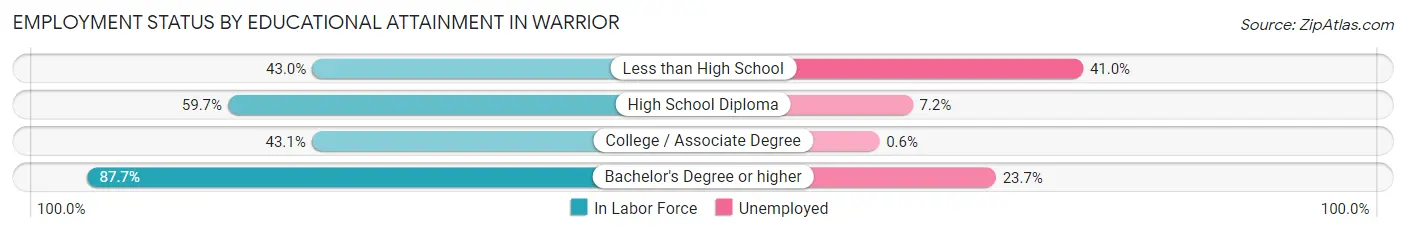
| Educational Attainment | In Labor Force | Unemployed |
| Less than High School | 83 (43.0%) | 79 (41.0%) |
| High School Diploma | 403 (59.7%) | 49 (7.2%) |
| College / Associate Degree | 315 (43.1%) | 4 (0.6%) |
| Bachelor's Degree or higher | 93 (87.7%) | 25 (23.7%) |
| Total | 893 (52.4%) | 165 (9.7%) |
Employment Occupations by Sex in Warrior
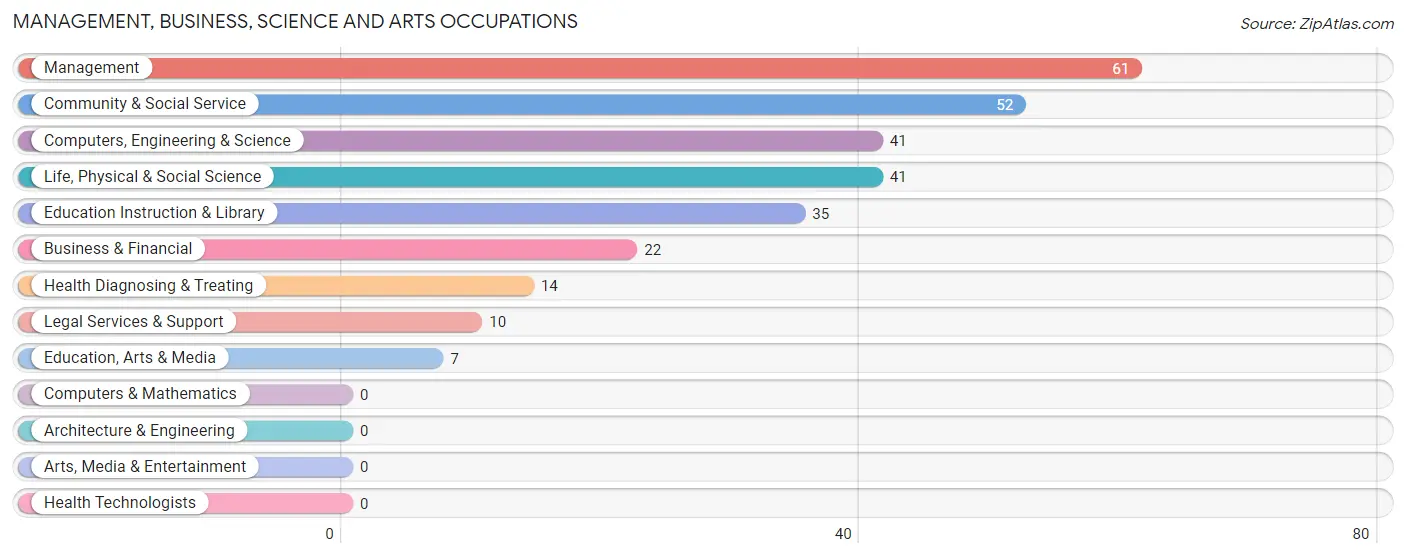
Management, Business, Science and Arts Occupations
The most common Management, Business, Science and Arts occupations in Warrior are Management (61 | 6.5%), Community & Social Service (52 | 5.6%), Computers, Engineering & Science (41 | 4.4%), Life, Physical & Social Science (41 | 4.4%), and Education Instruction & Library (35 | 3.7%).
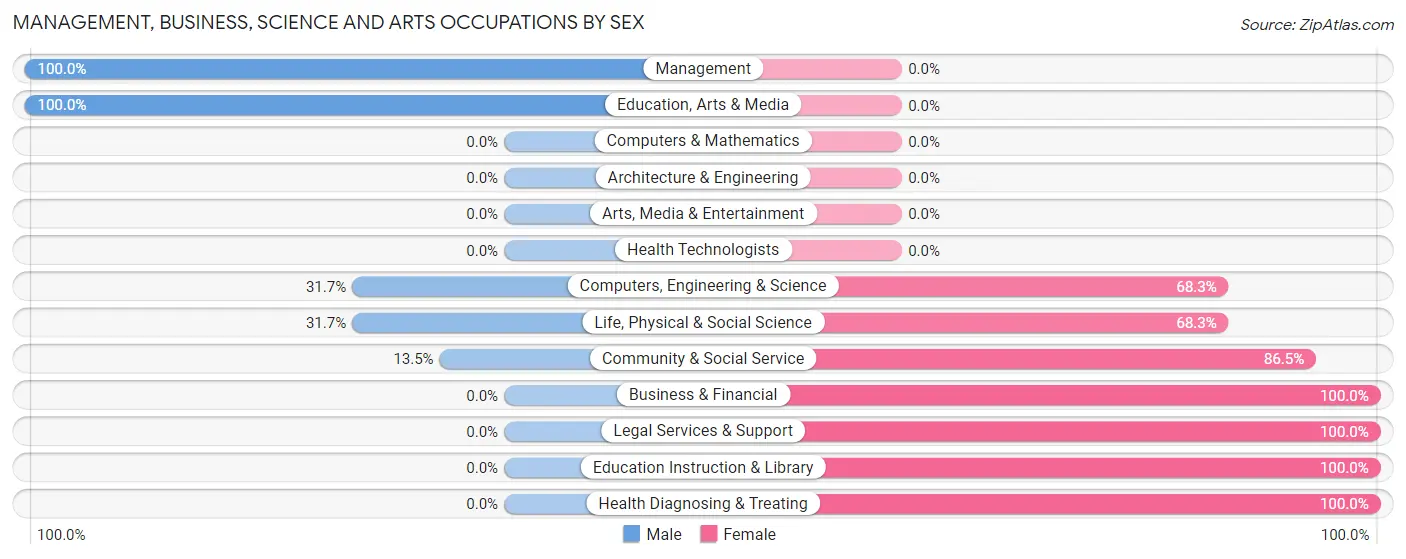
Management, Business, Science and Arts Occupations by Sex
Within the Management, Business, Science and Arts occupations in Warrior, the most male-oriented occupations are Management (100.0%), Education, Arts & Media (100.0%), and Computers, Engineering & Science (31.7%), while the most female-oriented occupations are Business & Financial (100.0%), Legal Services & Support (100.0%), and Education Instruction & Library (100.0%).
| Occupation | Male | Female |
| Management | 61 (100.0%) | 0 (0.0%) |
| Business & Financial | 0 (0.0%) | 22 (100.0%) |
| Computers, Engineering & Science | 13 (31.7%) | 28 (68.3%) |
| Computers & Mathematics | 0 (0.0%) | 0 (0.0%) |
| Architecture & Engineering | 0 (0.0%) | 0 (0.0%) |
| Life, Physical & Social Science | 13 (31.7%) | 28 (68.3%) |
| Community & Social Service | 7 (13.5%) | 45 (86.5%) |
| Education, Arts & Media | 7 (100.0%) | 0 (0.0%) |
| Legal Services & Support | 0 (0.0%) | 10 (100.0%) |
| Education Instruction & Library | 0 (0.0%) | 35 (100.0%) |
| Arts, Media & Entertainment | 0 (0.0%) | 0 (0.0%) |
| Health Diagnosing & Treating | 0 (0.0%) | 14 (100.0%) |
| Health Technologists | 0 (0.0%) | 0 (0.0%) |
| Total (Category) | 81 (42.6%) | 109 (57.4%) |
| Total (Overall) | 526 (56.3%) | 409 (43.7%) |
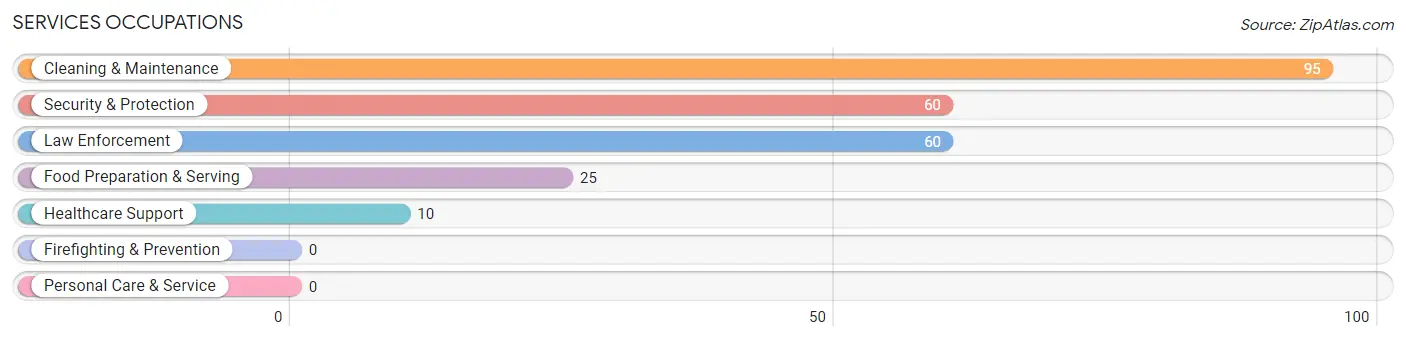
Services Occupations
The most common Services occupations in Warrior are Cleaning & Maintenance (95 | 10.2%), Security & Protection (60 | 6.4%), Law Enforcement (60 | 6.4%), Food Preparation & Serving (25 | 2.7%), and Healthcare Support (10 | 1.1%).
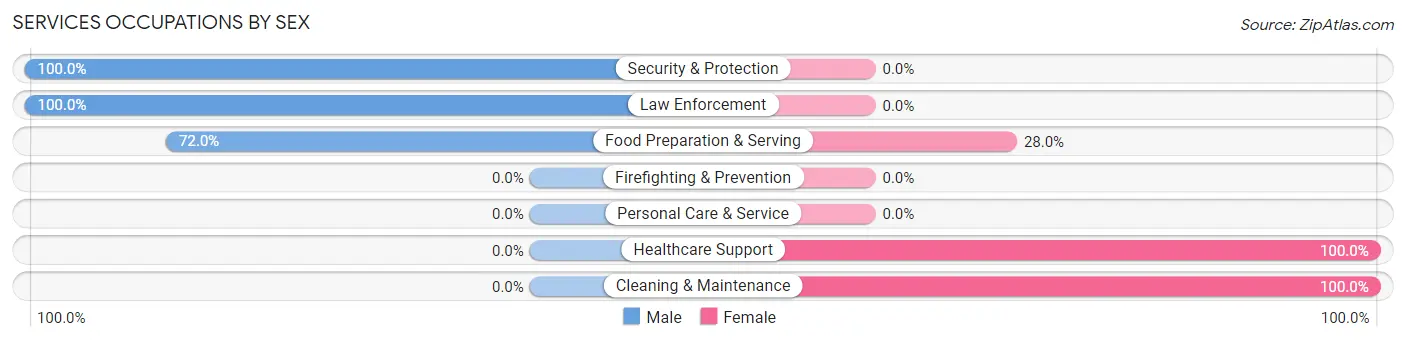
Services Occupations by Sex
Within the Services occupations in Warrior, the most male-oriented occupations are Security & Protection (100.0%), Law Enforcement (100.0%), and Food Preparation & Serving (72.0%), while the most female-oriented occupations are Healthcare Support (100.0%), Cleaning & Maintenance (100.0%), and Food Preparation & Serving (28.0%).
| Occupation | Male | Female |
| Healthcare Support | 0 (0.0%) | 10 (100.0%) |
| Security & Protection | 60 (100.0%) | 0 (0.0%) |
| Firefighting & Prevention | 0 (0.0%) | 0 (0.0%) |
| Law Enforcement | 60 (100.0%) | 0 (0.0%) |
| Food Preparation & Serving | 18 (72.0%) | 7 (28.0%) |
| Cleaning & Maintenance | 0 (0.0%) | 95 (100.0%) |
| Personal Care & Service | 0 (0.0%) | 0 (0.0%) |
| Total (Category) | 78 (41.0%) | 112 (59.0%) |
| Total (Overall) | 526 (56.3%) | 409 (43.7%) |
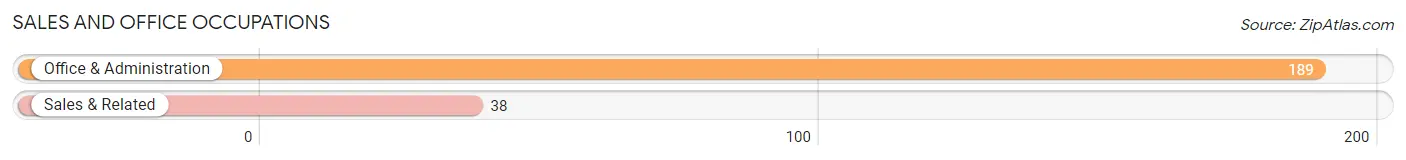
Sales and Office Occupations
The most common Sales and Office occupations in Warrior are Office & Administration (189 | 20.2%), and Sales & Related (38 | 4.1%).
Sales and Office Occupations by Sex
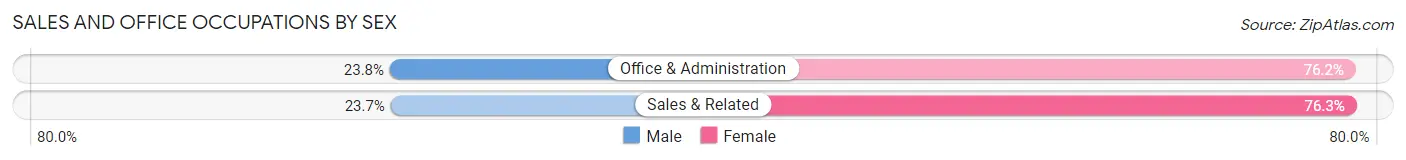
| Occupation | Male | Female |
| Sales & Related | 9 (23.7%) | 29 (76.3%) |
| Office & Administration | 45 (23.8%) | 144 (76.2%) |
| Total (Category) | 54 (23.8%) | 173 (76.2%) |
| Total (Overall) | 526 (56.3%) | 409 (43.7%) |
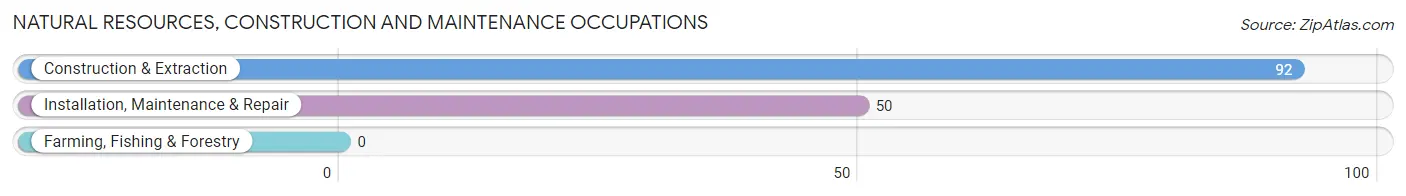
Natural Resources, Construction and Maintenance Occupations
The most common Natural Resources, Construction and Maintenance occupations in Warrior are Construction & Extraction (92 | 9.8%), and Installation, Maintenance & Repair (50 | 5.3%).
Natural Resources, Construction and Maintenance Occupations by Sex
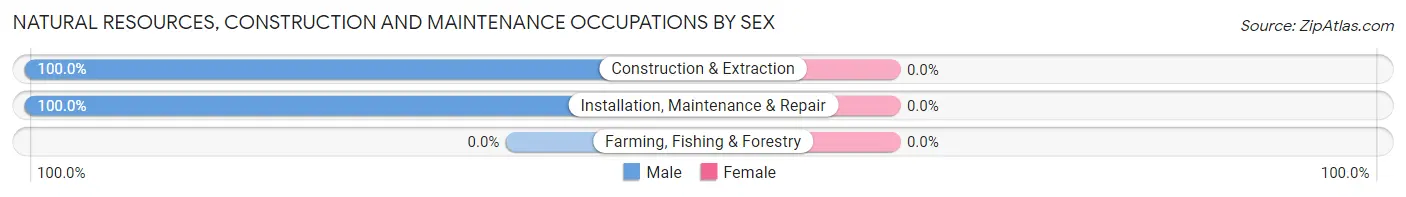
| Occupation | Male | Female |
| Farming, Fishing & Forestry | 0 (0.0%) | 0 (0.0%) |
| Construction & Extraction | 92 (100.0%) | 0 (0.0%) |
| Installation, Maintenance & Repair | 50 (100.0%) | 0 (0.0%) |
| Total (Category) | 142 (100.0%) | 0 (0.0%) |
| Total (Overall) | 526 (56.3%) | 409 (43.7%) |
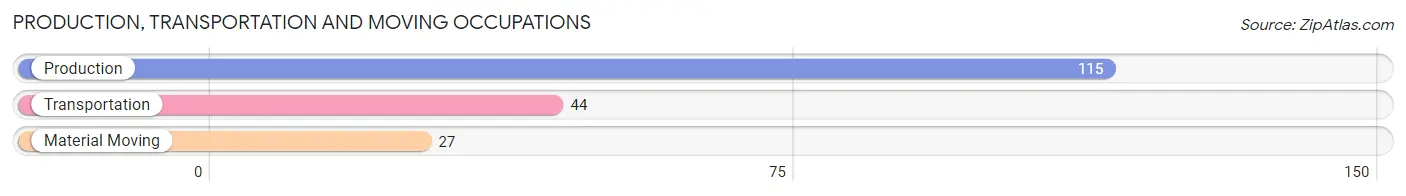
Production, Transportation and Moving Occupations
The most common Production, Transportation and Moving occupations in Warrior are Production (115 | 12.3%), Transportation (44 | 4.7%), and Material Moving (27 | 2.9%).
Production, Transportation and Moving Occupations by Sex
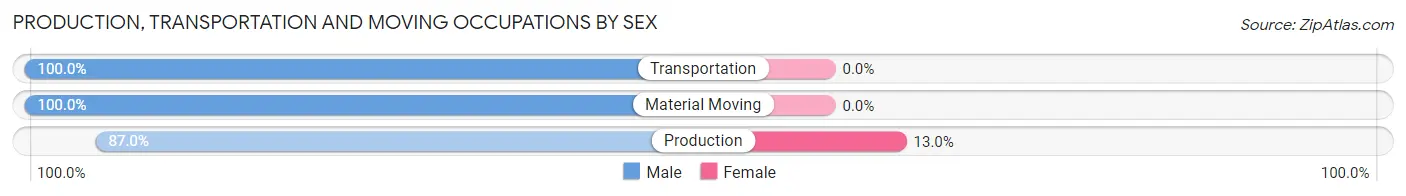
| Occupation | Male | Female |
| Production | 100 (87.0%) | 15 (13.0%) |
| Transportation | 44 (100.0%) | 0 (0.0%) |
| Material Moving | 27 (100.0%) | 0 (0.0%) |
| Total (Category) | 171 (91.9%) | 15 (8.1%) |
| Total (Overall) | 526 (56.3%) | 409 (43.7%) |
Employment Industries by Sex in Warrior
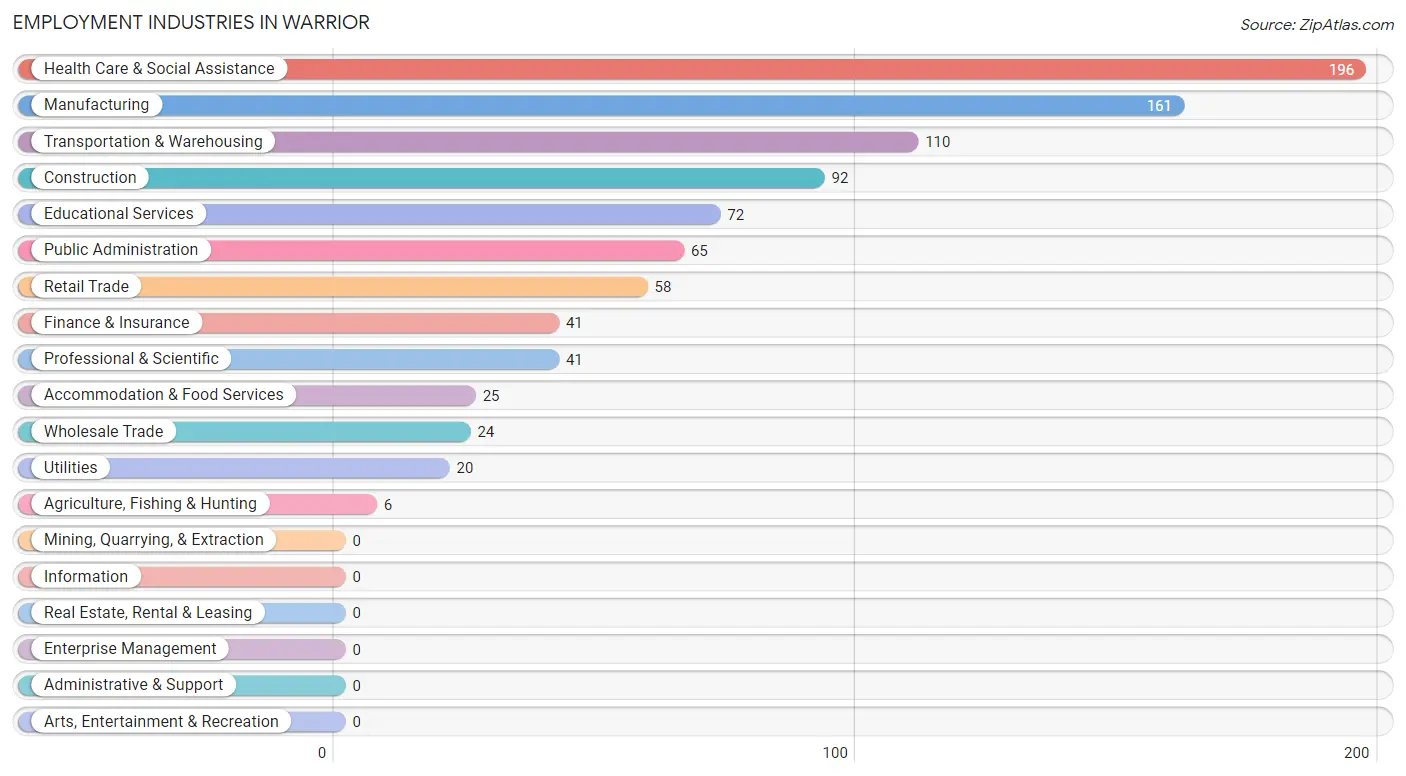
Employment Industries in Warrior
The major employment industries in Warrior include Health Care & Social Assistance (196 | 21.0%), Manufacturing (161 | 17.2%), Transportation & Warehousing (110 | 11.8%), Construction (92 | 9.8%), and Educational Services (72 | 7.7%).
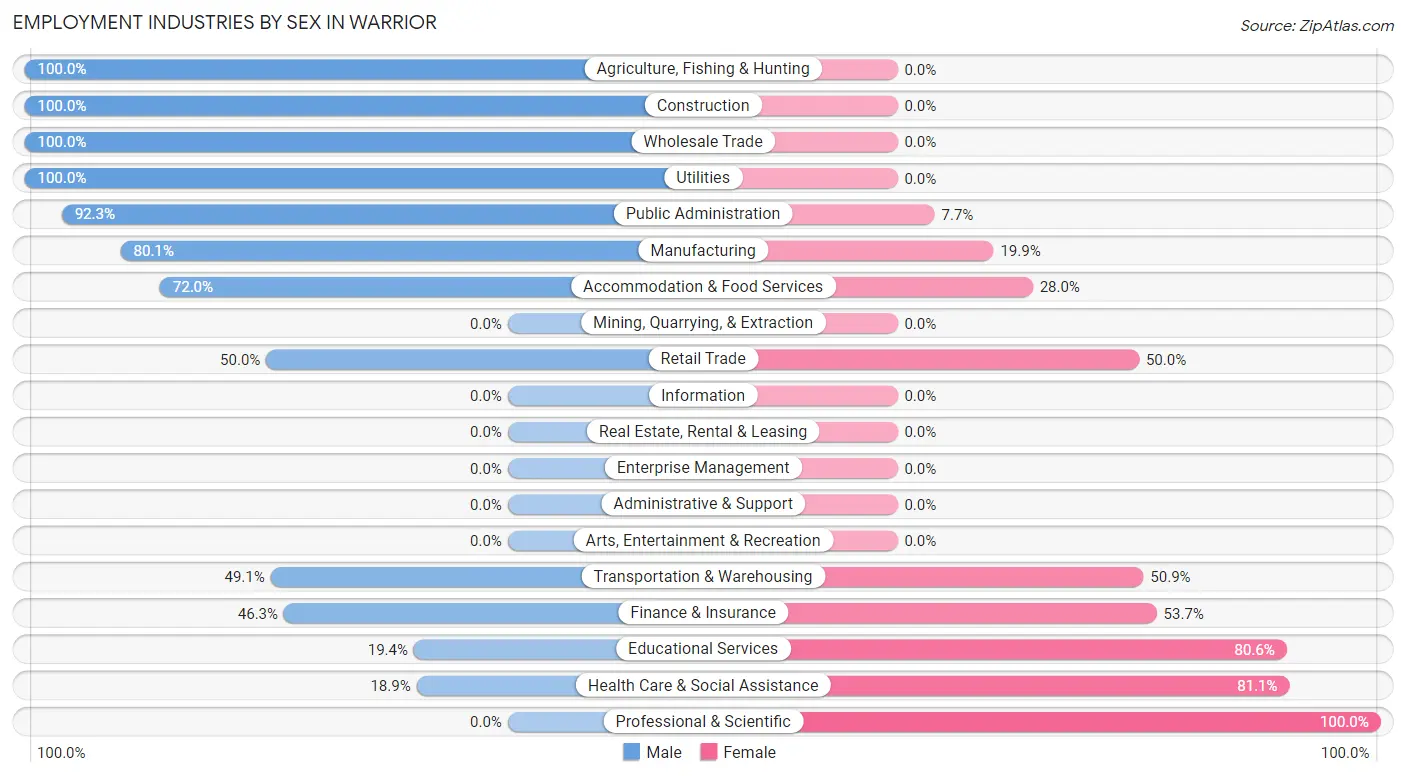
Employment Industries by Sex in Warrior
The Warrior industries that see more men than women are Agriculture, Fishing & Hunting (100.0%), Construction (100.0%), and Wholesale Trade (100.0%), whereas the industries that tend to have a higher number of women are Professional & Scientific (100.0%), Health Care & Social Assistance (81.1%), and Educational Services (80.6%).
| Industry | Male | Female |
| Agriculture, Fishing & Hunting | 6 (100.0%) | 0 (0.0%) |
| Mining, Quarrying, & Extraction | 0 (0.0%) | 0 (0.0%) |
| Construction | 92 (100.0%) | 0 (0.0%) |
| Manufacturing | 129 (80.1%) | 32 (19.9%) |
| Wholesale Trade | 24 (100.0%) | 0 (0.0%) |
| Retail Trade | 29 (50.0%) | 29 (50.0%) |
| Transportation & Warehousing | 54 (49.1%) | 56 (50.9%) |
| Utilities | 20 (100.0%) | 0 (0.0%) |
| Information | 0 (0.0%) | 0 (0.0%) |
| Finance & Insurance | 19 (46.3%) | 22 (53.7%) |
| Real Estate, Rental & Leasing | 0 (0.0%) | 0 (0.0%) |
| Professional & Scientific | 0 (0.0%) | 41 (100.0%) |
| Enterprise Management | 0 (0.0%) | 0 (0.0%) |
| Administrative & Support | 0 (0.0%) | 0 (0.0%) |
| Educational Services | 14 (19.4%) | 58 (80.6%) |
| Health Care & Social Assistance | 37 (18.9%) | 159 (81.1%) |
| Arts, Entertainment & Recreation | 0 (0.0%) | 0 (0.0%) |
| Accommodation & Food Services | 18 (72.0%) | 7 (28.0%) |
| Public Administration | 60 (92.3%) | 5 (7.7%) |
| Total | 526 (56.3%) | 409 (43.7%) |
Education in Warrior
School Enrollment in Warrior
The most common levels of schooling among the 306 students in Warrior are college / undergraduate (170 | 55.6%), high school (60 | 19.6%), and middle school (25 | 8.2%).
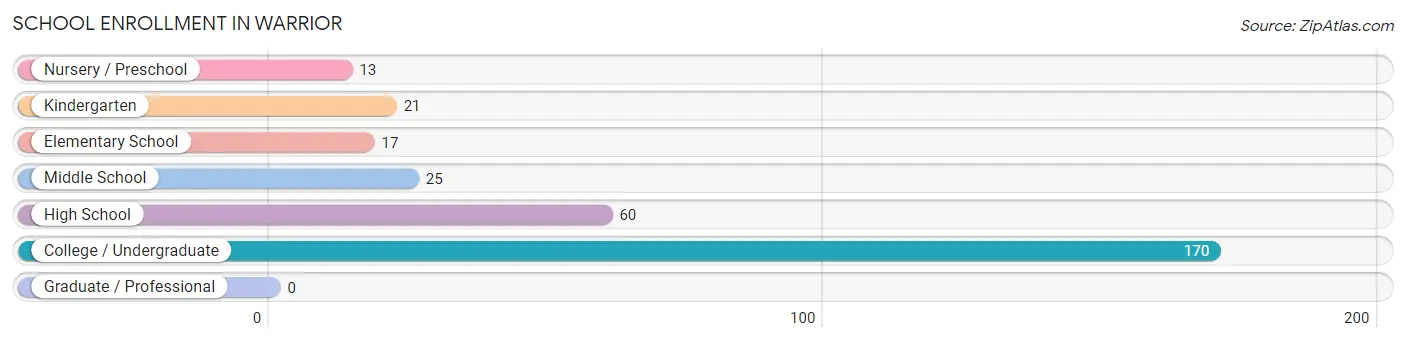
| School Level | # Students | % Students |
| Nursery / Preschool | 13 | 4.3% |
| Kindergarten | 21 | 6.9% |
| Elementary School | 17 | 5.6% |
| Middle School | 25 | 8.2% |
| High School | 60 | 19.6% |
| College / Undergraduate | 170 | 55.6% |
| Graduate / Professional | 0 | 0.0% |
| Total | 306 | 100.0% |
School Enrollment by Age by Funding Source in Warrior
Out of a total of 306 students who are enrolled in schools in Warrior, 9 (2.9%) attend a private institution, while the remaining 297 (97.1%) are enrolled in public schools. The age group of 5 to 9 year old has the highest likelihood of being enrolled in private schools, with 9 (18.4% in the age bracket) enrolled. Conversely, the age group of 10 to 14 year olds has the lowest likelihood of being enrolled in a private school, with 46 (100.0% in the age bracket) attending a public institution.
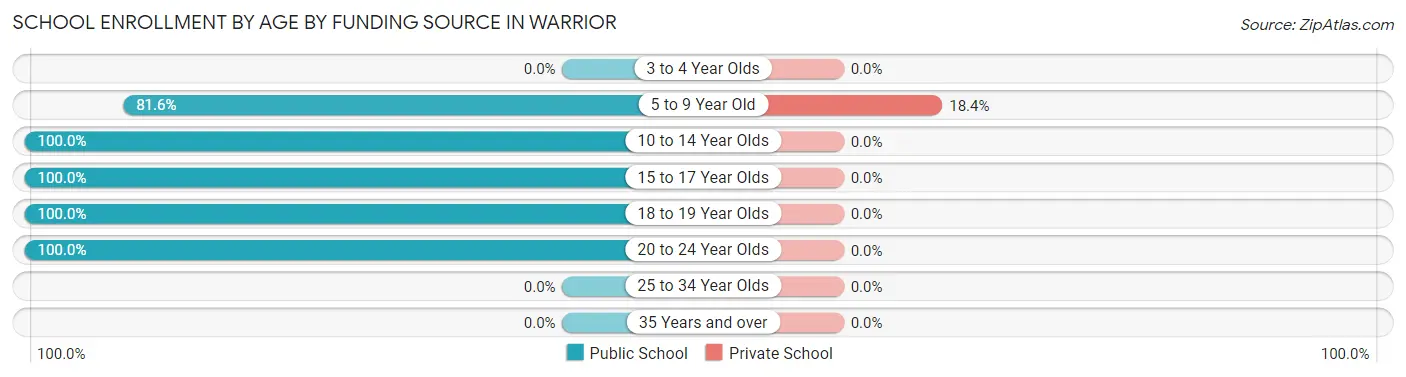
| Age Bracket | Public School | Private School |
| 3 to 4 Year Olds | 0 (0.0%) | 0 (0.0%) |
| 5 to 9 Year Old | 40 (81.6%) | 9 (18.4%) |
| 10 to 14 Year Olds | 46 (100.0%) | 0 (0.0%) |
| 15 to 17 Year Olds | 9 (100.0%) | 0 (0.0%) |
| 18 to 19 Year Olds | 182 (100.0%) | 0 (0.0%) |
| 20 to 24 Year Olds | 20 (100.0%) | 0 (0.0%) |
| 25 to 34 Year Olds | 0 (0.0%) | 0 (0.0%) |
| 35 Years and over | 0 (0.0%) | 0 (0.0%) |
| Total | 297 (97.1%) | 9 (2.9%) |
Educational Attainment by Field of Study in Warrior
Business (116 | 53.5%), psychology (40 | 18.4%), arts & humanities (24 | 11.1%), engineering (18 | 8.3%), and bio, nature & agricultural (11 | 5.1%) are the most common fields of study among 217 individuals in Warrior who have obtained a bachelor's degree or higher.
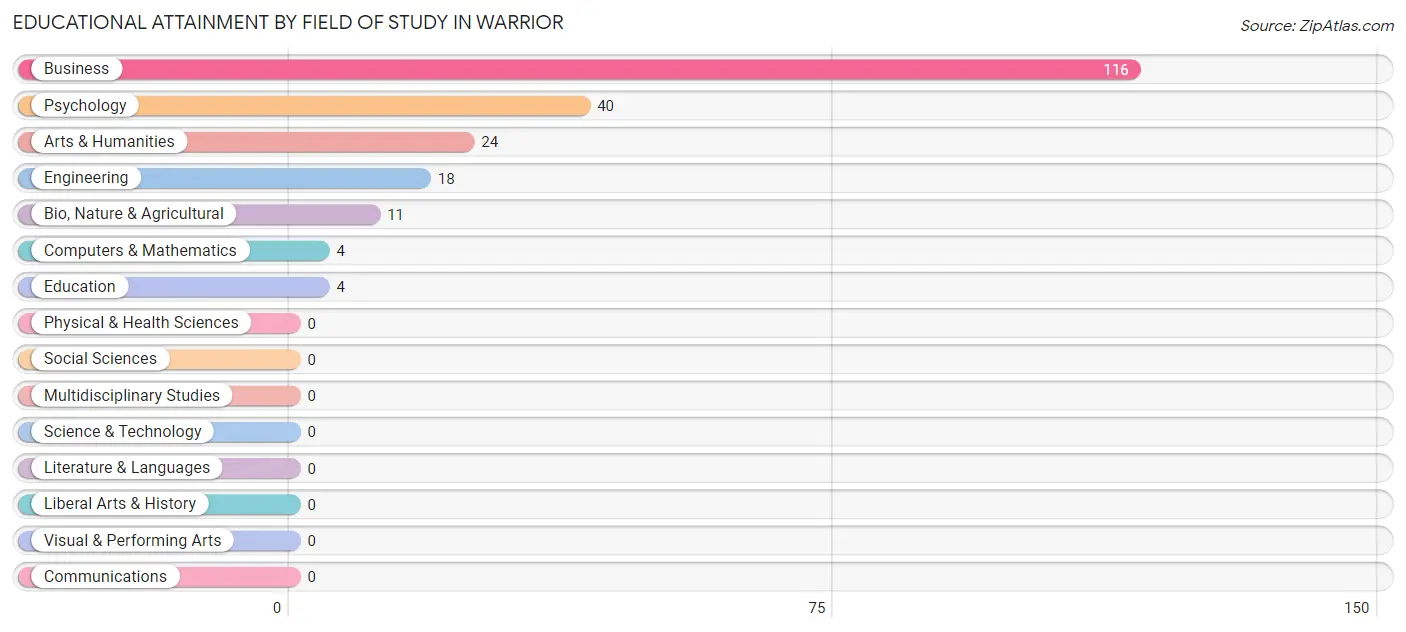
| Field of Study | # Graduates | % Graduates |
| Computers & Mathematics | 4 | 1.8% |
| Bio, Nature & Agricultural | 11 | 5.1% |
| Physical & Health Sciences | 0 | 0.0% |
| Psychology | 40 | 18.4% |
| Social Sciences | 0 | 0.0% |
| Engineering | 18 | 8.3% |
| Multidisciplinary Studies | 0 | 0.0% |
| Science & Technology | 0 | 0.0% |
| Business | 116 | 53.5% |
| Education | 4 | 1.8% |
| Literature & Languages | 0 | 0.0% |
| Liberal Arts & History | 0 | 0.0% |
| Visual & Performing Arts | 0 | 0.0% |
| Communications | 0 | 0.0% |
| Arts & Humanities | 24 | 11.1% |
| Total | 217 | 100.0% |
Transportation & Commute in Warrior
Vehicle Availability by Sex in Warrior
The most prevalent vehicle ownership categories in Warrior are males with 3 vehicles (213, accounting for 42.3%) and females with 3 vehicles (143, making up 52.1%).
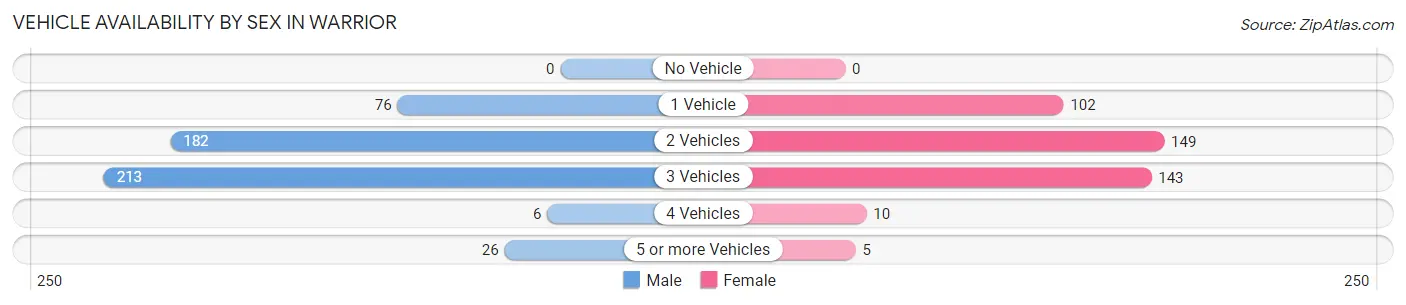
| Vehicles Available | Male | Female |
| No Vehicle | 0 (0.0%) | 0 (0.0%) |
| 1 Vehicle | 76 (15.1%) | 102 (24.9%) |
| 2 Vehicles | 182 (36.2%) | 149 (36.4%) |
| 3 Vehicles | 213 (42.3%) | 143 (35.0%) |
| 4 Vehicles | 6 (1.2%) | 10 (2.4%) |
| 5 or more Vehicles | 26 (5.2%) | 5 (1.2%) |
| Total | 503 (100.0%) | 409 (100.0%) |
Commute Time in Warrior
The most frequently occuring commute durations in Warrior are 20 to 24 minutes (187 commuters, 21.4%), 30 to 34 minutes (140 commuters, 16.0%), and 25 to 29 minutes (106 commuters, 12.1%).
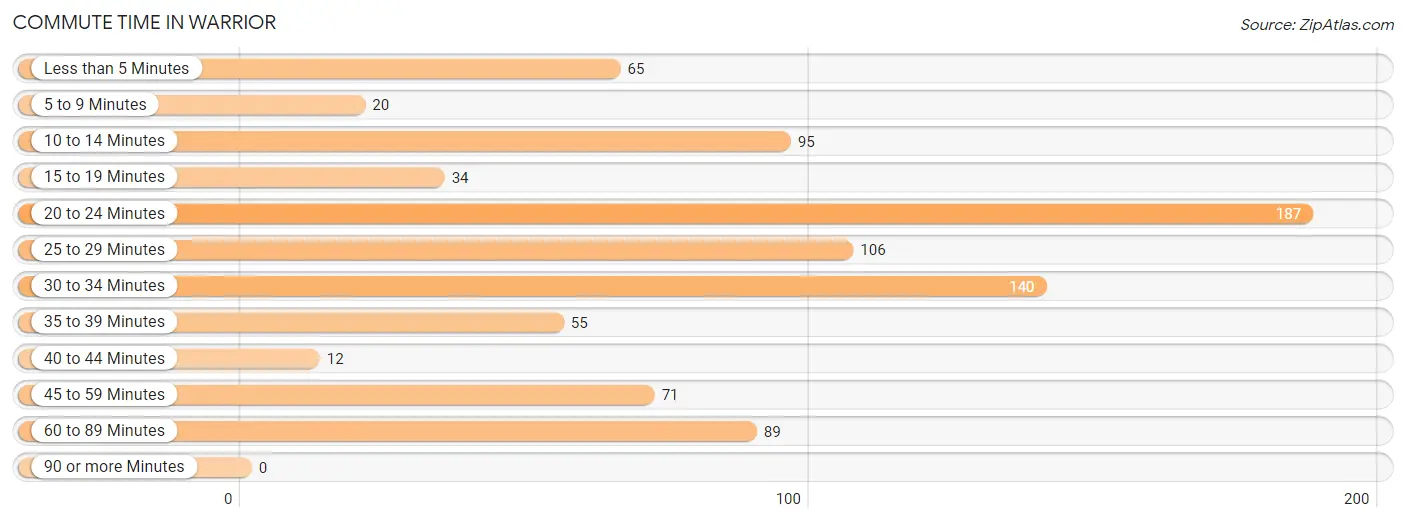
| Commute Time | # Commuters | % Commuters |
| Less than 5 Minutes | 65 | 7.4% |
| 5 to 9 Minutes | 20 | 2.3% |
| 10 to 14 Minutes | 95 | 10.9% |
| 15 to 19 Minutes | 34 | 3.9% |
| 20 to 24 Minutes | 187 | 21.4% |
| 25 to 29 Minutes | 106 | 12.1% |
| 30 to 34 Minutes | 140 | 16.0% |
| 35 to 39 Minutes | 55 | 6.3% |
| 40 to 44 Minutes | 12 | 1.4% |
| 45 to 59 Minutes | 71 | 8.1% |
| 60 to 89 Minutes | 89 | 10.2% |
| 90 or more Minutes | 0 | 0.0% |
Commute Time by Sex in Warrior
The most common commute times in Warrior are 20 to 24 minutes (103 commuters, 20.6%) for males and 20 to 24 minutes (84 commuters, 22.5%) for females.
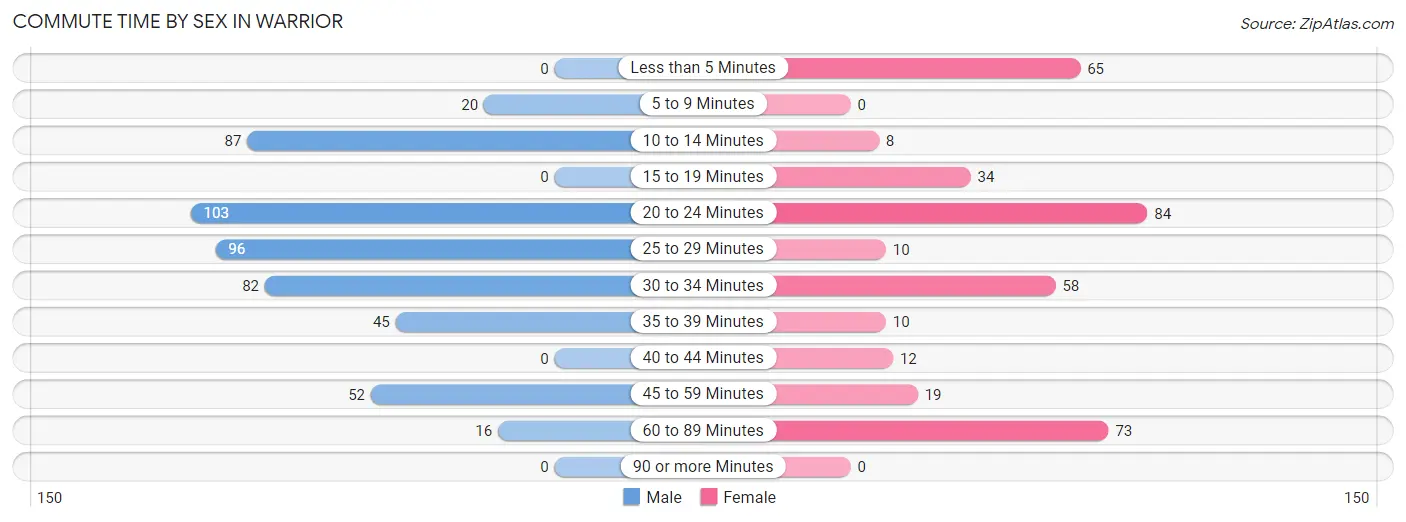
| Commute Time | Male | Female |
| Less than 5 Minutes | 0 (0.0%) | 65 (17.4%) |
| 5 to 9 Minutes | 20 (4.0%) | 0 (0.0%) |
| 10 to 14 Minutes | 87 (17.4%) | 8 (2.1%) |
| 15 to 19 Minutes | 0 (0.0%) | 34 (9.1%) |
| 20 to 24 Minutes | 103 (20.6%) | 84 (22.5%) |
| 25 to 29 Minutes | 96 (19.2%) | 10 (2.7%) |
| 30 to 34 Minutes | 82 (16.4%) | 58 (15.5%) |
| 35 to 39 Minutes | 45 (9.0%) | 10 (2.7%) |
| 40 to 44 Minutes | 0 (0.0%) | 12 (3.2%) |
| 45 to 59 Minutes | 52 (10.4%) | 19 (5.1%) |
| 60 to 89 Minutes | 16 (3.2%) | 73 (19.6%) |
| 90 or more Minutes | 0 (0.0%) | 0 (0.0%) |
Time of Departure to Work by Sex in Warrior
The most frequent times of departure to work in Warrior are 6:00 AM to 6:29 AM (119, 23.7%) for males and 7:00 AM to 7:29 AM (191, 51.2%) for females.
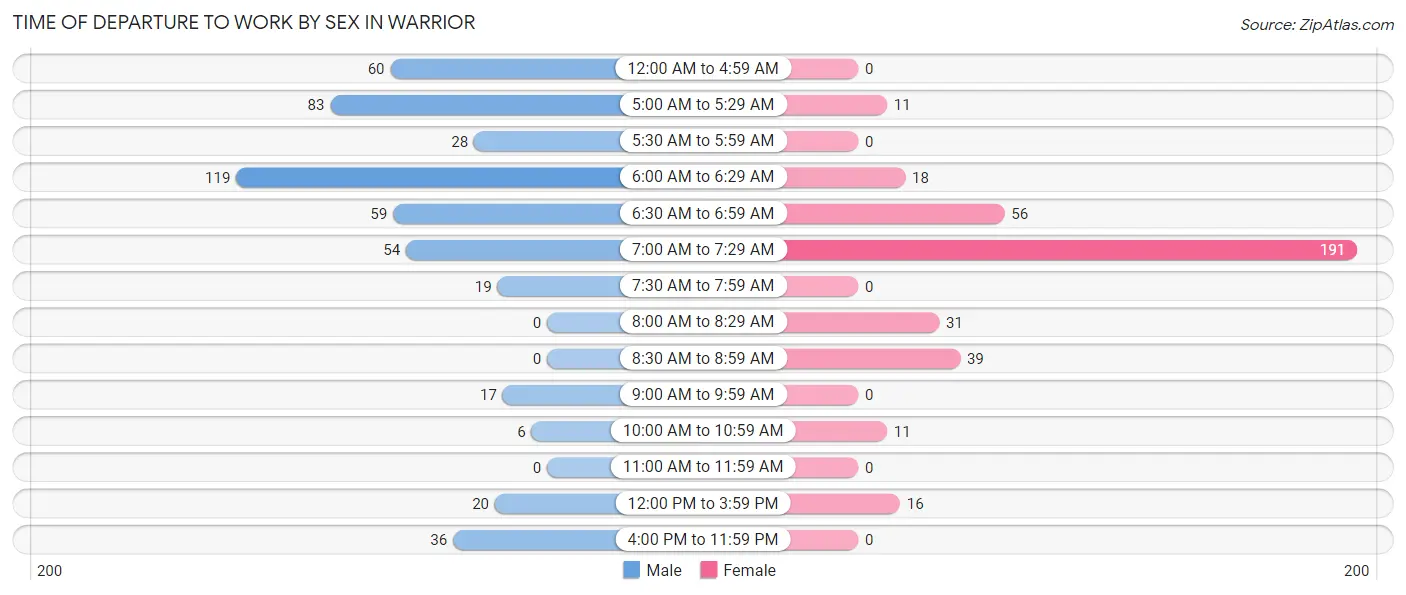
| Time of Departure | Male | Female |
| 12:00 AM to 4:59 AM | 60 (12.0%) | 0 (0.0%) |
| 5:00 AM to 5:29 AM | 83 (16.6%) | 11 (2.9%) |
| 5:30 AM to 5:59 AM | 28 (5.6%) | 0 (0.0%) |
| 6:00 AM to 6:29 AM | 119 (23.7%) | 18 (4.8%) |
| 6:30 AM to 6:59 AM | 59 (11.8%) | 56 (15.0%) |
| 7:00 AM to 7:29 AM | 54 (10.8%) | 191 (51.2%) |
| 7:30 AM to 7:59 AM | 19 (3.8%) | 0 (0.0%) |
| 8:00 AM to 8:29 AM | 0 (0.0%) | 31 (8.3%) |
| 8:30 AM to 8:59 AM | 0 (0.0%) | 39 (10.5%) |
| 9:00 AM to 9:59 AM | 17 (3.4%) | 0 (0.0%) |
| 10:00 AM to 10:59 AM | 6 (1.2%) | 11 (2.9%) |
| 11:00 AM to 11:59 AM | 0 (0.0%) | 0 (0.0%) |
| 12:00 PM to 3:59 PM | 20 (4.0%) | 16 (4.3%) |
| 4:00 PM to 11:59 PM | 36 (7.2%) | 0 (0.0%) |
| Total | 501 (100.0%) | 373 (100.0%) |
Housing Occupancy in Warrior
Occupancy by Ownership in Warrior
Of the total 1,336 dwellings in Warrior, owner-occupied units account for 838 (62.7%), while renter-occupied units make up 498 (37.3%).
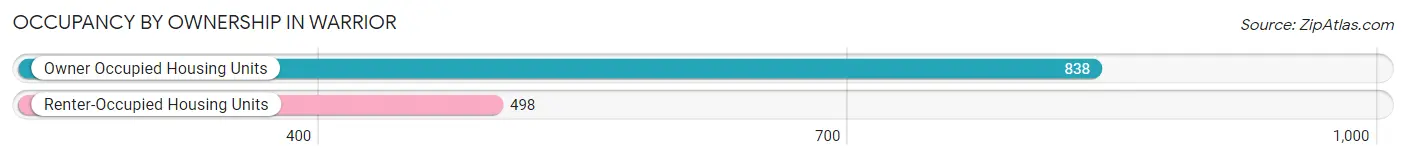
| Occupancy | # Housing Units | % Housing Units |
| Owner Occupied Housing Units | 838 | 62.7% |
| Renter-Occupied Housing Units | 498 | 37.3% |
| Total Occupied Housing Units | 1,336 | 100.0% |
Occupancy by Household Size in Warrior
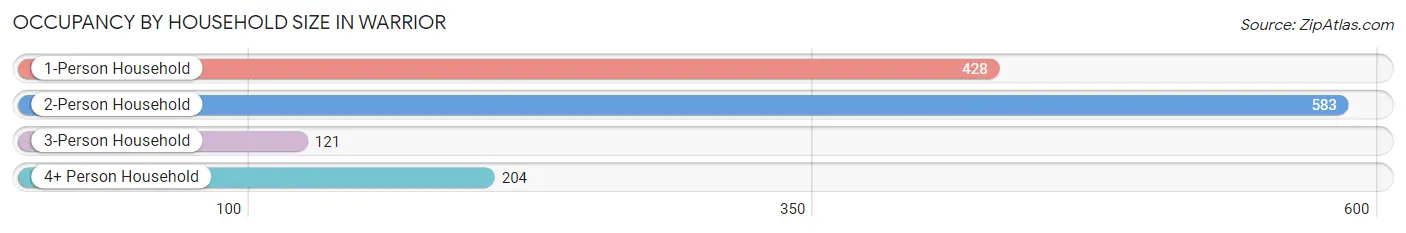
| Household Size | # Housing Units | % Housing Units |
| 1-Person Household | 428 | 32.0% |
| 2-Person Household | 583 | 43.6% |
| 3-Person Household | 121 | 9.1% |
| 4+ Person Household | 204 | 15.3% |
| Total Housing Units | 1,336 | 100.0% |
Occupancy by Ownership by Household Size in Warrior
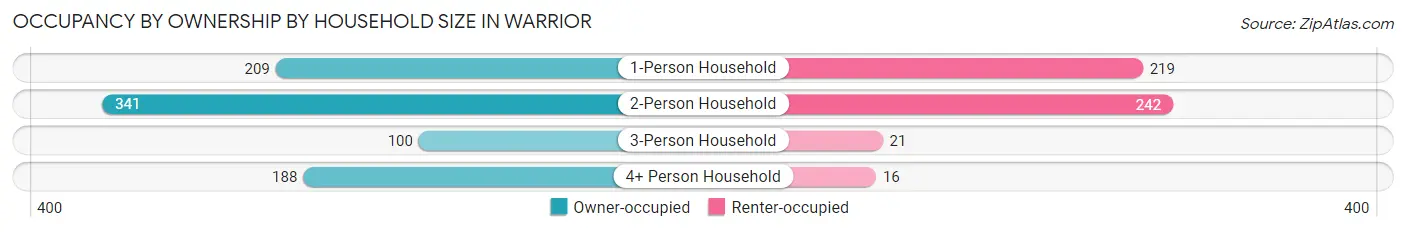
| Household Size | Owner-occupied | Renter-occupied |
| 1-Person Household | 209 (48.8%) | 219 (51.2%) |
| 2-Person Household | 341 (58.5%) | 242 (41.5%) |
| 3-Person Household | 100 (82.6%) | 21 (17.4%) |
| 4+ Person Household | 188 (92.2%) | 16 (7.8%) |
| Total Housing Units | 838 (62.7%) | 498 (37.3%) |
Occupancy by Educational Attainment in Warrior
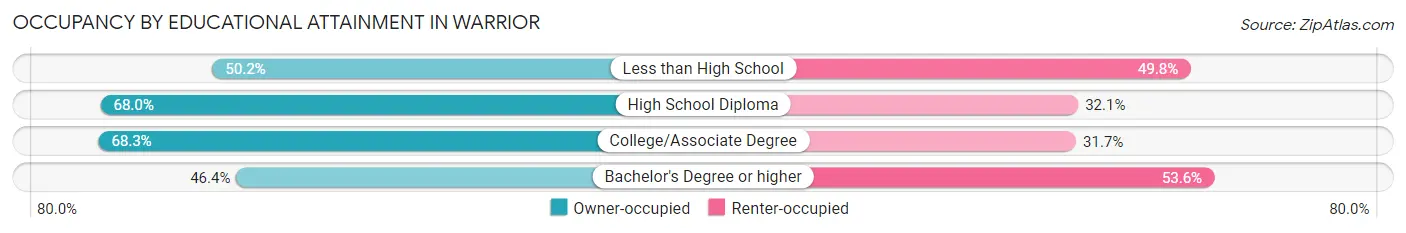
| Household Size | Owner-occupied | Renter-occupied |
| Less than High School | 117 (50.2%) | 116 (49.8%) |
| High School Diploma | 318 (67.9%) | 150 (32.1%) |
| College/Associate Degree | 338 (68.3%) | 157 (31.7%) |
| Bachelor's Degree or higher | 65 (46.4%) | 75 (53.6%) |
Occupancy by Age of Householder in Warrior
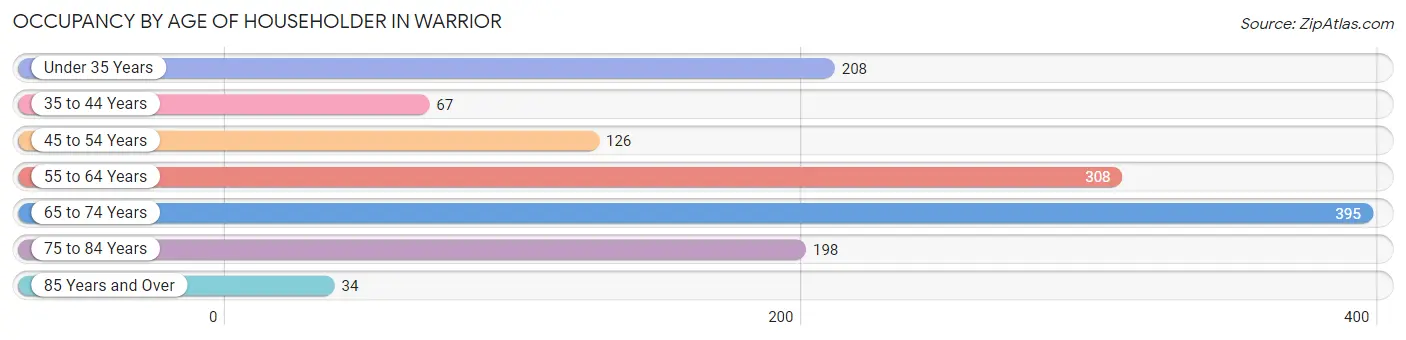
| Age Bracket | # Households | % Households |
| Under 35 Years | 208 | 15.6% |
| 35 to 44 Years | 67 | 5.0% |
| 45 to 54 Years | 126 | 9.4% |
| 55 to 64 Years | 308 | 23.1% |
| 65 to 74 Years | 395 | 29.6% |
| 75 to 84 Years | 198 | 14.8% |
| 85 Years and Over | 34 | 2.5% |
| Total | 1,336 | 100.0% |
Housing Finances in Warrior
Median Income by Occupancy in Warrior
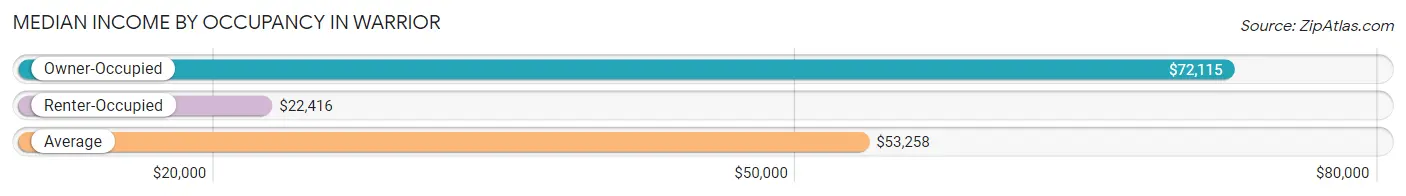
| Occupancy Type | # Households | Median Income |
| Owner-Occupied | 838 (62.7%) | $72,115 |
| Renter-Occupied | 498 (37.3%) | $22,416 |
| Average | 1,336 (100.0%) | $53,258 |
Occupancy by Householder Income Bracket in Warrior
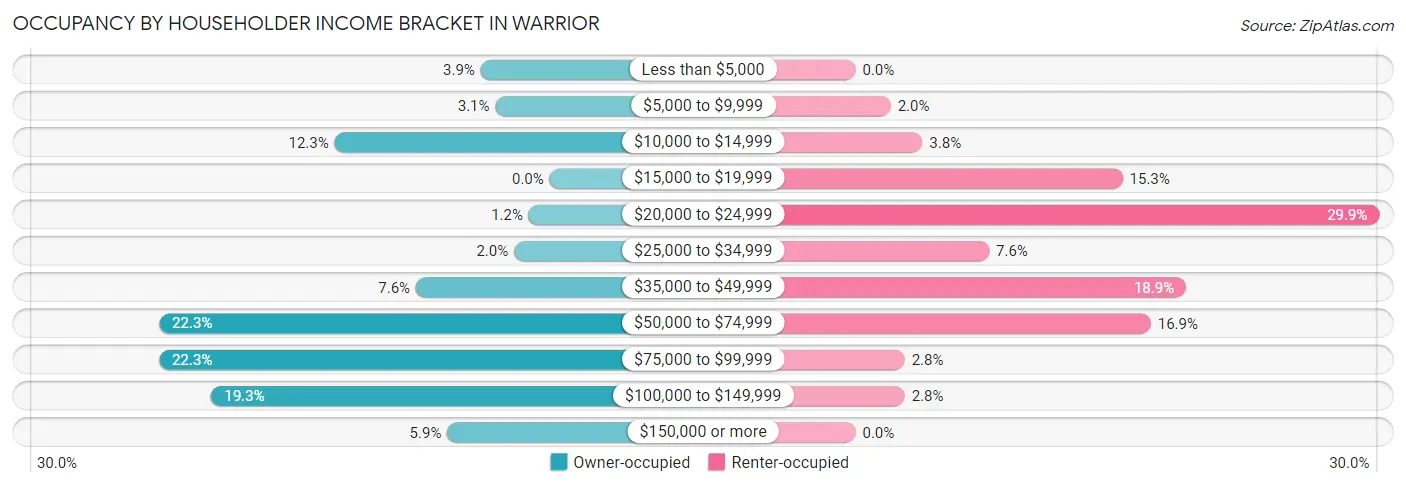
| Income Bracket | Owner-occupied | Renter-occupied |
| Less than $5,000 | 33 (3.9%) | 0 (0.0%) |
| $5,000 to $9,999 | 26 (3.1%) | 10 (2.0%) |
| $10,000 to $14,999 | 103 (12.3%) | 19 (3.8%) |
| $15,000 to $19,999 | 0 (0.0%) | 76 (15.3%) |
| $20,000 to $24,999 | 10 (1.2%) | 149 (29.9%) |
| $25,000 to $34,999 | 17 (2.0%) | 38 (7.6%) |
| $35,000 to $49,999 | 64 (7.6%) | 94 (18.9%) |
| $50,000 to $74,999 | 187 (22.3%) | 84 (16.9%) |
| $75,000 to $99,999 | 187 (22.3%) | 14 (2.8%) |
| $100,000 to $149,999 | 162 (19.3%) | 14 (2.8%) |
| $150,000 or more | 49 (5.9%) | 0 (0.0%) |
| Total | 838 (100.0%) | 498 (100.0%) |
Monthly Housing Cost Tiers in Warrior
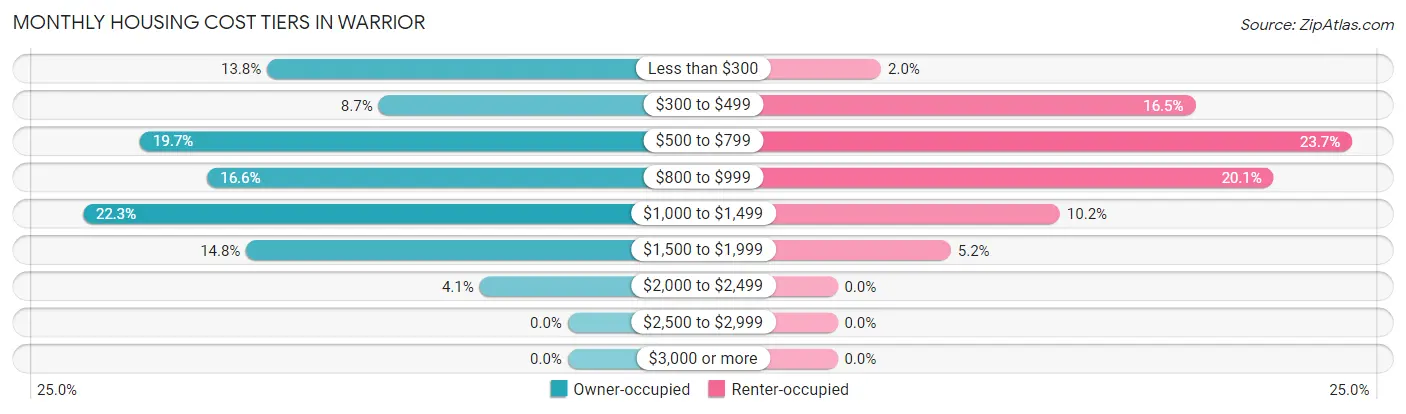
| Monthly Cost | Owner-occupied | Renter-occupied |
| Less than $300 | 116 (13.8%) | 10 (2.0%) |
| $300 to $499 | 73 (8.7%) | 82 (16.5%) |
| $500 to $799 | 165 (19.7%) | 118 (23.7%) |
| $800 to $999 | 139 (16.6%) | 100 (20.1%) |
| $1,000 to $1,499 | 187 (22.3%) | 51 (10.2%) |
| $1,500 to $1,999 | 124 (14.8%) | 26 (5.2%) |
| $2,000 to $2,499 | 34 (4.1%) | 0 (0.0%) |
| $2,500 to $2,999 | 0 (0.0%) | 0 (0.0%) |
| $3,000 or more | 0 (0.0%) | 0 (0.0%) |
| Total | 838 (100.0%) | 498 (100.0%) |
Physical Housing Characteristics in Warrior
Housing Structures in Warrior
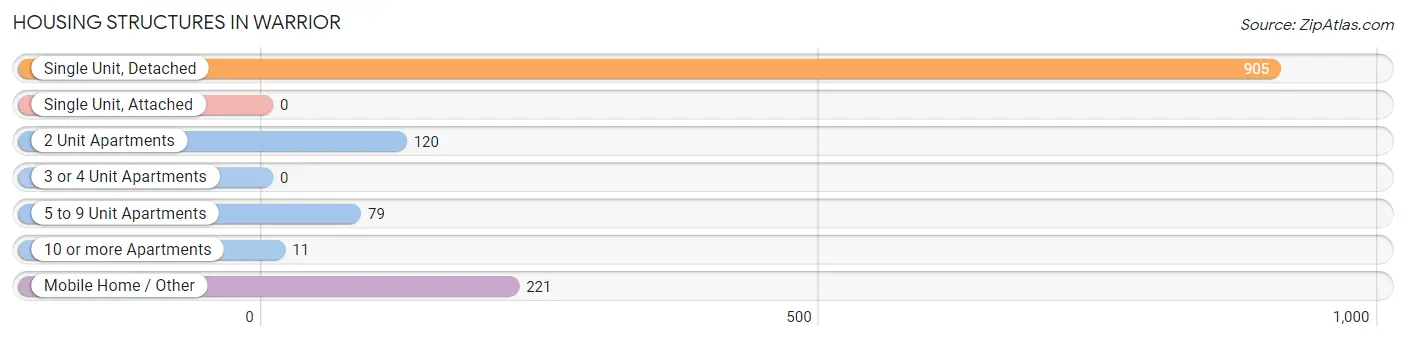
| Structure Type | # Housing Units | % Housing Units |
| Single Unit, Detached | 905 | 67.7% |
| Single Unit, Attached | 0 | 0.0% |
| 2 Unit Apartments | 120 | 9.0% |
| 3 or 4 Unit Apartments | 0 | 0.0% |
| 5 to 9 Unit Apartments | 79 | 5.9% |
| 10 or more Apartments | 11 | 0.8% |
| Mobile Home / Other | 221 | 16.5% |
| Total | 1,336 | 100.0% |
Housing Structures by Occupancy in Warrior
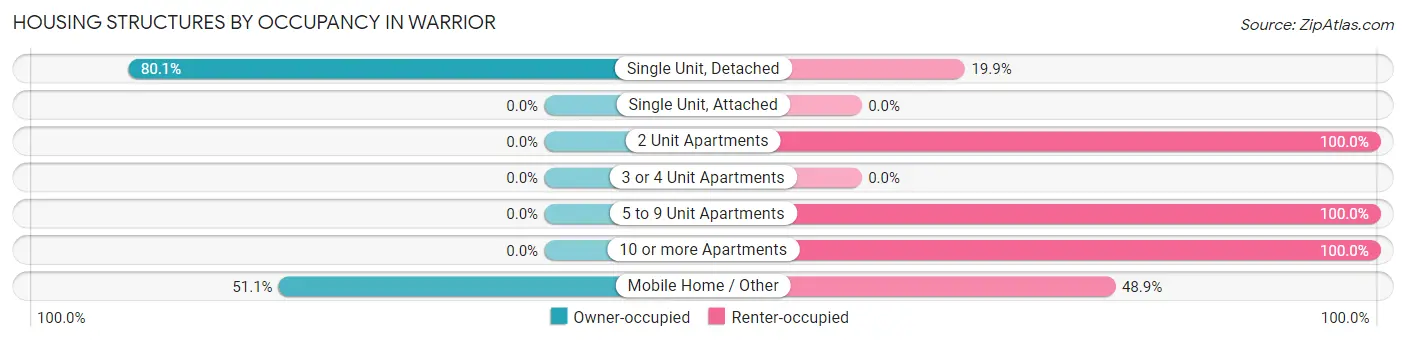
| Structure Type | Owner-occupied | Renter-occupied |
| Single Unit, Detached | 725 (80.1%) | 180 (19.9%) |
| Single Unit, Attached | 0 (0.0%) | 0 (0.0%) |
| 2 Unit Apartments | 0 (0.0%) | 120 (100.0%) |
| 3 or 4 Unit Apartments | 0 (0.0%) | 0 (0.0%) |
| 5 to 9 Unit Apartments | 0 (0.0%) | 79 (100.0%) |
| 10 or more Apartments | 0 (0.0%) | 11 (100.0%) |
| Mobile Home / Other | 113 (51.1%) | 108 (48.9%) |
| Total | 838 (62.7%) | 498 (37.3%) |
Housing Structures by Number of Rooms in Warrior
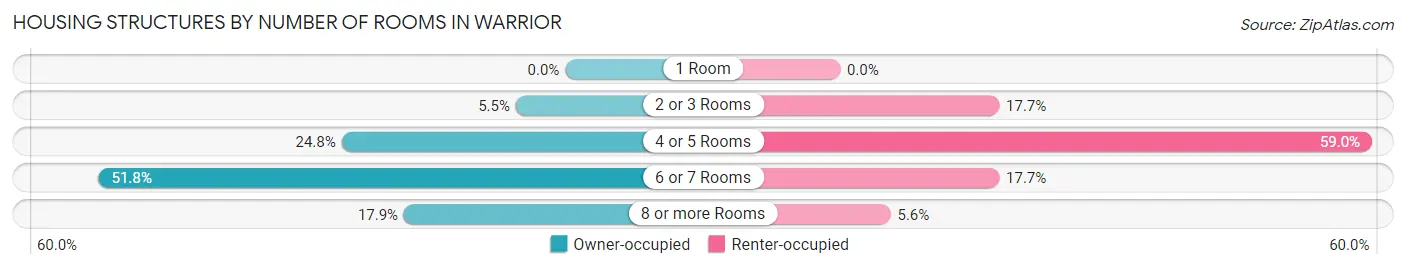
| Number of Rooms | Owner-occupied | Renter-occupied |
| 1 Room | 0 (0.0%) | 0 (0.0%) |
| 2 or 3 Rooms | 46 (5.5%) | 88 (17.7%) |
| 4 or 5 Rooms | 208 (24.8%) | 294 (59.0%) |
| 6 or 7 Rooms | 434 (51.8%) | 88 (17.7%) |
| 8 or more Rooms | 150 (17.9%) | 28 (5.6%) |
| Total | 838 (100.0%) | 498 (100.0%) |
Housing Structure by Heating Type in Warrior
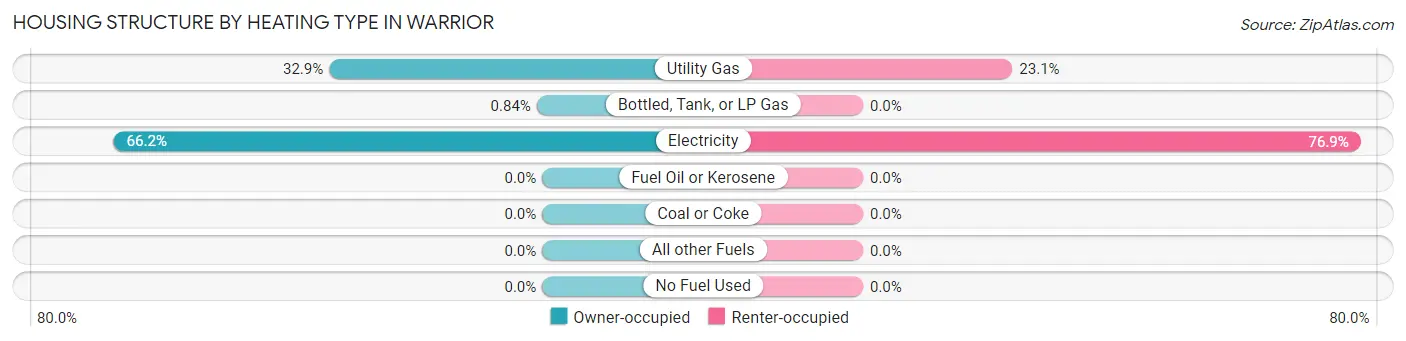
| Heating Type | Owner-occupied | Renter-occupied |
| Utility Gas | 276 (32.9%) | 115 (23.1%) |
| Bottled, Tank, or LP Gas | 7 (0.8%) | 0 (0.0%) |
| Electricity | 555 (66.2%) | 383 (76.9%) |
| Fuel Oil or Kerosene | 0 (0.0%) | 0 (0.0%) |
| Coal or Coke | 0 (0.0%) | 0 (0.0%) |
| All other Fuels | 0 (0.0%) | 0 (0.0%) |
| No Fuel Used | 0 (0.0%) | 0 (0.0%) |
| Total | 838 (100.0%) | 498 (100.0%) |
Household Vehicle Usage in Warrior
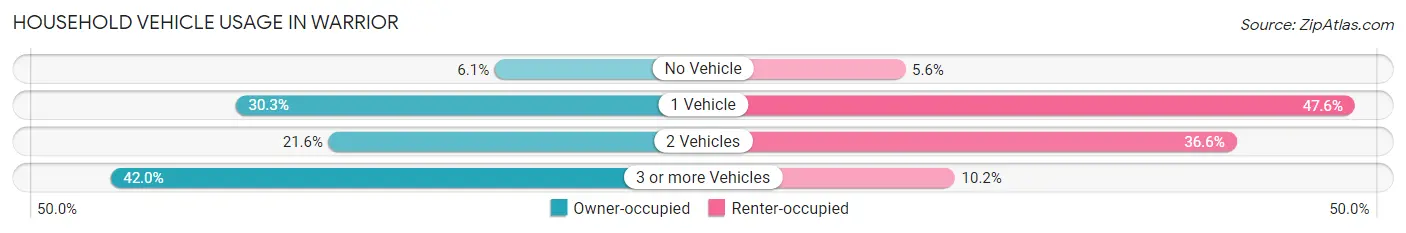
| Vehicles per Household | Owner-occupied | Renter-occupied |
| No Vehicle | 51 (6.1%) | 28 (5.6%) |
| 1 Vehicle | 254 (30.3%) | 237 (47.6%) |
| 2 Vehicles | 181 (21.6%) | 182 (36.5%) |
| 3 or more Vehicles | 352 (42.0%) | 51 (10.2%) |
| Total | 838 (100.0%) | 498 (100.0%) |
Real Estate & Mortgages in Warrior
Real Estate and Mortgage Overview in Warrior
| Characteristic | Without Mortgage | With Mortgage |
| Housing Units | 257 | 581 |
| Median Property Value | $75,600 | $161,400 |
| Median Household Income | - | - |
| Monthly Housing Costs | $381 | $0 |
| Real Estate Taxes | $359 | $184 |
Property Value by Mortgage Status in Warrior
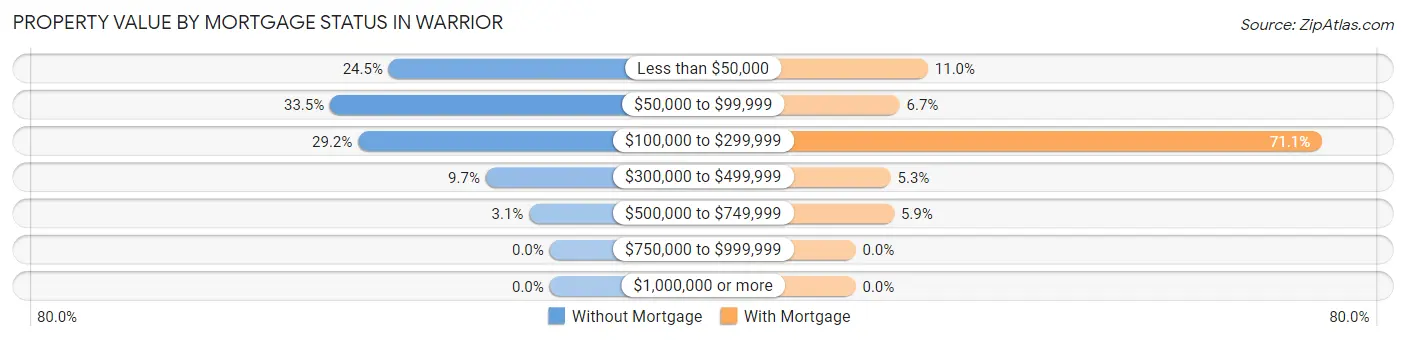
| Property Value | Without Mortgage | With Mortgage |
| Less than $50,000 | 63 (24.5%) | 64 (11.0%) |
| $50,000 to $99,999 | 86 (33.5%) | 39 (6.7%) |
| $100,000 to $299,999 | 75 (29.2%) | 413 (71.1%) |
| $300,000 to $499,999 | 25 (9.7%) | 31 (5.3%) |
| $500,000 to $749,999 | 8 (3.1%) | 34 (5.9%) |
| $750,000 to $999,999 | 0 (0.0%) | 0 (0.0%) |
| $1,000,000 or more | 0 (0.0%) | 0 (0.0%) |
| Total | 257 (100.0%) | 581 (100.0%) |
Household Income by Mortgage Status in Warrior
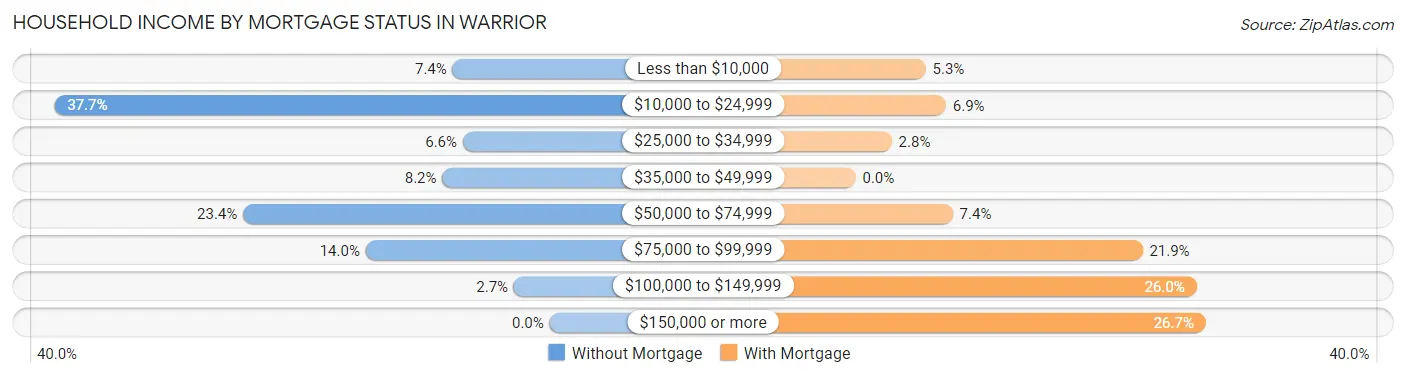
| Household Income | Without Mortgage | With Mortgage |
| Less than $10,000 | 19 (7.4%) | 31 (5.3%) |
| $10,000 to $24,999 | 97 (37.7%) | 40 (6.9%) |
| $25,000 to $34,999 | 17 (6.6%) | 16 (2.8%) |
| $35,000 to $49,999 | 21 (8.2%) | 0 (0.0%) |
| $50,000 to $74,999 | 60 (23.4%) | 43 (7.4%) |
| $75,000 to $99,999 | 36 (14.0%) | 127 (21.9%) |
| $100,000 to $149,999 | 7 (2.7%) | 151 (26.0%) |
| $150,000 or more | 0 (0.0%) | 155 (26.7%) |
| Total | 257 (100.0%) | 581 (100.0%) |
Property Value to Household Income Ratio in Warrior
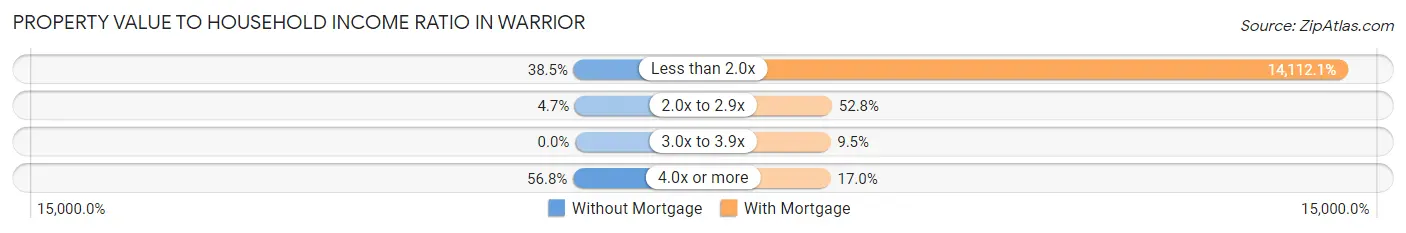
| Value-to-Income Ratio | Without Mortgage | With Mortgage |
| Less than 2.0x | 99 (38.5%) | 81,991 (14,112.0%) |
| 2.0x to 2.9x | 12 (4.7%) | 307 (52.8%) |
| 3.0x to 3.9x | 0 (0.0%) | 55 (9.5%) |
| 4.0x or more | 146 (56.8%) | 99 (17.0%) |
| Total | 257 (100.0%) | 581 (100.0%) |
Real Estate Taxes by Mortgage Status in Warrior
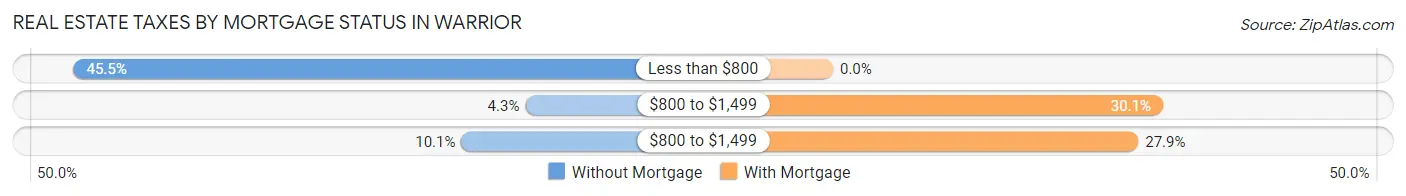
| Property Taxes | Without Mortgage | With Mortgage |
| Less than $800 | 117 (45.5%) | 0 (0.0%) |
| $800 to $1,499 | 11 (4.3%) | 175 (30.1%) |
| $800 to $1,499 | 26 (10.1%) | 162 (27.9%) |
| Total | 257 (100.0%) | 581 (100.0%) |
Health & Disability in Warrior
Health Insurance Coverage by Age in Warrior
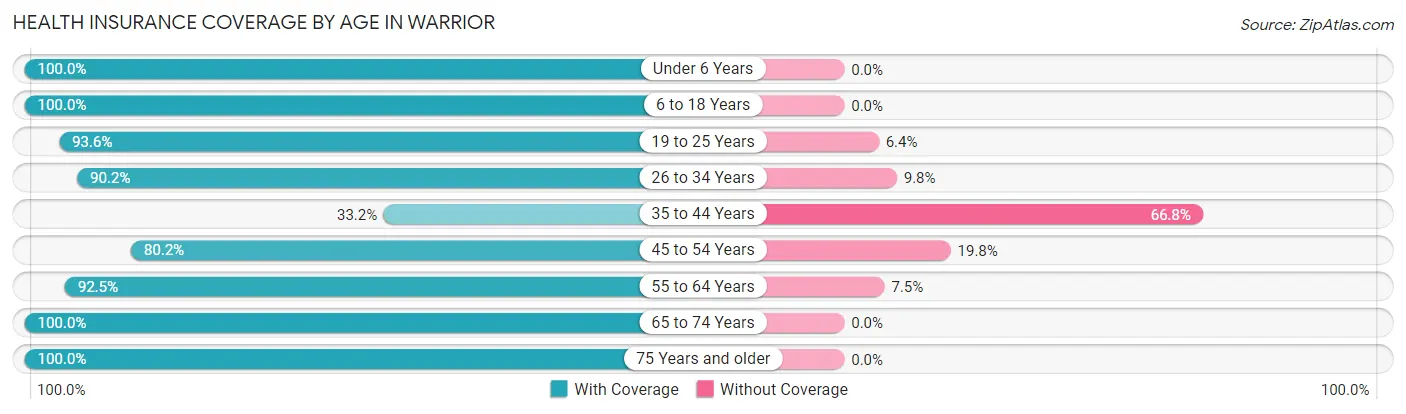
| Age Bracket | With Coverage | Without Coverage |
| Under 6 Years | 131 (100.0%) | 0 (0.0%) |
| 6 to 18 Years | 102 (100.0%) | 0 (0.0%) |
| 19 to 25 Years | 306 (93.6%) | 21 (6.4%) |
| 26 to 34 Years | 304 (90.2%) | 33 (9.8%) |
| 35 to 44 Years | 125 (33.2%) | 252 (66.8%) |
| 45 to 54 Years | 481 (80.2%) | 119 (19.8%) |
| 55 to 64 Years | 357 (92.5%) | 29 (7.5%) |
| 65 to 74 Years | 566 (100.0%) | 0 (0.0%) |
| 75 Years and older | 368 (100.0%) | 0 (0.0%) |
| Total | 2,740 (85.8%) | 454 (14.2%) |
Health Insurance Coverage by Citizenship Status in Warrior
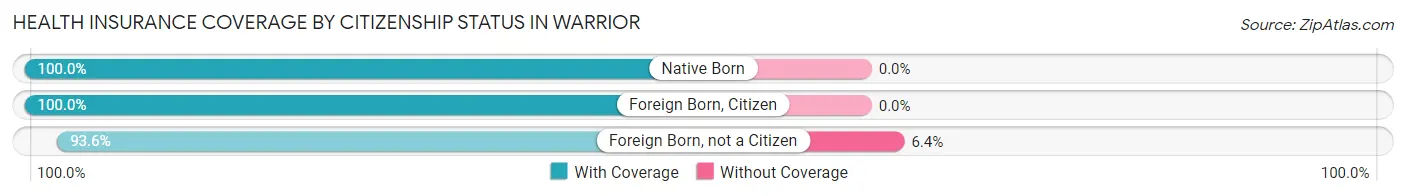
| Citizenship Status | With Coverage | Without Coverage |
| Native Born | 131 (100.0%) | 0 (0.0%) |
| Foreign Born, Citizen | 102 (100.0%) | 0 (0.0%) |
| Foreign Born, not a Citizen | 306 (93.6%) | 21 (6.4%) |
Health Insurance Coverage by Household Income in Warrior
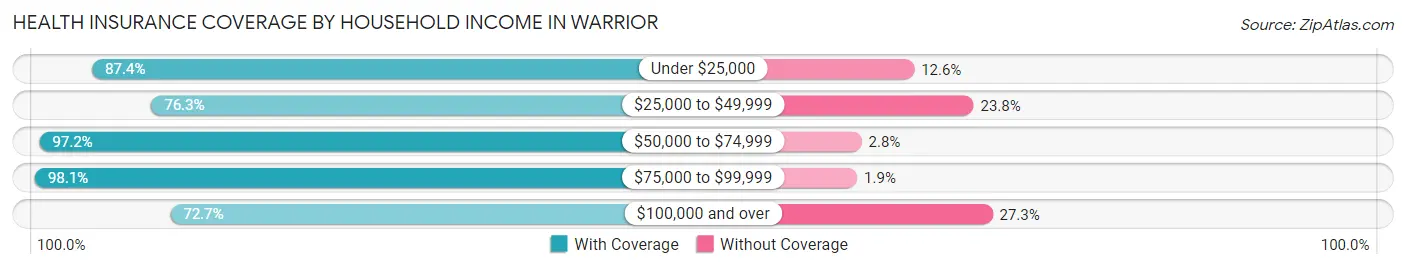
| Household Income | With Coverage | Without Coverage |
| Under $25,000 | 602 (87.4%) | 87 (12.6%) |
| $25,000 to $49,999 | 321 (76.2%) | 100 (23.7%) |
| $50,000 to $74,999 | 420 (97.2%) | 12 (2.8%) |
| $75,000 to $99,999 | 758 (98.1%) | 15 (1.9%) |
| $100,000 and over | 639 (72.7%) | 240 (27.3%) |
Public vs Private Health Insurance Coverage by Age in Warrior
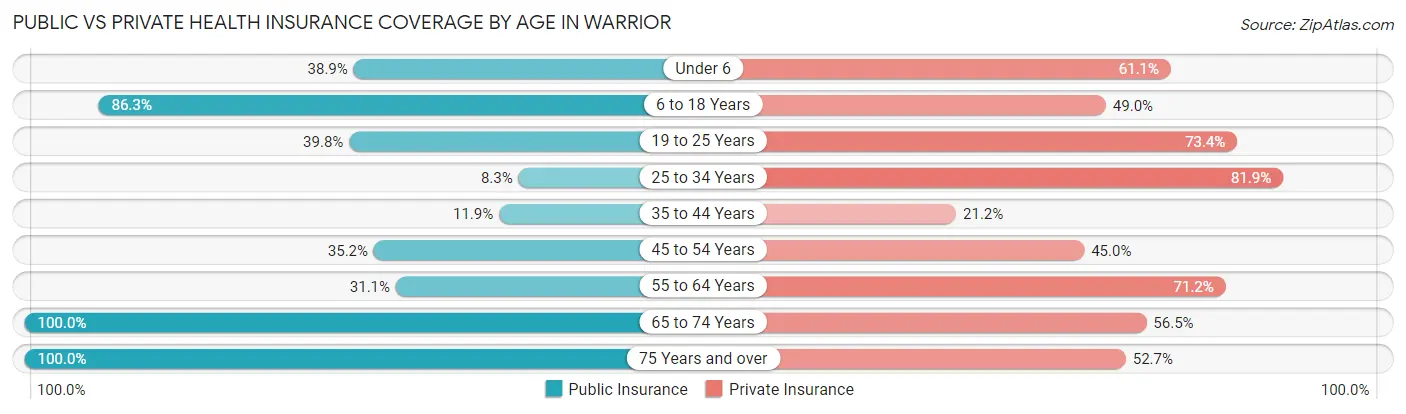
| Age Bracket | Public Insurance | Private Insurance |
| Under 6 | 51 (38.9%) | 80 (61.1%) |
| 6 to 18 Years | 88 (86.3%) | 50 (49.0%) |
| 19 to 25 Years | 130 (39.8%) | 240 (73.4%) |
| 25 to 34 Years | 28 (8.3%) | 276 (81.9%) |
| 35 to 44 Years | 45 (11.9%) | 80 (21.2%) |
| 45 to 54 Years | 211 (35.2%) | 270 (45.0%) |
| 55 to 64 Years | 120 (31.1%) | 275 (71.2%) |
| 65 to 74 Years | 566 (100.0%) | 320 (56.5%) |
| 75 Years and over | 368 (100.0%) | 194 (52.7%) |
| Total | 1,607 (50.3%) | 1,785 (55.9%) |
Disability Status by Sex by Age in Warrior
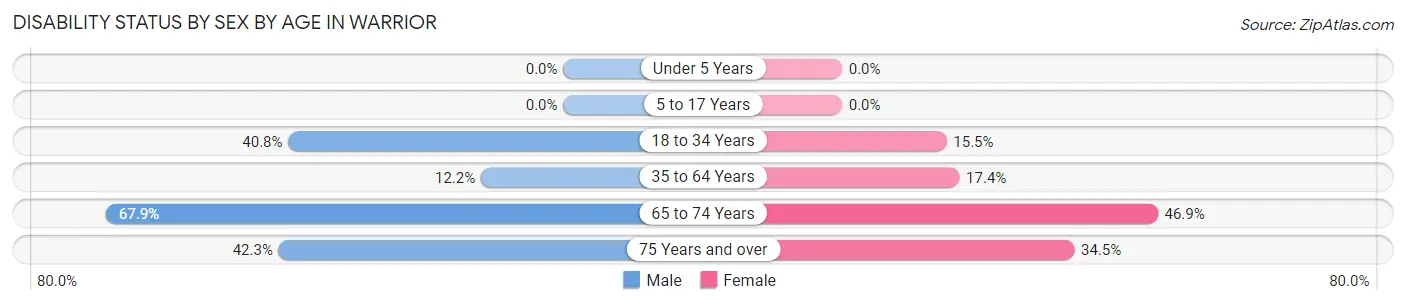
| Age Bracket | Male | Female |
| Under 5 Years | 0 (0.0%) | 0 (0.0%) |
| 5 to 17 Years | 0 (0.0%) | 0 (0.0%) |
| 18 to 34 Years | 158 (40.8%) | 48 (15.5%) |
| 35 to 64 Years | 81 (12.2%) | 122 (17.4%) |
| 65 to 74 Years | 144 (67.9%) | 166 (46.9%) |
| 75 Years and over | 71 (42.3%) | 69 (34.5%) |
Disability Class by Sex by Age in Warrior
Disability Class: Hearing Difficulty
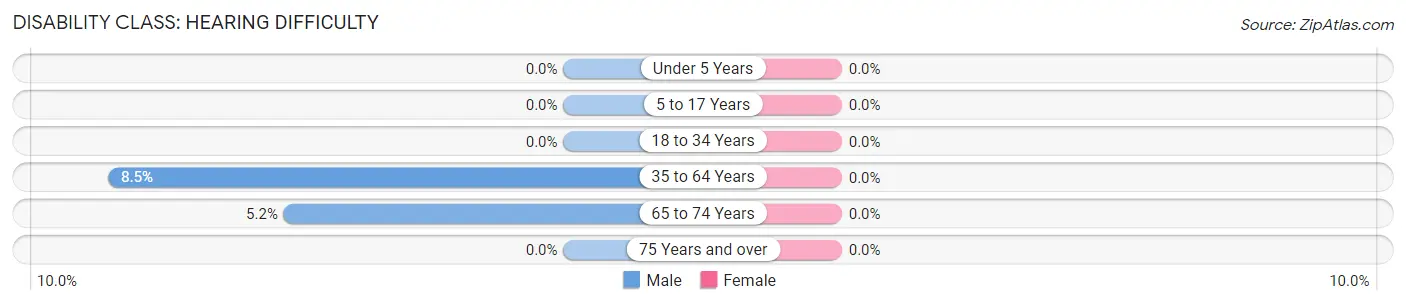
| Age Bracket | Male | Female |
| Under 5 Years | 0 (0.0%) | 0 (0.0%) |
| 5 to 17 Years | 0 (0.0%) | 0 (0.0%) |
| 18 to 34 Years | 0 (0.0%) | 0 (0.0%) |
| 35 to 64 Years | 56 (8.5%) | 0 (0.0%) |
| 65 to 74 Years | 11 (5.2%) | 0 (0.0%) |
| 75 Years and over | 0 (0.0%) | 0 (0.0%) |
Disability Class: Vision Difficulty
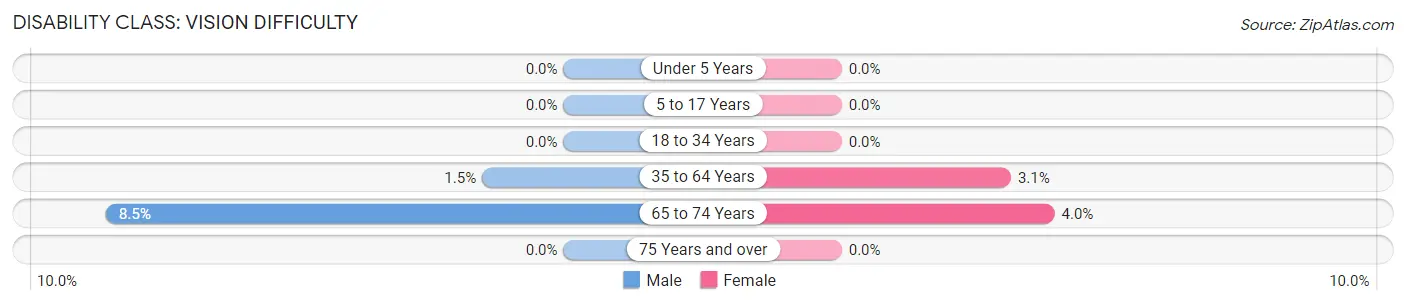
| Age Bracket | Male | Female |
| Under 5 Years | 0 (0.0%) | 0 (0.0%) |
| 5 to 17 Years | 0 (0.0%) | 0 (0.0%) |
| 18 to 34 Years | 0 (0.0%) | 0 (0.0%) |
| 35 to 64 Years | 10 (1.5%) | 22 (3.1%) |
| 65 to 74 Years | 18 (8.5%) | 14 (4.0%) |
| 75 Years and over | 0 (0.0%) | 0 (0.0%) |
Disability Class: Cognitive Difficulty
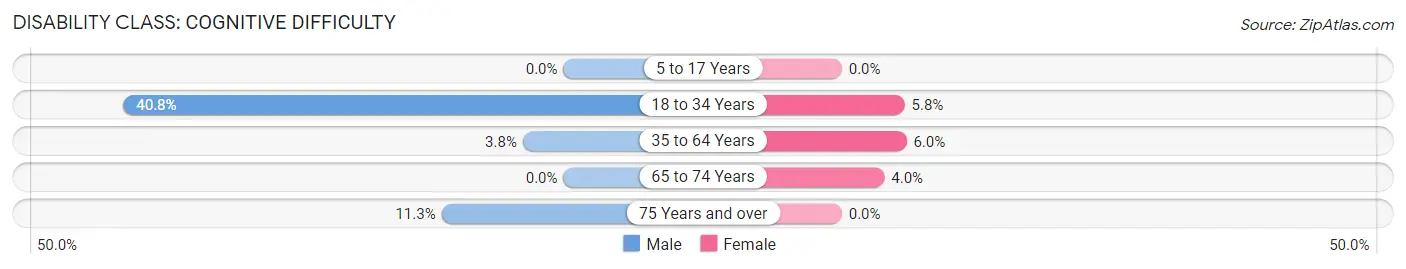
| Age Bracket | Male | Female |
| 5 to 17 Years | 0 (0.0%) | 0 (0.0%) |
| 18 to 34 Years | 158 (40.8%) | 18 (5.8%) |
| 35 to 64 Years | 25 (3.8%) | 42 (6.0%) |
| 65 to 74 Years | 0 (0.0%) | 14 (4.0%) |
| 75 Years and over | 19 (11.3%) | 0 (0.0%) |
Disability Class: Ambulatory Difficulty
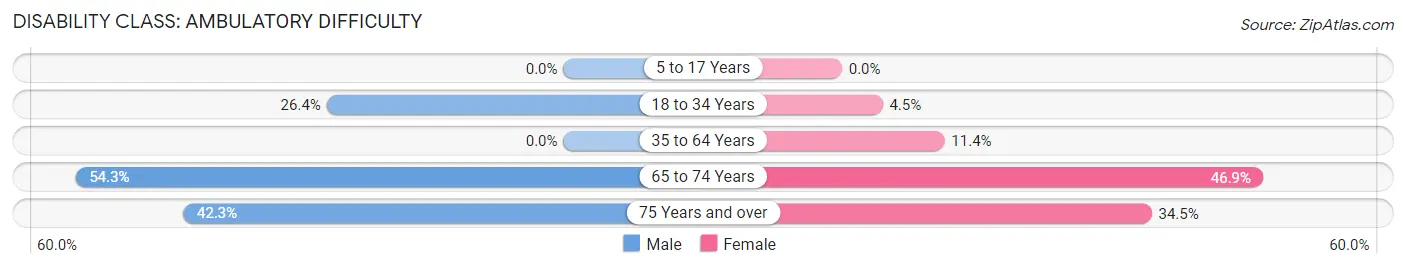
| Age Bracket | Male | Female |
| 5 to 17 Years | 0 (0.0%) | 0 (0.0%) |
| 18 to 34 Years | 102 (26.4%) | 14 (4.5%) |
| 35 to 64 Years | 0 (0.0%) | 80 (11.4%) |
| 65 to 74 Years | 115 (54.2%) | 166 (46.9%) |
| 75 Years and over | 71 (42.3%) | 69 (34.5%) |
Disability Class: Self-Care Difficulty
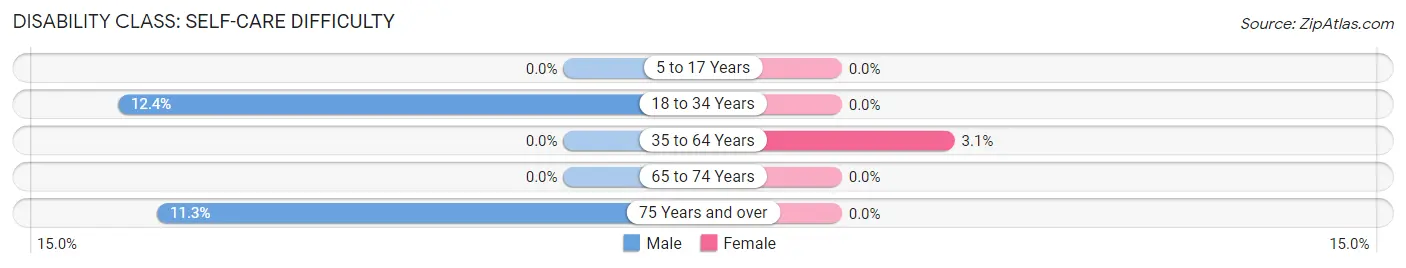
| Age Bracket | Male | Female |
| 5 to 17 Years | 0 (0.0%) | 0 (0.0%) |
| 18 to 34 Years | 48 (12.4%) | 0 (0.0%) |
| 35 to 64 Years | 0 (0.0%) | 22 (3.1%) |
| 65 to 74 Years | 0 (0.0%) | 0 (0.0%) |
| 75 Years and over | 19 (11.3%) | 0 (0.0%) |
Technology Access in Warrior
Computing Device Access in Warrior
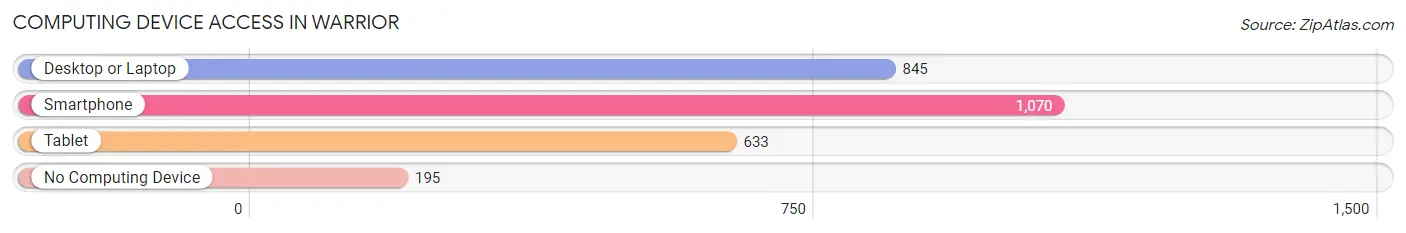
| Device Type | # Households | % Households |
| Desktop or Laptop | 845 | 63.2% |
| Smartphone | 1,070 | 80.1% |
| Tablet | 633 | 47.4% |
| No Computing Device | 195 | 14.6% |
| Total | 1,336 | 100.0% |
Internet Access in Warrior
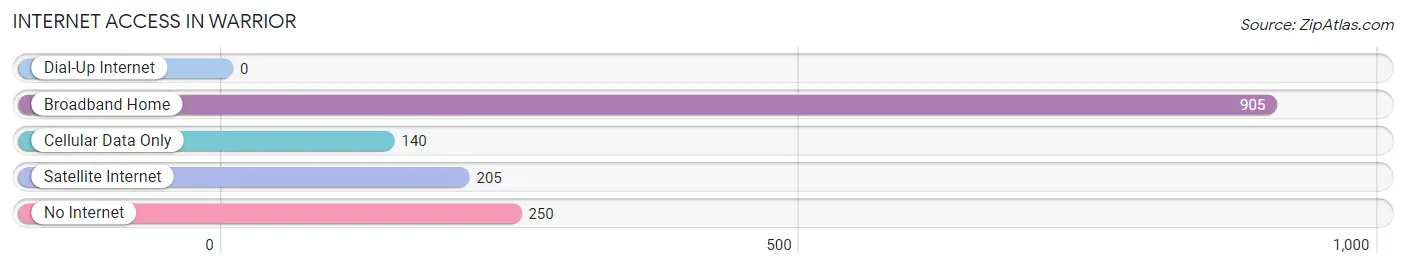
| Internet Type | # Households | % Households |
| Dial-Up Internet | 0 | 0.0% |
| Broadband Home | 905 | 67.7% |
| Cellular Data Only | 140 | 10.5% |
| Satellite Internet | 205 | 15.3% |
| No Internet | 250 | 18.7% |
| Total | 1,336 | 100.0% |
Warrior Summary
Warrior, Alabama is a small town located in the northwest corner of the state, in the foothills of the Appalachian Mountains. It is part of the Birmingham-Hoover Metropolitan Statistical Area and is situated in the Cullman County. The town was founded in 1883 and was named after the nearby Warrior River. As of the 2010 census, the population of Warrior was 1,897.
Geography
Warrior is located at 33°59'N 86°45'W (33.983, -86.75). According to the United States Census Bureau, the town has a total area of 4.2 square miles (10.8 km2), all land.
The town is situated in the foothills of the Appalachian Mountains, and is surrounded by rolling hills and forests. The Warrior River runs through the town, and there are several small creeks and streams in the area.
Climate
Warrior has a humid subtropical climate, with hot, humid summers and mild winters. The average annual temperature is 64°F (18°C), and the average annual precipitation is 52 inches (132 cm).
Demographics
As of the 2010 census, there were 1,897 people, 745 households, and 517 families residing in the town. The population density was 454.2 people per square mile (175.3/km2). There were 817 housing units at an average density of 195.2 per square mile (75.3/km2). The racial makeup of the town was 95.2% White, 0.9% African American, 0.4% Native American, 0.3% Asian, 0.1% Pacific Islander, 1.7% from other races, and 1.4% from two or more races. Hispanic or Latino of any race were 3.2% of the population.
There were 745 households, out of which 28.3% had children under the age of 18 living with them, 51.2% were married couples living together, 12.2% had a female householder with no husband present, and 32.2% were non-families. 28.3% of all households were made up of individuals, and 14.2% had someone living alone who was 65 years of age or older. The average household size was 2.53 and the average family size was 3.09.
In the town, the population was spread out, with 24.2% under the age of 18, 8.2% from 18 to 24, 25.7% from 25 to 44, 24.2% from 45 to 64, and 17.7% who were 65 years of age or older. The median age was 38 years. For every 100 females, there were 87.2 males. For every 100 females age 18 and over, there were 81.2 males.
The median income for a household in the town was $31,250, and the median income for a family was $37,500. Males had a median income of $30,000 versus $20,000 for females. The per capita income for the town was $15,945. About 11.2% of families and 14.2% of the population were below the poverty line, including 19.2% of those under age 18 and 11.2% of those age 65 or over.
Economy
The economy of Warrior is largely based on agriculture and manufacturing. The town is home to several small businesses, including a lumber mill, a feed mill, and a furniture factory. The town also has a few retail stores, restaurants, and a few small service businesses.
The town is also home to a number of farms, which produce a variety of crops, including corn, soybeans, cotton, and hay. The town is also home to a number of poultry farms, which produce eggs and chicken for the local market.
The town is served by the Warrior-Cullman County Airport, which provides general aviation services. The airport is also home to a number of corporate and private aircraft.
Conclusion
Warrior, Alabama is a small town located in the northwest corner of the state, in the foothills of the Appalachian Mountains. It is part of the Birmingham-Hoover Metropolitan Statistical Area and is situated in the Cullman County. The town was founded in 1883 and was named after the nearby Warrior River. As of the 2010 census, the population of Warrior was 1,897. The town has a humid subtropical climate, with hot, humid summers and mild winters. The economy of Warrior is largely based on agriculture and manufacturing, and the town is home to several small businesses, farms, and the Warrior-Cullman County Airport.
Common Questions
What is Per Capita Income in Warrior?
Per Capita income in Warrior is $24,645.
What is the Median Family Income in Warrior?
Median Family Income in Warrior is $69,907.
What is the Median Household income in Warrior?
Median Household Income in Warrior is $53,258.
What is Income or Wage Gap in Warrior?
Income or Wage Gap in Warrior is 58.7%.
Women in Warrior earn 41.3 cents for every dollar earned by a man.
What is Family Income Deficit in Warrior?
Family Income Deficit in Warrior is $6,502.
Families that are below poverty line in Warrior earn $6,502 less on average than the poverty threshold level.
What is Inequality or Gini Index in Warrior?
Inequality or Gini Index in Warrior is 0.39.
What is the Total Population of Warrior?
Total Population of Warrior is 3,206.
What is the Total Male Population of Warrior?
Total Male Population of Warrior is 1,540.
What is the Total Female Population of Warrior?
Total Female Population of Warrior is 1,666.
What is the Ratio of Males per 100 Females in Warrior?
There are 92.44 Males per 100 Females in Warrior.
What is the Ratio of Females per 100 Males in Warrior?
There are 108.18 Females per 100 Males in Warrior.
What is the Median Population Age in Warrior?
Median Population Age in Warrior is 49.7 Years.
What is the Average Family Size in Warrior
Average Family Size in Warrior is 3.1 People.
What is the Average Household Size in Warrior
Average Household Size in Warrior is 2.4 People.
How Large is the Labor Force in Warrior?
There are 1,028 People in the Labor Forcein in Warrior.
What is the Percentage of People in the Labor Force in Warrior?
34.1% of People are in the Labor Force in Warrior.
What is the Unemployment Rate in Warrior?
Unemployment Rate in Warrior is 9.0%.