Pinson, AL
Pinson Map
Pinson Overview
7,209
TOTAL POPULATION
3,335
MALE POPULATION
3,874
FEMALE POPULATION
86.09
MALES / 100 FEMALES
116.16
FEMALES / 100 MALES
34.5
MEDIAN AGE
3.1
AVG FAMILY SIZE
2.7
AVG HOUSEHOLD SIZE
$34,658
PER CAPITA INCOME
$97,459
AVG FAMILY INCOME
$83,673
AVG HOUSEHOLD INCOME
14.9%
WAGE / INCOME GAP [ % ]
85.1¢/ $1
WAGE / INCOME GAP [ $ ]
$11,577
FAMILY INCOME DEFICIT
0.35
INEQUALITY / GINI INDEX
3,812
LABOR FORCE [ PEOPLE ]
65.4%
PERCENT IN LABOR FORCE
4.3%
UNEMPLOYMENT RATE
Pinson Zip Codes
Pinson Area Codes
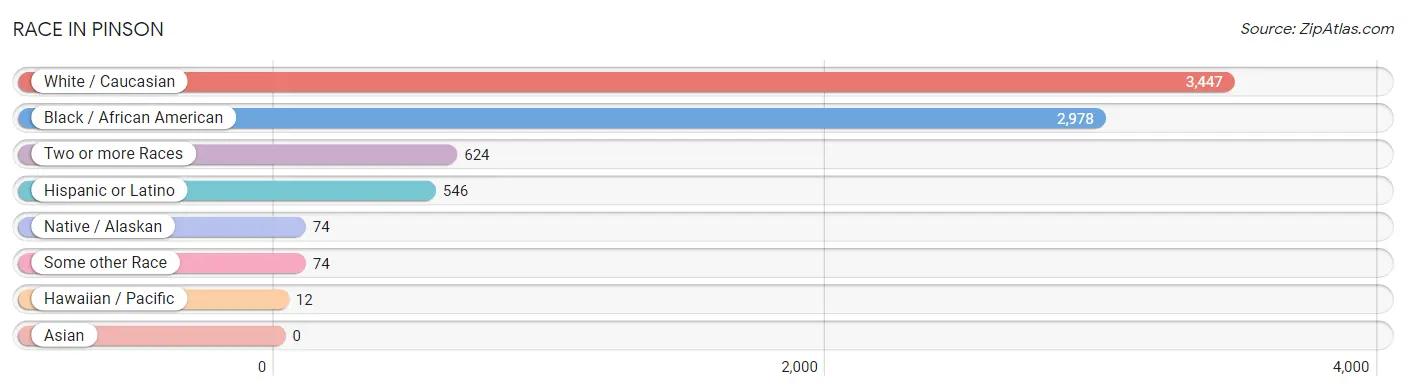
Race in Pinson
The most populous races in Pinson are White / Caucasian (3,447 | 47.8%), Black / African American (2,978 | 41.3%), and Two or more Races (624 | 8.7%).
| Race | # Population | % Population |
| Asian | 0 | 0.0% |
| Black / African American | 2,978 | 41.3% |
| Hawaiian / Pacific | 12 | 0.2% |
| Hispanic or Latino | 546 | 7.6% |
| Native / Alaskan | 74 | 1.0% |
| White / Caucasian | 3,447 | 47.8% |
| Two or more Races | 624 | 8.7% |
| Some other Race | 74 | 1.0% |
| Total | 7,209 | 100.0% |
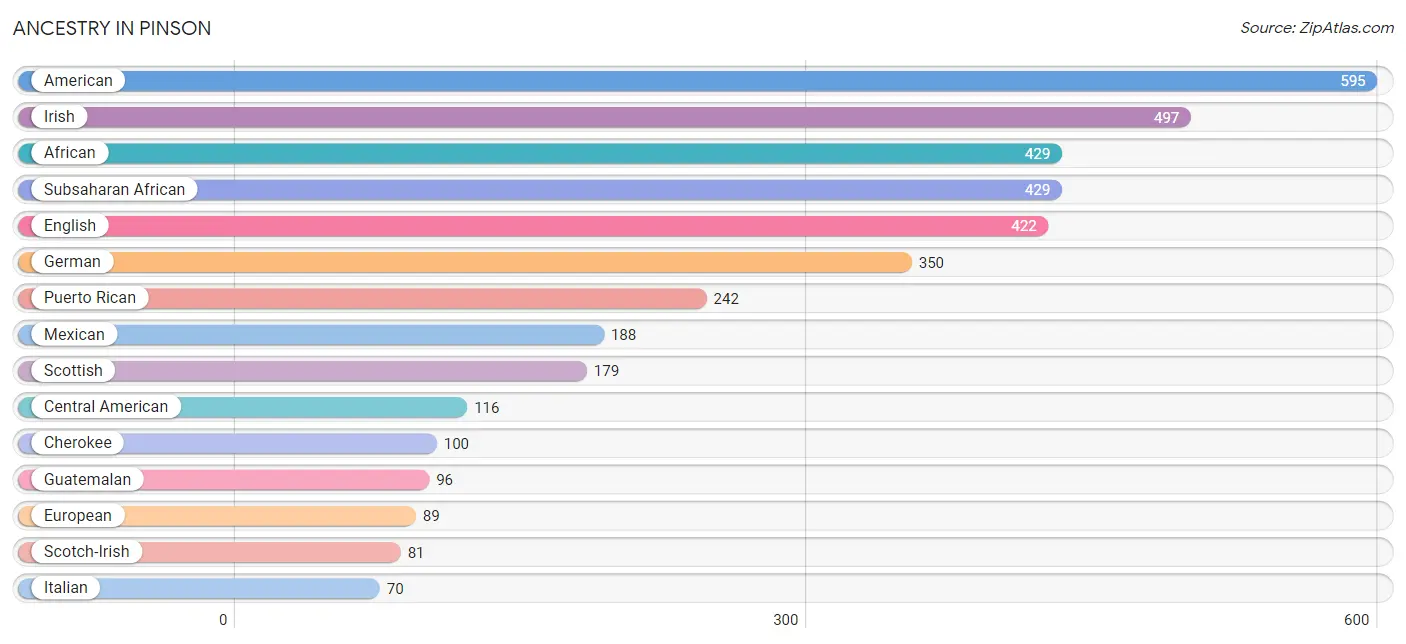
Ancestry in Pinson
The most populous ancestries reported in Pinson are American (595 | 8.3%), Irish (497 | 6.9%), African (429 | 5.9%), Subsaharan African (429 | 5.9%), and English (422 | 5.9%), together accounting for 32.9% of all Pinson residents.
| Ancestry | # Population | % Population |
| African | 429 | 5.9% |
| American | 595 | 8.3% |
| Arab | 4 | 0.1% |
| Belgian | 4 | 0.1% |
| British | 6 | 0.1% |
| Central American | 116 | 1.6% |
| Central American Indian | 27 | 0.4% |
| Cherokee | 100 | 1.4% |
| Choctaw | 2 | 0.0% |
| Creek | 2 | 0.0% |
| Dutch | 37 | 0.5% |
| English | 422 | 5.9% |
| European | 89 | 1.2% |
| French | 57 | 0.8% |
| French Canadian | 9 | 0.1% |
| German | 350 | 4.9% |
| Greek | 29 | 0.4% |
| Guatemalan | 96 | 1.3% |
| Honduran | 20 | 0.3% |
| Irish | 497 | 6.9% |
| Italian | 70 | 1.0% |
| Lebanese | 4 | 0.1% |
| Mexican | 188 | 2.6% |
| Mexican American Indian | 27 | 0.4% |
| Native Hawaiian | 12 | 0.2% |
| Norwegian | 30 | 0.4% |
| Puerto Rican | 242 | 3.4% |
| Scotch-Irish | 81 | 1.1% |
| Scottish | 179 | 2.5% |
| Subsaharan African | 429 | 5.9% |
| Swedish | 5 | 0.1% |
| Welsh | 51 | 0.7% |
| West Indian | 5 | 0.1% | View All 33 Rows |
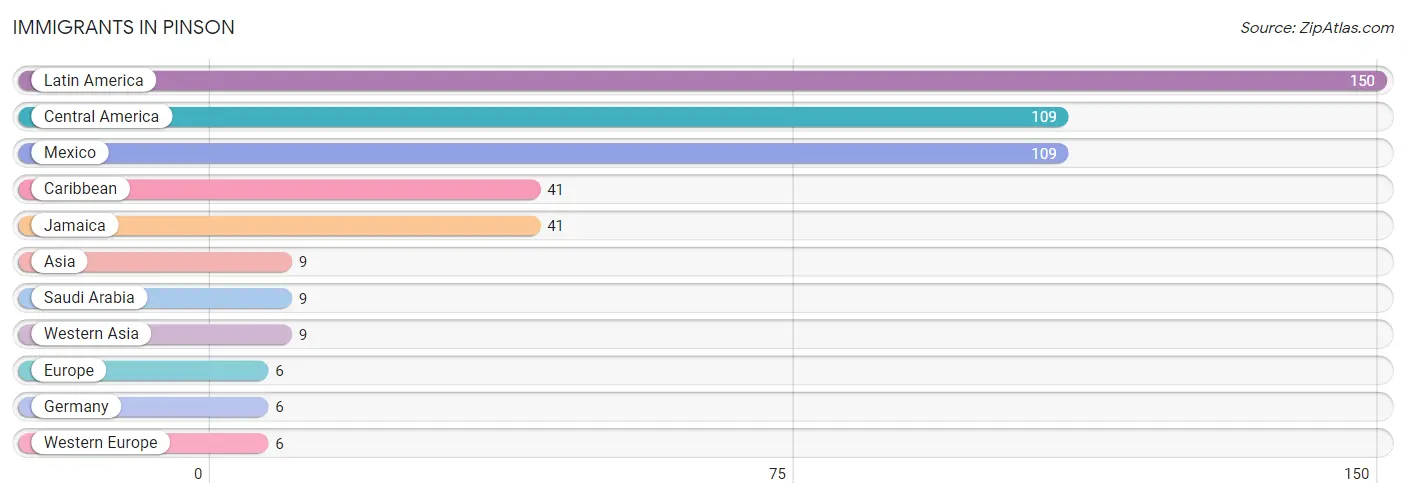
Immigrants in Pinson
The most numerous immigrant groups reported in Pinson came from Latin America (150 | 2.1%), Central America (109 | 1.5%), Mexico (109 | 1.5%), Caribbean (41 | 0.6%), and Jamaica (41 | 0.6%), together accounting for 6.2% of all Pinson residents.
| Immigration Origin | # Population | % Population |
| Asia | 9 | 0.1% |
| Caribbean | 41 | 0.6% |
| Central America | 109 | 1.5% |
| Europe | 6 | 0.1% |
| Germany | 6 | 0.1% |
| Jamaica | 41 | 0.6% |
| Latin America | 150 | 2.1% |
| Mexico | 109 | 1.5% |
| Saudi Arabia | 9 | 0.1% |
| Western Asia | 9 | 0.1% |
| Western Europe | 6 | 0.1% | View All 11 Rows |
Sex and Age in Pinson
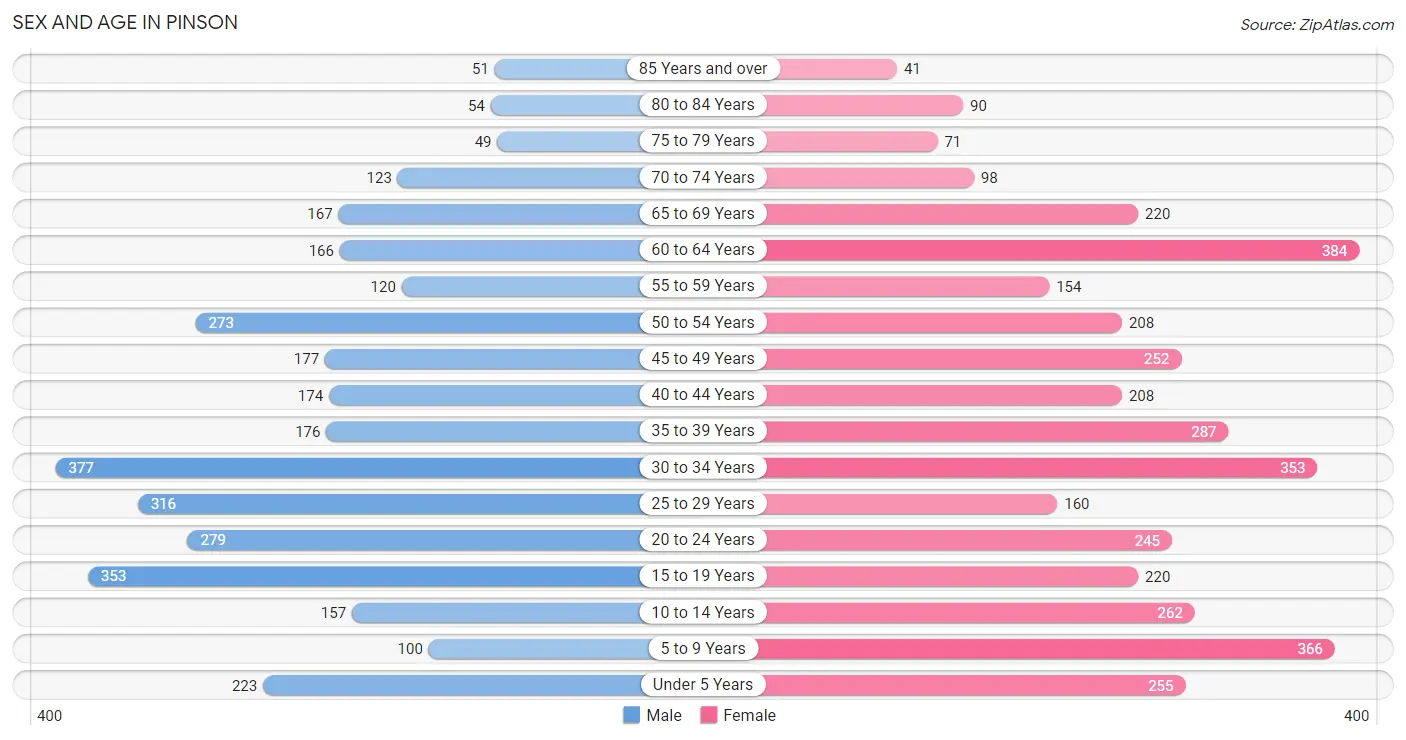
Sex and Age in Pinson
The most populous age groups in Pinson are 30 to 34 Years (377 | 11.3%) for men and 60 to 64 Years (384 | 9.9%) for women.
| Age Bracket | Male | Female |
| Under 5 Years | 223 (6.7%) | 255 (6.6%) |
| 5 to 9 Years | 100 (3.0%) | 366 (9.5%) |
| 10 to 14 Years | 157 (4.7%) | 262 (6.8%) |
| 15 to 19 Years | 353 (10.6%) | 220 (5.7%) |
| 20 to 24 Years | 279 (8.4%) | 245 (6.3%) |
| 25 to 29 Years | 316 (9.5%) | 160 (4.1%) |
| 30 to 34 Years | 377 (11.3%) | 353 (9.1%) |
| 35 to 39 Years | 176 (5.3%) | 287 (7.4%) |
| 40 to 44 Years | 174 (5.2%) | 208 (5.4%) |
| 45 to 49 Years | 177 (5.3%) | 252 (6.5%) |
| 50 to 54 Years | 273 (8.2%) | 208 (5.4%) |
| 55 to 59 Years | 120 (3.6%) | 154 (4.0%) |
| 60 to 64 Years | 166 (5.0%) | 384 (9.9%) |
| 65 to 69 Years | 167 (5.0%) | 220 (5.7%) |
| 70 to 74 Years | 123 (3.7%) | 98 (2.5%) |
| 75 to 79 Years | 49 (1.5%) | 71 (1.8%) |
| 80 to 84 Years | 54 (1.6%) | 90 (2.3%) |
| 85 Years and over | 51 (1.5%) | 41 (1.1%) |
| Total | 3,335 (100.0%) | 3,874 (100.0%) |
Families and Households in Pinson
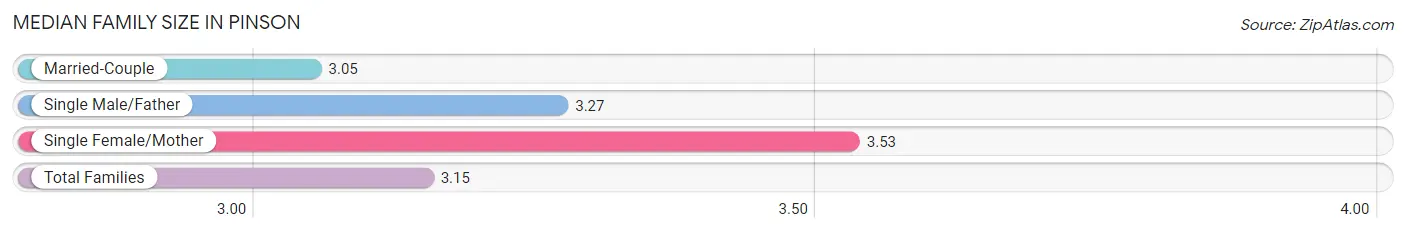
Median Family Size in Pinson
The median family size in Pinson is 3.15 persons per family, with single female/mother families (364 | 18.9%) accounting for the largest median family size of 3.53 persons per family. On the other hand, married-couple families (1,482 | 76.9%) represent the smallest median family size with 3.05 persons per family.
| Family Type | # Families | Family Size |
| Married-Couple | 1,482 (76.9%) | 3.05 |
| Single Male/Father | 82 (4.3%) | 3.27 |
| Single Female/Mother | 364 (18.9%) | 3.53 |
| Total Families | 1,928 (100.0%) | 3.15 |
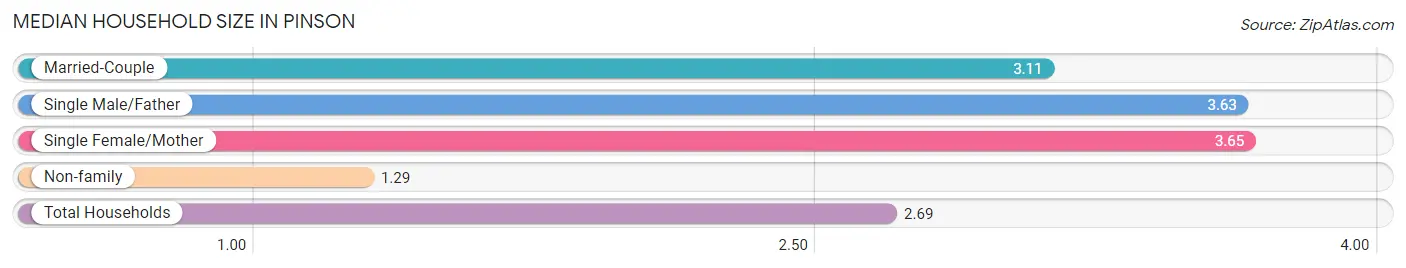
Median Household Size in Pinson
The median household size in Pinson is 2.69 persons per household, with single female/mother households (364 | 13.6%) accounting for the largest median household size of 3.65 persons per household. non-family households (752 | 28.1%) represent the smallest median household size with 1.29 persons per household.
| Household Type | # Households | Household Size |
| Married-Couple | 1,482 (55.3%) | 3.11 |
| Single Male/Father | 82 (3.1%) | 3.63 |
| Single Female/Mother | 364 (13.6%) | 3.65 |
| Non-family | 752 (28.1%) | 1.29 |
| Total Households | 2,680 (100.0%) | 2.69 |
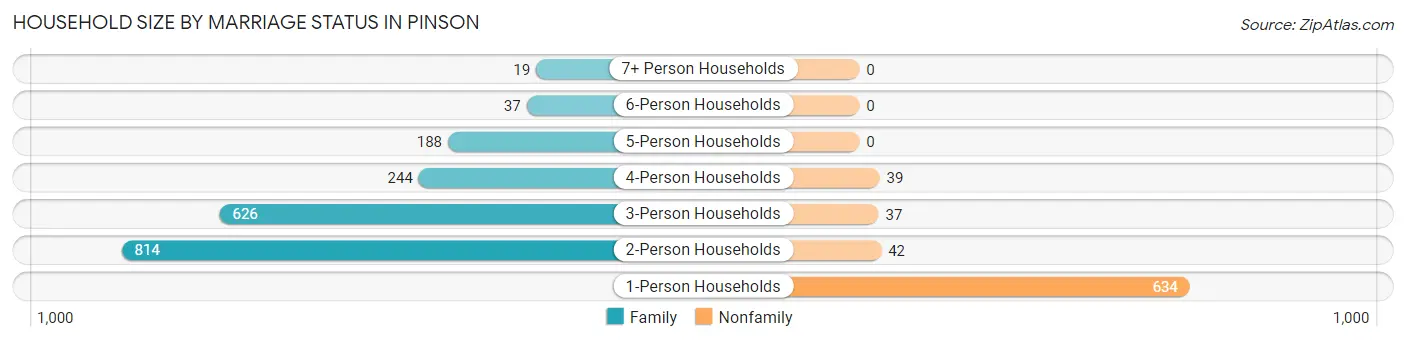
Household Size by Marriage Status in Pinson
Out of a total of 2,680 households in Pinson, 1,928 (71.9%) are family households, while 752 (28.1%) are nonfamily households. The most numerous type of family households are 2-person households, comprising 814, and the most common type of nonfamily households are 1-person households, comprising 634.
| Household Size | Family Households | Nonfamily Households |
| 1-Person Households | - | 634 (23.7%) |
| 2-Person Households | 814 (30.4%) | 42 (1.6%) |
| 3-Person Households | 626 (23.4%) | 37 (1.4%) |
| 4-Person Households | 244 (9.1%) | 39 (1.5%) |
| 5-Person Households | 188 (7.0%) | 0 (0.0%) |
| 6-Person Households | 37 (1.4%) | 0 (0.0%) |
| 7+ Person Households | 19 (0.7%) | 0 (0.0%) |
| Total | 1,928 (71.9%) | 752 (28.1%) |
Female Fertility in Pinson
Fertility by Age in Pinson
Average fertility rate in Pinson is 31.0 births per 1,000 women. Women in the age bracket of 20 to 34 years have the highest fertility rate with 70.0 births per 1,000 women. Women in the age bracket of 20 to 34 years acount for 100.0% of all women with births.
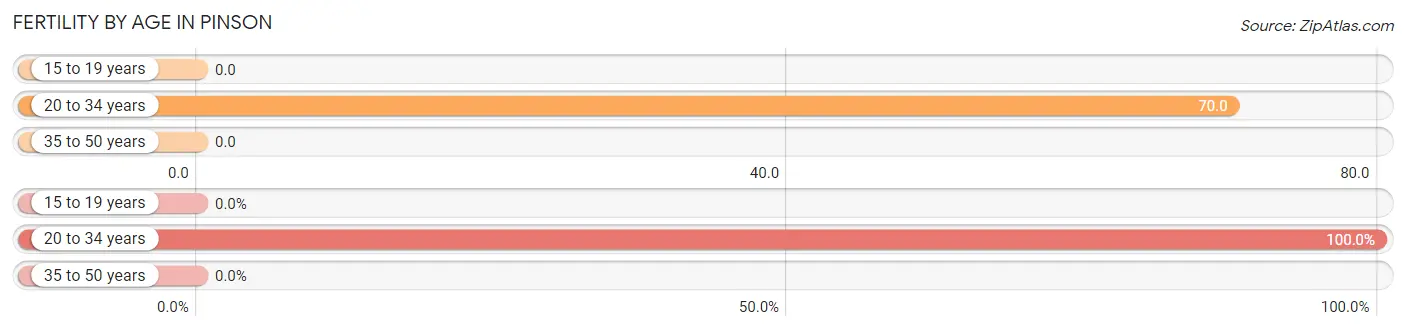
| Age Bracket | Women with Births | Births / 1,000 Women |
| 15 to 19 years | 0 (0.0%) | 0.0 |
| 20 to 34 years | 53 (100.0%) | 70.0 |
| 35 to 50 years | 0 (0.0%) | 0.0 |
| Total | 53 (100.0%) | 31.0 |
Fertility by Age by Marriage Status in Pinson
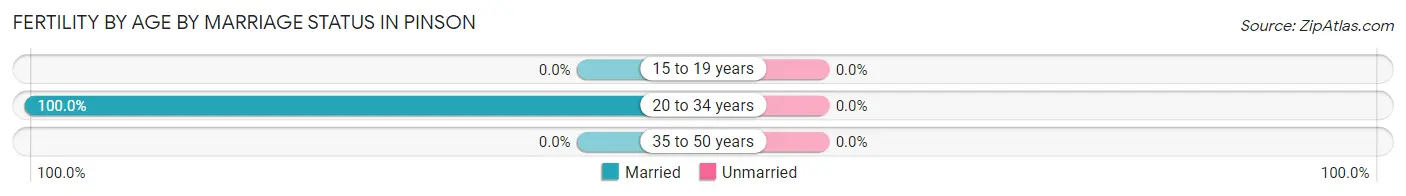
| Age Bracket | Married | Unmarried |
| 15 to 19 years | 0 (0.0%) | 0 (0.0%) |
| 20 to 34 years | 53 (100.0%) | 0 (0.0%) |
| 35 to 50 years | 0 (0.0%) | 0 (0.0%) |
| Total | 53 (100.0%) | 0 (0.0%) |
Fertility by Education in Pinson
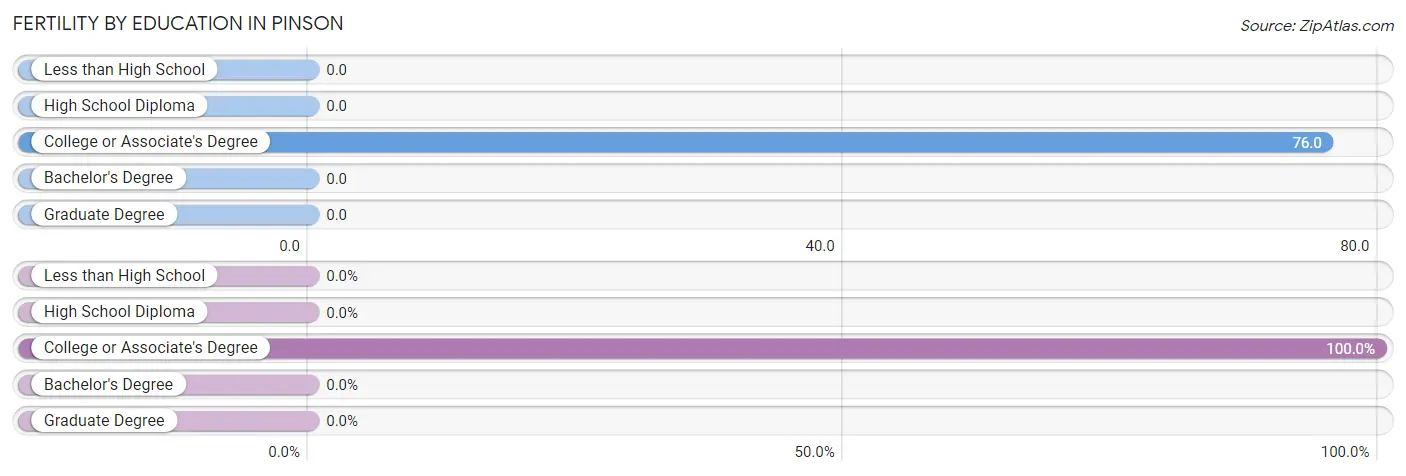
| Educational Attainment | Women with Births | Births / 1,000 Women |
| Less than High School | 0 (0.0%) | 0.0 |
| High School Diploma | 0 (0.0%) | 0.0 |
| College or Associate's Degree | 53 (100.0%) | 76.0 |
| Bachelor's Degree | 0 (0.0%) | 0.0 |
| Graduate Degree | 0 (0.0%) | 0.0 |
| Total | 53 (100.0%) | 31.0 |
Fertility by Education by Marriage Status in Pinson
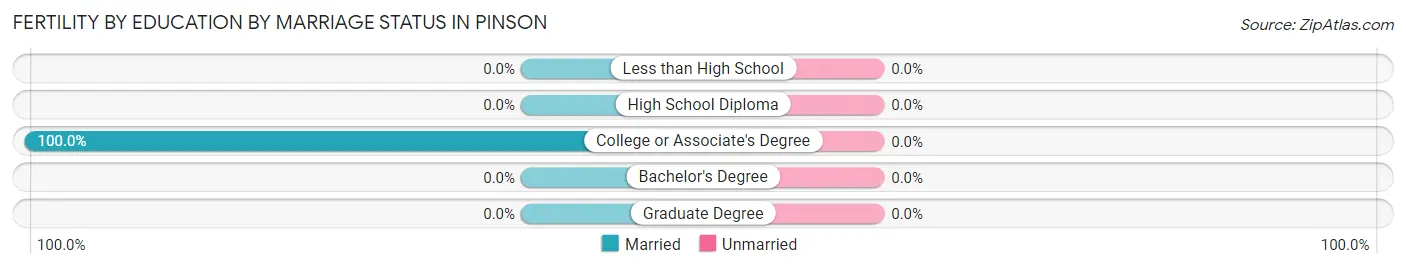
| Educational Attainment | Married | Unmarried |
| Less than High School | 0 (0.0%) | 0 (0.0%) |
| High School Diploma | 0 (0.0%) | 0 (0.0%) |
| College or Associate's Degree | 53 (100.0%) | 0 (0.0%) |
| Bachelor's Degree | 0 (0.0%) | 0 (0.0%) |
| Graduate Degree | 0 (0.0%) | 0 (0.0%) |
| Total | 53 (100.0%) | 0 (0.0%) |
Income in Pinson
Income Overview in Pinson
Per Capita Income in Pinson is $34,658, while median incomes of families and households are $97,459 and $83,673 respectively.
| Characteristic | Number | Measure |
| Per Capita Income | 7,209 | $34,658 |
| Median Family Income | 1,928 | $97,459 |
| Mean Family Income | 1,928 | $102,996 |
| Median Household Income | 2,680 | $83,673 |
| Mean Household Income | 2,680 | $91,491 |
| Income Deficit | 1,928 | $11,577 |
| Wage / Income Gap (%) | 7,209 | 14.86% |
| Wage / Income Gap ($) | 7,209 | 85.14¢ per $1 |
| Gini / Inequality Index | 7,209 | 0.35 |
Earnings by Sex in Pinson
Average Earnings in Pinson are $46,964, $52,396 for men and $44,611 for women, a difference of 14.9%.
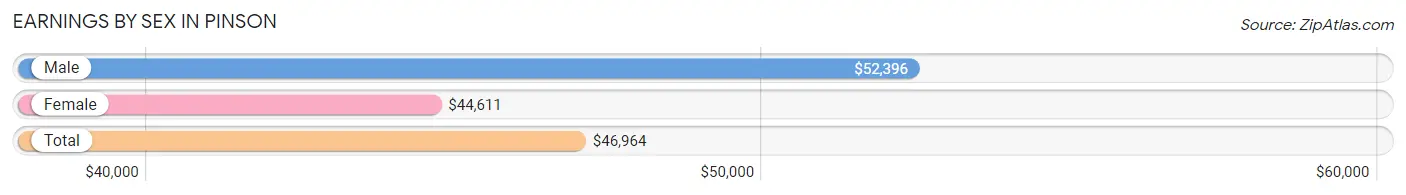
| Sex | Number | Average Earnings |
| Male | 1,884 (49.5%) | $52,396 |
| Female | 1,919 (50.5%) | $44,611 |
| Total | 3,803 (100.0%) | $46,964 |
Earnings by Sex by Income Bracket in Pinson
The most common earnings brackets in Pinson are $55,000 to $64,999 for men (373 | 19.8%) and $75,000 to $99,999 for women (286 | 14.9%).
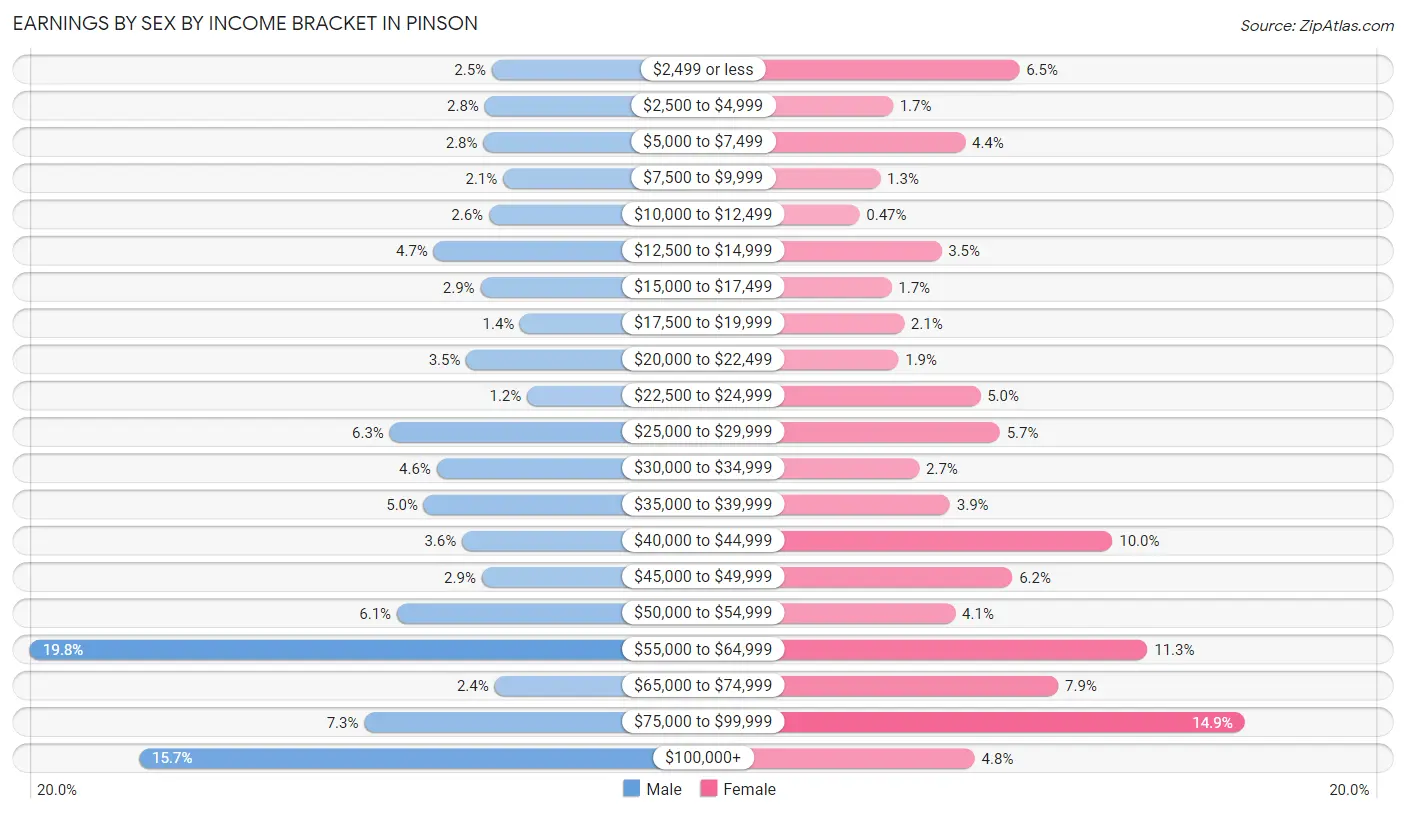
| Income | Male | Female |
| $2,499 or less | 47 (2.5%) | 124 (6.5%) |
| $2,500 to $4,999 | 52 (2.8%) | 33 (1.7%) |
| $5,000 to $7,499 | 53 (2.8%) | 85 (4.4%) |
| $7,500 to $9,999 | 39 (2.1%) | 24 (1.3%) |
| $10,000 to $12,499 | 49 (2.6%) | 9 (0.5%) |
| $12,500 to $14,999 | 88 (4.7%) | 68 (3.5%) |
| $15,000 to $17,499 | 55 (2.9%) | 32 (1.7%) |
| $17,500 to $19,999 | 27 (1.4%) | 41 (2.1%) |
| $20,000 to $22,499 | 65 (3.5%) | 37 (1.9%) |
| $22,500 to $24,999 | 22 (1.2%) | 96 (5.0%) |
| $25,000 to $29,999 | 119 (6.3%) | 110 (5.7%) |
| $30,000 to $34,999 | 86 (4.6%) | 52 (2.7%) |
| $35,000 to $39,999 | 95 (5.0%) | 74 (3.9%) |
| $40,000 to $44,999 | 68 (3.6%) | 191 (10.0%) |
| $45,000 to $49,999 | 54 (2.9%) | 119 (6.2%) |
| $50,000 to $54,999 | 114 (6.0%) | 78 (4.1%) |
| $55,000 to $64,999 | 373 (19.8%) | 216 (11.3%) |
| $65,000 to $74,999 | 45 (2.4%) | 152 (7.9%) |
| $75,000 to $99,999 | 137 (7.3%) | 286 (14.9%) |
| $100,000+ | 296 (15.7%) | 92 (4.8%) |
| Total | 1,884 (100.0%) | 1,919 (100.0%) |
Earnings by Sex by Educational Attainment in Pinson
Average earnings in Pinson are $54,246 for men and $49,336 for women, a difference of 9.0%. Men with an educational attainment of bachelor's degree enjoy the highest average annual earnings of $60,260, while those with college or associate's degree education earn the least with $42,375. Women with an educational attainment of graduate degree earn the most with the average annual earnings of $63,135, while those with high school diploma education have the smallest earnings of $36,250.
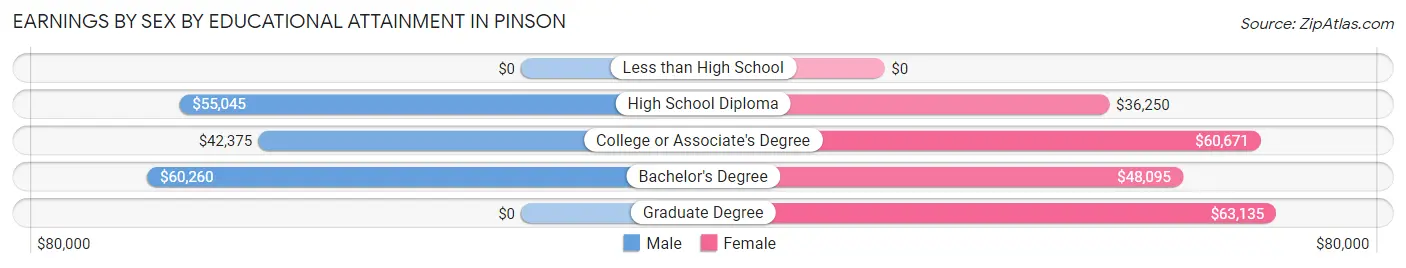
| Educational Attainment | Male Income | Female Income |
| Less than High School | - | - |
| High School Diploma | $55,045 | $36,250 |
| College or Associate's Degree | $42,375 | $60,671 |
| Bachelor's Degree | $60,260 | $48,095 |
| Graduate Degree | - | - |
| Total | $54,246 | $49,336 |
Family Income in Pinson
Family Income Brackets in Pinson
According to the Pinson family income data, there are 582 families falling into the $100,000 to $149,999 income range, which is the most common income bracket and makes up 30.2% of all families. Conversely, the $10,000 to $14,999 income bracket is the least frequent group with only 8 families (0.4%) belonging to this category.
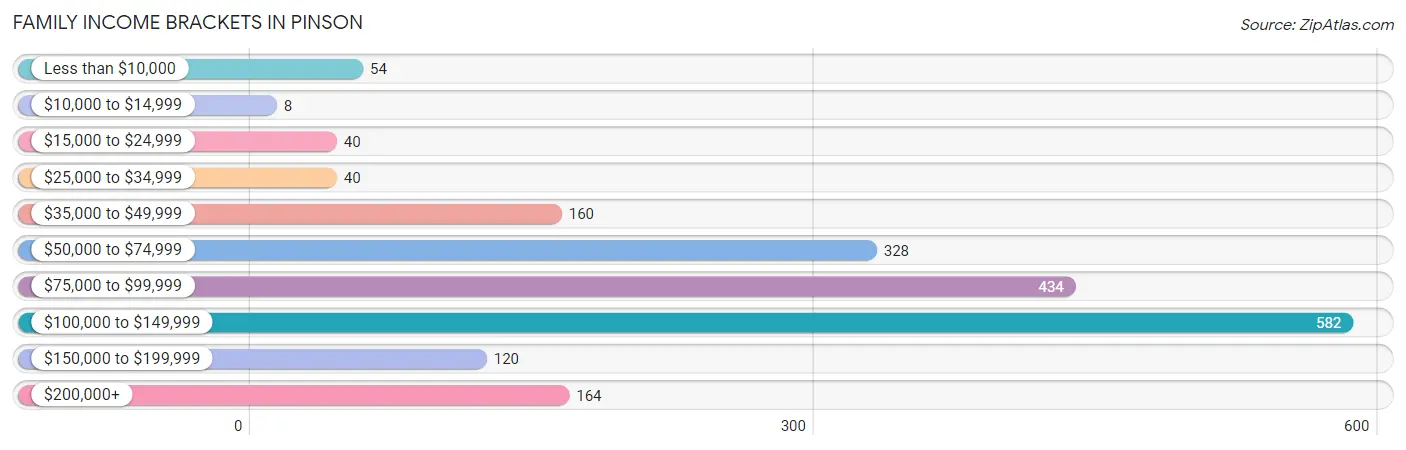
| Income Bracket | # Families | % Families |
| Less than $10,000 | 54 | 2.8% |
| $10,000 to $14,999 | 8 | 0.4% |
| $15,000 to $24,999 | 40 | 2.1% |
| $25,000 to $34,999 | 40 | 2.1% |
| $35,000 to $49,999 | 160 | 8.3% |
| $50,000 to $74,999 | 328 | 17.0% |
| $75,000 to $99,999 | 434 | 22.5% |
| $100,000 to $149,999 | 582 | 30.2% |
| $150,000 to $199,999 | 120 | 6.2% |
| $200,000+ | 164 | 8.5% |
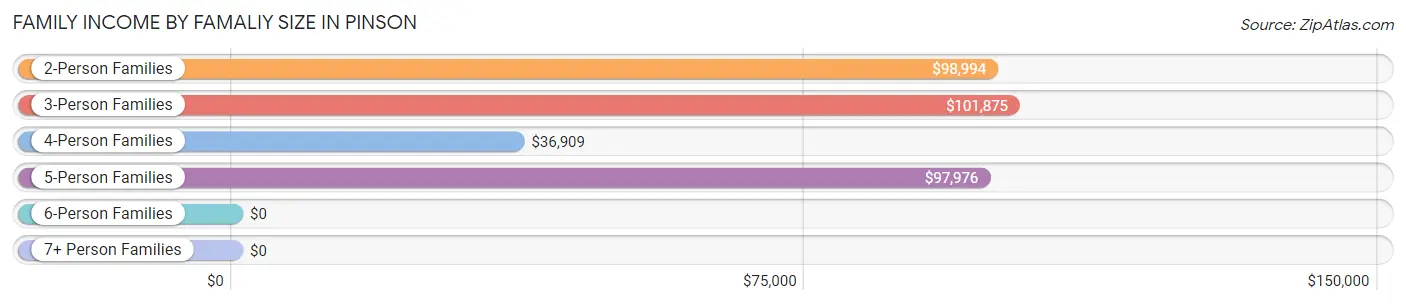
Family Income by Famaliy Size in Pinson
3-person families (627 | 32.5%) account for the highest median family income in Pinson with $101,875 per family, while 2-person families (834 | 43.3%) have the highest median income of $49,497 per family member.
| Income Bracket | # Families | Median Income |
| 2-Person Families | 834 (43.3%) | $98,994 |
| 3-Person Families | 627 (32.5%) | $101,875 |
| 4-Person Families | 254 (13.2%) | $36,909 |
| 5-Person Families | 174 (9.0%) | $97,976 |
| 6-Person Families | 20 (1.0%) | $0 |
| 7+ Person Families | 19 (1.0%) | $0 |
| Total | 1,928 (100.0%) | $97,459 |
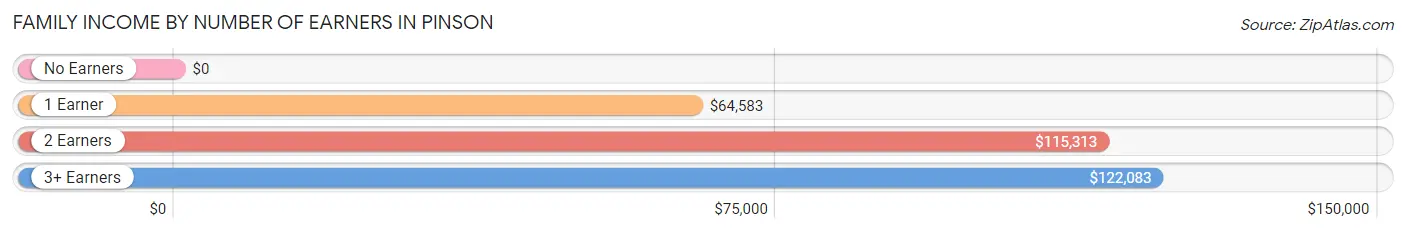
Family Income by Number of Earners in Pinson
| Number of Earners | # Families | Median Income |
| No Earners | 238 (12.3%) | $0 |
| 1 Earner | 583 (30.2%) | $64,583 |
| 2 Earners | 968 (50.2%) | $115,313 |
| 3+ Earners | 139 (7.2%) | $122,083 |
| Total | 1,928 (100.0%) | $97,459 |
Household Income in Pinson
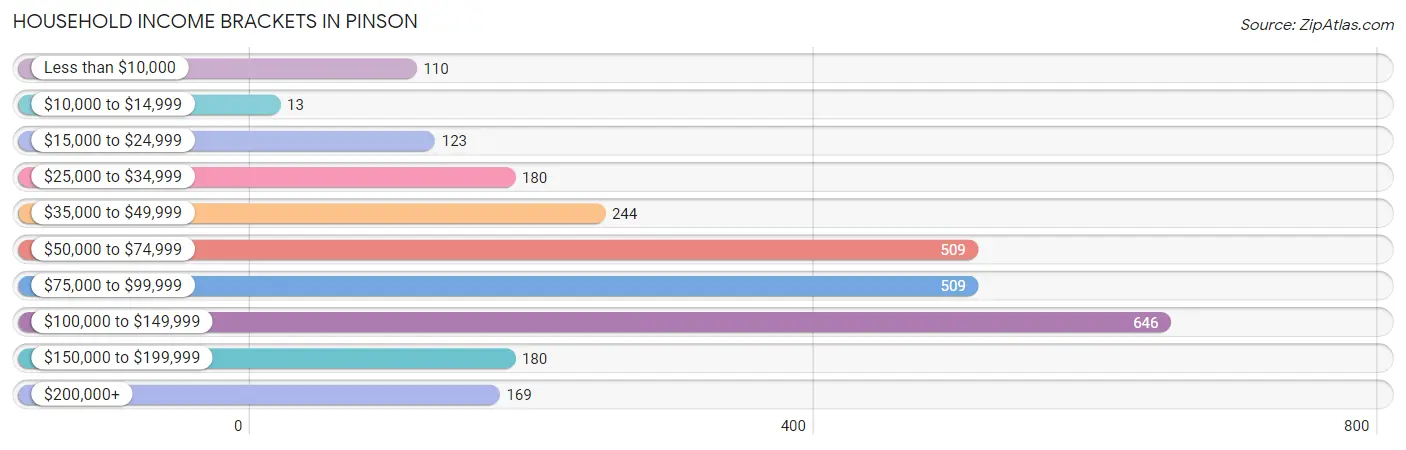
Household Income Brackets in Pinson
With 646 households falling in the category, the $100,000 to $149,999 income range is the most frequent in Pinson, accounting for 24.1% of all households. In contrast, only 13 households (0.5%) fall into the $10,000 to $14,999 income bracket, making it the least populous group.
| Income Bracket | # Households | % Households |
| Less than $10,000 | 110 | 4.1% |
| $10,000 to $14,999 | 13 | 0.5% |
| $15,000 to $24,999 | 123 | 4.6% |
| $25,000 to $34,999 | 180 | 6.7% |
| $35,000 to $49,999 | 244 | 9.1% |
| $50,000 to $74,999 | 509 | 19.0% |
| $75,000 to $99,999 | 509 | 19.0% |
| $100,000 to $149,999 | 646 | 24.1% |
| $150,000 to $199,999 | 180 | 6.7% |
| $200,000+ | 169 | 6.3% |
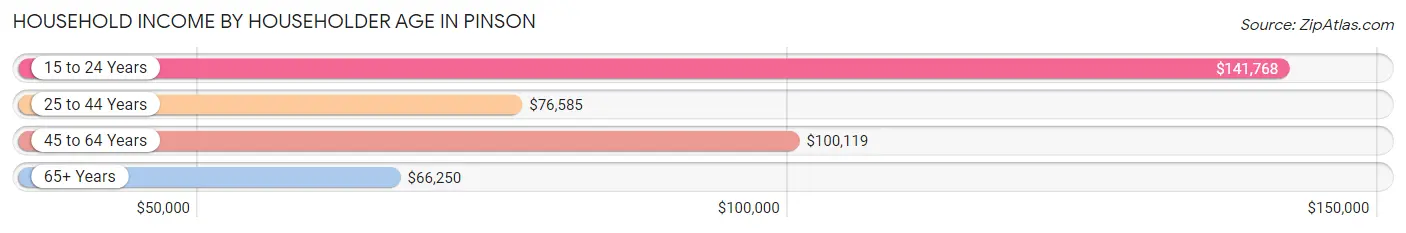
Household Income by Householder Age in Pinson
The median household income in Pinson is $83,673, with the highest median household income of $141,768 found in the 15 to 24 years age bracket for the primary householder. A total of 88 households (3.3%) fall into this category. Meanwhile, the 65+ years age bracket for the primary householder has the lowest median household income of $66,250, with 650 households (24.2%) in this group.
| Income Bracket | # Households | Median Income |
| 15 to 24 Years | 88 (3.3%) | $141,768 |
| 25 to 44 Years | 894 (33.4%) | $76,585 |
| 45 to 64 Years | 1,048 (39.1%) | $100,119 |
| 65+ Years | 650 (24.2%) | $66,250 |
| Total | 2,680 (100.0%) | $83,673 |
Poverty in Pinson
Income Below Poverty by Sex and Age in Pinson
With 12.8% poverty level for males and 11.1% for females among the residents of Pinson, 15 year old males and 15 year old females are the most vulnerable to poverty, with 6 males (100.0%) and 4 females (33.3%) in their respective age groups living below the poverty level.
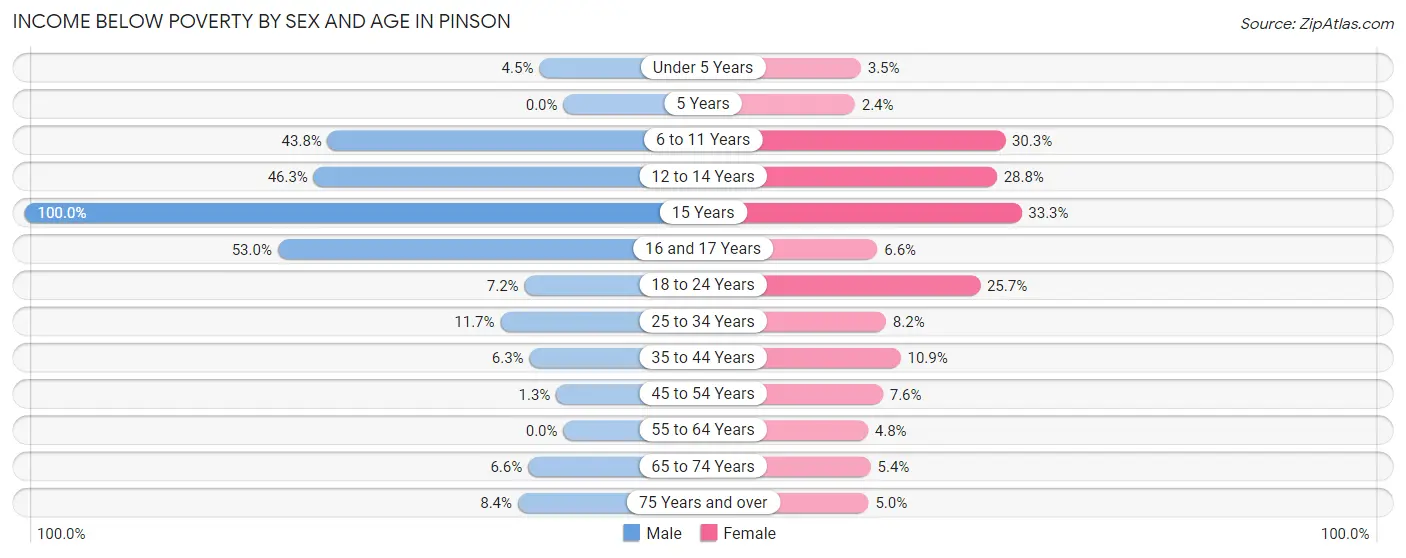
| Age Bracket | Male | Female |
| Under 5 Years | 10 (4.5%) | 9 (3.5%) |
| 5 Years | 0 (0.0%) | 4 (2.4%) |
| 6 to 11 Years | 84 (43.8%) | 63 (30.3%) |
| 12 to 14 Years | 19 (46.3%) | 69 (28.7%) |
| 15 Years | 6 (100.0%) | 4 (33.3%) |
| 16 and 17 Years | 141 (53.0%) | 7 (6.6%) |
| 18 to 24 Years | 26 (7.2%) | 89 (25.7%) |
| 25 to 34 Years | 81 (11.7%) | 42 (8.2%) |
| 35 to 44 Years | 22 (6.3%) | 54 (10.9%) |
| 45 to 54 Years | 6 (1.3%) | 35 (7.6%) |
| 55 to 64 Years | 0 (0.0%) | 26 (4.8%) |
| 65 to 74 Years | 19 (6.6%) | 17 (5.3%) |
| 75 Years and over | 13 (8.4%) | 10 (5.0%) |
| Total | 427 (12.8%) | 429 (11.1%) |
Income Above Poverty by Sex and Age in Pinson
According to the poverty statistics in Pinson, males aged 5 years and females aged 5 years are the age groups that are most secure financially, with 100.0% of males and 97.6% of females in these age groups living above the poverty line.
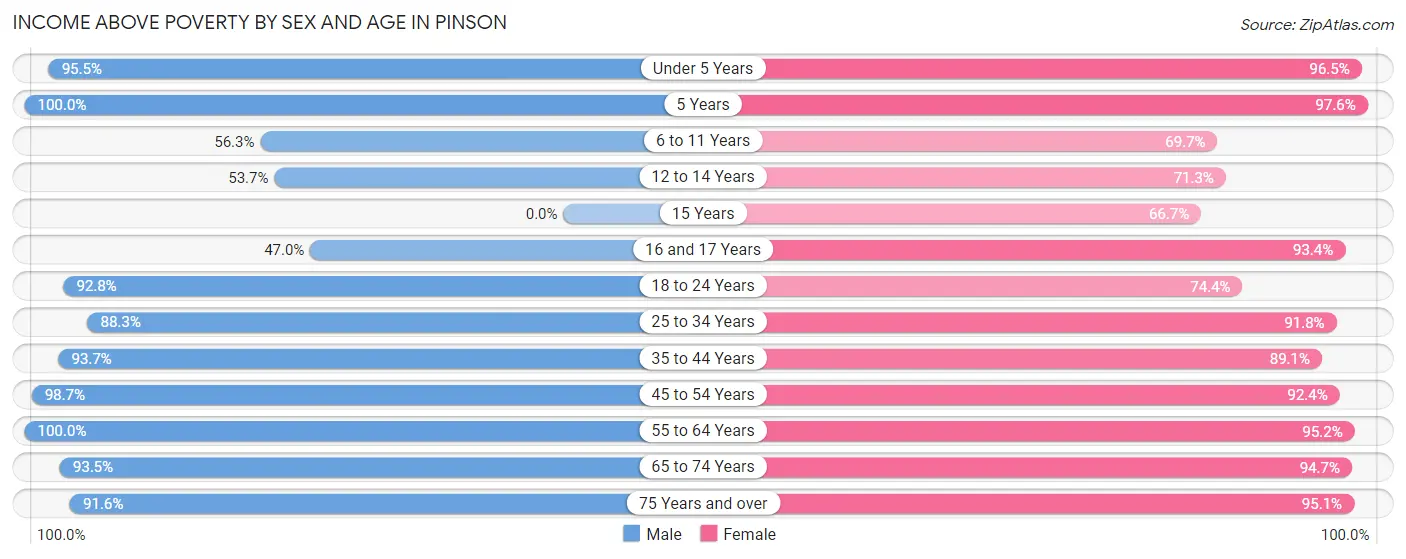
| Age Bracket | Male | Female |
| Under 5 Years | 213 (95.5%) | 246 (96.5%) |
| 5 Years | 24 (100.0%) | 162 (97.6%) |
| 6 to 11 Years | 108 (56.2%) | 145 (69.7%) |
| 12 to 14 Years | 22 (53.7%) | 171 (71.3%) |
| 15 Years | 0 (0.0%) | 8 (66.7%) |
| 16 and 17 Years | 125 (47.0%) | 99 (93.4%) |
| 18 to 24 Years | 334 (92.8%) | 258 (74.4%) |
| 25 to 34 Years | 612 (88.3%) | 471 (91.8%) |
| 35 to 44 Years | 328 (93.7%) | 441 (89.1%) |
| 45 to 54 Years | 444 (98.7%) | 425 (92.4%) |
| 55 to 64 Years | 286 (100.0%) | 512 (95.2%) |
| 65 to 74 Years | 271 (93.4%) | 301 (94.7%) |
| 75 Years and over | 141 (91.6%) | 192 (95.1%) |
| Total | 2,908 (87.2%) | 3,431 (88.9%) |
Income Below Poverty Among Married-Couple Families in Pinson
The poverty statistics for married-couple families in Pinson show that 3.4% or 50 of the total 1,482 families live below the poverty line. Families with 3 or 4 children have the highest poverty rate of 48.6%, comprising of 17 families. On the other hand, families with no children have the lowest poverty rate of 0.0%, which includes 0 families.
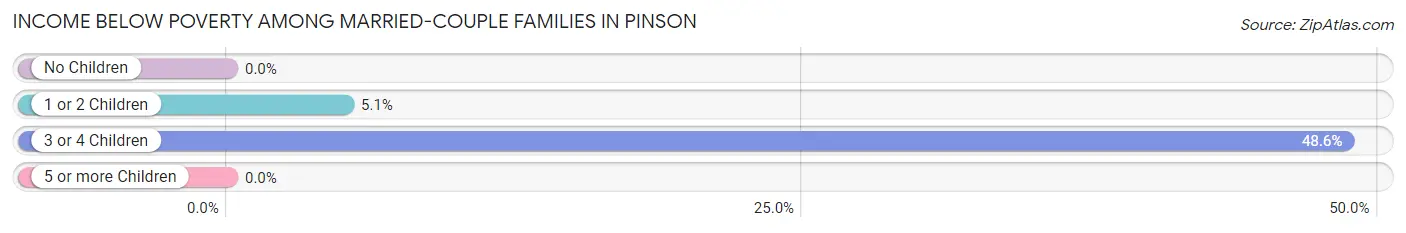
| Children | Above Poverty | Below Poverty |
| No Children | 793 (100.0%) | 0 (0.0%) |
| 1 or 2 Children | 621 (95.0%) | 33 (5.1%) |
| 3 or 4 Children | 18 (51.4%) | 17 (48.6%) |
| 5 or more Children | 0 (0.0%) | 0 (0.0%) |
| Total | 1,432 (96.6%) | 50 (3.4%) |
Income Below Poverty Among Single-Parent Households in Pinson
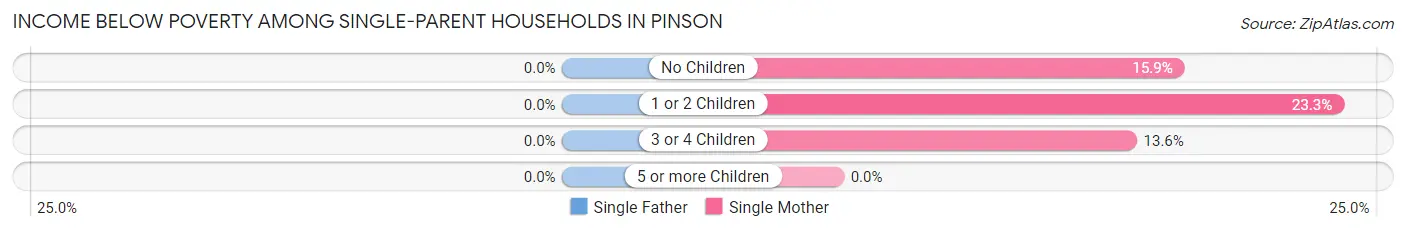
| Children | Single Father | Single Mother |
| No Children | 0 (0.0%) | 10 (15.9%) |
| 1 or 2 Children | 0 (0.0%) | 65 (23.3%) |
| 3 or 4 Children | 0 (0.0%) | 3 (13.6%) |
| 5 or more Children | 0 (0.0%) | 0 (0.0%) |
| Total | 0 (0.0%) | 78 (21.4%) |
Income Below Poverty Among Married-Couple vs Single-Parent Households in Pinson
The poverty data for Pinson shows that 50 of the married-couple family households (3.4%) and 78 of the single-parent households (17.5%) are living below the poverty level. Within the married-couple family households, those with 3 or 4 children have the highest poverty rate, with 17 households (48.6%) falling below the poverty line. Among the single-parent households, those with 1 or 2 children have the highest poverty rate, with 65 household (22.3%) living below poverty.
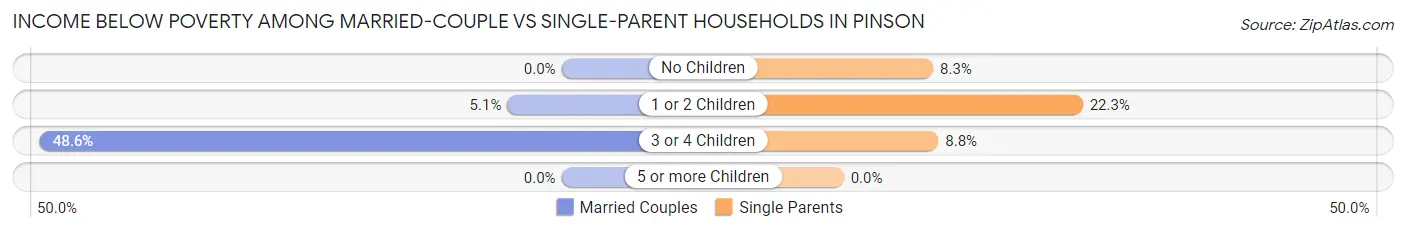
| Children | Married-Couple Families | Single-Parent Households |
| No Children | 0 (0.0%) | 10 (8.3%) |
| 1 or 2 Children | 33 (5.1%) | 65 (22.3%) |
| 3 or 4 Children | 17 (48.6%) | 3 (8.8%) |
| 5 or more Children | 0 (0.0%) | 0 (0.0%) |
| Total | 50 (3.4%) | 78 (17.5%) |
Employment Characteristics in Pinson
Employment by Class of Employer in Pinson
Among the 3,616 employed individuals in Pinson, private company employees (2,580 | 71.4%), local government employees (277 | 7.7%), and self-employed (not incorporated) (222 | 6.1%) make up the most common classes of employment.
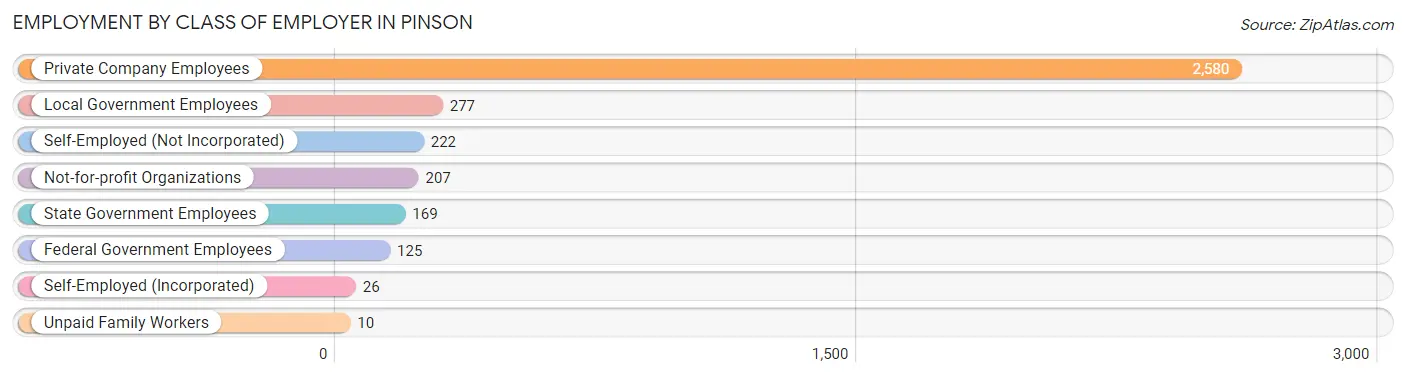
| Employer Class | # Employees | % Employees |
| Private Company Employees | 2,580 | 71.4% |
| Self-Employed (Incorporated) | 26 | 0.7% |
| Self-Employed (Not Incorporated) | 222 | 6.1% |
| Not-for-profit Organizations | 207 | 5.7% |
| Local Government Employees | 277 | 7.7% |
| State Government Employees | 169 | 4.7% |
| Federal Government Employees | 125 | 3.5% |
| Unpaid Family Workers | 10 | 0.3% |
| Total | 3,616 | 100.0% |
Employment Status by Age in Pinson
According to the labor force statistics for Pinson, out of the total population over 16 years of age (5,828), 65.4% or 3,812 individuals are in the labor force, with 4.3% or 164 of them unemployed. The age group with the highest labor force participation rate is 25 to 29 years, with 93.7% or 446 individuals in the labor force. Within the labor force, the 16 to 19 years age range has the highest percentage of unemployed individuals, with 24.5% or 40 of them being unemployed.
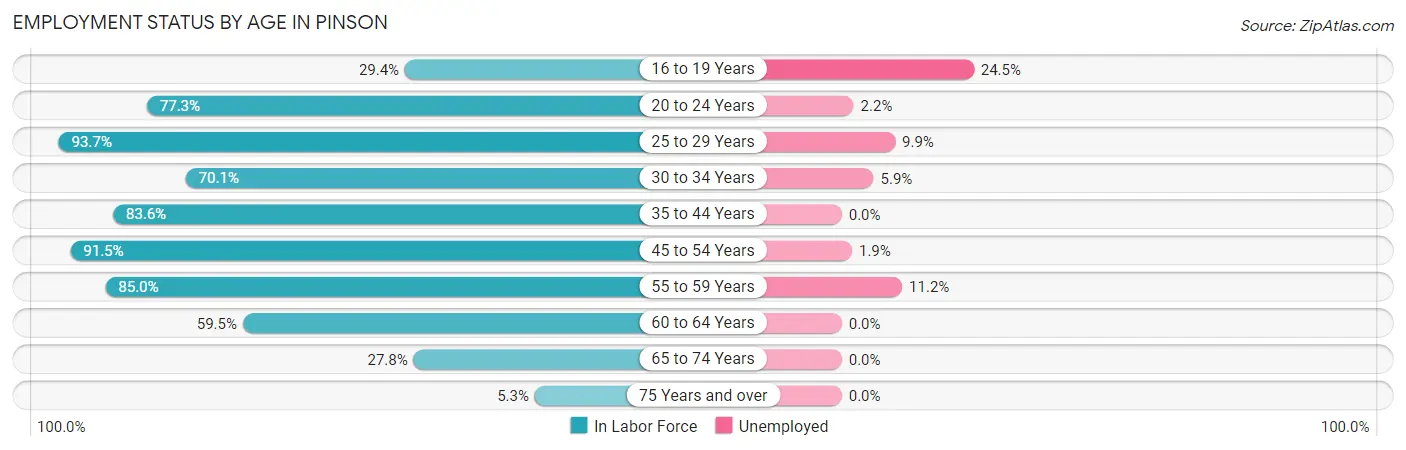
| Age Bracket | In Labor Force | Unemployed |
| 16 to 19 Years | 163 (29.4%) | 40 (24.5%) |
| 20 to 24 Years | 405 (77.3%) | 9 (2.2%) |
| 25 to 29 Years | 446 (93.7%) | 44 (9.9%) |
| 30 to 34 Years | 512 (70.1%) | 30 (5.9%) |
| 35 to 44 Years | 706 (83.6%) | 0 (0.0%) |
| 45 to 54 Years | 833 (91.5%) | 16 (1.9%) |
| 55 to 59 Years | 233 (85.0%) | 26 (11.2%) |
| 60 to 64 Years | 327 (59.5%) | 0 (0.0%) |
| 65 to 74 Years | 169 (27.8%) | 0 (0.0%) |
| 75 Years and over | 19 (5.3%) | 0 (0.0%) |
| Total | 3,812 (65.4%) | 164 (4.3%) |
Employment Status by Educational Attainment in Pinson
According to labor force statistics for Pinson, 80.8% of individuals (3,058) out of the total population between 25 and 64 years of age (3,785) are in the labor force, with 3.8% or 116 of them being unemployed. The group with the highest labor force participation rate are those with the educational attainment of college / associate degree, with 87.4% or 1,286 individuals in the labor force. Within the labor force, individuals with high school diploma education have the highest percentage of unemployment, with 6.7% or 71 of them being unemployed.
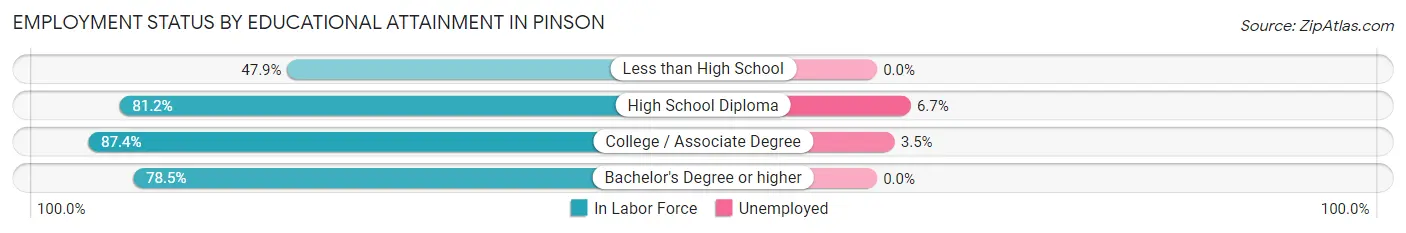
| Educational Attainment | In Labor Force | Unemployed |
| Less than High School | 126 (47.9%) | 0 (0.0%) |
| High School Diploma | 1,065 (81.2%) | 88 (6.7%) |
| College / Associate Degree | 1,286 (87.4%) | 51 (3.5%) |
| Bachelor's Degree or higher | 581 (78.5%) | 0 (0.0%) |
| Total | 3,058 (80.8%) | 144 (3.8%) |
Employment Occupations by Sex in Pinson
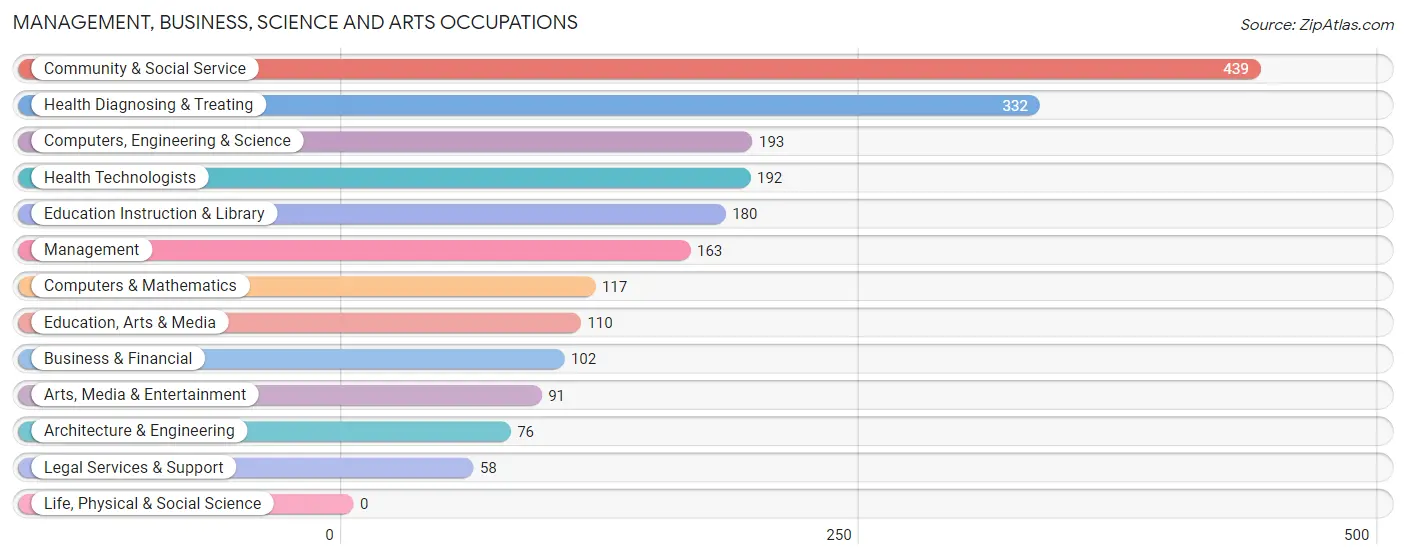
Management, Business, Science and Arts Occupations
The most common Management, Business, Science and Arts occupations in Pinson are Community & Social Service (439 | 12.0%), Health Diagnosing & Treating (332 | 9.1%), Computers, Engineering & Science (193 | 5.3%), Health Technologists (192 | 5.3%), and Education Instruction & Library (180 | 4.9%).
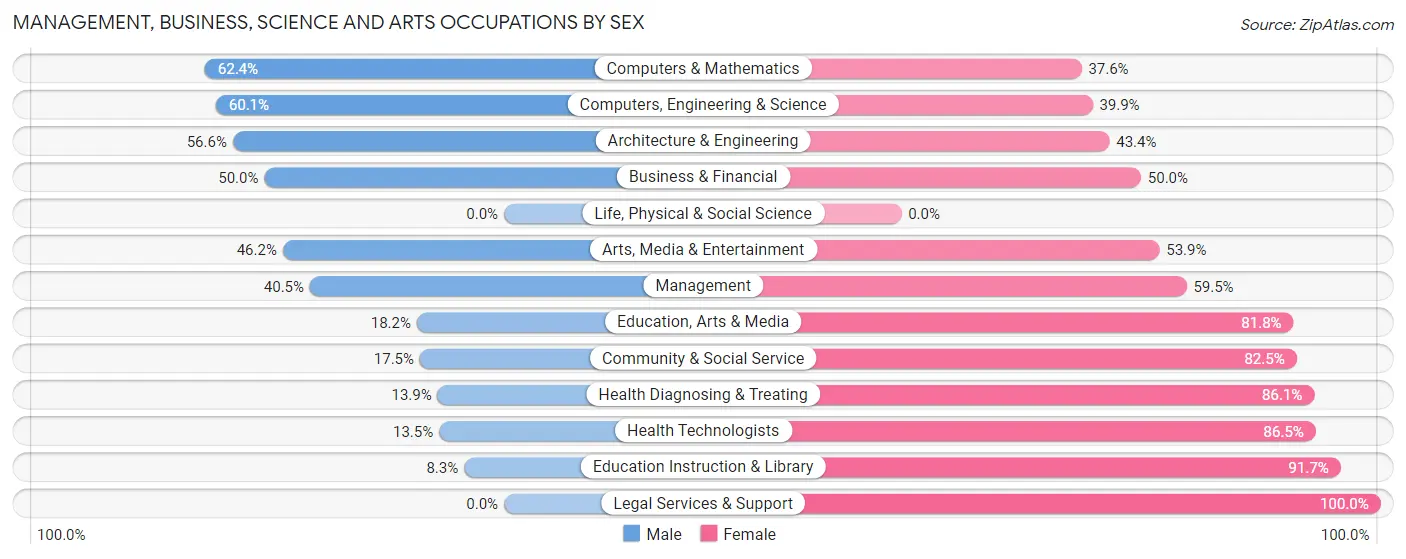
Management, Business, Science and Arts Occupations by Sex
Within the Management, Business, Science and Arts occupations in Pinson, the most male-oriented occupations are Computers & Mathematics (62.4%), Computers, Engineering & Science (60.1%), and Architecture & Engineering (56.6%), while the most female-oriented occupations are Legal Services & Support (100.0%), Education Instruction & Library (91.7%), and Health Technologists (86.5%).
| Occupation | Male | Female |
| Management | 66 (40.5%) | 97 (59.5%) |
| Business & Financial | 51 (50.0%) | 51 (50.0%) |
| Computers, Engineering & Science | 116 (60.1%) | 77 (39.9%) |
| Computers & Mathematics | 73 (62.4%) | 44 (37.6%) |
| Architecture & Engineering | 43 (56.6%) | 33 (43.4%) |
| Life, Physical & Social Science | 0 (0.0%) | 0 (0.0%) |
| Community & Social Service | 77 (17.5%) | 362 (82.5%) |
| Education, Arts & Media | 20 (18.2%) | 90 (81.8%) |
| Legal Services & Support | 0 (0.0%) | 58 (100.0%) |
| Education Instruction & Library | 15 (8.3%) | 165 (91.7%) |
| Arts, Media & Entertainment | 42 (46.2%) | 49 (53.8%) |
| Health Diagnosing & Treating | 46 (13.9%) | 286 (86.1%) |
| Health Technologists | 26 (13.5%) | 166 (86.5%) |
| Total (Category) | 356 (29.0%) | 873 (71.0%) |
| Total (Overall) | 1,804 (49.4%) | 1,844 (50.5%) |
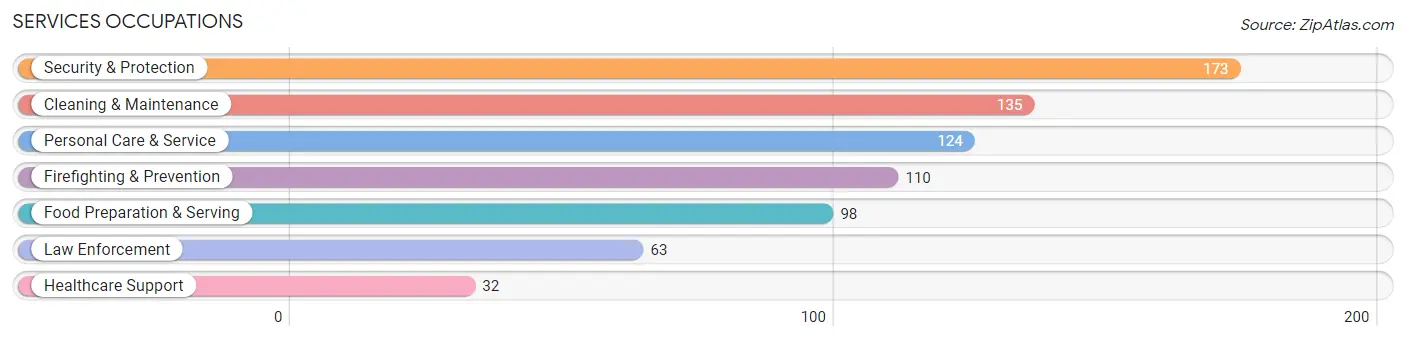
Services Occupations
The most common Services occupations in Pinson are Security & Protection (173 | 4.7%), Cleaning & Maintenance (135 | 3.7%), Personal Care & Service (124 | 3.4%), Firefighting & Prevention (110 | 3.0%), and Food Preparation & Serving (98 | 2.7%).
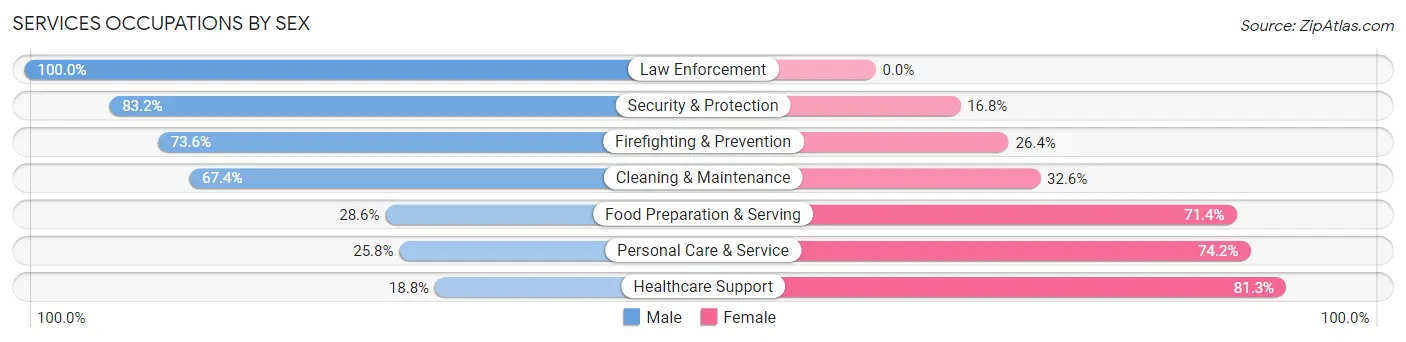
Services Occupations by Sex
Within the Services occupations in Pinson, the most male-oriented occupations are Law Enforcement (100.0%), Security & Protection (83.2%), and Firefighting & Prevention (73.6%), while the most female-oriented occupations are Healthcare Support (81.2%), Personal Care & Service (74.2%), and Food Preparation & Serving (71.4%).
| Occupation | Male | Female |
| Healthcare Support | 6 (18.8%) | 26 (81.2%) |
| Security & Protection | 144 (83.2%) | 29 (16.8%) |
| Firefighting & Prevention | 81 (73.6%) | 29 (26.4%) |
| Law Enforcement | 63 (100.0%) | 0 (0.0%) |
| Food Preparation & Serving | 28 (28.6%) | 70 (71.4%) |
| Cleaning & Maintenance | 91 (67.4%) | 44 (32.6%) |
| Personal Care & Service | 32 (25.8%) | 92 (74.2%) |
| Total (Category) | 301 (53.6%) | 261 (46.4%) |
| Total (Overall) | 1,804 (49.4%) | 1,844 (50.5%) |
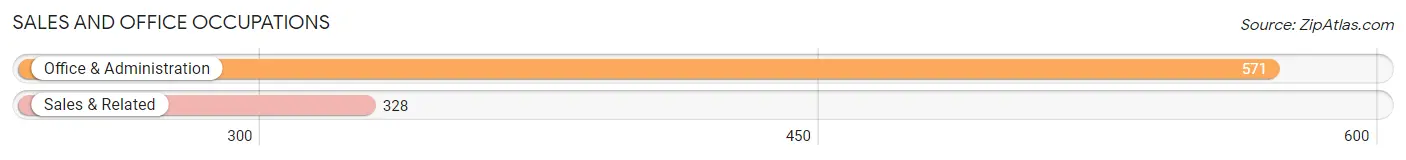
Sales and Office Occupations
The most common Sales and Office occupations in Pinson are Office & Administration (571 | 15.7%), and Sales & Related (328 | 9.0%).
Sales and Office Occupations by Sex
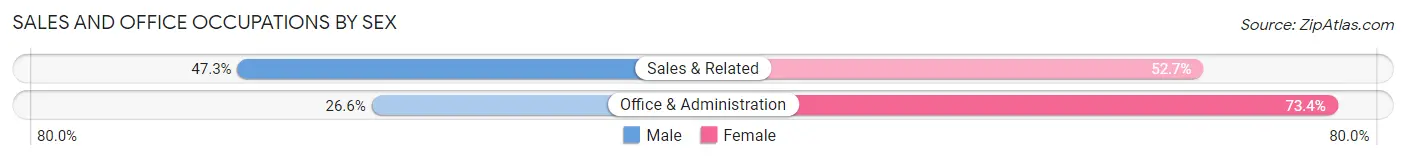
| Occupation | Male | Female |
| Sales & Related | 155 (47.3%) | 173 (52.7%) |
| Office & Administration | 152 (26.6%) | 419 (73.4%) |
| Total (Category) | 307 (34.2%) | 592 (65.8%) |
| Total (Overall) | 1,804 (49.4%) | 1,844 (50.5%) |
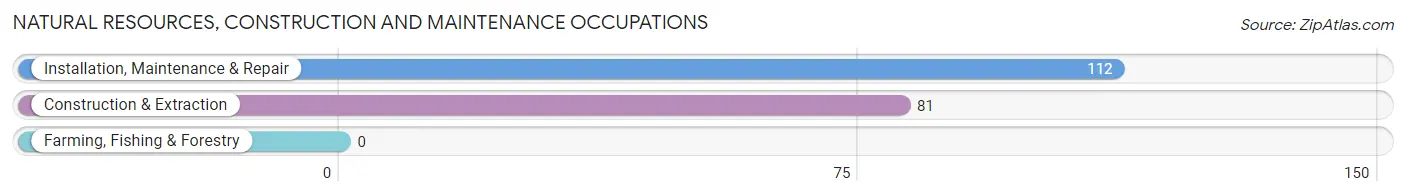
Natural Resources, Construction and Maintenance Occupations
The most common Natural Resources, Construction and Maintenance occupations in Pinson are Installation, Maintenance & Repair (112 | 3.1%), and Construction & Extraction (81 | 2.2%).
Natural Resources, Construction and Maintenance Occupations by Sex
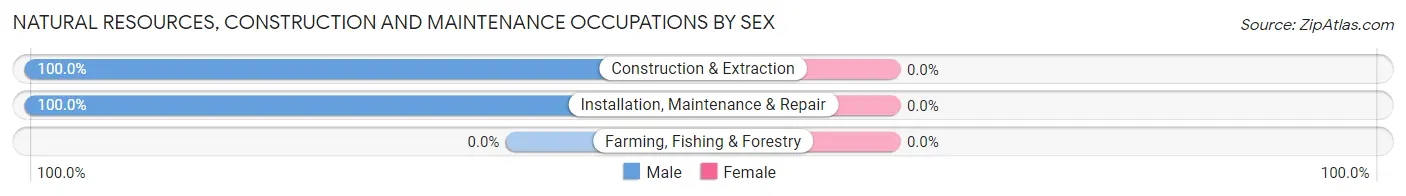
| Occupation | Male | Female |
| Farming, Fishing & Forestry | 0 (0.0%) | 0 (0.0%) |
| Construction & Extraction | 81 (100.0%) | 0 (0.0%) |
| Installation, Maintenance & Repair | 112 (100.0%) | 0 (0.0%) |
| Total (Category) | 193 (100.0%) | 0 (0.0%) |
| Total (Overall) | 1,804 (49.4%) | 1,844 (50.5%) |
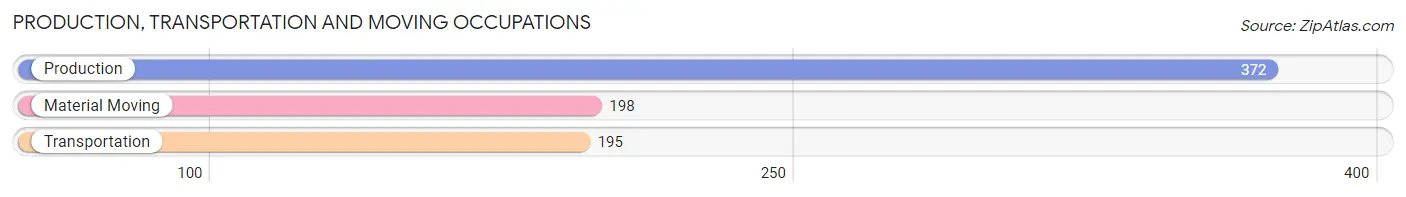
Production, Transportation and Moving Occupations
The most common Production, Transportation and Moving occupations in Pinson are Production (372 | 10.2%), Material Moving (198 | 5.4%), and Transportation (195 | 5.3%).
Production, Transportation and Moving Occupations by Sex
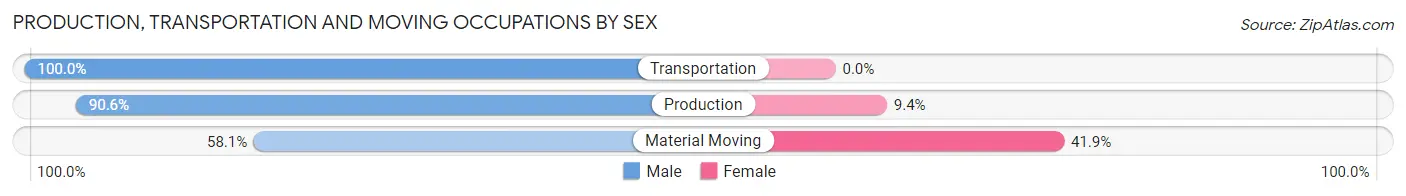
| Occupation | Male | Female |
| Production | 337 (90.6%) | 35 (9.4%) |
| Transportation | 195 (100.0%) | 0 (0.0%) |
| Material Moving | 115 (58.1%) | 83 (41.9%) |
| Total (Category) | 647 (84.6%) | 118 (15.4%) |
| Total (Overall) | 1,804 (49.4%) | 1,844 (50.5%) |
Employment Industries by Sex in Pinson
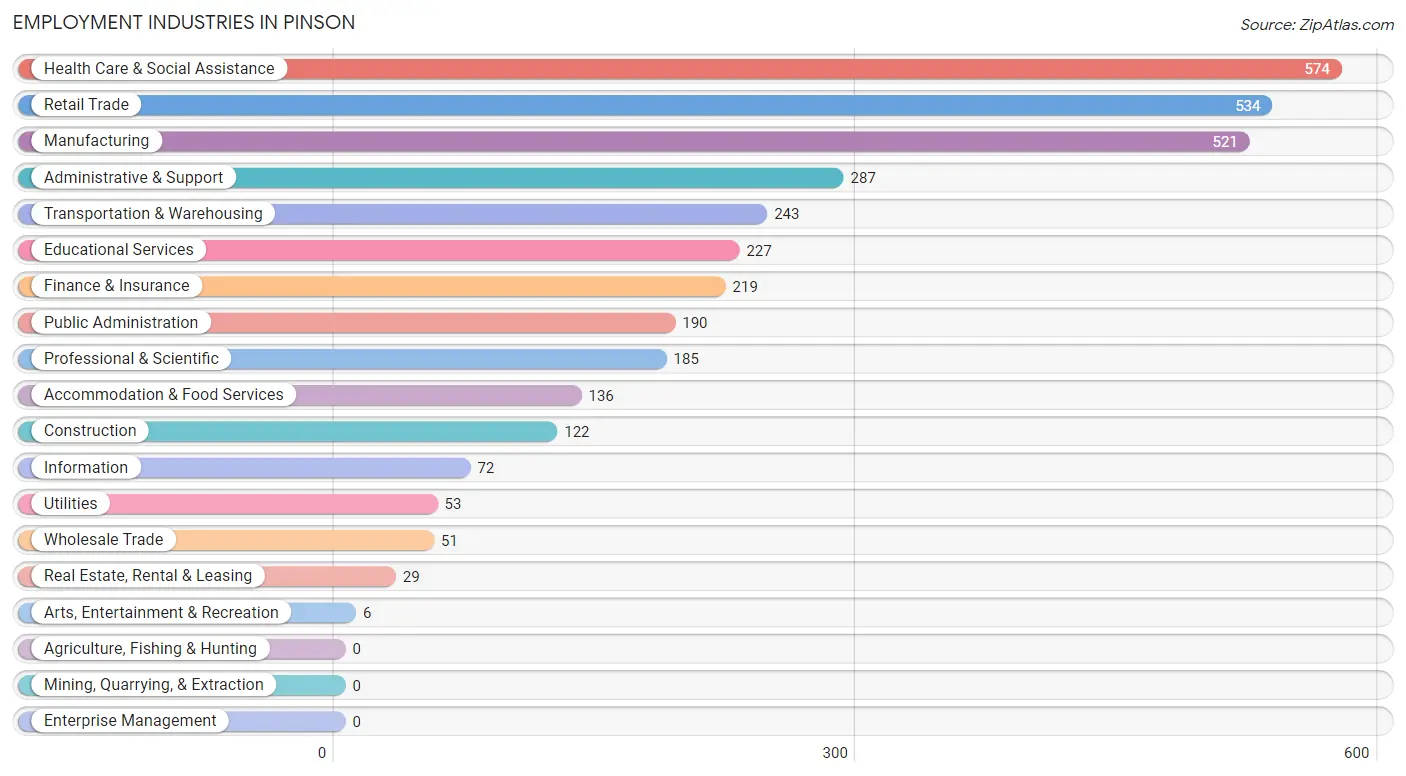
Employment Industries in Pinson
The major employment industries in Pinson include Health Care & Social Assistance (574 | 15.7%), Retail Trade (534 | 14.6%), Manufacturing (521 | 14.3%), Administrative & Support (287 | 7.9%), and Transportation & Warehousing (243 | 6.7%).
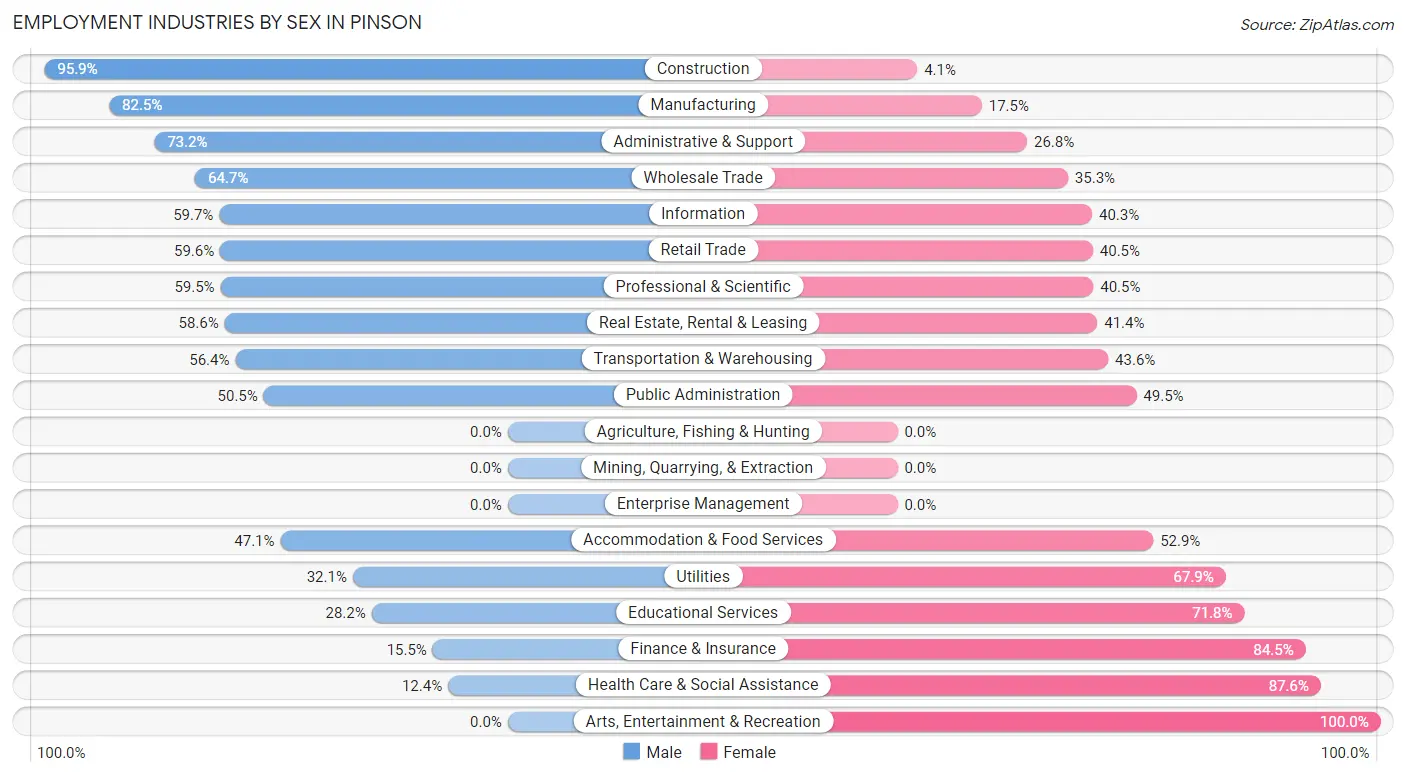
Employment Industries by Sex in Pinson
The Pinson industries that see more men than women are Construction (95.9%), Manufacturing (82.5%), and Administrative & Support (73.2%), whereas the industries that tend to have a higher number of women are Arts, Entertainment & Recreation (100.0%), Health Care & Social Assistance (87.6%), and Finance & Insurance (84.5%).
| Industry | Male | Female |
| Agriculture, Fishing & Hunting | 0 (0.0%) | 0 (0.0%) |
| Mining, Quarrying, & Extraction | 0 (0.0%) | 0 (0.0%) |
| Construction | 117 (95.9%) | 5 (4.1%) |
| Manufacturing | 430 (82.5%) | 91 (17.5%) |
| Wholesale Trade | 33 (64.7%) | 18 (35.3%) |
| Retail Trade | 318 (59.6%) | 216 (40.5%) |
| Transportation & Warehousing | 137 (56.4%) | 106 (43.6%) |
| Utilities | 17 (32.1%) | 36 (67.9%) |
| Information | 43 (59.7%) | 29 (40.3%) |
| Finance & Insurance | 34 (15.5%) | 185 (84.5%) |
| Real Estate, Rental & Leasing | 17 (58.6%) | 12 (41.4%) |
| Professional & Scientific | 110 (59.5%) | 75 (40.5%) |
| Enterprise Management | 0 (0.0%) | 0 (0.0%) |
| Administrative & Support | 210 (73.2%) | 77 (26.8%) |
| Educational Services | 64 (28.2%) | 163 (71.8%) |
| Health Care & Social Assistance | 71 (12.4%) | 503 (87.6%) |
| Arts, Entertainment & Recreation | 0 (0.0%) | 6 (100.0%) |
| Accommodation & Food Services | 64 (47.1%) | 72 (52.9%) |
| Public Administration | 96 (50.5%) | 94 (49.5%) |
| Total | 1,804 (49.4%) | 1,844 (50.5%) |
Education in Pinson
School Enrollment in Pinson
The most common levels of schooling among the 1,762 students in Pinson are high school (507 | 28.8%), college / undergraduate (355 | 20.2%), and middle school (326 | 18.5%).
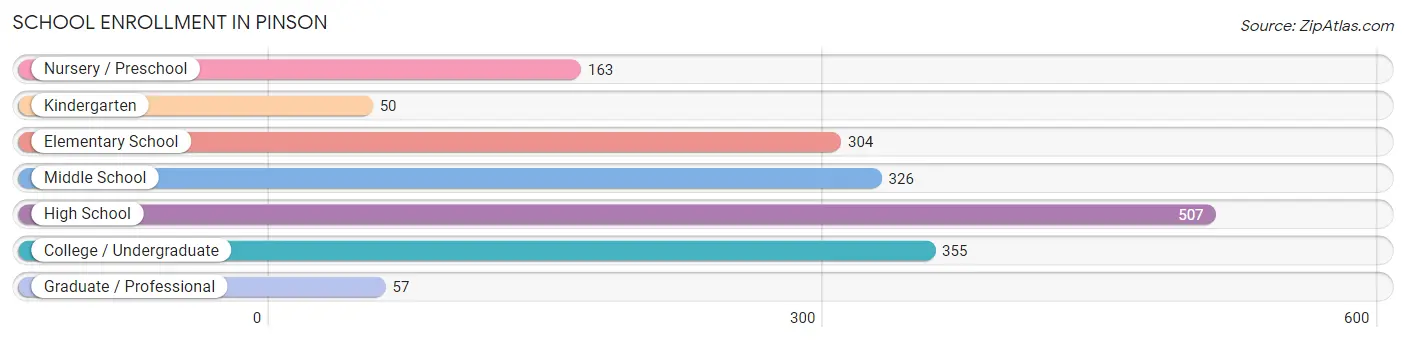
| School Level | # Students | % Students |
| Nursery / Preschool | 163 | 9.2% |
| Kindergarten | 50 | 2.8% |
| Elementary School | 304 | 17.2% |
| Middle School | 326 | 18.5% |
| High School | 507 | 28.8% |
| College / Undergraduate | 355 | 20.2% |
| Graduate / Professional | 57 | 3.2% |
| Total | 1,762 | 100.0% |
School Enrollment by Age by Funding Source in Pinson
Out of a total of 1,762 students who are enrolled in schools in Pinson, 294 (16.7%) attend a private institution, while the remaining 1,468 (83.3%) are enrolled in public schools. The age group of 3 to 4 year olds has the highest likelihood of being enrolled in private schools, with 133 (85.3% in the age bracket) enrolled. Conversely, the age group of 15 to 17 year olds has the lowest likelihood of being enrolled in a private school, with 390 (100.0% in the age bracket) attending a public institution.
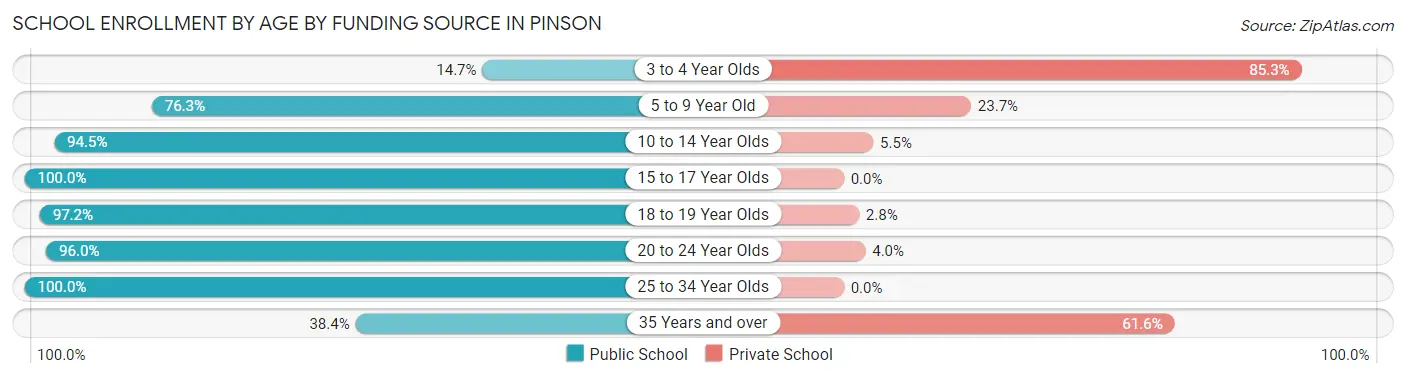
| Age Bracket | Public School | Private School |
| 3 to 4 Year Olds | 23 (14.7%) | 133 (85.3%) |
| 5 to 9 Year Old | 235 (76.3%) | 73 (23.7%) |
| 10 to 14 Year Olds | 396 (94.5%) | 23 (5.5%) |
| 15 to 17 Year Olds | 390 (100.0%) | 0 (0.0%) |
| 18 to 19 Year Olds | 137 (97.2%) | 4 (2.8%) |
| 20 to 24 Year Olds | 215 (96.0%) | 9 (4.0%) |
| 25 to 34 Year Olds | 38 (100.0%) | 0 (0.0%) |
| 35 Years and over | 33 (38.4%) | 53 (61.6%) |
| Total | 1,468 (83.3%) | 294 (16.7%) |
Educational Attainment by Field of Study in Pinson
Business (313 | 34.8%), science & technology (114 | 12.7%), communications (100 | 11.1%), arts & humanities (63 | 7.0%), and psychology (60 | 6.7%) are the most common fields of study among 899 individuals in Pinson who have obtained a bachelor's degree or higher.
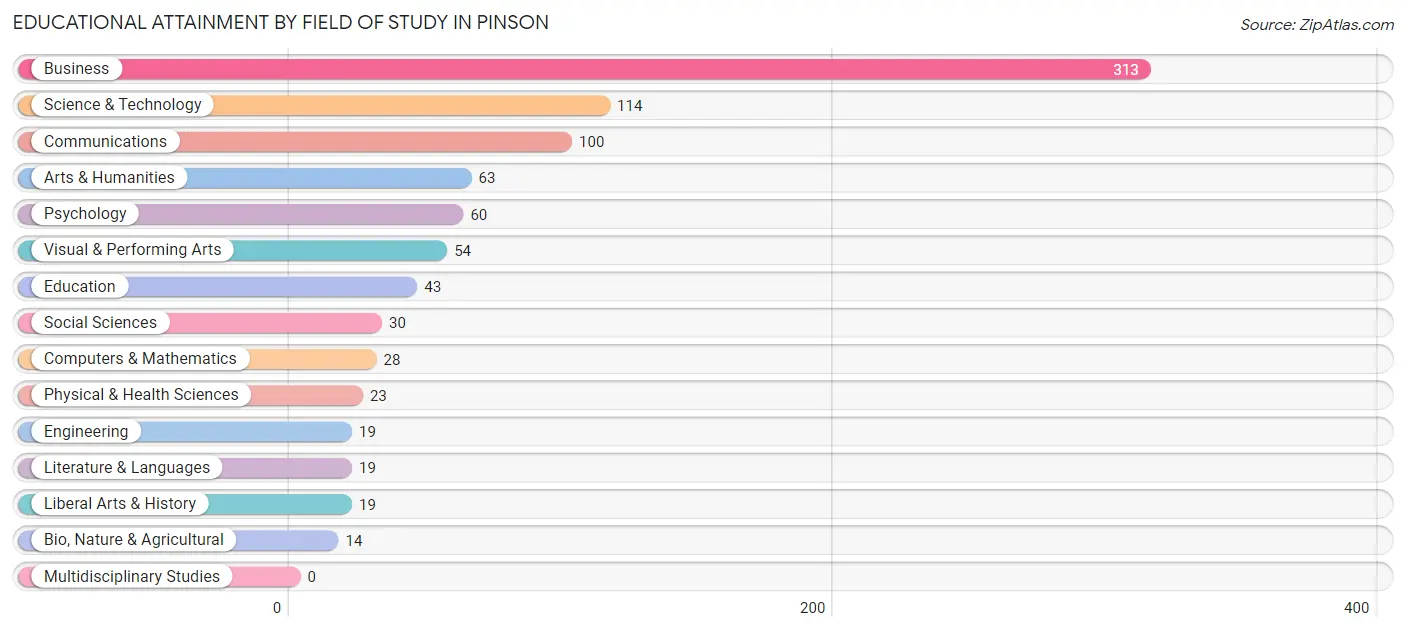
| Field of Study | # Graduates | % Graduates |
| Computers & Mathematics | 28 | 3.1% |
| Bio, Nature & Agricultural | 14 | 1.6% |
| Physical & Health Sciences | 23 | 2.6% |
| Psychology | 60 | 6.7% |
| Social Sciences | 30 | 3.3% |
| Engineering | 19 | 2.1% |
| Multidisciplinary Studies | 0 | 0.0% |
| Science & Technology | 114 | 12.7% |
| Business | 313 | 34.8% |
| Education | 43 | 4.8% |
| Literature & Languages | 19 | 2.1% |
| Liberal Arts & History | 19 | 2.1% |
| Visual & Performing Arts | 54 | 6.0% |
| Communications | 100 | 11.1% |
| Arts & Humanities | 63 | 7.0% |
| Total | 899 | 100.0% |
Transportation & Commute in Pinson
Vehicle Availability by Sex in Pinson
The most prevalent vehicle ownership categories in Pinson are males with 2 vehicles (733, accounting for 40.9%) and females with 2 vehicles (664, making up 40.2%).
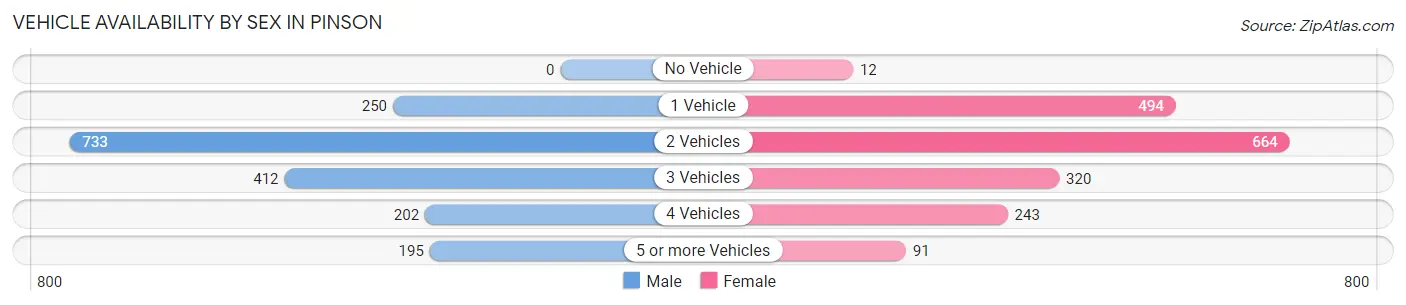
| Vehicles Available | Male | Female |
| No Vehicle | 0 (0.0%) | 12 (0.7%) |
| 1 Vehicle | 250 (14.0%) | 494 (27.1%) |
| 2 Vehicles | 733 (40.9%) | 664 (36.4%) |
| 3 Vehicles | 412 (23.0%) | 320 (17.5%) |
| 4 Vehicles | 202 (11.3%) | 243 (13.3%) |
| 5 or more Vehicles | 195 (10.9%) | 91 (5.0%) |
| Total | 1,792 (100.0%) | 1,824 (100.0%) |
Commute Time in Pinson
The most frequently occuring commute durations in Pinson are 30 to 34 minutes (759 commuters, 22.6%), 20 to 24 minutes (518 commuters, 15.4%), and 45 to 59 minutes (398 commuters, 11.9%).
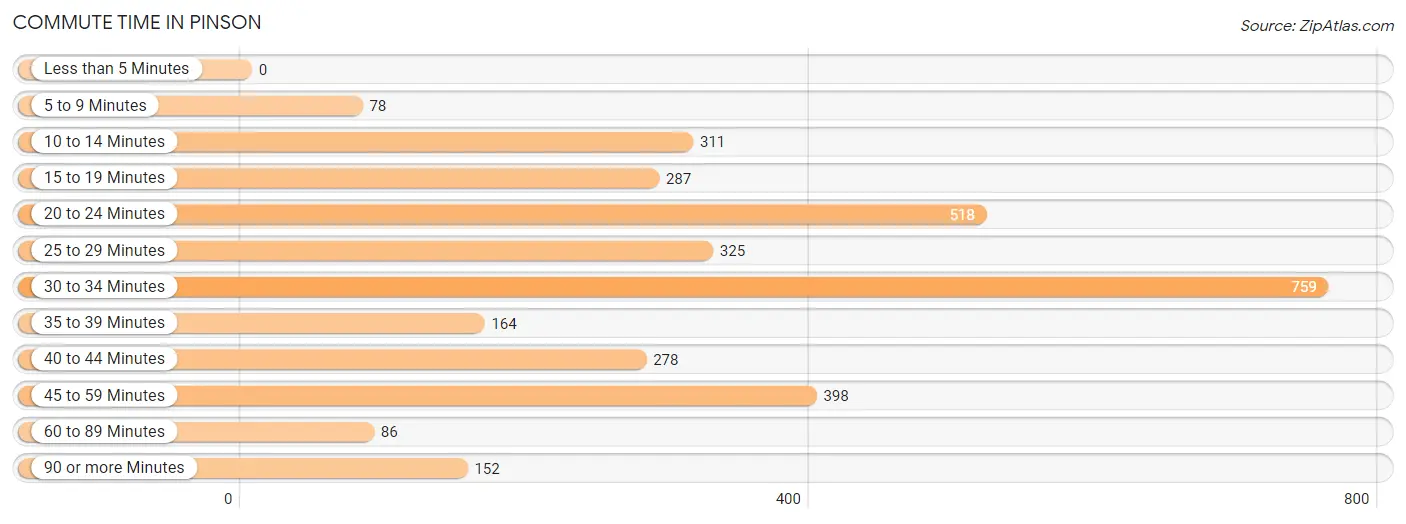
| Commute Time | # Commuters | % Commuters |
| Less than 5 Minutes | 0 | 0.0% |
| 5 to 9 Minutes | 78 | 2.3% |
| 10 to 14 Minutes | 311 | 9.3% |
| 15 to 19 Minutes | 287 | 8.6% |
| 20 to 24 Minutes | 518 | 15.4% |
| 25 to 29 Minutes | 325 | 9.7% |
| 30 to 34 Minutes | 759 | 22.6% |
| 35 to 39 Minutes | 164 | 4.9% |
| 40 to 44 Minutes | 278 | 8.3% |
| 45 to 59 Minutes | 398 | 11.9% |
| 60 to 89 Minutes | 86 | 2.6% |
| 90 or more Minutes | 152 | 4.5% |
Commute Time by Sex in Pinson
The most common commute times in Pinson are 30 to 34 minutes (400 commuters, 23.3%) for males and 20 to 24 minutes (374 commuters, 22.9%) for females.
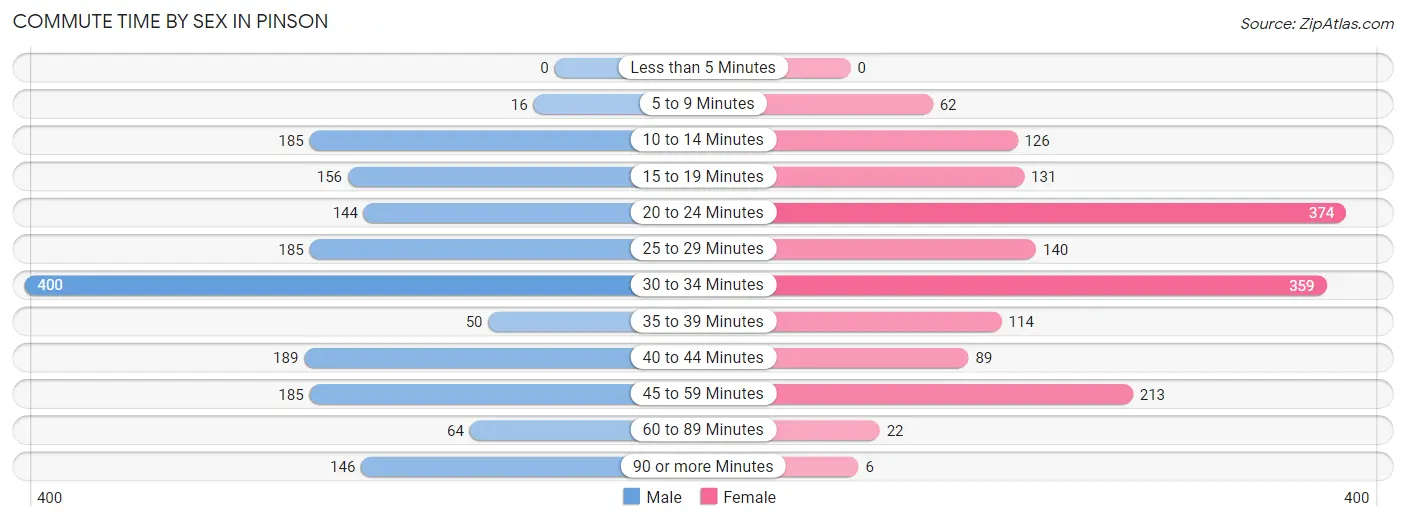
| Commute Time | Male | Female |
| Less than 5 Minutes | 0 (0.0%) | 0 (0.0%) |
| 5 to 9 Minutes | 16 (0.9%) | 62 (3.8%) |
| 10 to 14 Minutes | 185 (10.8%) | 126 (7.7%) |
| 15 to 19 Minutes | 156 (9.1%) | 131 (8.0%) |
| 20 to 24 Minutes | 144 (8.4%) | 374 (22.9%) |
| 25 to 29 Minutes | 185 (10.8%) | 140 (8.6%) |
| 30 to 34 Minutes | 400 (23.3%) | 359 (21.9%) |
| 35 to 39 Minutes | 50 (2.9%) | 114 (7.0%) |
| 40 to 44 Minutes | 189 (11.0%) | 89 (5.4%) |
| 45 to 59 Minutes | 185 (10.8%) | 213 (13.0%) |
| 60 to 89 Minutes | 64 (3.7%) | 22 (1.3%) |
| 90 or more Minutes | 146 (8.5%) | 6 (0.4%) |
Time of Departure to Work by Sex in Pinson
The most frequent times of departure to work in Pinson are 5:30 AM to 5:59 AM (258, 15.0%) for males and 7:00 AM to 7:29 AM (277, 16.9%) for females.
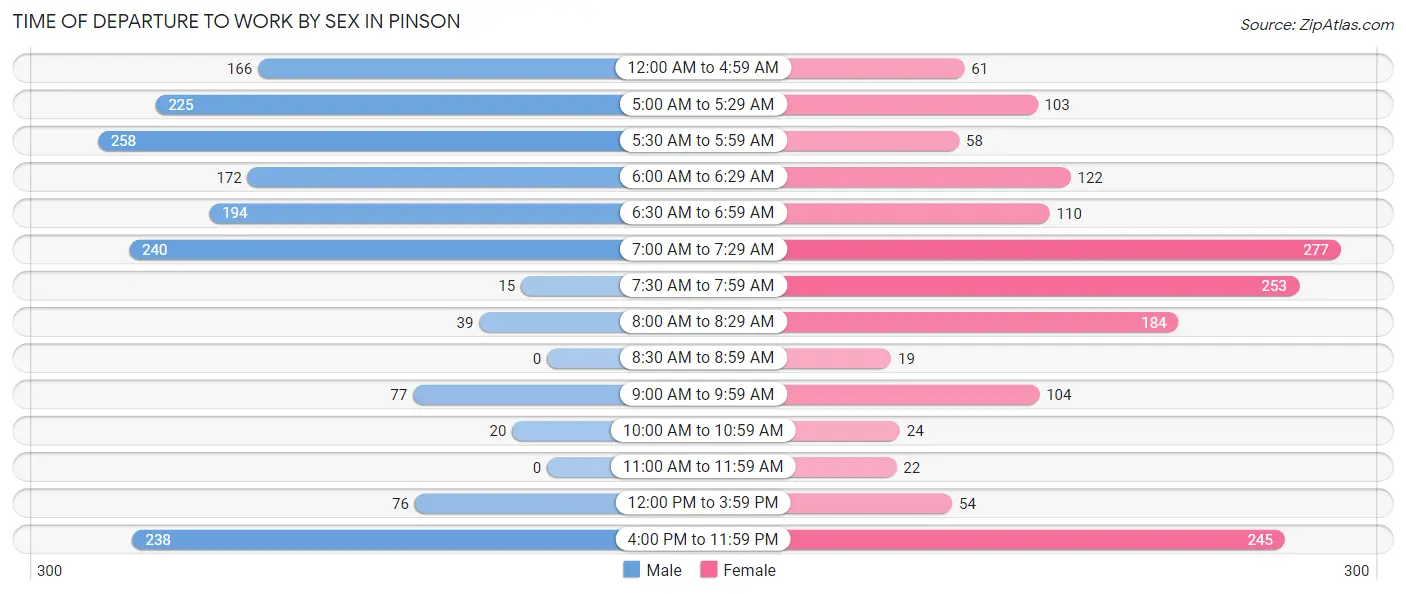
| Time of Departure | Male | Female |
| 12:00 AM to 4:59 AM | 166 (9.7%) | 61 (3.7%) |
| 5:00 AM to 5:29 AM | 225 (13.1%) | 103 (6.3%) |
| 5:30 AM to 5:59 AM | 258 (15.0%) | 58 (3.5%) |
| 6:00 AM to 6:29 AM | 172 (10.0%) | 122 (7.5%) |
| 6:30 AM to 6:59 AM | 194 (11.3%) | 110 (6.7%) |
| 7:00 AM to 7:29 AM | 240 (14.0%) | 277 (16.9%) |
| 7:30 AM to 7:59 AM | 15 (0.9%) | 253 (15.5%) |
| 8:00 AM to 8:29 AM | 39 (2.3%) | 184 (11.3%) |
| 8:30 AM to 8:59 AM | 0 (0.0%) | 19 (1.2%) |
| 9:00 AM to 9:59 AM | 77 (4.5%) | 104 (6.4%) |
| 10:00 AM to 10:59 AM | 20 (1.2%) | 24 (1.5%) |
| 11:00 AM to 11:59 AM | 0 (0.0%) | 22 (1.3%) |
| 12:00 PM to 3:59 PM | 76 (4.4%) | 54 (3.3%) |
| 4:00 PM to 11:59 PM | 238 (13.8%) | 245 (15.0%) |
| Total | 1,720 (100.0%) | 1,636 (100.0%) |
Housing Occupancy in Pinson
Occupancy by Ownership in Pinson
Of the total 2,680 dwellings in Pinson, owner-occupied units account for 2,286 (85.3%), while renter-occupied units make up 394 (14.7%).
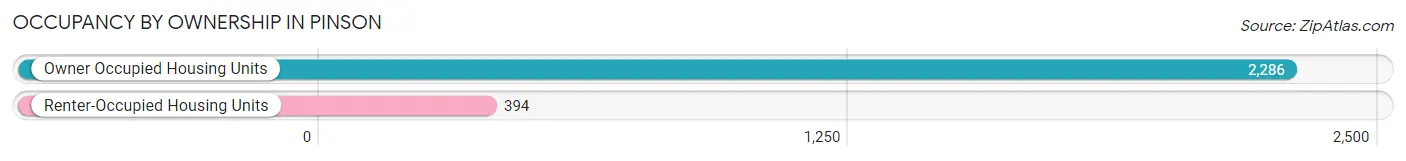
| Occupancy | # Housing Units | % Housing Units |
| Owner Occupied Housing Units | 2,286 | 85.3% |
| Renter-Occupied Housing Units | 394 | 14.7% |
| Total Occupied Housing Units | 2,680 | 100.0% |
Occupancy by Household Size in Pinson
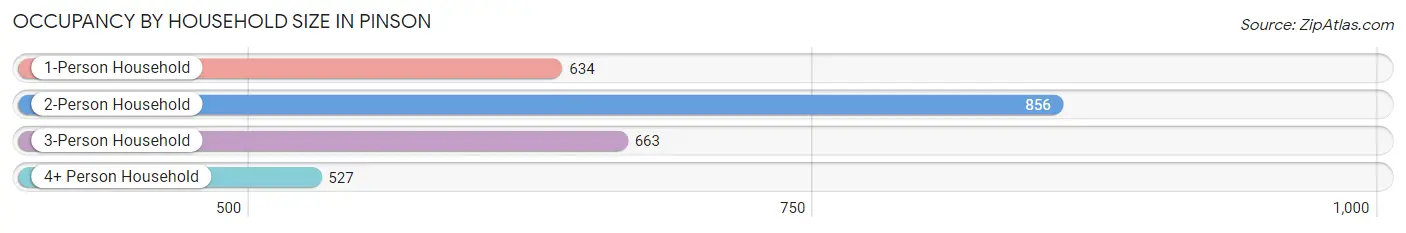
| Household Size | # Housing Units | % Housing Units |
| 1-Person Household | 634 | 23.7% |
| 2-Person Household | 856 | 31.9% |
| 3-Person Household | 663 | 24.7% |
| 4+ Person Household | 527 | 19.7% |
| Total Housing Units | 2,680 | 100.0% |
Occupancy by Ownership by Household Size in Pinson
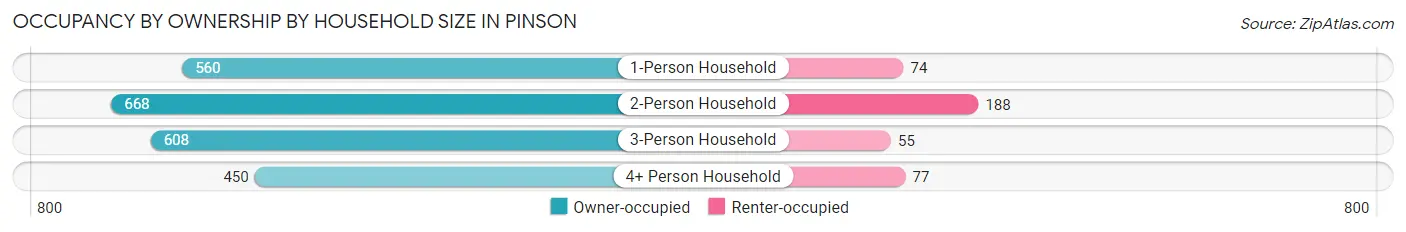
| Household Size | Owner-occupied | Renter-occupied |
| 1-Person Household | 560 (88.3%) | 74 (11.7%) |
| 2-Person Household | 668 (78.0%) | 188 (22.0%) |
| 3-Person Household | 608 (91.7%) | 55 (8.3%) |
| 4+ Person Household | 450 (85.4%) | 77 (14.6%) |
| Total Housing Units | 2,286 (85.3%) | 394 (14.7%) |
Occupancy by Educational Attainment in Pinson
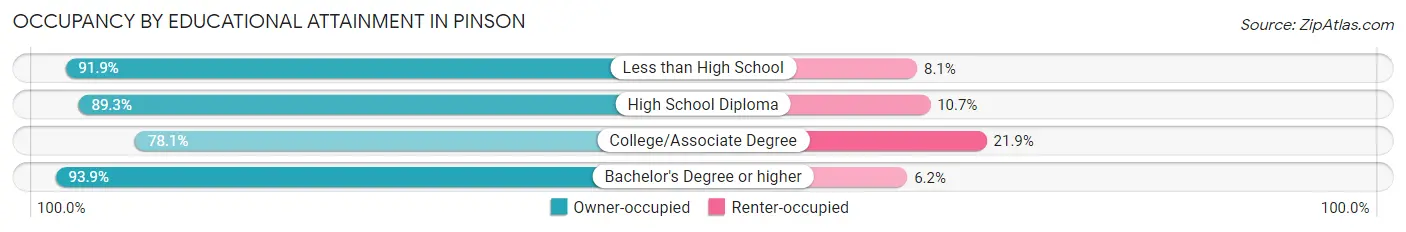
| Household Size | Owner-occupied | Renter-occupied |
| Less than High School | 193 (91.9%) | 17 (8.1%) |
| High School Diploma | 675 (89.3%) | 81 (10.7%) |
| College/Associate Degree | 945 (78.1%) | 265 (21.9%) |
| Bachelor's Degree or higher | 473 (93.9%) | 31 (6.1%) |
Occupancy by Age of Householder in Pinson
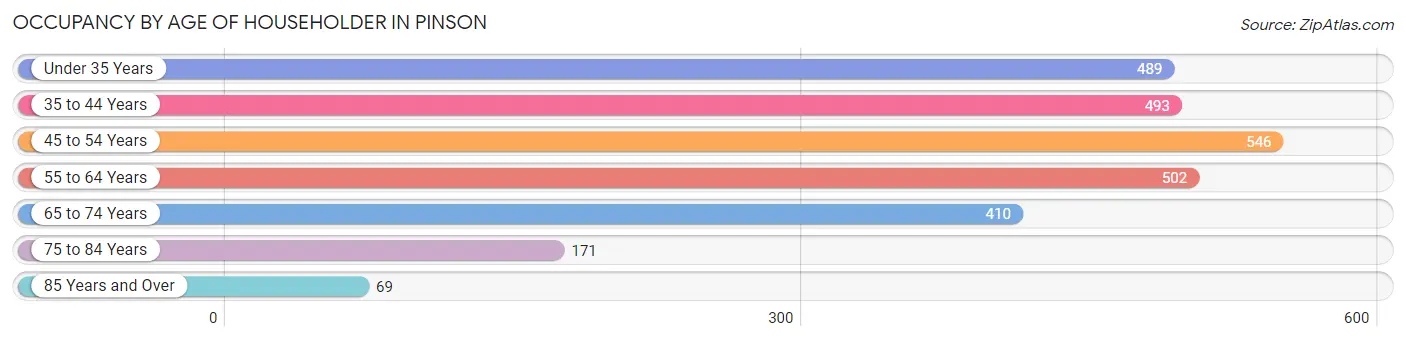
| Age Bracket | # Households | % Households |
| Under 35 Years | 489 | 18.2% |
| 35 to 44 Years | 493 | 18.4% |
| 45 to 54 Years | 546 | 20.4% |
| 55 to 64 Years | 502 | 18.7% |
| 65 to 74 Years | 410 | 15.3% |
| 75 to 84 Years | 171 | 6.4% |
| 85 Years and Over | 69 | 2.6% |
| Total | 2,680 | 100.0% |
Housing Finances in Pinson
Median Income by Occupancy in Pinson
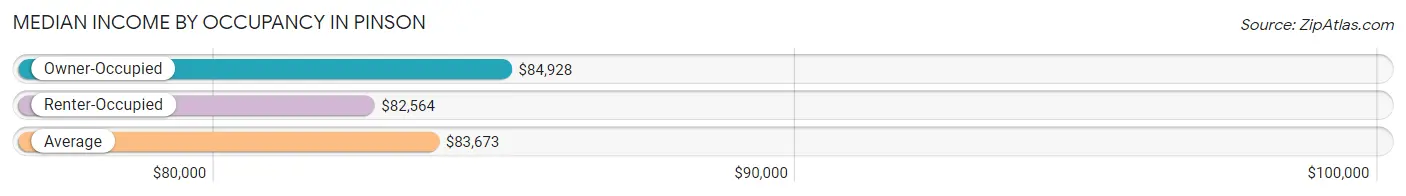
| Occupancy Type | # Households | Median Income |
| Owner-Occupied | 2,286 (85.3%) | $84,928 |
| Renter-Occupied | 394 (14.7%) | $82,564 |
| Average | 2,680 (100.0%) | $83,673 |
Occupancy by Householder Income Bracket in Pinson
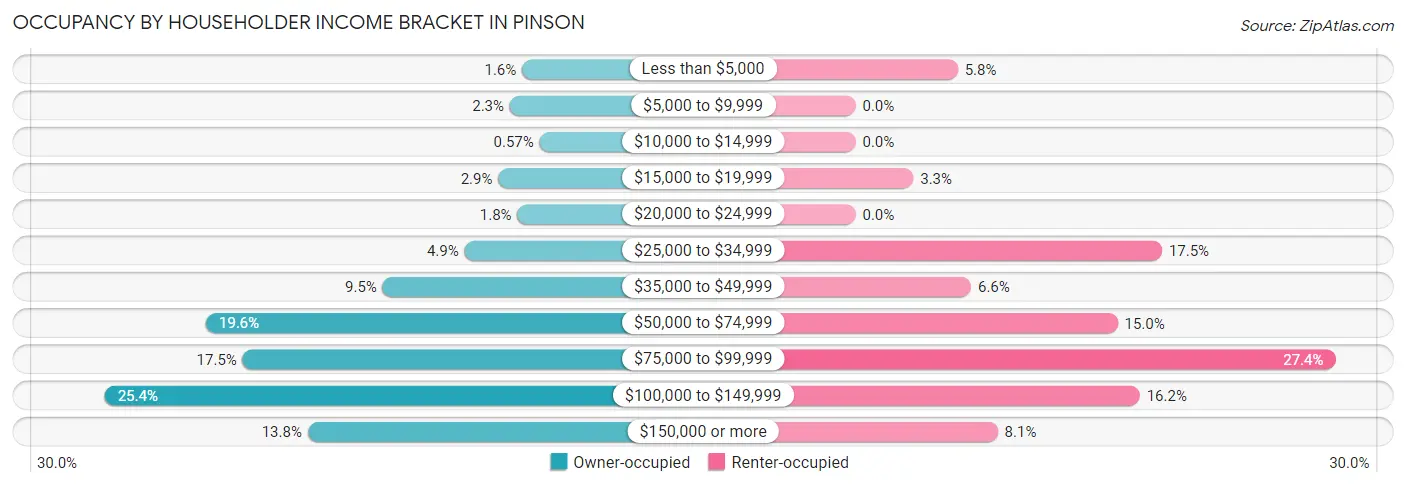
| Income Bracket | Owner-occupied | Renter-occupied |
| Less than $5,000 | 36 (1.6%) | 23 (5.8%) |
| $5,000 to $9,999 | 52 (2.3%) | 0 (0.0%) |
| $10,000 to $14,999 | 13 (0.6%) | 0 (0.0%) |
| $15,000 to $19,999 | 67 (2.9%) | 13 (3.3%) |
| $20,000 to $24,999 | 42 (1.8%) | 0 (0.0%) |
| $25,000 to $34,999 | 111 (4.9%) | 69 (17.5%) |
| $35,000 to $49,999 | 218 (9.5%) | 26 (6.6%) |
| $50,000 to $74,999 | 449 (19.6%) | 59 (15.0%) |
| $75,000 to $99,999 | 401 (17.5%) | 108 (27.4%) |
| $100,000 to $149,999 | 581 (25.4%) | 64 (16.2%) |
| $150,000 or more | 316 (13.8%) | 32 (8.1%) |
| Total | 2,286 (100.0%) | 394 (100.0%) |
Monthly Housing Cost Tiers in Pinson
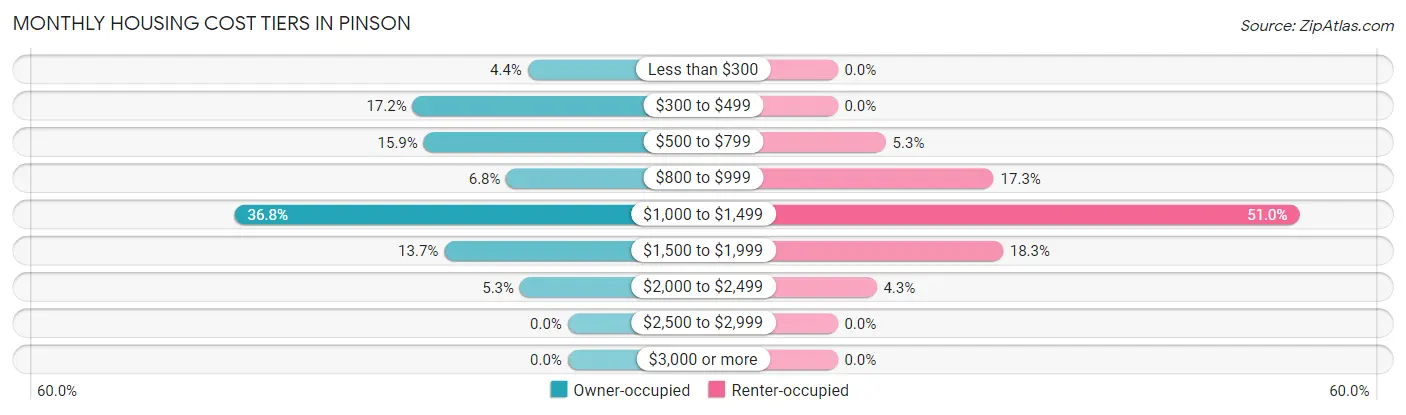
| Monthly Cost | Owner-occupied | Renter-occupied |
| Less than $300 | 101 (4.4%) | 0 (0.0%) |
| $300 to $499 | 392 (17.2%) | 0 (0.0%) |
| $500 to $799 | 364 (15.9%) | 21 (5.3%) |
| $800 to $999 | 155 (6.8%) | 68 (17.3%) |
| $1,000 to $1,499 | 841 (36.8%) | 201 (51.0%) |
| $1,500 to $1,999 | 312 (13.7%) | 72 (18.3%) |
| $2,000 to $2,499 | 121 (5.3%) | 17 (4.3%) |
| $2,500 to $2,999 | 0 (0.0%) | 0 (0.0%) |
| $3,000 or more | 0 (0.0%) | 0 (0.0%) |
| Total | 2,286 (100.0%) | 394 (100.0%) |
Physical Housing Characteristics in Pinson
Housing Structures in Pinson
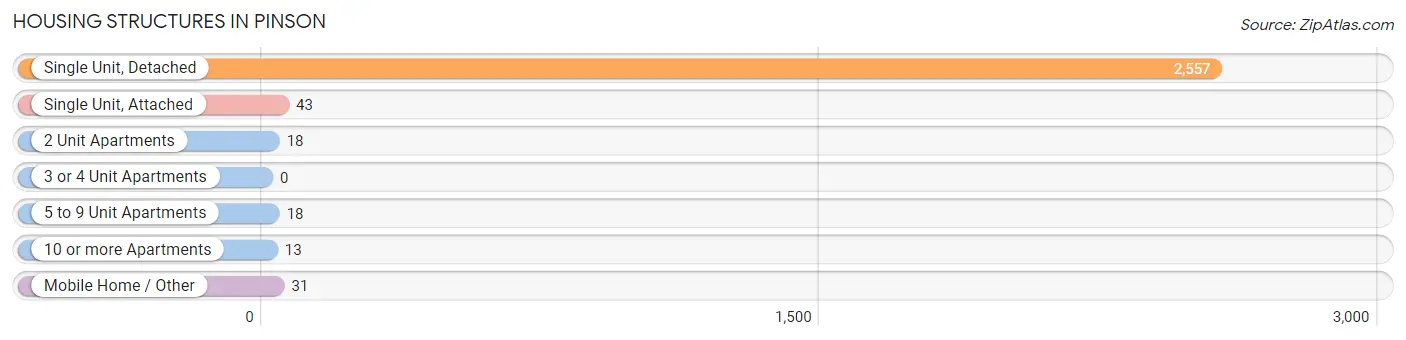
| Structure Type | # Housing Units | % Housing Units |
| Single Unit, Detached | 2,557 | 95.4% |
| Single Unit, Attached | 43 | 1.6% |
| 2 Unit Apartments | 18 | 0.7% |
| 3 or 4 Unit Apartments | 0 | 0.0% |
| 5 to 9 Unit Apartments | 18 | 0.7% |
| 10 or more Apartments | 13 | 0.5% |
| Mobile Home / Other | 31 | 1.2% |
| Total | 2,680 | 100.0% |
Housing Structures by Occupancy in Pinson
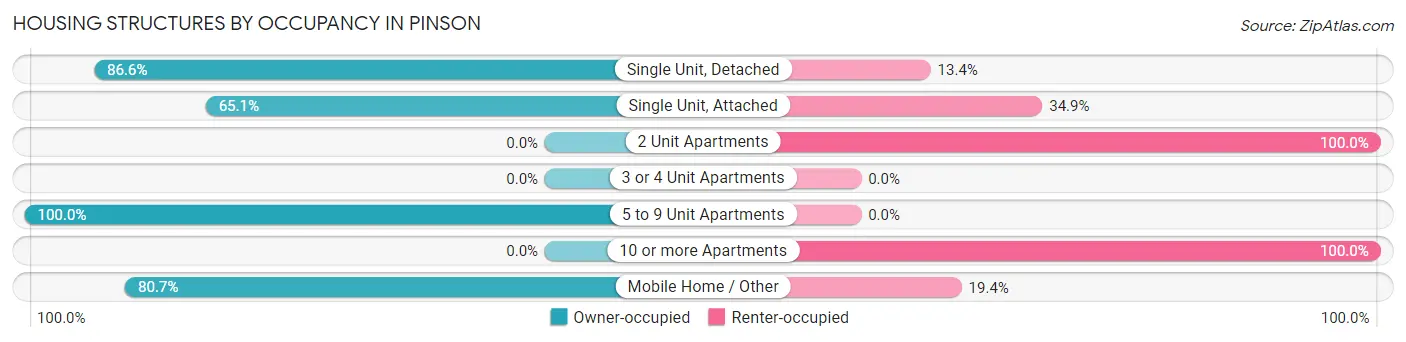
| Structure Type | Owner-occupied | Renter-occupied |
| Single Unit, Detached | 2,215 (86.6%) | 342 (13.4%) |
| Single Unit, Attached | 28 (65.1%) | 15 (34.9%) |
| 2 Unit Apartments | 0 (0.0%) | 18 (100.0%) |
| 3 or 4 Unit Apartments | 0 (0.0%) | 0 (0.0%) |
| 5 to 9 Unit Apartments | 18 (100.0%) | 0 (0.0%) |
| 10 or more Apartments | 0 (0.0%) | 13 (100.0%) |
| Mobile Home / Other | 25 (80.6%) | 6 (19.4%) |
| Total | 2,286 (85.3%) | 394 (14.7%) |
Housing Structures by Number of Rooms in Pinson
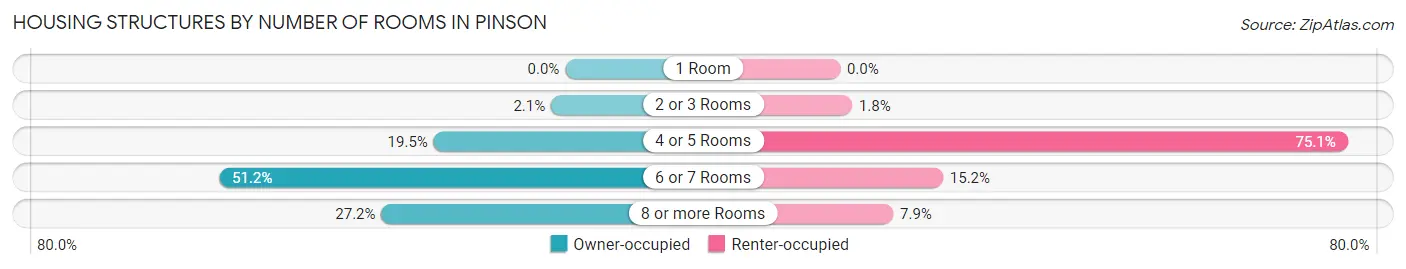
| Number of Rooms | Owner-occupied | Renter-occupied |
| 1 Room | 0 (0.0%) | 0 (0.0%) |
| 2 or 3 Rooms | 48 (2.1%) | 7 (1.8%) |
| 4 or 5 Rooms | 445 (19.5%) | 296 (75.1%) |
| 6 or 7 Rooms | 1,171 (51.2%) | 60 (15.2%) |
| 8 or more Rooms | 622 (27.2%) | 31 (7.9%) |
| Total | 2,286 (100.0%) | 394 (100.0%) |
Housing Structure by Heating Type in Pinson
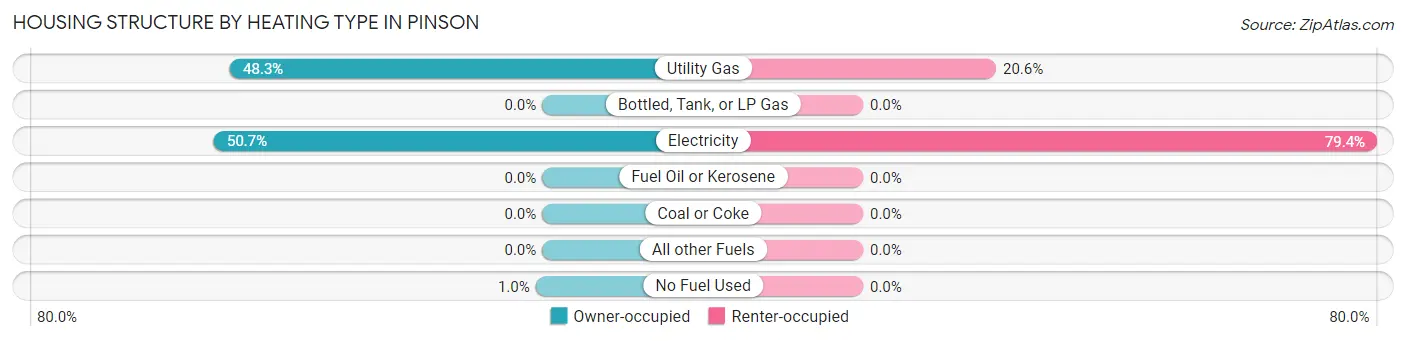
| Heating Type | Owner-occupied | Renter-occupied |
| Utility Gas | 1,103 (48.2%) | 81 (20.6%) |
| Bottled, Tank, or LP Gas | 0 (0.0%) | 0 (0.0%) |
| Electricity | 1,160 (50.7%) | 313 (79.4%) |
| Fuel Oil or Kerosene | 0 (0.0%) | 0 (0.0%) |
| Coal or Coke | 0 (0.0%) | 0 (0.0%) |
| All other Fuels | 0 (0.0%) | 0 (0.0%) |
| No Fuel Used | 23 (1.0%) | 0 (0.0%) |
| Total | 2,286 (100.0%) | 394 (100.0%) |
Household Vehicle Usage in Pinson
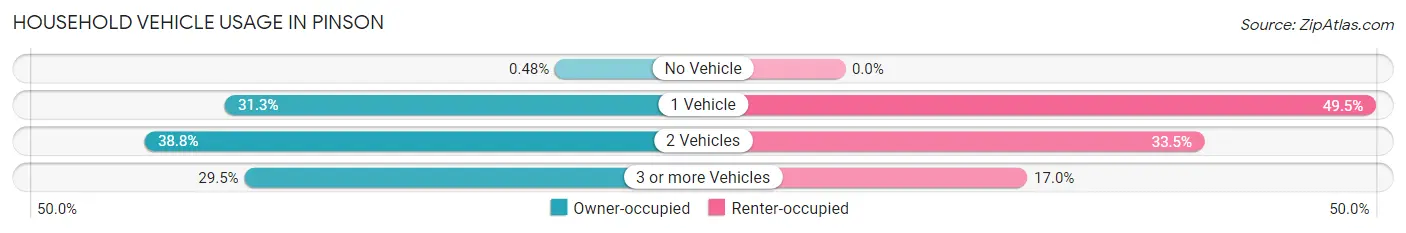
| Vehicles per Household | Owner-occupied | Renter-occupied |
| No Vehicle | 11 (0.5%) | 0 (0.0%) |
| 1 Vehicle | 715 (31.3%) | 195 (49.5%) |
| 2 Vehicles | 886 (38.8%) | 132 (33.5%) |
| 3 or more Vehicles | 674 (29.5%) | 67 (17.0%) |
| Total | 2,286 (100.0%) | 394 (100.0%) |
Real Estate & Mortgages in Pinson
Real Estate and Mortgage Overview in Pinson
| Characteristic | Without Mortgage | With Mortgage |
| Housing Units | 696 | 1,590 |
| Median Property Value | $183,000 | $170,500 |
| Median Household Income | $90,000 | $151 |
| Monthly Housing Costs | $426 | $0 |
| Real Estate Taxes | $788 | $304 |
Property Value by Mortgage Status in Pinson
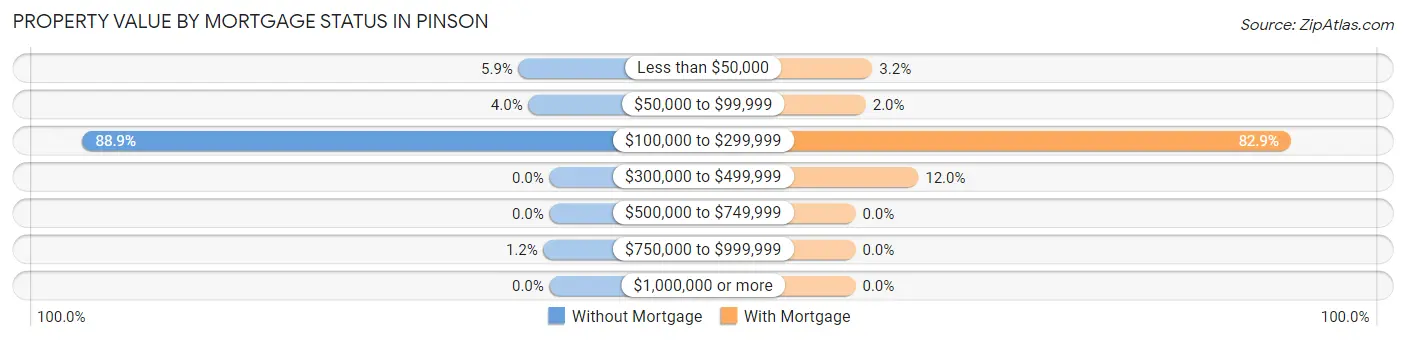
| Property Value | Without Mortgage | With Mortgage |
| Less than $50,000 | 41 (5.9%) | 51 (3.2%) |
| $50,000 to $99,999 | 28 (4.0%) | 31 (1.9%) |
| $100,000 to $299,999 | 619 (88.9%) | 1,318 (82.9%) |
| $300,000 to $499,999 | 0 (0.0%) | 190 (11.9%) |
| $500,000 to $749,999 | 0 (0.0%) | 0 (0.0%) |
| $750,000 to $999,999 | 8 (1.1%) | 0 (0.0%) |
| $1,000,000 or more | 0 (0.0%) | 0 (0.0%) |
| Total | 696 (100.0%) | 1,590 (100.0%) |
Household Income by Mortgage Status in Pinson
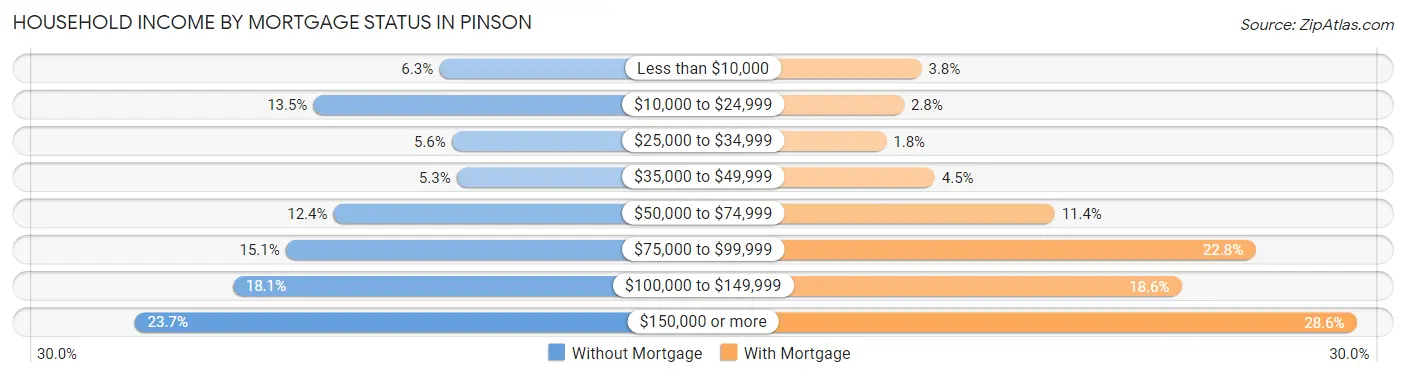
| Household Income | Without Mortgage | With Mortgage |
| Less than $10,000 | 44 (6.3%) | 60 (3.8%) |
| $10,000 to $24,999 | 94 (13.5%) | 44 (2.8%) |
| $25,000 to $34,999 | 39 (5.6%) | 28 (1.8%) |
| $35,000 to $49,999 | 37 (5.3%) | 72 (4.5%) |
| $50,000 to $74,999 | 86 (12.4%) | 181 (11.4%) |
| $75,000 to $99,999 | 105 (15.1%) | 363 (22.8%) |
| $100,000 to $149,999 | 126 (18.1%) | 296 (18.6%) |
| $150,000 or more | 165 (23.7%) | 455 (28.6%) |
| Total | 696 (100.0%) | 1,590 (100.0%) |
Property Value to Household Income Ratio in Pinson
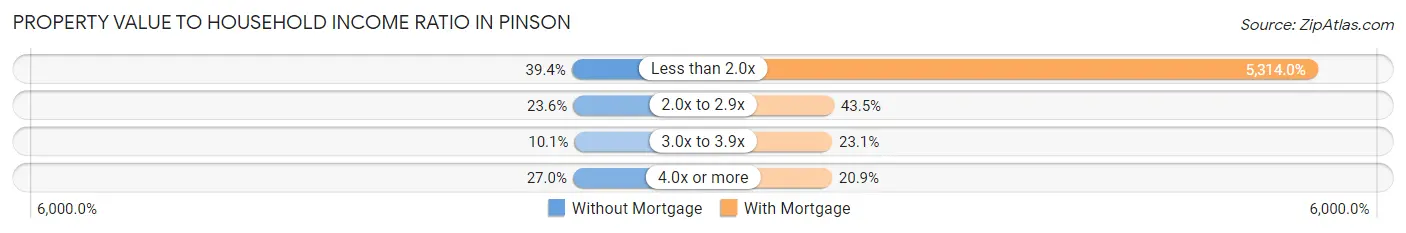
| Value-to-Income Ratio | Without Mortgage | With Mortgage |
| Less than 2.0x | 274 (39.4%) | 84,493 (5,314.0%) |
| 2.0x to 2.9x | 164 (23.6%) | 692 (43.5%) |
| 3.0x to 3.9x | 70 (10.1%) | 367 (23.1%) |
| 4.0x or more | 188 (27.0%) | 332 (20.9%) |
| Total | 696 (100.0%) | 1,590 (100.0%) |
Real Estate Taxes by Mortgage Status in Pinson
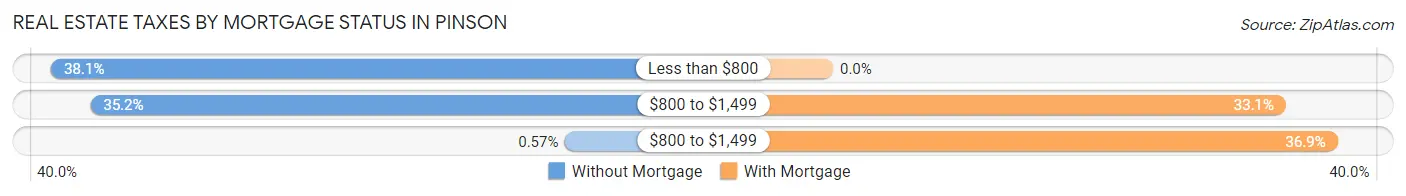
| Property Taxes | Without Mortgage | With Mortgage |
| Less than $800 | 265 (38.1%) | 0 (0.0%) |
| $800 to $1,499 | 245 (35.2%) | 526 (33.1%) |
| $800 to $1,499 | 4 (0.6%) | 586 (36.9%) |
| Total | 696 (100.0%) | 1,590 (100.0%) |
Health & Disability in Pinson
Health Insurance Coverage by Age in Pinson
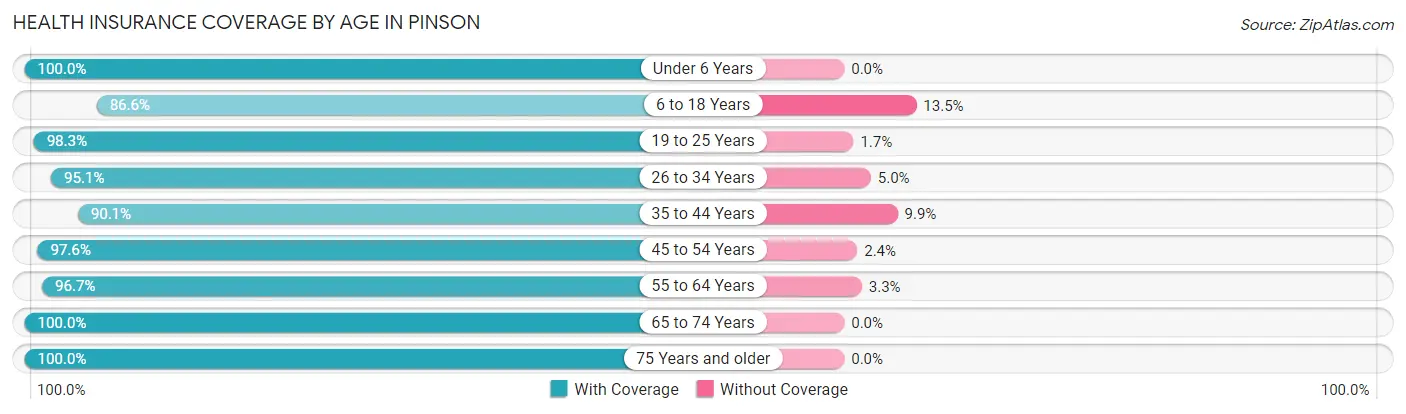
| Age Bracket | With Coverage | Without Coverage |
| Under 6 Years | 675 (100.0%) | 0 (0.0%) |
| 6 to 18 Years | 1,055 (86.6%) | 164 (13.5%) |
| 19 to 25 Years | 690 (98.3%) | 12 (1.7%) |
| 26 to 34 Years | 1,017 (95.1%) | 53 (5.0%) |
| 35 to 44 Years | 761 (90.1%) | 84 (9.9%) |
| 45 to 54 Years | 888 (97.6%) | 22 (2.4%) |
| 55 to 64 Years | 797 (96.7%) | 27 (3.3%) |
| 65 to 74 Years | 608 (100.0%) | 0 (0.0%) |
| 75 Years and older | 356 (100.0%) | 0 (0.0%) |
| Total | 6,847 (95.0%) | 362 (5.0%) |
Health Insurance Coverage by Citizenship Status in Pinson
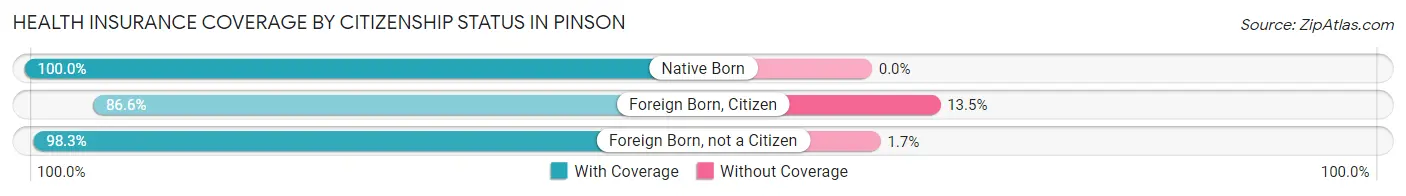
| Citizenship Status | With Coverage | Without Coverage |
| Native Born | 675 (100.0%) | 0 (0.0%) |
| Foreign Born, Citizen | 1,055 (86.6%) | 164 (13.5%) |
| Foreign Born, not a Citizen | 690 (98.3%) | 12 (1.7%) |
Health Insurance Coverage by Household Income in Pinson
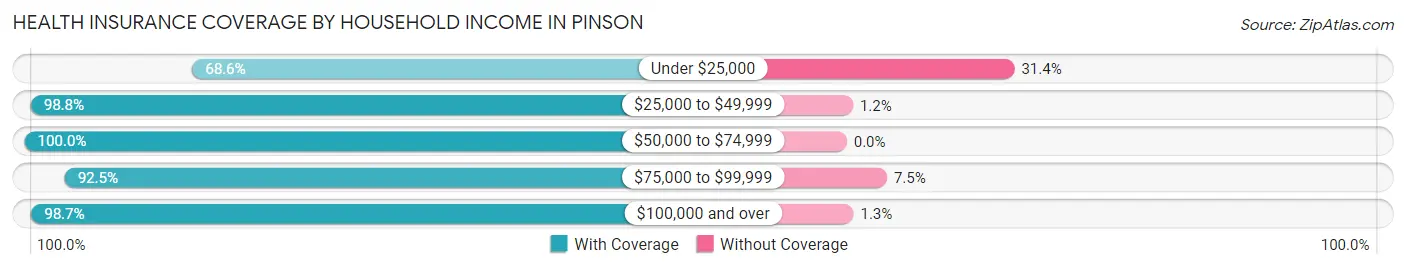
| Household Income | With Coverage | Without Coverage |
| Under $25,000 | 454 (68.6%) | 208 (31.4%) |
| $25,000 to $49,999 | 1,026 (98.8%) | 12 (1.2%) |
| $50,000 to $74,999 | 1,118 (100.0%) | 0 (0.0%) |
| $75,000 to $99,999 | 1,277 (92.5%) | 104 (7.5%) |
| $100,000 and over | 2,972 (98.7%) | 38 (1.3%) |
Public vs Private Health Insurance Coverage by Age in Pinson
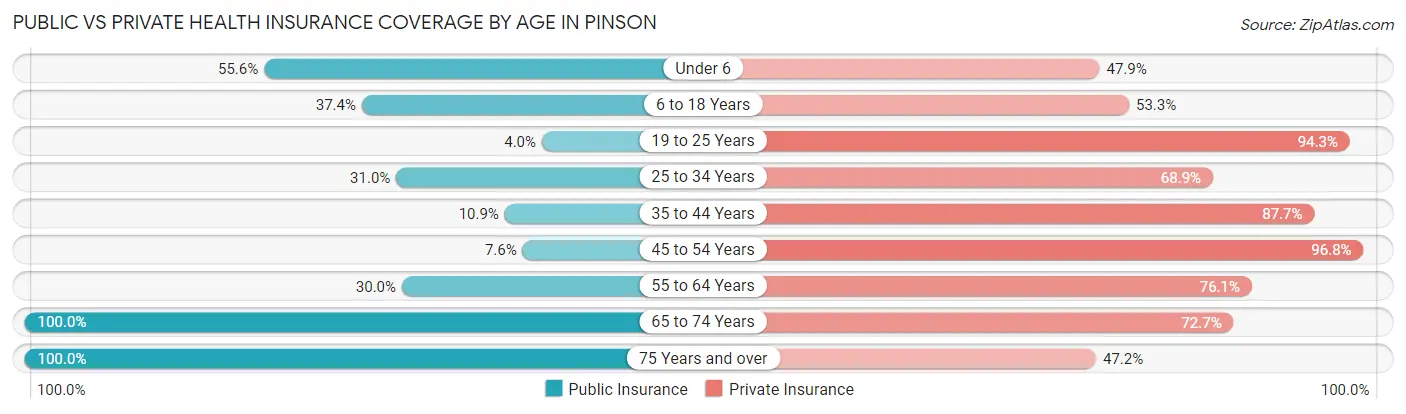
| Age Bracket | Public Insurance | Private Insurance |
| Under 6 | 375 (55.6%) | 323 (47.8%) |
| 6 to 18 Years | 456 (37.4%) | 650 (53.3%) |
| 19 to 25 Years | 28 (4.0%) | 662 (94.3%) |
| 25 to 34 Years | 332 (31.0%) | 737 (68.9%) |
| 35 to 44 Years | 92 (10.9%) | 741 (87.7%) |
| 45 to 54 Years | 69 (7.6%) | 881 (96.8%) |
| 55 to 64 Years | 247 (30.0%) | 627 (76.1%) |
| 65 to 74 Years | 608 (100.0%) | 442 (72.7%) |
| 75 Years and over | 356 (100.0%) | 168 (47.2%) |
| Total | 2,563 (35.5%) | 5,231 (72.6%) |
Disability Status by Sex by Age in Pinson
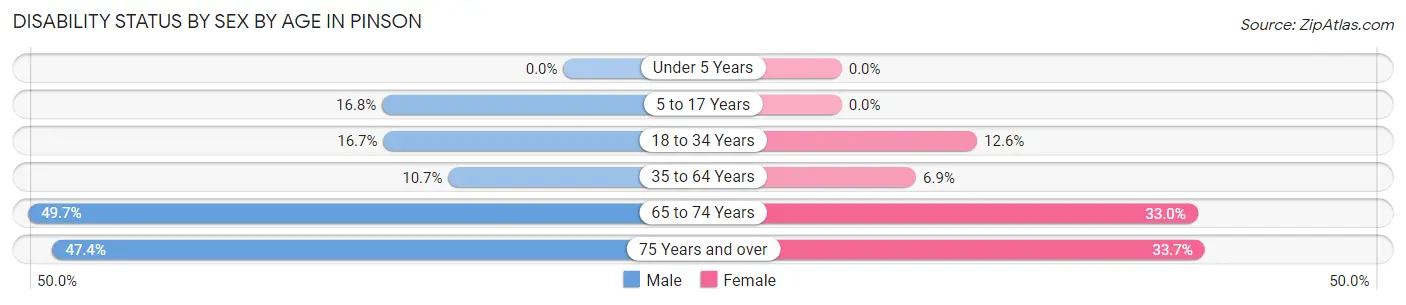
| Age Bracket | Male | Female |
| Under 5 Years | 0 (0.0%) | 0 (0.0%) |
| 5 to 17 Years | 89 (16.8%) | 0 (0.0%) |
| 18 to 34 Years | 176 (16.7%) | 108 (12.6%) |
| 35 to 64 Years | 116 (10.7%) | 103 (6.9%) |
| 65 to 74 Years | 144 (49.7%) | 105 (33.0%) |
| 75 Years and over | 73 (47.4%) | 68 (33.7%) |
Disability Class by Sex by Age in Pinson
Disability Class: Hearing Difficulty
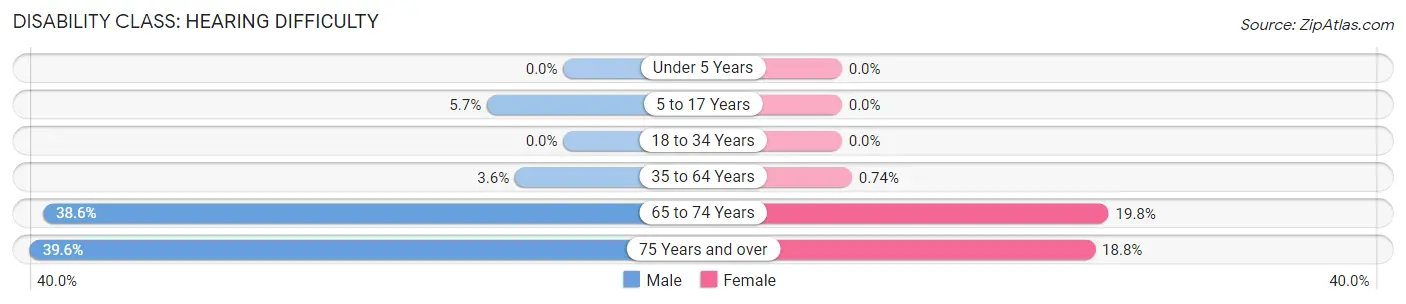
| Age Bracket | Male | Female |
| Under 5 Years | 0 (0.0%) | 0 (0.0%) |
| 5 to 17 Years | 30 (5.7%) | 0 (0.0%) |
| 18 to 34 Years | 0 (0.0%) | 0 (0.0%) |
| 35 to 64 Years | 39 (3.6%) | 11 (0.7%) |
| 65 to 74 Years | 112 (38.6%) | 63 (19.8%) |
| 75 Years and over | 61 (39.6%) | 38 (18.8%) |
Disability Class: Vision Difficulty
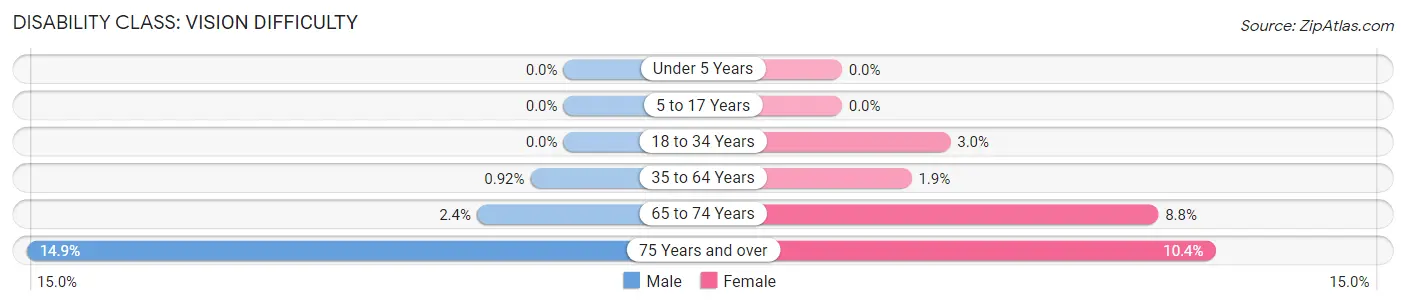
| Age Bracket | Male | Female |
| Under 5 Years | 0 (0.0%) | 0 (0.0%) |
| 5 to 17 Years | 0 (0.0%) | 0 (0.0%) |
| 18 to 34 Years | 0 (0.0%) | 26 (3.0%) |
| 35 to 64 Years | 10 (0.9%) | 29 (1.9%) |
| 65 to 74 Years | 7 (2.4%) | 28 (8.8%) |
| 75 Years and over | 23 (14.9%) | 21 (10.4%) |
Disability Class: Cognitive Difficulty
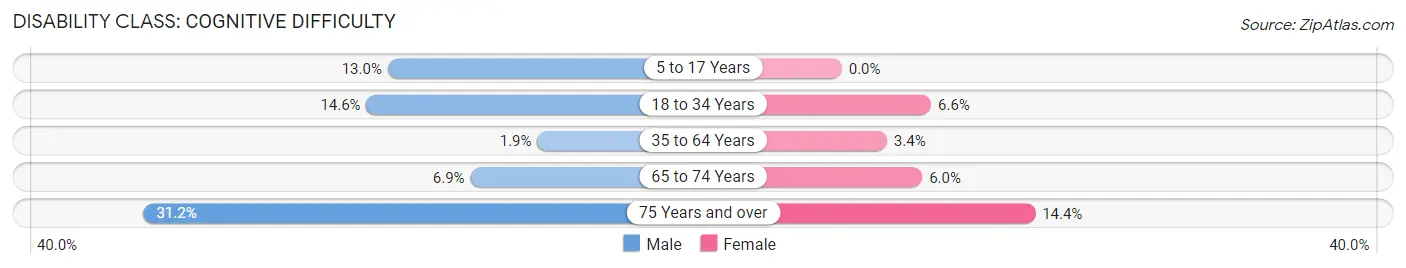
| Age Bracket | Male | Female |
| 5 to 17 Years | 69 (13.0%) | 0 (0.0%) |
| 18 to 34 Years | 154 (14.6%) | 57 (6.6%) |
| 35 to 64 Years | 21 (1.9%) | 50 (3.4%) |
| 65 to 74 Years | 20 (6.9%) | 19 (6.0%) |
| 75 Years and over | 48 (31.2%) | 29 (14.4%) |
Disability Class: Ambulatory Difficulty
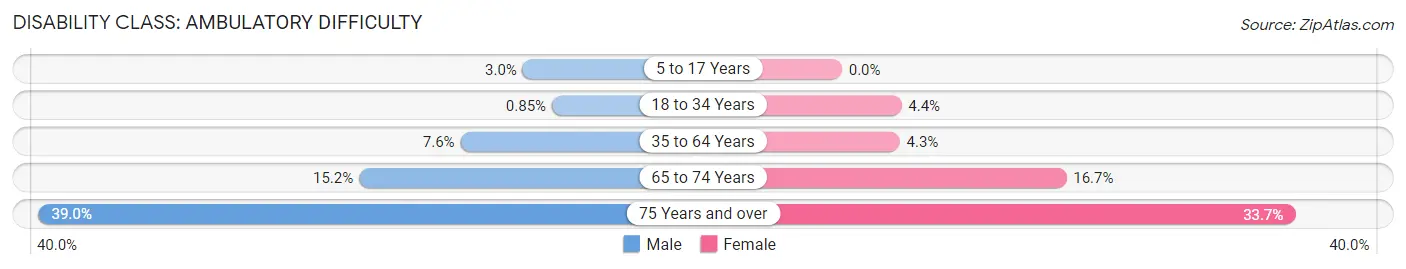
| Age Bracket | Male | Female |
| 5 to 17 Years | 16 (3.0%) | 0 (0.0%) |
| 18 to 34 Years | 9 (0.9%) | 38 (4.4%) |
| 35 to 64 Years | 83 (7.6%) | 64 (4.3%) |
| 65 to 74 Years | 44 (15.2%) | 53 (16.7%) |
| 75 Years and over | 60 (39.0%) | 68 (33.7%) |
Disability Class: Self-Care Difficulty
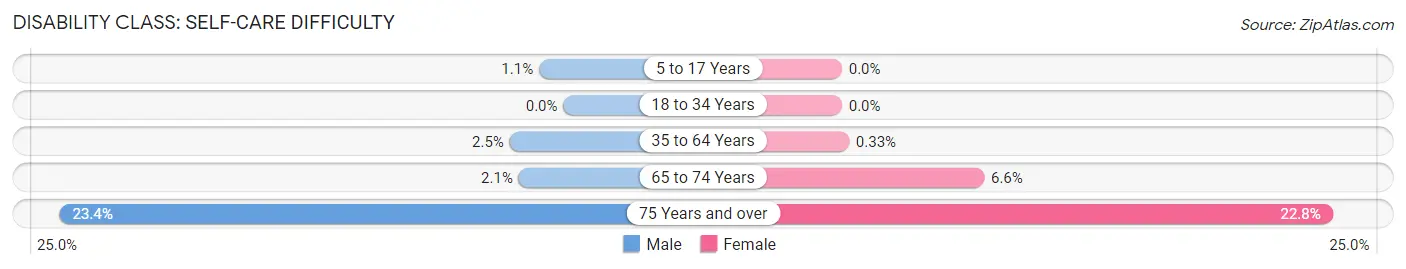
| Age Bracket | Male | Female |
| 5 to 17 Years | 6 (1.1%) | 0 (0.0%) |
| 18 to 34 Years | 0 (0.0%) | 0 (0.0%) |
| 35 to 64 Years | 27 (2.5%) | 5 (0.3%) |
| 65 to 74 Years | 6 (2.1%) | 21 (6.6%) |
| 75 Years and over | 36 (23.4%) | 46 (22.8%) |
Technology Access in Pinson
Computing Device Access in Pinson
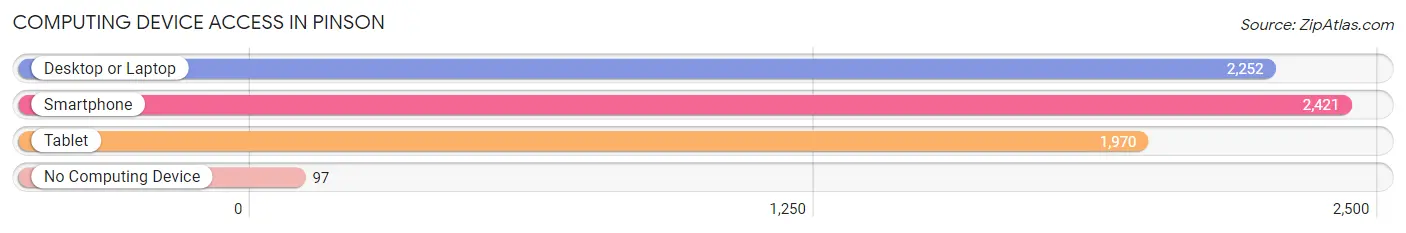
| Device Type | # Households | % Households |
| Desktop or Laptop | 2,252 | 84.0% |
| Smartphone | 2,421 | 90.3% |
| Tablet | 1,970 | 73.5% |
| No Computing Device | 97 | 3.6% |
| Total | 2,680 | 100.0% |
Internet Access in Pinson
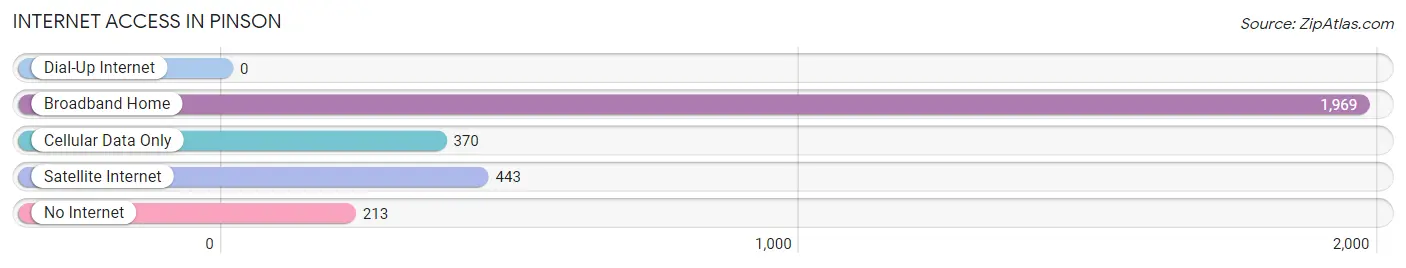
| Internet Type | # Households | % Households |
| Dial-Up Internet | 0 | 0.0% |
| Broadband Home | 1,969 | 73.5% |
| Cellular Data Only | 370 | 13.8% |
| Satellite Internet | 443 | 16.5% |
| No Internet | 213 | 8.0% |
| Total | 2,680 | 100.0% |
Pinson Summary
Pinson is a city located in Jefferson County, Alabama, United States. It is a suburb of Birmingham and is part of the Birmingham-Hoover Metropolitan Statistical Area. The population was 7,163 at the 2010 census.
History
The area that is now Pinson was first settled in the early 1800s by the Pinson family, who were among the first settlers in the area. The town was officially incorporated in 1891.
In the early 1900s, Pinson was a small farming community. The town was home to several cotton gins, a grist mill, and a sawmill. The town also had a post office, a general store, and a few churches.
In the 1950s, Pinson began to experience rapid growth as Birmingham's suburbs began to expand. The town was annexed by the city of Birmingham in the 1960s, but it was later reincorporated as an independent city in 1971.
Geography
Pinson is located at 33°41'25" North, 86°37'17" West (33.690278, -86.621389). According to the U.S. Census Bureau, the city has a total area of 8.2 square miles, all land.
Economy
Pinson is home to several businesses, including a number of retail stores, restaurants, and other services. The city is also home to several industrial and manufacturing companies, including a steel mill and a paper mill.
Demographics
As of the 2010 census, there were 7,163 people, 2,717 households, and 1,945 families residing in the city. The population density was 876.2 people per square mile. There were 2,945 housing units at an average density of 359.2 per square mile. The racial makeup of the city was 79.2% White, 15.7% African American, 0.3% Native American, 0.7% Asian, 0.1% Pacific Islander, 2.2% from other races, and 2.0% from two or more races. Hispanic or Latino of any race were 4.2% of the population.
There were 2,717 households, out of which 33.2% had children under the age of 18 living with them, 51.2% were married couples living together, 14.2% had a female householder with no husband present, and 29.2% were non-families. 24.3% of all households were made up of individuals, and 8.2% had someone living alone who was 65 years of age or older. The average household size was 2.60 and the average family size was 3.09.
In the city, the population was spread out, with 25.7% under the age of 18, 8.7% from 18 to 24, 30.2% from 25 to 44, 23.3% from 45 to 64, and 12.1% who were 65 years of age or older. The median age was 36 years. For every 100 females, there were 93.2 males. For every 100 females age 18 and over, there were 89.3 males.
The median income for a household in the city was $41,944, and the median income for a family was $48,958. Males had a median income of $36,919 versus $27,917 for females. The per capita income for the city was $19,945. About 8.2% of families and 10.2% of the population were below the poverty line, including 14.2% of those under age 18 and 8.2% of those age 65 or over.
Common Questions
What is the Total Population of Pinson?
Total Population of Pinson is 7,209.
What is the Total Male Population of Pinson?
Total Male Population of Pinson is 3,335.
What is the Total Female Population of Pinson?
Total Female Population of Pinson is 3,874.
What is the Ratio of Males per 100 Females in Pinson?
There are 86.09 Males per 100 Females in Pinson.
What is the Ratio of Females per 100 Males in Pinson?
There are 116.16 Females per 100 Males in Pinson.
What is the Median Population Age in Pinson?
Median Population Age in Pinson is 34.5 Years.
What is the Average Family Size in Pinson
Average Family Size in Pinson is 3.1 People.
What is the Average Household Size in Pinson
Average Household Size in Pinson is 2.7 People.
What is Per Capita Income in Pinson?
Per Capita income in Pinson is $34,658.
What is the Median Family Income in Pinson?
Median Family Income in Pinson is $97,459.
What is the Median Household income in Pinson?
Median Household Income in Pinson is $83,673.
What is Income or Wage Gap in Pinson?
Income or Wage Gap in Pinson is 14.9%.
Women in Pinson earn 85.1 cents for every dollar earned by a man.
What is Family Income Deficit in Pinson?
Family Income Deficit in Pinson is $11,577.
Families that are below poverty line in Pinson earn $11,577 less on average than the poverty threshold level.
What is Inequality or Gini Index in Pinson?
Inequality or Gini Index in Pinson is 0.35.
How Large is the Labor Force in Pinson?
There are 3,812 People in the Labor Forcein in Pinson.
What is the Percentage of People in the Labor Force in Pinson?
65.4% of People are in the Labor Force in Pinson.
What is the Unemployment Rate in Pinson?
Unemployment Rate in Pinson is 4.3%.