Westover, AL
Westover Map
Westover Overview
2,404
TOTAL POPULATION
1,151
MALE POPULATION
1,253
FEMALE POPULATION
91.86
MALES / 100 FEMALES
108.86
FEMALES / 100 MALES
34.2
MEDIAN AGE
3.5
AVG FAMILY SIZE
3.2
AVG HOUSEHOLD SIZE
$37,661
PER CAPITA INCOME
$95,577
AVG FAMILY INCOME
$87,772
AVG HOUSEHOLD INCOME
28.8%
WAGE / INCOME GAP [ % ]
71.2¢/ $1
WAGE / INCOME GAP [ $ ]
0.41
INEQUALITY / GINI INDEX
1,174
LABOR FORCE [ PEOPLE ]
69.9%
PERCENT IN LABOR FORCE
2.5%
UNEMPLOYMENT RATE
Westover Area Codes
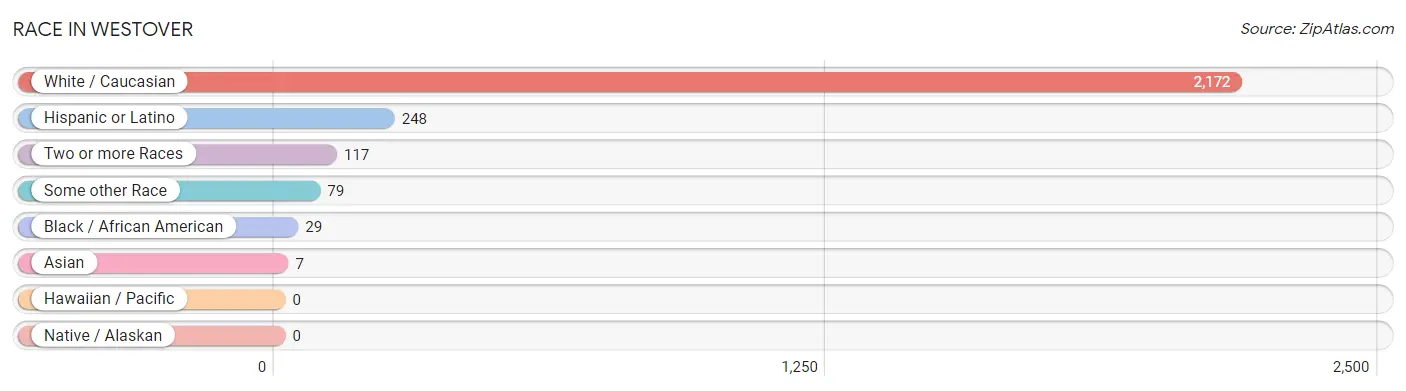
Race in Westover
The most populous races in Westover are White / Caucasian (2,172 | 90.3%), Hispanic or Latino (248 | 10.3%), and Two or more Races (117 | 4.9%).
| Race | # Population | % Population |
| Asian | 7 | 0.3% |
| Black / African American | 29 | 1.2% |
| Hawaiian / Pacific | 0 | 0.0% |
| Hispanic or Latino | 248 | 10.3% |
| Native / Alaskan | 0 | 0.0% |
| White / Caucasian | 2,172 | 90.3% |
| Two or more Races | 117 | 4.9% |
| Some other Race | 79 | 3.3% |
| Total | 2,404 | 100.0% |
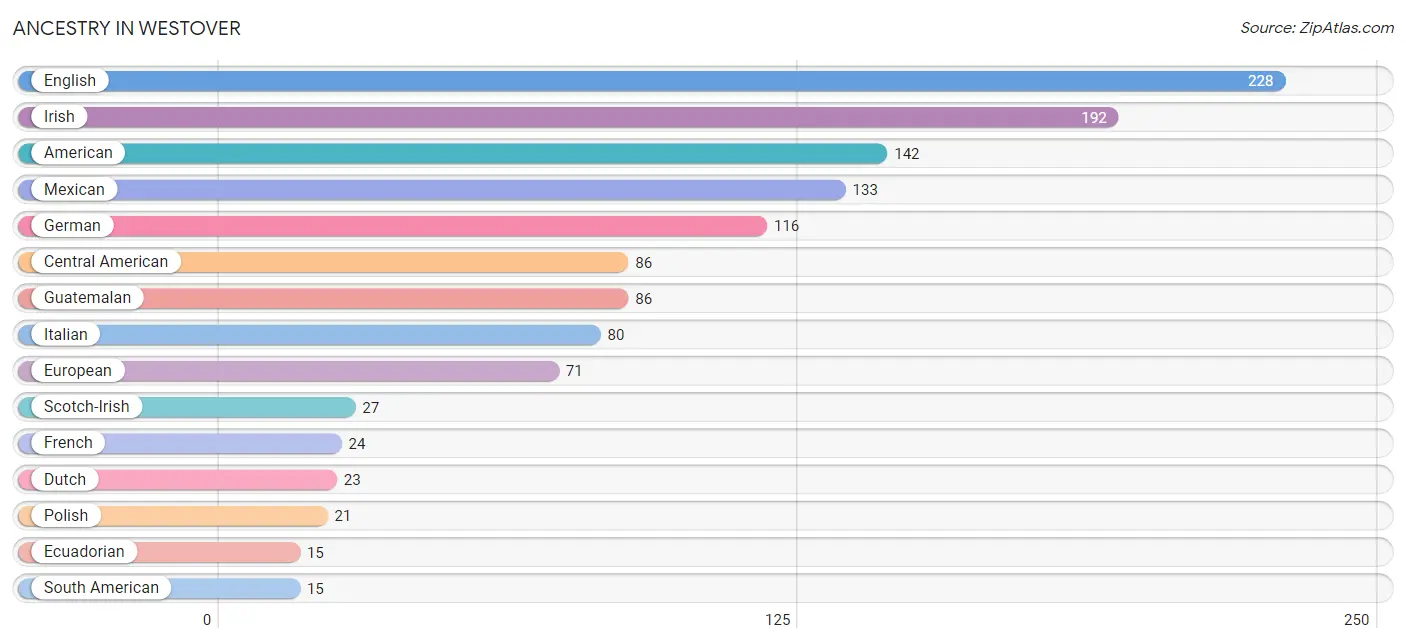
Ancestry in Westover
The most populous ancestries reported in Westover are English (228 | 9.5%), Irish (192 | 8.0%), American (142 | 5.9%), Mexican (133 | 5.5%), and German (116 | 4.8%), together accounting for 33.7% of all Westover residents.
| Ancestry | # Population | % Population |
| American | 142 | 5.9% |
| Arab | 10 | 0.4% |
| Armenian | 7 | 0.3% |
| Austrian | 4 | 0.2% |
| British | 10 | 0.4% |
| Burmese | 4 | 0.2% |
| Central American | 86 | 3.6% |
| Cherokee | 4 | 0.2% |
| Czechoslovakian | 9 | 0.4% |
| Danish | 10 | 0.4% |
| Dutch | 23 | 1.0% |
| Eastern European | 2 | 0.1% |
| Ecuadorian | 15 | 0.6% |
| English | 228 | 9.5% |
| European | 71 | 2.9% |
| Finnish | 3 | 0.1% |
| French | 24 | 1.0% |
| French Canadian | 3 | 0.1% |
| German | 116 | 4.8% |
| Greek | 3 | 0.1% |
| Guatemalan | 86 | 3.6% |
| Hungarian | 4 | 0.2% |
| Irish | 192 | 8.0% |
| Italian | 80 | 3.3% |
| Korean | 3 | 0.1% |
| Lebanese | 10 | 0.4% |
| Mexican | 133 | 5.5% |
| Norwegian | 5 | 0.2% |
| Polish | 21 | 0.9% |
| Portuguese | 4 | 0.2% |
| Scandinavian | 7 | 0.3% |
| Scotch-Irish | 27 | 1.1% |
| Scottish | 9 | 0.4% |
| South American | 15 | 0.6% |
| Swedish | 7 | 0.3% |
| Swiss | 4 | 0.2% |
| Welsh | 3 | 0.1% | View All 37 Rows |
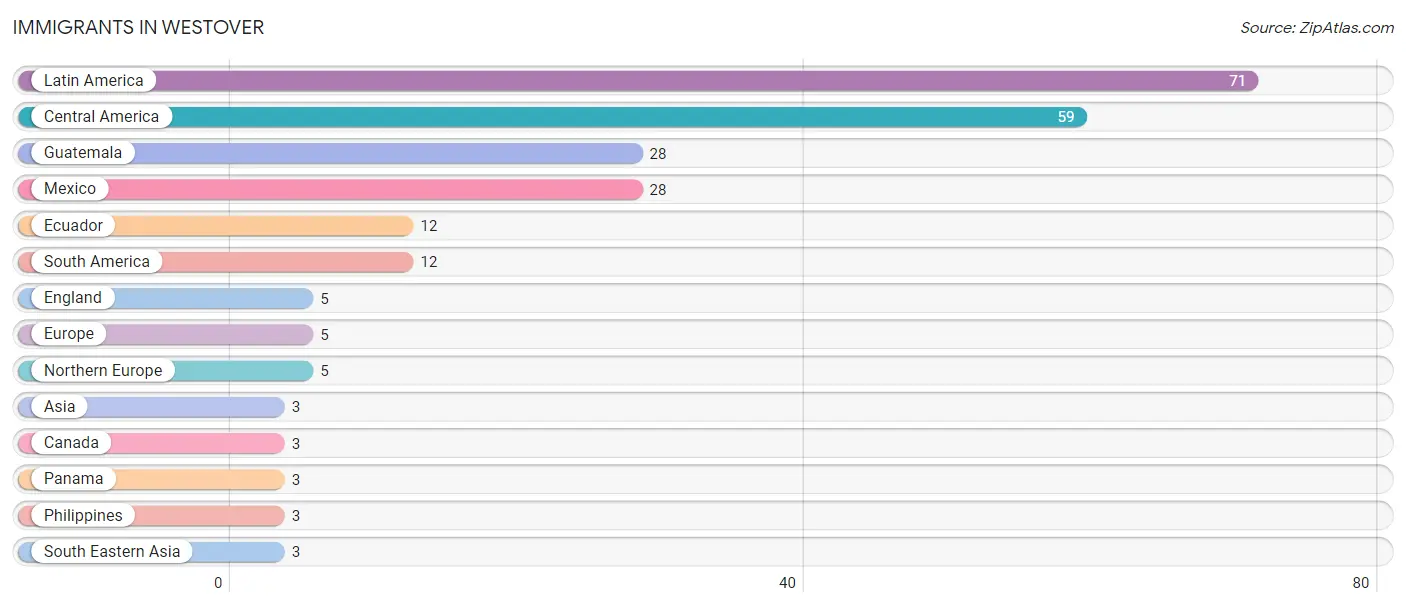
Immigrants in Westover
The most numerous immigrant groups reported in Westover came from Latin America (71 | 2.9%), Central America (59 | 2.5%), Guatemala (28 | 1.2%), Mexico (28 | 1.2%), and Ecuador (12 | 0.5%), together accounting for 8.2% of all Westover residents.
| Immigration Origin | # Population | % Population |
| Asia | 3 | 0.1% |
| Canada | 3 | 0.1% |
| Central America | 59 | 2.5% |
| Ecuador | 12 | 0.5% |
| England | 5 | 0.2% |
| Europe | 5 | 0.2% |
| Guatemala | 28 | 1.2% |
| Latin America | 71 | 2.9% |
| Mexico | 28 | 1.2% |
| Northern Europe | 5 | 0.2% |
| Panama | 3 | 0.1% |
| Philippines | 3 | 0.1% |
| South America | 12 | 0.5% |
| South Eastern Asia | 3 | 0.1% | View All 14 Rows |
Sex and Age in Westover
Sex and Age in Westover
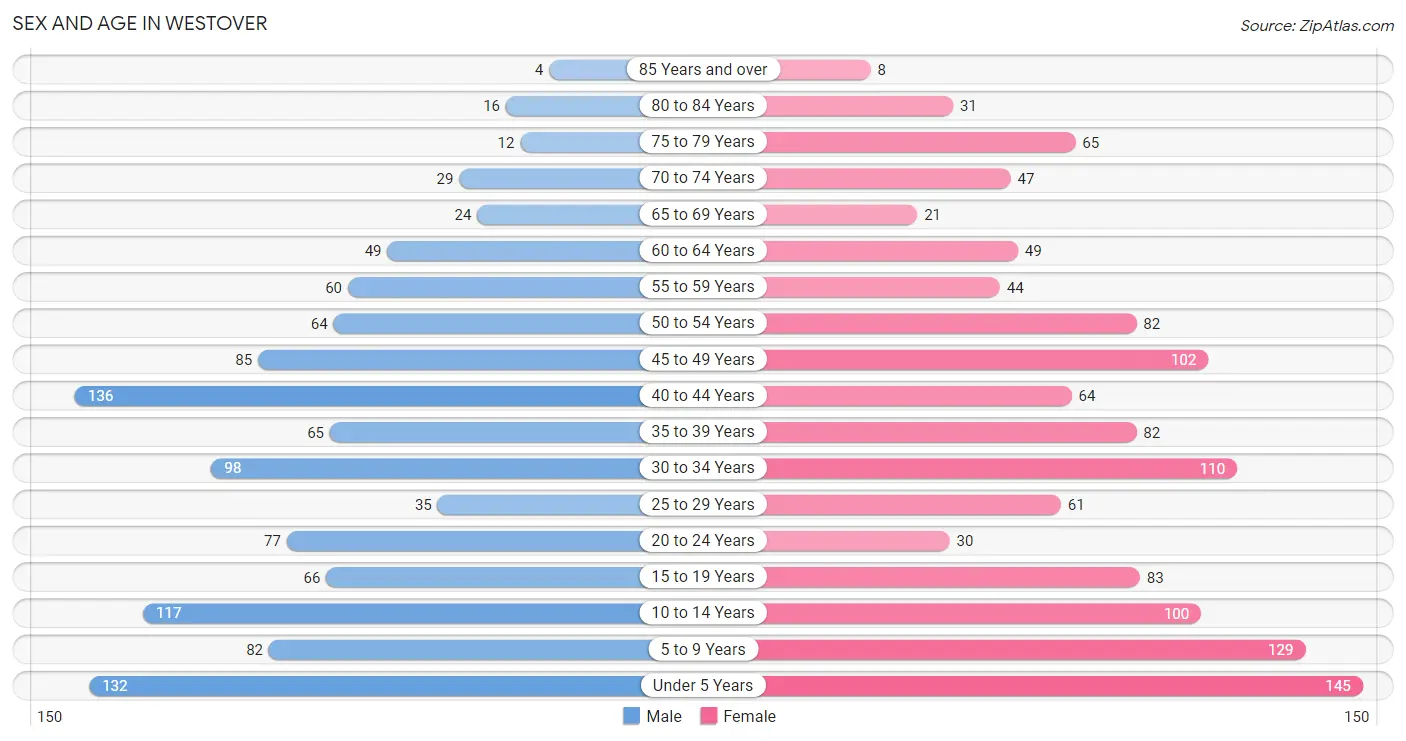
The most populous age groups in Westover are 40 to 44 Years (136 | 11.8%) for men and Under 5 Years (145 | 11.6%) for women.
| Age Bracket | Male | Female |
| Under 5 Years | 132 (11.5%) | 145 (11.6%) |
| 5 to 9 Years | 82 (7.1%) | 129 (10.3%) |
| 10 to 14 Years | 117 (10.2%) | 100 (8.0%) |
| 15 to 19 Years | 66 (5.7%) | 83 (6.6%) |
| 20 to 24 Years | 77 (6.7%) | 30 (2.4%) |
| 25 to 29 Years | 35 (3.0%) | 61 (4.9%) |
| 30 to 34 Years | 98 (8.5%) | 110 (8.8%) |
| 35 to 39 Years | 65 (5.7%) | 82 (6.5%) |
| 40 to 44 Years | 136 (11.8%) | 64 (5.1%) |
| 45 to 49 Years | 85 (7.4%) | 102 (8.1%) |
| 50 to 54 Years | 64 (5.6%) | 82 (6.5%) |
| 55 to 59 Years | 60 (5.2%) | 44 (3.5%) |
| 60 to 64 Years | 49 (4.3%) | 49 (3.9%) |
| 65 to 69 Years | 24 (2.1%) | 21 (1.7%) |
| 70 to 74 Years | 29 (2.5%) | 47 (3.7%) |
| 75 to 79 Years | 12 (1.0%) | 65 (5.2%) |
| 80 to 84 Years | 16 (1.4%) | 31 (2.5%) |
| 85 Years and over | 4 (0.4%) | 8 (0.6%) |
| Total | 1,151 (100.0%) | 1,253 (100.0%) |
Families and Households in Westover
Median Family Size in Westover
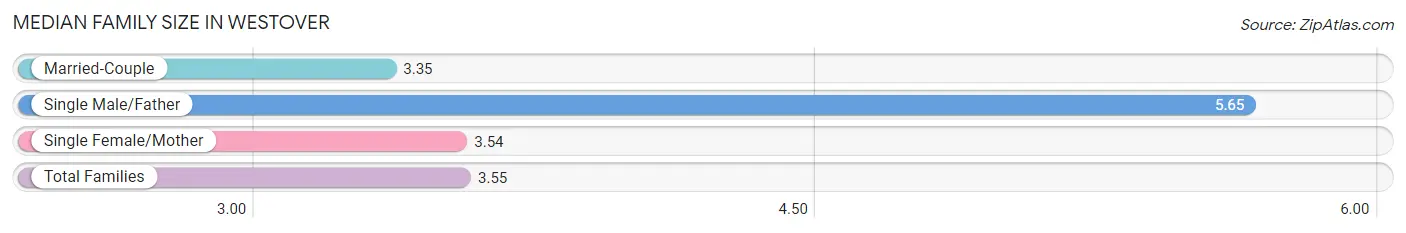
The median family size in Westover is 3.55 persons per family, with single male/father families (46 | 7.6%) accounting for the largest median family size of 5.65 persons per family. On the other hand, married-couple families (489 | 81.0%) represent the smallest median family size with 3.35 persons per family.
| Family Type | # Families | Family Size |
| Married-Couple | 489 (81.0%) | 3.35 |
| Single Male/Father | 46 (7.6%) | 5.65 |
| Single Female/Mother | 69 (11.4%) | 3.54 |
| Total Families | 604 (100.0%) | 3.55 |
Median Household Size in Westover
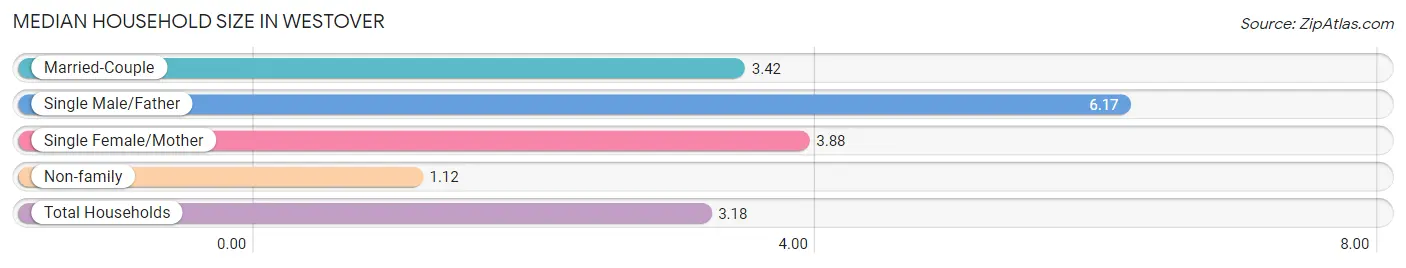
The median household size in Westover is 3.18 persons per household, with single male/father households (46 | 6.1%) accounting for the largest median household size of 6.17 persons per household. non-family households (147 | 19.6%) represent the smallest median household size with 1.12 persons per household.
| Household Type | # Households | Household Size |
| Married-Couple | 489 (65.1%) | 3.42 |
| Single Male/Father | 46 (6.1%) | 6.17 |
| Single Female/Mother | 69 (9.2%) | 3.88 |
| Non-family | 147 (19.6%) | 1.12 |
| Total Households | 751 (100.0%) | 3.18 |
Household Size by Marriage Status in Westover
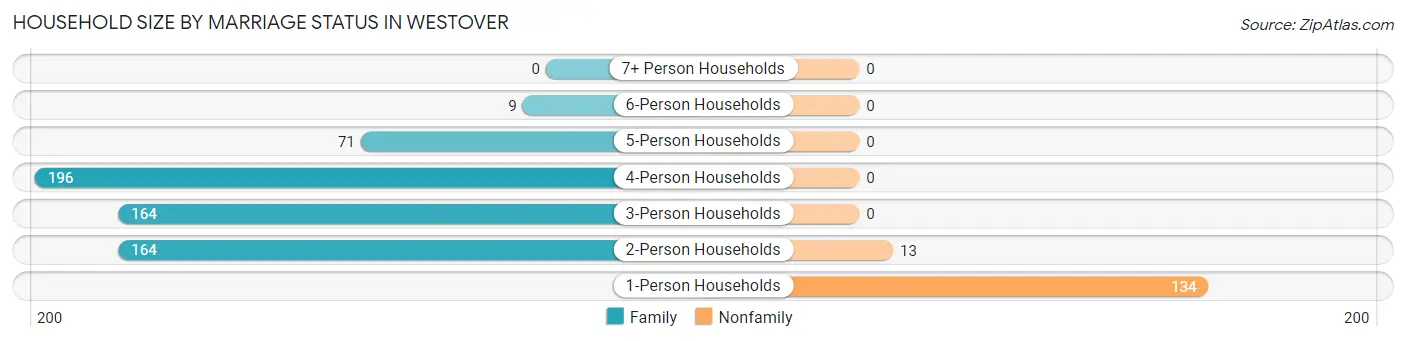
Out of a total of 751 households in Westover, 604 (80.4%) are family households, while 147 (19.6%) are nonfamily households. The most numerous type of family households are 4-person households, comprising 196, and the most common type of nonfamily households are 1-person households, comprising 134.
| Household Size | Family Households | Nonfamily Households |
| 1-Person Households | - | 134 (17.8%) |
| 2-Person Households | 164 (21.8%) | 13 (1.7%) |
| 3-Person Households | 164 (21.8%) | 0 (0.0%) |
| 4-Person Households | 196 (26.1%) | 0 (0.0%) |
| 5-Person Households | 71 (9.5%) | 0 (0.0%) |
| 6-Person Households | 9 (1.2%) | 0 (0.0%) |
| 7+ Person Households | 0 (0.0%) | 0 (0.0%) |
| Total | 604 (80.4%) | 147 (19.6%) |
Female Fertility in Westover
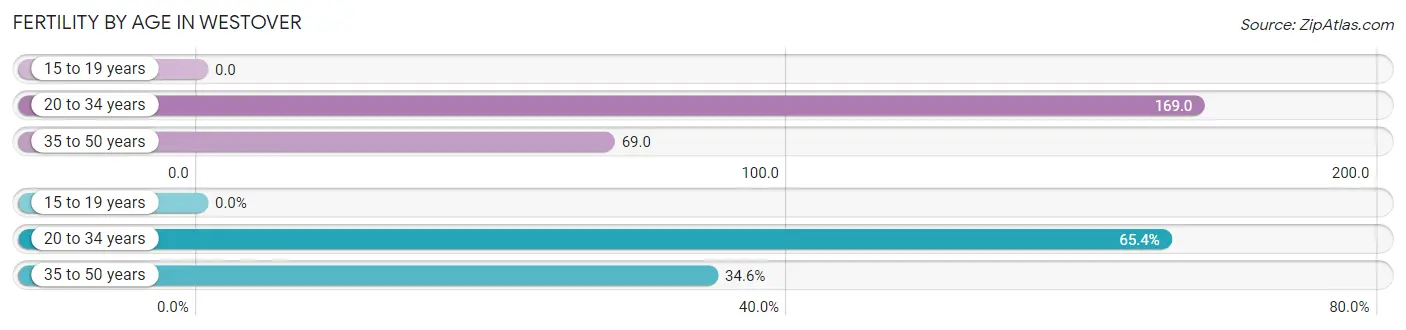
Fertility by Age in Westover
Average fertility rate in Westover is 95.0 births per 1,000 women. Women in the age bracket of 20 to 34 years have the highest fertility rate with 169.0 births per 1,000 women. Women in the age bracket of 20 to 34 years acount for 65.4% of all women with births.
| Age Bracket | Women with Births | Births / 1,000 Women |
| 15 to 19 years | 0 (0.0%) | 0.0 |
| 20 to 34 years | 34 (65.4%) | 169.0 |
| 35 to 50 years | 18 (34.6%) | 69.0 |
| Total | 52 (100.0%) | 95.0 |
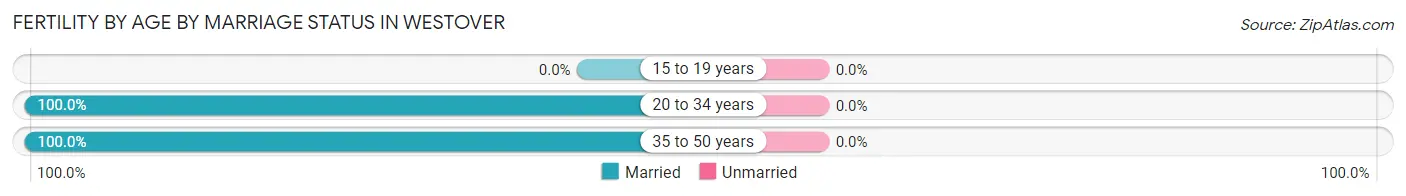
Fertility by Age by Marriage Status in Westover
| Age Bracket | Married | Unmarried |
| 15 to 19 years | 0 (0.0%) | 0 (0.0%) |
| 20 to 34 years | 34 (100.0%) | 0 (0.0%) |
| 35 to 50 years | 18 (100.0%) | 0 (0.0%) |
| Total | 52 (100.0%) | 0 (0.0%) |
Fertility by Education in Westover
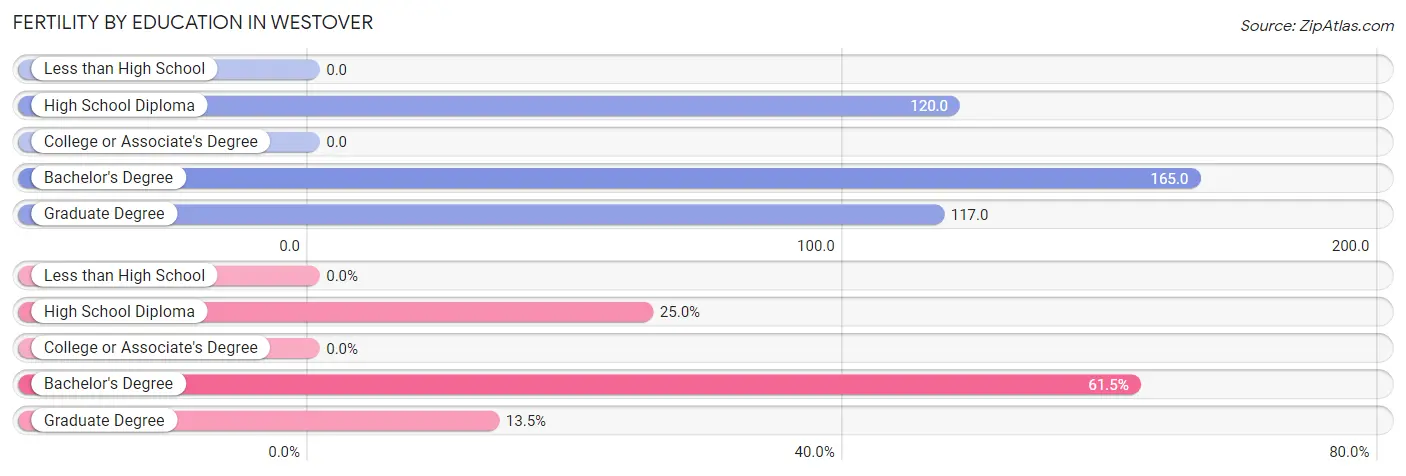
| Educational Attainment | Women with Births | Births / 1,000 Women |
| Less than High School | 0 (0.0%) | 0.0 |
| High School Diploma | 13 (25.0%) | 120.0 |
| College or Associate's Degree | 0 (0.0%) | 0.0 |
| Bachelor's Degree | 32 (61.5%) | 165.0 |
| Graduate Degree | 7 (13.5%) | 117.0 |
| Total | 52 (100.0%) | 95.0 |
Fertility by Education by Marriage Status in Westover
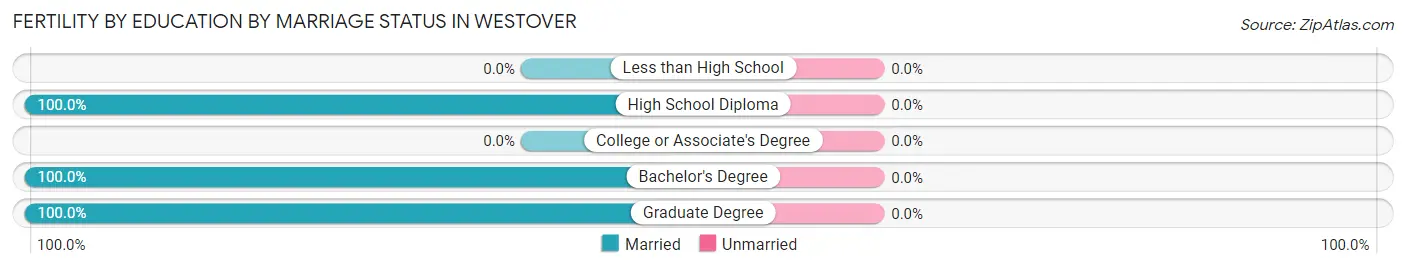
| Educational Attainment | Married | Unmarried |
| Less than High School | 0 (0.0%) | 0 (0.0%) |
| High School Diploma | 13 (100.0%) | 0 (0.0%) |
| College or Associate's Degree | 0 (0.0%) | 0 (0.0%) |
| Bachelor's Degree | 32 (100.0%) | 0 (0.0%) |
| Graduate Degree | 7 (100.0%) | 0 (0.0%) |
| Total | 52 (100.0%) | 0 (0.0%) |
Income in Westover
Income Overview in Westover
Per Capita Income in Westover is $37,661, while median incomes of families and households are $95,577 and $87,772 respectively.
| Characteristic | Number | Measure |
| Per Capita Income | 2,404 | $37,661 |
| Median Family Income | 604 | $95,577 |
| Mean Family Income | 604 | $130,330 |
| Median Household Income | 751 | $87,772 |
| Mean Household Income | 751 | $115,814 |
| Income Deficit | 604 | $0 |
| Wage / Income Gap (%) | 2,404 | 28.77% |
| Wage / Income Gap ($) | 2,404 | 71.23¢ per $1 |
| Gini / Inequality Index | 2,404 | 0.41 |
Earnings by Sex in Westover
Average Earnings in Westover are $51,602, $56,570 for men and $40,292 for women, a difference of 28.8%.
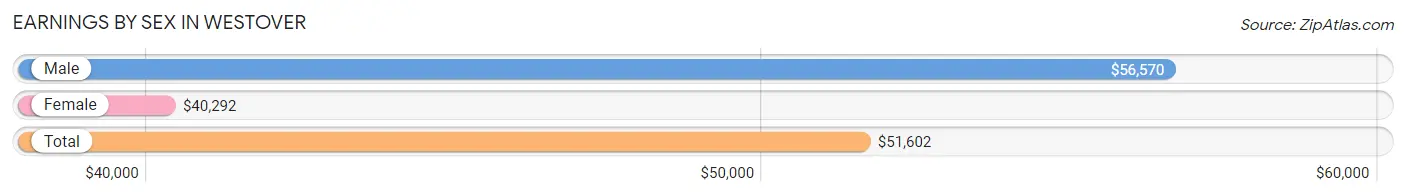
| Sex | Number | Average Earnings |
| Male | 698 (56.6%) | $56,570 |
| Female | 535 (43.4%) | $40,292 |
| Total | 1,233 (100.0%) | $51,602 |
Earnings by Sex by Income Bracket in Westover
The most common earnings brackets in Westover are $100,000+ for men (122 | 17.5%) and $75,000 to $99,999 for women (68 | 12.7%).
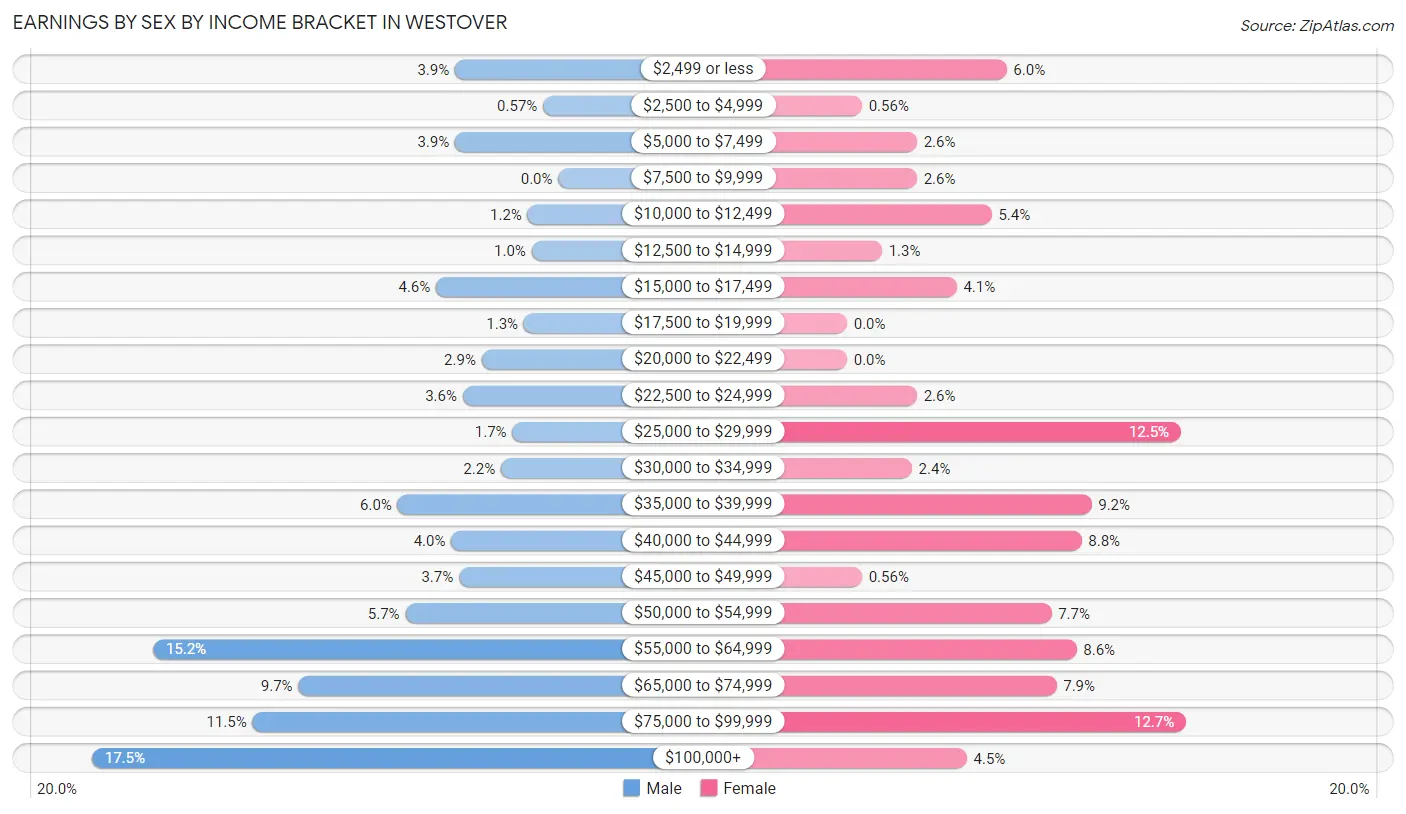
| Income | Male | Female |
| $2,499 or less | 27 (3.9%) | 32 (6.0%) |
| $2,500 to $4,999 | 4 (0.6%) | 3 (0.6%) |
| $5,000 to $7,499 | 27 (3.9%) | 14 (2.6%) |
| $7,500 to $9,999 | 0 (0.0%) | 14 (2.6%) |
| $10,000 to $12,499 | 8 (1.1%) | 29 (5.4%) |
| $12,500 to $14,999 | 7 (1.0%) | 7 (1.3%) |
| $15,000 to $17,499 | 32 (4.6%) | 22 (4.1%) |
| $17,500 to $19,999 | 9 (1.3%) | 0 (0.0%) |
| $20,000 to $22,499 | 20 (2.9%) | 0 (0.0%) |
| $22,500 to $24,999 | 25 (3.6%) | 14 (2.6%) |
| $25,000 to $29,999 | 12 (1.7%) | 67 (12.5%) |
| $30,000 to $34,999 | 15 (2.1%) | 13 (2.4%) |
| $35,000 to $39,999 | 42 (6.0%) | 49 (9.2%) |
| $40,000 to $44,999 | 28 (4.0%) | 47 (8.8%) |
| $45,000 to $49,999 | 26 (3.7%) | 3 (0.6%) |
| $50,000 to $54,999 | 40 (5.7%) | 41 (7.7%) |
| $55,000 to $64,999 | 106 (15.2%) | 46 (8.6%) |
| $65,000 to $74,999 | 68 (9.7%) | 42 (7.9%) |
| $75,000 to $99,999 | 80 (11.5%) | 68 (12.7%) |
| $100,000+ | 122 (17.5%) | 24 (4.5%) |
| Total | 698 (100.0%) | 535 (100.0%) |
Earnings by Sex by Educational Attainment in Westover
Average earnings in Westover are $60,469 for men and $42,333 for women, a difference of 30.0%. Men with an educational attainment of graduate degree enjoy the highest average annual earnings of $75,833, while those with less than high school education earn the least with $43,906. Women with an educational attainment of graduate degree earn the most with the average annual earnings of $64,643, while those with high school diploma education have the smallest earnings of $28,841.
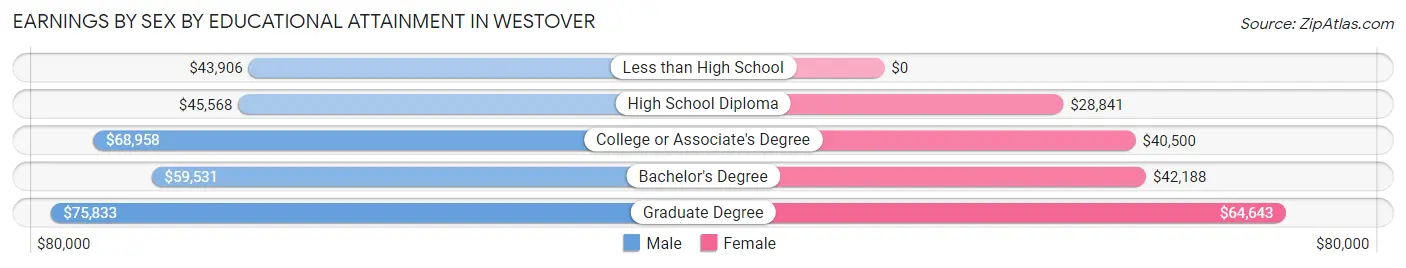
| Educational Attainment | Male Income | Female Income |
| Less than High School | $43,906 | $0 |
| High School Diploma | $45,568 | $28,841 |
| College or Associate's Degree | $68,958 | $40,500 |
| Bachelor's Degree | $59,531 | $42,188 |
| Graduate Degree | $75,833 | $64,643 |
| Total | $60,469 | $42,333 |
Family Income in Westover
Family Income Brackets in Westover
According to the Westover family income data, there are 195 families falling into the $75,000 to $99,999 income range, which is the most common income bracket and makes up 32.3% of all families.
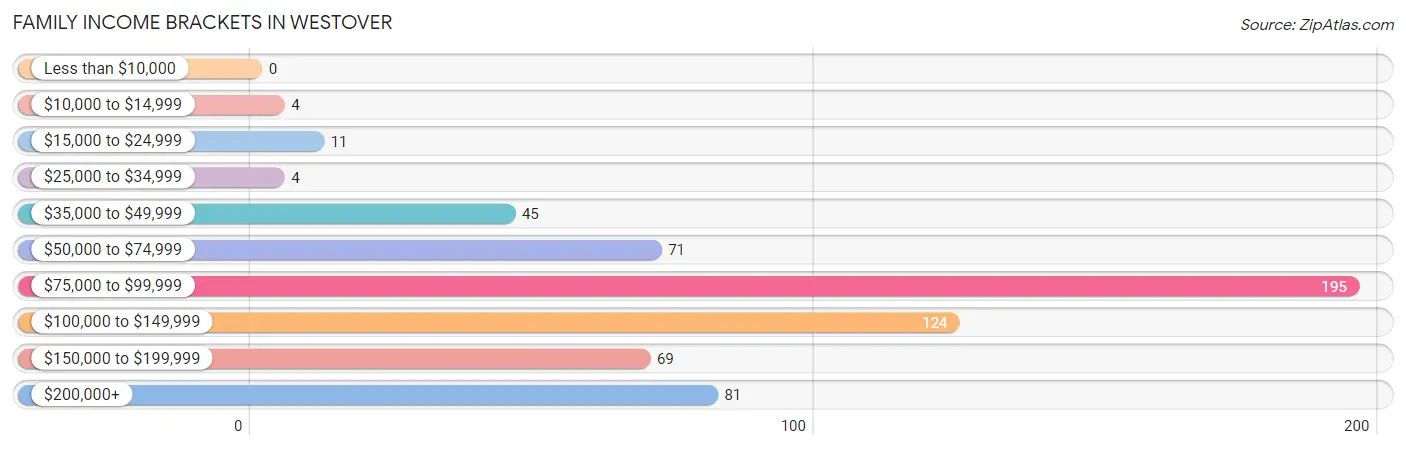
| Income Bracket | # Families | % Families |
| Less than $10,000 | 0 | 0.0% |
| $10,000 to $14,999 | 4 | 0.7% |
| $15,000 to $24,999 | 11 | 1.8% |
| $25,000 to $34,999 | 4 | 0.7% |
| $35,000 to $49,999 | 45 | 7.5% |
| $50,000 to $74,999 | 71 | 11.8% |
| $75,000 to $99,999 | 195 | 32.3% |
| $100,000 to $149,999 | 124 | 20.5% |
| $150,000 to $199,999 | 69 | 11.4% |
| $200,000+ | 81 | 13.4% |
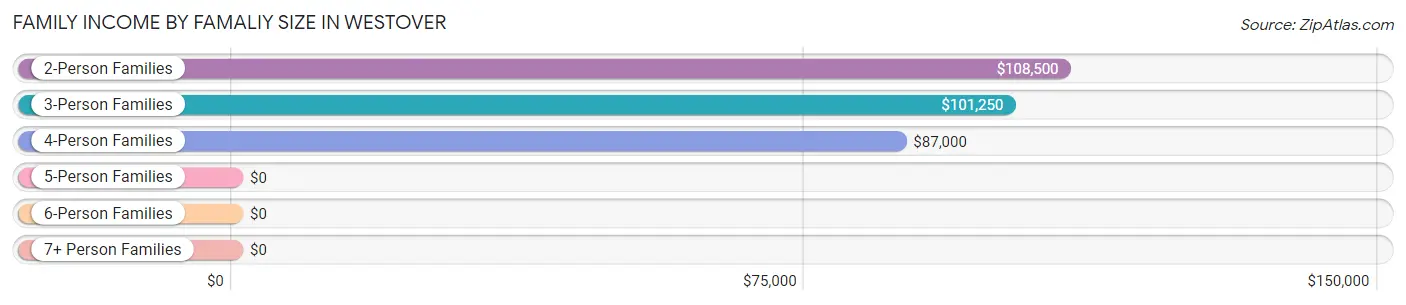
Family Income by Famaliy Size in Westover
2-person families (170 | 28.1%) account for the highest median family income in Westover with $108,500 per family, while 2-person families (170 | 28.1%) have the highest median income of $54,250 per family member.
| Income Bracket | # Families | Median Income |
| 2-Person Families | 170 (28.1%) | $108,500 |
| 3-Person Families | 182 (30.1%) | $101,250 |
| 4-Person Families | 204 (33.8%) | $87,000 |
| 5-Person Families | 39 (6.5%) | $0 |
| 6-Person Families | 9 (1.5%) | $0 |
| 7+ Person Families | 0 (0.0%) | $0 |
| Total | 604 (100.0%) | $95,577 |
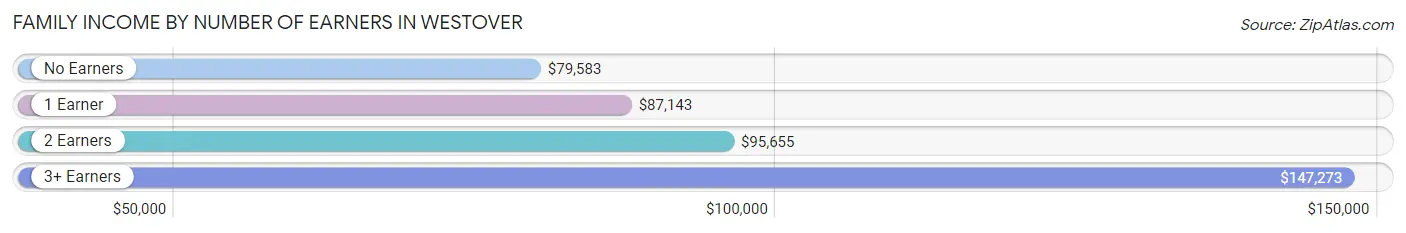
Family Income by Number of Earners in Westover
The median family income in Westover is $95,577, with families comprising 3+ earners (50) having the highest median family income of $147,273, while families with no earners (21) have the lowest median family income of $79,583, accounting for 8.3% and 3.5% of families, respectively.
| Number of Earners | # Families | Median Income |
| No Earners | 21 (3.5%) | $79,583 |
| 1 Earner | 166 (27.5%) | $87,143 |
| 2 Earners | 367 (60.8%) | $95,655 |
| 3+ Earners | 50 (8.3%) | $147,273 |
| Total | 604 (100.0%) | $95,577 |
Household Income in Westover
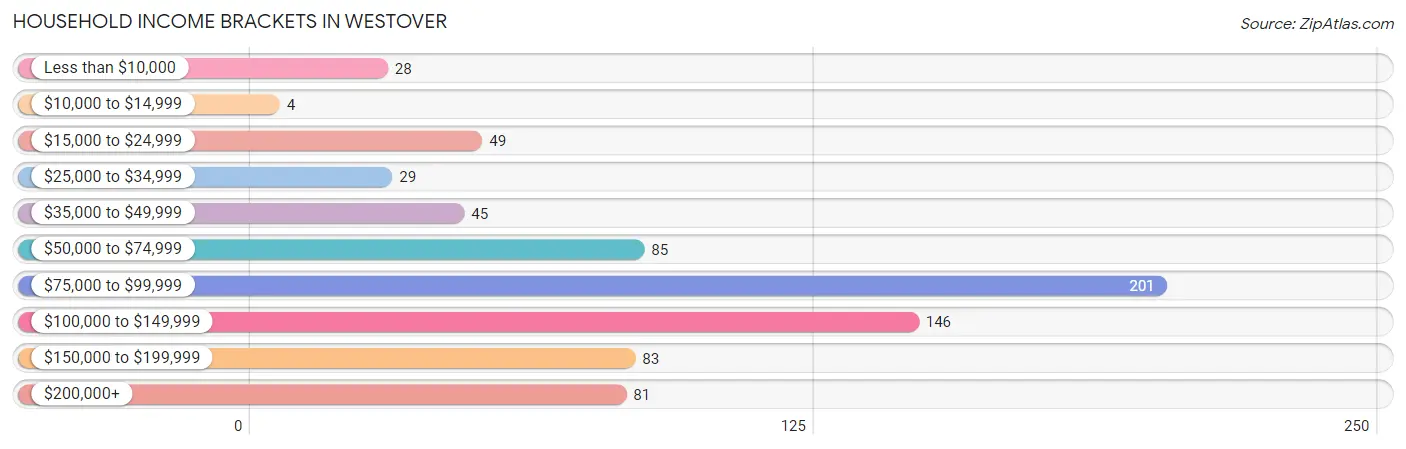
Household Income Brackets in Westover
With 201 households falling in the category, the $75,000 to $99,999 income range is the most frequent in Westover, accounting for 26.8% of all households. In contrast, only 4 households (0.5%) fall into the $10,000 to $14,999 income bracket, making it the least populous group.
| Income Bracket | # Households | % Households |
| Less than $10,000 | 28 | 3.7% |
| $10,000 to $14,999 | 4 | 0.5% |
| $15,000 to $24,999 | 49 | 6.5% |
| $25,000 to $34,999 | 29 | 3.9% |
| $35,000 to $49,999 | 45 | 6.0% |
| $50,000 to $74,999 | 85 | 11.3% |
| $75,000 to $99,999 | 201 | 26.8% |
| $100,000 to $149,999 | 146 | 19.4% |
| $150,000 to $199,999 | 83 | 11.1% |
| $200,000+ | 81 | 10.8% |
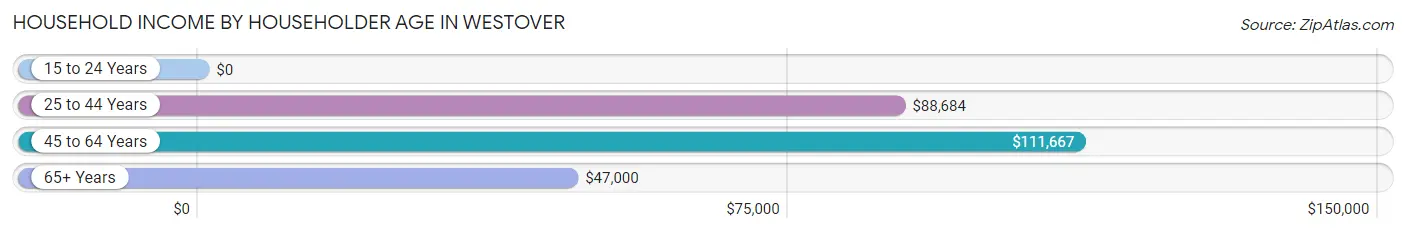
Household Income by Householder Age in Westover
The median household income in Westover is $87,772, with the highest median household income of $111,667 found in the 45 to 64 years age bracket for the primary householder. A total of 270 households (35.9%) fall into this category. Meanwhile, the 15 to 24 years age bracket for the primary householder has the lowest median household income of $0, with 35 households (4.7%) in this group.
| Income Bracket | # Households | Median Income |
| 15 to 24 Years | 35 (4.7%) | $0 |
| 25 to 44 Years | 306 (40.7%) | $88,684 |
| 45 to 64 Years | 270 (35.9%) | $111,667 |
| 65+ Years | 140 (18.6%) | $47,000 |
| Total | 751 (100.0%) | $87,772 |
Poverty in Westover
Income Below Poverty by Sex and Age in Westover
With 5.2% poverty level for males and 7.4% for females among the residents of Westover, 15 year old males and 12 to 14 year old females are the most vulnerable to poverty, with 4 males (25.0%) and 18 females (31.0%) in their respective age groups living below the poverty level.
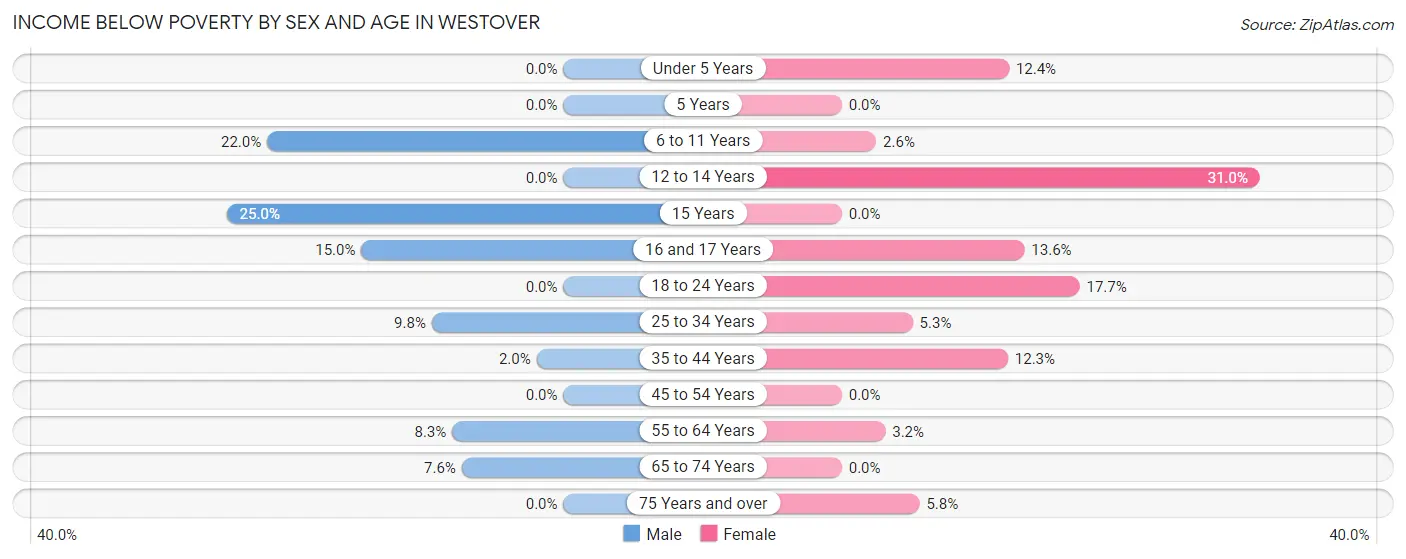
| Age Bracket | Male | Female |
| Under 5 Years | 0 (0.0%) | 18 (12.4%) |
| 5 Years | 0 (0.0%) | 0 (0.0%) |
| 6 to 11 Years | 22 (22.0%) | 4 (2.5%) |
| 12 to 14 Years | 0 (0.0%) | 18 (31.0%) |
| 15 Years | 4 (25.0%) | 0 (0.0%) |
| 16 and 17 Years | 3 (15.0%) | 8 (13.6%) |
| 18 to 24 Years | 0 (0.0%) | 9 (17.6%) |
| 25 to 34 Years | 13 (9.8%) | 9 (5.3%) |
| 35 to 44 Years | 4 (2.0%) | 18 (12.3%) |
| 45 to 54 Years | 0 (0.0%) | 0 (0.0%) |
| 55 to 64 Years | 9 (8.3%) | 3 (3.2%) |
| 65 to 74 Years | 4 (7.5%) | 0 (0.0%) |
| 75 Years and over | 0 (0.0%) | 6 (5.8%) |
| Total | 59 (5.2%) | 93 (7.4%) |
Income Above Poverty by Sex and Age in Westover
According to the poverty statistics in Westover, males aged under 5 years and females aged 5 years are the age groups that are most secure financially, with 100.0% of males and 100.0% of females in these age groups living above the poverty line.
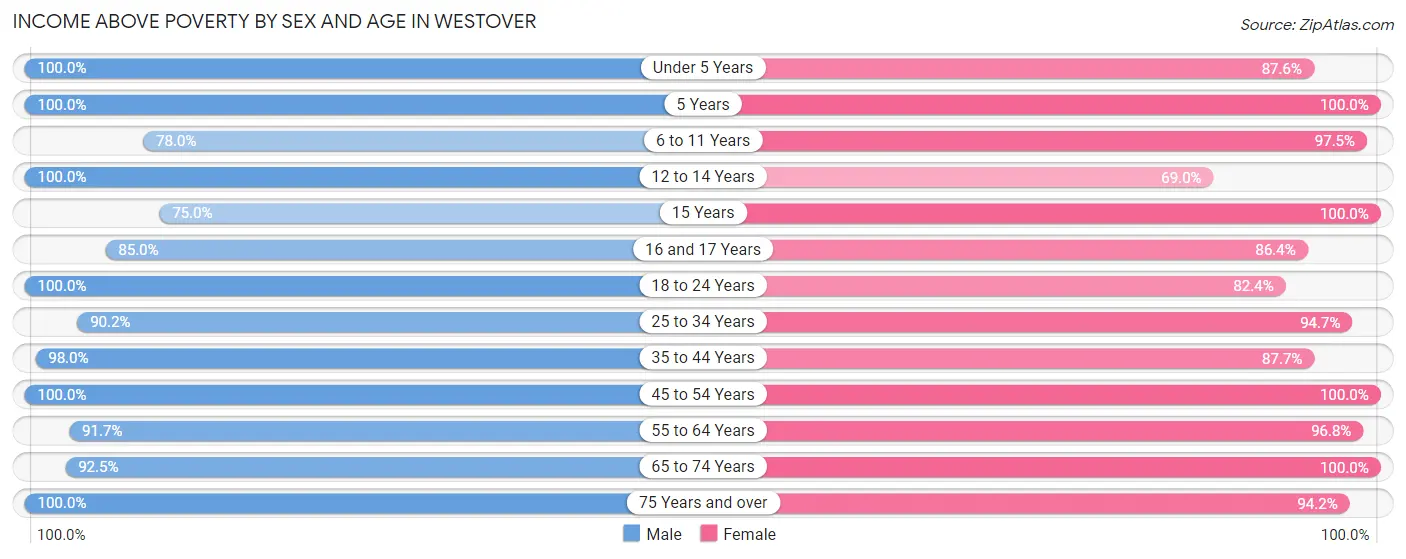
| Age Bracket | Male | Female |
| Under 5 Years | 132 (100.0%) | 127 (87.6%) |
| 5 Years | 8 (100.0%) | 14 (100.0%) |
| 6 to 11 Years | 78 (78.0%) | 153 (97.5%) |
| 12 to 14 Years | 87 (100.0%) | 40 (69.0%) |
| 15 Years | 12 (75.0%) | 3 (100.0%) |
| 16 and 17 Years | 17 (85.0%) | 51 (86.4%) |
| 18 to 24 Years | 96 (100.0%) | 42 (82.4%) |
| 25 to 34 Years | 120 (90.2%) | 162 (94.7%) |
| 35 to 44 Years | 197 (98.0%) | 128 (87.7%) |
| 45 to 54 Years | 149 (100.0%) | 184 (100.0%) |
| 55 to 64 Years | 100 (91.7%) | 90 (96.8%) |
| 65 to 74 Years | 49 (92.4%) | 68 (100.0%) |
| 75 Years and over | 32 (100.0%) | 98 (94.2%) |
| Total | 1,077 (94.8%) | 1,160 (92.6%) |
Income Below Poverty Among Married-Couple Families in Westover
The poverty statistics for married-couple families in Westover show that 0.8% or 4 of the total 489 families live below the poverty line. Families with 1 or 2 children have the highest poverty rate of 1.5%, comprising of 4 families. On the other hand, families with no children have the lowest poverty rate of 0.0%, which includes 0 families.
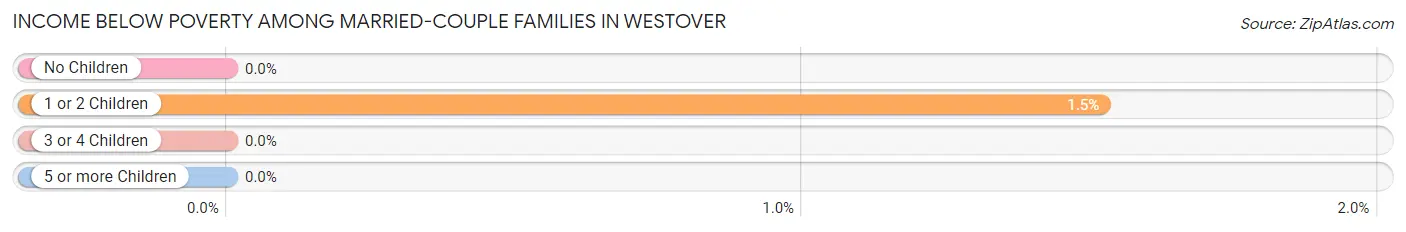
| Children | Above Poverty | Below Poverty |
| No Children | 191 (100.0%) | 0 (0.0%) |
| 1 or 2 Children | 259 (98.5%) | 4 (1.5%) |
| 3 or 4 Children | 35 (100.0%) | 0 (0.0%) |
| 5 or more Children | 0 (0.0%) | 0 (0.0%) |
| Total | 485 (99.2%) | 4 (0.8%) |
Income Below Poverty Among Single-Parent Households in Westover
According to the poverty data in Westover, 15.2% or 7 single-father households and 8.7% or 6 single-mother households are living below the poverty line. Among single-father households, those with 3 or 4 children have the highest poverty rate, with 7 households (28.0%) experiencing poverty. Likewise, among single-mother households, those with 1 or 2 children have the highest poverty rate, with 6 households (19.4%) falling below the poverty line.
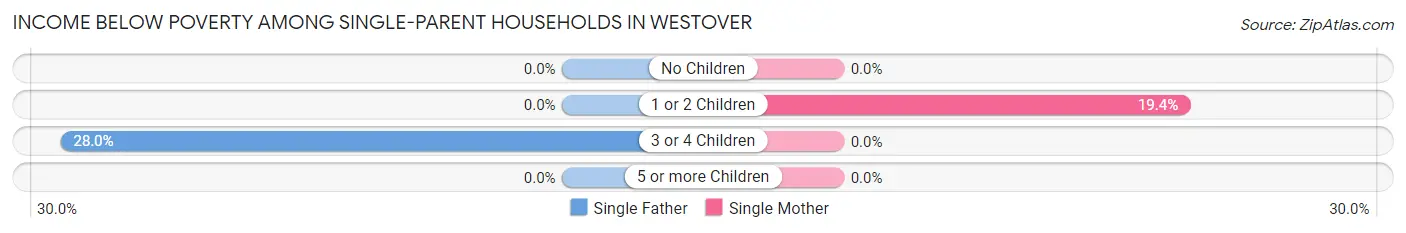
| Children | Single Father | Single Mother |
| No Children | 0 (0.0%) | 0 (0.0%) |
| 1 or 2 Children | 0 (0.0%) | 6 (19.4%) |
| 3 or 4 Children | 7 (28.0%) | 0 (0.0%) |
| 5 or more Children | 0 (0.0%) | 0 (0.0%) |
| Total | 7 (15.2%) | 6 (8.7%) |
Income Below Poverty Among Married-Couple vs Single-Parent Households in Westover
The poverty data for Westover shows that 4 of the married-couple family households (0.8%) and 13 of the single-parent households (11.3%) are living below the poverty level. Within the married-couple family households, those with 1 or 2 children have the highest poverty rate, with 4 households (1.5%) falling below the poverty line. Among the single-parent households, those with 3 or 4 children have the highest poverty rate, with 7 household (18.9%) living below poverty.
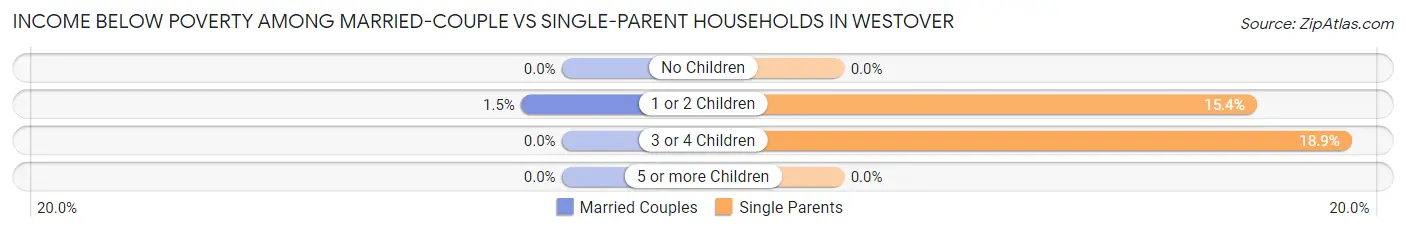
| Children | Married-Couple Families | Single-Parent Households |
| No Children | 0 (0.0%) | 0 (0.0%) |
| 1 or 2 Children | 4 (1.5%) | 6 (15.4%) |
| 3 or 4 Children | 0 (0.0%) | 7 (18.9%) |
| 5 or more Children | 0 (0.0%) | 0 (0.0%) |
| Total | 4 (0.8%) | 13 (11.3%) |
Employment Characteristics in Westover
Employment by Class of Employer in Westover
Among the 1,111 employed individuals in Westover, private company employees (696 | 62.6%), local government employees (120 | 10.8%), and not-for-profit organizations (116 | 10.4%) make up the most common classes of employment.
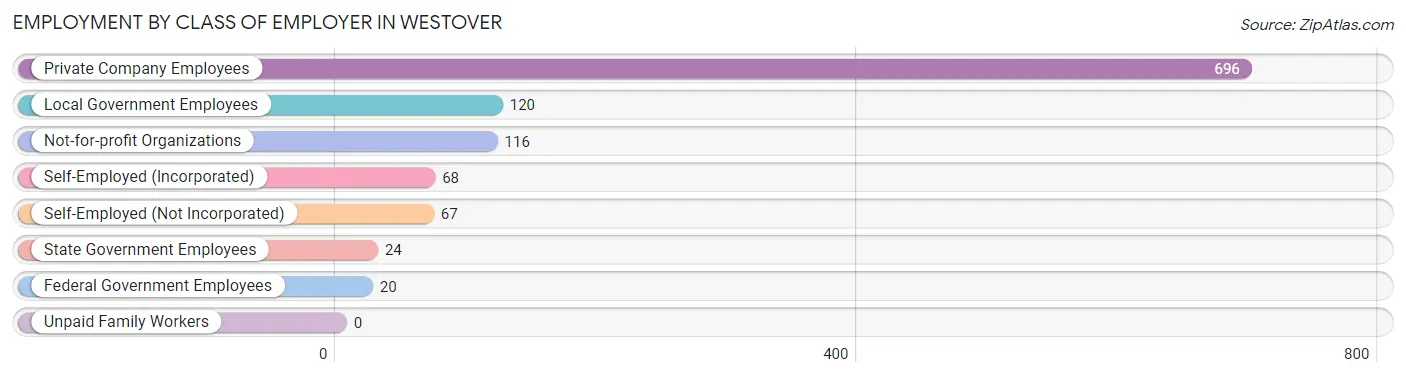
| Employer Class | # Employees | % Employees |
| Private Company Employees | 696 | 62.6% |
| Self-Employed (Incorporated) | 68 | 6.1% |
| Self-Employed (Not Incorporated) | 67 | 6.0% |
| Not-for-profit Organizations | 116 | 10.4% |
| Local Government Employees | 120 | 10.8% |
| State Government Employees | 24 | 2.2% |
| Federal Government Employees | 20 | 1.8% |
| Unpaid Family Workers | 0 | 0.0% |
| Total | 1,111 | 100.0% |
Employment Status by Age in Westover
According to the labor force statistics for Westover, out of the total population over 16 years of age (1,680), 69.9% or 1,174 individuals are in the labor force, with 2.5% or 29 of them unemployed. The age group with the highest labor force participation rate is 35 to 44 years, with 93.4% or 324 individuals in the labor force. Within the labor force, the 20 to 24 years age range has the highest percentage of unemployed individuals, with 14.4% or 13 of them being unemployed.
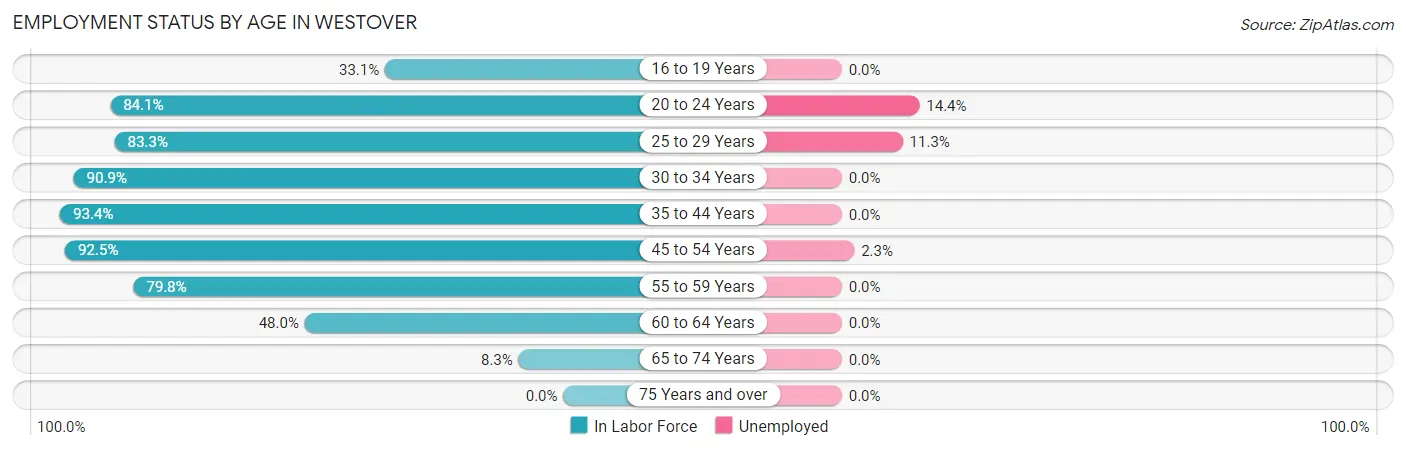
| Age Bracket | In Labor Force | Unemployed |
| 16 to 19 Years | 43 (33.1%) | 0 (0.0%) |
| 20 to 24 Years | 90 (84.1%) | 13 (14.4%) |
| 25 to 29 Years | 80 (83.3%) | 9 (11.3%) |
| 30 to 34 Years | 189 (90.9%) | 0 (0.0%) |
| 35 to 44 Years | 324 (93.4%) | 0 (0.0%) |
| 45 to 54 Years | 308 (92.5%) | 7 (2.3%) |
| 55 to 59 Years | 83 (79.8%) | 0 (0.0%) |
| 60 to 64 Years | 47 (48.0%) | 0 (0.0%) |
| 65 to 74 Years | 10 (8.3%) | 0 (0.0%) |
| 75 Years and over | 0 (0.0%) | 0 (0.0%) |
| Total | 1,174 (69.9%) | 29 (2.5%) |
Employment Status by Educational Attainment in Westover
According to labor force statistics for Westover, 86.9% of individuals (1,031) out of the total population between 25 and 64 years of age (1,186) are in the labor force, with 1.6% or 16 of them being unemployed. The group with the highest labor force participation rate are those with the educational attainment of high school diploma, with 91.4% or 180 individuals in the labor force. Within the labor force, individuals with college / associate degree education have the highest percentage of unemployment, with 5.2% or 16 of them being unemployed.
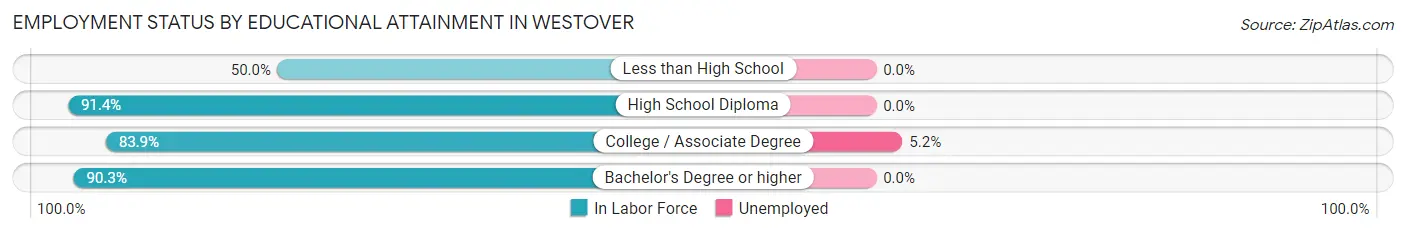
| Educational Attainment | In Labor Force | Unemployed |
| Less than High School | 23 (50.0%) | 0 (0.0%) |
| High School Diploma | 180 (91.4%) | 0 (0.0%) |
| College / Associate Degree | 307 (83.9%) | 19 (5.2%) |
| Bachelor's Degree or higher | 521 (90.3%) | 0 (0.0%) |
| Total | 1,031 (86.9%) | 19 (1.6%) |
Employment Occupations by Sex in Westover
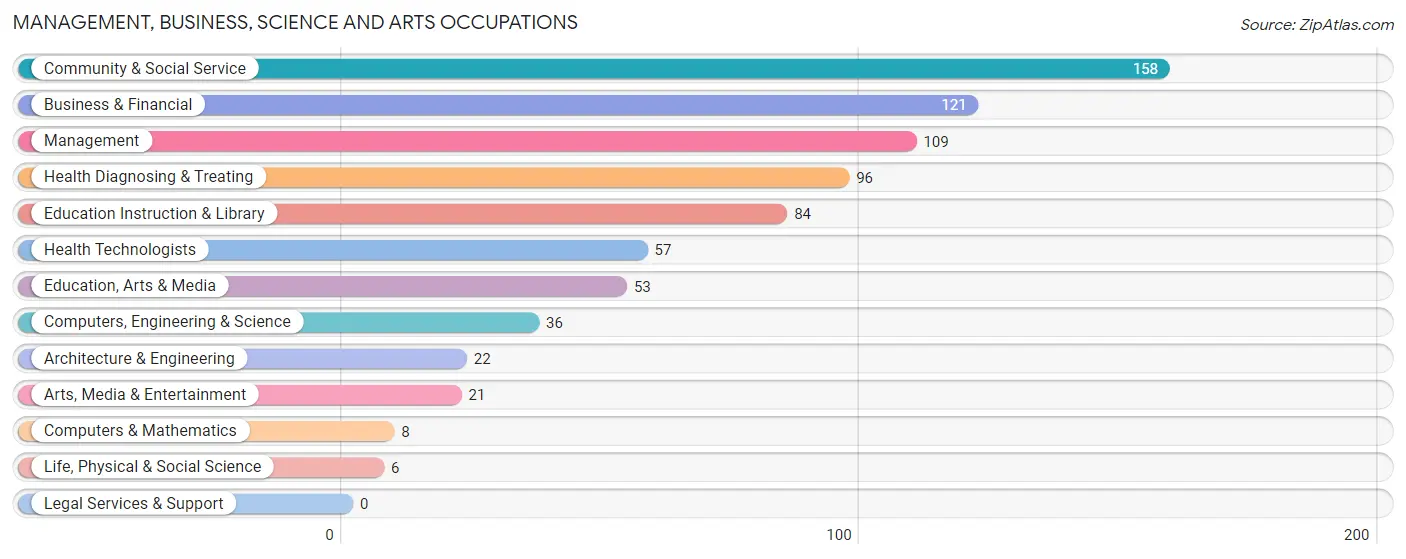
Management, Business, Science and Arts Occupations
The most common Management, Business, Science and Arts occupations in Westover are Community & Social Service (158 | 13.8%), Business & Financial (121 | 10.6%), Management (109 | 9.5%), Health Diagnosing & Treating (96 | 8.4%), and Education Instruction & Library (84 | 7.3%).
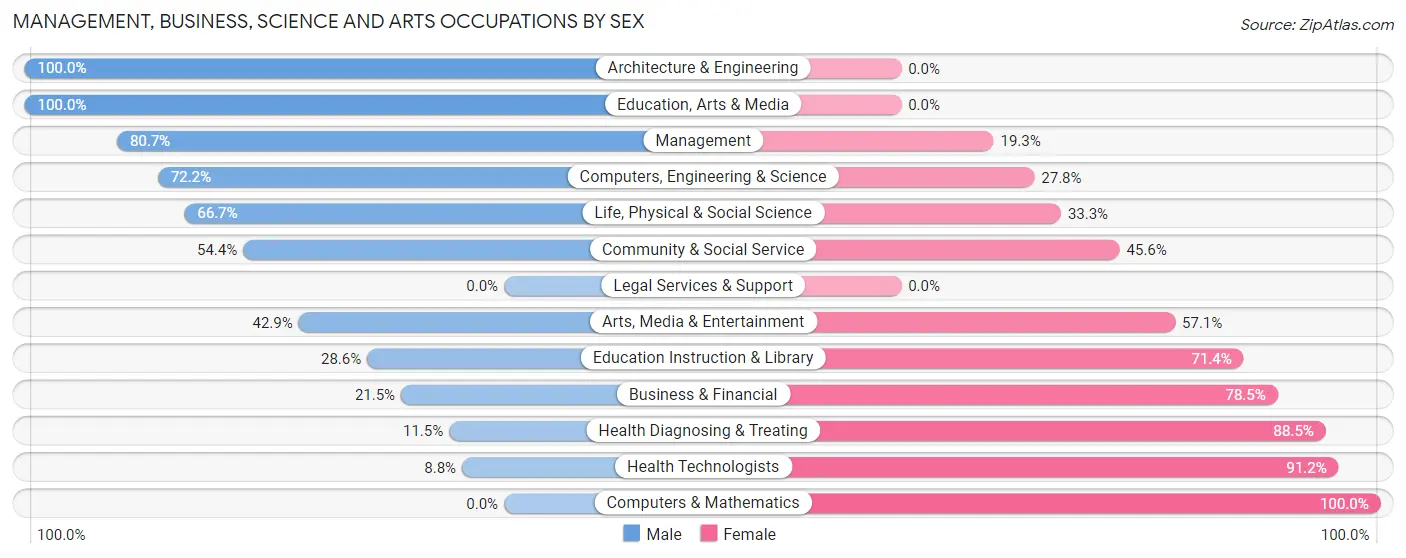
Management, Business, Science and Arts Occupations by Sex
Within the Management, Business, Science and Arts occupations in Westover, the most male-oriented occupations are Architecture & Engineering (100.0%), Education, Arts & Media (100.0%), and Management (80.7%), while the most female-oriented occupations are Computers & Mathematics (100.0%), Health Technologists (91.2%), and Health Diagnosing & Treating (88.5%).
| Occupation | Male | Female |
| Management | 88 (80.7%) | 21 (19.3%) |
| Business & Financial | 26 (21.5%) | 95 (78.5%) |
| Computers, Engineering & Science | 26 (72.2%) | 10 (27.8%) |
| Computers & Mathematics | 0 (0.0%) | 8 (100.0%) |
| Architecture & Engineering | 22 (100.0%) | 0 (0.0%) |
| Life, Physical & Social Science | 4 (66.7%) | 2 (33.3%) |
| Community & Social Service | 86 (54.4%) | 72 (45.6%) |
| Education, Arts & Media | 53 (100.0%) | 0 (0.0%) |
| Legal Services & Support | 0 (0.0%) | 0 (0.0%) |
| Education Instruction & Library | 24 (28.6%) | 60 (71.4%) |
| Arts, Media & Entertainment | 9 (42.9%) | 12 (57.1%) |
| Health Diagnosing & Treating | 11 (11.5%) | 85 (88.5%) |
| Health Technologists | 5 (8.8%) | 52 (91.2%) |
| Total (Category) | 237 (45.6%) | 283 (54.4%) |
| Total (Overall) | 638 (55.7%) | 507 (44.3%) |
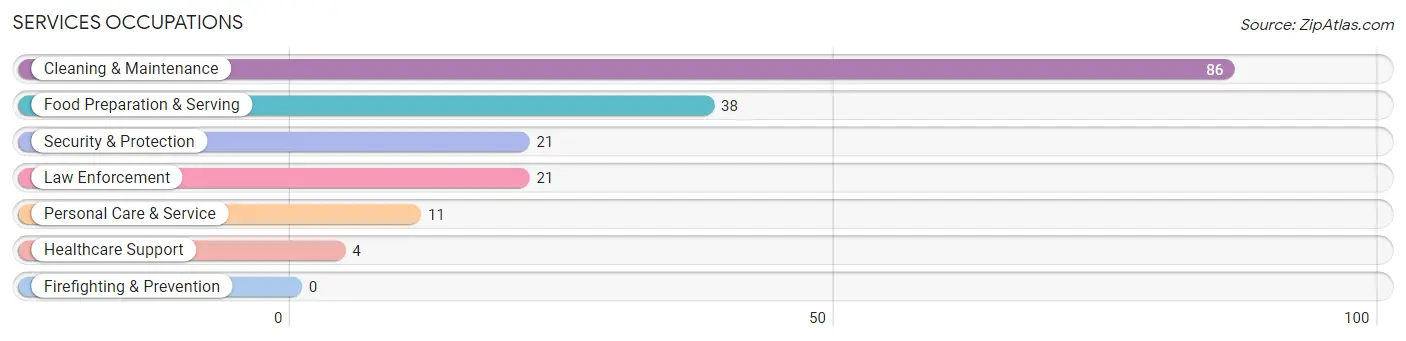
Services Occupations
The most common Services occupations in Westover are Cleaning & Maintenance (86 | 7.5%), Food Preparation & Serving (38 | 3.3%), Security & Protection (21 | 1.8%), Law Enforcement (21 | 1.8%), and Personal Care & Service (11 | 1.0%).
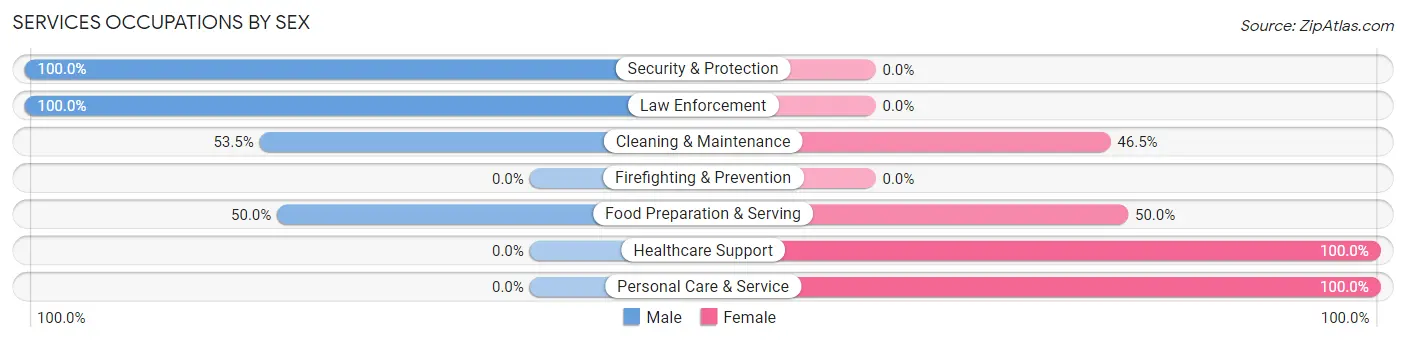
Services Occupations by Sex
Within the Services occupations in Westover, the most male-oriented occupations are Security & Protection (100.0%), Law Enforcement (100.0%), and Cleaning & Maintenance (53.5%), while the most female-oriented occupations are Healthcare Support (100.0%), Personal Care & Service (100.0%), and Food Preparation & Serving (50.0%).
| Occupation | Male | Female |
| Healthcare Support | 0 (0.0%) | 4 (100.0%) |
| Security & Protection | 21 (100.0%) | 0 (0.0%) |
| Firefighting & Prevention | 0 (0.0%) | 0 (0.0%) |
| Law Enforcement | 21 (100.0%) | 0 (0.0%) |
| Food Preparation & Serving | 19 (50.0%) | 19 (50.0%) |
| Cleaning & Maintenance | 46 (53.5%) | 40 (46.5%) |
| Personal Care & Service | 0 (0.0%) | 11 (100.0%) |
| Total (Category) | 86 (53.7%) | 74 (46.3%) |
| Total (Overall) | 638 (55.7%) | 507 (44.3%) |
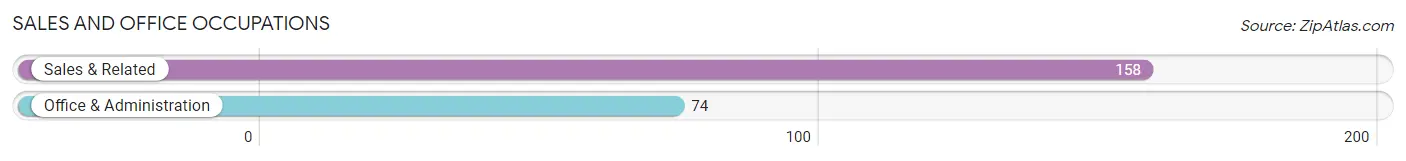
Sales and Office Occupations
The most common Sales and Office occupations in Westover are Sales & Related (158 | 13.8%), and Office & Administration (74 | 6.5%).
Sales and Office Occupations by Sex
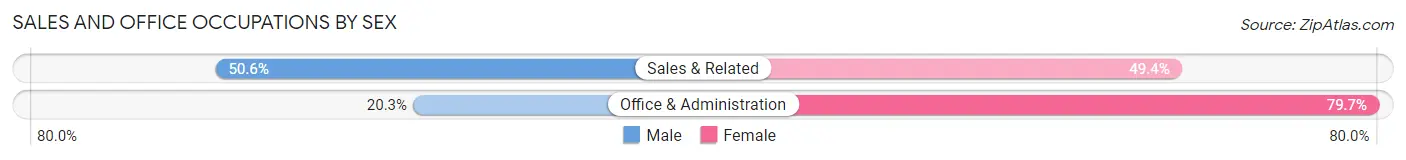
| Occupation | Male | Female |
| Sales & Related | 80 (50.6%) | 78 (49.4%) |
| Office & Administration | 15 (20.3%) | 59 (79.7%) |
| Total (Category) | 95 (40.9%) | 137 (59.1%) |
| Total (Overall) | 638 (55.7%) | 507 (44.3%) |
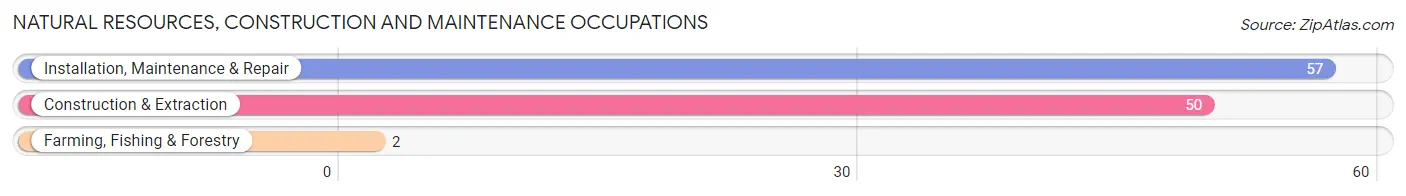
Natural Resources, Construction and Maintenance Occupations
The most common Natural Resources, Construction and Maintenance occupations in Westover are Installation, Maintenance & Repair (57 | 5.0%), Construction & Extraction (50 | 4.4%), and Farming, Fishing & Forestry (2 | 0.2%).
Natural Resources, Construction and Maintenance Occupations by Sex
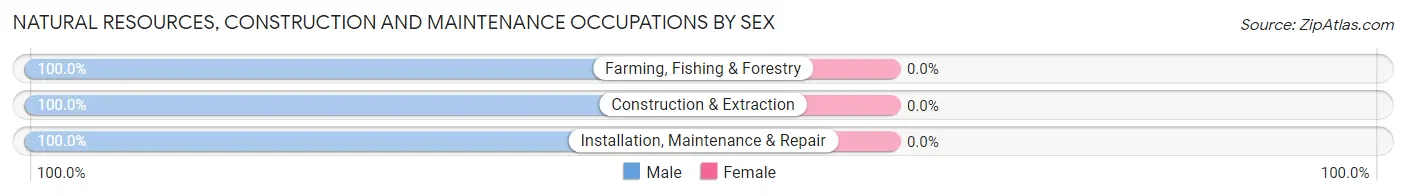
| Occupation | Male | Female |
| Farming, Fishing & Forestry | 2 (100.0%) | 0 (0.0%) |
| Construction & Extraction | 50 (100.0%) | 0 (0.0%) |
| Installation, Maintenance & Repair | 57 (100.0%) | 0 (0.0%) |
| Total (Category) | 109 (100.0%) | 0 (0.0%) |
| Total (Overall) | 638 (55.7%) | 507 (44.3%) |
Production, Transportation and Moving Occupations
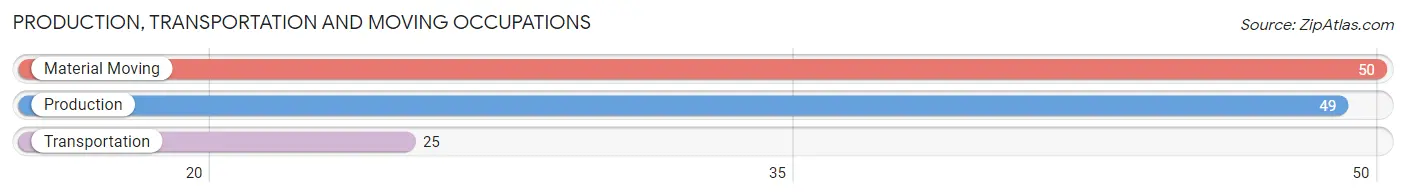
The most common Production, Transportation and Moving occupations in Westover are Material Moving (50 | 4.4%), Production (49 | 4.3%), and Transportation (25 | 2.2%).
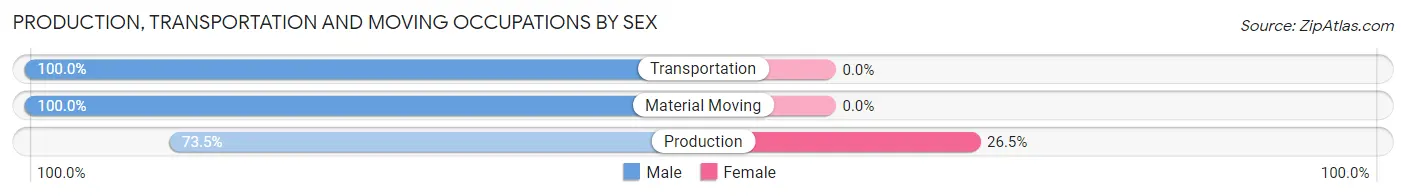
Production, Transportation and Moving Occupations by Sex
| Occupation | Male | Female |
| Production | 36 (73.5%) | 13 (26.5%) |
| Transportation | 25 (100.0%) | 0 (0.0%) |
| Material Moving | 50 (100.0%) | 0 (0.0%) |
| Total (Category) | 111 (89.5%) | 13 (10.5%) |
| Total (Overall) | 638 (55.7%) | 507 (44.3%) |
Employment Industries by Sex in Westover
Employment Industries in Westover
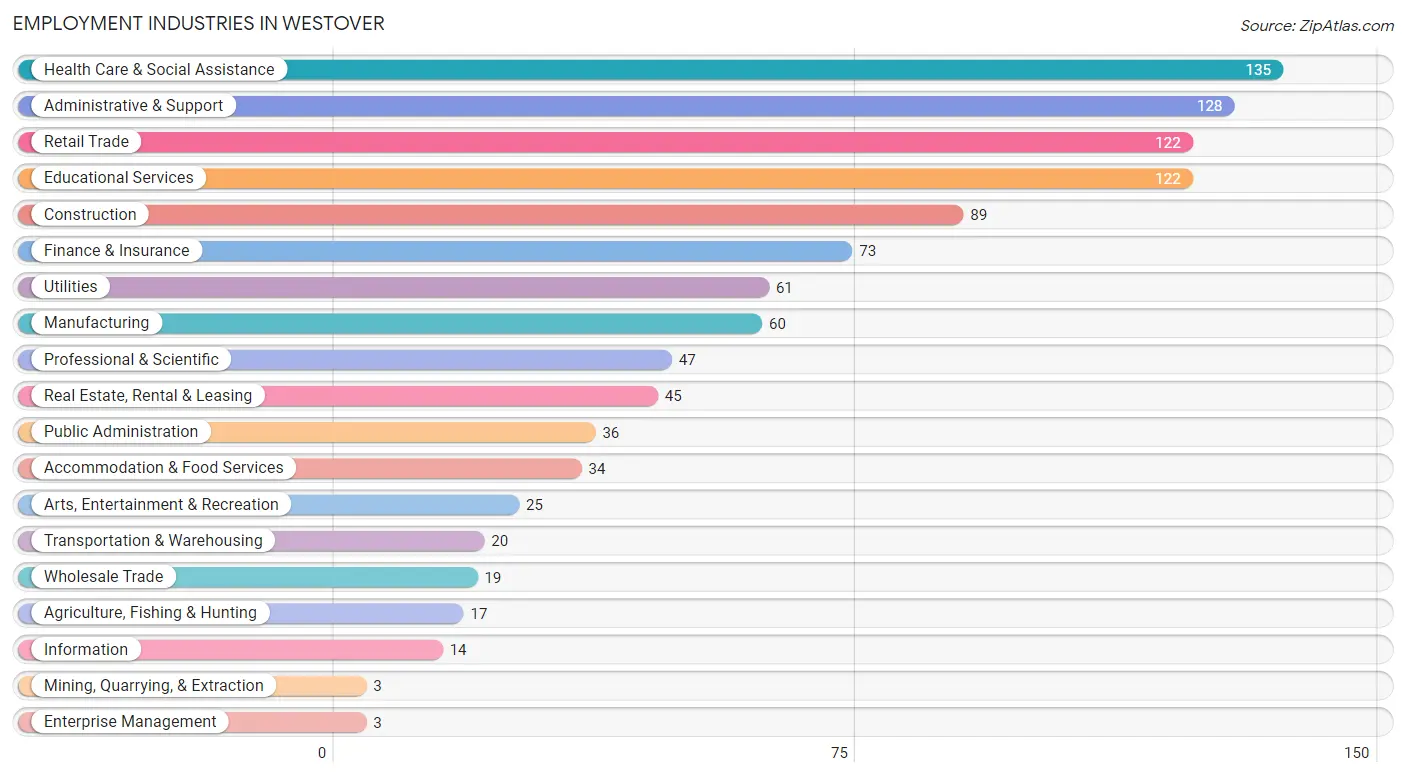
The major employment industries in Westover include Health Care & Social Assistance (135 | 11.8%), Administrative & Support (128 | 11.2%), Retail Trade (122 | 10.7%), Educational Services (122 | 10.7%), and Construction (89 | 7.8%).
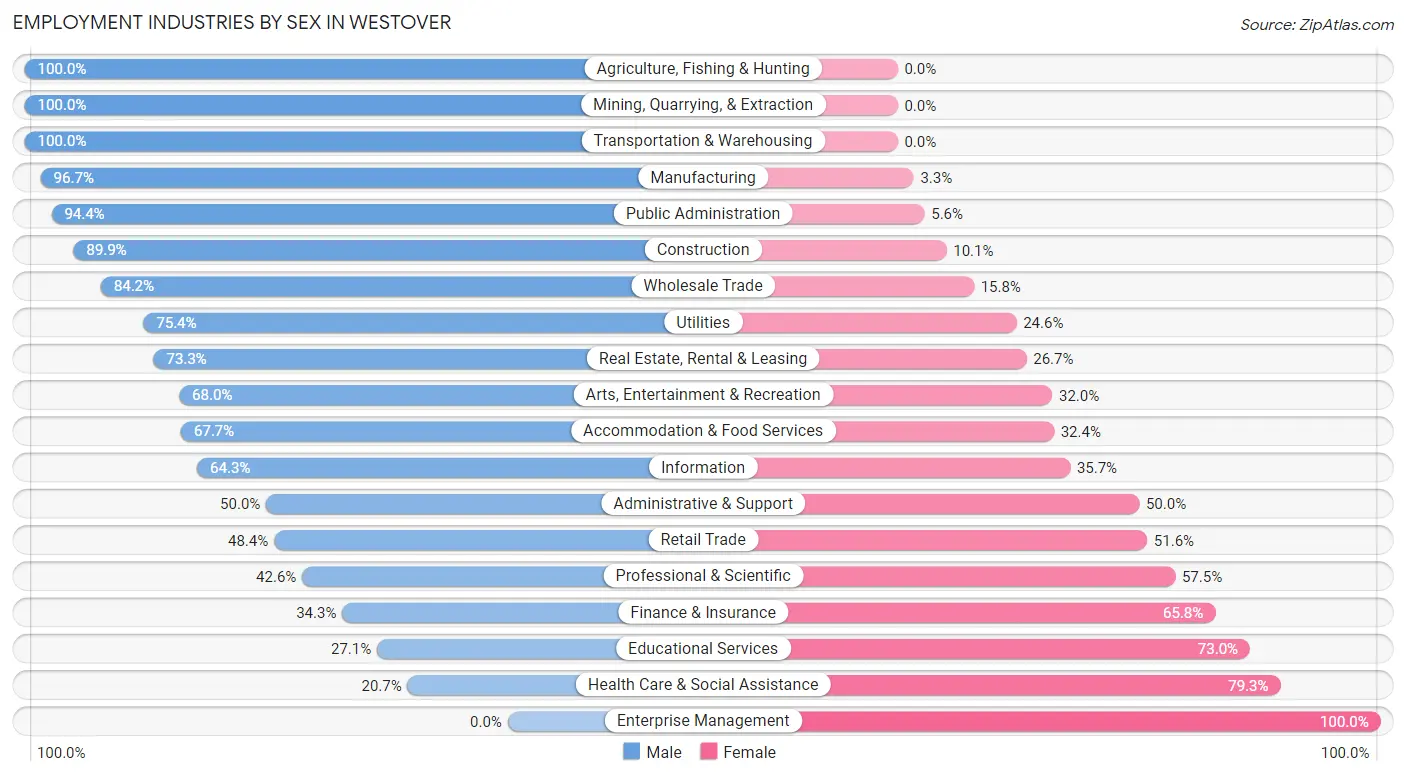
Employment Industries by Sex in Westover
The Westover industries that see more men than women are Agriculture, Fishing & Hunting (100.0%), Mining, Quarrying, & Extraction (100.0%), and Transportation & Warehousing (100.0%), whereas the industries that tend to have a higher number of women are Enterprise Management (100.0%), Health Care & Social Assistance (79.3%), and Educational Services (73.0%).
| Industry | Male | Female |
| Agriculture, Fishing & Hunting | 17 (100.0%) | 0 (0.0%) |
| Mining, Quarrying, & Extraction | 3 (100.0%) | 0 (0.0%) |
| Construction | 80 (89.9%) | 9 (10.1%) |
| Manufacturing | 58 (96.7%) | 2 (3.3%) |
| Wholesale Trade | 16 (84.2%) | 3 (15.8%) |
| Retail Trade | 59 (48.4%) | 63 (51.6%) |
| Transportation & Warehousing | 20 (100.0%) | 0 (0.0%) |
| Utilities | 46 (75.4%) | 15 (24.6%) |
| Information | 9 (64.3%) | 5 (35.7%) |
| Finance & Insurance | 25 (34.3%) | 48 (65.7%) |
| Real Estate, Rental & Leasing | 33 (73.3%) | 12 (26.7%) |
| Professional & Scientific | 20 (42.5%) | 27 (57.5%) |
| Enterprise Management | 0 (0.0%) | 3 (100.0%) |
| Administrative & Support | 64 (50.0%) | 64 (50.0%) |
| Educational Services | 33 (27.1%) | 89 (73.0%) |
| Health Care & Social Assistance | 28 (20.7%) | 107 (79.3%) |
| Arts, Entertainment & Recreation | 17 (68.0%) | 8 (32.0%) |
| Accommodation & Food Services | 23 (67.6%) | 11 (32.4%) |
| Public Administration | 34 (94.4%) | 2 (5.6%) |
| Total | 638 (55.7%) | 507 (44.3%) |
Education in Westover
School Enrollment in Westover
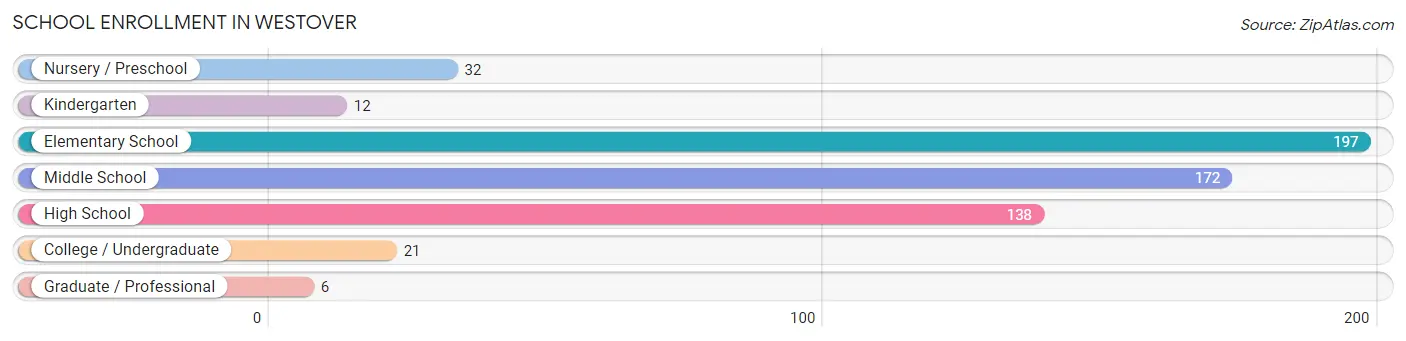
The most common levels of schooling among the 578 students in Westover are elementary school (197 | 34.1%), middle school (172 | 29.8%), and high school (138 | 23.9%).
| School Level | # Students | % Students |
| Nursery / Preschool | 32 | 5.5% |
| Kindergarten | 12 | 2.1% |
| Elementary School | 197 | 34.1% |
| Middle School | 172 | 29.8% |
| High School | 138 | 23.9% |
| College / Undergraduate | 21 | 3.6% |
| Graduate / Professional | 6 | 1.0% |
| Total | 578 | 100.0% |
School Enrollment by Age by Funding Source in Westover
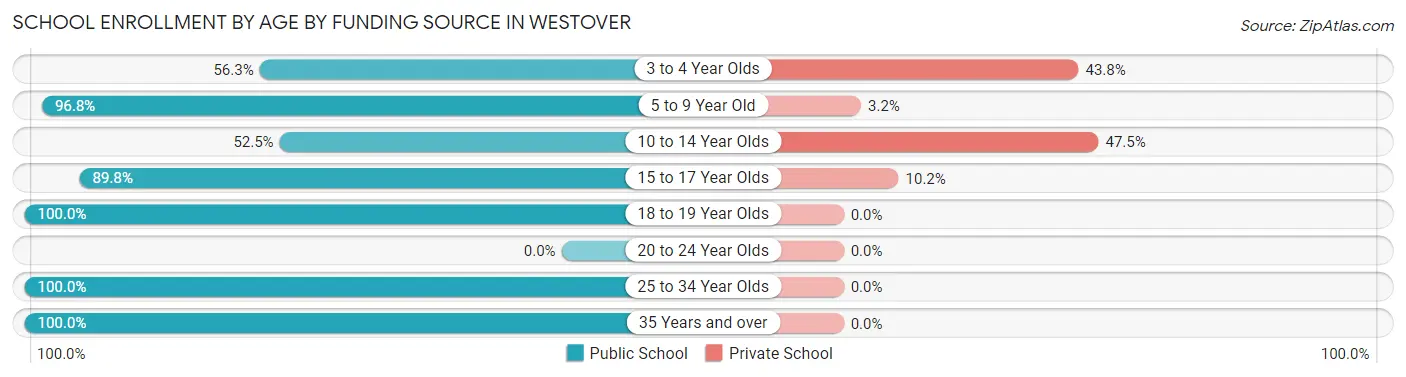
Out of a total of 578 students who are enrolled in schools in Westover, 132 (22.8%) attend a private institution, while the remaining 446 (77.2%) are enrolled in public schools. The age group of 10 to 14 year olds has the highest likelihood of being enrolled in private schools, with 103 (47.5% in the age bracket) enrolled. Conversely, the age group of 18 to 19 year olds has the lowest likelihood of being enrolled in a private school, with 42 (100.0% in the age bracket) attending a public institution.
| Age Bracket | Public School | Private School |
| 3 to 4 Year Olds | 18 (56.2%) | 14 (43.8%) |
| 5 to 9 Year Old | 179 (96.8%) | 6 (3.2%) |
| 10 to 14 Year Olds | 114 (52.5%) | 103 (47.5%) |
| 15 to 17 Year Olds | 79 (89.8%) | 9 (10.2%) |
| 18 to 19 Year Olds | 42 (100.0%) | 0 (0.0%) |
| 20 to 24 Year Olds | 0 (0.0%) | 0 (0.0%) |
| 25 to 34 Year Olds | 10 (100.0%) | 0 (0.0%) |
| 35 Years and over | 4 (100.0%) | 0 (0.0%) |
| Total | 446 (77.2%) | 132 (22.8%) |
Educational Attainment by Field of Study in Westover
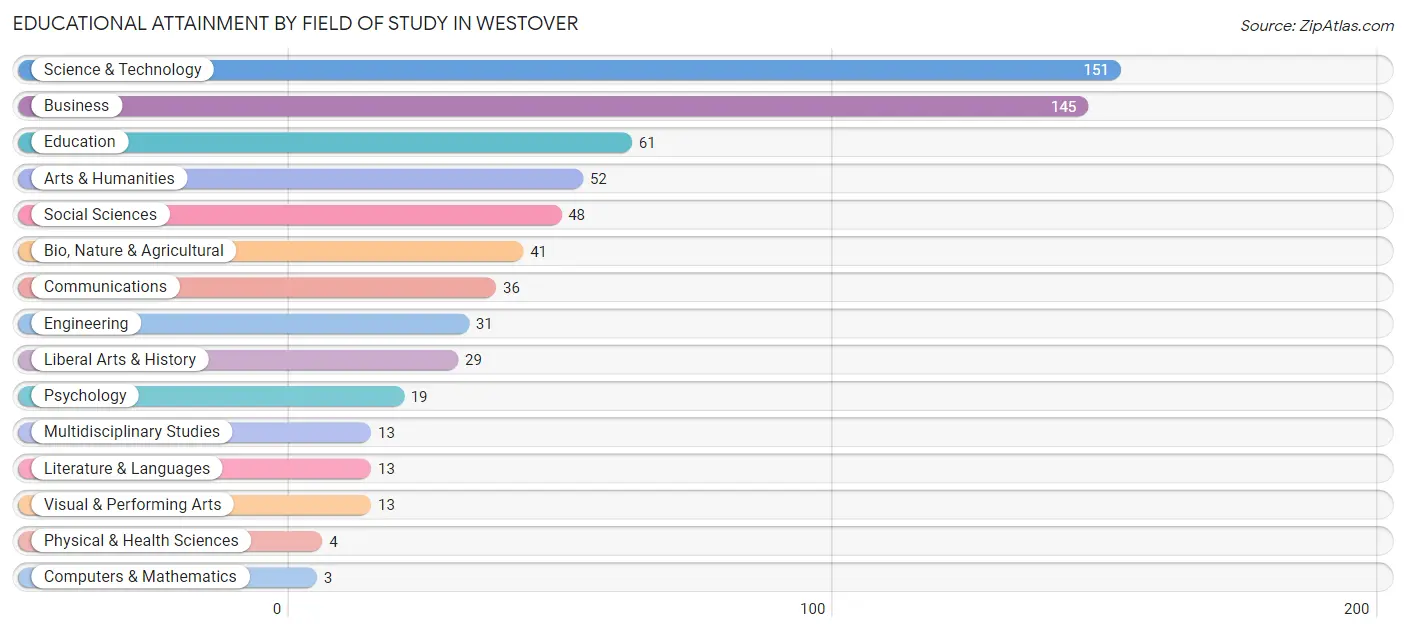
Science & technology (151 | 22.9%), business (145 | 22.0%), education (61 | 9.3%), arts & humanities (52 | 7.9%), and social sciences (48 | 7.3%) are the most common fields of study among 659 individuals in Westover who have obtained a bachelor's degree or higher.
| Field of Study | # Graduates | % Graduates |
| Computers & Mathematics | 3 | 0.5% |
| Bio, Nature & Agricultural | 41 | 6.2% |
| Physical & Health Sciences | 4 | 0.6% |
| Psychology | 19 | 2.9% |
| Social Sciences | 48 | 7.3% |
| Engineering | 31 | 4.7% |
| Multidisciplinary Studies | 13 | 2.0% |
| Science & Technology | 151 | 22.9% |
| Business | 145 | 22.0% |
| Education | 61 | 9.3% |
| Literature & Languages | 13 | 2.0% |
| Liberal Arts & History | 29 | 4.4% |
| Visual & Performing Arts | 13 | 2.0% |
| Communications | 36 | 5.5% |
| Arts & Humanities | 52 | 7.9% |
| Total | 659 | 100.0% |
Transportation & Commute in Westover
Vehicle Availability by Sex in Westover
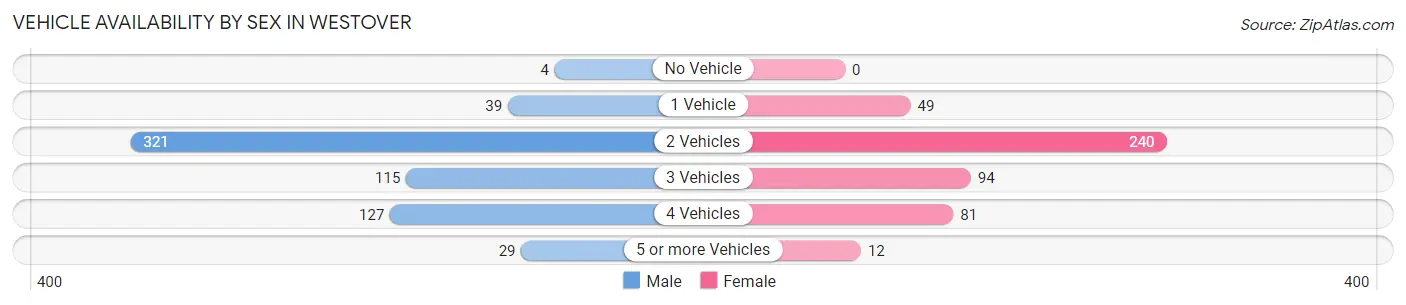
The most prevalent vehicle ownership categories in Westover are males with 2 vehicles (321, accounting for 50.5%) and females with 2 vehicles (240, making up 67.4%).
| Vehicles Available | Male | Female |
| No Vehicle | 4 (0.6%) | 0 (0.0%) |
| 1 Vehicle | 39 (6.1%) | 49 (10.3%) |
| 2 Vehicles | 321 (50.5%) | 240 (50.4%) |
| 3 Vehicles | 115 (18.1%) | 94 (19.8%) |
| 4 Vehicles | 127 (20.0%) | 81 (17.0%) |
| 5 or more Vehicles | 29 (4.6%) | 12 (2.5%) |
| Total | 635 (100.0%) | 476 (100.0%) |
Commute Time in Westover
The most frequently occuring commute durations in Westover are 30 to 34 minutes (176 commuters, 17.8%), 40 to 44 minutes (146 commuters, 14.7%), and 20 to 24 minutes (135 commuters, 13.6%).
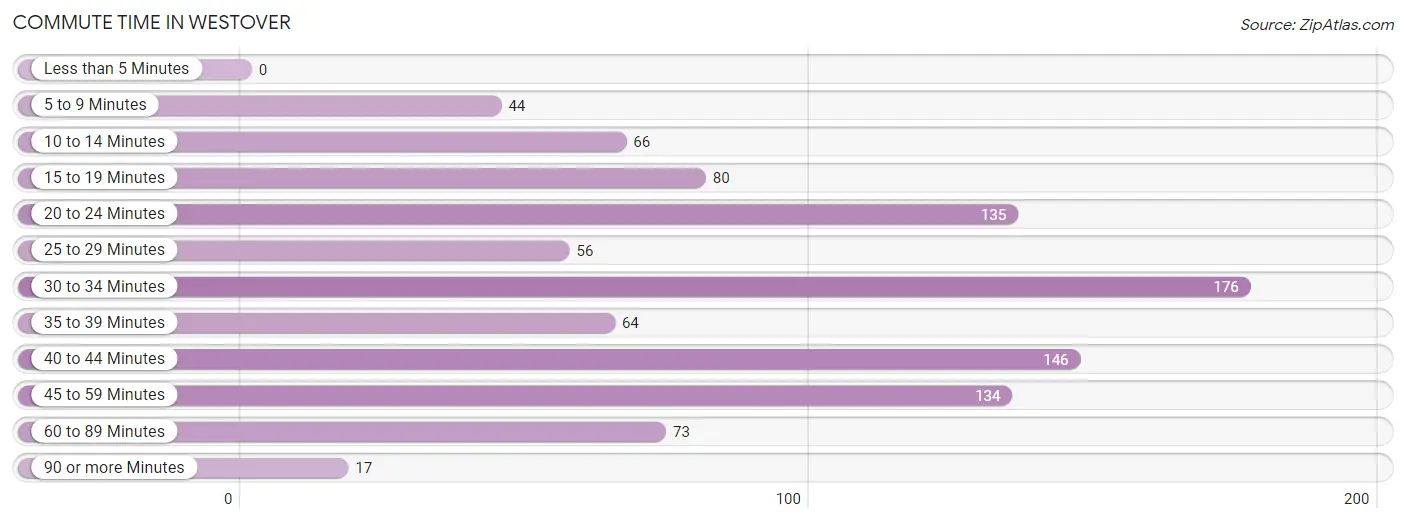
| Commute Time | # Commuters | % Commuters |
| Less than 5 Minutes | 0 | 0.0% |
| 5 to 9 Minutes | 44 | 4.4% |
| 10 to 14 Minutes | 66 | 6.7% |
| 15 to 19 Minutes | 80 | 8.1% |
| 20 to 24 Minutes | 135 | 13.6% |
| 25 to 29 Minutes | 56 | 5.7% |
| 30 to 34 Minutes | 176 | 17.8% |
| 35 to 39 Minutes | 64 | 6.5% |
| 40 to 44 Minutes | 146 | 14.7% |
| 45 to 59 Minutes | 134 | 13.5% |
| 60 to 89 Minutes | 73 | 7.4% |
| 90 or more Minutes | 17 | 1.7% |
Commute Time by Sex in Westover
The most common commute times in Westover are 20 to 24 minutes (117 commuters, 19.6%) for males and 30 to 34 minutes (109 commuters, 27.7%) for females.
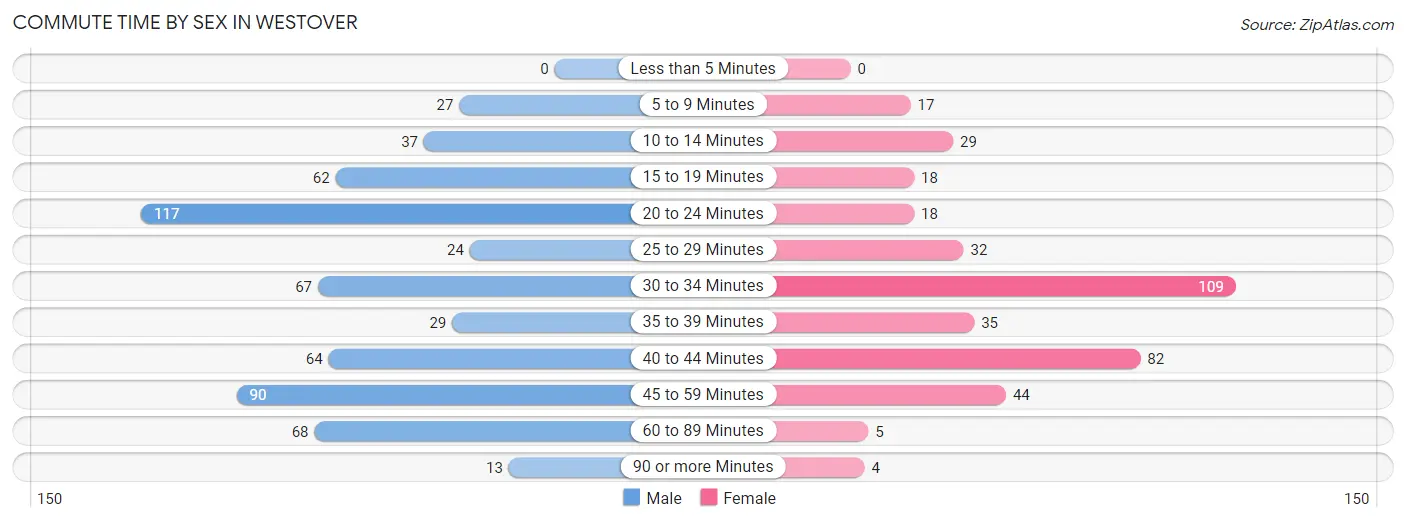
| Commute Time | Male | Female |
| Less than 5 Minutes | 0 (0.0%) | 0 (0.0%) |
| 5 to 9 Minutes | 27 (4.5%) | 17 (4.3%) |
| 10 to 14 Minutes | 37 (6.2%) | 29 (7.4%) |
| 15 to 19 Minutes | 62 (10.4%) | 18 (4.6%) |
| 20 to 24 Minutes | 117 (19.6%) | 18 (4.6%) |
| 25 to 29 Minutes | 24 (4.0%) | 32 (8.1%) |
| 30 to 34 Minutes | 67 (11.2%) | 109 (27.7%) |
| 35 to 39 Minutes | 29 (4.9%) | 35 (8.9%) |
| 40 to 44 Minutes | 64 (10.7%) | 82 (20.9%) |
| 45 to 59 Minutes | 90 (15.0%) | 44 (11.2%) |
| 60 to 89 Minutes | 68 (11.4%) | 5 (1.3%) |
| 90 or more Minutes | 13 (2.2%) | 4 (1.0%) |
Time of Departure to Work by Sex in Westover
The most frequent times of departure to work in Westover are 7:00 AM to 7:29 AM (129, 21.6%) for males and 7:00 AM to 7:29 AM (114, 29.0%) for females.
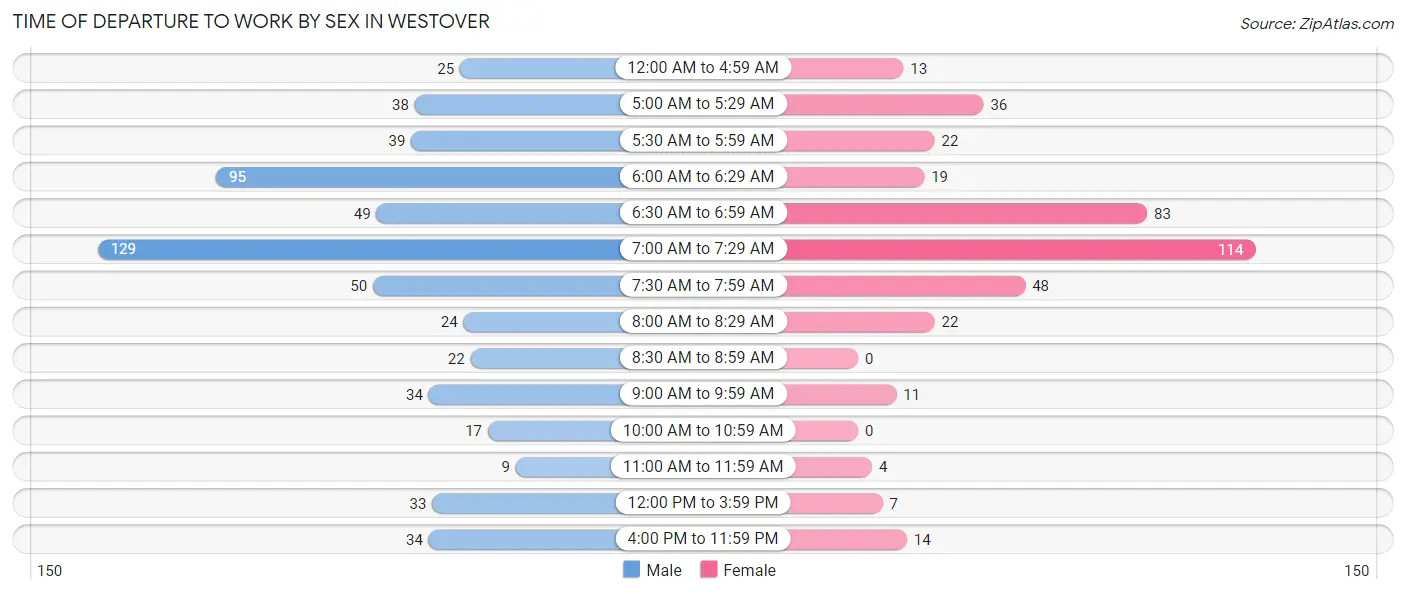
| Time of Departure | Male | Female |
| 12:00 AM to 4:59 AM | 25 (4.2%) | 13 (3.3%) |
| 5:00 AM to 5:29 AM | 38 (6.4%) | 36 (9.2%) |
| 5:30 AM to 5:59 AM | 39 (6.5%) | 22 (5.6%) |
| 6:00 AM to 6:29 AM | 95 (15.9%) | 19 (4.8%) |
| 6:30 AM to 6:59 AM | 49 (8.2%) | 83 (21.1%) |
| 7:00 AM to 7:29 AM | 129 (21.6%) | 114 (29.0%) |
| 7:30 AM to 7:59 AM | 50 (8.4%) | 48 (12.2%) |
| 8:00 AM to 8:29 AM | 24 (4.0%) | 22 (5.6%) |
| 8:30 AM to 8:59 AM | 22 (3.7%) | 0 (0.0%) |
| 9:00 AM to 9:59 AM | 34 (5.7%) | 11 (2.8%) |
| 10:00 AM to 10:59 AM | 17 (2.8%) | 0 (0.0%) |
| 11:00 AM to 11:59 AM | 9 (1.5%) | 4 (1.0%) |
| 12:00 PM to 3:59 PM | 33 (5.5%) | 7 (1.8%) |
| 4:00 PM to 11:59 PM | 34 (5.7%) | 14 (3.6%) |
| Total | 598 (100.0%) | 393 (100.0%) |
Housing Occupancy in Westover
Occupancy by Ownership in Westover
Of the total 751 dwellings in Westover, owner-occupied units account for 669 (89.1%), while renter-occupied units make up 82 (10.9%).
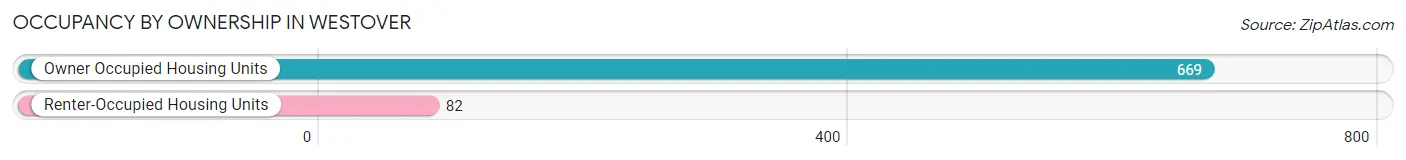
| Occupancy | # Housing Units | % Housing Units |
| Owner Occupied Housing Units | 669 | 89.1% |
| Renter-Occupied Housing Units | 82 | 10.9% |
| Total Occupied Housing Units | 751 | 100.0% |
Occupancy by Household Size in Westover
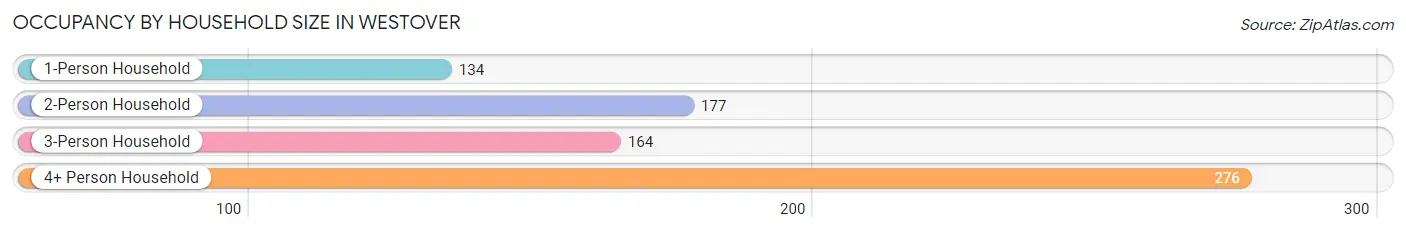
| Household Size | # Housing Units | % Housing Units |
| 1-Person Household | 134 | 17.8% |
| 2-Person Household | 177 | 23.6% |
| 3-Person Household | 164 | 21.8% |
| 4+ Person Household | 276 | 36.7% |
| Total Housing Units | 751 | 100.0% |
Occupancy by Ownership by Household Size in Westover
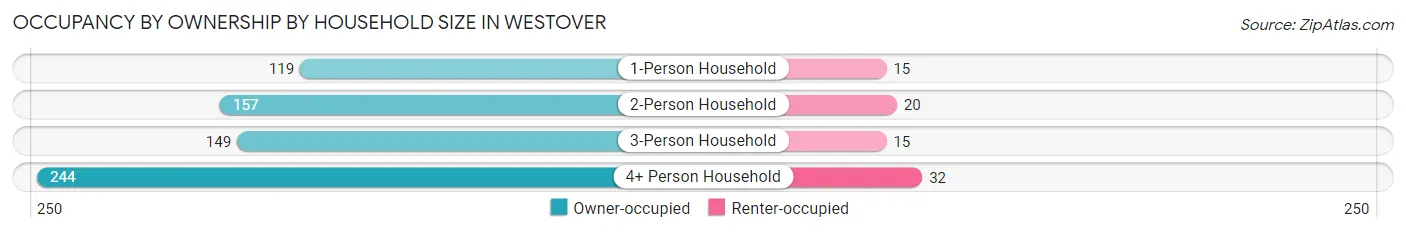
| Household Size | Owner-occupied | Renter-occupied |
| 1-Person Household | 119 (88.8%) | 15 (11.2%) |
| 2-Person Household | 157 (88.7%) | 20 (11.3%) |
| 3-Person Household | 149 (90.8%) | 15 (9.1%) |
| 4+ Person Household | 244 (88.4%) | 32 (11.6%) |
| Total Housing Units | 669 (89.1%) | 82 (10.9%) |
Occupancy by Educational Attainment in Westover
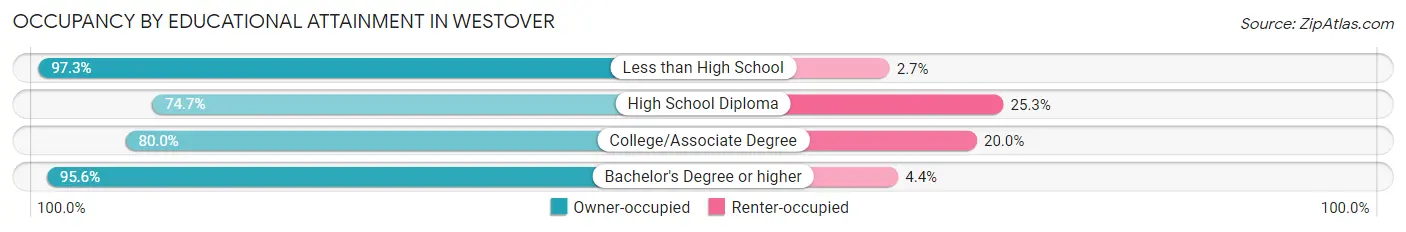
| Household Size | Owner-occupied | Renter-occupied |
| Less than High School | 72 (97.3%) | 2 (2.7%) |
| High School Diploma | 68 (74.7%) | 23 (25.3%) |
| College/Associate Degree | 160 (80.0%) | 40 (20.0%) |
| Bachelor's Degree or higher | 369 (95.6%) | 17 (4.4%) |
Occupancy by Age of Householder in Westover
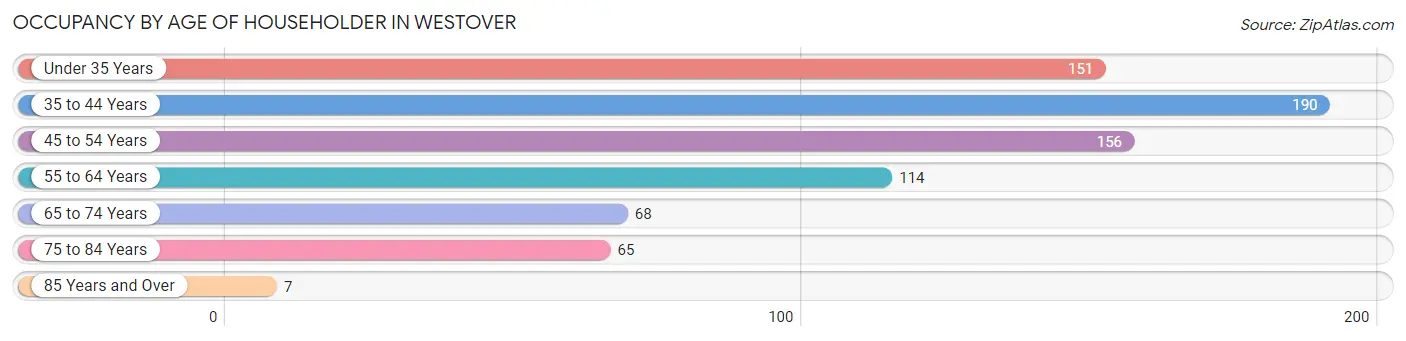
| Age Bracket | # Households | % Households |
| Under 35 Years | 151 | 20.1% |
| 35 to 44 Years | 190 | 25.3% |
| 45 to 54 Years | 156 | 20.8% |
| 55 to 64 Years | 114 | 15.2% |
| 65 to 74 Years | 68 | 9.0% |
| 75 to 84 Years | 65 | 8.7% |
| 85 Years and Over | 7 | 0.9% |
| Total | 751 | 100.0% |
Housing Finances in Westover
Median Income by Occupancy in Westover
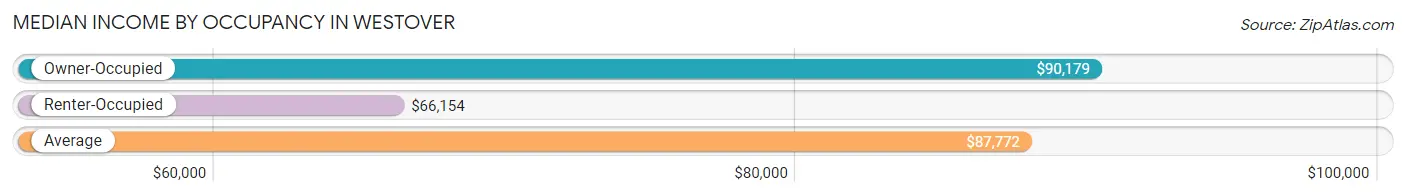
| Occupancy Type | # Households | Median Income |
| Owner-Occupied | 669 (89.1%) | $90,179 |
| Renter-Occupied | 82 (10.9%) | $66,154 |
| Average | 751 (100.0%) | $87,772 |
Occupancy by Householder Income Bracket in Westover
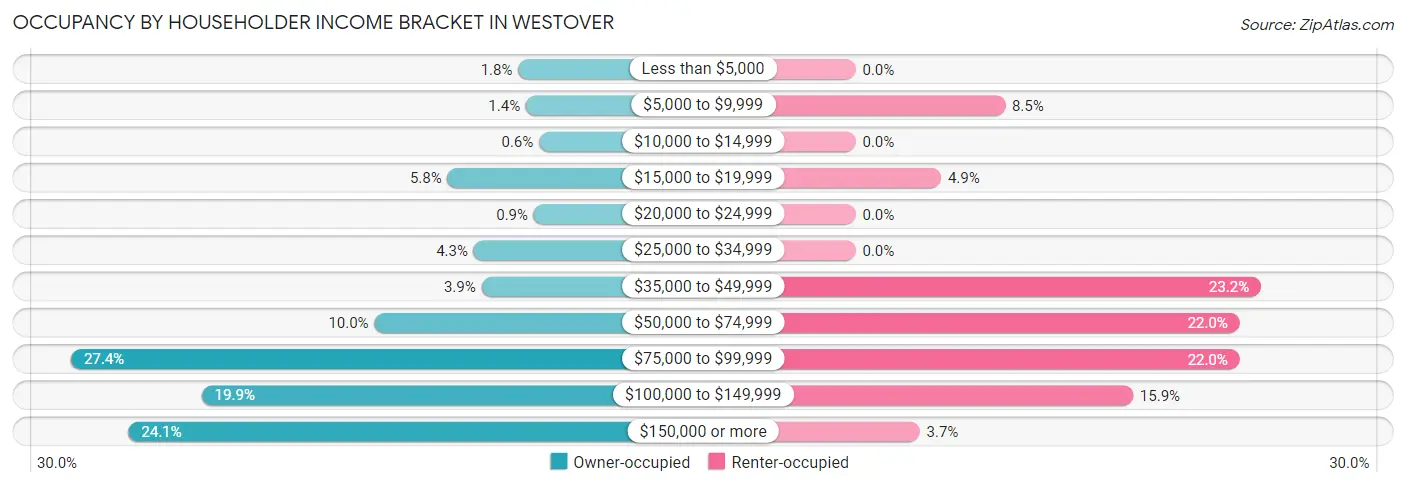
| Income Bracket | Owner-occupied | Renter-occupied |
| Less than $5,000 | 12 (1.8%) | 0 (0.0%) |
| $5,000 to $9,999 | 9 (1.3%) | 7 (8.5%) |
| $10,000 to $14,999 | 4 (0.6%) | 0 (0.0%) |
| $15,000 to $19,999 | 39 (5.8%) | 4 (4.9%) |
| $20,000 to $24,999 | 6 (0.9%) | 0 (0.0%) |
| $25,000 to $34,999 | 29 (4.3%) | 0 (0.0%) |
| $35,000 to $49,999 | 26 (3.9%) | 19 (23.2%) |
| $50,000 to $74,999 | 67 (10.0%) | 18 (22.0%) |
| $75,000 to $99,999 | 183 (27.4%) | 18 (22.0%) |
| $100,000 to $149,999 | 133 (19.9%) | 13 (15.9%) |
| $150,000 or more | 161 (24.1%) | 3 (3.7%) |
| Total | 669 (100.0%) | 82 (100.0%) |
Monthly Housing Cost Tiers in Westover
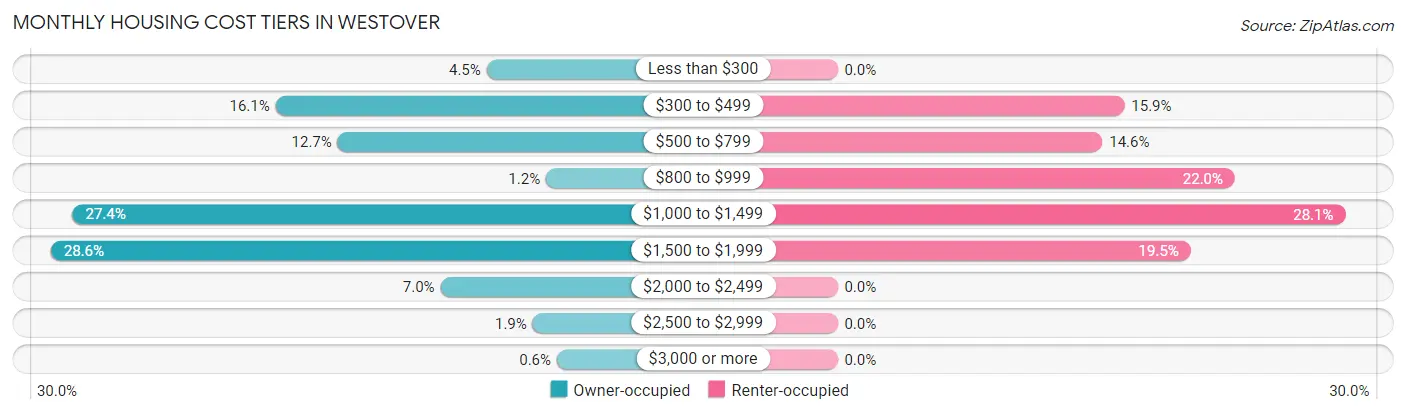
| Monthly Cost | Owner-occupied | Renter-occupied |
| Less than $300 | 30 (4.5%) | 0 (0.0%) |
| $300 to $499 | 108 (16.1%) | 13 (15.9%) |
| $500 to $799 | 85 (12.7%) | 12 (14.6%) |
| $800 to $999 | 8 (1.2%) | 18 (22.0%) |
| $1,000 to $1,499 | 183 (27.4%) | 23 (28.1%) |
| $1,500 to $1,999 | 191 (28.5%) | 16 (19.5%) |
| $2,000 to $2,499 | 47 (7.0%) | 0 (0.0%) |
| $2,500 to $2,999 | 13 (1.9%) | 0 (0.0%) |
| $3,000 or more | 4 (0.6%) | 0 (0.0%) |
| Total | 669 (100.0%) | 82 (100.0%) |
Physical Housing Characteristics in Westover
Housing Structures in Westover
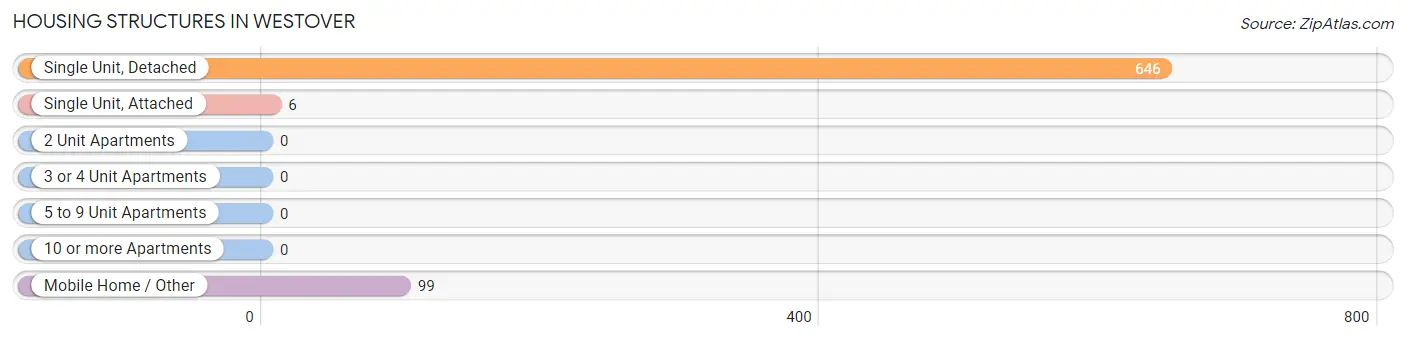
| Structure Type | # Housing Units | % Housing Units |
| Single Unit, Detached | 646 | 86.0% |
| Single Unit, Attached | 6 | 0.8% |
| 2 Unit Apartments | 0 | 0.0% |
| 3 or 4 Unit Apartments | 0 | 0.0% |
| 5 to 9 Unit Apartments | 0 | 0.0% |
| 10 or more Apartments | 0 | 0.0% |
| Mobile Home / Other | 99 | 13.2% |
| Total | 751 | 100.0% |
Housing Structures by Occupancy in Westover
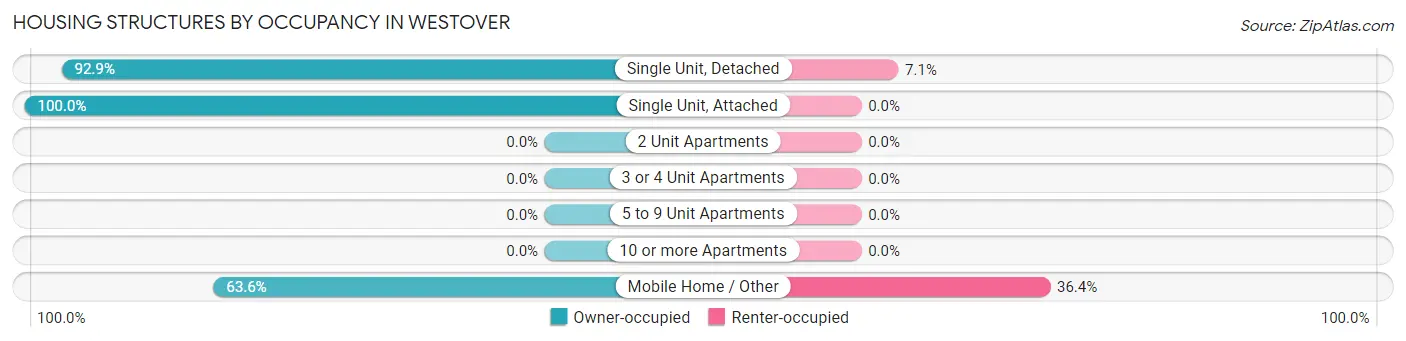
| Structure Type | Owner-occupied | Renter-occupied |
| Single Unit, Detached | 600 (92.9%) | 46 (7.1%) |
| Single Unit, Attached | 6 (100.0%) | 0 (0.0%) |
| 2 Unit Apartments | 0 (0.0%) | 0 (0.0%) |
| 3 or 4 Unit Apartments | 0 (0.0%) | 0 (0.0%) |
| 5 to 9 Unit Apartments | 0 (0.0%) | 0 (0.0%) |
| 10 or more Apartments | 0 (0.0%) | 0 (0.0%) |
| Mobile Home / Other | 63 (63.6%) | 36 (36.4%) |
| Total | 669 (89.1%) | 82 (10.9%) |
Housing Structures by Number of Rooms in Westover
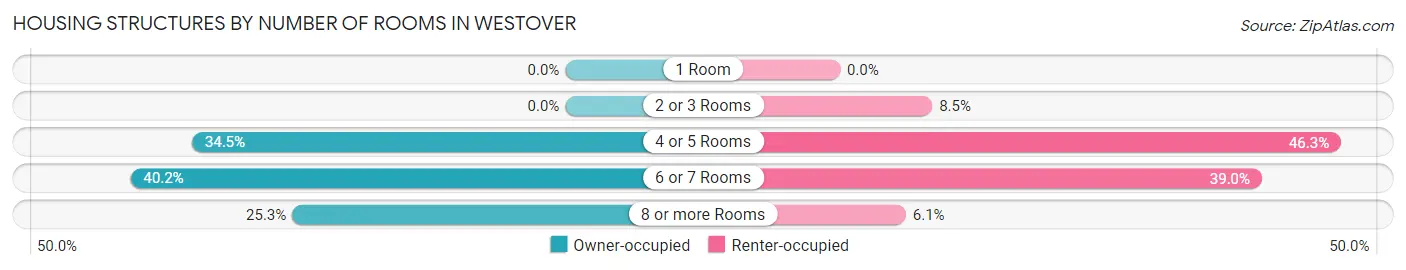
| Number of Rooms | Owner-occupied | Renter-occupied |
| 1 Room | 0 (0.0%) | 0 (0.0%) |
| 2 or 3 Rooms | 0 (0.0%) | 7 (8.5%) |
| 4 or 5 Rooms | 231 (34.5%) | 38 (46.3%) |
| 6 or 7 Rooms | 269 (40.2%) | 32 (39.0%) |
| 8 or more Rooms | 169 (25.3%) | 5 (6.1%) |
| Total | 669 (100.0%) | 82 (100.0%) |
Housing Structure by Heating Type in Westover
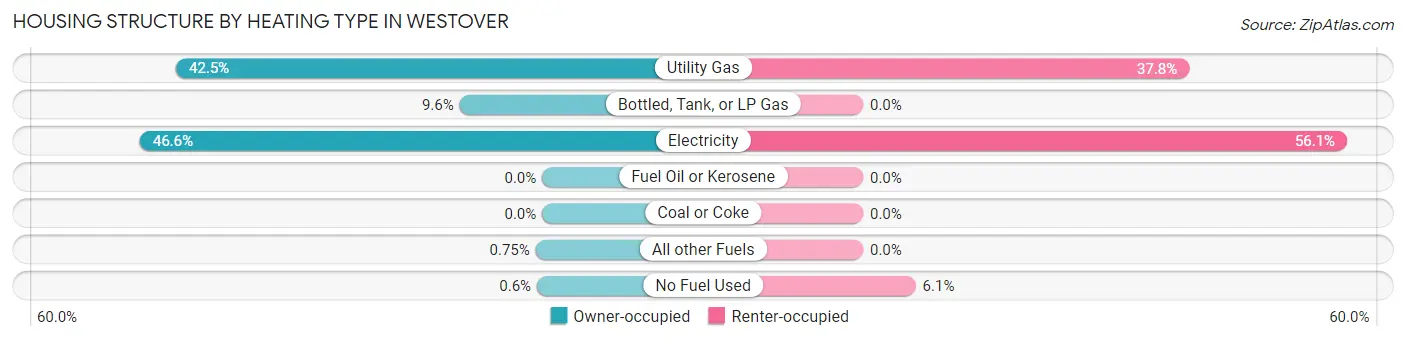
| Heating Type | Owner-occupied | Renter-occupied |
| Utility Gas | 284 (42.4%) | 31 (37.8%) |
| Bottled, Tank, or LP Gas | 64 (9.6%) | 0 (0.0%) |
| Electricity | 312 (46.6%) | 46 (56.1%) |
| Fuel Oil or Kerosene | 0 (0.0%) | 0 (0.0%) |
| Coal or Coke | 0 (0.0%) | 0 (0.0%) |
| All other Fuels | 5 (0.7%) | 0 (0.0%) |
| No Fuel Used | 4 (0.6%) | 5 (6.1%) |
| Total | 669 (100.0%) | 82 (100.0%) |
Household Vehicle Usage in Westover
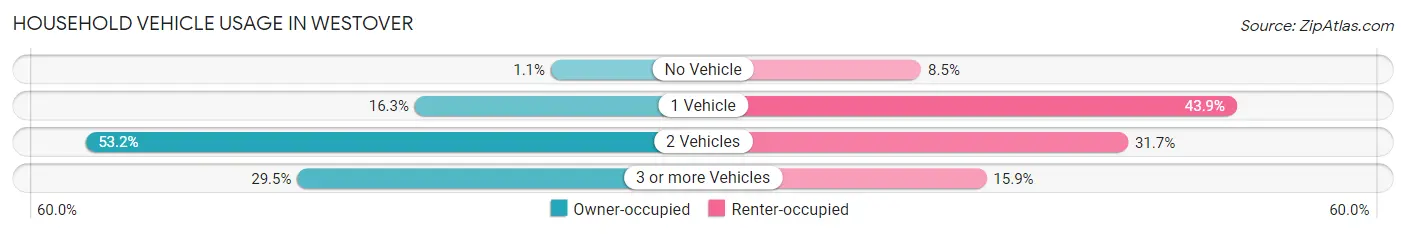
| Vehicles per Household | Owner-occupied | Renter-occupied |
| No Vehicle | 7 (1.1%) | 7 (8.5%) |
| 1 Vehicle | 109 (16.3%) | 36 (43.9%) |
| 2 Vehicles | 356 (53.2%) | 26 (31.7%) |
| 3 or more Vehicles | 197 (29.4%) | 13 (15.9%) |
| Total | 669 (100.0%) | 82 (100.0%) |
Real Estate & Mortgages in Westover
Real Estate and Mortgage Overview in Westover
| Characteristic | Without Mortgage | With Mortgage |
| Housing Units | 211 | 458 |
| Median Property Value | $210,500 | $280,700 |
| Median Household Income | $44,432 | $131 |
| Monthly Housing Costs | $428 | $4 |
| Real Estate Taxes | $716 | $38 |
Property Value by Mortgage Status in Westover
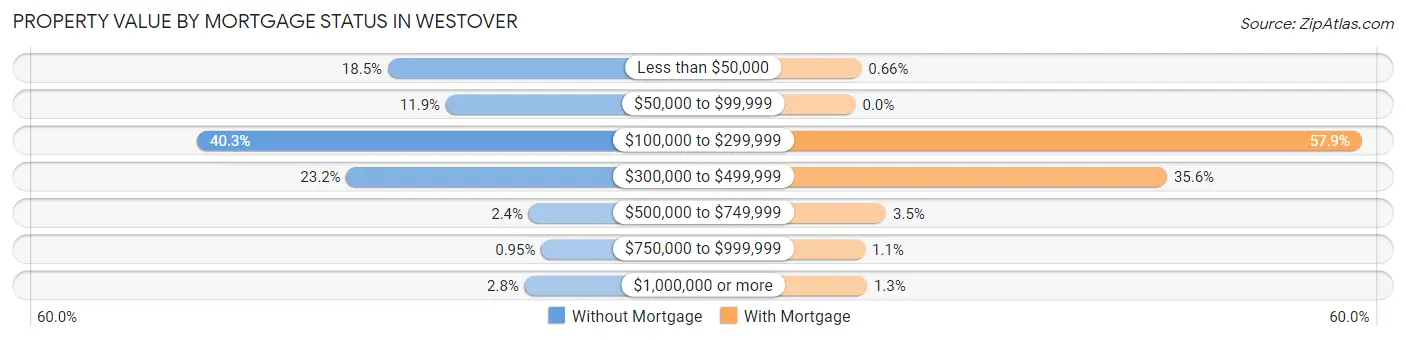
| Property Value | Without Mortgage | With Mortgage |
| Less than $50,000 | 39 (18.5%) | 3 (0.7%) |
| $50,000 to $99,999 | 25 (11.8%) | 0 (0.0%) |
| $100,000 to $299,999 | 85 (40.3%) | 265 (57.9%) |
| $300,000 to $499,999 | 49 (23.2%) | 163 (35.6%) |
| $500,000 to $749,999 | 5 (2.4%) | 16 (3.5%) |
| $750,000 to $999,999 | 2 (0.9%) | 5 (1.1%) |
| $1,000,000 or more | 6 (2.8%) | 6 (1.3%) |
| Total | 211 (100.0%) | 458 (100.0%) |
Household Income by Mortgage Status in Westover
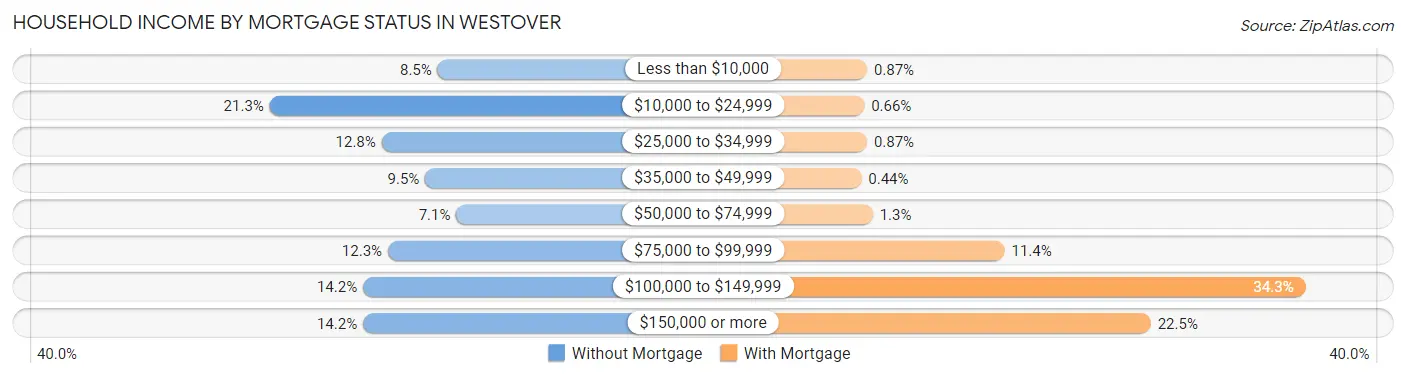
| Household Income | Without Mortgage | With Mortgage |
| Less than $10,000 | 18 (8.5%) | 4 (0.9%) |
| $10,000 to $24,999 | 45 (21.3%) | 3 (0.7%) |
| $25,000 to $34,999 | 27 (12.8%) | 4 (0.9%) |
| $35,000 to $49,999 | 20 (9.5%) | 2 (0.4%) |
| $50,000 to $74,999 | 15 (7.1%) | 6 (1.3%) |
| $75,000 to $99,999 | 26 (12.3%) | 52 (11.4%) |
| $100,000 to $149,999 | 30 (14.2%) | 157 (34.3%) |
| $150,000 or more | 30 (14.2%) | 103 (22.5%) |
| Total | 211 (100.0%) | 458 (100.0%) |
Property Value to Household Income Ratio in Westover
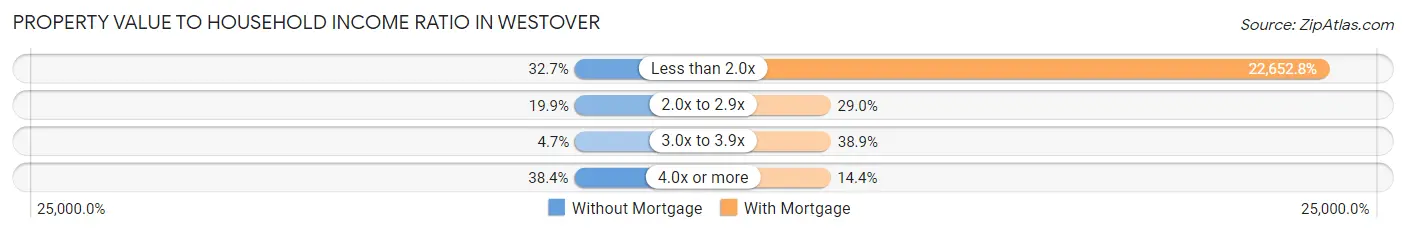
| Value-to-Income Ratio | Without Mortgage | With Mortgage |
| Less than 2.0x | 69 (32.7%) | 103,750 (22,652.8%) |
| 2.0x to 2.9x | 42 (19.9%) | 133 (29.0%) |
| 3.0x to 3.9x | 10 (4.7%) | 178 (38.9%) |
| 4.0x or more | 81 (38.4%) | 66 (14.4%) |
| Total | 211 (100.0%) | 458 (100.0%) |
Real Estate Taxes by Mortgage Status in Westover
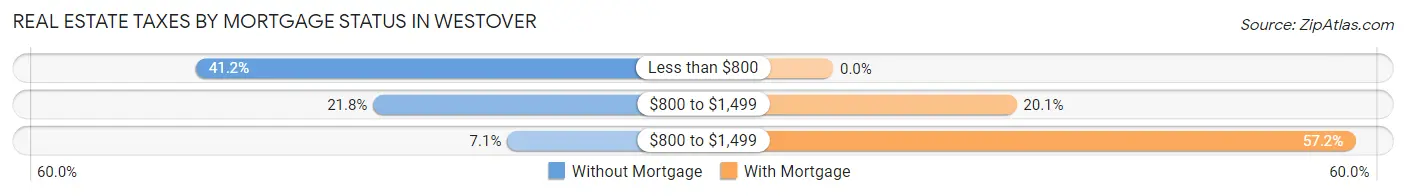
| Property Taxes | Without Mortgage | With Mortgage |
| Less than $800 | 87 (41.2%) | 0 (0.0%) |
| $800 to $1,499 | 46 (21.8%) | 92 (20.1%) |
| $800 to $1,499 | 15 (7.1%) | 262 (57.2%) |
| Total | 211 (100.0%) | 458 (100.0%) |
Health & Disability in Westover
Health Insurance Coverage by Age in Westover
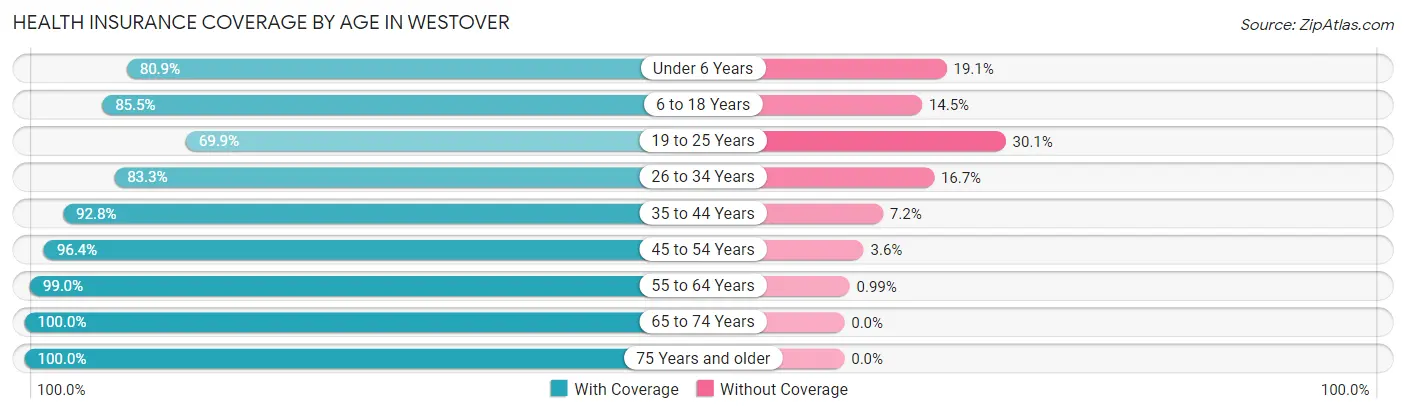
| Age Bracket | With Coverage | Without Coverage |
| Under 6 Years | 242 (80.9%) | 57 (19.1%) |
| 6 to 18 Years | 449 (85.5%) | 76 (14.5%) |
| 19 to 25 Years | 93 (69.9%) | 40 (30.1%) |
| 26 to 34 Years | 244 (83.3%) | 49 (16.7%) |
| 35 to 44 Years | 322 (92.8%) | 25 (7.2%) |
| 45 to 54 Years | 321 (96.4%) | 12 (3.6%) |
| 55 to 64 Years | 200 (99.0%) | 2 (1.0%) |
| 65 to 74 Years | 121 (100.0%) | 0 (0.0%) |
| 75 Years and older | 136 (100.0%) | 0 (0.0%) |
| Total | 2,128 (89.1%) | 261 (10.9%) |
Health Insurance Coverage by Citizenship Status in Westover
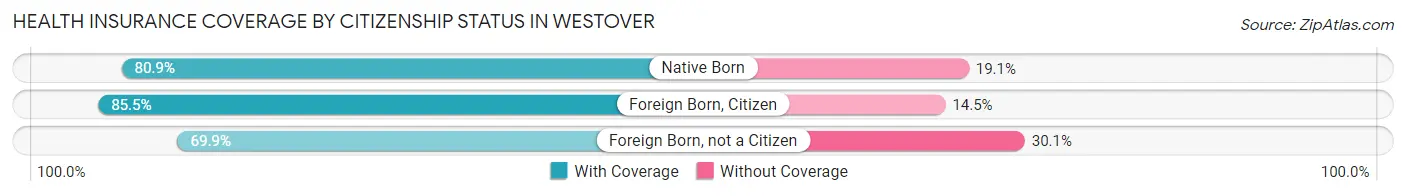
| Citizenship Status | With Coverage | Without Coverage |
| Native Born | 242 (80.9%) | 57 (19.1%) |
| Foreign Born, Citizen | 449 (85.5%) | 76 (14.5%) |
| Foreign Born, not a Citizen | 93 (69.9%) | 40 (30.1%) |
Health Insurance Coverage by Household Income in Westover
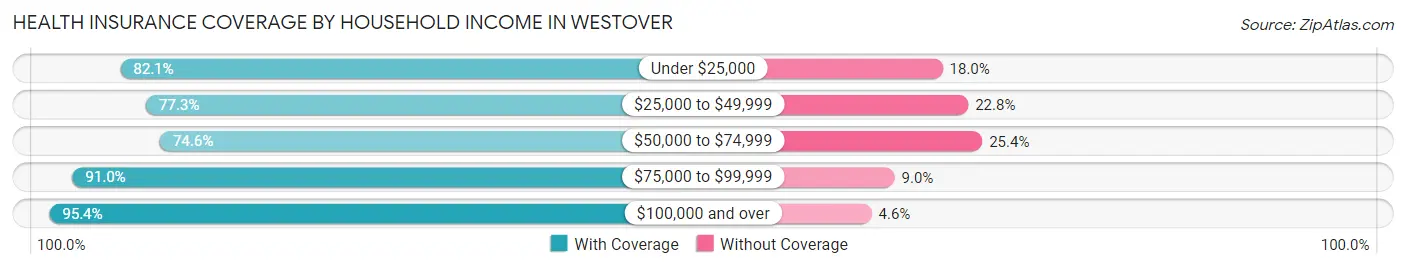
| Household Income | With Coverage | Without Coverage |
| Under $25,000 | 128 (82.1%) | 28 (17.9%) |
| $25,000 to $49,999 | 129 (77.2%) | 38 (22.8%) |
| $50,000 to $74,999 | 253 (74.6%) | 86 (25.4%) |
| $75,000 to $99,999 | 610 (91.0%) | 60 (9.0%) |
| $100,000 and over | 1,008 (95.4%) | 49 (4.6%) |
Public vs Private Health Insurance Coverage by Age in Westover
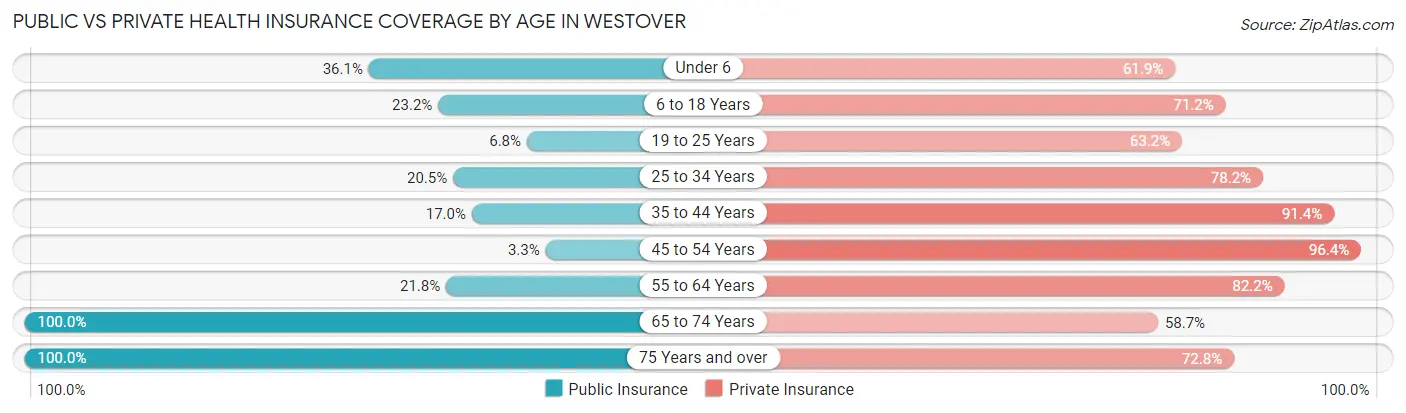
| Age Bracket | Public Insurance | Private Insurance |
| Under 6 | 108 (36.1%) | 185 (61.9%) |
| 6 to 18 Years | 122 (23.2%) | 374 (71.2%) |
| 19 to 25 Years | 9 (6.8%) | 84 (63.2%) |
| 25 to 34 Years | 60 (20.5%) | 229 (78.2%) |
| 35 to 44 Years | 59 (17.0%) | 317 (91.3%) |
| 45 to 54 Years | 11 (3.3%) | 321 (96.4%) |
| 55 to 64 Years | 44 (21.8%) | 166 (82.2%) |
| 65 to 74 Years | 121 (100.0%) | 71 (58.7%) |
| 75 Years and over | 136 (100.0%) | 99 (72.8%) |
| Total | 670 (28.1%) | 1,846 (77.3%) |
Disability Status by Sex by Age in Westover
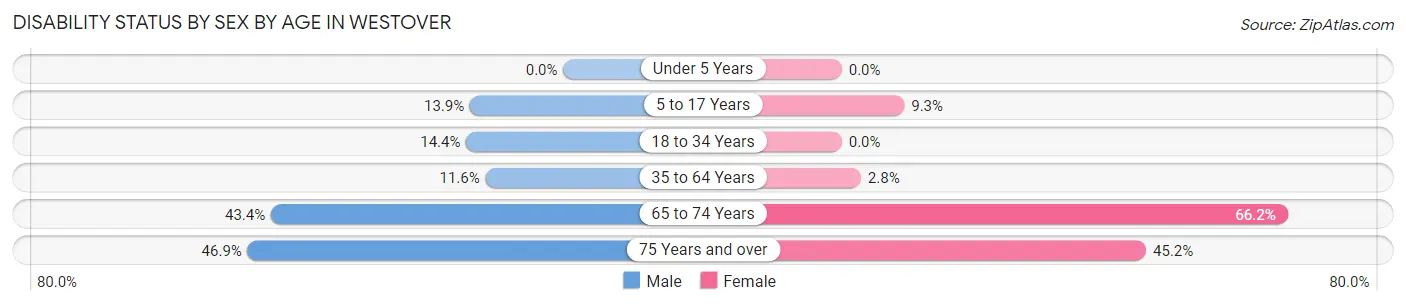
| Age Bracket | Male | Female |
| Under 5 Years | 0 (0.0%) | 0 (0.0%) |
| 5 to 17 Years | 32 (13.9%) | 27 (9.3%) |
| 18 to 34 Years | 33 (14.4%) | 0 (0.0%) |
| 35 to 64 Years | 53 (11.6%) | 12 (2.8%) |
| 65 to 74 Years | 23 (43.4%) | 45 (66.2%) |
| 75 Years and over | 15 (46.9%) | 47 (45.2%) |
Disability Class by Sex by Age in Westover
Disability Class: Hearing Difficulty
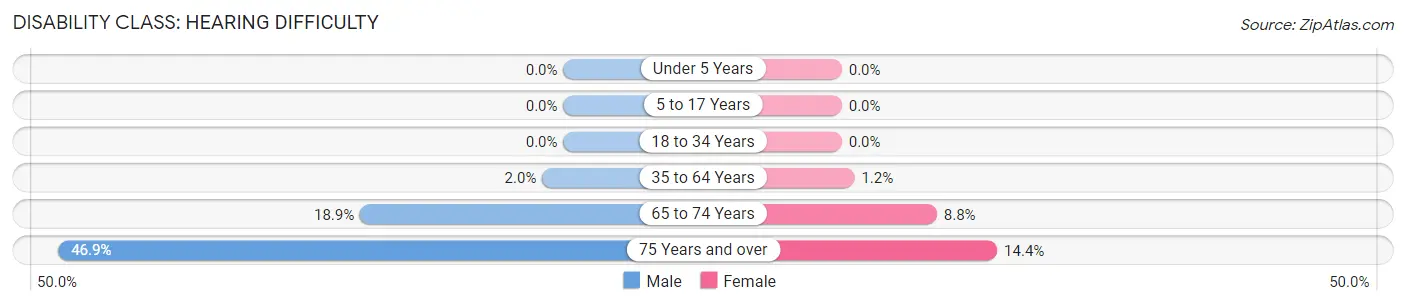
| Age Bracket | Male | Female |
| Under 5 Years | 0 (0.0%) | 0 (0.0%) |
| 5 to 17 Years | 0 (0.0%) | 0 (0.0%) |
| 18 to 34 Years | 0 (0.0%) | 0 (0.0%) |
| 35 to 64 Years | 9 (2.0%) | 5 (1.2%) |
| 65 to 74 Years | 10 (18.9%) | 6 (8.8%) |
| 75 Years and over | 15 (46.9%) | 15 (14.4%) |
Disability Class: Vision Difficulty
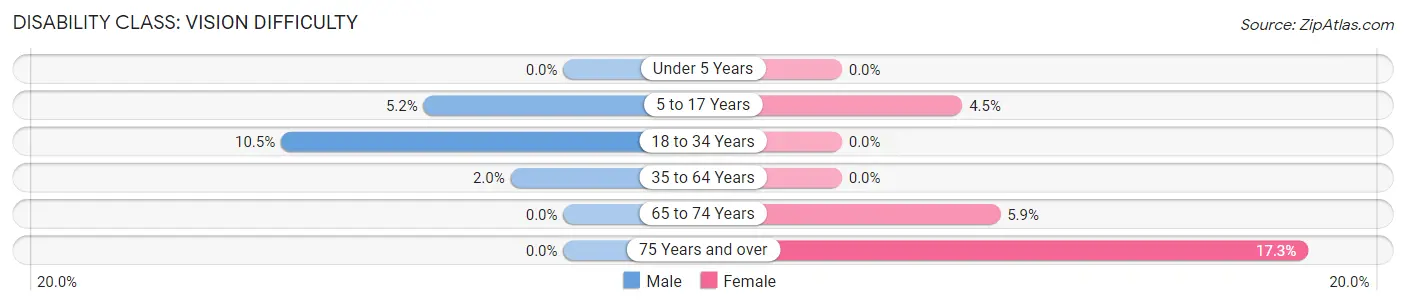
| Age Bracket | Male | Female |
| Under 5 Years | 0 (0.0%) | 0 (0.0%) |
| 5 to 17 Years | 12 (5.2%) | 13 (4.5%) |
| 18 to 34 Years | 24 (10.5%) | 0 (0.0%) |
| 35 to 64 Years | 9 (2.0%) | 0 (0.0%) |
| 65 to 74 Years | 0 (0.0%) | 4 (5.9%) |
| 75 Years and over | 0 (0.0%) | 18 (17.3%) |
Disability Class: Cognitive Difficulty
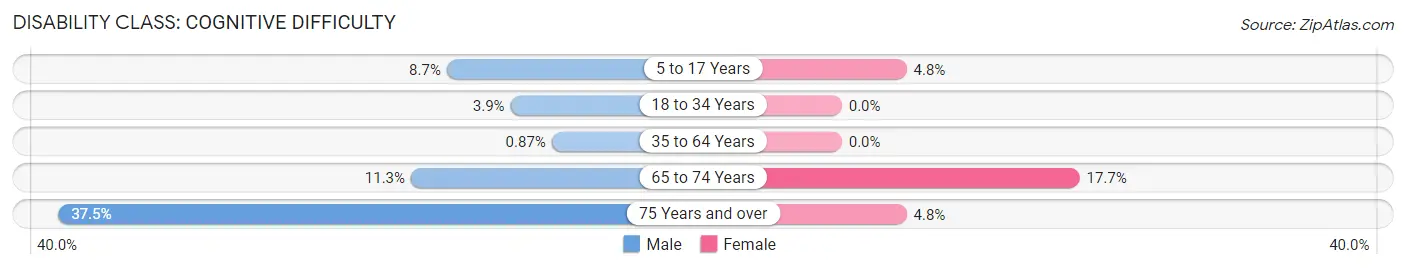
| Age Bracket | Male | Female |
| 5 to 17 Years | 20 (8.7%) | 14 (4.8%) |
| 18 to 34 Years | 9 (3.9%) | 0 (0.0%) |
| 35 to 64 Years | 4 (0.9%) | 0 (0.0%) |
| 65 to 74 Years | 6 (11.3%) | 12 (17.6%) |
| 75 Years and over | 12 (37.5%) | 5 (4.8%) |
Disability Class: Ambulatory Difficulty
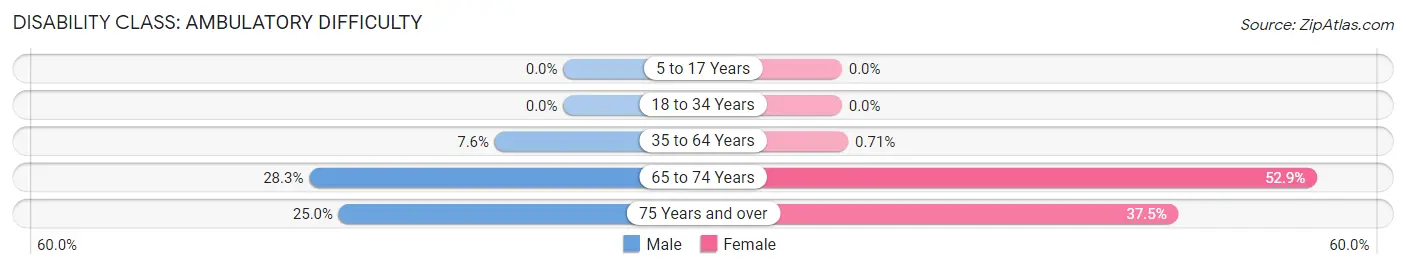
| Age Bracket | Male | Female |
| 5 to 17 Years | 0 (0.0%) | 0 (0.0%) |
| 18 to 34 Years | 0 (0.0%) | 0 (0.0%) |
| 35 to 64 Years | 35 (7.6%) | 3 (0.7%) |
| 65 to 74 Years | 15 (28.3%) | 36 (52.9%) |
| 75 Years and over | 8 (25.0%) | 39 (37.5%) |
Disability Class: Self-Care Difficulty
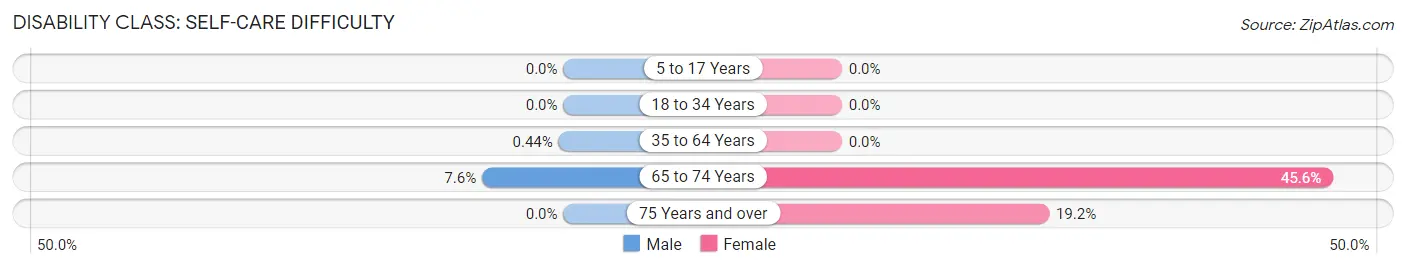
| Age Bracket | Male | Female |
| 5 to 17 Years | 0 (0.0%) | 0 (0.0%) |
| 18 to 34 Years | 0 (0.0%) | 0 (0.0%) |
| 35 to 64 Years | 2 (0.4%) | 0 (0.0%) |
| 65 to 74 Years | 4 (7.5%) | 31 (45.6%) |
| 75 Years and over | 0 (0.0%) | 20 (19.2%) |
Technology Access in Westover
Computing Device Access in Westover
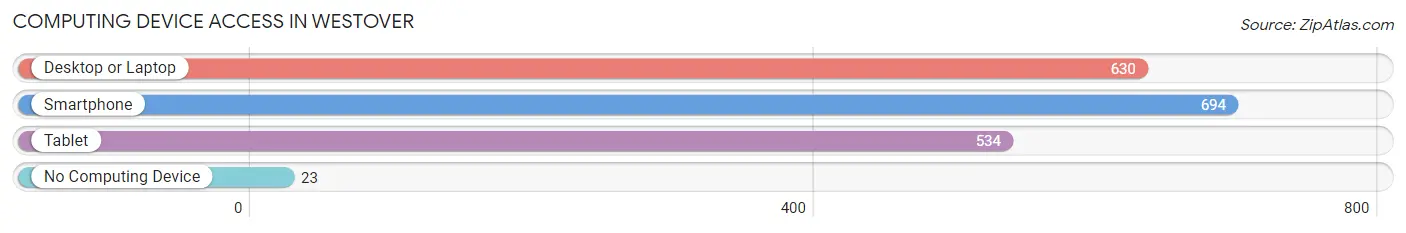
| Device Type | # Households | % Households |
| Desktop or Laptop | 630 | 83.9% |
| Smartphone | 694 | 92.4% |
| Tablet | 534 | 71.1% |
| No Computing Device | 23 | 3.1% |
| Total | 751 | 100.0% |
Internet Access in Westover
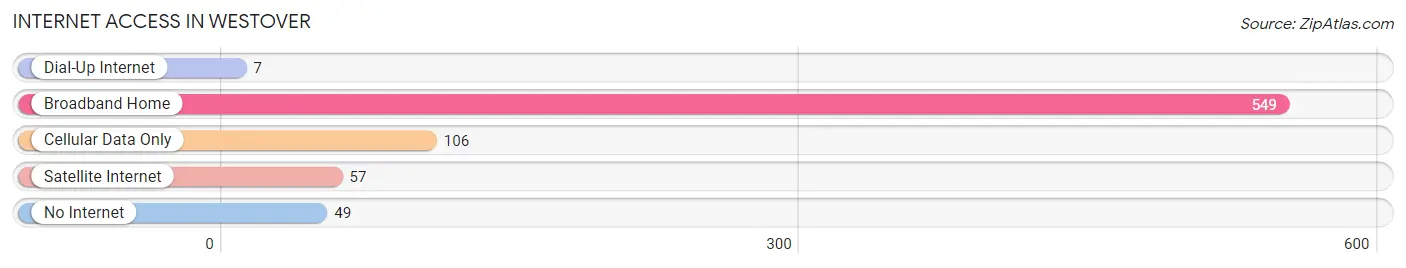
| Internet Type | # Households | % Households |
| Dial-Up Internet | 7 | 0.9% |
| Broadband Home | 549 | 73.1% |
| Cellular Data Only | 106 | 14.1% |
| Satellite Internet | 57 | 7.6% |
| No Internet | 49 | 6.5% |
| Total | 751 | 100.0% |
Westover Summary
Westover is a small town located in the state of Alabama, in the United States. It is situated in the northwest corner of the state, in the foothills of the Appalachian Mountains. The town is located in the county of Walker, and is part of the Birmingham-Hoover Metropolitan Statistical Area. As of the 2010 census, the population of Westover was 1,845.
History
Westover was founded in 1887 by a group of settlers from Georgia. The town was named after the nearby Westover Plantation, which was owned by the family of William Westover. The town was incorporated in 1891, and the first mayor was William Westover.
The town grew slowly, but steadily, over the years. In the early 1900s, the town was home to several businesses, including a sawmill, a gristmill, a cotton gin, and a general store. The town also had a post office, a bank, and a hotel.
In the 1920s, the town began to experience a period of growth. The population increased from around 500 in 1920 to over 1,000 in 1930. This growth was due in part to the development of the nearby coal mines. The coal industry provided jobs for many of the town's residents, and the town's economy flourished.
In the 1950s, the town experienced a period of decline. The coal industry began to decline, and many of the town's businesses closed. The population decreased from 1,000 in 1950 to just over 800 in 1960.
In the 1970s, the town began to experience a period of revitalization. The town's economy was bolstered by the opening of a new factory, and the population began to increase. By the 1990s, the population had grown to over 1,500.
Geography
Westover is located in the northwest corner of Alabama, in the foothills of the Appalachian Mountains. The town is situated in the county of Walker, and is part of the Birmingham-Hoover Metropolitan Statistical Area. The town is located at an elevation of 845 feet above sea level.
The town is located near several major highways, including Interstate 65, U.S. Route 78, and Alabama State Route 79. The town is also located near several major cities, including Birmingham, Huntsville, and Montgomery.
Economy
The economy of Westover is largely based on manufacturing. The town is home to several factories, including a paper mill, a plastics plant, and a metal fabrication plant. The town is also home to several retail stores, restaurants, and other businesses.
The town is also home to several farms, which produce a variety of crops, including corn, soybeans, and cotton. The town is also home to several timber companies, which harvest timber from the nearby forests.
Demographics
As of the 2010 census, the population of Westover was 1,845. The racial makeup of the town was 95.3% White, 1.7% African American, 0.3% Native American, 0.3% Asian, 0.1% Pacific Islander, 0.7% from other races, and 1.6% from two or more races. Hispanic or Latino of any race were 2.2% of the population.
The median household income in Westover was $37,917, and the median family income was $45,938. The per capita income in Westover was $18,945. About 11.3% of families and 14.2% of the population were below the poverty line, including 19.2% of those under age 18 and 8.3% of those age 65 or over.
Common Questions
What is the Total Population of Westover?
Total Population of Westover is 2,404.
What is the Total Male Population of Westover?
Total Male Population of Westover is 1,151.
What is the Total Female Population of Westover?
Total Female Population of Westover is 1,253.
What is the Ratio of Males per 100 Females in Westover?
There are 91.86 Males per 100 Females in Westover.
What is the Ratio of Females per 100 Males in Westover?
There are 108.86 Females per 100 Males in Westover.
What is the Median Population Age in Westover?
Median Population Age in Westover is 34.2 Years.
What is the Average Family Size in Westover
Average Family Size in Westover is 3.5 People.
What is the Average Household Size in Westover
Average Household Size in Westover is 3.2 People.
What is Per Capita Income in Westover?
Per Capita income in Westover is $37,661.
What is the Median Family Income in Westover?
Median Family Income in Westover is $95,577.
What is the Median Household income in Westover?
Median Household Income in Westover is $87,772.
What is Income or Wage Gap in Westover?
Income or Wage Gap in Westover is 28.8%.
Women in Westover earn 71.2 cents for every dollar earned by a man.
What is Inequality or Gini Index in Westover?
Inequality or Gini Index in Westover is 0.41.
How Large is the Labor Force in Westover?
There are 1,174 People in the Labor Forcein in Westover.
What is the Percentage of People in the Labor Force in Westover?
69.9% of People are in the Labor Force in Westover.
What is the Unemployment Rate in Westover?
Unemployment Rate in Westover is 2.5%.