Section, AL Map & Demographics
Section Map
Section Overview
$25,631
PER CAPITA INCOME
$46,000
AVG FAMILY INCOME
$31,250
AVG HOUSEHOLD INCOME
24.1%
WAGE / INCOME GAP [ % ]
75.9¢/ $1
WAGE / INCOME GAP [ $ ]
0.46
INEQUALITY / GINI INDEX
828
TOTAL POPULATION
445
MALE POPULATION
383
FEMALE POPULATION
116.19
MALES / 100 FEMALES
86.07
FEMALES / 100 MALES
44.4
MEDIAN AGE
3.4
AVG FAMILY SIZE
2.5
AVG HOUSEHOLD SIZE
316
LABOR FORCE [ PEOPLE ]
48.2%
PERCENT IN LABOR FORCE
3.5%
UNEMPLOYMENT RATE
Section Zip Codes
Section Area Codes
Income in Section
Income Overview in Section
Per Capita Income in Section is $25,631, while median incomes of families and households are $46,000 and $31,250 respectively.
| Characteristic | Number | Measure |
| Per Capita Income | 828 | $25,631 |
| Median Family Income | 208 | $46,000 |
| Mean Family Income | 208 | $63,318 |
| Median Household Income | 328 | $31,250 |
| Mean Household Income | 328 | $50,656 |
| Income Deficit | 208 | $0 |
| Wage / Income Gap (%) | 828 | 24.10% |
| Wage / Income Gap ($) | 828 | 75.90¢ per $1 |
| Gini / Inequality Index | 828 | 0.46 |
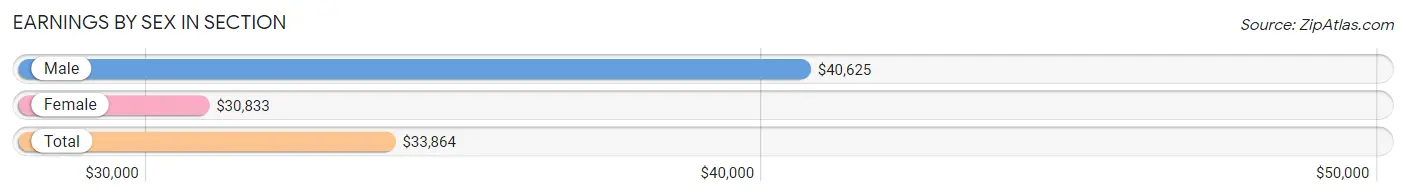
Earnings by Sex in Section
Average Earnings in Section are $33,864, $40,625 for men and $30,833 for women, a difference of 24.1%.
| Sex | Number | Average Earnings |
| Male | 222 (67.3%) | $40,625 |
| Female | 108 (32.7%) | $30,833 |
| Total | 330 (100.0%) | $33,864 |
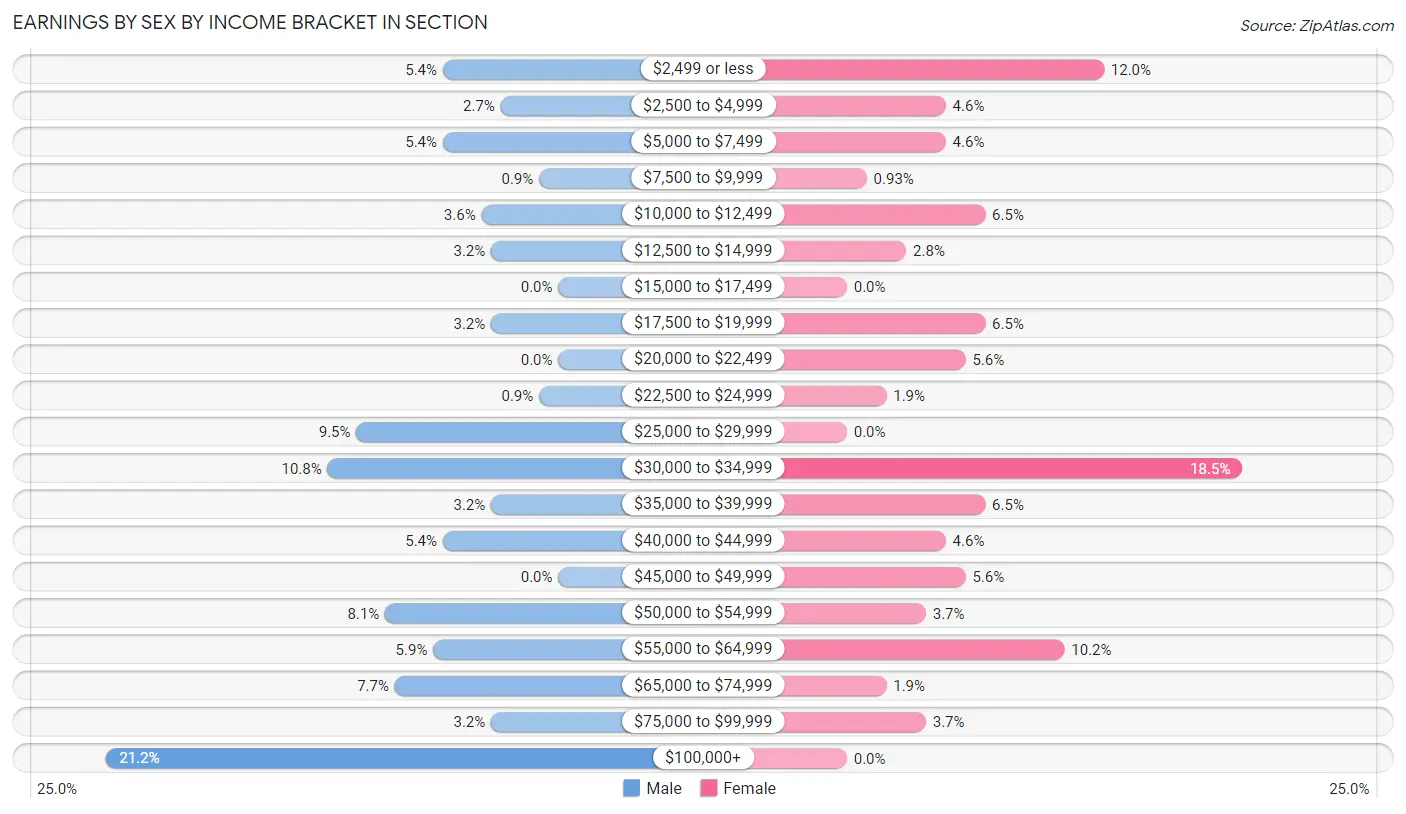
Earnings by Sex by Income Bracket in Section
The most common earnings brackets in Section are $100,000+ for men (47 | 21.2%) and $30,000 to $34,999 for women (20 | 18.5%).
| Income | Male | Female |
| $2,499 or less | 12 (5.4%) | 13 (12.0%) |
| $2,500 to $4,999 | 6 (2.7%) | 5 (4.6%) |
| $5,000 to $7,499 | 12 (5.4%) | 5 (4.6%) |
| $7,500 to $9,999 | 2 (0.9%) | 1 (0.9%) |
| $10,000 to $12,499 | 8 (3.6%) | 7 (6.5%) |
| $12,500 to $14,999 | 7 (3.2%) | 3 (2.8%) |
| $15,000 to $17,499 | 0 (0.0%) | 0 (0.0%) |
| $17,500 to $19,999 | 7 (3.2%) | 7 (6.5%) |
| $20,000 to $22,499 | 0 (0.0%) | 6 (5.6%) |
| $22,500 to $24,999 | 2 (0.9%) | 2 (1.8%) |
| $25,000 to $29,999 | 21 (9.5%) | 0 (0.0%) |
| $30,000 to $34,999 | 24 (10.8%) | 20 (18.5%) |
| $35,000 to $39,999 | 7 (3.2%) | 7 (6.5%) |
| $40,000 to $44,999 | 12 (5.4%) | 5 (4.6%) |
| $45,000 to $49,999 | 0 (0.0%) | 6 (5.6%) |
| $50,000 to $54,999 | 18 (8.1%) | 4 (3.7%) |
| $55,000 to $64,999 | 13 (5.9%) | 11 (10.2%) |
| $65,000 to $74,999 | 17 (7.7%) | 2 (1.8%) |
| $75,000 to $99,999 | 7 (3.2%) | 4 (3.7%) |
| $100,000+ | 47 (21.2%) | 0 (0.0%) |
| Total | 222 (100.0%) | 108 (100.0%) |
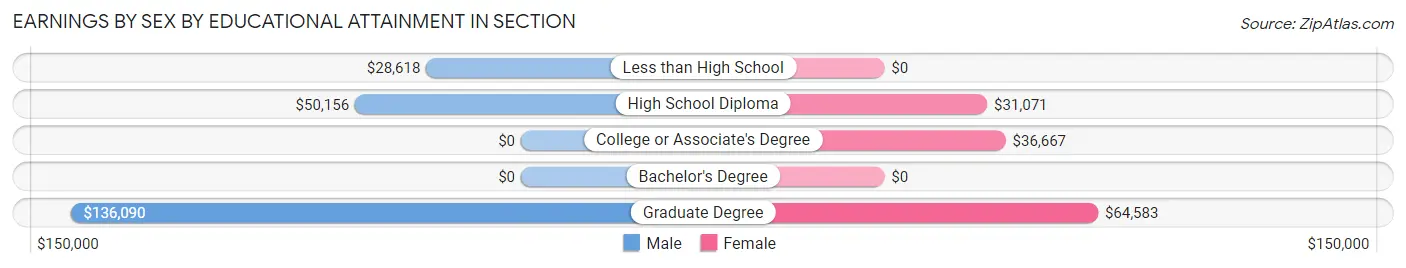
Earnings by Sex by Educational Attainment in Section
Average earnings in Section are $50,250 for men and $33,750 for women, a difference of 32.8%. Men with an educational attainment of graduate degree enjoy the highest average annual earnings of $136,090, while those with less than high school education earn the least with $28,618. Women with an educational attainment of graduate degree earn the most with the average annual earnings of $64,583, while those with high school diploma education have the smallest earnings of $31,071.
| Educational Attainment | Male Income | Female Income |
| Less than High School | $28,618 | $0 |
| High School Diploma | $50,156 | $31,071 |
| College or Associate's Degree | - | - |
| Bachelor's Degree | - | - |
| Graduate Degree | $136,090 | $64,583 |
| Total | $50,250 | $33,750 |
Family Income in Section
Family Income Brackets in Section
According to the Section family income data, there are 42 families falling into the $25,000 to $34,999 income range, which is the most common income bracket and makes up 20.2% of all families. Conversely, the less than $10,000 income bracket is the least frequent group with only 2 families (1.0%) belonging to this category.
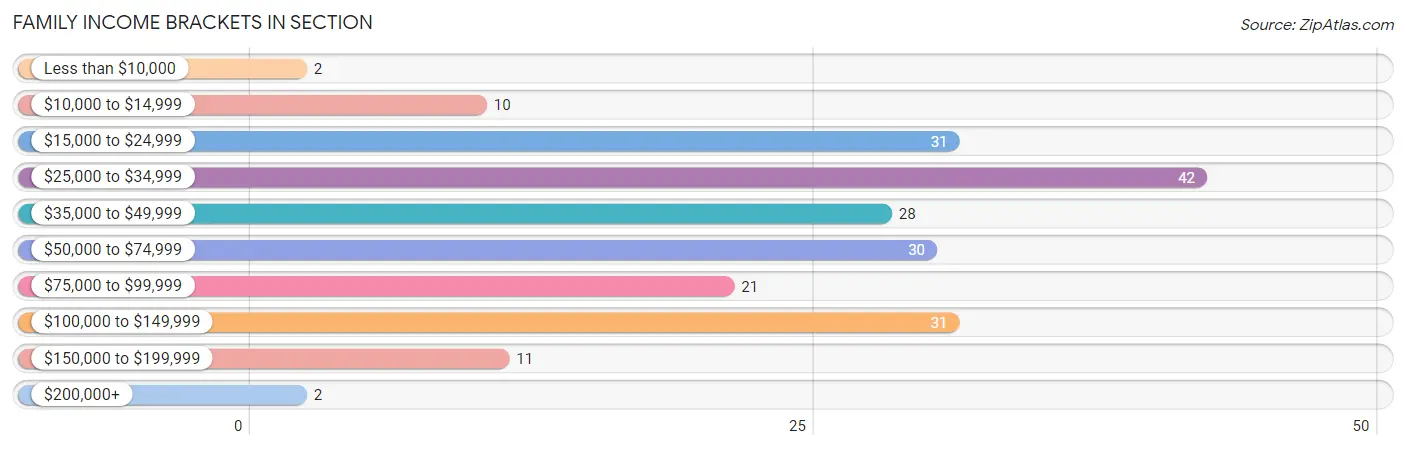
| Income Bracket | # Families | % Families |
| Less than $10,000 | 2 | 1.0% |
| $10,000 to $14,999 | 10 | 4.8% |
| $15,000 to $24,999 | 31 | 14.9% |
| $25,000 to $34,999 | 42 | 20.2% |
| $35,000 to $49,999 | 28 | 13.5% |
| $50,000 to $74,999 | 30 | 14.4% |
| $75,000 to $99,999 | 21 | 10.1% |
| $100,000 to $149,999 | 31 | 14.9% |
| $150,000 to $199,999 | 11 | 5.3% |
| $200,000+ | 2 | 1.0% |
Family Income by Famaliy Size in Section
5-person families (8 | 3.8%) account for the highest median family income in Section with $160,625 per family, while 5-person families (8 | 3.8%) have the highest median income of $32,125 per family member.
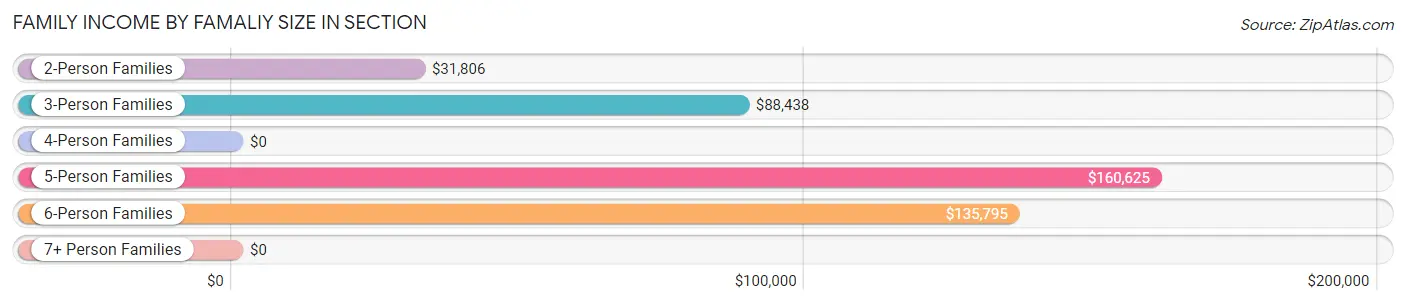
| Income Bracket | # Families | Median Income |
| 2-Person Families | 129 (62.0%) | $31,806 |
| 3-Person Families | 31 (14.9%) | $88,438 |
| 4-Person Families | 21 (10.1%) | $0 |
| 5-Person Families | 8 (3.8%) | $160,625 |
| 6-Person Families | 19 (9.1%) | $135,795 |
| 7+ Person Families | 0 (0.0%) | $0 |
| Total | 208 (100.0%) | $46,000 |
Family Income by Number of Earners in Section
The median family income in Section is $46,000, with families comprising 2 earners (48) having the highest median family income of $97,778, while families with no earners (67) have the lowest median family income of $22,917, accounting for 23.1% and 32.2% of families, respectively.
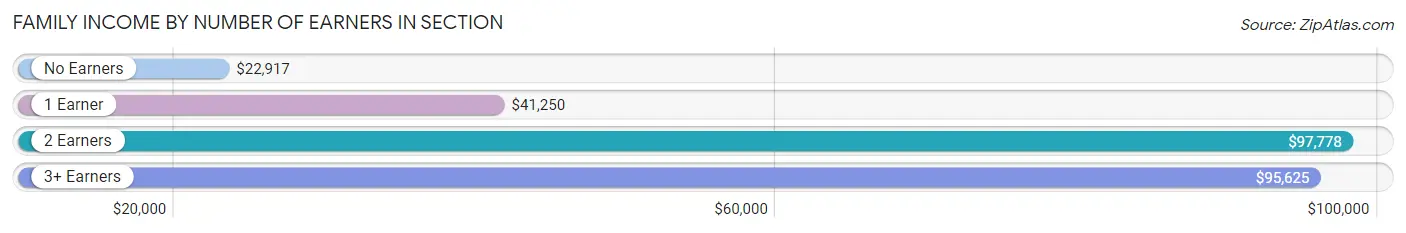
| Number of Earners | # Families | Median Income |
| No Earners | 67 (32.2%) | $22,917 |
| 1 Earner | 72 (34.6%) | $41,250 |
| 2 Earners | 48 (23.1%) | $97,778 |
| 3+ Earners | 21 (10.1%) | $95,625 |
| Total | 208 (100.0%) | $46,000 |
Household Income in Section
Household Income Brackets in Section
With 58 households falling in the category, the $10,000 to $14,999 income range is the most frequent in Section, accounting for 17.7% of all households. In contrast, only 2 households (0.6%) fall into the $200,000+ income bracket, making it the least populous group.
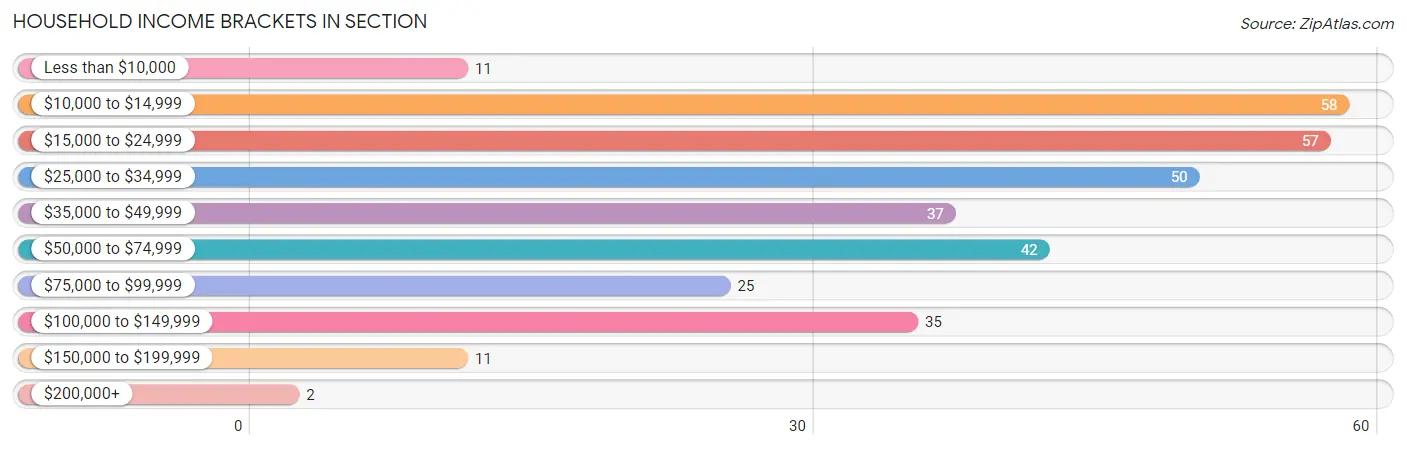
| Income Bracket | # Households | % Households |
| Less than $10,000 | 11 | 3.4% |
| $10,000 to $14,999 | 58 | 17.7% |
| $15,000 to $24,999 | 57 | 17.4% |
| $25,000 to $34,999 | 50 | 15.2% |
| $35,000 to $49,999 | 37 | 11.3% |
| $50,000 to $74,999 | 42 | 12.8% |
| $75,000 to $99,999 | 25 | 7.6% |
| $100,000 to $149,999 | 35 | 10.7% |
| $150,000 to $199,999 | 11 | 3.4% |
| $200,000+ | 2 | 0.6% |
Household Income by Householder Age in Section
The median household income in Section is $31,250, with the highest median household income of $31,667 found in the 45 to 64 years age bracket for the primary householder. A total of 90 households (27.4%) fall into this category. Meanwhile, the 15 to 24 years age bracket for the primary householder has the lowest median household income of $0, with 5 households (1.5%) in this group.
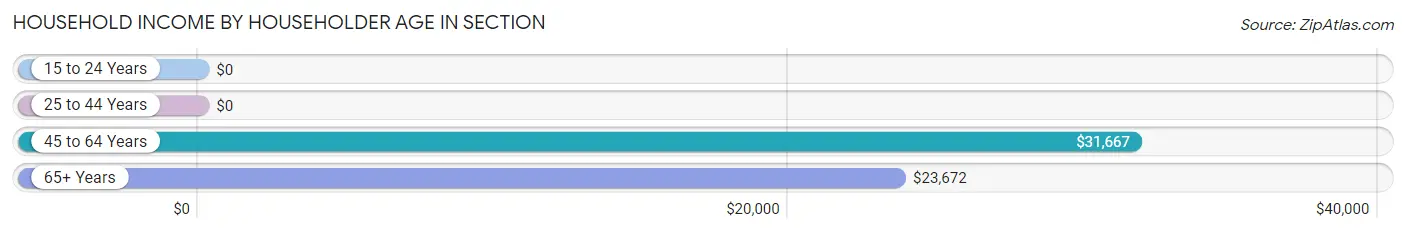
| Income Bracket | # Households | Median Income |
| 15 to 24 Years | 5 (1.5%) | $0 |
| 25 to 44 Years | 100 (30.5%) | $0 |
| 45 to 64 Years | 90 (27.4%) | $31,667 |
| 65+ Years | 133 (40.6%) | $23,672 |
| Total | 328 (100.0%) | $31,250 |
Poverty in Section
Income Below Poverty by Sex and Age in Section
With 12.4% poverty level for males and 16.5% for females among the residents of Section, 55 to 64 year old males and 6 to 11 year old females are the most vulnerable to poverty, with 14 males (32.6%) and 33 females (58.9%) in their respective age groups living below the poverty level.
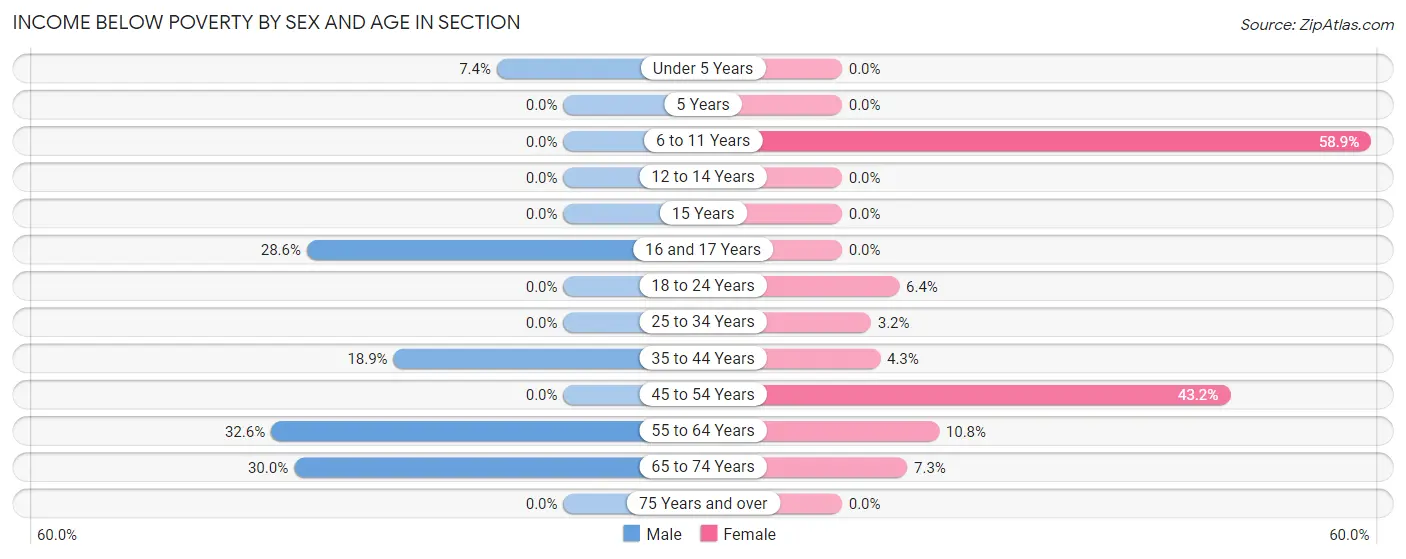
| Age Bracket | Male | Female |
| Under 5 Years | 2 (7.4%) | 0 (0.0%) |
| 5 Years | 0 (0.0%) | 0 (0.0%) |
| 6 to 11 Years | 0 (0.0%) | 33 (58.9%) |
| 12 to 14 Years | 0 (0.0%) | 0 (0.0%) |
| 15 Years | 0 (0.0%) | 0 (0.0%) |
| 16 and 17 Years | 4 (28.6%) | 0 (0.0%) |
| 18 to 24 Years | 0 (0.0%) | 3 (6.4%) |
| 25 to 34 Years | 0 (0.0%) | 1 (3.2%) |
| 35 to 44 Years | 14 (18.9%) | 2 (4.3%) |
| 45 to 54 Years | 0 (0.0%) | 16 (43.2%) |
| 55 to 64 Years | 14 (32.6%) | 4 (10.8%) |
| 65 to 74 Years | 21 (30.0%) | 4 (7.3%) |
| 75 Years and over | 0 (0.0%) | 0 (0.0%) |
| Total | 55 (12.4%) | 63 (16.5%) |
Income Above Poverty by Sex and Age in Section
According to the poverty statistics in Section, males aged 5 years and females aged under 5 years are the age groups that are most secure financially, with 100.0% of males and 100.0% of females in these age groups living above the poverty line.
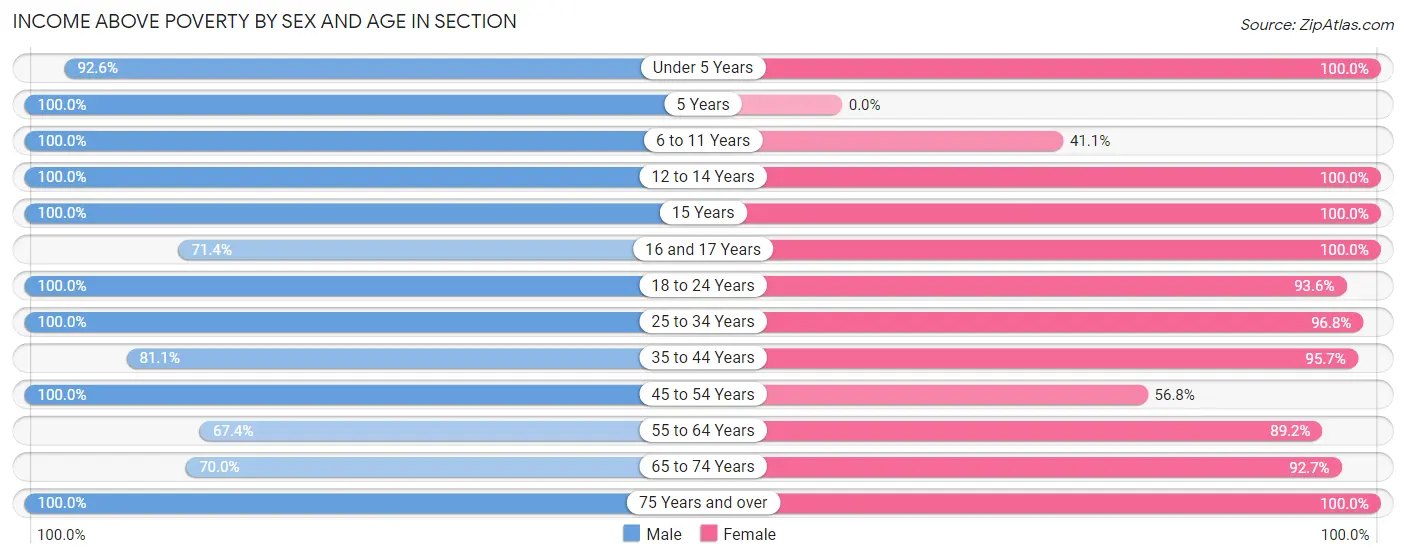
| Age Bracket | Male | Female |
| Under 5 Years | 25 (92.6%) | 18 (100.0%) |
| 5 Years | 2 (100.0%) | 0 (0.0%) |
| 6 to 11 Years | 32 (100.0%) | 23 (41.1%) |
| 12 to 14 Years | 9 (100.0%) | 3 (100.0%) |
| 15 Years | 4 (100.0%) | 21 (100.0%) |
| 16 and 17 Years | 10 (71.4%) | 4 (100.0%) |
| 18 to 24 Years | 28 (100.0%) | 44 (93.6%) |
| 25 to 34 Years | 23 (100.0%) | 30 (96.8%) |
| 35 to 44 Years | 60 (81.1%) | 45 (95.7%) |
| 45 to 54 Years | 83 (100.0%) | 21 (56.8%) |
| 55 to 64 Years | 29 (67.4%) | 33 (89.2%) |
| 65 to 74 Years | 49 (70.0%) | 51 (92.7%) |
| 75 Years and over | 36 (100.0%) | 27 (100.0%) |
| Total | 390 (87.6%) | 320 (83.6%) |
Income Below Poverty Among Married-Couple Families in Section
The poverty statistics for married-couple families in Section show that 3.1% or 5 of the total 163 families live below the poverty line. Families with 1 or 2 children have the highest poverty rate of 17.2%, comprising of 5 families. On the other hand, families with no children have the lowest poverty rate of 0.0%, which includes 0 families.
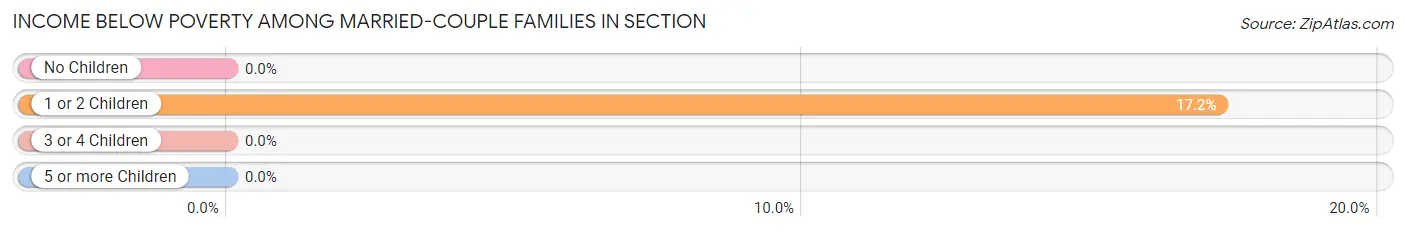
| Children | Above Poverty | Below Poverty |
| No Children | 114 (100.0%) | 0 (0.0%) |
| 1 or 2 Children | 24 (82.8%) | 5 (17.2%) |
| 3 or 4 Children | 20 (100.0%) | 0 (0.0%) |
| 5 or more Children | 0 (0.0%) | 0 (0.0%) |
| Total | 158 (96.9%) | 5 (3.1%) |
Income Below Poverty Among Single-Parent Households in Section
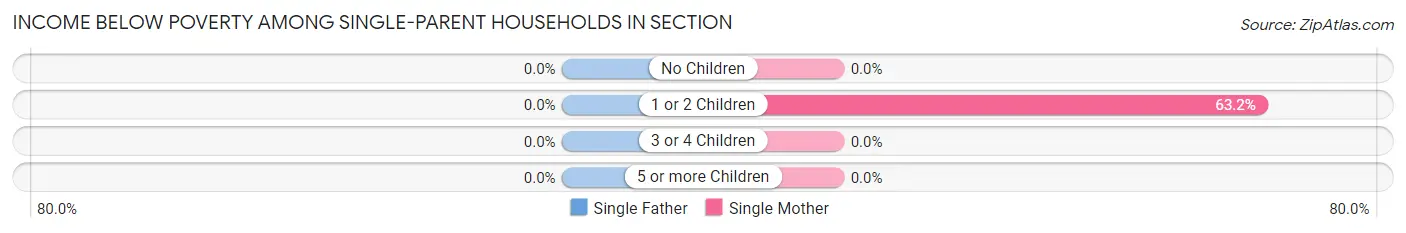
| Children | Single Father | Single Mother |
| No Children | 0 (0.0%) | 0 (0.0%) |
| 1 or 2 Children | 0 (0.0%) | 12 (63.2%) |
| 3 or 4 Children | 0 (0.0%) | 0 (0.0%) |
| 5 or more Children | 0 (0.0%) | 0 (0.0%) |
| Total | 0 (0.0%) | 12 (44.4%) |
Income Below Poverty Among Married-Couple vs Single-Parent Households in Section
The poverty data for Section shows that 5 of the married-couple family households (3.1%) and 12 of the single-parent households (26.7%) are living below the poverty level. Within the married-couple family households, those with 1 or 2 children have the highest poverty rate, with 5 households (17.2%) falling below the poverty line. Among the single-parent households, those with 1 or 2 children have the highest poverty rate, with 12 household (42.9%) living below poverty.
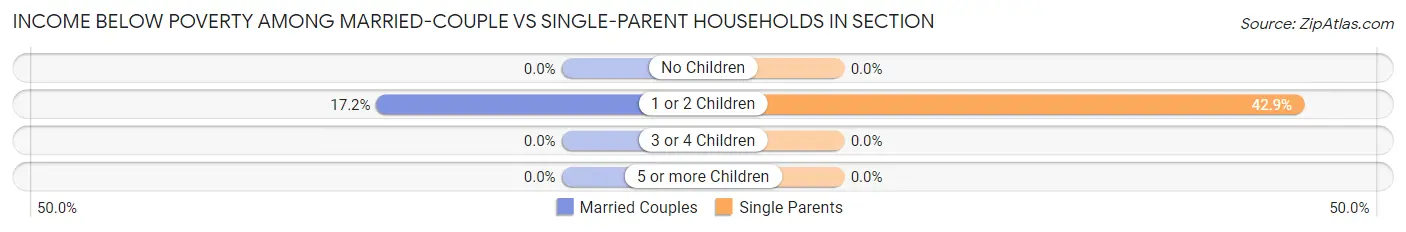
| Children | Married-Couple Families | Single-Parent Households |
| No Children | 0 (0.0%) | 0 (0.0%) |
| 1 or 2 Children | 5 (17.2%) | 12 (42.9%) |
| 3 or 4 Children | 0 (0.0%) | 0 (0.0%) |
| 5 or more Children | 0 (0.0%) | 0 (0.0%) |
| Total | 5 (3.1%) | 12 (26.7%) |
Race in Section
The most populous races in Section are White / Caucasian (720 | 87.0%), Hispanic or Latino (80 | 9.7%), and Some other Race (74 | 8.9%).
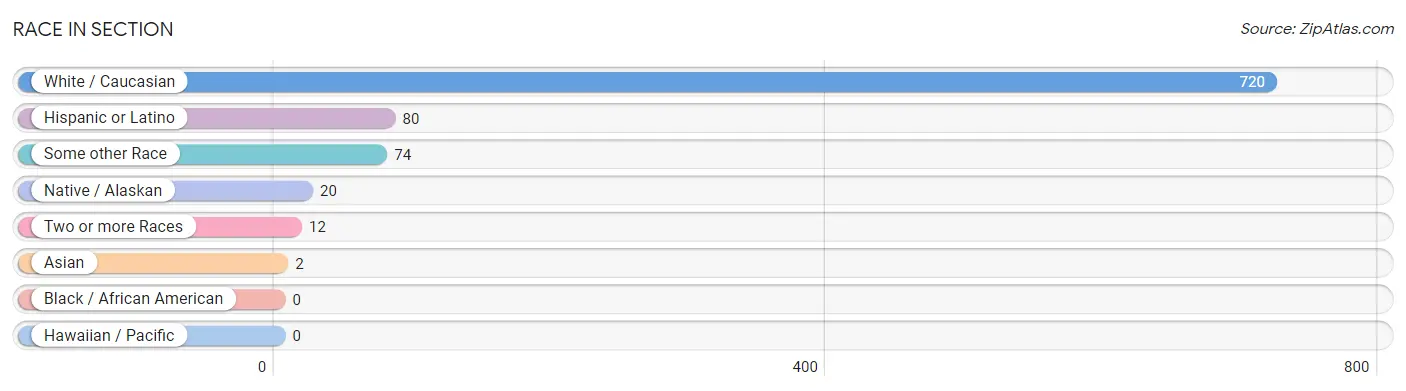
| Race | # Population | % Population |
| Asian | 2 | 0.2% |
| Black / African American | 0 | 0.0% |
| Hawaiian / Pacific | 0 | 0.0% |
| Hispanic or Latino | 80 | 9.7% |
| Native / Alaskan | 20 | 2.4% |
| White / Caucasian | 720 | 87.0% |
| Two or more Races | 12 | 1.5% |
| Some other Race | 74 | 8.9% |
| Total | 828 | 100.0% |
Ancestry in Section
The most populous ancestries reported in Section are American (146 | 17.6%), Irish (104 | 12.6%), German (99 | 12.0%), Mexican (74 | 8.9%), and English (71 | 8.6%), together accounting for 59.7% of all Section residents.
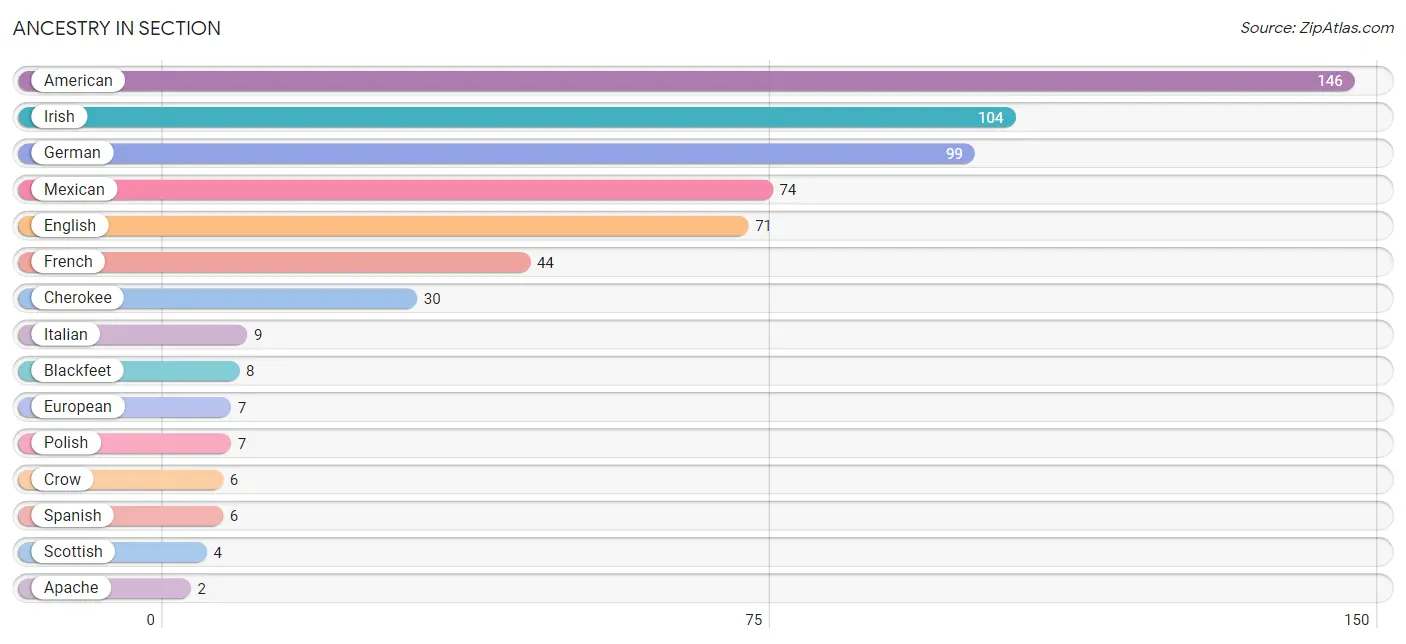
| Ancestry | # Population | % Population |
| American | 146 | 17.6% |
| Apache | 2 | 0.2% |
| Blackfeet | 8 | 1.0% |
| Cherokee | 30 | 3.6% |
| Crow | 6 | 0.7% |
| Dutch | 2 | 0.2% |
| English | 71 | 8.6% |
| European | 7 | 0.9% |
| French | 44 | 5.3% |
| German | 99 | 12.0% |
| Irish | 104 | 12.6% |
| Italian | 9 | 1.1% |
| Korean | 2 | 0.2% |
| Mexican | 74 | 8.9% |
| Polish | 7 | 0.9% |
| Scotch-Irish | 2 | 0.2% |
| Scottish | 4 | 0.5% |
| Slovak | 2 | 0.2% |
| Spanish | 6 | 0.7% | View All 19 Rows |
Immigrants in Section
The most numerous immigrant groups reported in Section came from Central America (31 | 3.7%), Latin America (31 | 3.7%), Mexico (31 | 3.7%), Asia (2 | 0.2%), and Philippines (2 | 0.2%), together accounting for 11.7% of all Section residents.
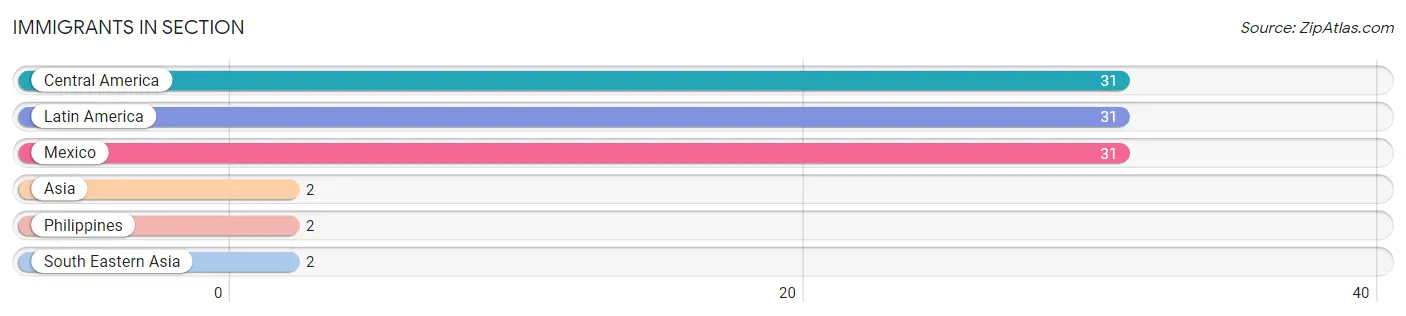
| Immigration Origin | # Population | % Population |
| Asia | 2 | 0.2% |
| Central America | 31 | 3.7% |
| Latin America | 31 | 3.7% |
| Mexico | 31 | 3.7% |
| Philippines | 2 | 0.2% |
| South Eastern Asia | 2 | 0.2% | View All 6 Rows |
Sex and Age in Section
Sex and Age in Section
The most populous age groups in Section are 40 to 44 Years (61 | 13.7%) for men and 10 to 14 Years (54 | 14.1%) for women.
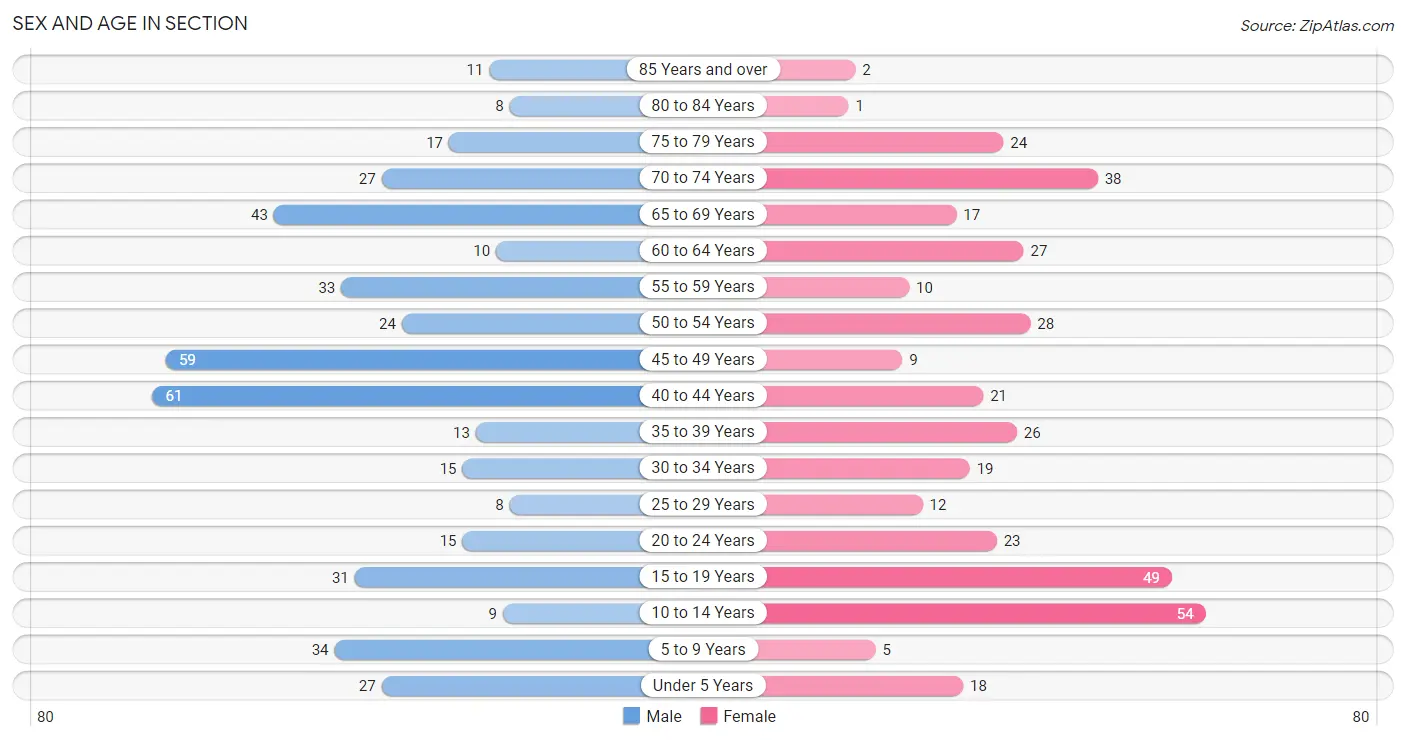
| Age Bracket | Male | Female |
| Under 5 Years | 27 (6.1%) | 18 (4.7%) |
| 5 to 9 Years | 34 (7.6%) | 5 (1.3%) |
| 10 to 14 Years | 9 (2.0%) | 54 (14.1%) |
| 15 to 19 Years | 31 (7.0%) | 49 (12.8%) |
| 20 to 24 Years | 15 (3.4%) | 23 (6.0%) |
| 25 to 29 Years | 8 (1.8%) | 12 (3.1%) |
| 30 to 34 Years | 15 (3.4%) | 19 (5.0%) |
| 35 to 39 Years | 13 (2.9%) | 26 (6.8%) |
| 40 to 44 Years | 61 (13.7%) | 21 (5.5%) |
| 45 to 49 Years | 59 (13.3%) | 9 (2.4%) |
| 50 to 54 Years | 24 (5.4%) | 28 (7.3%) |
| 55 to 59 Years | 33 (7.4%) | 10 (2.6%) |
| 60 to 64 Years | 10 (2.2%) | 27 (7.0%) |
| 65 to 69 Years | 43 (9.7%) | 17 (4.4%) |
| 70 to 74 Years | 27 (6.1%) | 38 (9.9%) |
| 75 to 79 Years | 17 (3.8%) | 24 (6.3%) |
| 80 to 84 Years | 8 (1.8%) | 1 (0.3%) |
| 85 Years and over | 11 (2.5%) | 2 (0.5%) |
| Total | 445 (100.0%) | 383 (100.0%) |
Families and Households in Section
Median Family Size in Section
The median family size in Section is 3.38 persons per family, with single male/father families (18 | 8.6%) accounting for the largest median family size of 4.11 persons per family. On the other hand, married-couple families (163 | 78.4%) represent the smallest median family size with 3.29 persons per family.
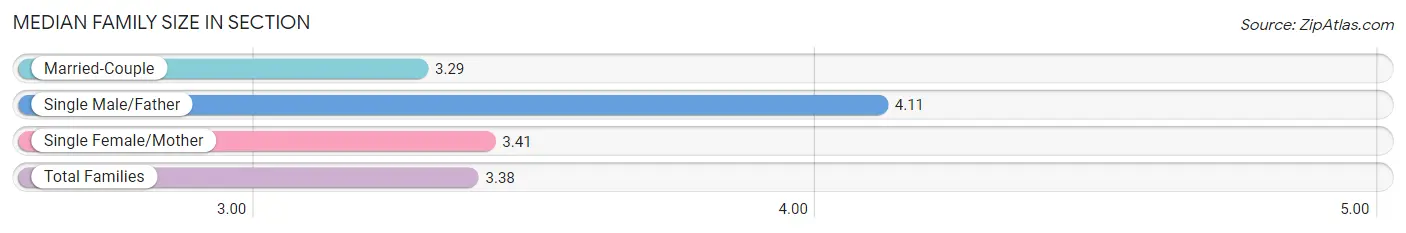
| Family Type | # Families | Family Size |
| Married-Couple | 163 (78.4%) | 3.29 |
| Single Male/Father | 18 (8.6%) | 4.11 |
| Single Female/Mother | 27 (13.0%) | 3.41 |
| Total Families | 208 (100.0%) | 3.38 |
Median Household Size in Section
The median household size in Section is 2.52 persons per household, with single male/father households (18 | 5.5%) accounting for the largest median household size of 4.11 persons per household. non-family households (120 | 36.6%) represent the smallest median household size with 1.04 persons per household.
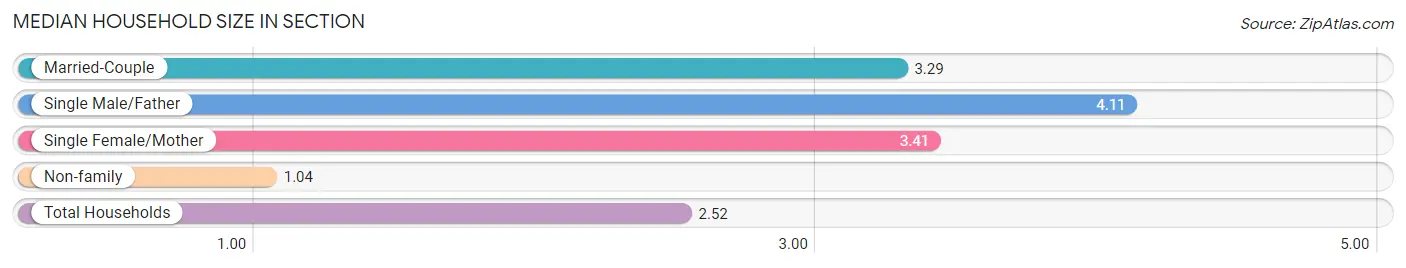
| Household Type | # Households | Household Size |
| Married-Couple | 163 (49.7%) | 3.29 |
| Single Male/Father | 18 (5.5%) | 4.11 |
| Single Female/Mother | 27 (8.2%) | 3.41 |
| Non-family | 120 (36.6%) | 1.04 |
| Total Households | 328 (100.0%) | 2.52 |
Household Size by Marriage Status in Section
Out of a total of 328 households in Section, 208 (63.4%) are family households, while 120 (36.6%) are nonfamily households. The most numerous type of family households are 2-person households, comprising 129, and the most common type of nonfamily households are 1-person households, comprising 118.
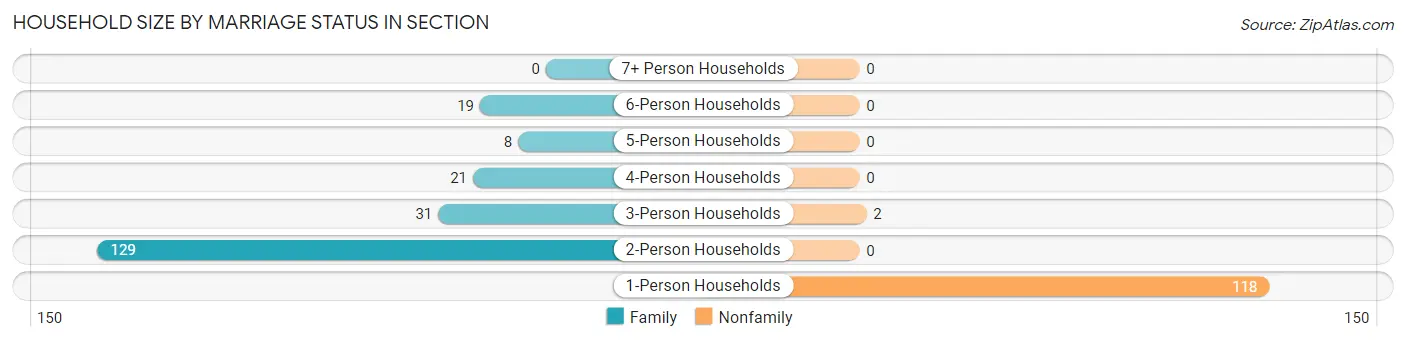
| Household Size | Family Households | Nonfamily Households |
| 1-Person Households | - | 118 (36.0%) |
| 2-Person Households | 129 (39.3%) | 0 (0.0%) |
| 3-Person Households | 31 (9.5%) | 2 (0.6%) |
| 4-Person Households | 21 (6.4%) | 0 (0.0%) |
| 5-Person Households | 8 (2.4%) | 0 (0.0%) |
| 6-Person Households | 19 (5.8%) | 0 (0.0%) |
| 7+ Person Households | 0 (0.0%) | 0 (0.0%) |
| Total | 208 (63.4%) | 120 (36.6%) |
Female Fertility in Section
Fertility by Age in Section
Average fertility rate in Section is 71.0 births per 1,000 women. Women in the age bracket of 20 to 34 years have the highest fertility rate with 167.0 births per 1,000 women. Women in the age bracket of 20 to 34 years acount for 75.0% of all women with births.
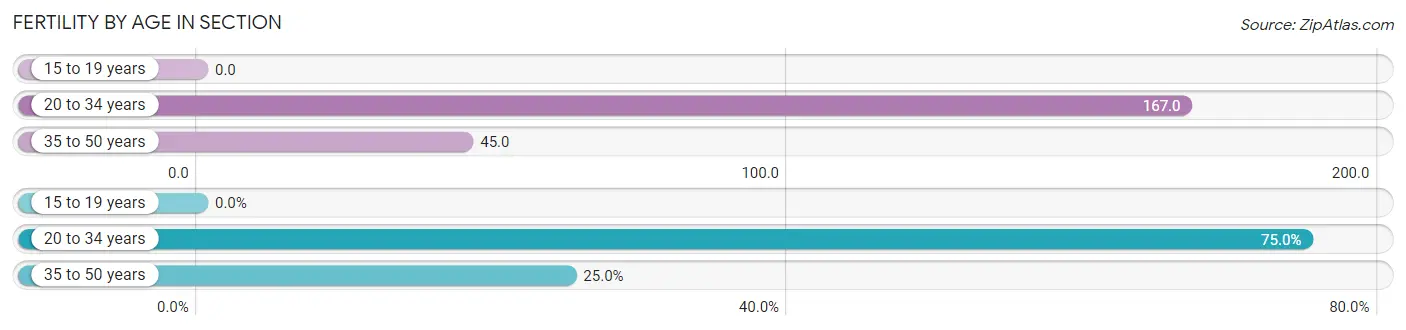
| Age Bracket | Women with Births | Births / 1,000 Women |
| 15 to 19 years | 0 (0.0%) | 0.0 |
| 20 to 34 years | 9 (75.0%) | 167.0 |
| 35 to 50 years | 3 (25.0%) | 45.0 |
| Total | 12 (100.0%) | 71.0 |
Fertility by Age by Marriage Status in Section
25.0% of women with births (12) in Section are married. The highest percentage of unmarried women with births falls into 20 to 34 years age bracket with 100.0% of them unmarried at the time of birth, while the lowest percentage of unmarried women with births belong to 35 to 50 years age bracket with 0.0% of them unmarried.
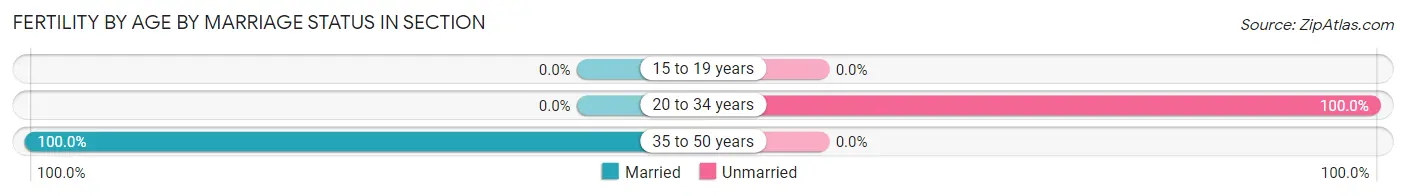
| Age Bracket | Married | Unmarried |
| 15 to 19 years | 0 (0.0%) | 0 (0.0%) |
| 20 to 34 years | 0 (0.0%) | 9 (100.0%) |
| 35 to 50 years | 3 (100.0%) | 0 (0.0%) |
| Total | 3 (25.0%) | 9 (75.0%) |
Fertility by Education in Section
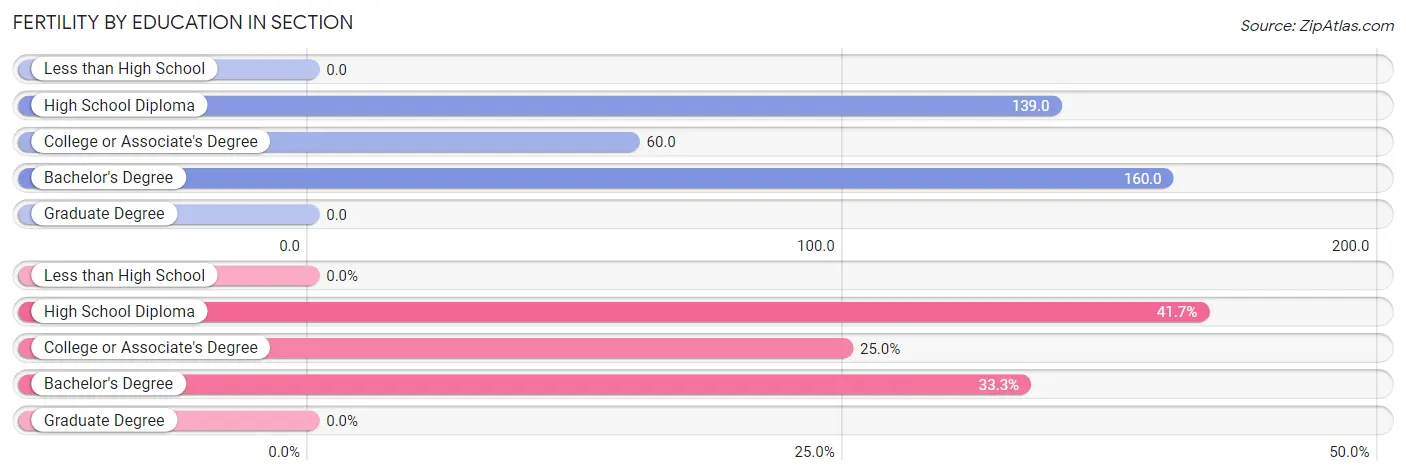
| Educational Attainment | Women with Births | Births / 1,000 Women |
| Less than High School | 0 (0.0%) | 0.0 |
| High School Diploma | 5 (41.7%) | 139.0 |
| College or Associate's Degree | 3 (25.0%) | 60.0 |
| Bachelor's Degree | 4 (33.3%) | 160.0 |
| Graduate Degree | 0 (0.0%) | 0.0 |
| Total | 12 (100.0%) | 71.0 |
Fertility by Education by Marriage Status in Section
75.0% of women with births in Section are unmarried. Women with the educational attainment of college or associate's degree are most likely to be married with 100.0% of them married at childbirth, while women with the educational attainment of high school diploma are least likely to be married with 100.0% of them unmarried at childbirth.
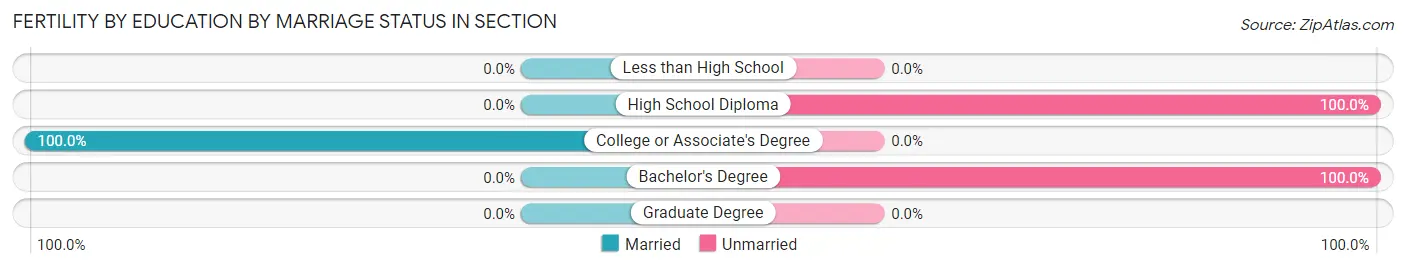
| Educational Attainment | Married | Unmarried |
| Less than High School | 0 (0.0%) | 0 (0.0%) |
| High School Diploma | 0 (0.0%) | 5 (100.0%) |
| College or Associate's Degree | 3 (100.0%) | 0 (0.0%) |
| Bachelor's Degree | 0 (0.0%) | 4 (100.0%) |
| Graduate Degree | 0 (0.0%) | 0 (0.0%) |
| Total | 3 (25.0%) | 9 (75.0%) |
Employment Characteristics in Section
Employment by Class of Employer in Section
Among the 299 employed individuals in Section, private company employees (213 | 71.2%), local government employees (30 | 10.0%), and self-employed (not incorporated) (25 | 8.4%) make up the most common classes of employment.
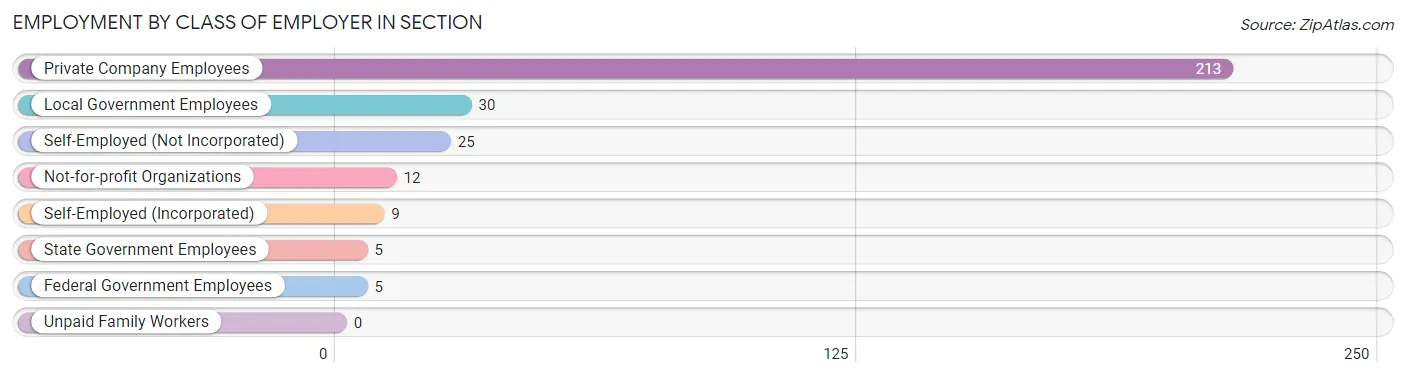
| Employer Class | # Employees | % Employees |
| Private Company Employees | 213 | 71.2% |
| Self-Employed (Incorporated) | 9 | 3.0% |
| Self-Employed (Not Incorporated) | 25 | 8.4% |
| Not-for-profit Organizations | 12 | 4.0% |
| Local Government Employees | 30 | 10.0% |
| State Government Employees | 5 | 1.7% |
| Federal Government Employees | 5 | 1.7% |
| Unpaid Family Workers | 0 | 0.0% |
| Total | 299 | 100.0% |
Employment Status by Age in Section
According to the labor force statistics for Section, out of the total population over 16 years of age (656), 48.2% or 316 individuals are in the labor force, with 3.5% or 11 of them unemployed. The age group with the highest labor force participation rate is 20 to 24 years, with 100.0% or 38 individuals in the labor force. Within the labor force, the 20 to 24 years age range has the highest percentage of unemployed individuals, with 13.2% or 5 of them being unemployed.
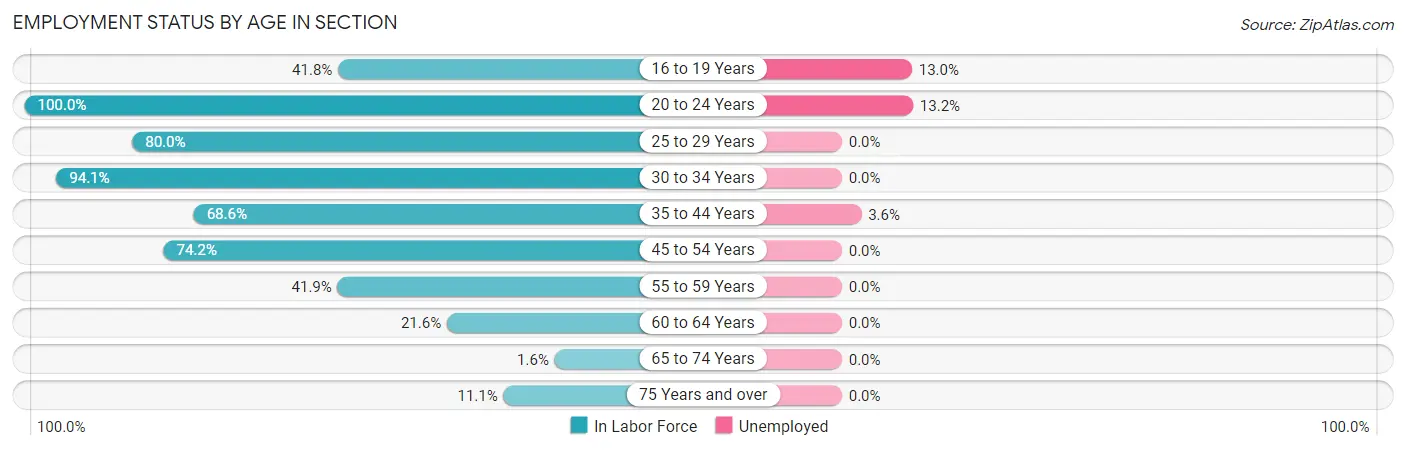
| Age Bracket | In Labor Force | Unemployed |
| 16 to 19 Years | 23 (41.8%) | 3 (13.0%) |
| 20 to 24 Years | 38 (100.0%) | 5 (13.2%) |
| 25 to 29 Years | 16 (80.0%) | 0 (0.0%) |
| 30 to 34 Years | 32 (94.1%) | 0 (0.0%) |
| 35 to 44 Years | 83 (68.6%) | 3 (3.6%) |
| 45 to 54 Years | 89 (74.2%) | 0 (0.0%) |
| 55 to 59 Years | 18 (41.9%) | 0 (0.0%) |
| 60 to 64 Years | 8 (21.6%) | 0 (0.0%) |
| 65 to 74 Years | 2 (1.6%) | 0 (0.0%) |
| 75 Years and over | 7 (11.1%) | 0 (0.0%) |
| Total | 316 (48.2%) | 11 (3.5%) |
Employment Status by Educational Attainment in Section
According to labor force statistics for Section, 65.6% of individuals (246) out of the total population between 25 and 64 years of age (375) are in the labor force, with 1.2% or 3 of them being unemployed. The group with the highest labor force participation rate are those with the educational attainment of bachelor's degree or higher, with 86.7% or 72 individuals in the labor force. Within the labor force, individuals with less than high school education have the highest percentage of unemployment, with 7.1% or 3 of them being unemployed.
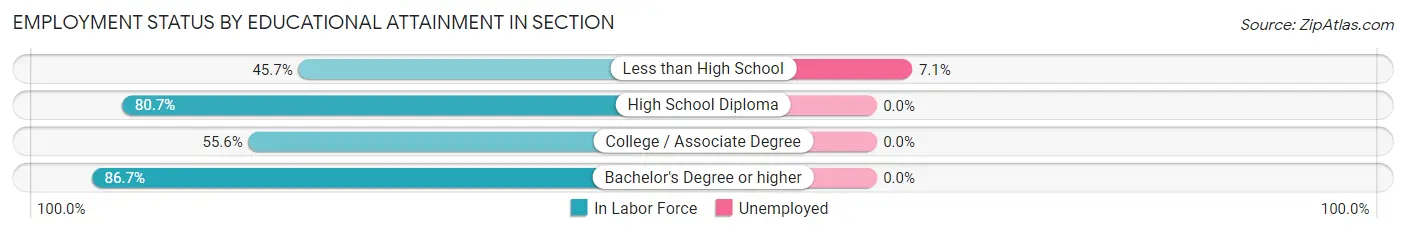
| Educational Attainment | In Labor Force | Unemployed |
| Less than High School | 42 (45.7%) | 7 (7.1%) |
| High School Diploma | 67 (80.7%) | 0 (0.0%) |
| College / Associate Degree | 65 (55.6%) | 0 (0.0%) |
| Bachelor's Degree or higher | 72 (86.7%) | 0 (0.0%) |
| Total | 246 (65.6%) | 4 (1.2%) |
Employment Occupations by Sex in Section
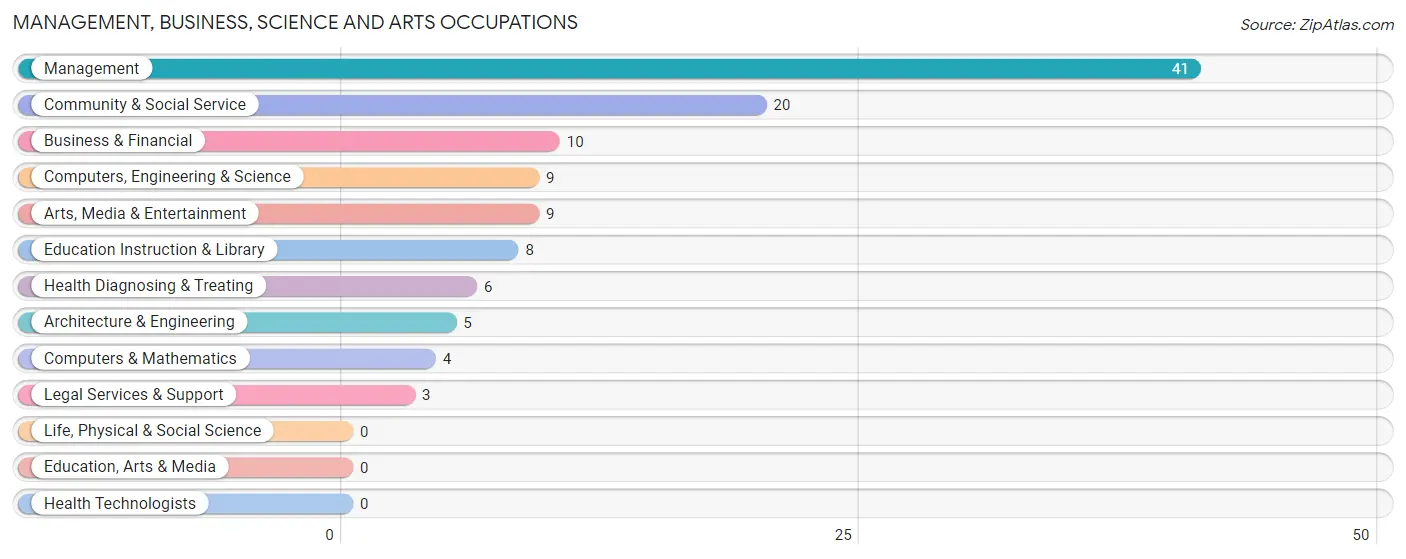
Management, Business, Science and Arts Occupations
The most common Management, Business, Science and Arts occupations in Section are Management (41 | 13.4%), Community & Social Service (20 | 6.6%), Business & Financial (10 | 3.3%), Computers, Engineering & Science (9 | 2.9%), and Arts, Media & Entertainment (9 | 2.9%).
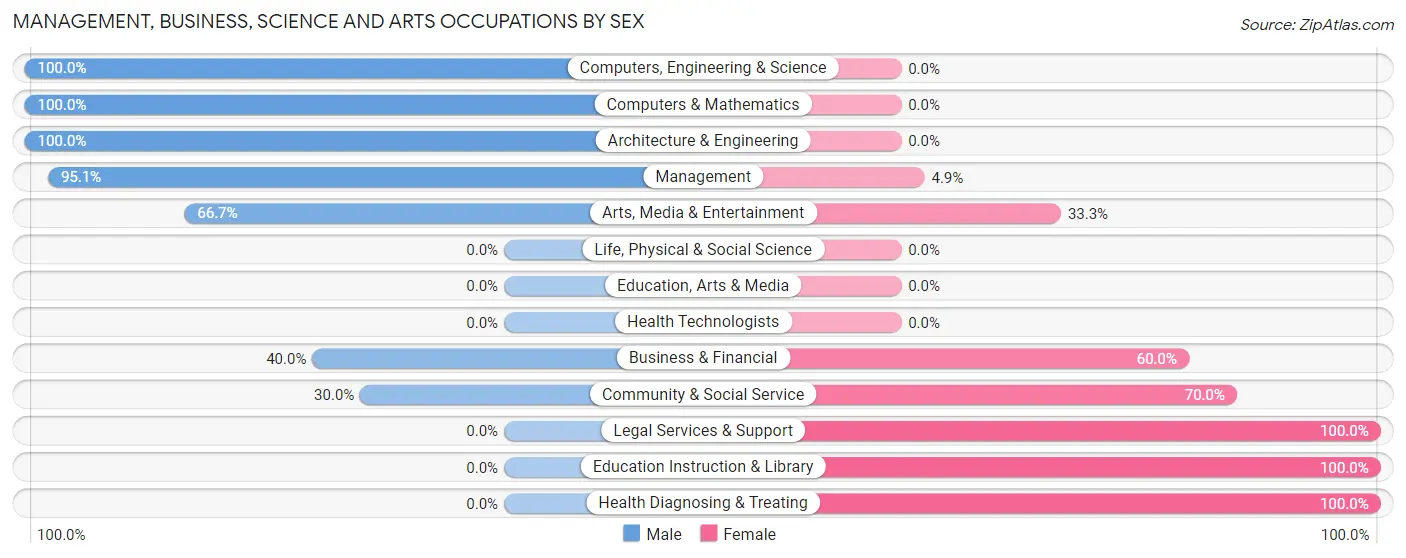
Management, Business, Science and Arts Occupations by Sex
Within the Management, Business, Science and Arts occupations in Section, the most male-oriented occupations are Computers, Engineering & Science (100.0%), Computers & Mathematics (100.0%), and Architecture & Engineering (100.0%), while the most female-oriented occupations are Legal Services & Support (100.0%), Education Instruction & Library (100.0%), and Health Diagnosing & Treating (100.0%).
| Occupation | Male | Female |
| Management | 39 (95.1%) | 2 (4.9%) |
| Business & Financial | 4 (40.0%) | 6 (60.0%) |
| Computers, Engineering & Science | 9 (100.0%) | 0 (0.0%) |
| Computers & Mathematics | 4 (100.0%) | 0 (0.0%) |
| Architecture & Engineering | 5 (100.0%) | 0 (0.0%) |
| Life, Physical & Social Science | 0 (0.0%) | 0 (0.0%) |
| Community & Social Service | 6 (30.0%) | 14 (70.0%) |
| Education, Arts & Media | 0 (0.0%) | 0 (0.0%) |
| Legal Services & Support | 0 (0.0%) | 3 (100.0%) |
| Education Instruction & Library | 0 (0.0%) | 8 (100.0%) |
| Arts, Media & Entertainment | 6 (66.7%) | 3 (33.3%) |
| Health Diagnosing & Treating | 0 (0.0%) | 6 (100.0%) |
| Health Technologists | 0 (0.0%) | 0 (0.0%) |
| Total (Category) | 58 (67.4%) | 28 (32.6%) |
| Total (Overall) | 212 (69.5%) | 93 (30.5%) |
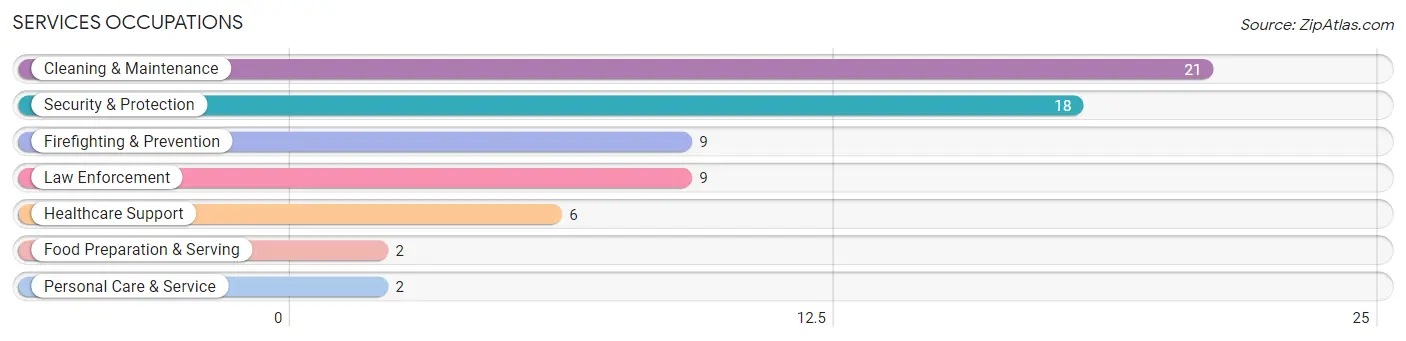
Services Occupations
The most common Services occupations in Section are Cleaning & Maintenance (21 | 6.9%), Security & Protection (18 | 5.9%), Firefighting & Prevention (9 | 2.9%), Law Enforcement (9 | 2.9%), and Healthcare Support (6 | 2.0%).
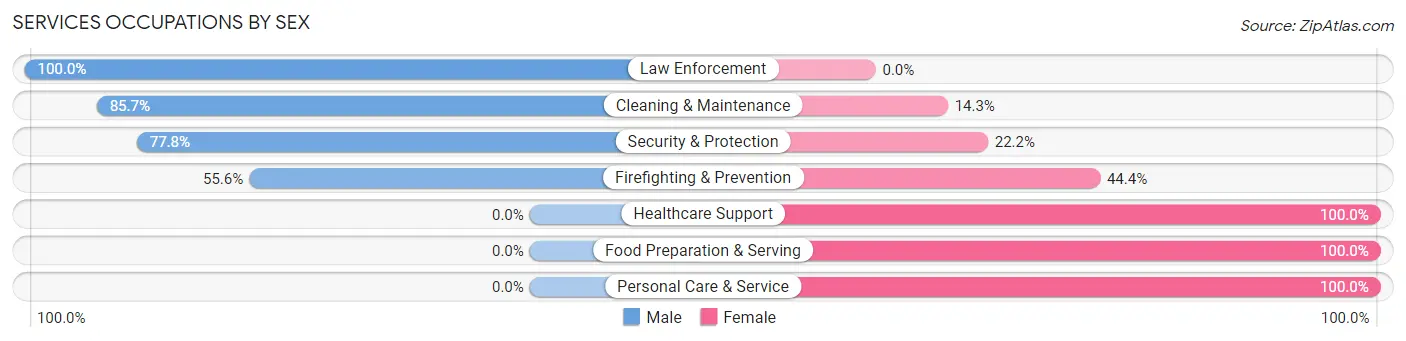
Services Occupations by Sex
Within the Services occupations in Section, the most male-oriented occupations are Law Enforcement (100.0%), Cleaning & Maintenance (85.7%), and Security & Protection (77.8%), while the most female-oriented occupations are Healthcare Support (100.0%), Food Preparation & Serving (100.0%), and Personal Care & Service (100.0%).
| Occupation | Male | Female |
| Healthcare Support | 0 (0.0%) | 6 (100.0%) |
| Security & Protection | 14 (77.8%) | 4 (22.2%) |
| Firefighting & Prevention | 5 (55.6%) | 4 (44.4%) |
| Law Enforcement | 9 (100.0%) | 0 (0.0%) |
| Food Preparation & Serving | 0 (0.0%) | 2 (100.0%) |
| Cleaning & Maintenance | 18 (85.7%) | 3 (14.3%) |
| Personal Care & Service | 0 (0.0%) | 2 (100.0%) |
| Total (Category) | 32 (65.3%) | 17 (34.7%) |
| Total (Overall) | 212 (69.5%) | 93 (30.5%) |
Sales and Office Occupations
The most common Sales and Office occupations in Section are Sales & Related (31 | 10.2%), and Office & Administration (21 | 6.9%).
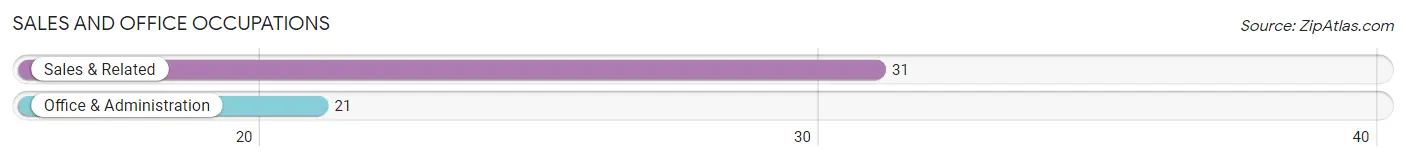
Sales and Office Occupations by Sex
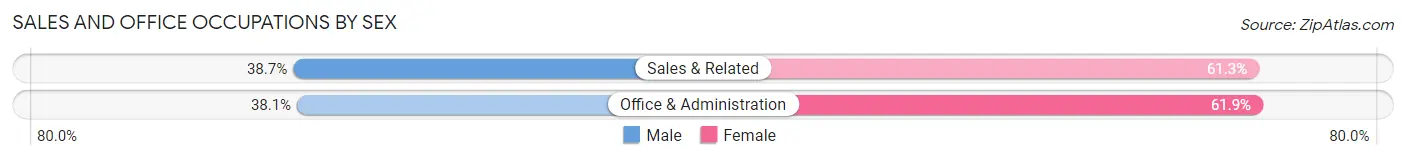
| Occupation | Male | Female |
| Sales & Related | 12 (38.7%) | 19 (61.3%) |
| Office & Administration | 8 (38.1%) | 13 (61.9%) |
| Total (Category) | 20 (38.5%) | 32 (61.5%) |
| Total (Overall) | 212 (69.5%) | 93 (30.5%) |
Natural Resources, Construction and Maintenance Occupations
The most common Natural Resources, Construction and Maintenance occupations in Section are Construction & Extraction (38 | 12.5%), Installation, Maintenance & Repair (8 | 2.6%), and Farming, Fishing & Forestry (1 | 0.3%).
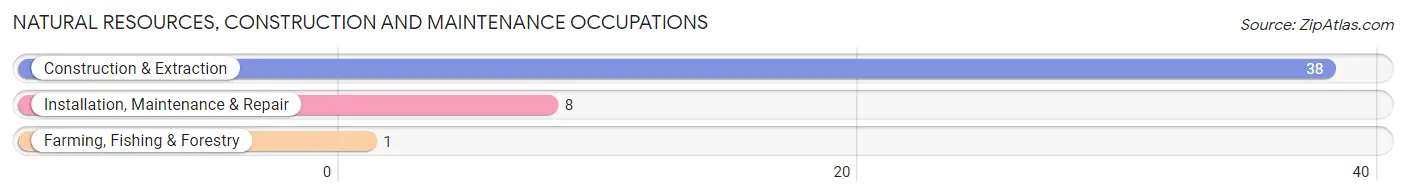
Natural Resources, Construction and Maintenance Occupations by Sex
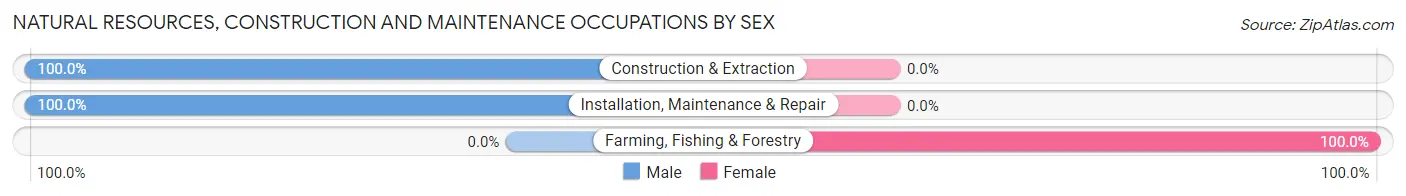
| Occupation | Male | Female |
| Farming, Fishing & Forestry | 0 (0.0%) | 1 (100.0%) |
| Construction & Extraction | 38 (100.0%) | 0 (0.0%) |
| Installation, Maintenance & Repair | 8 (100.0%) | 0 (0.0%) |
| Total (Category) | 46 (97.9%) | 1 (2.1%) |
| Total (Overall) | 212 (69.5%) | 93 (30.5%) |
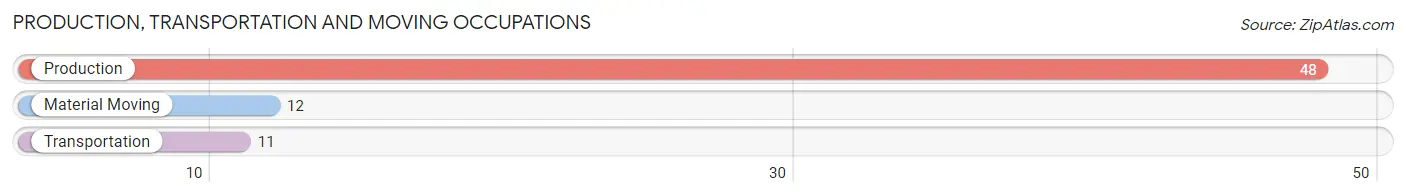
Production, Transportation and Moving Occupations
The most common Production, Transportation and Moving occupations in Section are Production (48 | 15.7%), Material Moving (12 | 3.9%), and Transportation (11 | 3.6%).
Production, Transportation and Moving Occupations by Sex
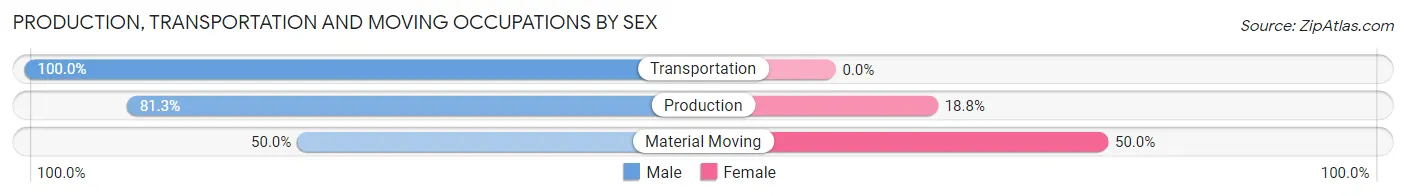
| Occupation | Male | Female |
| Production | 39 (81.2%) | 9 (18.8%) |
| Transportation | 11 (100.0%) | 0 (0.0%) |
| Material Moving | 6 (50.0%) | 6 (50.0%) |
| Total (Category) | 56 (78.9%) | 15 (21.1%) |
| Total (Overall) | 212 (69.5%) | 93 (30.5%) |
Employment Industries by Sex in Section
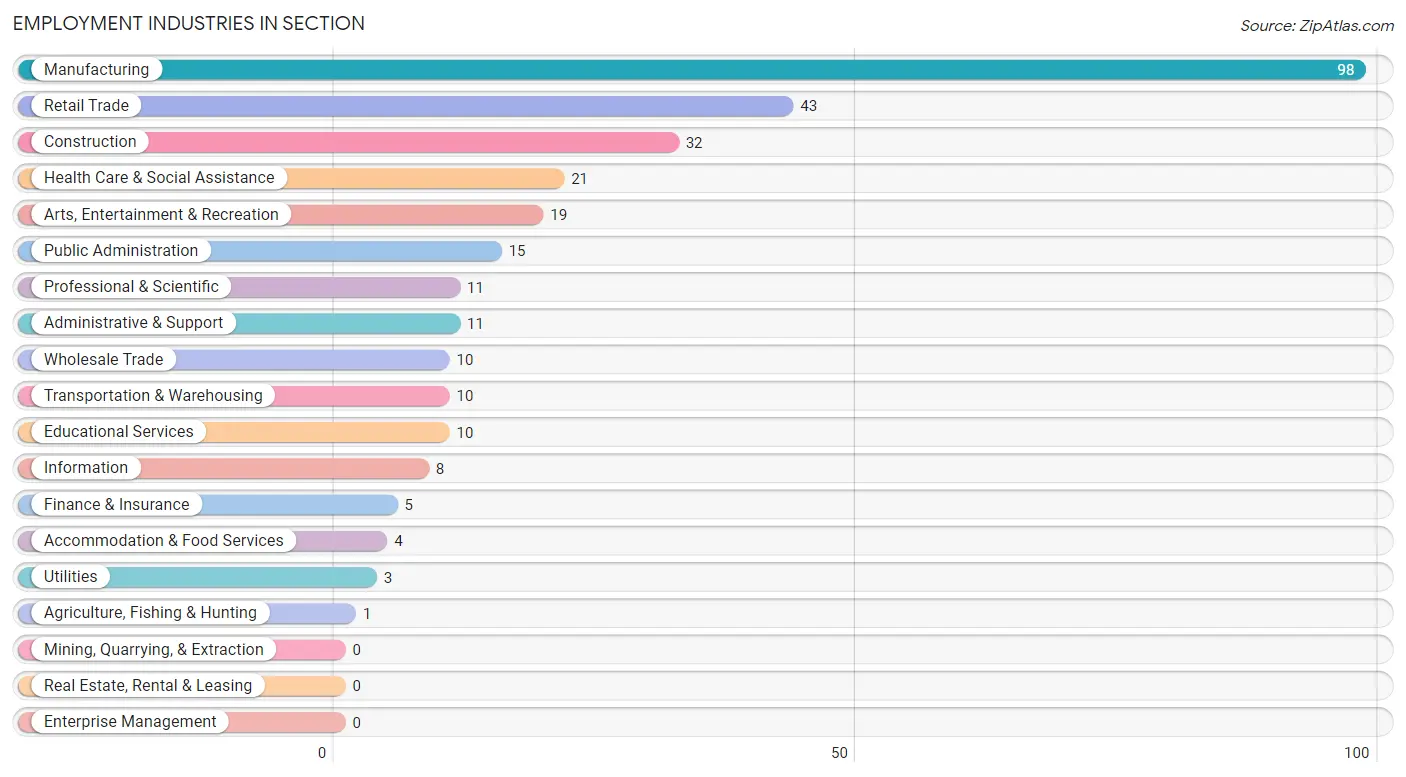
Employment Industries in Section
The major employment industries in Section include Manufacturing (98 | 32.1%), Retail Trade (43 | 14.1%), Construction (32 | 10.5%), Health Care & Social Assistance (21 | 6.9%), and Arts, Entertainment & Recreation (19 | 6.2%).
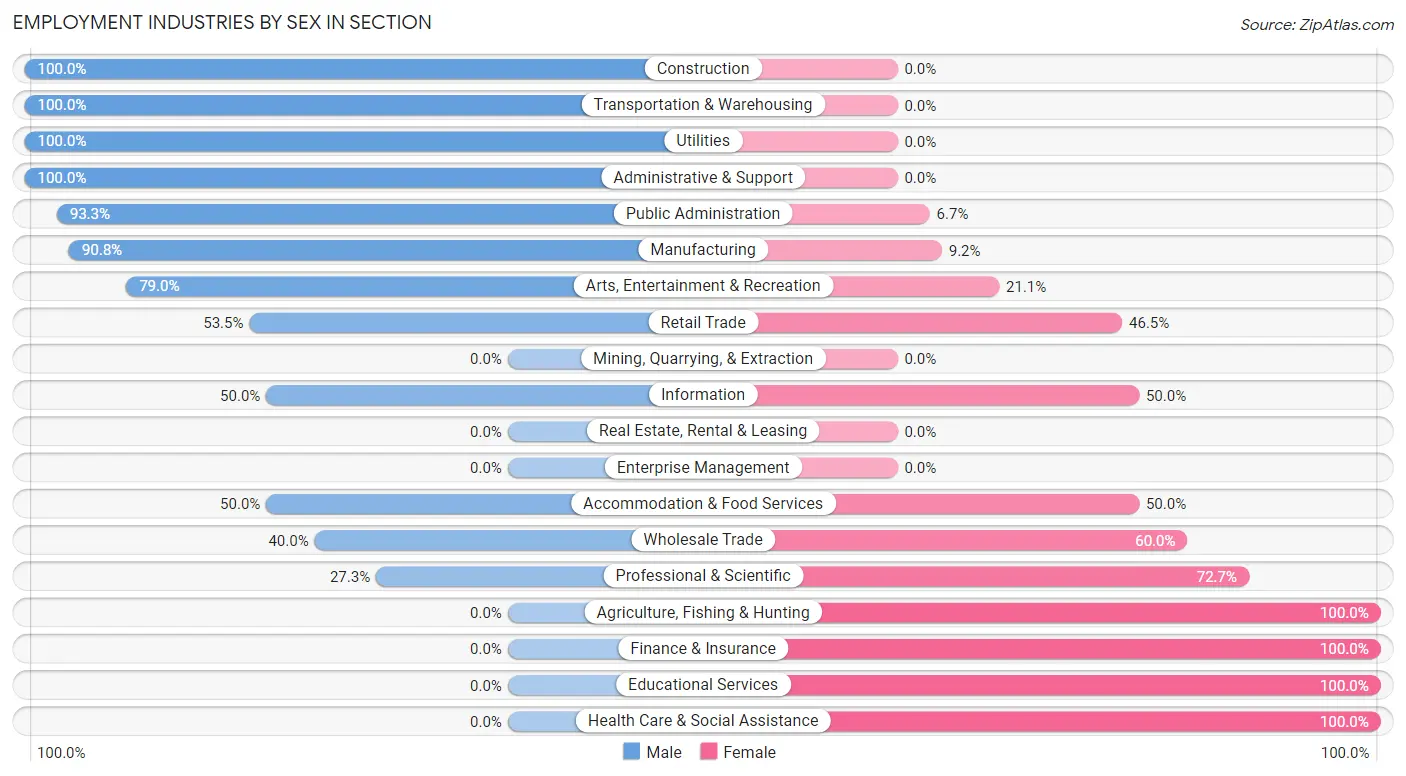
Employment Industries by Sex in Section
The Section industries that see more men than women are Construction (100.0%), Transportation & Warehousing (100.0%), and Utilities (100.0%), whereas the industries that tend to have a higher number of women are Agriculture, Fishing & Hunting (100.0%), Finance & Insurance (100.0%), and Educational Services (100.0%).
| Industry | Male | Female |
| Agriculture, Fishing & Hunting | 0 (0.0%) | 1 (100.0%) |
| Mining, Quarrying, & Extraction | 0 (0.0%) | 0 (0.0%) |
| Construction | 32 (100.0%) | 0 (0.0%) |
| Manufacturing | 89 (90.8%) | 9 (9.2%) |
| Wholesale Trade | 4 (40.0%) | 6 (60.0%) |
| Retail Trade | 23 (53.5%) | 20 (46.5%) |
| Transportation & Warehousing | 10 (100.0%) | 0 (0.0%) |
| Utilities | 3 (100.0%) | 0 (0.0%) |
| Information | 4 (50.0%) | 4 (50.0%) |
| Finance & Insurance | 0 (0.0%) | 5 (100.0%) |
| Real Estate, Rental & Leasing | 0 (0.0%) | 0 (0.0%) |
| Professional & Scientific | 3 (27.3%) | 8 (72.7%) |
| Enterprise Management | 0 (0.0%) | 0 (0.0%) |
| Administrative & Support | 11 (100.0%) | 0 (0.0%) |
| Educational Services | 0 (0.0%) | 10 (100.0%) |
| Health Care & Social Assistance | 0 (0.0%) | 21 (100.0%) |
| Arts, Entertainment & Recreation | 15 (78.9%) | 4 (21.0%) |
| Accommodation & Food Services | 2 (50.0%) | 2 (50.0%) |
| Public Administration | 14 (93.3%) | 1 (6.7%) |
| Total | 212 (69.5%) | 93 (30.5%) |
Education in Section
School Enrollment in Section
The most common levels of schooling among the 189 students in Section are high school (57 | 30.2%), middle school (55 | 29.1%), and elementary school (45 | 23.8%).
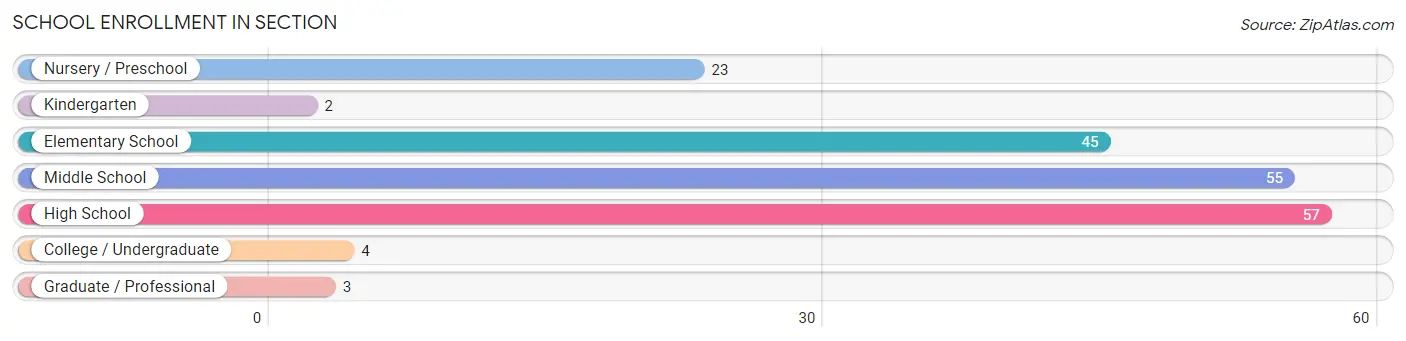
| School Level | # Students | % Students |
| Nursery / Preschool | 23 | 12.2% |
| Kindergarten | 2 | 1.1% |
| Elementary School | 45 | 23.8% |
| Middle School | 55 | 29.1% |
| High School | 57 | 30.2% |
| College / Undergraduate | 4 | 2.1% |
| Graduate / Professional | 3 | 1.6% |
| Total | 189 | 100.0% |
School Enrollment by Age by Funding Source in Section
Out of a total of 189 students who are enrolled in schools in Section, 14 (7.4%) attend a private institution, while the remaining 175 (92.6%) are enrolled in public schools. The age group of 18 to 19 year olds has the highest likelihood of being enrolled in private schools, with 6 (35.3% in the age bracket) enrolled. Conversely, the age group of 5 to 9 year old has the lowest likelihood of being enrolled in a private school, with 39 (100.0% in the age bracket) attending a public institution.
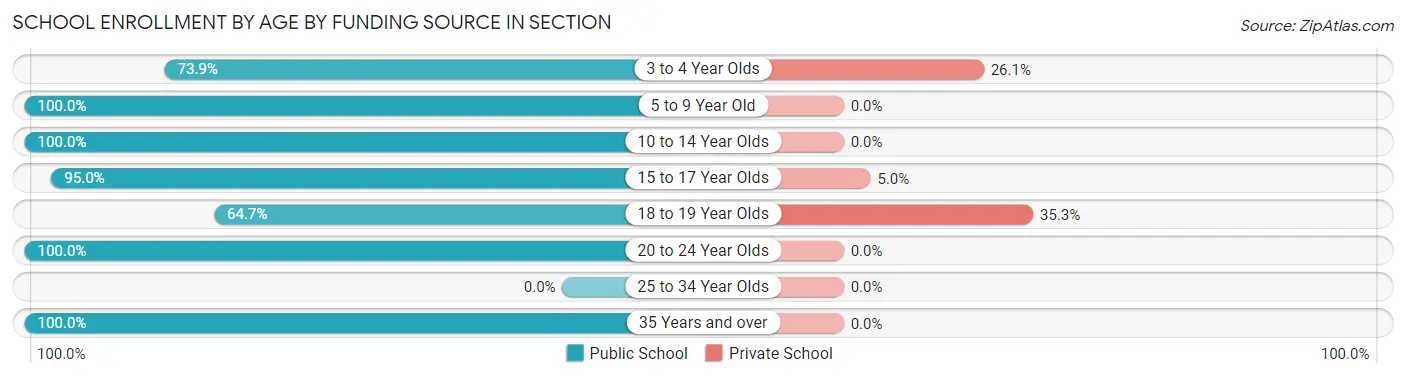
| Age Bracket | Public School | Private School |
| 3 to 4 Year Olds | 17 (73.9%) | 6 (26.1%) |
| 5 to 9 Year Old | 39 (100.0%) | 0 (0.0%) |
| 10 to 14 Year Olds | 63 (100.0%) | 0 (0.0%) |
| 15 to 17 Year Olds | 38 (95.0%) | 2 (5.0%) |
| 18 to 19 Year Olds | 11 (64.7%) | 6 (35.3%) |
| 20 to 24 Year Olds | 4 (100.0%) | 0 (0.0%) |
| 25 to 34 Year Olds | 0 (0.0%) | 0 (0.0%) |
| 35 Years and over | 3 (100.0%) | 0 (0.0%) |
| Total | 175 (92.6%) | 14 (7.4%) |
Educational Attainment by Field of Study in Section
Engineering (43 | 42.2%), education (25 | 24.5%), business (12 | 11.8%), science & technology (9 | 8.8%), and visual & performing arts (4 | 3.9%) are the most common fields of study among 102 individuals in Section who have obtained a bachelor's degree or higher.
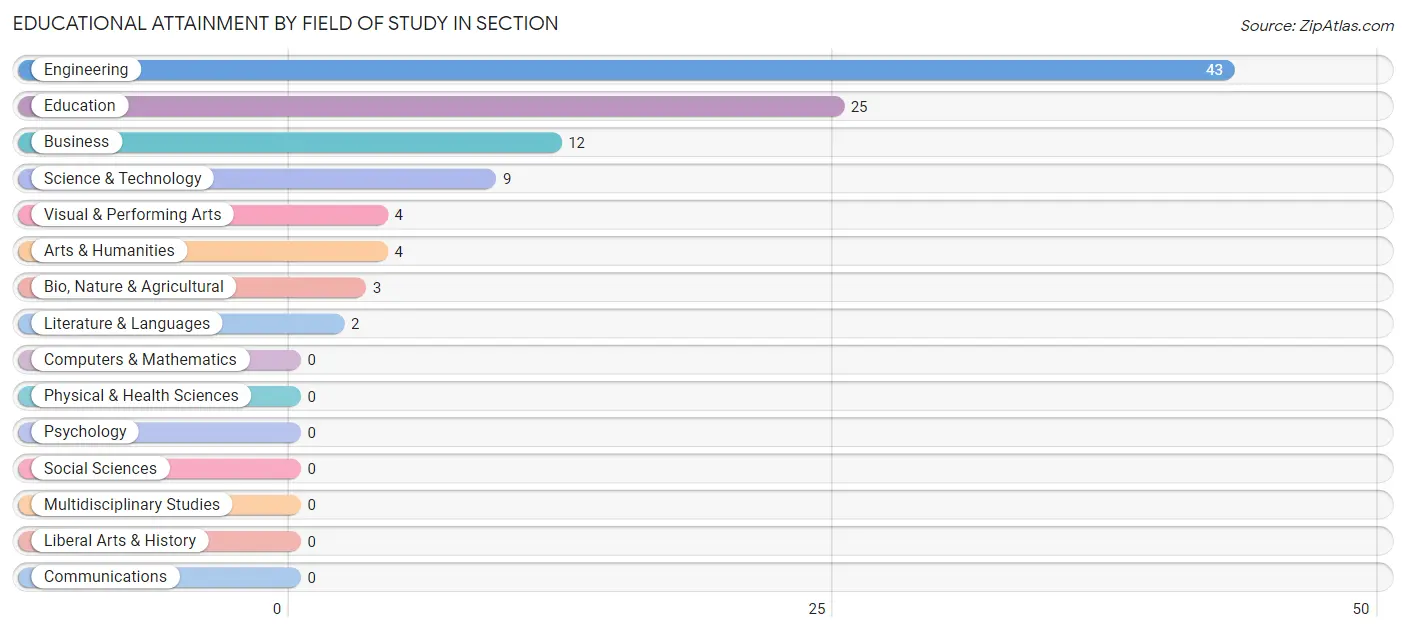
| Field of Study | # Graduates | % Graduates |
| Computers & Mathematics | 0 | 0.0% |
| Bio, Nature & Agricultural | 3 | 2.9% |
| Physical & Health Sciences | 0 | 0.0% |
| Psychology | 0 | 0.0% |
| Social Sciences | 0 | 0.0% |
| Engineering | 43 | 42.2% |
| Multidisciplinary Studies | 0 | 0.0% |
| Science & Technology | 9 | 8.8% |
| Business | 12 | 11.8% |
| Education | 25 | 24.5% |
| Literature & Languages | 2 | 2.0% |
| Liberal Arts & History | 0 | 0.0% |
| Visual & Performing Arts | 4 | 3.9% |
| Communications | 0 | 0.0% |
| Arts & Humanities | 4 | 3.9% |
| Total | 102 | 100.0% |
Transportation & Commute in Section
Vehicle Availability by Sex in Section
The most prevalent vehicle ownership categories in Section are males with 2 vehicles (69, accounting for 33.5%) and females with 2 vehicles (27, making up 74.2%).
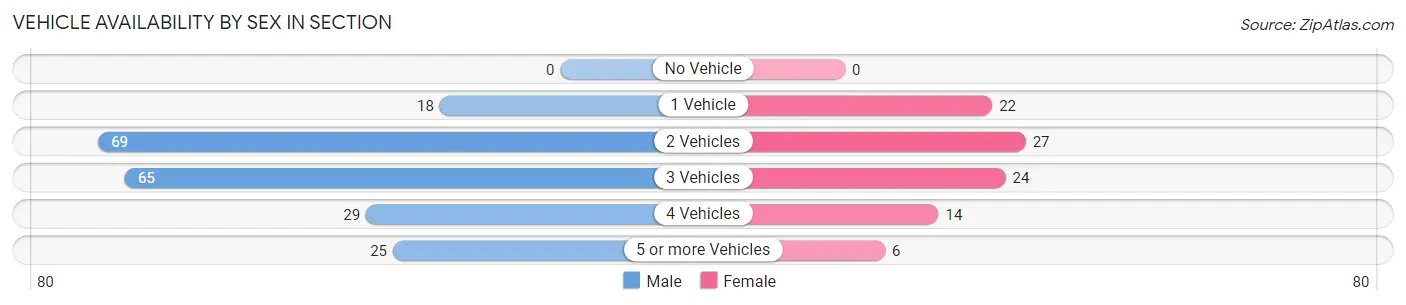
| Vehicles Available | Male | Female |
| No Vehicle | 0 (0.0%) | 0 (0.0%) |
| 1 Vehicle | 18 (8.7%) | 22 (23.7%) |
| 2 Vehicles | 69 (33.5%) | 27 (29.0%) |
| 3 Vehicles | 65 (31.6%) | 24 (25.8%) |
| 4 Vehicles | 29 (14.1%) | 14 (15.0%) |
| 5 or more Vehicles | 25 (12.1%) | 6 (6.5%) |
| Total | 206 (100.0%) | 93 (100.0%) |
Commute Time in Section
The most frequently occuring commute durations in Section are 30 to 34 minutes (48 commuters, 17.5%), 20 to 24 minutes (47 commuters, 17.2%), and 90 or more minutes (45 commuters, 16.4%).
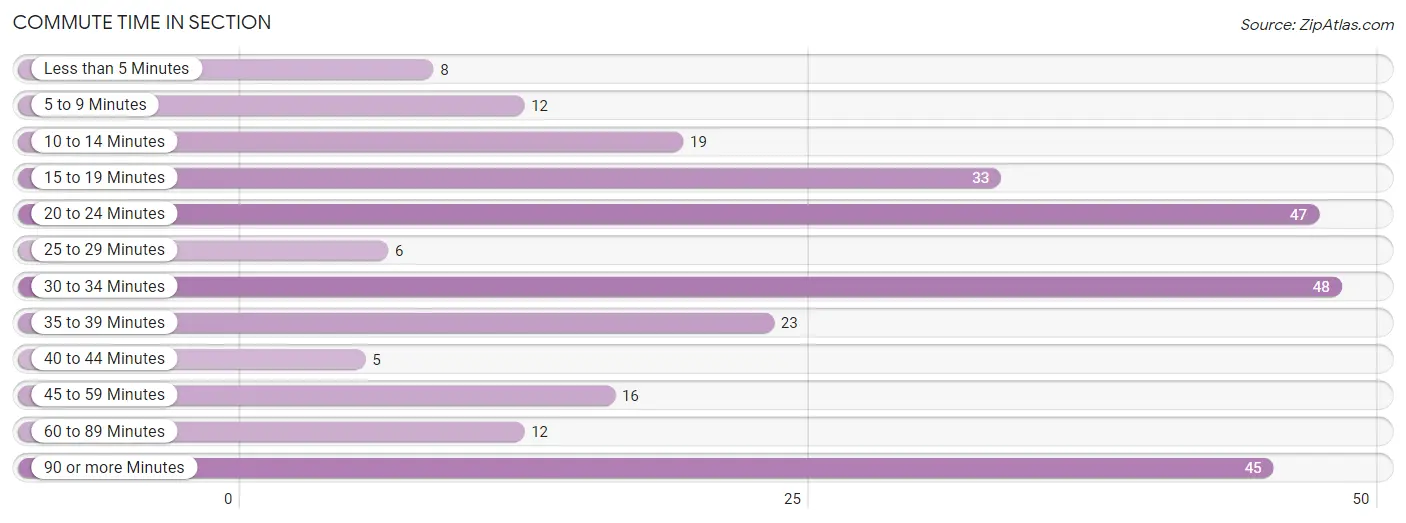
| Commute Time | # Commuters | % Commuters |
| Less than 5 Minutes | 8 | 2.9% |
| 5 to 9 Minutes | 12 | 4.4% |
| 10 to 14 Minutes | 19 | 6.9% |
| 15 to 19 Minutes | 33 | 12.0% |
| 20 to 24 Minutes | 47 | 17.2% |
| 25 to 29 Minutes | 6 | 2.2% |
| 30 to 34 Minutes | 48 | 17.5% |
| 35 to 39 Minutes | 23 | 8.4% |
| 40 to 44 Minutes | 5 | 1.8% |
| 45 to 59 Minutes | 16 | 5.8% |
| 60 to 89 Minutes | 12 | 4.4% |
| 90 or more Minutes | 45 | 16.4% |
Commute Time by Sex in Section
The most common commute times in Section are 90 or more minutes (45 commuters, 24.2%) for males and 15 to 19 minutes (25 commuters, 28.4%) for females.
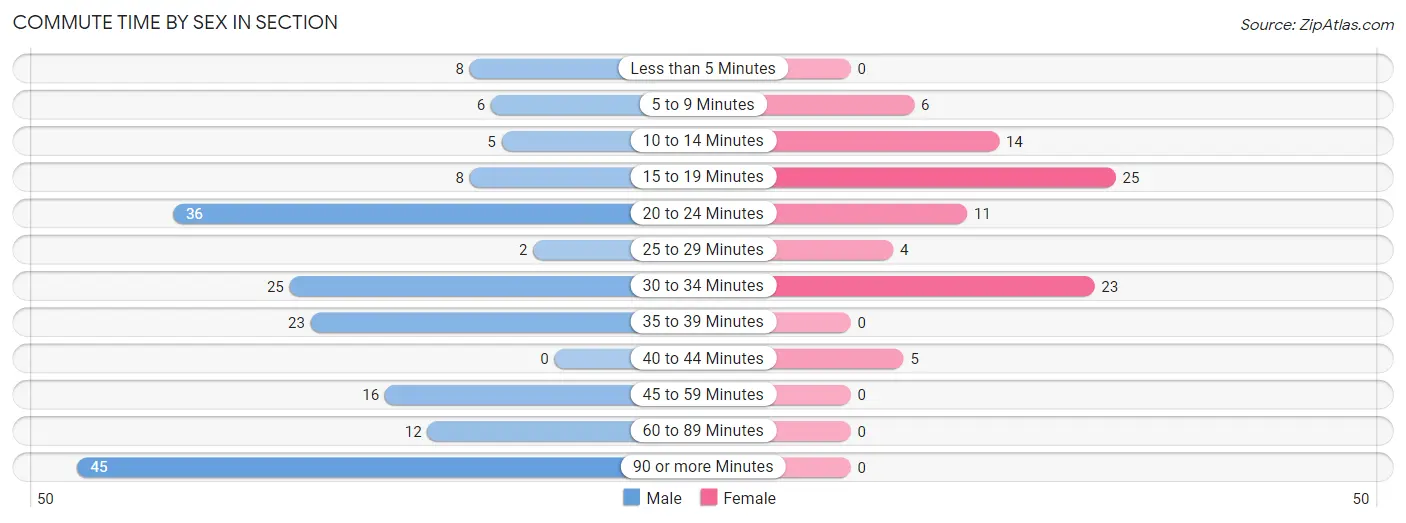
| Commute Time | Male | Female |
| Less than 5 Minutes | 8 (4.3%) | 0 (0.0%) |
| 5 to 9 Minutes | 6 (3.2%) | 6 (6.8%) |
| 10 to 14 Minutes | 5 (2.7%) | 14 (15.9%) |
| 15 to 19 Minutes | 8 (4.3%) | 25 (28.4%) |
| 20 to 24 Minutes | 36 (19.4%) | 11 (12.5%) |
| 25 to 29 Minutes | 2 (1.1%) | 4 (4.5%) |
| 30 to 34 Minutes | 25 (13.4%) | 23 (26.1%) |
| 35 to 39 Minutes | 23 (12.4%) | 0 (0.0%) |
| 40 to 44 Minutes | 0 (0.0%) | 5 (5.7%) |
| 45 to 59 Minutes | 16 (8.6%) | 0 (0.0%) |
| 60 to 89 Minutes | 12 (6.5%) | 0 (0.0%) |
| 90 or more Minutes | 45 (24.2%) | 0 (0.0%) |
Time of Departure to Work by Sex in Section
The most frequent times of departure to work in Section are 7:00 AM to 7:29 AM (87, 46.8%) for males and 12:00 AM to 4:59 AM (19, 21.6%) for females.
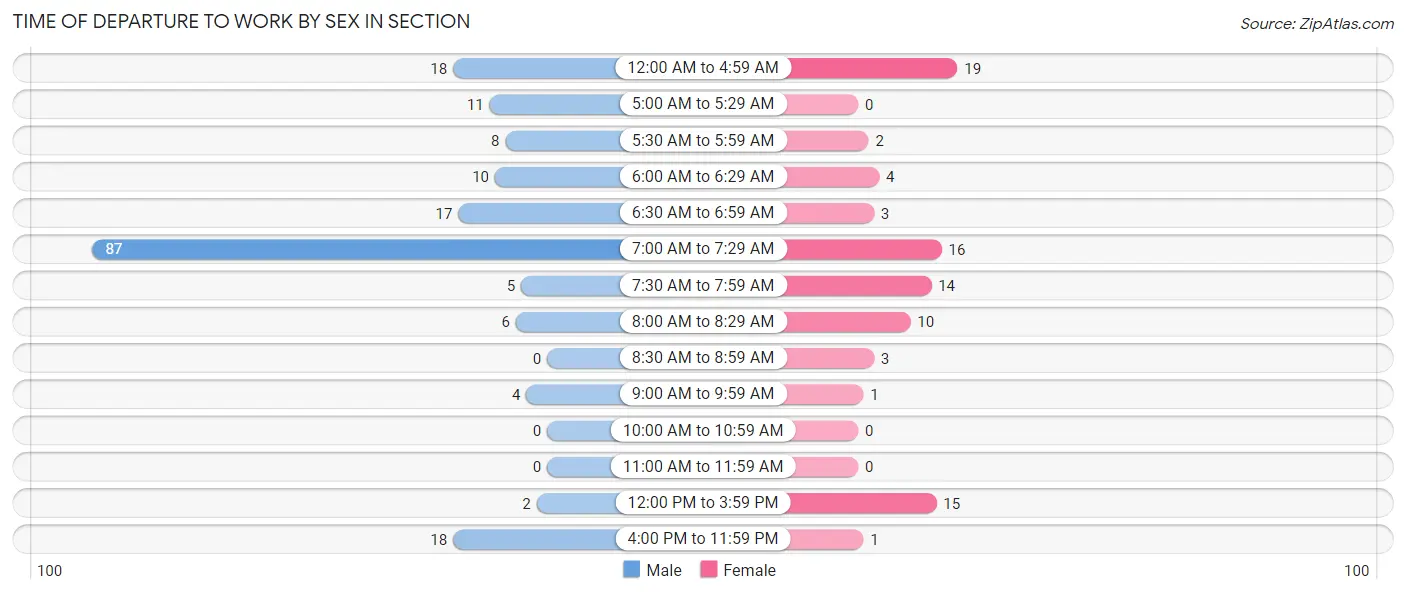
| Time of Departure | Male | Female |
| 12:00 AM to 4:59 AM | 18 (9.7%) | 19 (21.6%) |
| 5:00 AM to 5:29 AM | 11 (5.9%) | 0 (0.0%) |
| 5:30 AM to 5:59 AM | 8 (4.3%) | 2 (2.3%) |
| 6:00 AM to 6:29 AM | 10 (5.4%) | 4 (4.5%) |
| 6:30 AM to 6:59 AM | 17 (9.1%) | 3 (3.4%) |
| 7:00 AM to 7:29 AM | 87 (46.8%) | 16 (18.2%) |
| 7:30 AM to 7:59 AM | 5 (2.7%) | 14 (15.9%) |
| 8:00 AM to 8:29 AM | 6 (3.2%) | 10 (11.4%) |
| 8:30 AM to 8:59 AM | 0 (0.0%) | 3 (3.4%) |
| 9:00 AM to 9:59 AM | 4 (2.1%) | 1 (1.1%) |
| 10:00 AM to 10:59 AM | 0 (0.0%) | 0 (0.0%) |
| 11:00 AM to 11:59 AM | 0 (0.0%) | 0 (0.0%) |
| 12:00 PM to 3:59 PM | 2 (1.1%) | 15 (17.1%) |
| 4:00 PM to 11:59 PM | 18 (9.7%) | 1 (1.1%) |
| Total | 186 (100.0%) | 88 (100.0%) |
Housing Occupancy in Section
Occupancy by Ownership in Section
Of the total 328 dwellings in Section, owner-occupied units account for 239 (72.9%), while renter-occupied units make up 89 (27.1%).
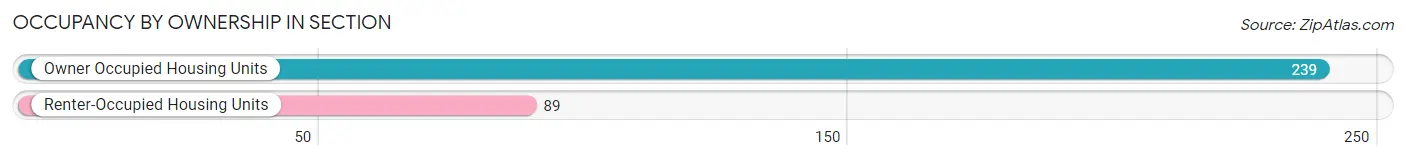
| Occupancy | # Housing Units | % Housing Units |
| Owner Occupied Housing Units | 239 | 72.9% |
| Renter-Occupied Housing Units | 89 | 27.1% |
| Total Occupied Housing Units | 328 | 100.0% |
Occupancy by Household Size in Section
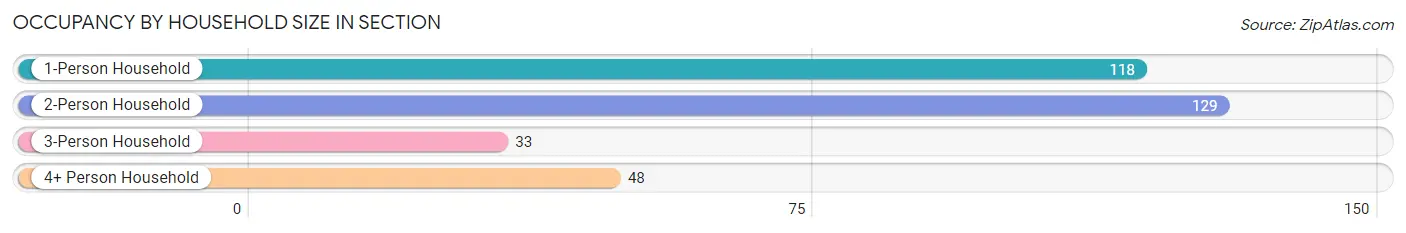
| Household Size | # Housing Units | % Housing Units |
| 1-Person Household | 118 | 36.0% |
| 2-Person Household | 129 | 39.3% |
| 3-Person Household | 33 | 10.1% |
| 4+ Person Household | 48 | 14.6% |
| Total Housing Units | 328 | 100.0% |
Occupancy by Ownership by Household Size in Section
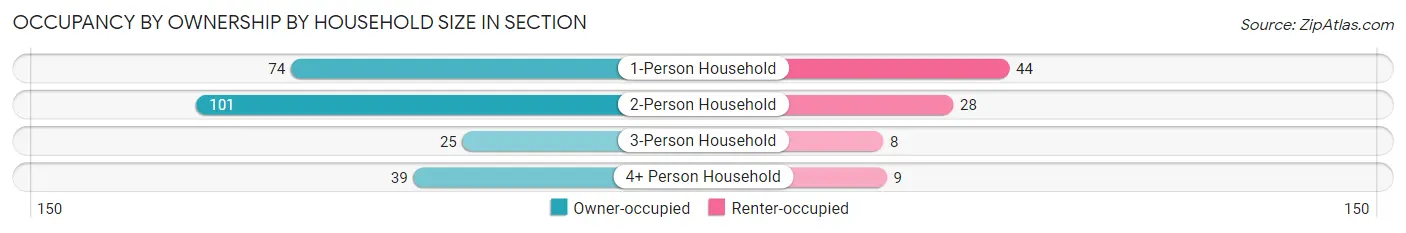
| Household Size | Owner-occupied | Renter-occupied |
| 1-Person Household | 74 (62.7%) | 44 (37.3%) |
| 2-Person Household | 101 (78.3%) | 28 (21.7%) |
| 3-Person Household | 25 (75.8%) | 8 (24.2%) |
| 4+ Person Household | 39 (81.2%) | 9 (18.8%) |
| Total Housing Units | 239 (72.9%) | 89 (27.1%) |
Occupancy by Educational Attainment in Section
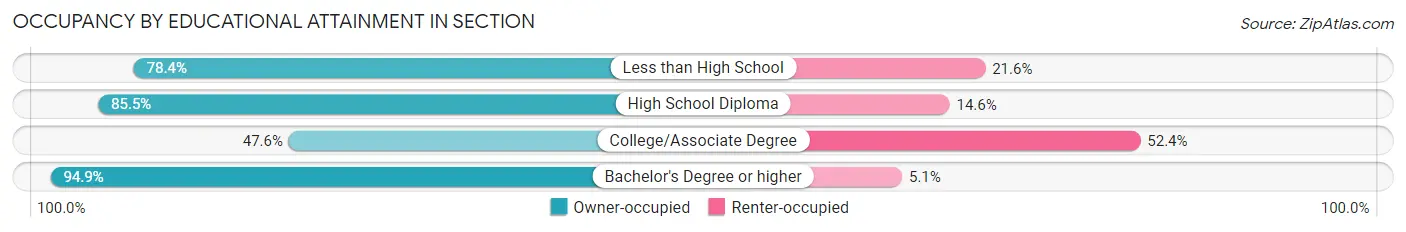
| Household Size | Owner-occupied | Renter-occupied |
| Less than High School | 58 (78.4%) | 16 (21.6%) |
| High School Diploma | 94 (85.5%) | 16 (14.5%) |
| College/Associate Degree | 50 (47.6%) | 55 (52.4%) |
| Bachelor's Degree or higher | 37 (94.9%) | 2 (5.1%) |
Occupancy by Age of Householder in Section
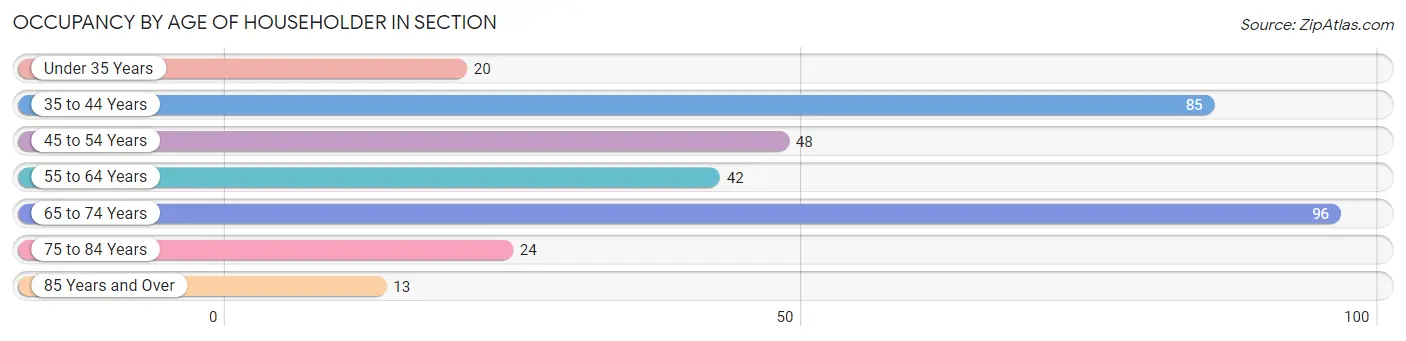
| Age Bracket | # Households | % Households |
| Under 35 Years | 20 | 6.1% |
| 35 to 44 Years | 85 | 25.9% |
| 45 to 54 Years | 48 | 14.6% |
| 55 to 64 Years | 42 | 12.8% |
| 65 to 74 Years | 96 | 29.3% |
| 75 to 84 Years | 24 | 7.3% |
| 85 Years and Over | 13 | 4.0% |
| Total | 328 | 100.0% |
Housing Finances in Section
Median Income by Occupancy in Section
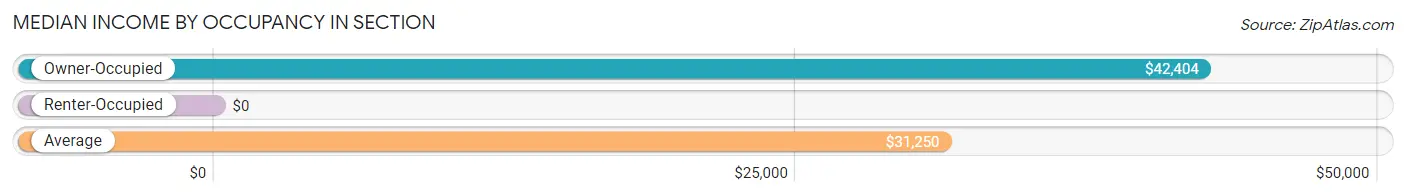
| Occupancy Type | # Households | Median Income |
| Owner-Occupied | 239 (72.9%) | $42,404 |
| Renter-Occupied | 89 (27.1%) | $0 |
| Average | 328 (100.0%) | $31,250 |
Occupancy by Householder Income Bracket in Section
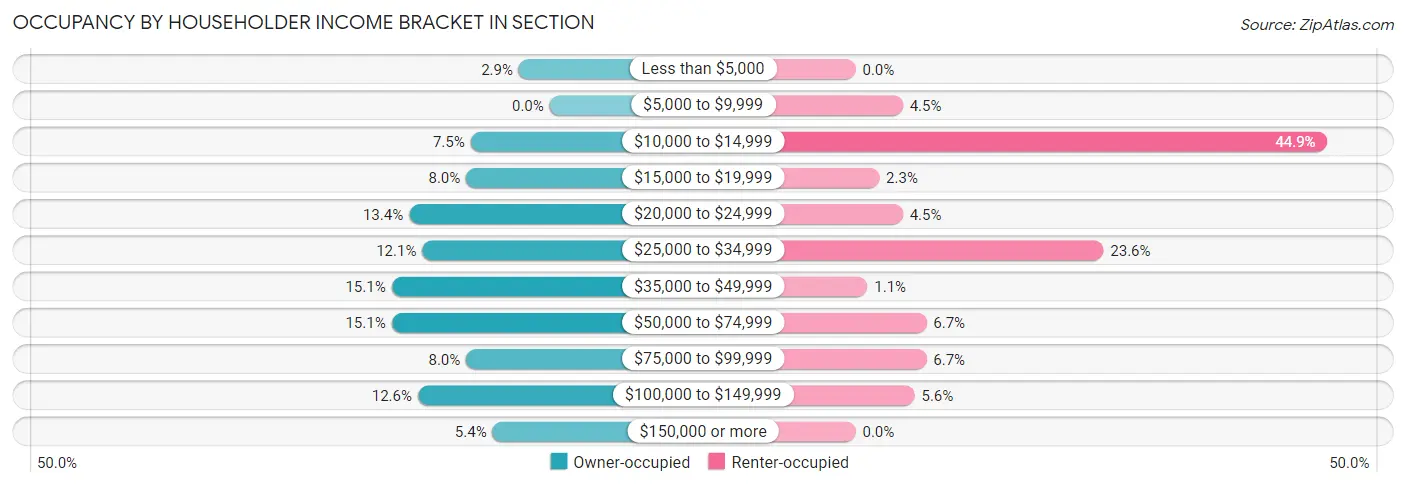
| Income Bracket | Owner-occupied | Renter-occupied |
| Less than $5,000 | 7 (2.9%) | 0 (0.0%) |
| $5,000 to $9,999 | 0 (0.0%) | 4 (4.5%) |
| $10,000 to $14,999 | 18 (7.5%) | 40 (44.9%) |
| $15,000 to $19,999 | 19 (8.0%) | 2 (2.2%) |
| $20,000 to $24,999 | 32 (13.4%) | 4 (4.5%) |
| $25,000 to $34,999 | 29 (12.1%) | 21 (23.6%) |
| $35,000 to $49,999 | 36 (15.1%) | 1 (1.1%) |
| $50,000 to $74,999 | 36 (15.1%) | 6 (6.7%) |
| $75,000 to $99,999 | 19 (8.0%) | 6 (6.7%) |
| $100,000 to $149,999 | 30 (12.6%) | 5 (5.6%) |
| $150,000 or more | 13 (5.4%) | 0 (0.0%) |
| Total | 239 (100.0%) | 89 (100.0%) |
Monthly Housing Cost Tiers in Section
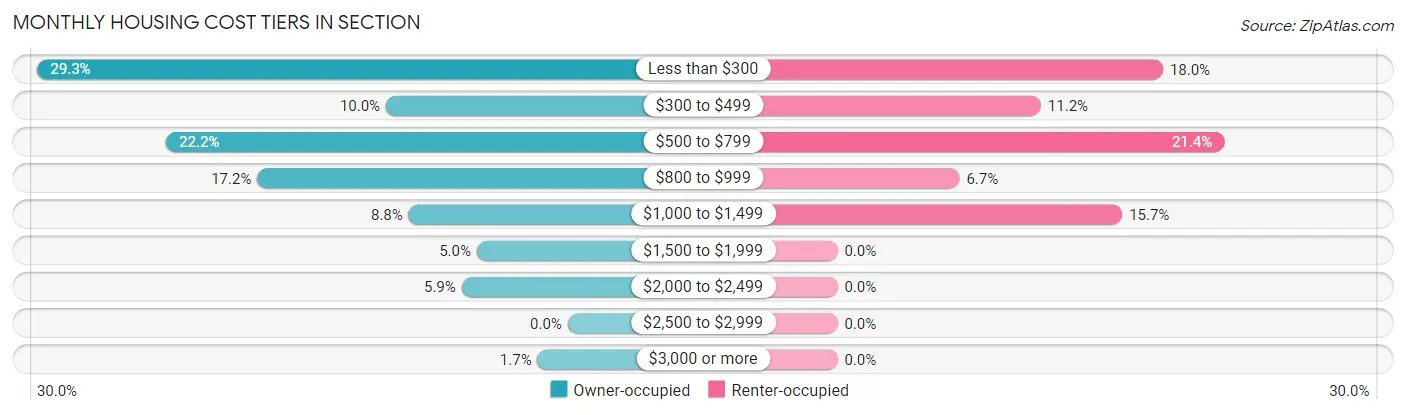
| Monthly Cost | Owner-occupied | Renter-occupied |
| Less than $300 | 70 (29.3%) | 16 (18.0%) |
| $300 to $499 | 24 (10.0%) | 10 (11.2%) |
| $500 to $799 | 53 (22.2%) | 19 (21.3%) |
| $800 to $999 | 41 (17.2%) | 6 (6.7%) |
| $1,000 to $1,499 | 21 (8.8%) | 14 (15.7%) |
| $1,500 to $1,999 | 12 (5.0%) | 0 (0.0%) |
| $2,000 to $2,499 | 14 (5.9%) | 0 (0.0%) |
| $2,500 to $2,999 | 0 (0.0%) | 0 (0.0%) |
| $3,000 or more | 4 (1.7%) | 0 (0.0%) |
| Total | 239 (100.0%) | 89 (100.0%) |
Physical Housing Characteristics in Section
Housing Structures in Section
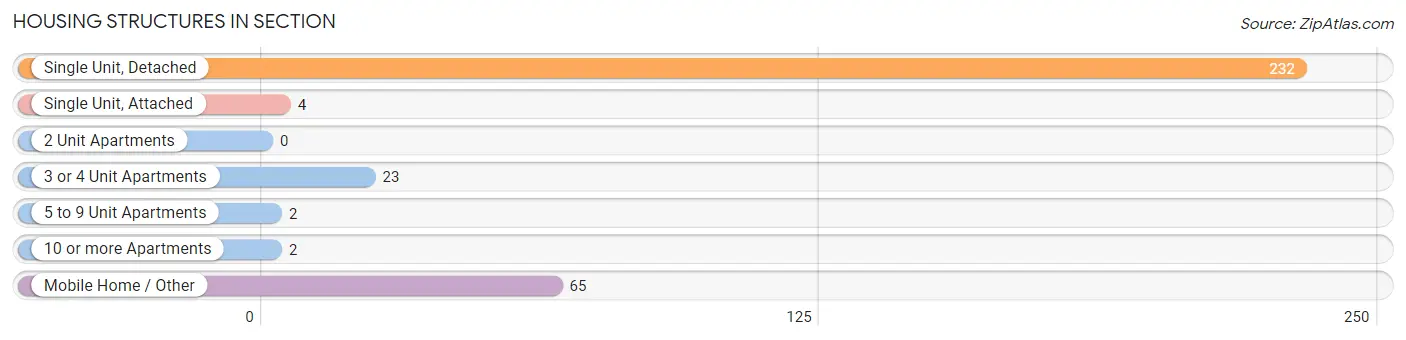
| Structure Type | # Housing Units | % Housing Units |
| Single Unit, Detached | 232 | 70.7% |
| Single Unit, Attached | 4 | 1.2% |
| 2 Unit Apartments | 0 | 0.0% |
| 3 or 4 Unit Apartments | 23 | 7.0% |
| 5 to 9 Unit Apartments | 2 | 0.6% |
| 10 or more Apartments | 2 | 0.6% |
| Mobile Home / Other | 65 | 19.8% |
| Total | 328 | 100.0% |
Housing Structures by Occupancy in Section
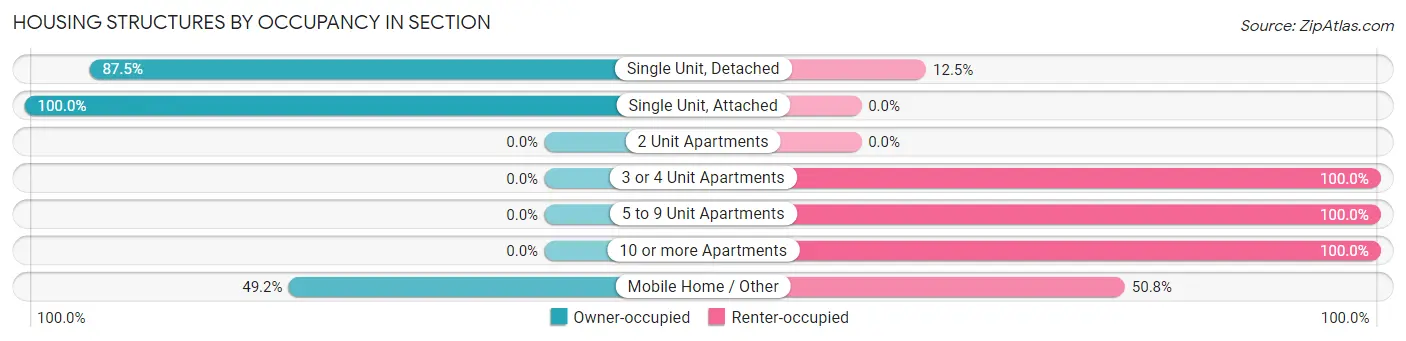
| Structure Type | Owner-occupied | Renter-occupied |
| Single Unit, Detached | 203 (87.5%) | 29 (12.5%) |
| Single Unit, Attached | 4 (100.0%) | 0 (0.0%) |
| 2 Unit Apartments | 0 (0.0%) | 0 (0.0%) |
| 3 or 4 Unit Apartments | 0 (0.0%) | 23 (100.0%) |
| 5 to 9 Unit Apartments | 0 (0.0%) | 2 (100.0%) |
| 10 or more Apartments | 0 (0.0%) | 2 (100.0%) |
| Mobile Home / Other | 32 (49.2%) | 33 (50.8%) |
| Total | 239 (72.9%) | 89 (27.1%) |
Housing Structures by Number of Rooms in Section
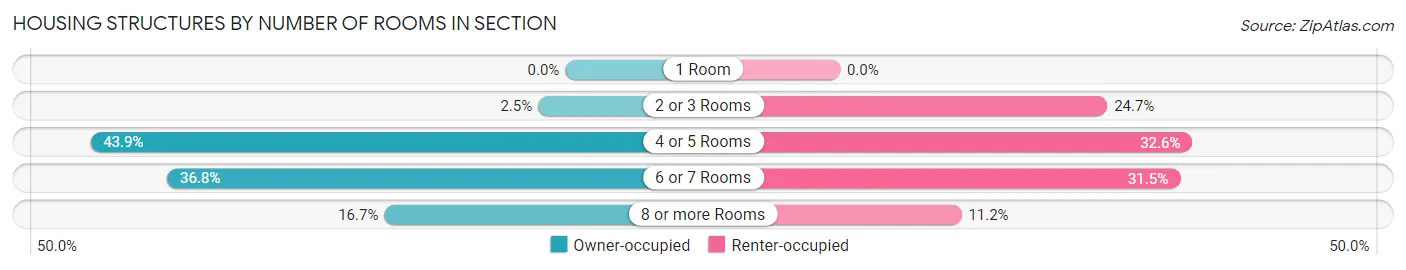
| Number of Rooms | Owner-occupied | Renter-occupied |
| 1 Room | 0 (0.0%) | 0 (0.0%) |
| 2 or 3 Rooms | 6 (2.5%) | 22 (24.7%) |
| 4 or 5 Rooms | 105 (43.9%) | 29 (32.6%) |
| 6 or 7 Rooms | 88 (36.8%) | 28 (31.5%) |
| 8 or more Rooms | 40 (16.7%) | 10 (11.2%) |
| Total | 239 (100.0%) | 89 (100.0%) |
Housing Structure by Heating Type in Section
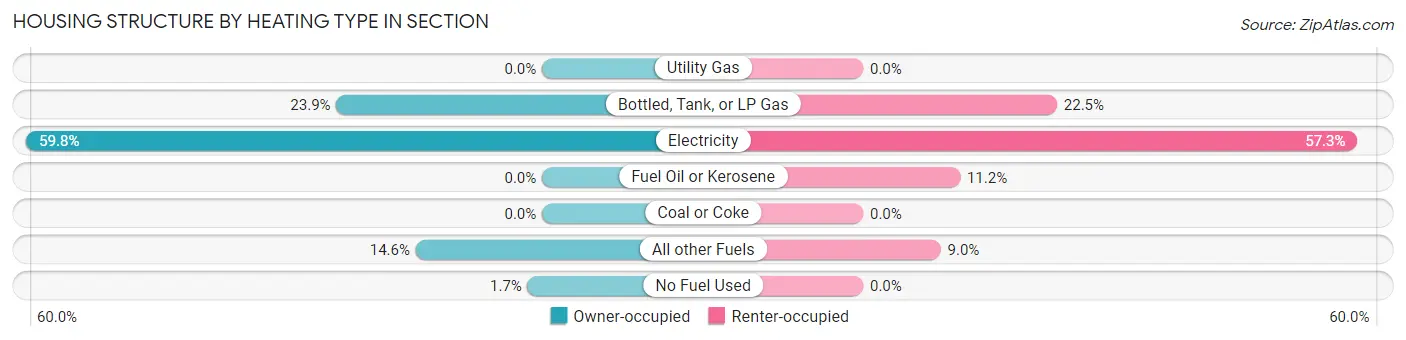
| Heating Type | Owner-occupied | Renter-occupied |
| Utility Gas | 0 (0.0%) | 0 (0.0%) |
| Bottled, Tank, or LP Gas | 57 (23.8%) | 20 (22.5%) |
| Electricity | 143 (59.8%) | 51 (57.3%) |
| Fuel Oil or Kerosene | 0 (0.0%) | 10 (11.2%) |
| Coal or Coke | 0 (0.0%) | 0 (0.0%) |
| All other Fuels | 35 (14.6%) | 8 (9.0%) |
| No Fuel Used | 4 (1.7%) | 0 (0.0%) |
| Total | 239 (100.0%) | 89 (100.0%) |
Household Vehicle Usage in Section
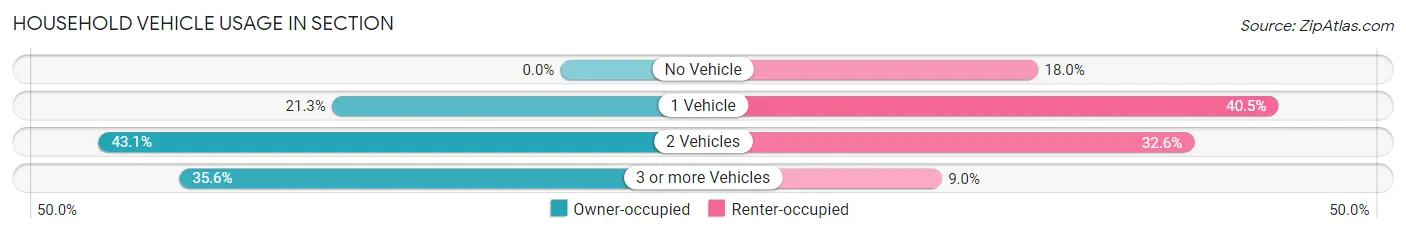
| Vehicles per Household | Owner-occupied | Renter-occupied |
| No Vehicle | 0 (0.0%) | 16 (18.0%) |
| 1 Vehicle | 51 (21.3%) | 36 (40.5%) |
| 2 Vehicles | 103 (43.1%) | 29 (32.6%) |
| 3 or more Vehicles | 85 (35.6%) | 8 (9.0%) |
| Total | 239 (100.0%) | 89 (100.0%) |
Real Estate & Mortgages in Section
Real Estate and Mortgage Overview in Section
| Characteristic | Without Mortgage | With Mortgage |
| Housing Units | 130 | 109 |
| Median Property Value | $117,500 | $140,900 |
| Median Household Income | $32,500 | $10 |
| Monthly Housing Costs | $284 | $4 |
| Real Estate Taxes | $472 | $3 |
Property Value by Mortgage Status in Section
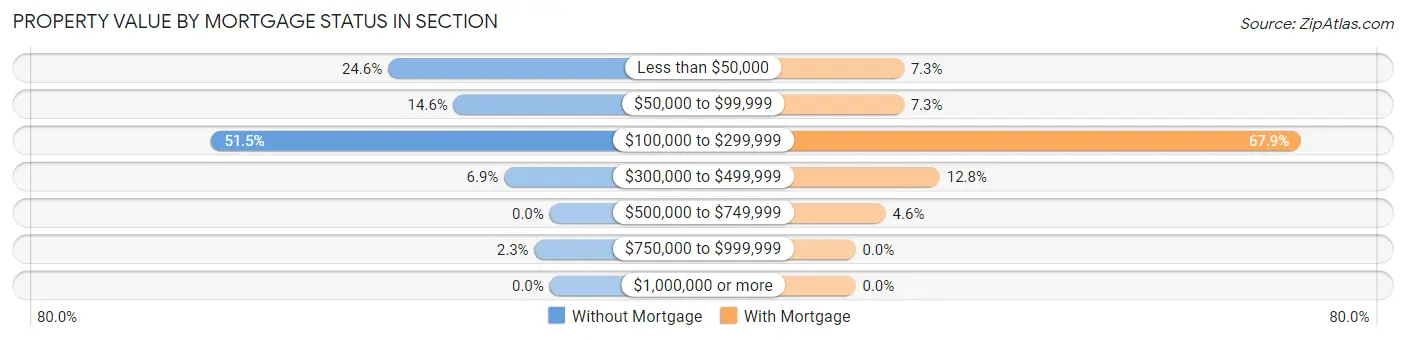
| Property Value | Without Mortgage | With Mortgage |
| Less than $50,000 | 32 (24.6%) | 8 (7.3%) |
| $50,000 to $99,999 | 19 (14.6%) | 8 (7.3%) |
| $100,000 to $299,999 | 67 (51.5%) | 74 (67.9%) |
| $300,000 to $499,999 | 9 (6.9%) | 14 (12.8%) |
| $500,000 to $749,999 | 0 (0.0%) | 5 (4.6%) |
| $750,000 to $999,999 | 3 (2.3%) | 0 (0.0%) |
| $1,000,000 or more | 0 (0.0%) | 0 (0.0%) |
| Total | 130 (100.0%) | 109 (100.0%) |
Household Income by Mortgage Status in Section
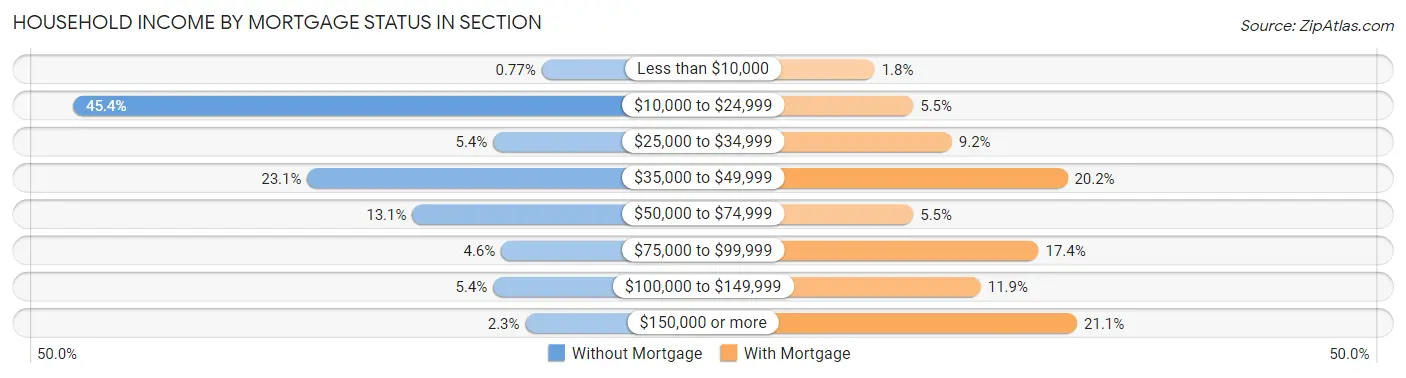
| Household Income | Without Mortgage | With Mortgage |
| Less than $10,000 | 1 (0.8%) | 2 (1.8%) |
| $10,000 to $24,999 | 59 (45.4%) | 6 (5.5%) |
| $25,000 to $34,999 | 7 (5.4%) | 10 (9.2%) |
| $35,000 to $49,999 | 30 (23.1%) | 22 (20.2%) |
| $50,000 to $74,999 | 17 (13.1%) | 6 (5.5%) |
| $75,000 to $99,999 | 6 (4.6%) | 19 (17.4%) |
| $100,000 to $149,999 | 7 (5.4%) | 13 (11.9%) |
| $150,000 or more | 3 (2.3%) | 23 (21.1%) |
| Total | 130 (100.0%) | 109 (100.0%) |
Property Value to Household Income Ratio in Section
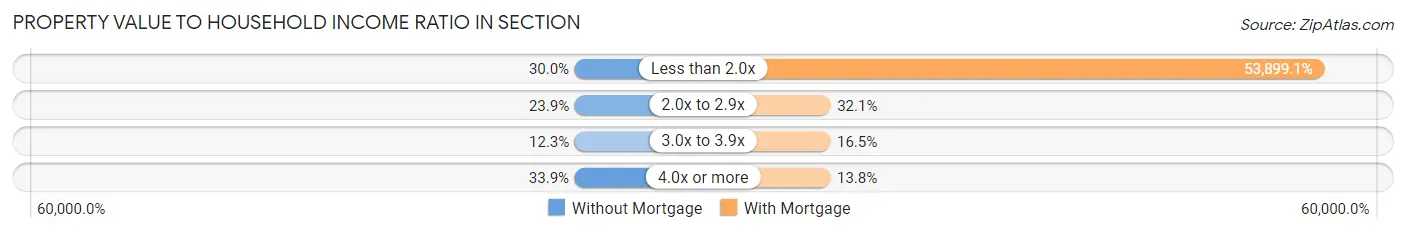
| Value-to-Income Ratio | Without Mortgage | With Mortgage |
| Less than 2.0x | 39 (30.0%) | 58,750 (53,899.1%) |
| 2.0x to 2.9x | 31 (23.8%) | 35 (32.1%) |
| 3.0x to 3.9x | 16 (12.3%) | 18 (16.5%) |
| 4.0x or more | 44 (33.9%) | 15 (13.8%) |
| Total | 130 (100.0%) | 109 (100.0%) |
Real Estate Taxes by Mortgage Status in Section
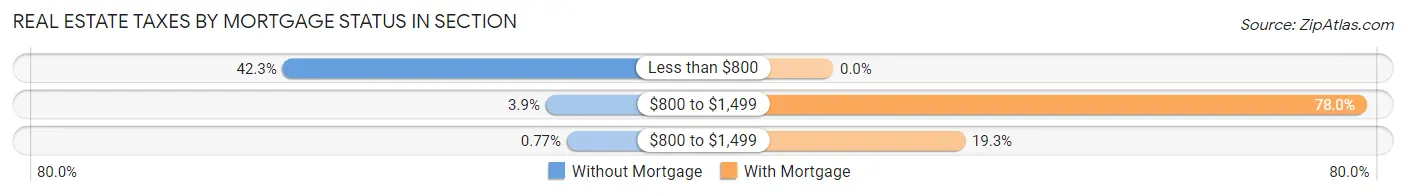
| Property Taxes | Without Mortgage | With Mortgage |
| Less than $800 | 55 (42.3%) | 0 (0.0%) |
| $800 to $1,499 | 5 (3.8%) | 85 (78.0%) |
| $800 to $1,499 | 1 (0.8%) | 21 (19.3%) |
| Total | 130 (100.0%) | 109 (100.0%) |
Health & Disability in Section
Health Insurance Coverage by Age in Section
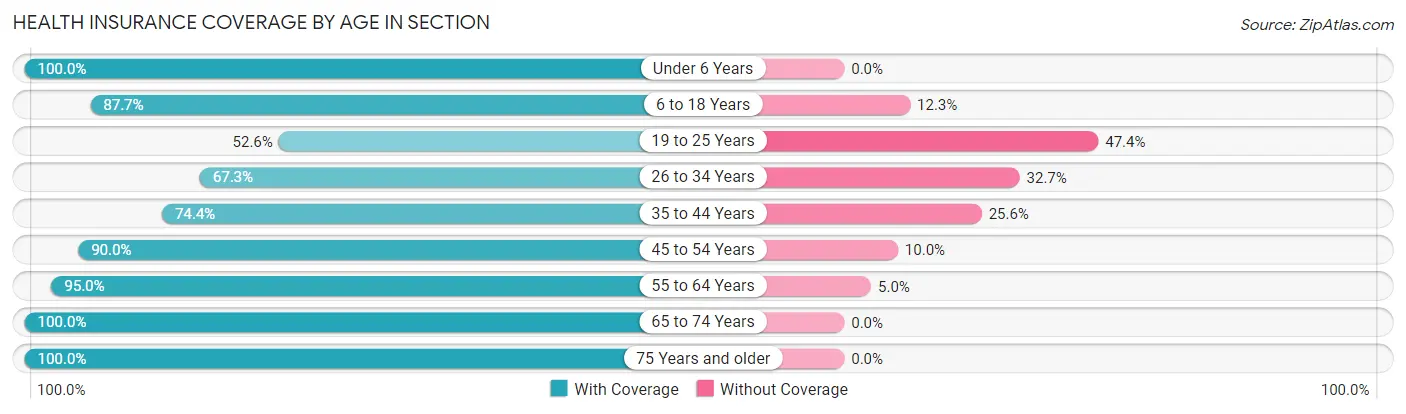
| Age Bracket | With Coverage | Without Coverage |
| Under 6 Years | 47 (100.0%) | 0 (0.0%) |
| 6 to 18 Years | 143 (87.7%) | 20 (12.3%) |
| 19 to 25 Years | 30 (52.6%) | 27 (47.4%) |
| 26 to 34 Years | 35 (67.3%) | 17 (32.7%) |
| 35 to 44 Years | 90 (74.4%) | 31 (25.6%) |
| 45 to 54 Years | 108 (90.0%) | 12 (10.0%) |
| 55 to 64 Years | 76 (95.0%) | 4 (5.0%) |
| 65 to 74 Years | 125 (100.0%) | 0 (0.0%) |
| 75 Years and older | 63 (100.0%) | 0 (0.0%) |
| Total | 717 (86.6%) | 111 (13.4%) |
Health Insurance Coverage by Citizenship Status in Section
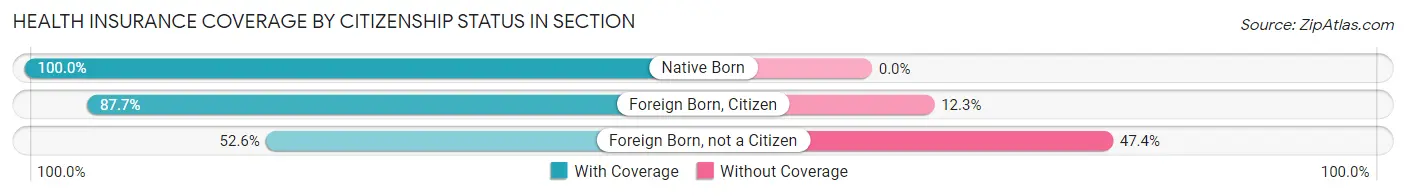
| Citizenship Status | With Coverage | Without Coverage |
| Native Born | 47 (100.0%) | 0 (0.0%) |
| Foreign Born, Citizen | 143 (87.7%) | 20 (12.3%) |
| Foreign Born, not a Citizen | 30 (52.6%) | 27 (47.4%) |
Health Insurance Coverage by Household Income in Section
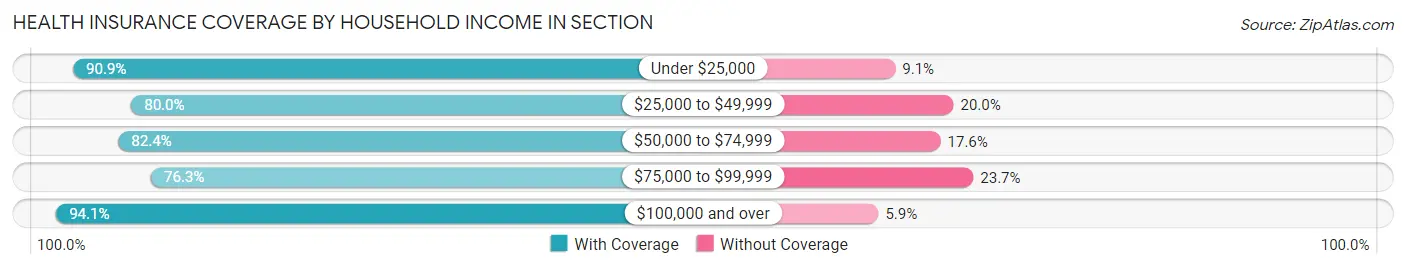
| Household Income | With Coverage | Without Coverage |
| Under $25,000 | 190 (90.9%) | 19 (9.1%) |
| $25,000 to $49,999 | 156 (80.0%) | 39 (20.0%) |
| $50,000 to $74,999 | 75 (82.4%) | 16 (17.6%) |
| $75,000 to $99,999 | 74 (76.3%) | 23 (23.7%) |
| $100,000 and over | 222 (94.1%) | 14 (5.9%) |
Public vs Private Health Insurance Coverage by Age in Section
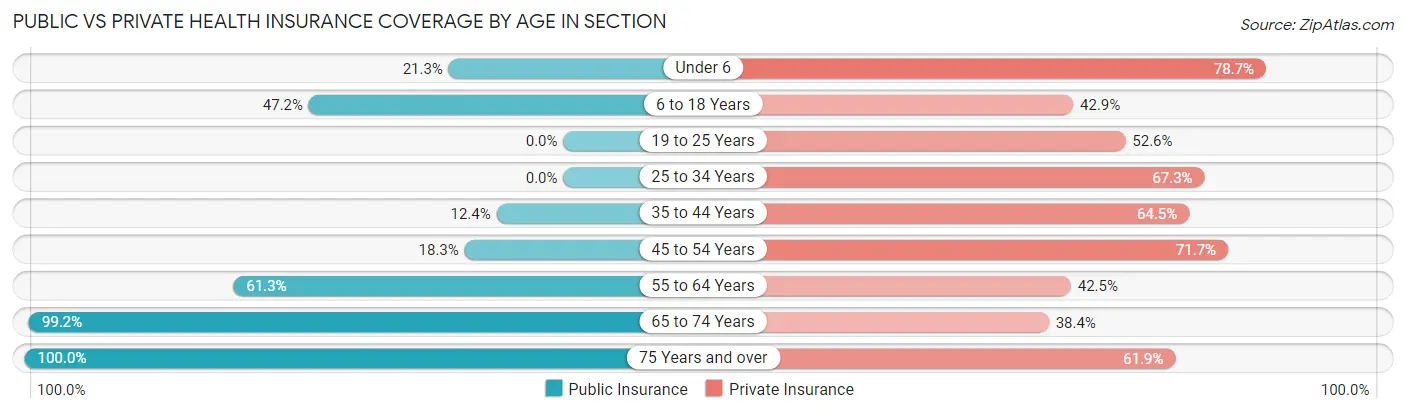
| Age Bracket | Public Insurance | Private Insurance |
| Under 6 | 10 (21.3%) | 37 (78.7%) |
| 6 to 18 Years | 77 (47.2%) | 70 (42.9%) |
| 19 to 25 Years | 0 (0.0%) | 30 (52.6%) |
| 25 to 34 Years | 0 (0.0%) | 35 (67.3%) |
| 35 to 44 Years | 15 (12.4%) | 78 (64.5%) |
| 45 to 54 Years | 22 (18.3%) | 86 (71.7%) |
| 55 to 64 Years | 49 (61.3%) | 34 (42.5%) |
| 65 to 74 Years | 124 (99.2%) | 48 (38.4%) |
| 75 Years and over | 63 (100.0%) | 39 (61.9%) |
| Total | 360 (43.5%) | 457 (55.2%) |
Disability Status by Sex by Age in Section
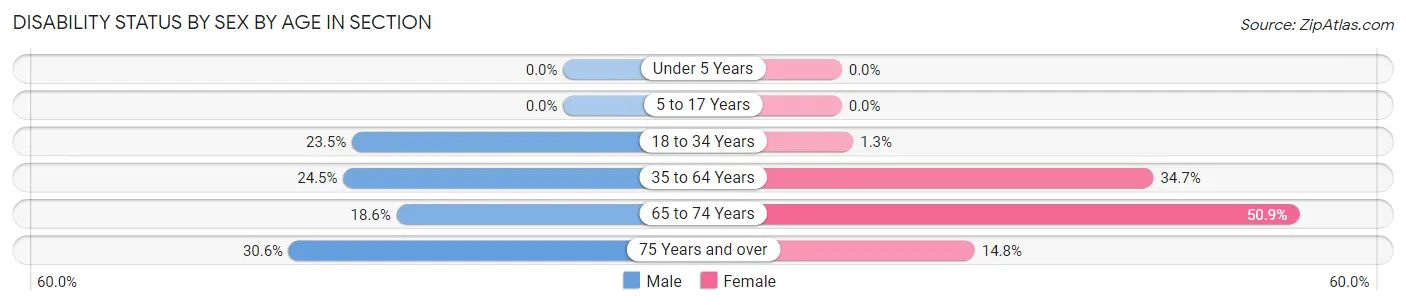
| Age Bracket | Male | Female |
| Under 5 Years | 0 (0.0%) | 0 (0.0%) |
| 5 to 17 Years | 0 (0.0%) | 0 (0.0%) |
| 18 to 34 Years | 12 (23.5%) | 1 (1.3%) |
| 35 to 64 Years | 49 (24.5%) | 42 (34.7%) |
| 65 to 74 Years | 13 (18.6%) | 28 (50.9%) |
| 75 Years and over | 11 (30.6%) | 4 (14.8%) |
Disability Class by Sex by Age in Section
Disability Class: Hearing Difficulty
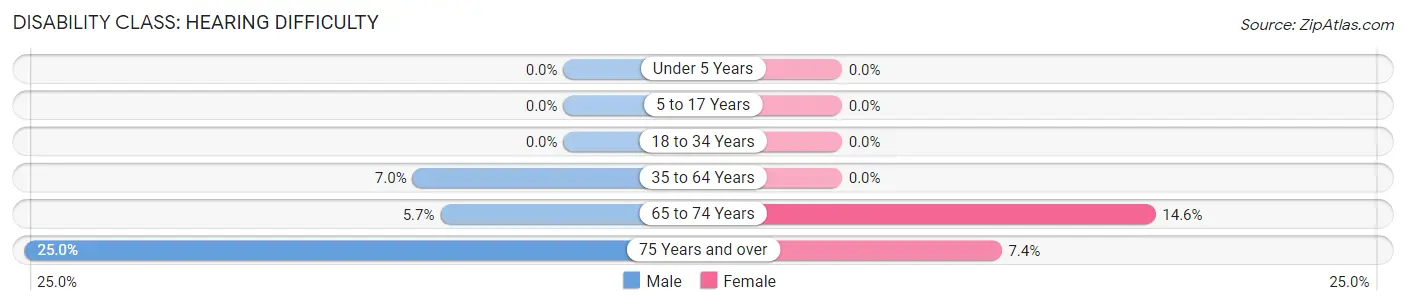
| Age Bracket | Male | Female |
| Under 5 Years | 0 (0.0%) | 0 (0.0%) |
| 5 to 17 Years | 0 (0.0%) | 0 (0.0%) |
| 18 to 34 Years | 0 (0.0%) | 0 (0.0%) |
| 35 to 64 Years | 14 (7.0%) | 0 (0.0%) |
| 65 to 74 Years | 4 (5.7%) | 8 (14.5%) |
| 75 Years and over | 9 (25.0%) | 2 (7.4%) |
Disability Class: Vision Difficulty
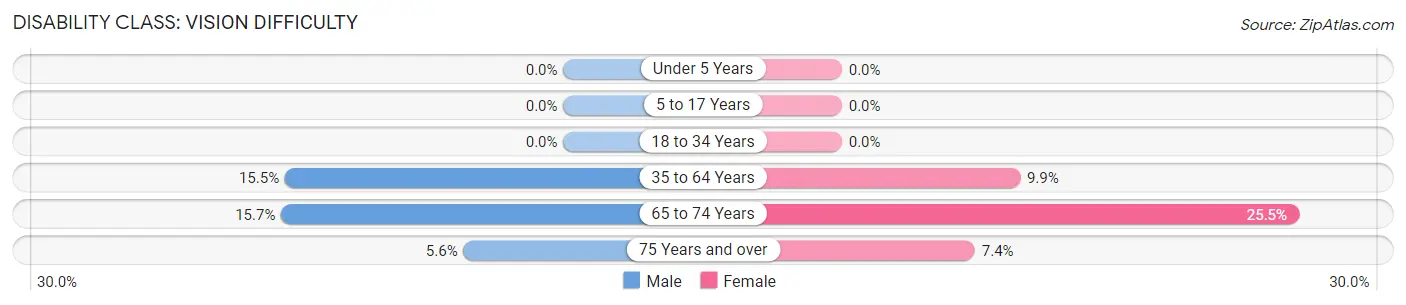
| Age Bracket | Male | Female |
| Under 5 Years | 0 (0.0%) | 0 (0.0%) |
| 5 to 17 Years | 0 (0.0%) | 0 (0.0%) |
| 18 to 34 Years | 0 (0.0%) | 0 (0.0%) |
| 35 to 64 Years | 31 (15.5%) | 12 (9.9%) |
| 65 to 74 Years | 11 (15.7%) | 14 (25.5%) |
| 75 Years and over | 2 (5.6%) | 2 (7.4%) |
Disability Class: Cognitive Difficulty
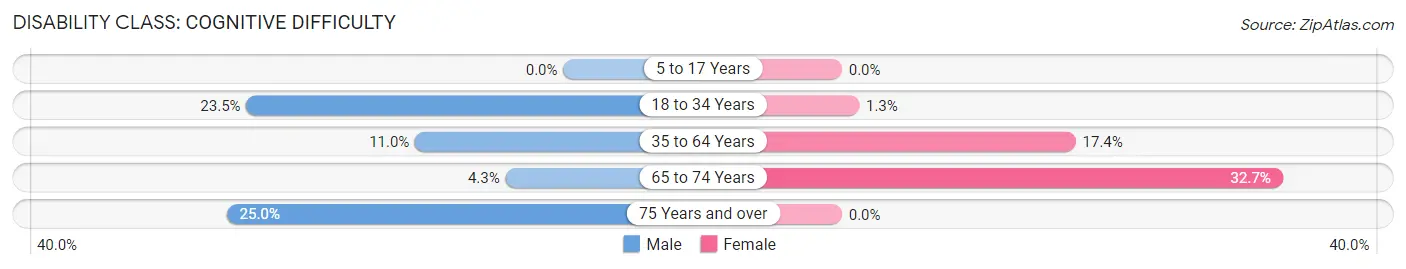
| Age Bracket | Male | Female |
| 5 to 17 Years | 0 (0.0%) | 0 (0.0%) |
| 18 to 34 Years | 12 (23.5%) | 1 (1.3%) |
| 35 to 64 Years | 22 (11.0%) | 21 (17.4%) |
| 65 to 74 Years | 3 (4.3%) | 18 (32.7%) |
| 75 Years and over | 9 (25.0%) | 0 (0.0%) |
Disability Class: Ambulatory Difficulty
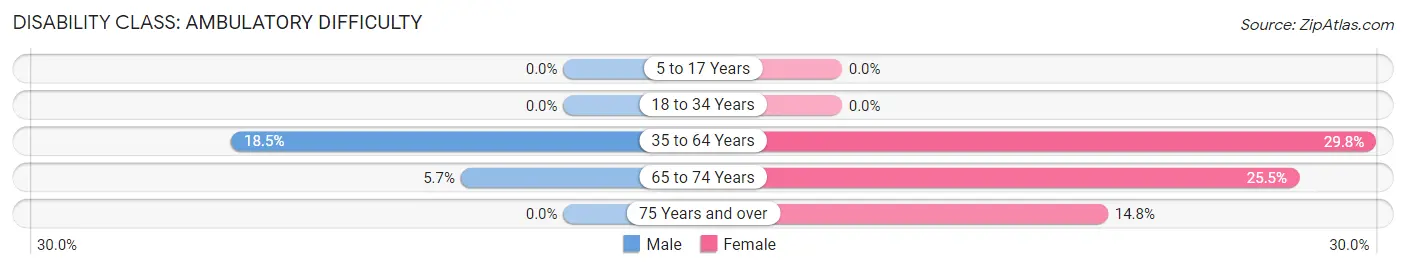
| Age Bracket | Male | Female |
| 5 to 17 Years | 0 (0.0%) | 0 (0.0%) |
| 18 to 34 Years | 0 (0.0%) | 0 (0.0%) |
| 35 to 64 Years | 37 (18.5%) | 36 (29.7%) |
| 65 to 74 Years | 4 (5.7%) | 14 (25.5%) |
| 75 Years and over | 0 (0.0%) | 4 (14.8%) |
Disability Class: Self-Care Difficulty
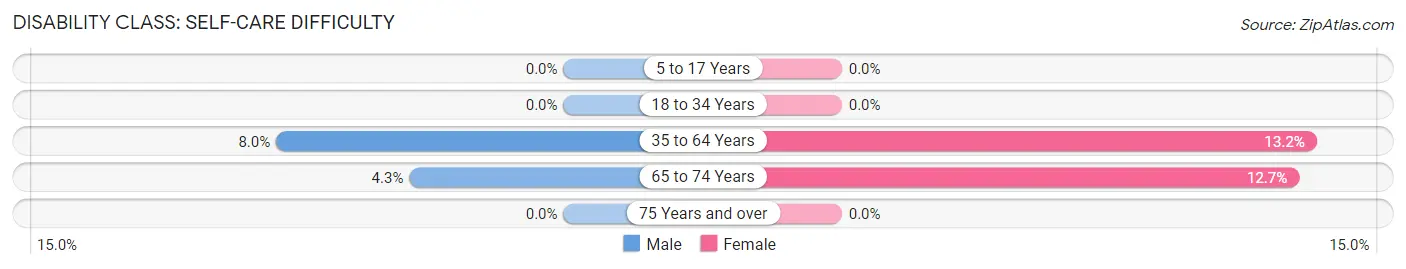
| Age Bracket | Male | Female |
| 5 to 17 Years | 0 (0.0%) | 0 (0.0%) |
| 18 to 34 Years | 0 (0.0%) | 0 (0.0%) |
| 35 to 64 Years | 16 (8.0%) | 16 (13.2%) |
| 65 to 74 Years | 3 (4.3%) | 7 (12.7%) |
| 75 Years and over | 0 (0.0%) | 0 (0.0%) |
Technology Access in Section
Computing Device Access in Section
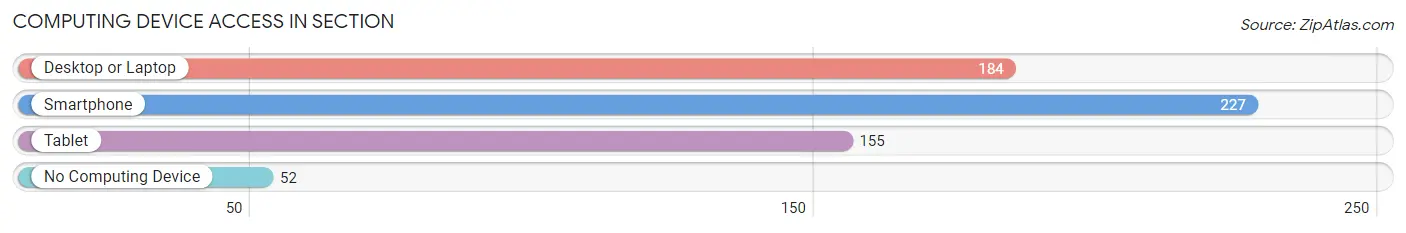
| Device Type | # Households | % Households |
| Desktop or Laptop | 184 | 56.1% |
| Smartphone | 227 | 69.2% |
| Tablet | 155 | 47.3% |
| No Computing Device | 52 | 15.9% |
| Total | 328 | 100.0% |
Internet Access in Section
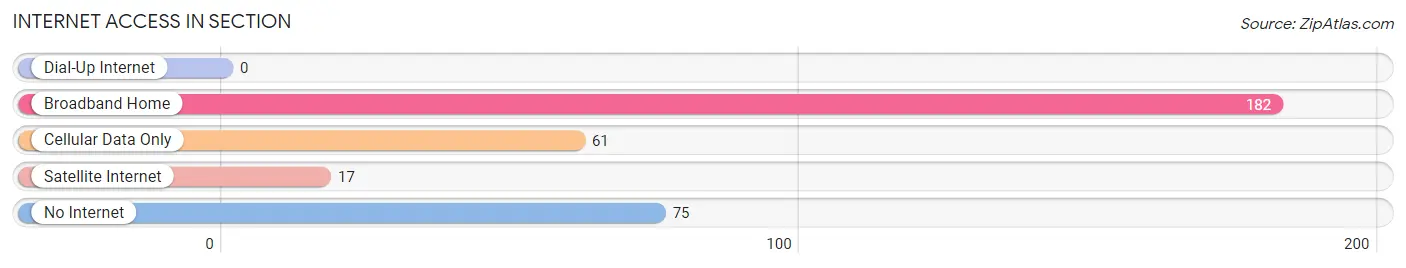
| Internet Type | # Households | % Households |
| Dial-Up Internet | 0 | 0.0% |
| Broadband Home | 182 | 55.5% |
| Cellular Data Only | 61 | 18.6% |
| Satellite Internet | 17 | 5.2% |
| No Internet | 75 | 22.9% |
| Total | 328 | 100.0% |
Section Summary
Alabama is a state located in the southeastern region of the United States. It is bordered by Tennessee to the north, Georgia to the east, Florida and the Gulf of Mexico to the south, and Mississippi to the west. Alabama is the 30th largest state in the United States, with an area of 52,419 square miles (135,765 km2). It is the 24th most populous state, with a population of 4,858,979 as of 2019. The state capital is Montgomery, and the largest city is Birmingham.
Geography
Alabama is located in the southeastern region of the United States. It is bordered by Tennessee to the north, Georgia to the east, Florida and the Gulf of Mexico to the south, and Mississippi to the west. The state is divided into 67 counties, with the Tennessee River forming the northern border. The highest point in the state is Cheaha Mountain, which is 2,407 feet (734 m) above sea level. The state has a humid subtropical climate, with hot, humid summers and mild winters.
Economy
Alabama's economy is largely based on agriculture, forestry, and manufacturing. The state is a major producer of cotton, peanuts, soybeans, poultry, and livestock. It is also a major producer of timber and paper products. The state is home to several major automotive manufacturing plants, including the Mercedes-Benz plant in Vance and the Honda plant in Lincoln. The state is also home to several military bases, including Maxwell Air Force Base and Fort Rucker.
Demographics
As of 2019, the population of Alabama was estimated to be 4,858,979. The state has a population density of 94.3 people per square mile (36.4/km2). The largest racial group in the state is white, making up 68.5% of the population. African Americans make up 26.2% of the population, while Hispanics and Latinos make up 4.2%. The median household income in the state is $48,123, and the median age is 38.7 years.
Education
Alabama is home to several public and private universities, including the University of Alabama, Auburn University, and the University of South Alabama. The state also has a large network of public schools, with over 1,500 schools and more than 700,000 students. The state also has several community colleges and technical schools.
Conclusion
Alabama is a state located in the southeastern region of the United States. It is bordered by Tennessee to the north, Georgia to the east, Florida and the Gulf of Mexico to the south, and Mississippi to the west. The state has a humid subtropical climate, with hot, humid summers and mild winters. The economy of the state is largely based on agriculture, forestry, and manufacturing. The population of the state is estimated to be 4,858,979, with the largest racial group being white. The state is home to several public and private universities, as well as a large network of public schools.
Common Questions
What is Per Capita Income in Section?
Per Capita income in Section is $25,631.
What is the Median Family Income in Section?
Median Family Income in Section is $46,000.
What is the Median Household income in Section?
Median Household Income in Section is $31,250.
What is Income or Wage Gap in Section?
Income or Wage Gap in Section is 24.1%.
Women in Section earn 75.9 cents for every dollar earned by a man.
What is Inequality or Gini Index in Section?
Inequality or Gini Index in Section is 0.46.
What is the Total Population of Section?
Total Population of Section is 828.
What is the Total Male Population of Section?
Total Male Population of Section is 445.
What is the Total Female Population of Section?
Total Female Population of Section is 383.
What is the Ratio of Males per 100 Females in Section?
There are 116.19 Males per 100 Females in Section.
What is the Ratio of Females per 100 Males in Section?
There are 86.07 Females per 100 Males in Section.
What is the Median Population Age in Section?
Median Population Age in Section is 44.4 Years.
What is the Average Family Size in Section
Average Family Size in Section is 3.4 People.
What is the Average Household Size in Section
Average Household Size in Section is 2.5 People.
How Large is the Labor Force in Section?
There are 316 People in the Labor Forcein in Section.
What is the Percentage of People in the Labor Force in Section?
48.2% of People are in the Labor Force in Section.
What is the Unemployment Rate in Section?
Unemployment Rate in Section is 3.5%.