Southside, AL Map & Demographics
Southside Map
Southside Overview
$32,630
PER CAPITA INCOME
$73,646
AVG FAMILY INCOME
$70,843
AVG HOUSEHOLD INCOME
34.0%
WAGE / INCOME GAP [ % ]
66.0¢/ $1
WAGE / INCOME GAP [ $ ]
0.38
INEQUALITY / GINI INDEX
9,358
TOTAL POPULATION
4,636
MALE POPULATION
4,722
FEMALE POPULATION
98.18
MALES / 100 FEMALES
101.86
FEMALES / 100 MALES
41.0
MEDIAN AGE
3.4
AVG FAMILY SIZE
3.0
AVG HOUSEHOLD SIZE
4,263
LABOR FORCE [ PEOPLE ]
59.4%
PERCENT IN LABOR FORCE
3.4%
UNEMPLOYMENT RATE
Southside Area Codes
Income in Southside
Income Overview in Southside
Per Capita Income in Southside is $32,630, while median incomes of families and households are $73,646 and $70,843 respectively.
| Characteristic | Number | Measure |
| Per Capita Income | 9,358 | $32,630 |
| Median Family Income | 2,336 | $73,646 |
| Mean Family Income | 2,336 | $96,197 |
| Median Household Income | 3,070 | $70,843 |
| Mean Household Income | 3,070 | $90,056 |
| Income Deficit | 2,336 | $0 |
| Wage / Income Gap (%) | 9,358 | 33.98% |
| Wage / Income Gap ($) | 9,358 | 66.02¢ per $1 |
| Gini / Inequality Index | 9,358 | 0.38 |
Earnings by Sex in Southside
Average Earnings in Southside are $43,244, $52,468 for men and $34,641 for women, a difference of 34.0%.
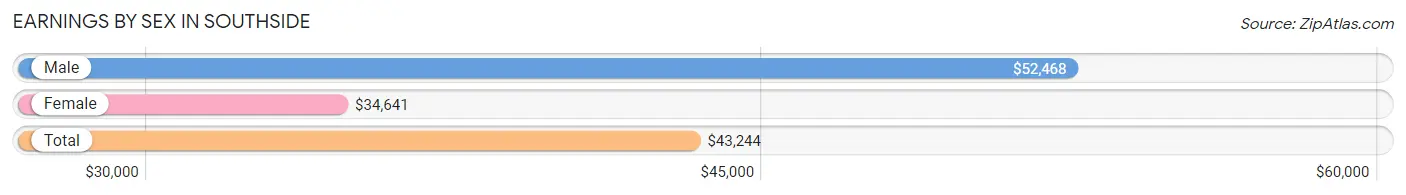
| Sex | Number | Average Earnings |
| Male | 2,258 (50.4%) | $52,468 |
| Female | 2,219 (49.6%) | $34,641 |
| Total | 4,477 (100.0%) | $43,244 |
Earnings by Sex by Income Bracket in Southside
The most common earnings brackets in Southside are $55,000 to $64,999 for men (410 | 18.2%) and $55,000 to $64,999 for women (316 | 14.2%).
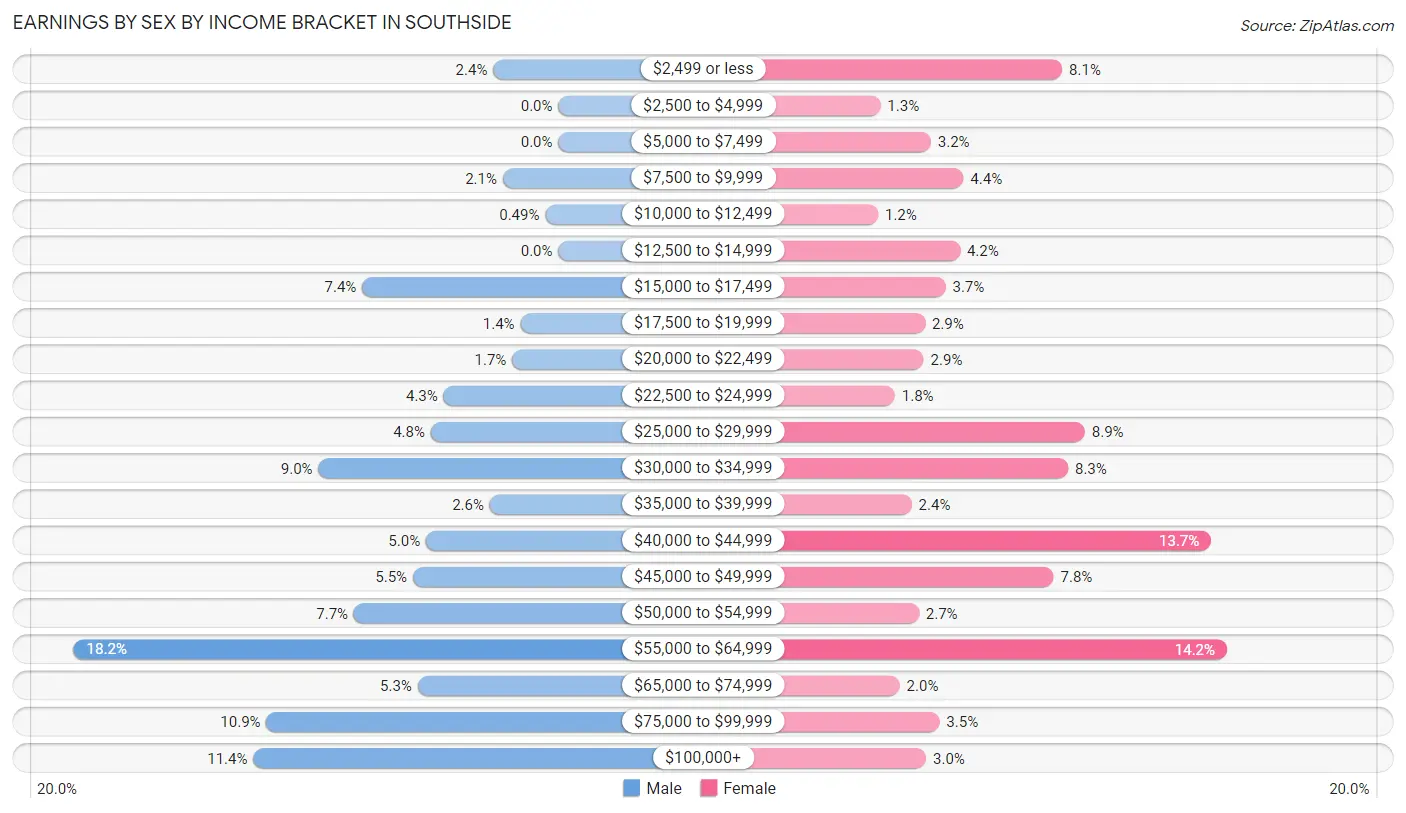
| Income | Male | Female |
| $2,499 or less | 55 (2.4%) | 179 (8.1%) |
| $2,500 to $4,999 | 0 (0.0%) | 28 (1.3%) |
| $5,000 to $7,499 | 0 (0.0%) | 70 (3.2%) |
| $7,500 to $9,999 | 47 (2.1%) | 97 (4.4%) |
| $10,000 to $12,499 | 11 (0.5%) | 26 (1.2%) |
| $12,500 to $14,999 | 0 (0.0%) | 94 (4.2%) |
| $15,000 to $17,499 | 166 (7.3%) | 82 (3.7%) |
| $17,500 to $19,999 | 32 (1.4%) | 65 (2.9%) |
| $20,000 to $22,499 | 39 (1.7%) | 64 (2.9%) |
| $22,500 to $24,999 | 97 (4.3%) | 40 (1.8%) |
| $25,000 to $29,999 | 108 (4.8%) | 198 (8.9%) |
| $30,000 to $34,999 | 203 (9.0%) | 184 (8.3%) |
| $35,000 to $39,999 | 58 (2.6%) | 54 (2.4%) |
| $40,000 to $44,999 | 112 (5.0%) | 303 (13.7%) |
| $45,000 to $49,999 | 123 (5.4%) | 172 (7.7%) |
| $50,000 to $54,999 | 173 (7.7%) | 60 (2.7%) |
| $55,000 to $64,999 | 410 (18.2%) | 316 (14.2%) |
| $65,000 to $74,999 | 119 (5.3%) | 44 (2.0%) |
| $75,000 to $99,999 | 247 (10.9%) | 77 (3.5%) |
| $100,000+ | 258 (11.4%) | 66 (3.0%) |
| Total | 2,258 (100.0%) | 2,219 (100.0%) |
Earnings by Sex by Educational Attainment in Southside
Average earnings in Southside are $55,377 for men and $40,993 for women, a difference of 26.0%. Men with an educational attainment of graduate degree enjoy the highest average annual earnings of $178,503, while those with less than high school education earn the least with $45,717. Women with an educational attainment of graduate degree earn the most with the average annual earnings of $58,775, while those with college or associate's degree education have the smallest earnings of $32,390.
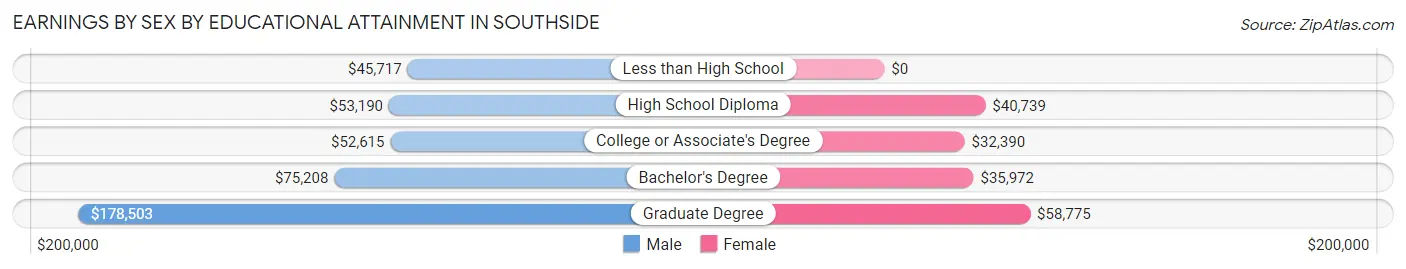
| Educational Attainment | Male Income | Female Income |
| Less than High School | $45,717 | $0 |
| High School Diploma | $53,190 | $40,739 |
| College or Associate's Degree | $52,615 | $32,390 |
| Bachelor's Degree | $75,208 | $35,972 |
| Graduate Degree | $178,503 | $58,775 |
| Total | $55,377 | $40,993 |
Family Income in Southside
Family Income Brackets in Southside
According to the Southside family income data, there are 584 families falling into the $50,000 to $74,999 income range, which is the most common income bracket and makes up 25.0% of all families.
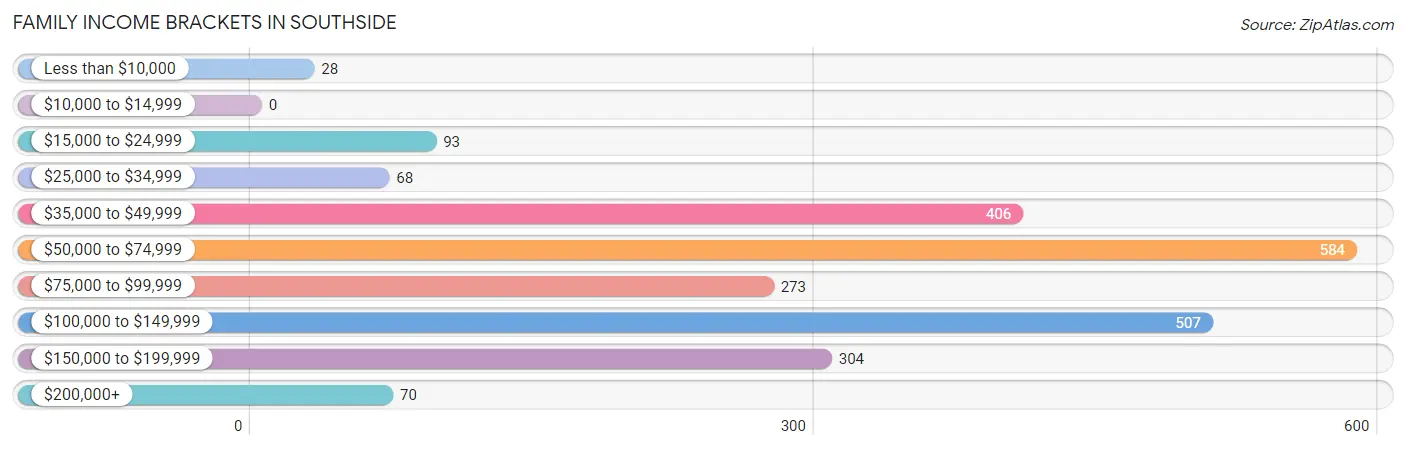
| Income Bracket | # Families | % Families |
| Less than $10,000 | 28 | 1.2% |
| $10,000 to $14,999 | 0 | 0.0% |
| $15,000 to $24,999 | 93 | 4.0% |
| $25,000 to $34,999 | 68 | 2.9% |
| $35,000 to $49,999 | 406 | 17.4% |
| $50,000 to $74,999 | 584 | 25.0% |
| $75,000 to $99,999 | 273 | 11.7% |
| $100,000 to $149,999 | 507 | 21.7% |
| $150,000 to $199,999 | 304 | 13.0% |
| $200,000+ | 70 | 3.0% |
Family Income by Famaliy Size in Southside
5-person families (165 | 7.1%) account for the highest median family income in Southside with $159,531 per family, while 2-person families (1,206 | 51.6%) have the highest median income of $35,228 per family member.
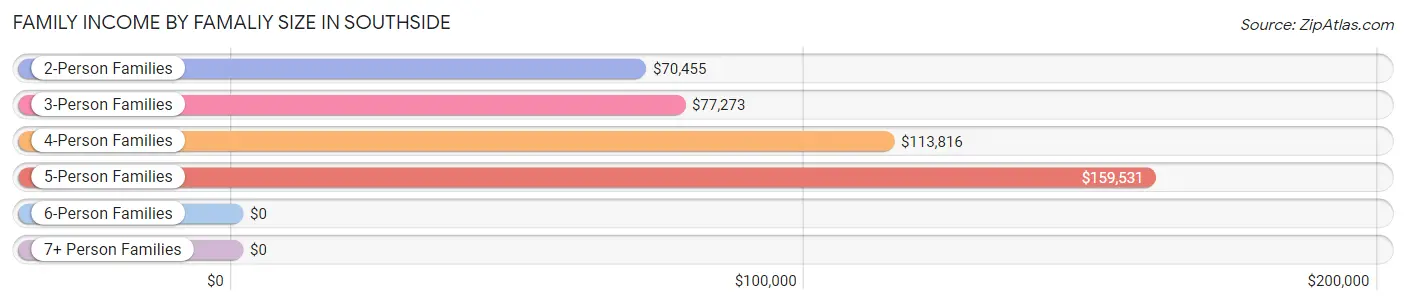
| Income Bracket | # Families | Median Income |
| 2-Person Families | 1,206 (51.6%) | $70,455 |
| 3-Person Families | 558 (23.9%) | $77,273 |
| 4-Person Families | 276 (11.8%) | $113,816 |
| 5-Person Families | 165 (7.1%) | $159,531 |
| 6-Person Families | 122 (5.2%) | $0 |
| 7+ Person Families | 9 (0.4%) | $0 |
| Total | 2,336 (100.0%) | $73,646 |
Family Income by Number of Earners in Southside
The median family income in Southside is $73,646, with families comprising 3+ earners (116) having the highest median family income of $138,100, while families with 1 earner (703) have the lowest median family income of $60,997, accounting for 5.0% and 30.1% of families, respectively.
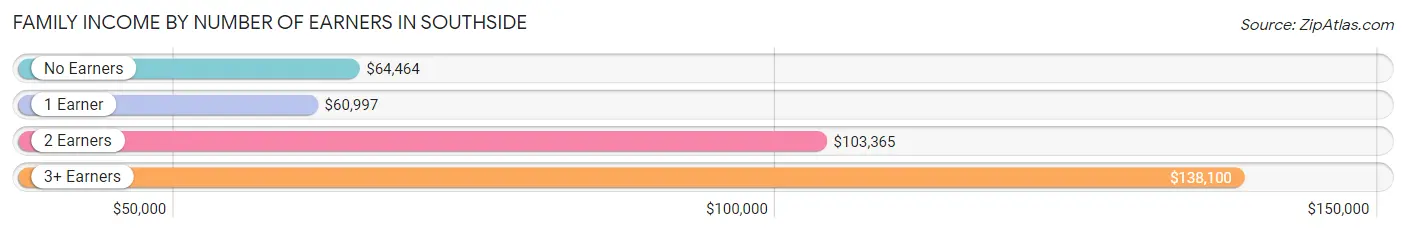
| Number of Earners | # Families | Median Income |
| No Earners | 505 (21.6%) | $64,464 |
| 1 Earner | 703 (30.1%) | $60,997 |
| 2 Earners | 1,012 (43.3%) | $103,365 |
| 3+ Earners | 116 (5.0%) | $138,100 |
| Total | 2,336 (100.0%) | $73,646 |
Household Income in Southside
Household Income Brackets in Southside
With 731 households falling in the category, the $50,000 to $74,999 income range is the most frequent in Southside, accounting for 23.8% of all households. In contrast, only 6 households (0.2%) fall into the $10,000 to $14,999 income bracket, making it the least populous group.
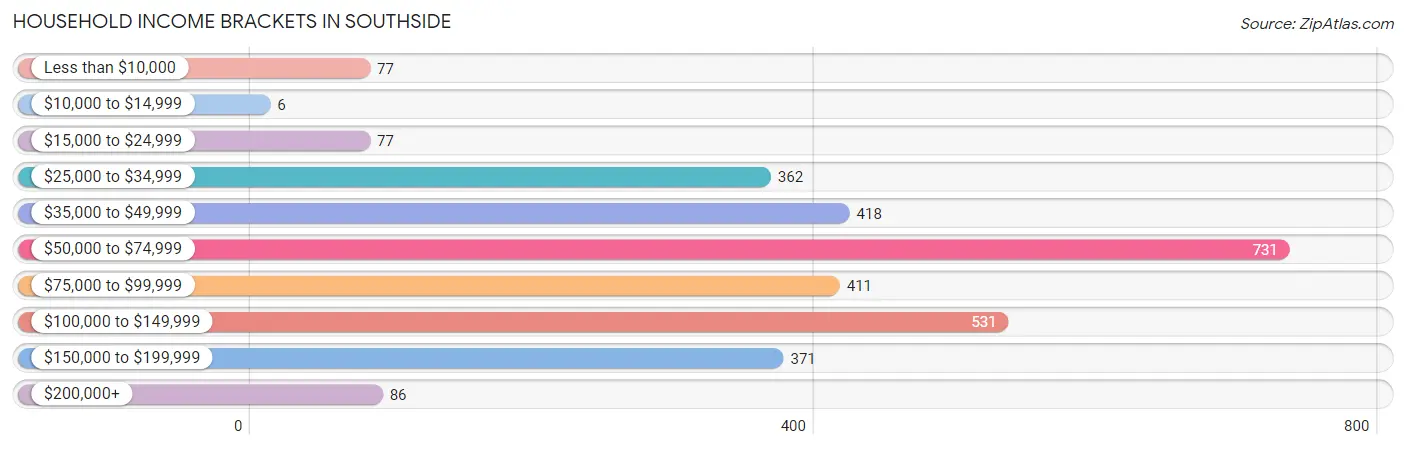
| Income Bracket | # Households | % Households |
| Less than $10,000 | 77 | 2.5% |
| $10,000 to $14,999 | 6 | 0.2% |
| $15,000 to $24,999 | 77 | 2.5% |
| $25,000 to $34,999 | 362 | 11.8% |
| $35,000 to $49,999 | 418 | 13.6% |
| $50,000 to $74,999 | 731 | 23.8% |
| $75,000 to $99,999 | 411 | 13.4% |
| $100,000 to $149,999 | 531 | 17.3% |
| $150,000 to $199,999 | 371 | 12.1% |
| $200,000+ | 86 | 2.8% |
Household Income by Householder Age in Southside
The median household income in Southside is $70,843, with the highest median household income of $92,765 found in the 45 to 64 years age bracket for the primary householder. A total of 1,225 households (39.9%) fall into this category. Meanwhile, the 15 to 24 years age bracket for the primary householder has the lowest median household income of $0, with 24 households (0.8%) in this group.
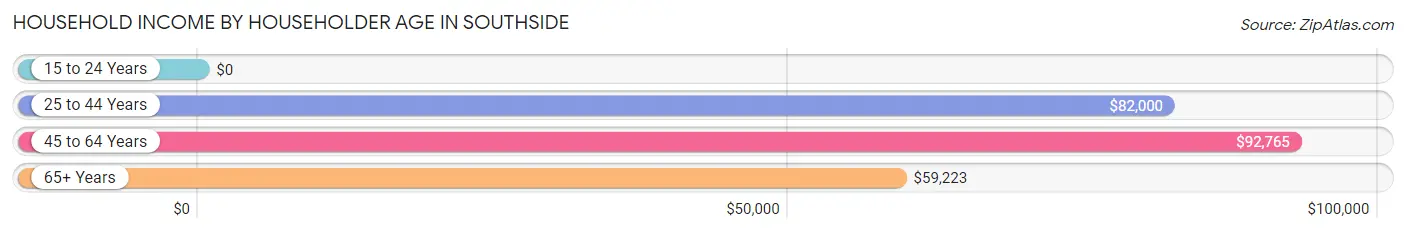
| Income Bracket | # Households | Median Income |
| 15 to 24 Years | 24 (0.8%) | $0 |
| 25 to 44 Years | 872 (28.4%) | $82,000 |
| 45 to 64 Years | 1,225 (39.9%) | $92,765 |
| 65+ Years | 949 (30.9%) | $59,223 |
| Total | 3,070 (100.0%) | $70,843 |
Poverty in Southside
Income Below Poverty by Sex and Age in Southside
With 3.6% poverty level for males and 9.5% for females among the residents of Southside, 15 year old males and 55 to 64 year old females are the most vulnerable to poverty, with 49 males (90.7%) and 136 females (20.6%) in their respective age groups living below the poverty level.
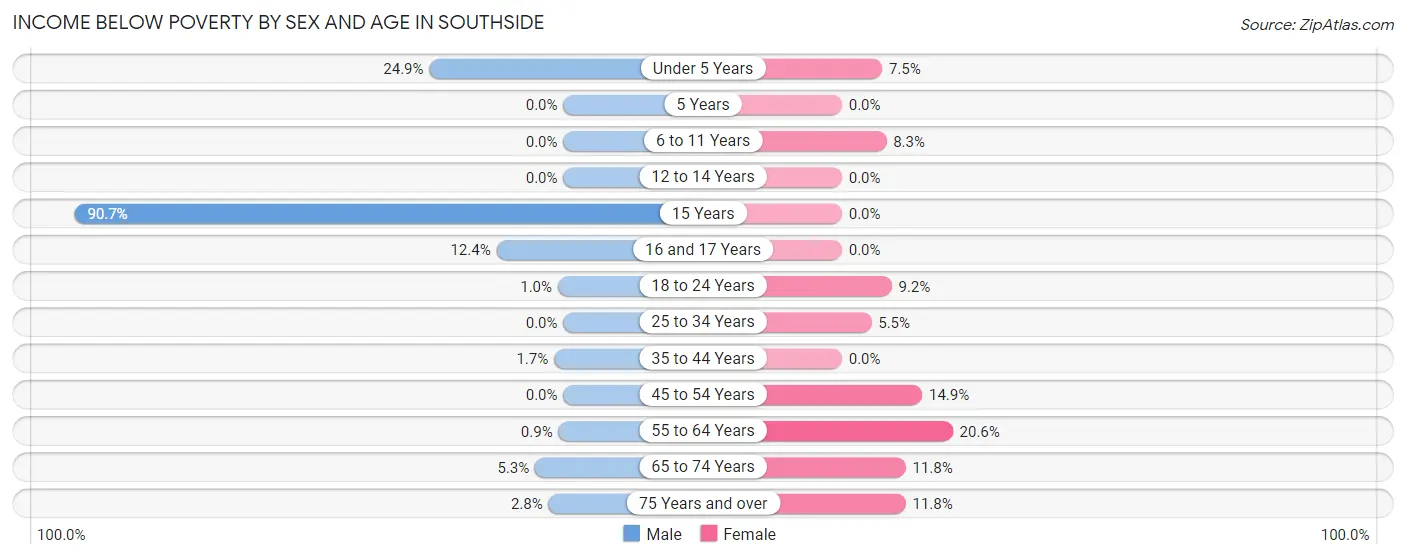
| Age Bracket | Male | Female |
| Under 5 Years | 47 (24.9%) | 40 (7.5%) |
| 5 Years | 0 (0.0%) | 0 (0.0%) |
| 6 to 11 Years | 0 (0.0%) | 26 (8.3%) |
| 12 to 14 Years | 0 (0.0%) | 0 (0.0%) |
| 15 Years | 49 (90.7%) | 0 (0.0%) |
| 16 and 17 Years | 17 (12.4%) | 0 (0.0%) |
| 18 to 24 Years | 3 (1.0%) | 18 (9.2%) |
| 25 to 34 Years | 0 (0.0%) | 30 (5.5%) |
| 35 to 44 Years | 8 (1.7%) | 0 (0.0%) |
| 45 to 54 Years | 0 (0.0%) | 62 (14.9%) |
| 55 to 64 Years | 5 (0.9%) | 136 (20.6%) |
| 65 to 74 Years | 24 (5.3%) | 83 (11.8%) |
| 75 Years and over | 10 (2.8%) | 40 (11.8%) |
| Total | 163 (3.6%) | 435 (9.5%) |
Income Above Poverty by Sex and Age in Southside
According to the poverty statistics in Southside, males aged 5 years and females aged 5 years are the age groups that are most secure financially, with 100.0% of males and 100.0% of females in these age groups living above the poverty line.
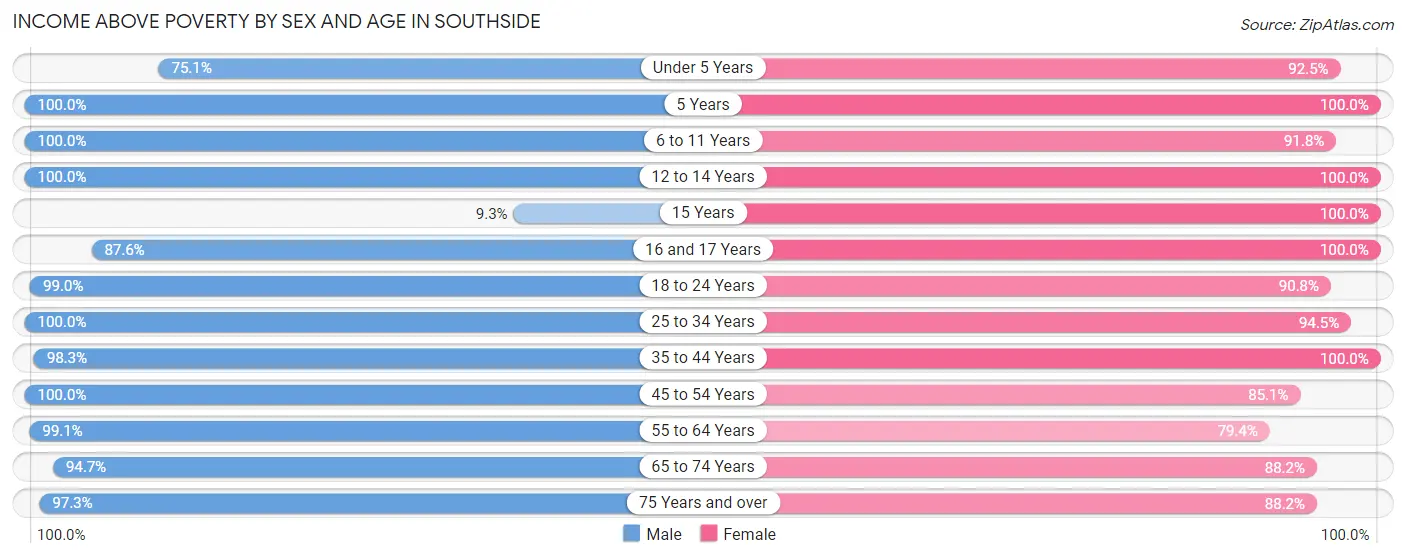
| Age Bracket | Male | Female |
| Under 5 Years | 142 (75.1%) | 496 (92.5%) |
| 5 Years | 46 (100.0%) | 86 (100.0%) |
| 6 to 11 Years | 479 (100.0%) | 289 (91.7%) |
| 12 to 14 Years | 286 (100.0%) | 67 (100.0%) |
| 15 Years | 5 (9.3%) | 9 (100.0%) |
| 16 and 17 Years | 120 (87.6%) | 30 (100.0%) |
| 18 to 24 Years | 291 (99.0%) | 177 (90.8%) |
| 25 to 34 Years | 728 (100.0%) | 518 (94.5%) |
| 35 to 44 Years | 457 (98.3%) | 699 (100.0%) |
| 45 to 54 Years | 516 (100.0%) | 354 (85.1%) |
| 55 to 64 Years | 550 (99.1%) | 525 (79.4%) |
| 65 to 74 Years | 432 (94.7%) | 618 (88.2%) |
| 75 Years and over | 353 (97.3%) | 298 (88.2%) |
| Total | 4,405 (96.4%) | 4,166 (90.5%) |
Income Below Poverty Among Married-Couple Families in Southside
The poverty statistics for married-couple families in Southside show that 0.9% or 17 of the total 1,810 families live below the poverty line. Families with 1 or 2 children have the highest poverty rate of 1.5%, comprising of 8 families. On the other hand, families with 3 or 4 children have the lowest poverty rate of 0.0%, which includes 0 families.
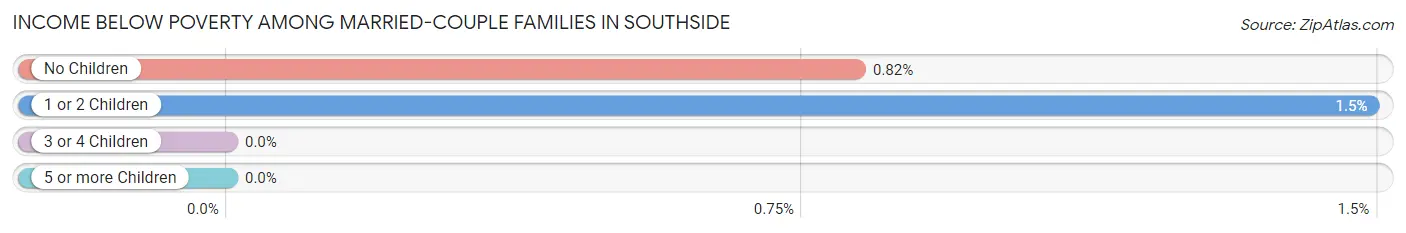
| Children | Above Poverty | Below Poverty |
| No Children | 1,085 (99.2%) | 9 (0.8%) |
| 1 or 2 Children | 528 (98.5%) | 8 (1.5%) |
| 3 or 4 Children | 171 (100.0%) | 0 (0.0%) |
| 5 or more Children | 9 (100.0%) | 0 (0.0%) |
| Total | 1,793 (99.1%) | 17 (0.9%) |
Income Below Poverty Among Single-Parent Households in Southside
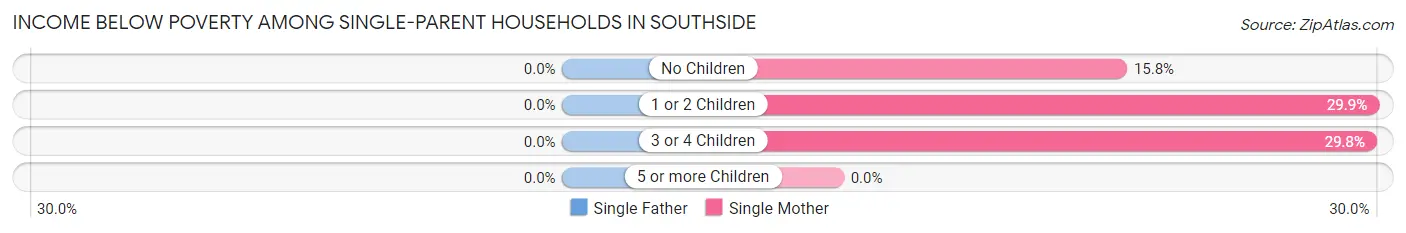
| Children | Single Father | Single Mother |
| No Children | 0 (0.0%) | 38 (15.8%) |
| 1 or 2 Children | 0 (0.0%) | 35 (29.9%) |
| 3 or 4 Children | 0 (0.0%) | 14 (29.8%) |
| 5 or more Children | 0 (0.0%) | 0 (0.0%) |
| Total | 0 (0.0%) | 87 (21.5%) |
Income Below Poverty Among Married-Couple vs Single-Parent Households in Southside
The poverty data for Southside shows that 17 of the married-couple family households (0.9%) and 87 of the single-parent households (16.5%) are living below the poverty level. Within the married-couple family households, those with 1 or 2 children have the highest poverty rate, with 8 households (1.5%) falling below the poverty line. Among the single-parent households, those with 3 or 4 children have the highest poverty rate, with 14 household (29.8%) living below poverty.
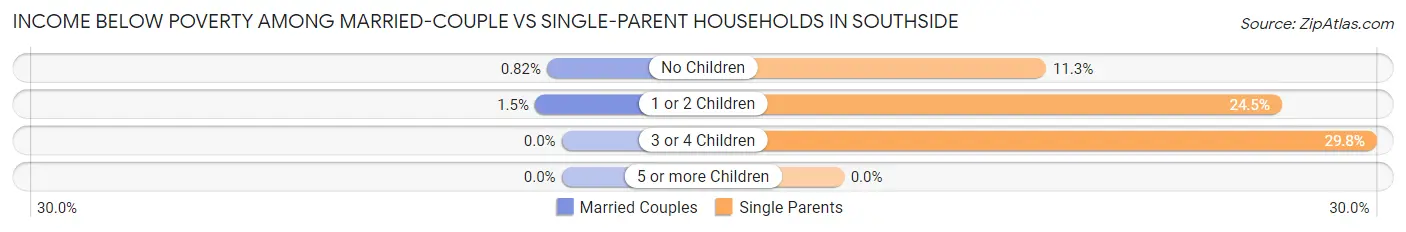
| Children | Married-Couple Families | Single-Parent Households |
| No Children | 9 (0.8%) | 38 (11.3%) |
| 1 or 2 Children | 8 (1.5%) | 35 (24.5%) |
| 3 or 4 Children | 0 (0.0%) | 14 (29.8%) |
| 5 or more Children | 0 (0.0%) | 0 (0.0%) |
| Total | 17 (0.9%) | 87 (16.5%) |
Race in Southside
The most populous races in Southside are White / Caucasian (8,836 | 94.4%), Two or more Races (221 | 2.4%), and Hispanic or Latino (170 | 1.8%).
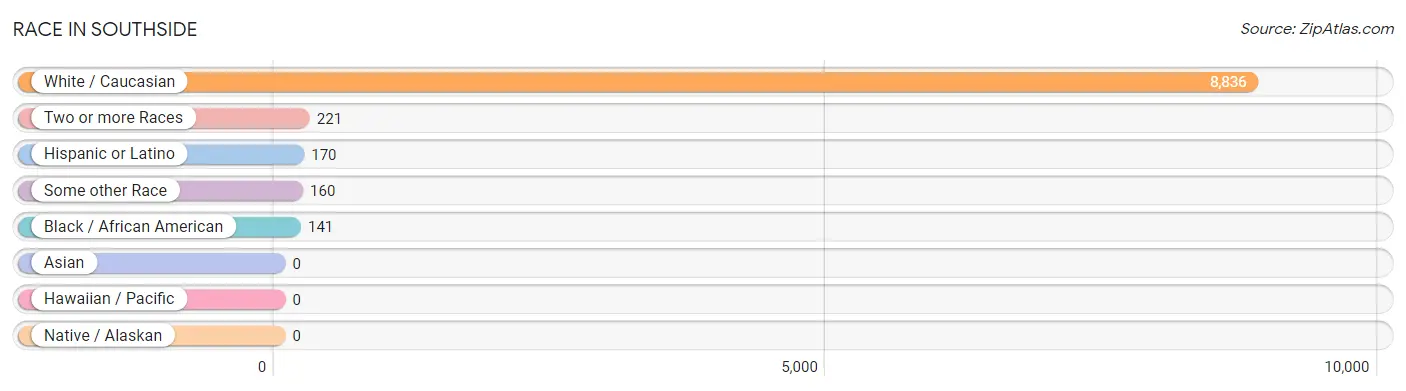
| Race | # Population | % Population |
| Asian | 0 | 0.0% |
| Black / African American | 141 | 1.5% |
| Hawaiian / Pacific | 0 | 0.0% |
| Hispanic or Latino | 170 | 1.8% |
| Native / Alaskan | 0 | 0.0% |
| White / Caucasian | 8,836 | 94.4% |
| Two or more Races | 221 | 2.4% |
| Some other Race | 160 | 1.7% |
| Total | 9,358 | 100.0% |
Ancestry in Southside
The most populous ancestries reported in Southside are English (1,554 | 16.6%), American (982 | 10.5%), Irish (967 | 10.3%), German (777 | 8.3%), and Polish (232 | 2.5%), together accounting for 48.2% of all Southside residents.
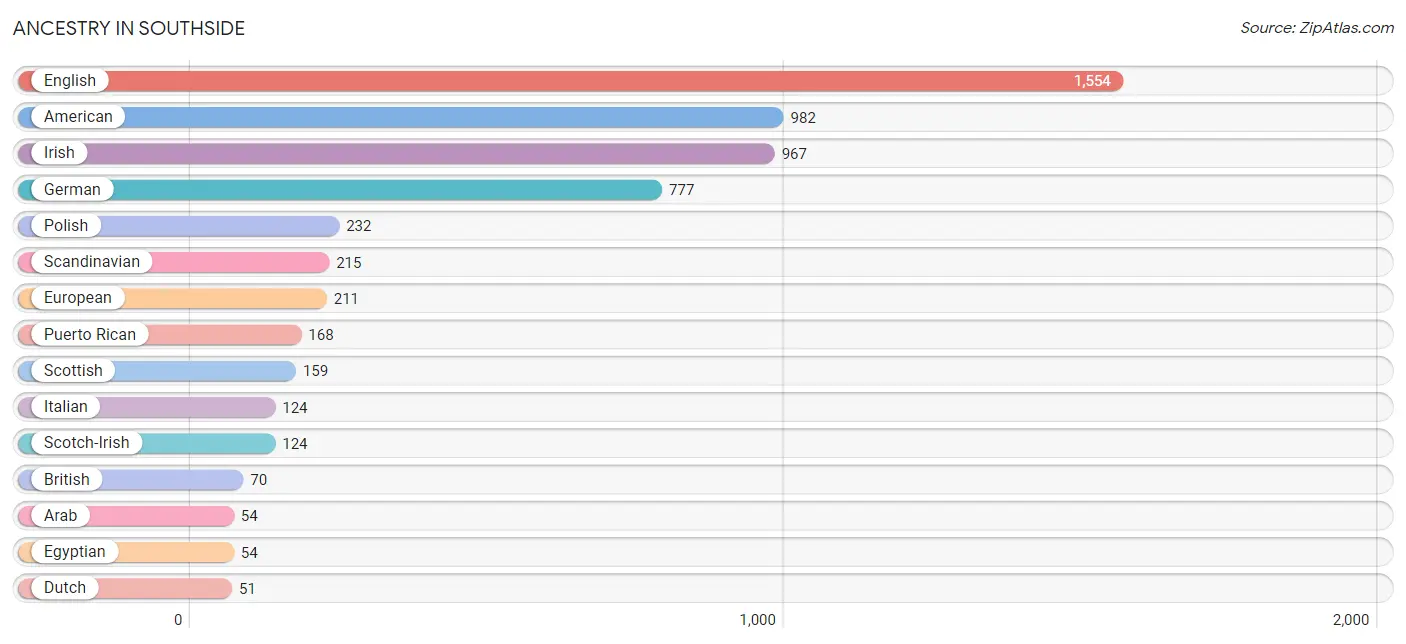
| Ancestry | # Population | % Population |
| American | 982 | 10.5% |
| Arab | 54 | 0.6% |
| British | 70 | 0.7% |
| Canadian | 29 | 0.3% |
| Cherokee | 11 | 0.1% |
| Cuban | 2 | 0.0% |
| Czech | 10 | 0.1% |
| Danish | 11 | 0.1% |
| Dutch | 51 | 0.5% |
| Eastern European | 14 | 0.2% |
| Egyptian | 54 | 0.6% |
| English | 1,554 | 16.6% |
| Ethiopian | 11 | 0.1% |
| European | 211 | 2.2% |
| French | 23 | 0.3% |
| German | 777 | 8.3% |
| Irish | 967 | 10.3% |
| Italian | 124 | 1.3% |
| Polish | 232 | 2.5% |
| Puerto Rican | 168 | 1.8% |
| Russian | 26 | 0.3% |
| Scandinavian | 215 | 2.3% |
| Scotch-Irish | 124 | 1.3% |
| Scottish | 159 | 1.7% |
| Subsaharan African | 11 | 0.1% |
| Swedish | 43 | 0.5% | View All 26 Rows |
Immigrants in Southside
The most numerous immigrant groups reported in Southside came from Africa (54 | 0.6%), Egypt (54 | 0.6%), Northern Africa (54 | 0.6%), Canada (22 | 0.2%), and Europe (10 | 0.1%), together accounting for 2.1% of all Southside residents.
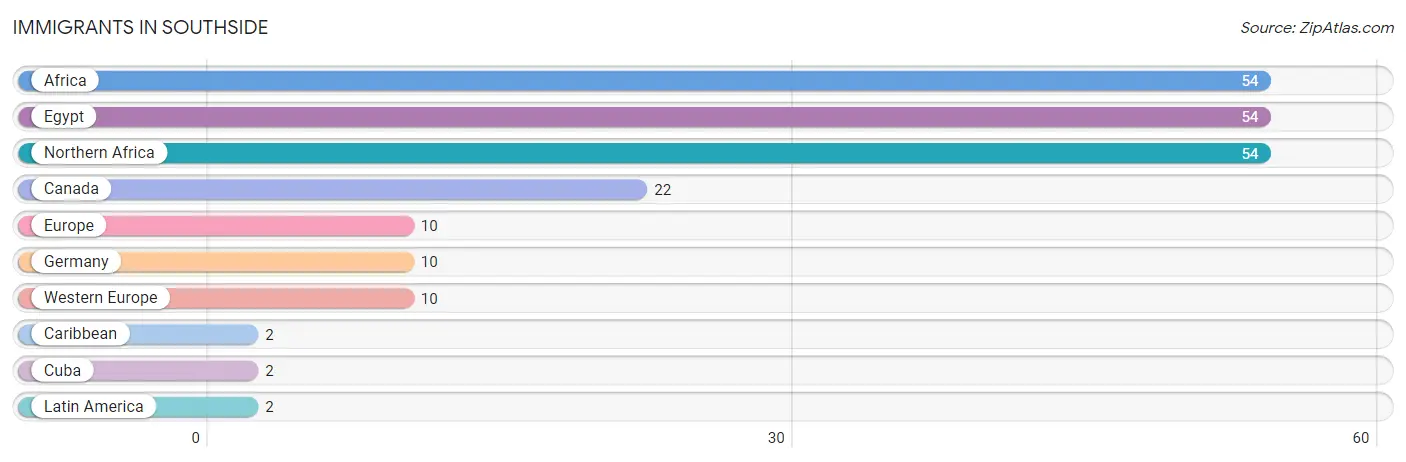
| Immigration Origin | # Population | % Population |
| Africa | 54 | 0.6% |
| Canada | 22 | 0.2% |
| Caribbean | 2 | 0.0% |
| Cuba | 2 | 0.0% |
| Egypt | 54 | 0.6% |
| Europe | 10 | 0.1% |
| Germany | 10 | 0.1% |
| Latin America | 2 | 0.0% |
| Northern Africa | 54 | 0.6% |
| Western Europe | 10 | 0.1% | View All 10 Rows |
Sex and Age in Southside
Sex and Age in Southside
The most populous age groups in Southside are 10 to 14 Years (515 | 11.1%) for men and 40 to 44 Years (602 | 12.8%) for women.
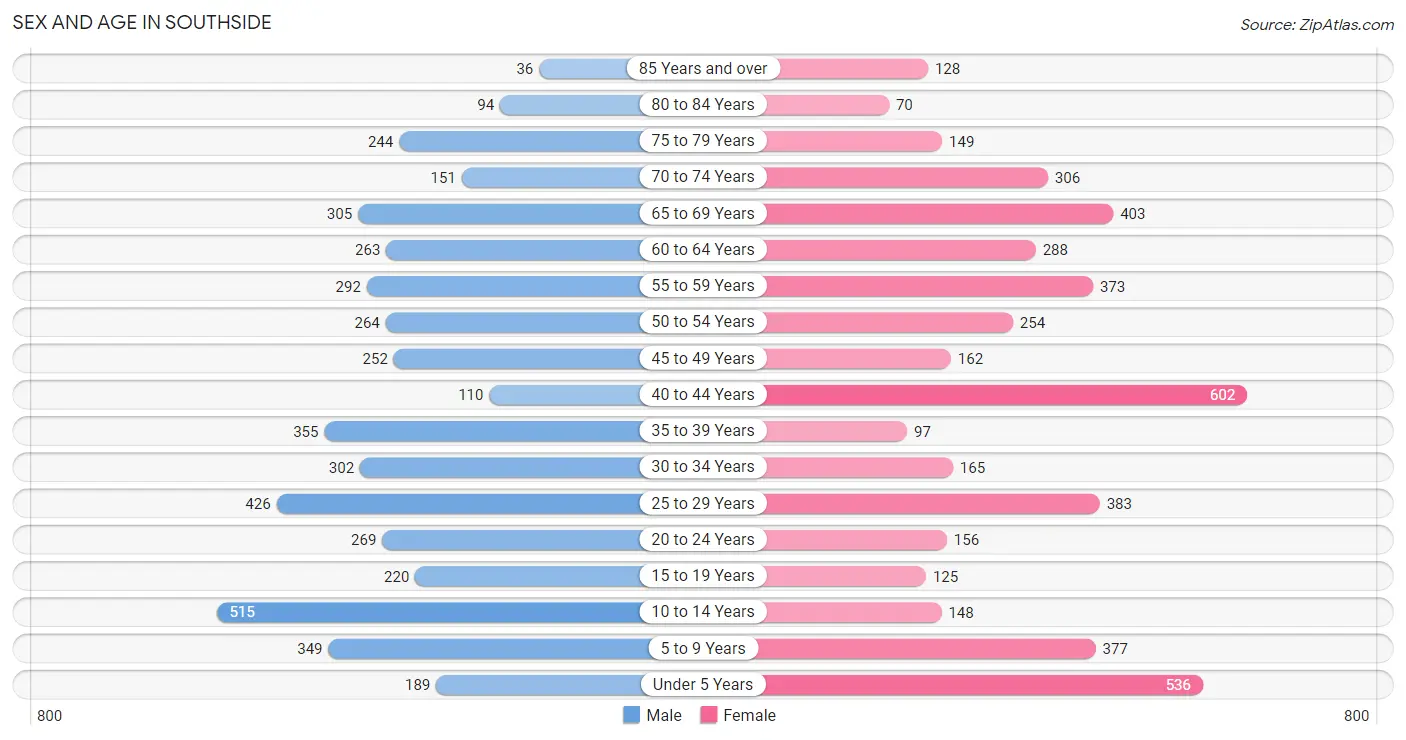
| Age Bracket | Male | Female |
| Under 5 Years | 189 (4.1%) | 536 (11.4%) |
| 5 to 9 Years | 349 (7.5%) | 377 (8.0%) |
| 10 to 14 Years | 515 (11.1%) | 148 (3.1%) |
| 15 to 19 Years | 220 (4.8%) | 125 (2.6%) |
| 20 to 24 Years | 269 (5.8%) | 156 (3.3%) |
| 25 to 29 Years | 426 (9.2%) | 383 (8.1%) |
| 30 to 34 Years | 302 (6.5%) | 165 (3.5%) |
| 35 to 39 Years | 355 (7.7%) | 97 (2.1%) |
| 40 to 44 Years | 110 (2.4%) | 602 (12.8%) |
| 45 to 49 Years | 252 (5.4%) | 162 (3.4%) |
| 50 to 54 Years | 264 (5.7%) | 254 (5.4%) |
| 55 to 59 Years | 292 (6.3%) | 373 (7.9%) |
| 60 to 64 Years | 263 (5.7%) | 288 (6.1%) |
| 65 to 69 Years | 305 (6.6%) | 403 (8.5%) |
| 70 to 74 Years | 151 (3.3%) | 306 (6.5%) |
| 75 to 79 Years | 244 (5.3%) | 149 (3.2%) |
| 80 to 84 Years | 94 (2.0%) | 70 (1.5%) |
| 85 Years and over | 36 (0.8%) | 128 (2.7%) |
| Total | 4,636 (100.0%) | 4,722 (100.0%) |
Families and Households in Southside
Median Family Size in Southside
The median family size in Southside is 3.37 persons per family, with single female/mother families (404 | 17.3%) accounting for the largest median family size of 4.11 persons per family. On the other hand, single male/father families (122 | 5.2%) represent the smallest median family size with 2.70 persons per family.
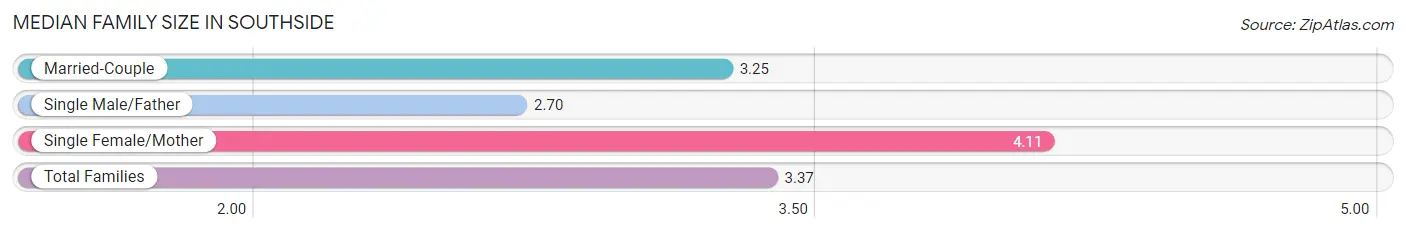
| Family Type | # Families | Family Size |
| Married-Couple | 1,810 (77.5%) | 3.25 |
| Single Male/Father | 122 (5.2%) | 2.70 |
| Single Female/Mother | 404 (17.3%) | 4.11 |
| Total Families | 2,336 (100.0%) | 3.37 |
Median Household Size in Southside
The median household size in Southside is 3.01 persons per household, with single female/mother households (404 | 13.2%) accounting for the largest median household size of 4.53 persons per household. non-family households (734 | 23.9%) represent the smallest median household size with 1.57 persons per household.
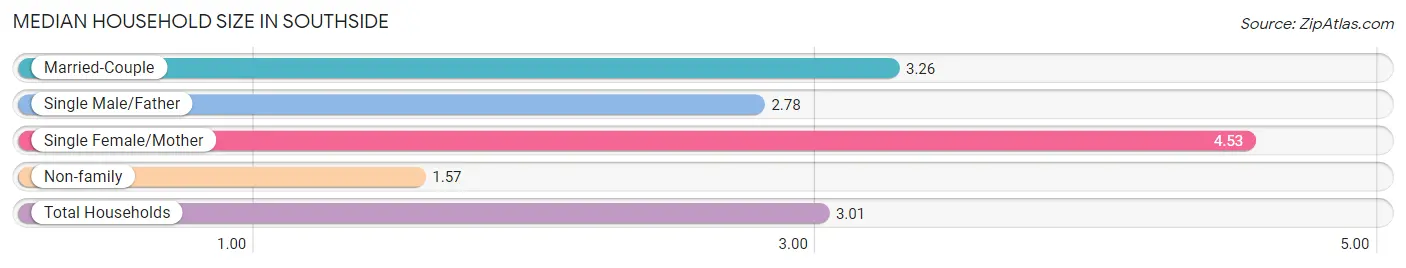
| Household Type | # Households | Household Size |
| Married-Couple | 1,810 (59.0%) | 3.26 |
| Single Male/Father | 122 (4.0%) | 2.78 |
| Single Female/Mother | 404 (13.2%) | 4.53 |
| Non-family | 734 (23.9%) | 1.57 |
| Total Households | 3,070 (100.0%) | 3.01 |
Household Size by Marriage Status in Southside
Out of a total of 3,070 households in Southside, 2,336 (76.1%) are family households, while 734 (23.9%) are nonfamily households. The most numerous type of family households are 2-person households, comprising 1,171, and the most common type of nonfamily households are 1-person households, comprising 531.
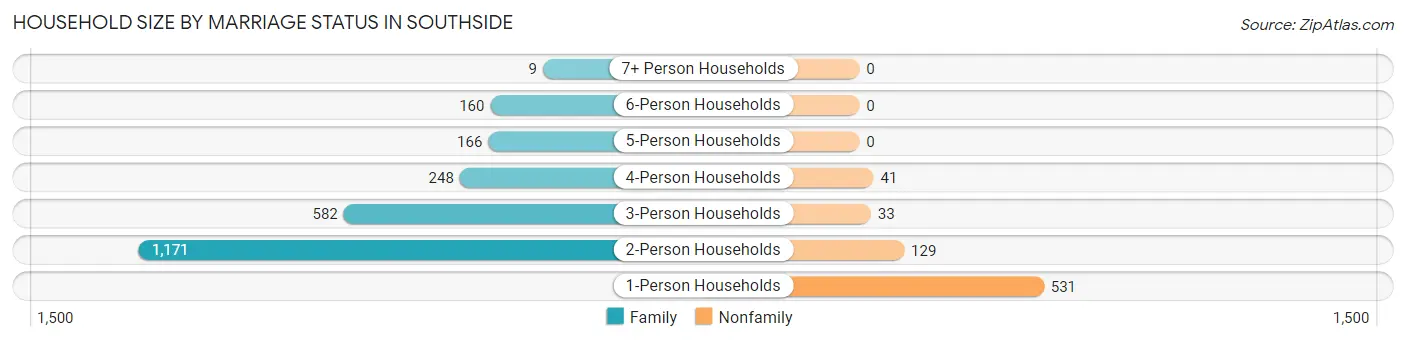
| Household Size | Family Households | Nonfamily Households |
| 1-Person Households | - | 531 (17.3%) |
| 2-Person Households | 1,171 (38.1%) | 129 (4.2%) |
| 3-Person Households | 582 (19.0%) | 33 (1.1%) |
| 4-Person Households | 248 (8.1%) | 41 (1.3%) |
| 5-Person Households | 166 (5.4%) | 0 (0.0%) |
| 6-Person Households | 160 (5.2%) | 0 (0.0%) |
| 7+ Person Households | 9 (0.3%) | 0 (0.0%) |
| Total | 2,336 (76.1%) | 734 (23.9%) |
Female Fertility in Southside
Fertility by Age in Southside
Average fertility rate in Southside is 46.0 births per 1,000 women. Women in the age bracket of 20 to 34 years have the highest fertility rate with 84.0 births per 1,000 women. Women in the age bracket of 20 to 34 years acount for 71.1% of all women with births.
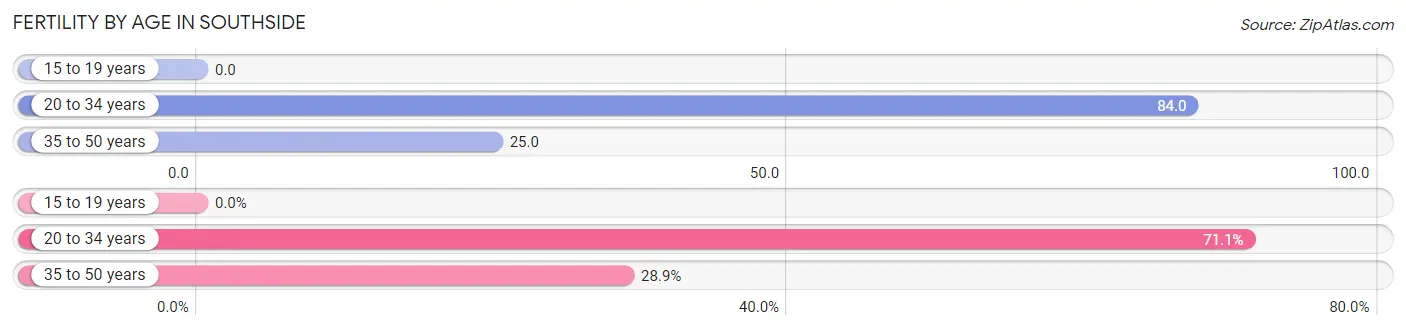
| Age Bracket | Women with Births | Births / 1,000 Women |
| 15 to 19 years | 0 (0.0%) | 0.0 |
| 20 to 34 years | 59 (71.1%) | 84.0 |
| 35 to 50 years | 24 (28.9%) | 25.0 |
| Total | 83 (100.0%) | 46.0 |
Fertility by Age by Marriage Status in Southside
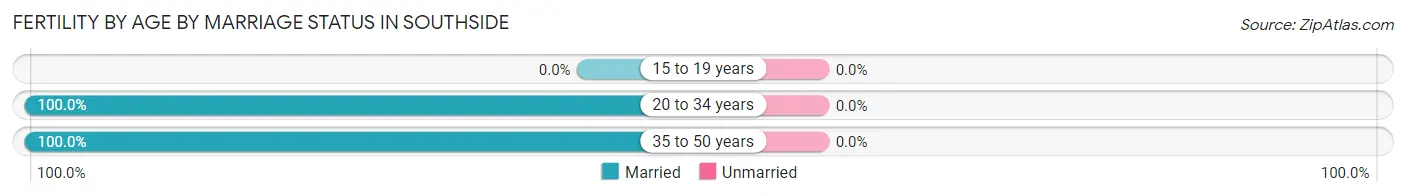
| Age Bracket | Married | Unmarried |
| 15 to 19 years | 0 (0.0%) | 0 (0.0%) |
| 20 to 34 years | 59 (100.0%) | 0 (0.0%) |
| 35 to 50 years | 24 (100.0%) | 0 (0.0%) |
| Total | 83 (100.0%) | 0 (0.0%) |
Fertility by Education in Southside
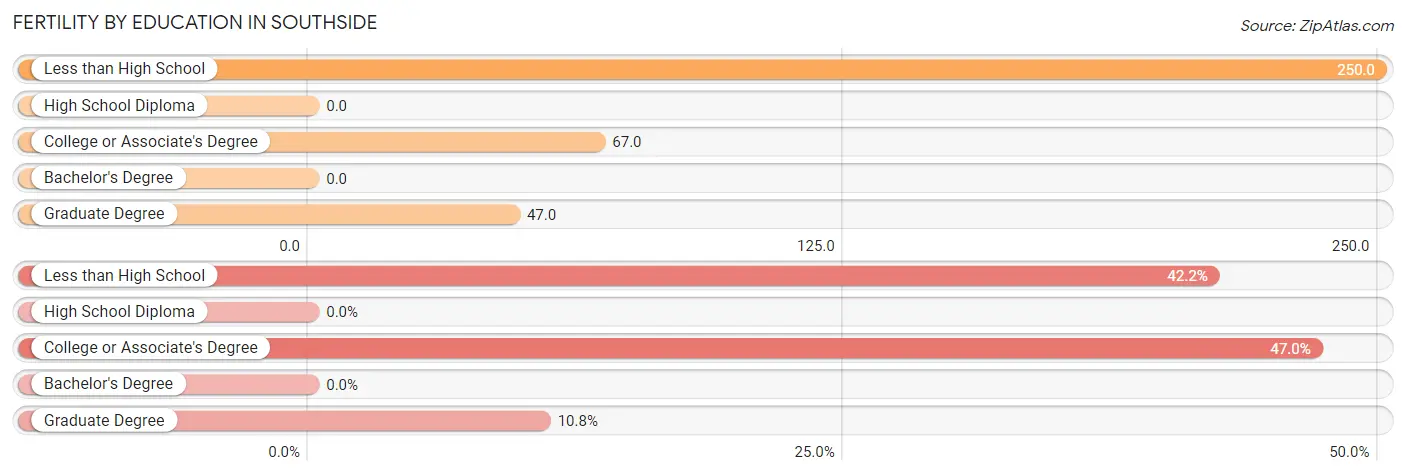
| Educational Attainment | Women with Births | Births / 1,000 Women |
| Less than High School | 35 (42.2%) | 250.0 |
| High School Diploma | 0 (0.0%) | 0.0 |
| College or Associate's Degree | 39 (47.0%) | 67.0 |
| Bachelor's Degree | 0 (0.0%) | 0.0 |
| Graduate Degree | 9 (10.8%) | 47.0 |
| Total | 83 (100.0%) | 46.0 |
Fertility by Education by Marriage Status in Southside

| Educational Attainment | Married | Unmarried |
| Less than High School | 35 (100.0%) | 0 (0.0%) |
| High School Diploma | 0 (0.0%) | 0 (0.0%) |
| College or Associate's Degree | 39 (100.0%) | 0 (0.0%) |
| Bachelor's Degree | 0 (0.0%) | 0 (0.0%) |
| Graduate Degree | 9 (100.0%) | 0 (0.0%) |
| Total | 83 (100.0%) | 0 (0.0%) |
Employment Characteristics in Southside
Employment by Class of Employer in Southside
Among the 4,007 employed individuals in Southside, private company employees (2,656 | 66.3%), local government employees (375 | 9.4%), and not-for-profit organizations (311 | 7.8%) make up the most common classes of employment.
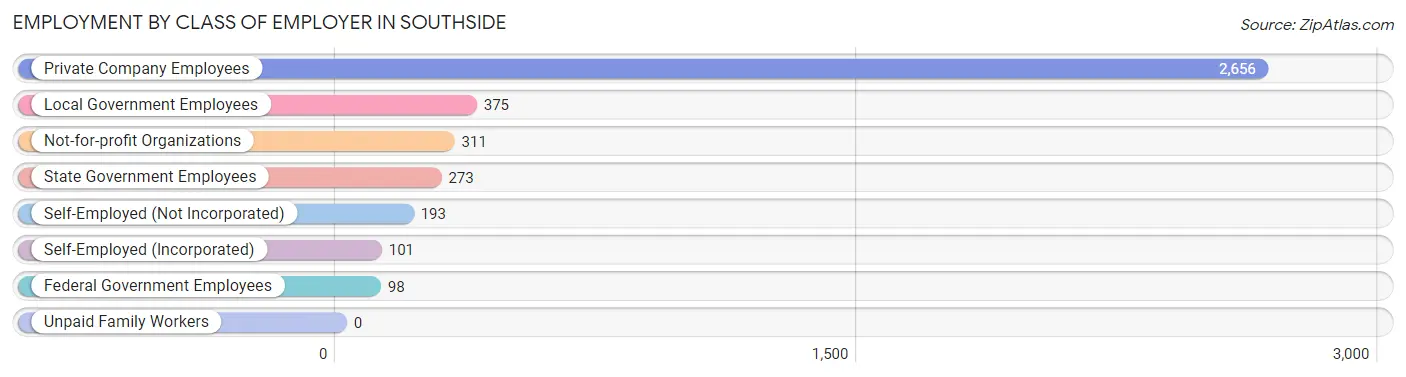
| Employer Class | # Employees | % Employees |
| Private Company Employees | 2,656 | 66.3% |
| Self-Employed (Incorporated) | 101 | 2.5% |
| Self-Employed (Not Incorporated) | 193 | 4.8% |
| Not-for-profit Organizations | 311 | 7.8% |
| Local Government Employees | 375 | 9.4% |
| State Government Employees | 273 | 6.8% |
| Federal Government Employees | 98 | 2.5% |
| Unpaid Family Workers | 0 | 0.0% |
| Total | 4,007 | 100.0% |
Employment Status by Age in Southside
According to the labor force statistics for Southside, out of the total population over 16 years of age (7,177), 59.4% or 4,263 individuals are in the labor force, with 3.4% or 145 of them unemployed. The age group with the highest labor force participation rate is 35 to 44 years, with 88.7% or 1,032 individuals in the labor force. Within the labor force, the 20 to 24 years age range has the highest percentage of unemployed individuals, with 9.2% or 33 of them being unemployed.
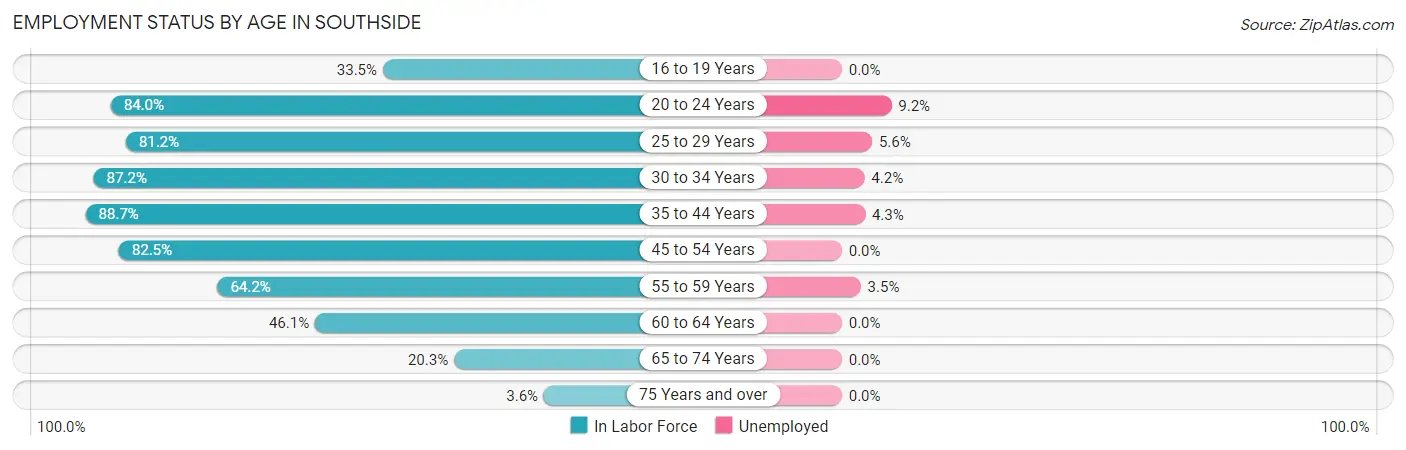
| Age Bracket | In Labor Force | Unemployed |
| 16 to 19 Years | 93 (33.5%) | 0 (0.0%) |
| 20 to 24 Years | 357 (84.0%) | 33 (9.2%) |
| 25 to 29 Years | 657 (81.2%) | 37 (5.6%) |
| 30 to 34 Years | 407 (87.2%) | 17 (4.2%) |
| 35 to 44 Years | 1,032 (88.7%) | 44 (4.3%) |
| 45 to 54 Years | 769 (82.5%) | 0 (0.0%) |
| 55 to 59 Years | 427 (64.2%) | 15 (3.5%) |
| 60 to 64 Years | 254 (46.1%) | 0 (0.0%) |
| 65 to 74 Years | 236 (20.3%) | 0 (0.0%) |
| 75 Years and over | 26 (3.6%) | 0 (0.0%) |
| Total | 4,263 (59.4%) | 145 (3.4%) |
Employment Status by Educational Attainment in Southside
According to labor force statistics for Southside, 77.3% of individuals (3,547) out of the total population between 25 and 64 years of age (4,588) are in the labor force, with 3.2% or 114 of them being unemployed. The group with the highest labor force participation rate are those with the educational attainment of bachelor's degree or higher, with 81.5% or 910 individuals in the labor force. Within the labor force, individuals with college / associate degree education have the highest percentage of unemployment, with 4.3% or 65 of them being unemployed.
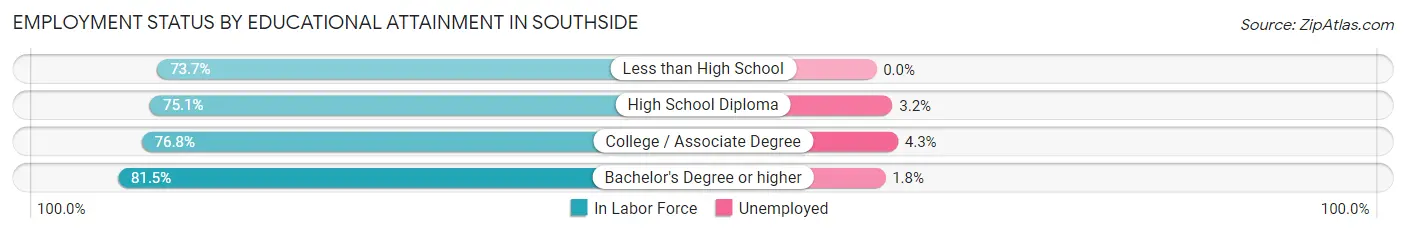
| Educational Attainment | In Labor Force | Unemployed |
| Less than High School | 143 (73.7%) | 0 (0.0%) |
| High School Diploma | 991 (75.1%) | 42 (3.2%) |
| College / Associate Degree | 1,504 (76.8%) | 84 (4.3%) |
| Bachelor's Degree or higher | 910 (81.5%) | 20 (1.8%) |
| Total | 3,547 (77.3%) | 147 (3.2%) |
Employment Occupations by Sex in Southside
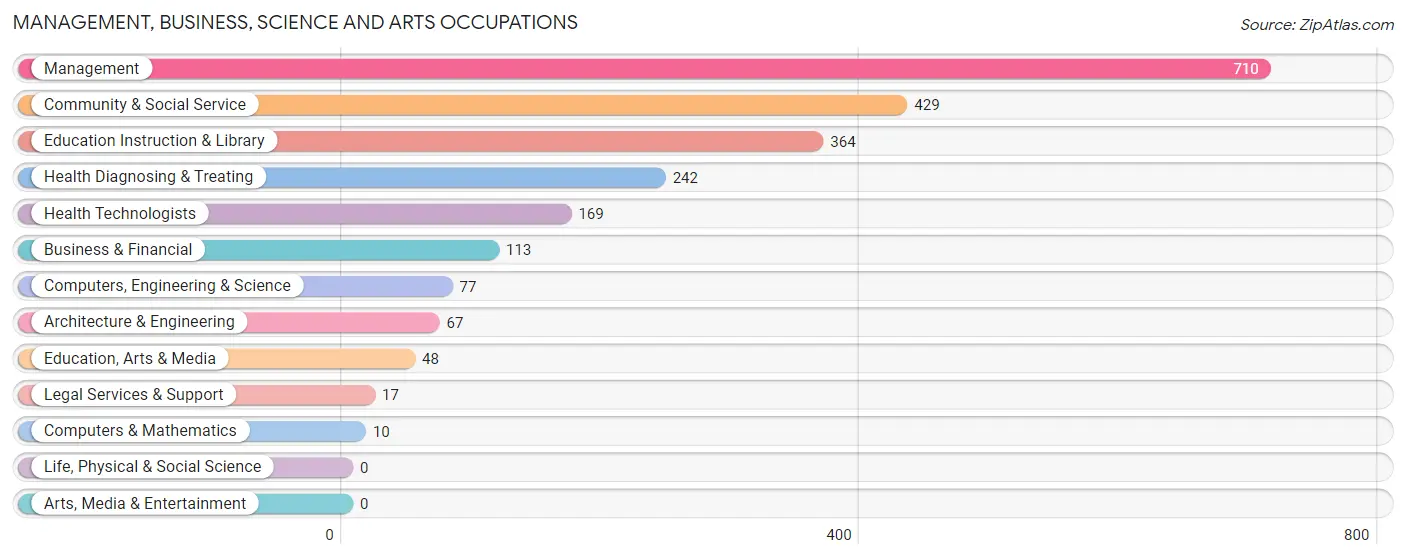
Management, Business, Science and Arts Occupations
The most common Management, Business, Science and Arts occupations in Southside are Management (710 | 17.3%), Community & Social Service (429 | 10.4%), Education Instruction & Library (364 | 8.8%), Health Diagnosing & Treating (242 | 5.9%), and Health Technologists (169 | 4.1%).
Management, Business, Science and Arts Occupations by Sex
Within the Management, Business, Science and Arts occupations in Southside, the most male-oriented occupations are Architecture & Engineering (100.0%), Computers, Engineering & Science (93.5%), and Management (58.3%), while the most female-oriented occupations are Business & Financial (100.0%), Legal Services & Support (100.0%), and Education Instruction & Library (88.7%).
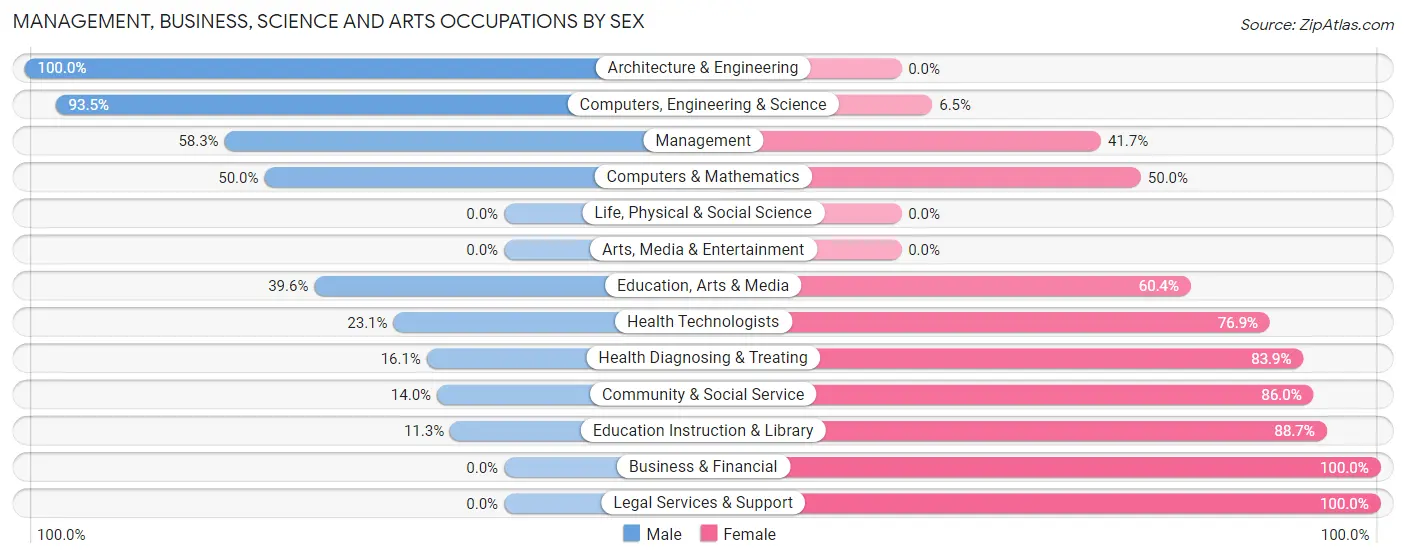
| Occupation | Male | Female |
| Management | 414 (58.3%) | 296 (41.7%) |
| Business & Financial | 0 (0.0%) | 113 (100.0%) |
| Computers, Engineering & Science | 72 (93.5%) | 5 (6.5%) |
| Computers & Mathematics | 5 (50.0%) | 5 (50.0%) |
| Architecture & Engineering | 67 (100.0%) | 0 (0.0%) |
| Life, Physical & Social Science | 0 (0.0%) | 0 (0.0%) |
| Community & Social Service | 60 (14.0%) | 369 (86.0%) |
| Education, Arts & Media | 19 (39.6%) | 29 (60.4%) |
| Legal Services & Support | 0 (0.0%) | 17 (100.0%) |
| Education Instruction & Library | 41 (11.3%) | 323 (88.7%) |
| Arts, Media & Entertainment | 0 (0.0%) | 0 (0.0%) |
| Health Diagnosing & Treating | 39 (16.1%) | 203 (83.9%) |
| Health Technologists | 39 (23.1%) | 130 (76.9%) |
| Total (Category) | 585 (37.2%) | 986 (62.8%) |
| Total (Overall) | 2,123 (51.6%) | 1,991 (48.4%) |
Services Occupations
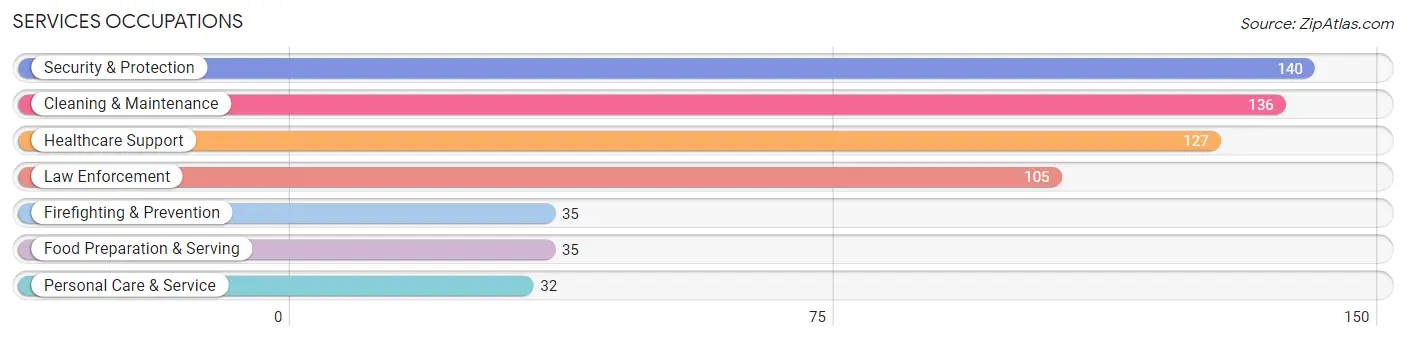
The most common Services occupations in Southside are Security & Protection (140 | 3.4%), Cleaning & Maintenance (136 | 3.3%), Healthcare Support (127 | 3.1%), Law Enforcement (105 | 2.5%), and Firefighting & Prevention (35 | 0.9%).
Services Occupations by Sex
Within the Services occupations in Southside, the most male-oriented occupations are Security & Protection (100.0%), Firefighting & Prevention (100.0%), and Law Enforcement (100.0%), while the most female-oriented occupations are Food Preparation & Serving (100.0%), Personal Care & Service (100.0%), and Healthcare Support (50.4%).
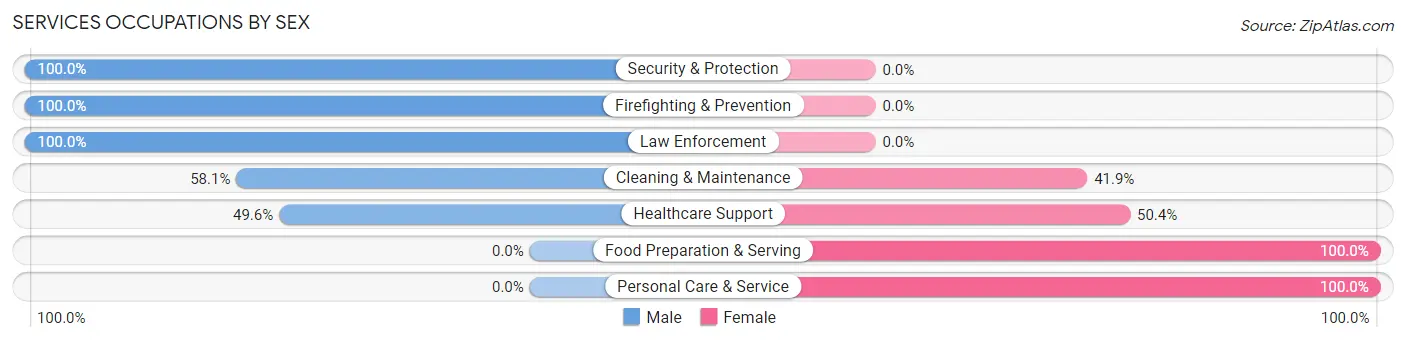
| Occupation | Male | Female |
| Healthcare Support | 63 (49.6%) | 64 (50.4%) |
| Security & Protection | 140 (100.0%) | 0 (0.0%) |
| Firefighting & Prevention | 35 (100.0%) | 0 (0.0%) |
| Law Enforcement | 105 (100.0%) | 0 (0.0%) |
| Food Preparation & Serving | 0 (0.0%) | 35 (100.0%) |
| Cleaning & Maintenance | 79 (58.1%) | 57 (41.9%) |
| Personal Care & Service | 0 (0.0%) | 32 (100.0%) |
| Total (Category) | 282 (60.0%) | 188 (40.0%) |
| Total (Overall) | 2,123 (51.6%) | 1,991 (48.4%) |
Sales and Office Occupations
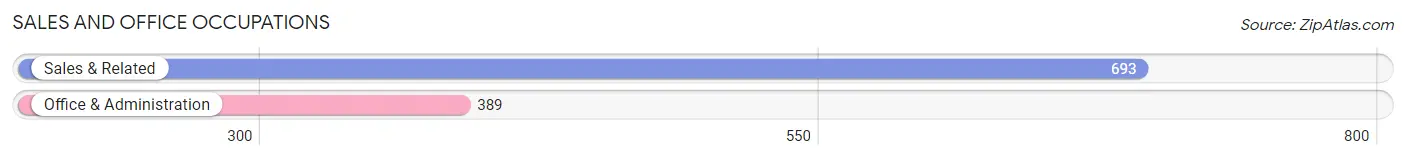
The most common Sales and Office occupations in Southside are Sales & Related (693 | 16.8%), and Office & Administration (389 | 9.5%).
Sales and Office Occupations by Sex
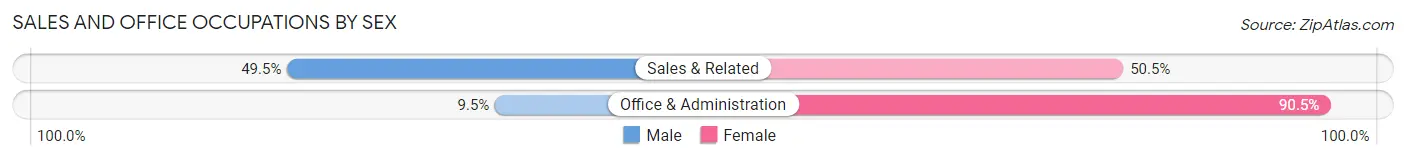
| Occupation | Male | Female |
| Sales & Related | 343 (49.5%) | 350 (50.5%) |
| Office & Administration | 37 (9.5%) | 352 (90.5%) |
| Total (Category) | 380 (35.1%) | 702 (64.9%) |
| Total (Overall) | 2,123 (51.6%) | 1,991 (48.4%) |
Natural Resources, Construction and Maintenance Occupations
The most common Natural Resources, Construction and Maintenance occupations in Southside are Installation, Maintenance & Repair (138 | 3.4%), and Construction & Extraction (33 | 0.8%).
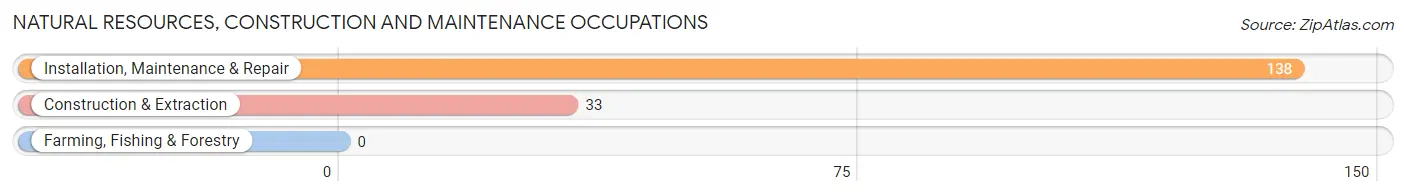
Natural Resources, Construction and Maintenance Occupations by Sex
| Occupation | Male | Female |
| Farming, Fishing & Forestry | 0 (0.0%) | 0 (0.0%) |
| Construction & Extraction | 33 (100.0%) | 0 (0.0%) |
| Installation, Maintenance & Repair | 138 (100.0%) | 0 (0.0%) |
| Total (Category) | 171 (100.0%) | 0 (0.0%) |
| Total (Overall) | 2,123 (51.6%) | 1,991 (48.4%) |
Production, Transportation and Moving Occupations
The most common Production, Transportation and Moving occupations in Southside are Production (366 | 8.9%), Transportation (293 | 7.1%), and Material Moving (161 | 3.9%).
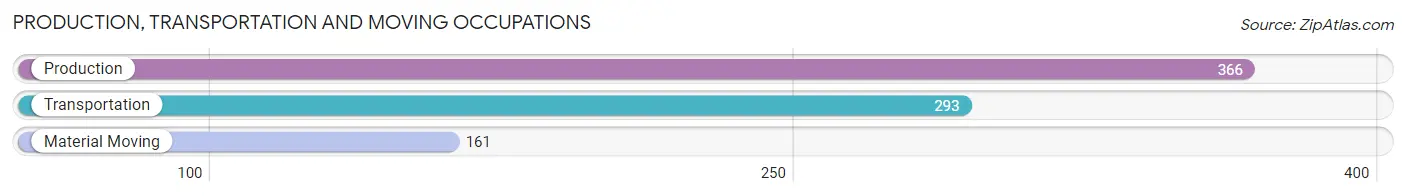
Production, Transportation and Moving Occupations by Sex
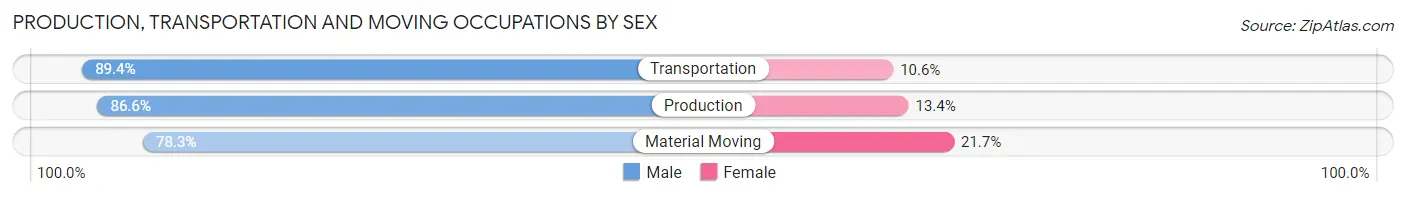
| Occupation | Male | Female |
| Production | 317 (86.6%) | 49 (13.4%) |
| Transportation | 262 (89.4%) | 31 (10.6%) |
| Material Moving | 126 (78.3%) | 35 (21.7%) |
| Total (Category) | 705 (86.0%) | 115 (14.0%) |
| Total (Overall) | 2,123 (51.6%) | 1,991 (48.4%) |
Employment Industries by Sex in Southside
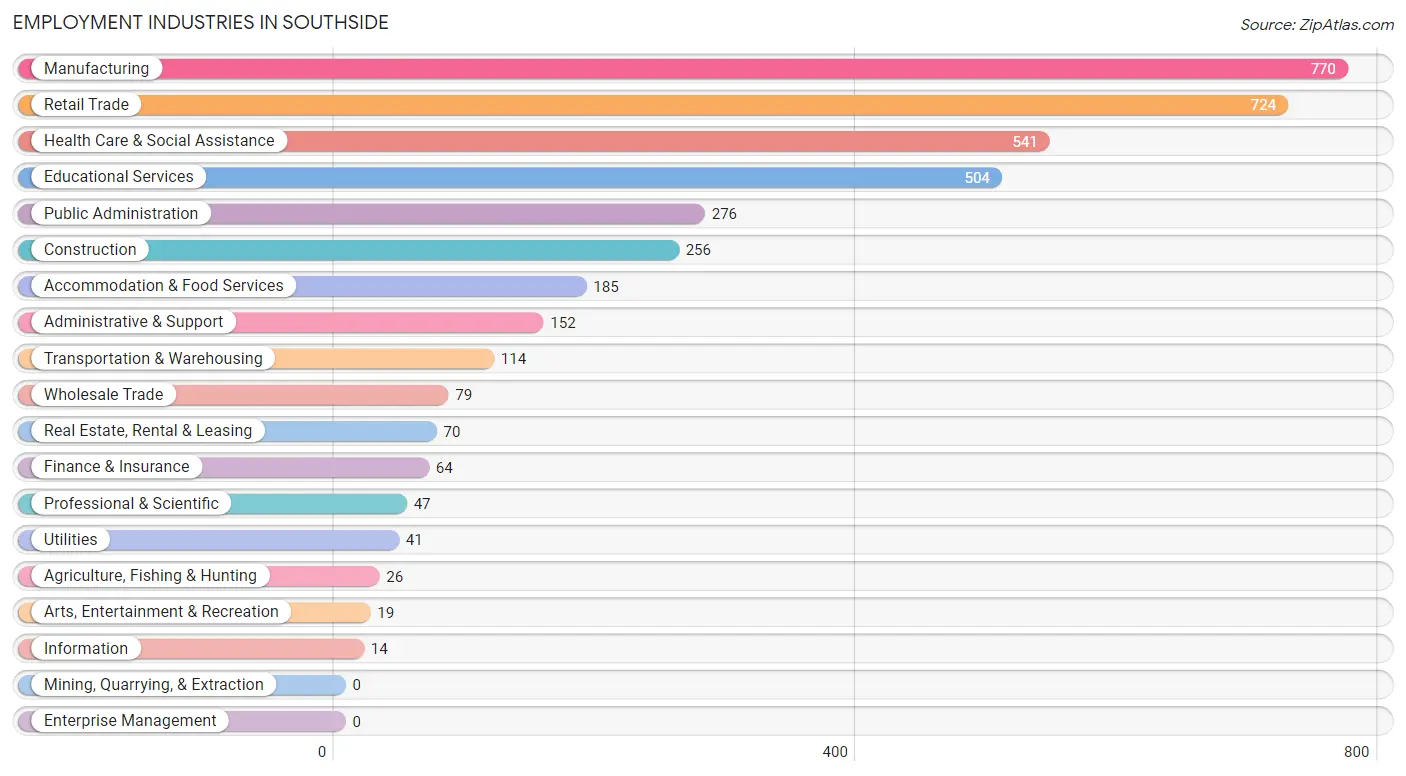
Employment Industries in Southside
The major employment industries in Southside include Manufacturing (770 | 18.7%), Retail Trade (724 | 17.6%), Health Care & Social Assistance (541 | 13.2%), Educational Services (504 | 12.2%), and Public Administration (276 | 6.7%).
Employment Industries by Sex in Southside
The Southside industries that see more men than women are Information (100.0%), Arts, Entertainment & Recreation (100.0%), and Construction (97.3%), whereas the industries that tend to have a higher number of women are Finance & Insurance (100.0%), Educational Services (91.9%), and Accommodation & Food Services (86.5%).
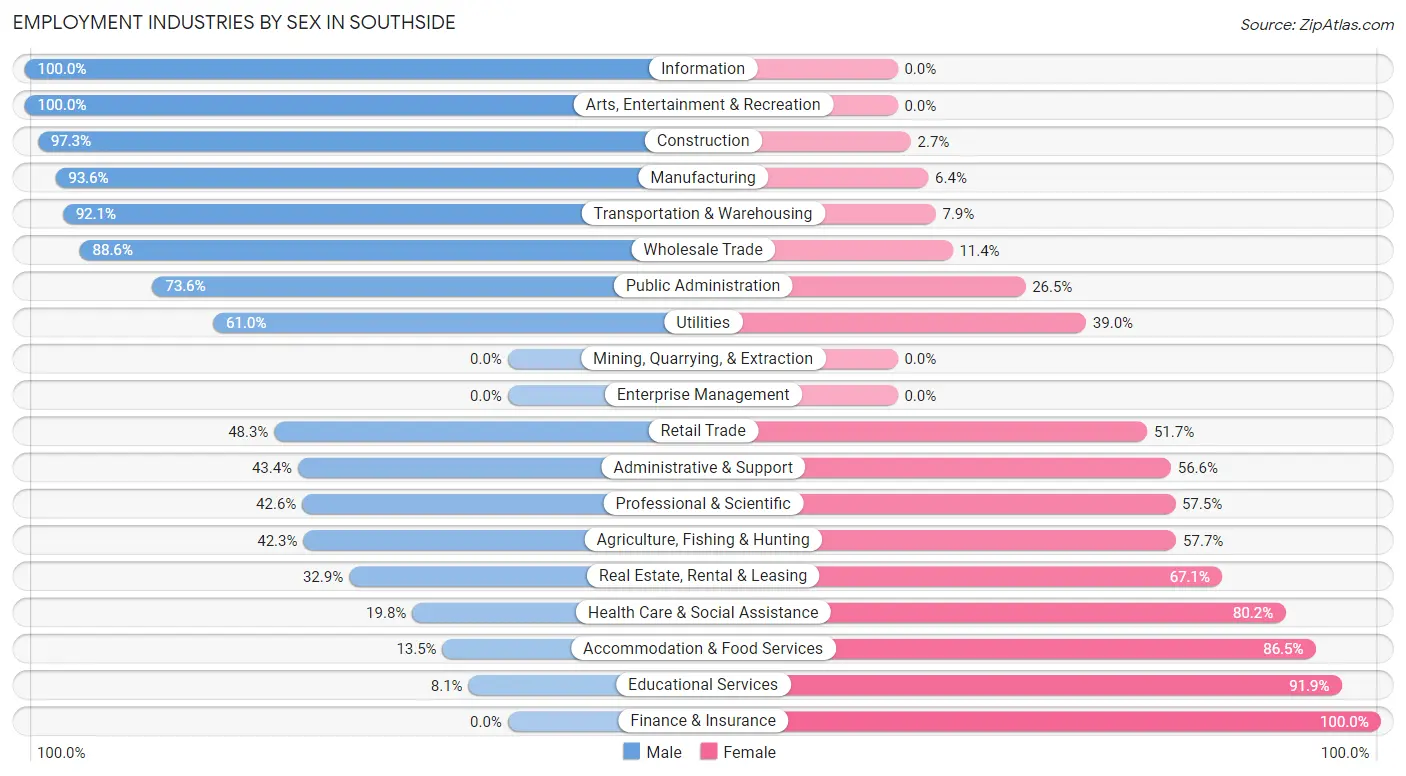
| Industry | Male | Female |
| Agriculture, Fishing & Hunting | 11 (42.3%) | 15 (57.7%) |
| Mining, Quarrying, & Extraction | 0 (0.0%) | 0 (0.0%) |
| Construction | 249 (97.3%) | 7 (2.7%) |
| Manufacturing | 721 (93.6%) | 49 (6.4%) |
| Wholesale Trade | 70 (88.6%) | 9 (11.4%) |
| Retail Trade | 350 (48.3%) | 374 (51.7%) |
| Transportation & Warehousing | 105 (92.1%) | 9 (7.9%) |
| Utilities | 25 (61.0%) | 16 (39.0%) |
| Information | 14 (100.0%) | 0 (0.0%) |
| Finance & Insurance | 0 (0.0%) | 64 (100.0%) |
| Real Estate, Rental & Leasing | 23 (32.9%) | 47 (67.1%) |
| Professional & Scientific | 20 (42.5%) | 27 (57.5%) |
| Enterprise Management | 0 (0.0%) | 0 (0.0%) |
| Administrative & Support | 66 (43.4%) | 86 (56.6%) |
| Educational Services | 41 (8.1%) | 463 (91.9%) |
| Health Care & Social Assistance | 107 (19.8%) | 434 (80.2%) |
| Arts, Entertainment & Recreation | 19 (100.0%) | 0 (0.0%) |
| Accommodation & Food Services | 25 (13.5%) | 160 (86.5%) |
| Public Administration | 203 (73.6%) | 73 (26.5%) |
| Total | 2,123 (51.6%) | 1,991 (48.4%) |
Education in Southside
School Enrollment in Southside
The most common levels of schooling among the 1,805 students in Southside are elementary school (561 | 31.1%), middle school (516 | 28.6%), and high school (268 | 14.8%).
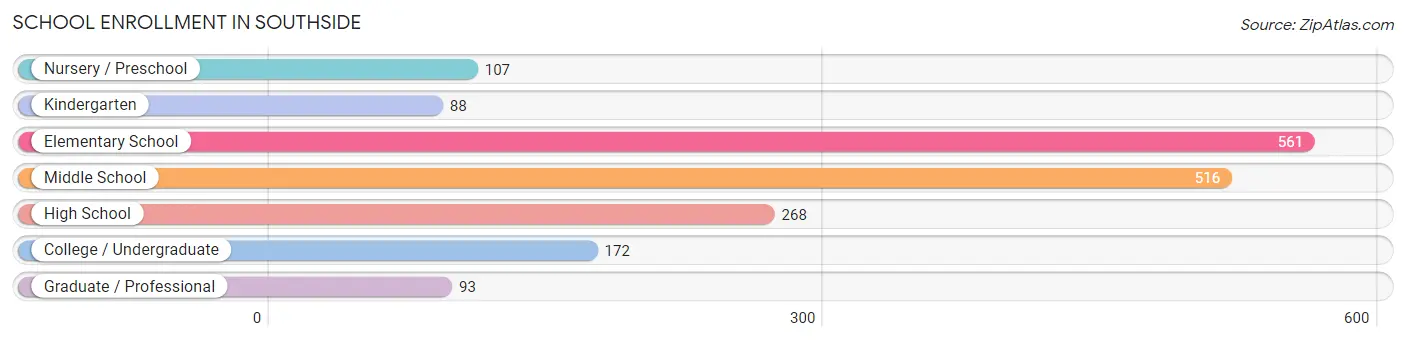
| School Level | # Students | % Students |
| Nursery / Preschool | 107 | 5.9% |
| Kindergarten | 88 | 4.9% |
| Elementary School | 561 | 31.1% |
| Middle School | 516 | 28.6% |
| High School | 268 | 14.8% |
| College / Undergraduate | 172 | 9.5% |
| Graduate / Professional | 93 | 5.1% |
| Total | 1,805 | 100.0% |
School Enrollment by Age by Funding Source in Southside
Out of a total of 1,805 students who are enrolled in schools in Southside, 164 (9.1%) attend a private institution, while the remaining 1,641 (90.9%) are enrolled in public schools. The age group of 15 to 17 year olds has the highest likelihood of being enrolled in private schools, with 43 (17.0% in the age bracket) enrolled. Conversely, the age group of 3 to 4 year olds has the lowest likelihood of being enrolled in a private school, with 107 (100.0% in the age bracket) attending a public institution.
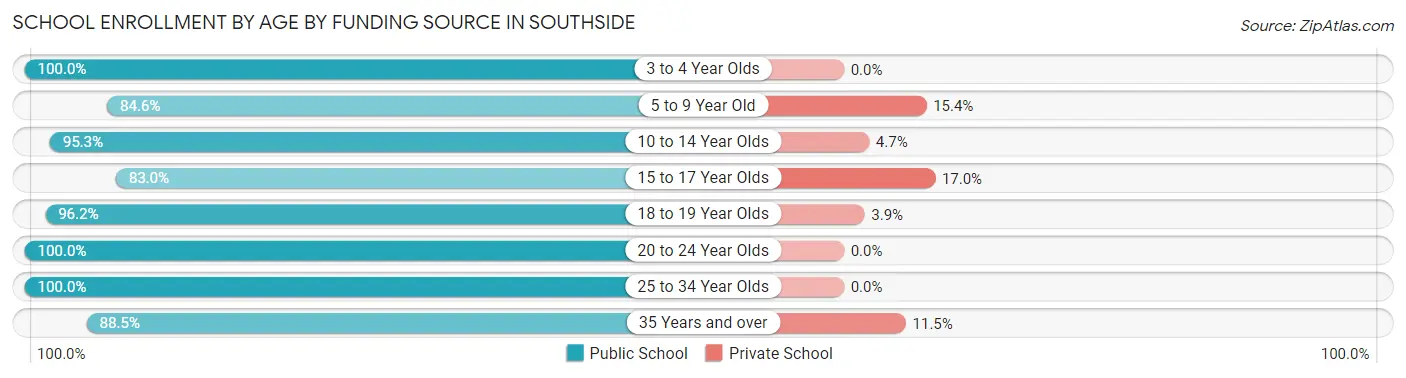
| Age Bracket | Public School | Private School |
| 3 to 4 Year Olds | 107 (100.0%) | 0 (0.0%) |
| 5 to 9 Year Old | 435 (84.6%) | 79 (15.4%) |
| 10 to 14 Year Olds | 629 (95.3%) | 31 (4.7%) |
| 15 to 17 Year Olds | 210 (83.0%) | 43 (17.0%) |
| 18 to 19 Year Olds | 50 (96.2%) | 2 (3.8%) |
| 20 to 24 Year Olds | 95 (100.0%) | 0 (0.0%) |
| 25 to 34 Year Olds | 46 (100.0%) | 0 (0.0%) |
| 35 Years and over | 69 (88.5%) | 9 (11.5%) |
| Total | 1,641 (90.9%) | 164 (9.1%) |
Educational Attainment by Field of Study in Southside
Education (397 | 26.1%), business (386 | 25.4%), science & technology (268 | 17.6%), arts & humanities (110 | 7.2%), and bio, nature & agricultural (77 | 5.1%) are the most common fields of study among 1,520 individuals in Southside who have obtained a bachelor's degree or higher.
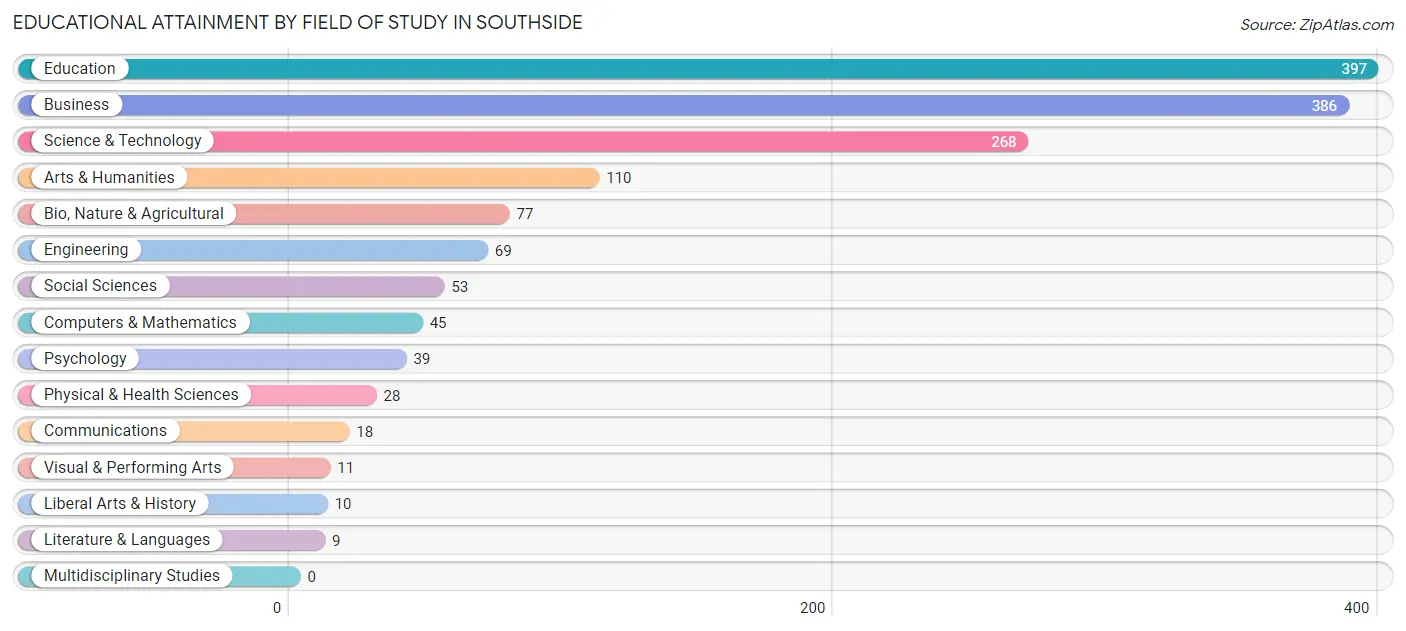
| Field of Study | # Graduates | % Graduates |
| Computers & Mathematics | 45 | 3.0% |
| Bio, Nature & Agricultural | 77 | 5.1% |
| Physical & Health Sciences | 28 | 1.8% |
| Psychology | 39 | 2.6% |
| Social Sciences | 53 | 3.5% |
| Engineering | 69 | 4.5% |
| Multidisciplinary Studies | 0 | 0.0% |
| Science & Technology | 268 | 17.6% |
| Business | 386 | 25.4% |
| Education | 397 | 26.1% |
| Literature & Languages | 9 | 0.6% |
| Liberal Arts & History | 10 | 0.7% |
| Visual & Performing Arts | 11 | 0.7% |
| Communications | 18 | 1.2% |
| Arts & Humanities | 110 | 7.2% |
| Total | 1,520 | 100.0% |
Transportation & Commute in Southside
Vehicle Availability by Sex in Southside
The most prevalent vehicle ownership categories in Southside are males with 2 vehicles (811, accounting for 39.4%) and females with 2 vehicles (574, making up 41.6%).
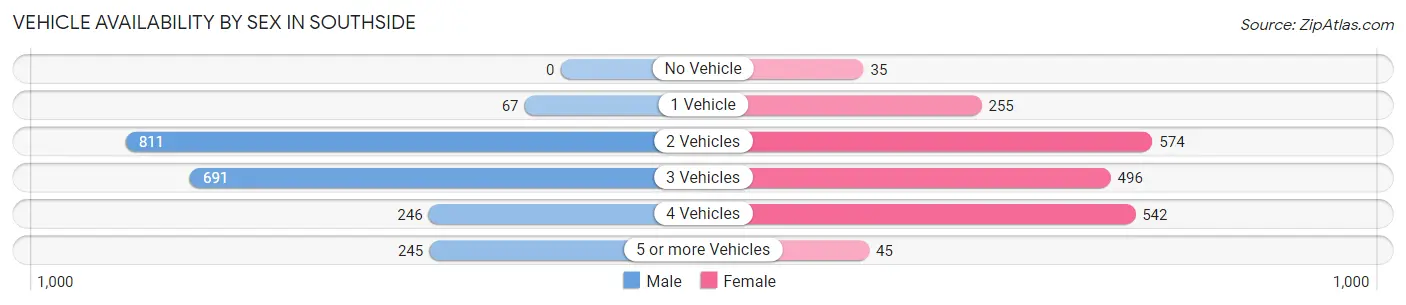
| Vehicles Available | Male | Female |
| No Vehicle | 0 (0.0%) | 35 (1.8%) |
| 1 Vehicle | 67 (3.3%) | 255 (13.1%) |
| 2 Vehicles | 811 (39.4%) | 574 (29.5%) |
| 3 Vehicles | 691 (33.5%) | 496 (25.5%) |
| 4 Vehicles | 246 (11.9%) | 542 (27.8%) |
| 5 or more Vehicles | 245 (11.9%) | 45 (2.3%) |
| Total | 2,060 (100.0%) | 1,947 (100.0%) |
Commute Time in Southside
The most frequently occuring commute durations in Southside are 20 to 24 minutes (1,149 commuters, 29.2%), 10 to 14 minutes (544 commuters, 13.8%), and 15 to 19 minutes (462 commuters, 11.7%).
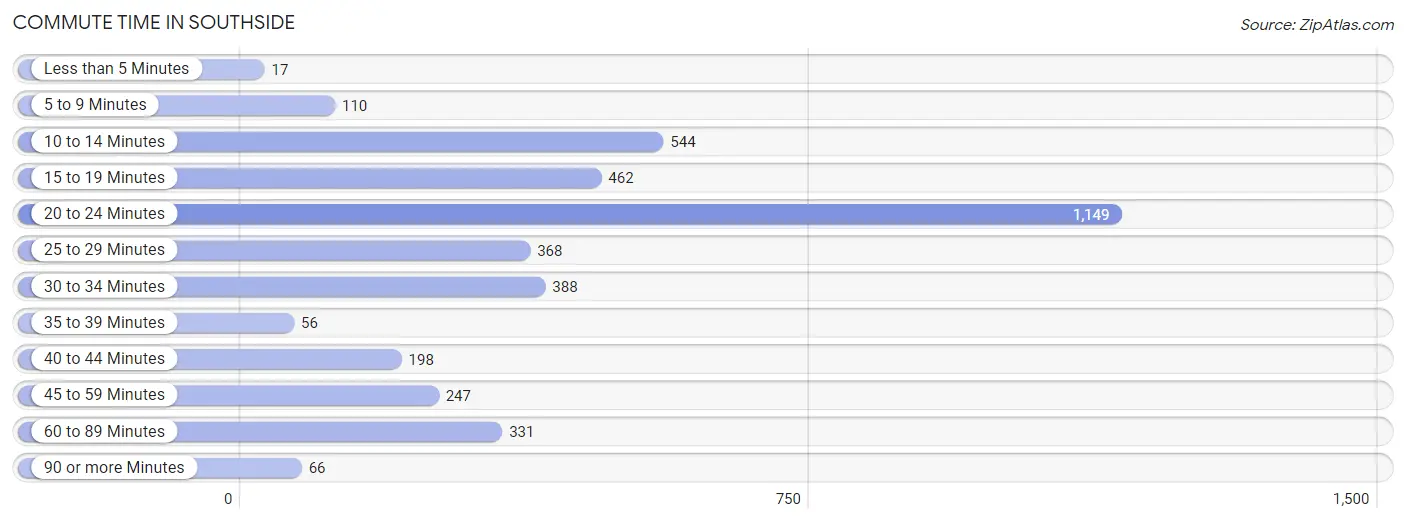
| Commute Time | # Commuters | % Commuters |
| Less than 5 Minutes | 17 | 0.4% |
| 5 to 9 Minutes | 110 | 2.8% |
| 10 to 14 Minutes | 544 | 13.8% |
| 15 to 19 Minutes | 462 | 11.7% |
| 20 to 24 Minutes | 1,149 | 29.2% |
| 25 to 29 Minutes | 368 | 9.3% |
| 30 to 34 Minutes | 388 | 9.9% |
| 35 to 39 Minutes | 56 | 1.4% |
| 40 to 44 Minutes | 198 | 5.0% |
| 45 to 59 Minutes | 247 | 6.3% |
| 60 to 89 Minutes | 331 | 8.4% |
| 90 or more Minutes | 66 | 1.7% |
Commute Time by Sex in Southside
The most common commute times in Southside are 20 to 24 minutes (409 commuters, 20.6%) for males and 20 to 24 minutes (740 commuters, 38.0%) for females.
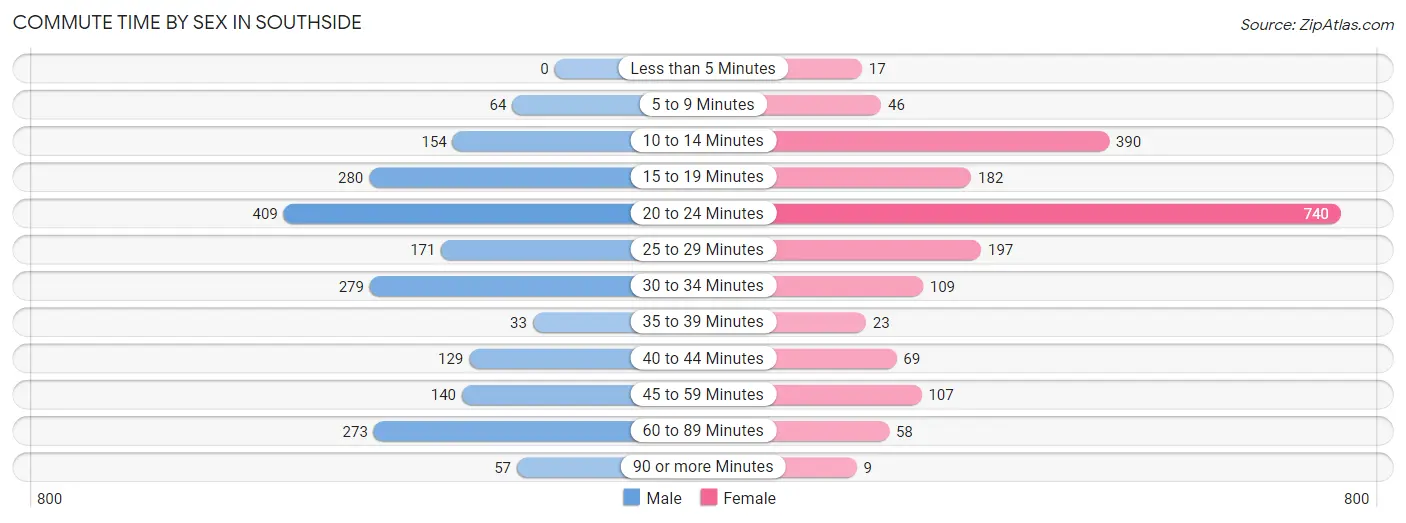
| Commute Time | Male | Female |
| Less than 5 Minutes | 0 (0.0%) | 17 (0.9%) |
| 5 to 9 Minutes | 64 (3.2%) | 46 (2.4%) |
| 10 to 14 Minutes | 154 (7.7%) | 390 (20.0%) |
| 15 to 19 Minutes | 280 (14.1%) | 182 (9.3%) |
| 20 to 24 Minutes | 409 (20.6%) | 740 (38.0%) |
| 25 to 29 Minutes | 171 (8.6%) | 197 (10.1%) |
| 30 to 34 Minutes | 279 (14.0%) | 109 (5.6%) |
| 35 to 39 Minutes | 33 (1.7%) | 23 (1.2%) |
| 40 to 44 Minutes | 129 (6.5%) | 69 (3.5%) |
| 45 to 59 Minutes | 140 (7.0%) | 107 (5.5%) |
| 60 to 89 Minutes | 273 (13.7%) | 58 (3.0%) |
| 90 or more Minutes | 57 (2.9%) | 9 (0.5%) |
Time of Departure to Work by Sex in Southside
The most frequent times of departure to work in Southside are 6:00 AM to 6:29 AM (466, 23.4%) for males and 9:00 AM to 9:59 AM (559, 28.7%) for females.
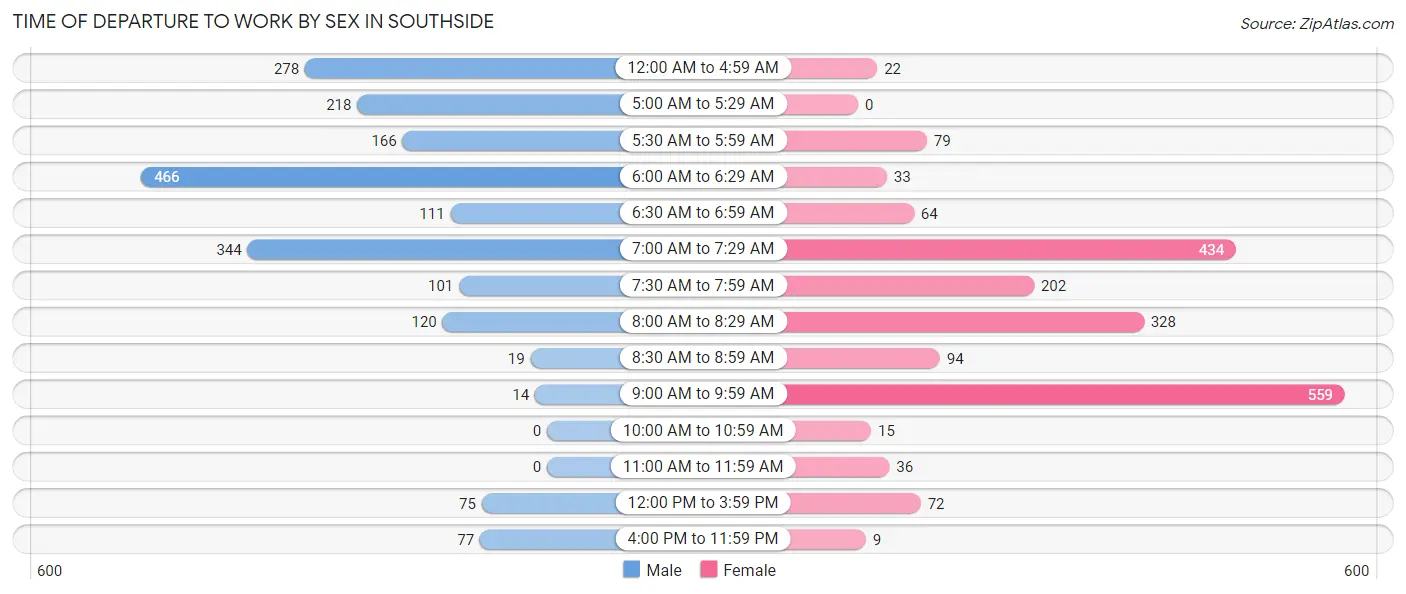
| Time of Departure | Male | Female |
| 12:00 AM to 4:59 AM | 278 (14.0%) | 22 (1.1%) |
| 5:00 AM to 5:29 AM | 218 (11.0%) | 0 (0.0%) |
| 5:30 AM to 5:59 AM | 166 (8.4%) | 79 (4.1%) |
| 6:00 AM to 6:29 AM | 466 (23.4%) | 33 (1.7%) |
| 6:30 AM to 6:59 AM | 111 (5.6%) | 64 (3.3%) |
| 7:00 AM to 7:29 AM | 344 (17.3%) | 434 (22.3%) |
| 7:30 AM to 7:59 AM | 101 (5.1%) | 202 (10.4%) |
| 8:00 AM to 8:29 AM | 120 (6.0%) | 328 (16.9%) |
| 8:30 AM to 8:59 AM | 19 (1.0%) | 94 (4.8%) |
| 9:00 AM to 9:59 AM | 14 (0.7%) | 559 (28.7%) |
| 10:00 AM to 10:59 AM | 0 (0.0%) | 15 (0.8%) |
| 11:00 AM to 11:59 AM | 0 (0.0%) | 36 (1.8%) |
| 12:00 PM to 3:59 PM | 75 (3.8%) | 72 (3.7%) |
| 4:00 PM to 11:59 PM | 77 (3.9%) | 9 (0.5%) |
| Total | 1,989 (100.0%) | 1,947 (100.0%) |
Housing Occupancy in Southside
Occupancy by Ownership in Southside
Of the total 3,070 dwellings in Southside, owner-occupied units account for 2,783 (90.6%), while renter-occupied units make up 287 (9.3%).

| Occupancy | # Housing Units | % Housing Units |
| Owner Occupied Housing Units | 2,783 | 90.6% |
| Renter-Occupied Housing Units | 287 | 9.3% |
| Total Occupied Housing Units | 3,070 | 100.0% |
Occupancy by Household Size in Southside
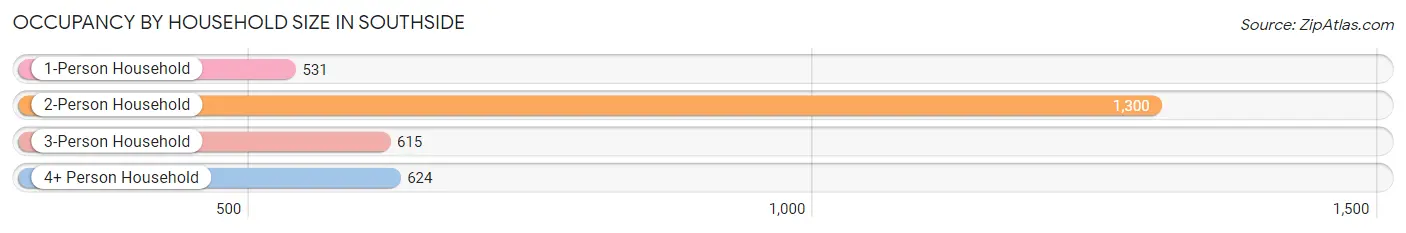
| Household Size | # Housing Units | % Housing Units |
| 1-Person Household | 531 | 17.3% |
| 2-Person Household | 1,300 | 42.3% |
| 3-Person Household | 615 | 20.0% |
| 4+ Person Household | 624 | 20.3% |
| Total Housing Units | 3,070 | 100.0% |
Occupancy by Ownership by Household Size in Southside
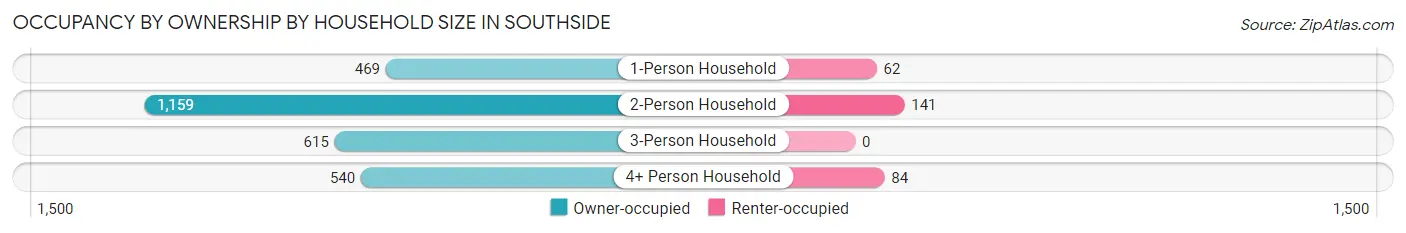
| Household Size | Owner-occupied | Renter-occupied |
| 1-Person Household | 469 (88.3%) | 62 (11.7%) |
| 2-Person Household | 1,159 (89.1%) | 141 (10.8%) |
| 3-Person Household | 615 (100.0%) | 0 (0.0%) |
| 4+ Person Household | 540 (86.5%) | 84 (13.5%) |
| Total Housing Units | 2,783 (90.6%) | 287 (9.3%) |
Occupancy by Educational Attainment in Southside
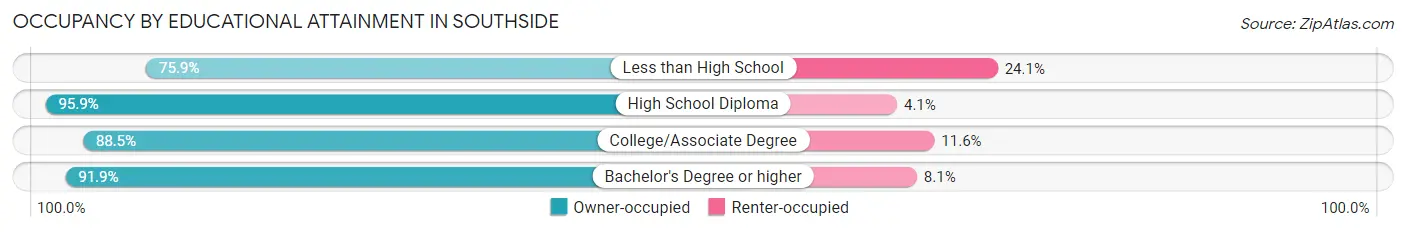
| Household Size | Owner-occupied | Renter-occupied |
| Less than High School | 126 (75.9%) | 40 (24.1%) |
| High School Diploma | 810 (95.9%) | 35 (4.1%) |
| College/Associate Degree | 1,164 (88.4%) | 152 (11.6%) |
| Bachelor's Degree or higher | 683 (91.9%) | 60 (8.1%) |
Occupancy by Age of Householder in Southside
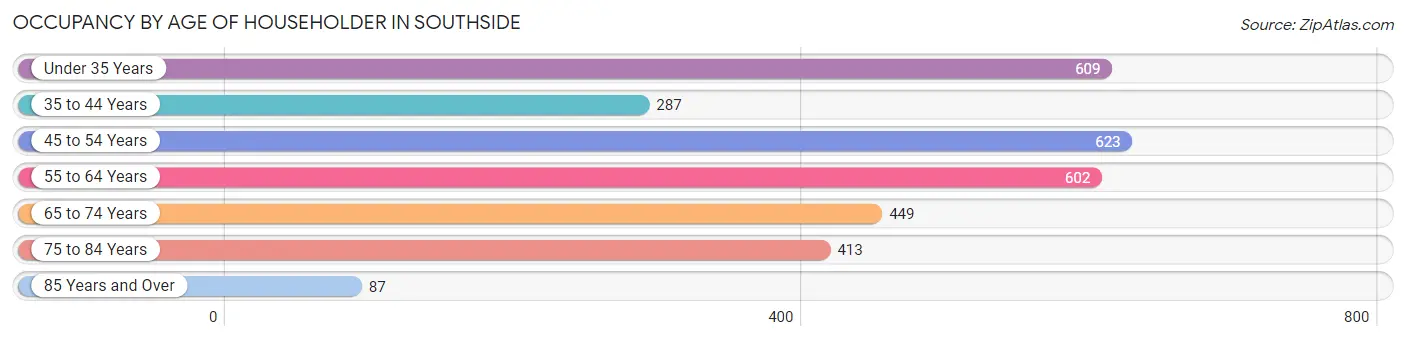
| Age Bracket | # Households | % Households |
| Under 35 Years | 609 | 19.8% |
| 35 to 44 Years | 287 | 9.3% |
| 45 to 54 Years | 623 | 20.3% |
| 55 to 64 Years | 602 | 19.6% |
| 65 to 74 Years | 449 | 14.6% |
| 75 to 84 Years | 413 | 13.5% |
| 85 Years and Over | 87 | 2.8% |
| Total | 3,070 | 100.0% |
Housing Finances in Southside
Median Income by Occupancy in Southside
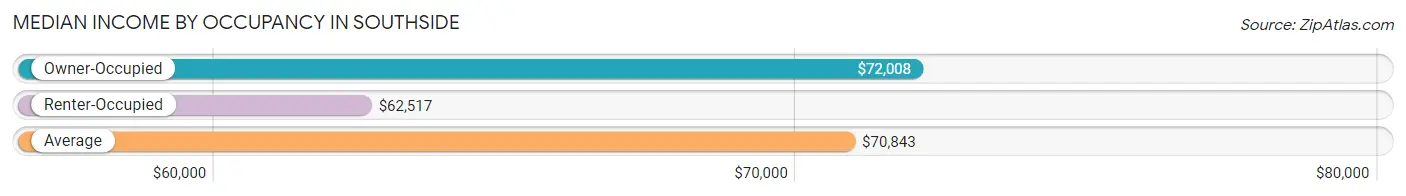
| Occupancy Type | # Households | Median Income |
| Owner-Occupied | 2,783 (90.6%) | $72,008 |
| Renter-Occupied | 287 (9.3%) | $62,517 |
| Average | 3,070 (100.0%) | $70,843 |
Occupancy by Householder Income Bracket in Southside
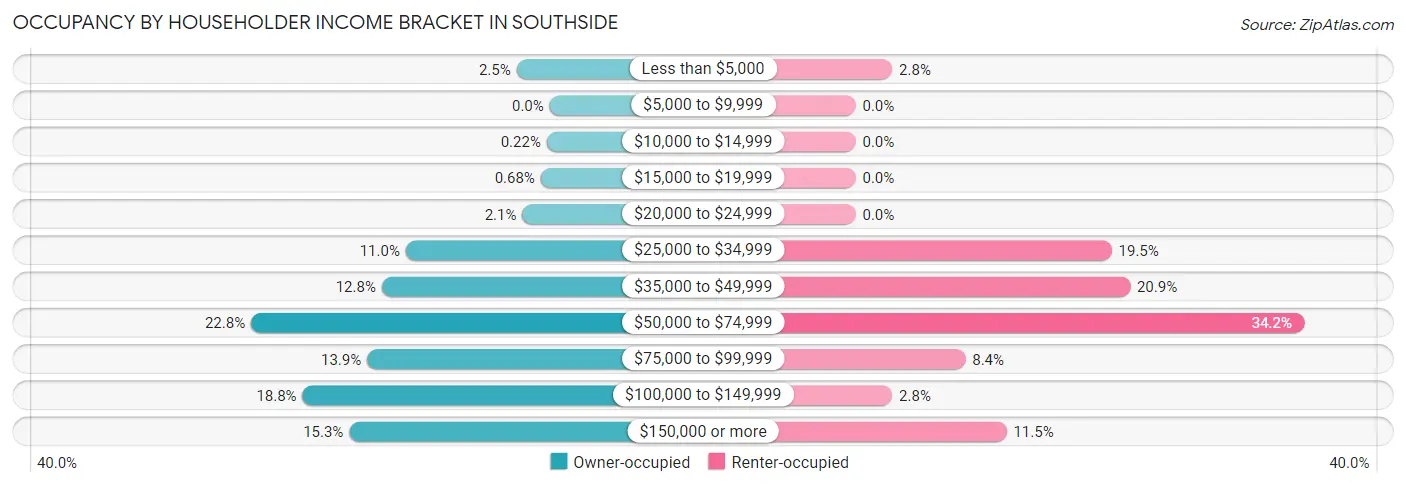
| Income Bracket | Owner-occupied | Renter-occupied |
| Less than $5,000 | 70 (2.5%) | 8 (2.8%) |
| $5,000 to $9,999 | 0 (0.0%) | 0 (0.0%) |
| $10,000 to $14,999 | 6 (0.2%) | 0 (0.0%) |
| $15,000 to $19,999 | 19 (0.7%) | 0 (0.0%) |
| $20,000 to $24,999 | 58 (2.1%) | 0 (0.0%) |
| $25,000 to $34,999 | 305 (11.0%) | 56 (19.5%) |
| $35,000 to $49,999 | 356 (12.8%) | 60 (20.9%) |
| $50,000 to $74,999 | 633 (22.8%) | 98 (34.2%) |
| $75,000 to $99,999 | 387 (13.9%) | 24 (8.4%) |
| $100,000 to $149,999 | 524 (18.8%) | 8 (2.8%) |
| $150,000 or more | 425 (15.3%) | 33 (11.5%) |
| Total | 2,783 (100.0%) | 287 (100.0%) |
Monthly Housing Cost Tiers in Southside
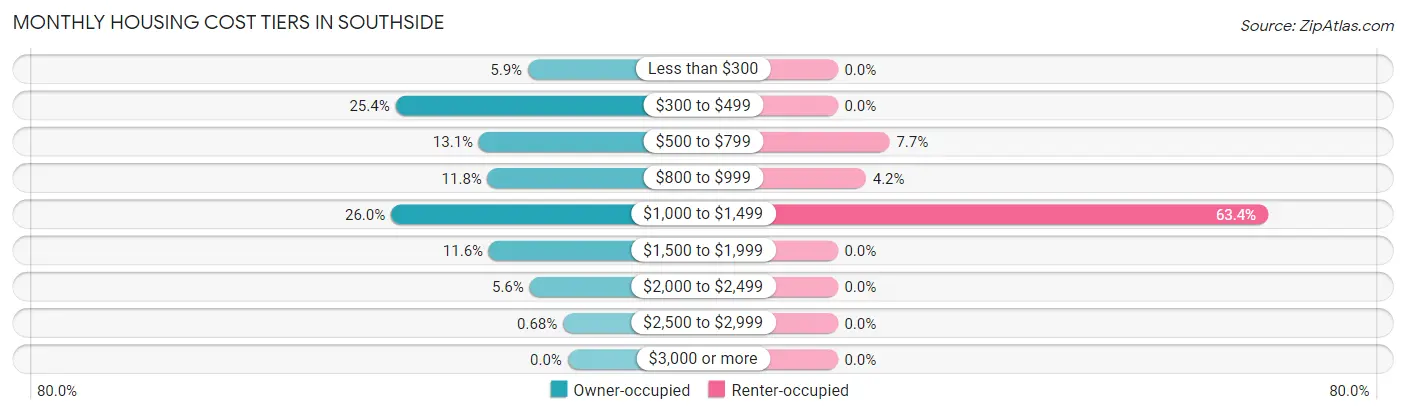
| Monthly Cost | Owner-occupied | Renter-occupied |
| Less than $300 | 163 (5.9%) | 0 (0.0%) |
| $300 to $499 | 706 (25.4%) | 0 (0.0%) |
| $500 to $799 | 364 (13.1%) | 22 (7.7%) |
| $800 to $999 | 328 (11.8%) | 12 (4.2%) |
| $1,000 to $1,499 | 724 (26.0%) | 182 (63.4%) |
| $1,500 to $1,999 | 323 (11.6%) | 0 (0.0%) |
| $2,000 to $2,499 | 156 (5.6%) | 0 (0.0%) |
| $2,500 to $2,999 | 19 (0.7%) | 0 (0.0%) |
| $3,000 or more | 0 (0.0%) | 0 (0.0%) |
| Total | 2,783 (100.0%) | 287 (100.0%) |
Physical Housing Characteristics in Southside
Housing Structures in Southside
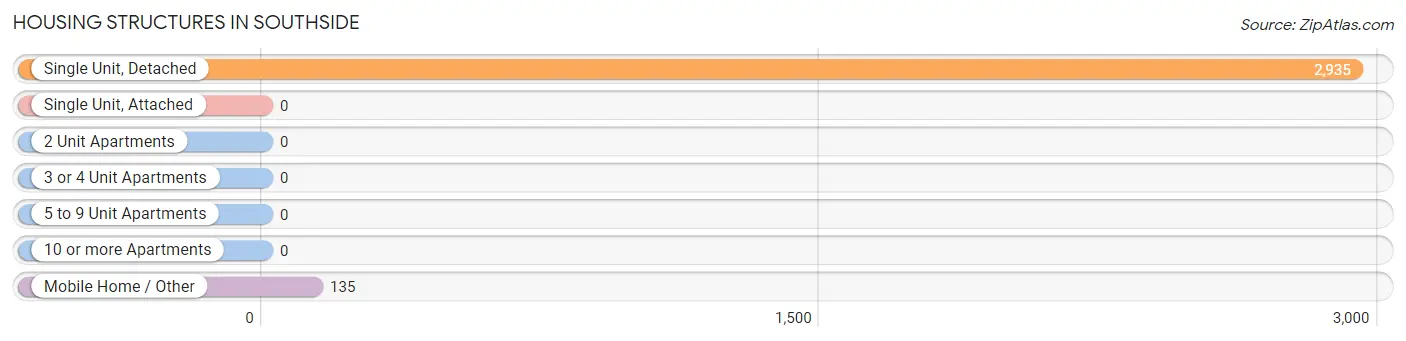
| Structure Type | # Housing Units | % Housing Units |
| Single Unit, Detached | 2,935 | 95.6% |
| Single Unit, Attached | 0 | 0.0% |
| 2 Unit Apartments | 0 | 0.0% |
| 3 or 4 Unit Apartments | 0 | 0.0% |
| 5 to 9 Unit Apartments | 0 | 0.0% |
| 10 or more Apartments | 0 | 0.0% |
| Mobile Home / Other | 135 | 4.4% |
| Total | 3,070 | 100.0% |
Housing Structures by Occupancy in Southside
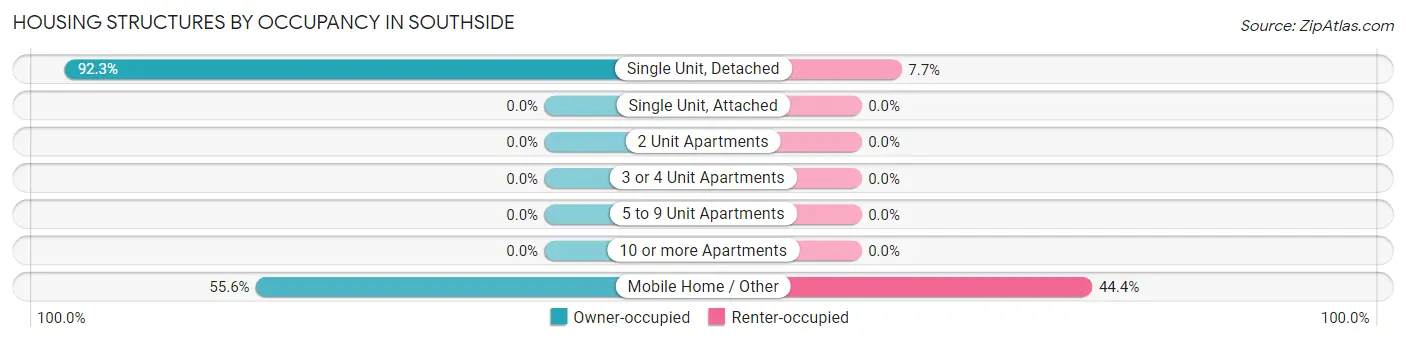
| Structure Type | Owner-occupied | Renter-occupied |
| Single Unit, Detached | 2,708 (92.3%) | 227 (7.7%) |
| Single Unit, Attached | 0 (0.0%) | 0 (0.0%) |
| 2 Unit Apartments | 0 (0.0%) | 0 (0.0%) |
| 3 or 4 Unit Apartments | 0 (0.0%) | 0 (0.0%) |
| 5 to 9 Unit Apartments | 0 (0.0%) | 0 (0.0%) |
| 10 or more Apartments | 0 (0.0%) | 0 (0.0%) |
| Mobile Home / Other | 75 (55.6%) | 60 (44.4%) |
| Total | 2,783 (90.6%) | 287 (9.3%) |
Housing Structures by Number of Rooms in Southside
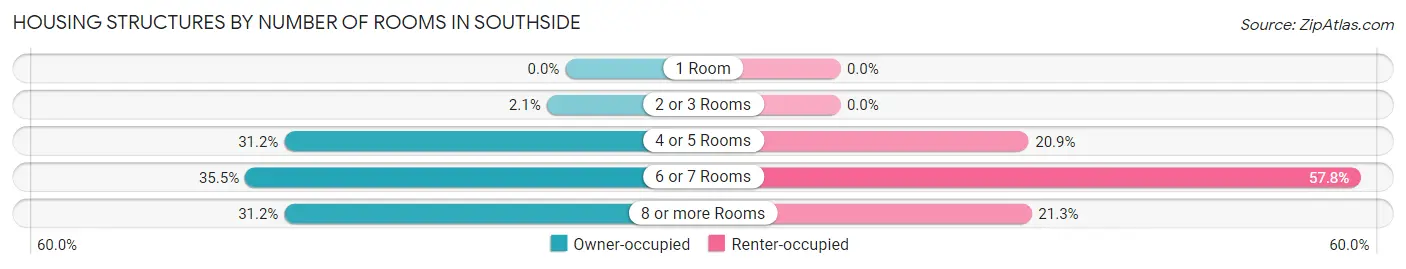
| Number of Rooms | Owner-occupied | Renter-occupied |
| 1 Room | 0 (0.0%) | 0 (0.0%) |
| 2 or 3 Rooms | 58 (2.1%) | 0 (0.0%) |
| 4 or 5 Rooms | 868 (31.2%) | 60 (20.9%) |
| 6 or 7 Rooms | 989 (35.5%) | 166 (57.8%) |
| 8 or more Rooms | 868 (31.2%) | 61 (21.2%) |
| Total | 2,783 (100.0%) | 287 (100.0%) |
Housing Structure by Heating Type in Southside
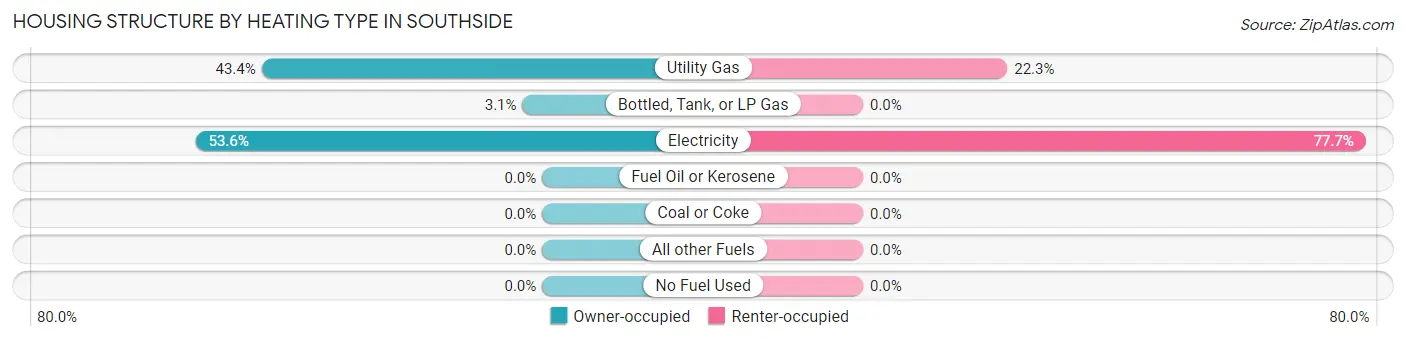
| Heating Type | Owner-occupied | Renter-occupied |
| Utility Gas | 1,207 (43.4%) | 64 (22.3%) |
| Bottled, Tank, or LP Gas | 85 (3.0%) | 0 (0.0%) |
| Electricity | 1,491 (53.6%) | 223 (77.7%) |
| Fuel Oil or Kerosene | 0 (0.0%) | 0 (0.0%) |
| Coal or Coke | 0 (0.0%) | 0 (0.0%) |
| All other Fuels | 0 (0.0%) | 0 (0.0%) |
| No Fuel Used | 0 (0.0%) | 0 (0.0%) |
| Total | 2,783 (100.0%) | 287 (100.0%) |
Household Vehicle Usage in Southside
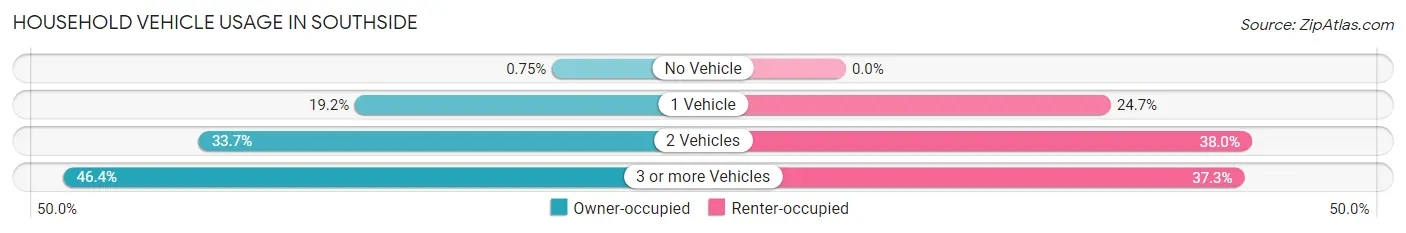
| Vehicles per Household | Owner-occupied | Renter-occupied |
| No Vehicle | 21 (0.7%) | 0 (0.0%) |
| 1 Vehicle | 533 (19.2%) | 71 (24.7%) |
| 2 Vehicles | 939 (33.7%) | 109 (38.0%) |
| 3 or more Vehicles | 1,290 (46.4%) | 107 (37.3%) |
| Total | 2,783 (100.0%) | 287 (100.0%) |
Real Estate & Mortgages in Southside
Real Estate and Mortgage Overview in Southside
| Characteristic | Without Mortgage | With Mortgage |
| Housing Units | 1,196 | 1,587 |
| Median Property Value | $185,300 | $188,300 |
| Median Household Income | $61,129 | $280 |
| Monthly Housing Costs | $445 | $0 |
| Real Estate Taxes | $769 | $138 |
Property Value by Mortgage Status in Southside
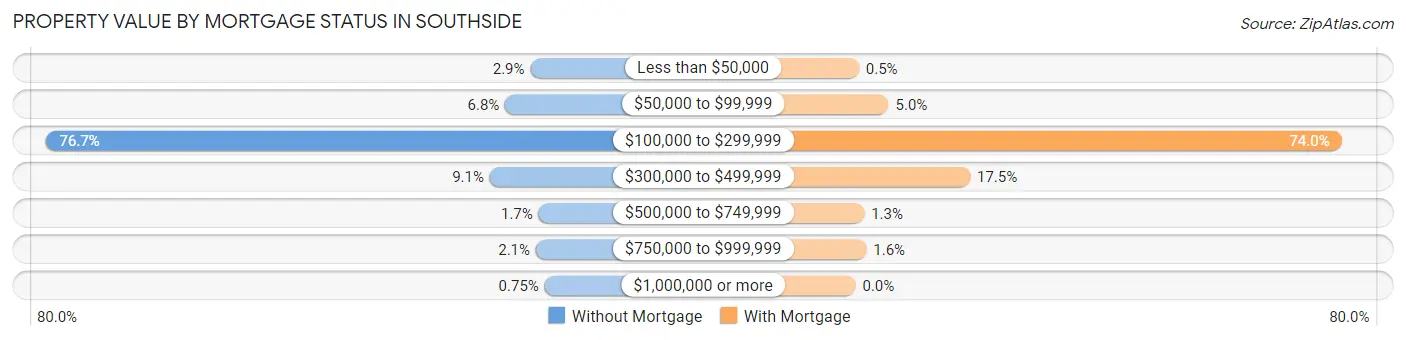
| Property Value | Without Mortgage | With Mortgage |
| Less than $50,000 | 35 (2.9%) | 8 (0.5%) |
| $50,000 to $99,999 | 81 (6.8%) | 80 (5.0%) |
| $100,000 to $299,999 | 917 (76.7%) | 1,175 (74.0%) |
| $300,000 to $499,999 | 109 (9.1%) | 277 (17.4%) |
| $500,000 to $749,999 | 20 (1.7%) | 21 (1.3%) |
| $750,000 to $999,999 | 25 (2.1%) | 26 (1.6%) |
| $1,000,000 or more | 9 (0.7%) | 0 (0.0%) |
| Total | 1,196 (100.0%) | 1,587 (100.0%) |
Household Income by Mortgage Status in Southside
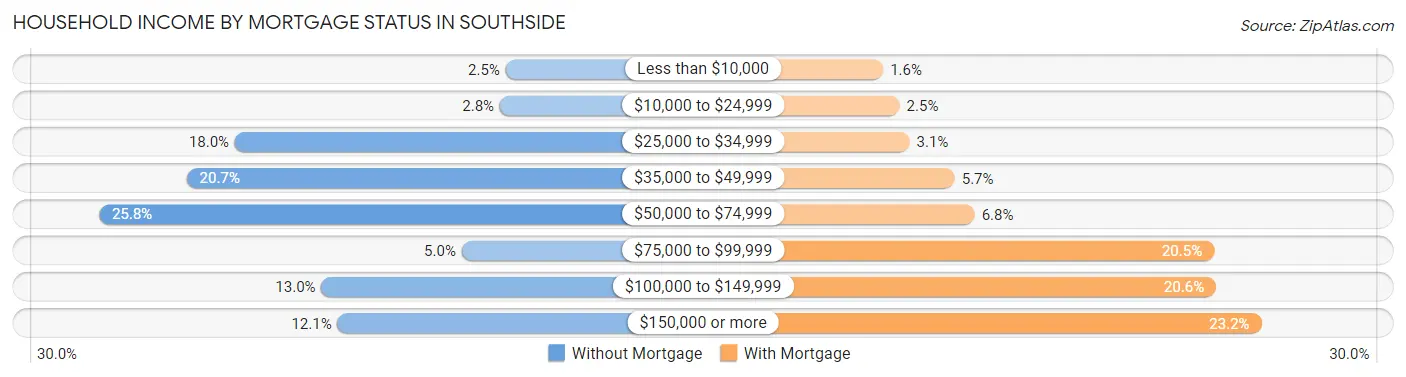
| Household Income | Without Mortgage | With Mortgage |
| Less than $10,000 | 30 (2.5%) | 25 (1.6%) |
| $10,000 to $24,999 | 34 (2.8%) | 40 (2.5%) |
| $25,000 to $34,999 | 215 (18.0%) | 49 (3.1%) |
| $35,000 to $49,999 | 248 (20.7%) | 90 (5.7%) |
| $50,000 to $74,999 | 308 (25.8%) | 108 (6.8%) |
| $75,000 to $99,999 | 60 (5.0%) | 325 (20.5%) |
| $100,000 to $149,999 | 156 (13.0%) | 327 (20.6%) |
| $150,000 or more | 145 (12.1%) | 368 (23.2%) |
| Total | 1,196 (100.0%) | 1,587 (100.0%) |
Property Value to Household Income Ratio in Southside
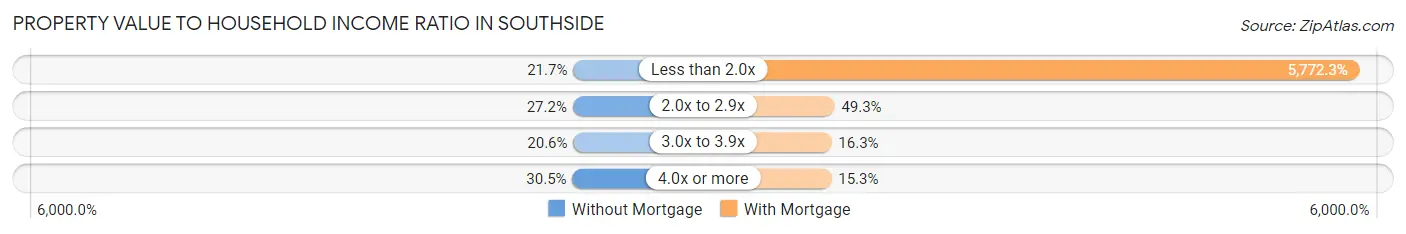
| Value-to-Income Ratio | Without Mortgage | With Mortgage |
| Less than 2.0x | 260 (21.7%) | 91,607 (5,772.3%) |
| 2.0x to 2.9x | 325 (27.2%) | 783 (49.3%) |
| 3.0x to 3.9x | 246 (20.6%) | 259 (16.3%) |
| 4.0x or more | 365 (30.5%) | 243 (15.3%) |
| Total | 1,196 (100.0%) | 1,587 (100.0%) |
Real Estate Taxes by Mortgage Status in Southside
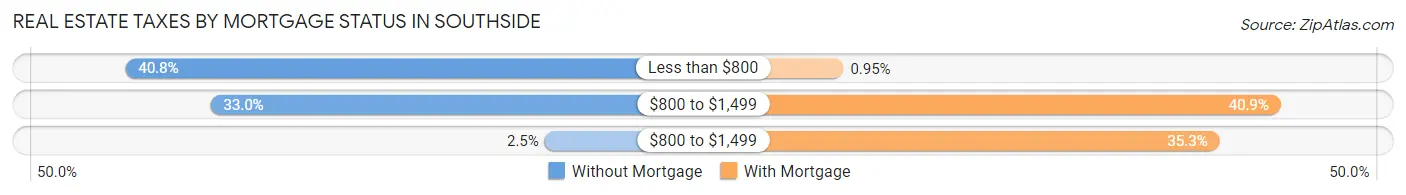
| Property Taxes | Without Mortgage | With Mortgage |
| Less than $800 | 488 (40.8%) | 15 (0.9%) |
| $800 to $1,499 | 395 (33.0%) | 649 (40.9%) |
| $800 to $1,499 | 30 (2.5%) | 560 (35.3%) |
| Total | 1,196 (100.0%) | 1,587 (100.0%) |
Health & Disability in Southside
Health Insurance Coverage by Age in Southside
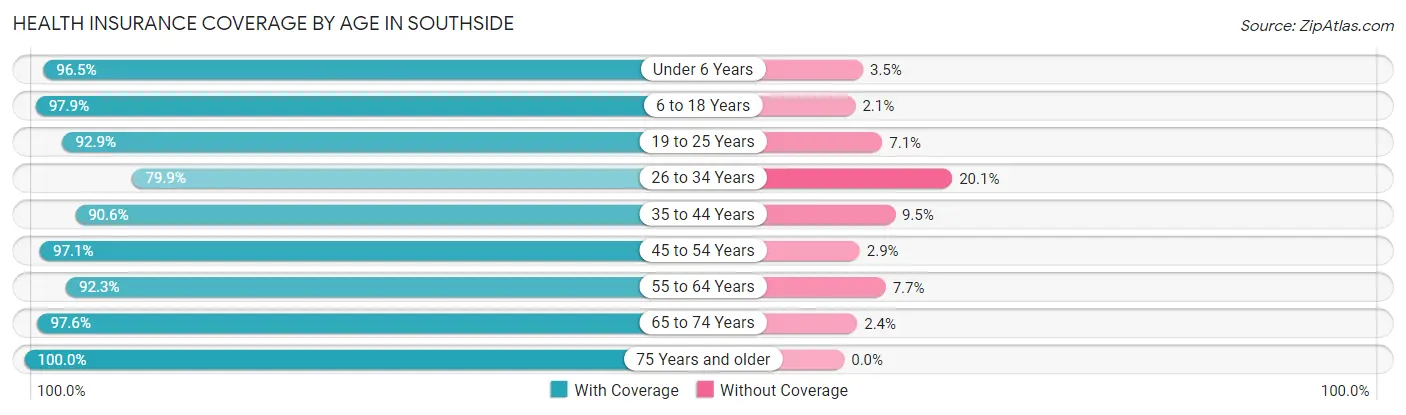
| Age Bracket | With Coverage | Without Coverage |
| Under 6 Years | 827 (96.5%) | 30 (3.5%) |
| 6 to 18 Years | 1,462 (97.9%) | 31 (2.1%) |
| 19 to 25 Years | 497 (92.9%) | 38 (7.1%) |
| 26 to 34 Years | 948 (79.9%) | 239 (20.1%) |
| 35 to 44 Years | 1,054 (90.5%) | 110 (9.5%) |
| 45 to 54 Years | 905 (97.1%) | 27 (2.9%) |
| 55 to 64 Years | 1,122 (92.3%) | 94 (7.7%) |
| 65 to 74 Years | 1,129 (97.6%) | 28 (2.4%) |
| 75 Years and older | 701 (100.0%) | 0 (0.0%) |
| Total | 8,645 (93.5%) | 597 (6.5%) |
Health Insurance Coverage by Citizenship Status in Southside
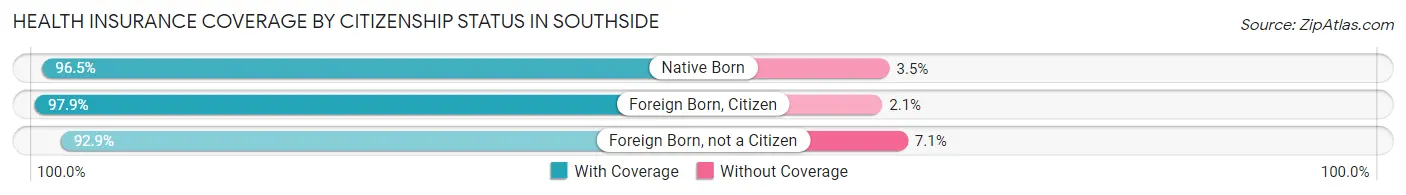
| Citizenship Status | With Coverage | Without Coverage |
| Native Born | 827 (96.5%) | 30 (3.5%) |
| Foreign Born, Citizen | 1,462 (97.9%) | 31 (2.1%) |
| Foreign Born, not a Citizen | 497 (92.9%) | 38 (7.1%) |
Health Insurance Coverage by Household Income in Southside
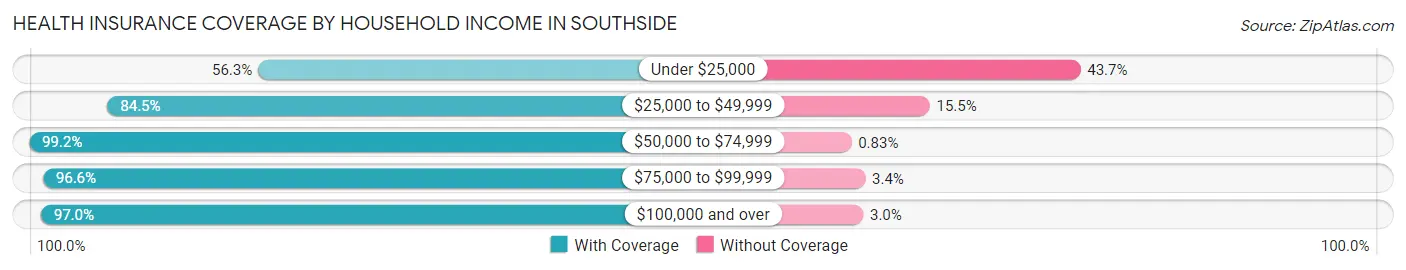
| Household Income | With Coverage | Without Coverage |
| Under $25,000 | 238 (56.3%) | 185 (43.7%) |
| $25,000 to $49,999 | 1,204 (84.5%) | 221 (15.5%) |
| $50,000 to $74,999 | 2,034 (99.2%) | 17 (0.8%) |
| $75,000 to $99,999 | 1,774 (96.6%) | 63 (3.4%) |
| $100,000 and over | 3,386 (97.0%) | 106 (3.0%) |
Public vs Private Health Insurance Coverage by Age in Southside
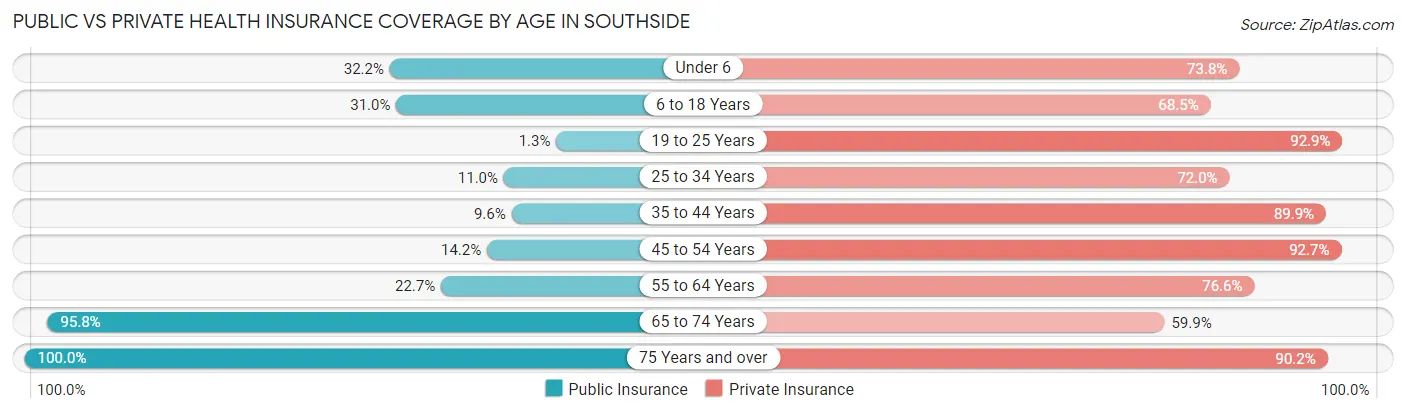
| Age Bracket | Public Insurance | Private Insurance |
| Under 6 | 276 (32.2%) | 632 (73.8%) |
| 6 to 18 Years | 463 (31.0%) | 1,022 (68.4%) |
| 19 to 25 Years | 7 (1.3%) | 497 (92.9%) |
| 25 to 34 Years | 131 (11.0%) | 854 (72.0%) |
| 35 to 44 Years | 112 (9.6%) | 1,046 (89.9%) |
| 45 to 54 Years | 132 (14.2%) | 864 (92.7%) |
| 55 to 64 Years | 276 (22.7%) | 931 (76.6%) |
| 65 to 74 Years | 1,108 (95.8%) | 693 (59.9%) |
| 75 Years and over | 701 (100.0%) | 632 (90.2%) |
| Total | 3,206 (34.7%) | 7,171 (77.6%) |
Disability Status by Sex by Age in Southside
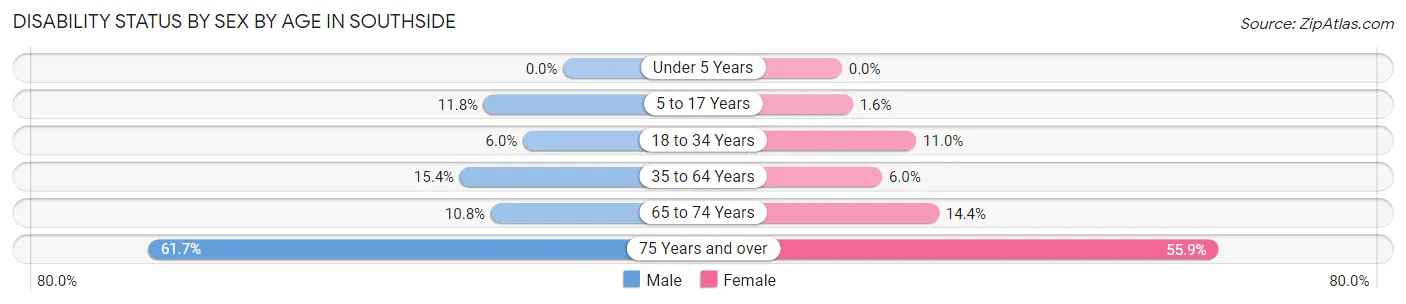
| Age Bracket | Male | Female |
| Under 5 Years | 0 (0.0%) | 0 (0.0%) |
| 5 to 17 Years | 121 (11.8%) | 9 (1.6%) |
| 18 to 34 Years | 61 (6.0%) | 82 (11.0%) |
| 35 to 64 Years | 236 (15.4%) | 106 (6.0%) |
| 65 to 74 Years | 49 (10.7%) | 101 (14.4%) |
| 75 Years and over | 224 (61.7%) | 189 (55.9%) |
Disability Class by Sex by Age in Southside
Disability Class: Hearing Difficulty
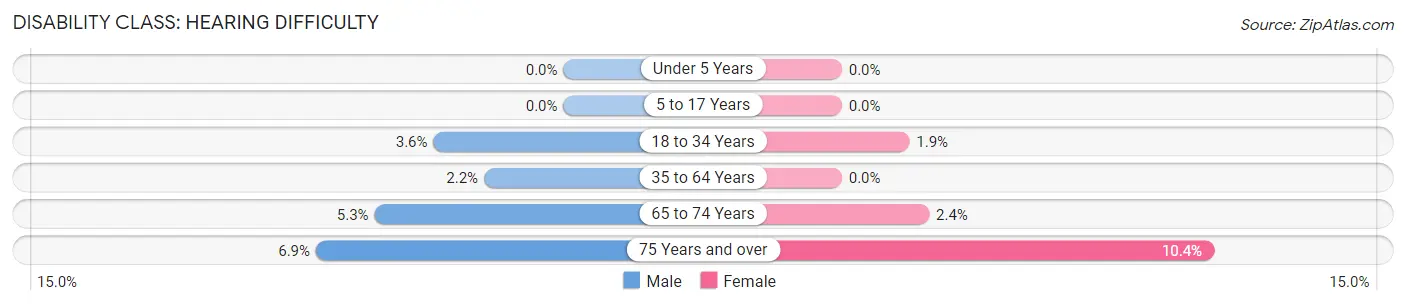
| Age Bracket | Male | Female |
| Under 5 Years | 0 (0.0%) | 0 (0.0%) |
| 5 to 17 Years | 0 (0.0%) | 0 (0.0%) |
| 18 to 34 Years | 37 (3.6%) | 14 (1.9%) |
| 35 to 64 Years | 34 (2.2%) | 0 (0.0%) |
| 65 to 74 Years | 24 (5.3%) | 17 (2.4%) |
| 75 Years and over | 25 (6.9%) | 35 (10.4%) |
Disability Class: Vision Difficulty
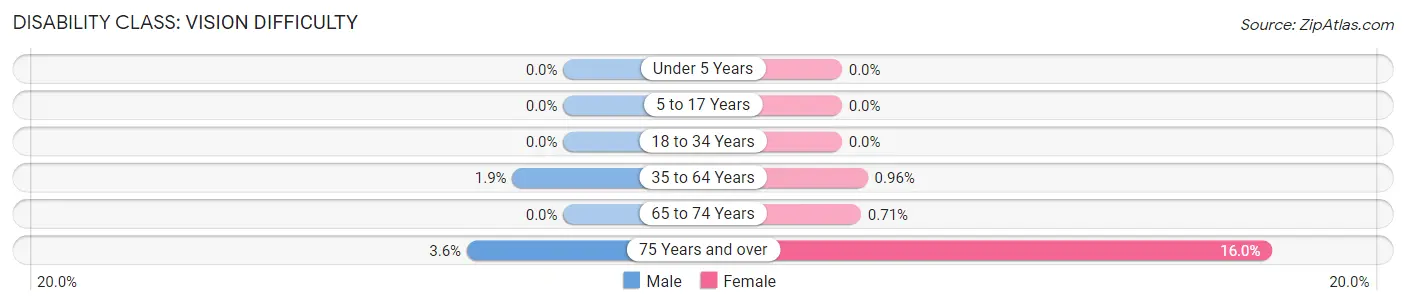
| Age Bracket | Male | Female |
| Under 5 Years | 0 (0.0%) | 0 (0.0%) |
| 5 to 17 Years | 0 (0.0%) | 0 (0.0%) |
| 18 to 34 Years | 0 (0.0%) | 0 (0.0%) |
| 35 to 64 Years | 29 (1.9%) | 17 (1.0%) |
| 65 to 74 Years | 0 (0.0%) | 5 (0.7%) |
| 75 Years and over | 13 (3.6%) | 54 (16.0%) |
Disability Class: Cognitive Difficulty
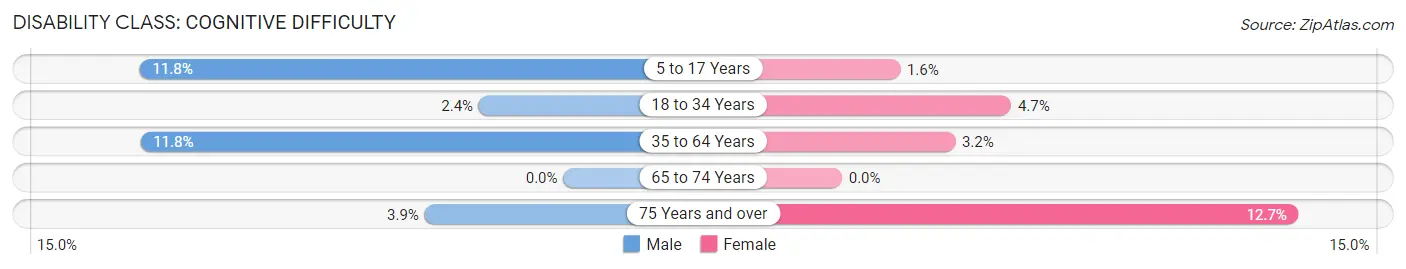
| Age Bracket | Male | Female |
| 5 to 17 Years | 121 (11.8%) | 9 (1.6%) |
| 18 to 34 Years | 24 (2.4%) | 35 (4.7%) |
| 35 to 64 Years | 181 (11.8%) | 56 (3.2%) |
| 65 to 74 Years | 0 (0.0%) | 0 (0.0%) |
| 75 Years and over | 14 (3.9%) | 43 (12.7%) |
Disability Class: Ambulatory Difficulty
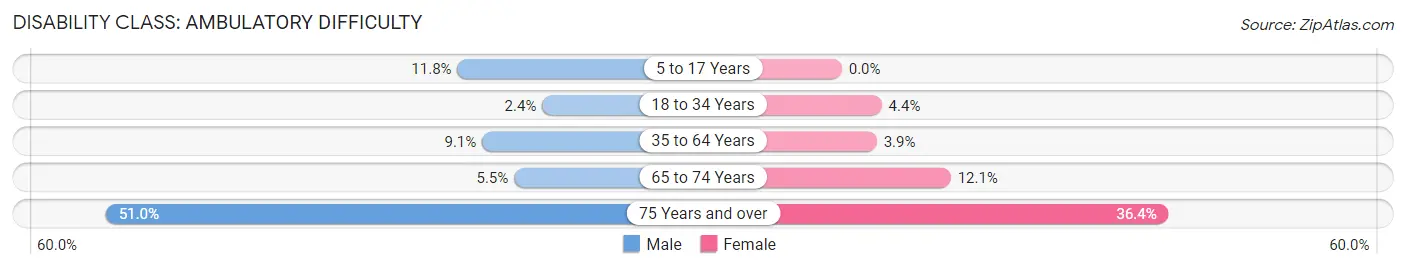
| Age Bracket | Male | Female |
| 5 to 17 Years | 121 (11.8%) | 0 (0.0%) |
| 18 to 34 Years | 24 (2.4%) | 33 (4.4%) |
| 35 to 64 Years | 139 (9.0%) | 69 (3.9%) |
| 65 to 74 Years | 25 (5.5%) | 85 (12.1%) |
| 75 Years and over | 185 (51.0%) | 123 (36.4%) |
Disability Class: Self-Care Difficulty
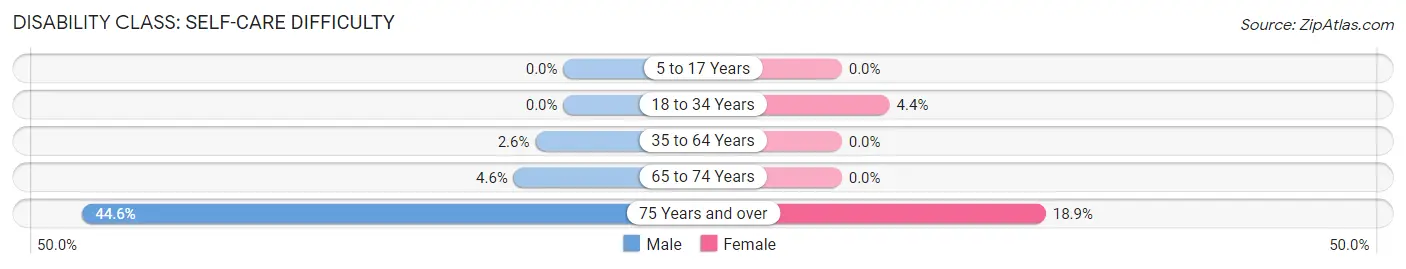
| Age Bracket | Male | Female |
| 5 to 17 Years | 0 (0.0%) | 0 (0.0%) |
| 18 to 34 Years | 0 (0.0%) | 33 (4.4%) |
| 35 to 64 Years | 40 (2.6%) | 0 (0.0%) |
| 65 to 74 Years | 21 (4.6%) | 0 (0.0%) |
| 75 Years and over | 162 (44.6%) | 64 (18.9%) |
Technology Access in Southside
Computing Device Access in Southside
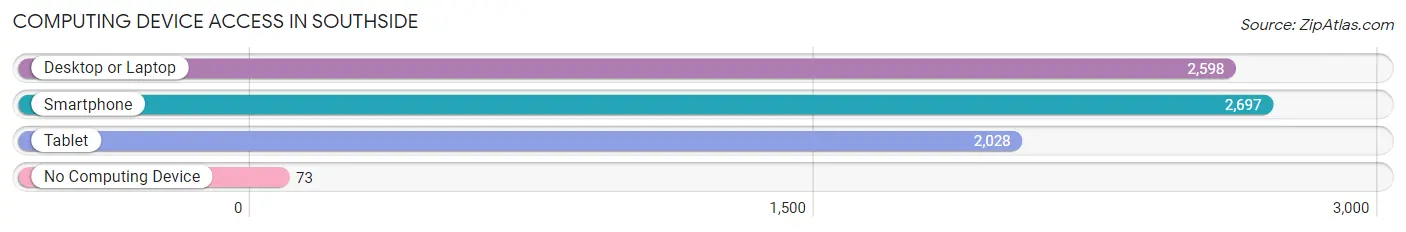
| Device Type | # Households | % Households |
| Desktop or Laptop | 2,598 | 84.6% |
| Smartphone | 2,697 | 87.8% |
| Tablet | 2,028 | 66.1% |
| No Computing Device | 73 | 2.4% |
| Total | 3,070 | 100.0% |
Internet Access in Southside
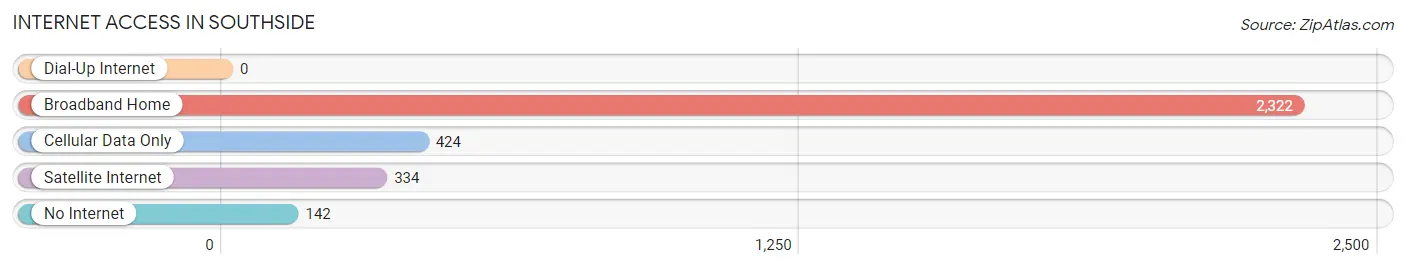
| Internet Type | # Households | % Households |
| Dial-Up Internet | 0 | 0.0% |
| Broadband Home | 2,322 | 75.6% |
| Cellular Data Only | 424 | 13.8% |
| Satellite Internet | 334 | 10.9% |
| No Internet | 142 | 4.6% |
| Total | 3,070 | 100.0% |
Southside Summary
Southside is a city located in Etowah County, Alabama. It is situated in the foothills of the Appalachian Mountains and is part of the Gadsden Metropolitan Statistical Area. The city has a population of approximately 8,000 people and is known for its small-town charm and friendly atmosphere.
History
Southside was founded in 1891 by a group of settlers from the nearby town of Gadsden. The town was originally called “Southside Station” due to its location on the south side of the railroad tracks. The town was officially incorporated in 1901 and the name was changed to Southside.
The city was originally a farming community and the main crops were cotton, corn, and tobacco. In the early 1900s, the town began to grow and develop as a manufacturing center. The first major industry to come to Southside was the Southside Cotton Mill, which opened in 1906. This mill was the first of many to come to the city and it helped to spur the growth of the town.
In the 1950s, Southside began to experience a population boom as people moved to the city from other parts of the state. This growth was largely due to the city’s proximity to the larger cities of Birmingham and Gadsden. The city also experienced a period of economic growth during this time as new businesses opened and the city’s infrastructure was improved.
Geography
Southside is located in the foothills of the Appalachian Mountains in Etowah County, Alabama. The city is situated on the banks of the Coosa River and is bordered by the cities of Gadsden and Attalla. The city has a total area of 8.3 square miles and is located at an elevation of 645 feet above sea level.
The climate in Southside is classified as humid subtropical, with hot, humid summers and mild winters. The average annual temperature is around 68 degrees Fahrenheit and the average annual precipitation is around 50 inches.
Economy
Southside’s economy is largely based on manufacturing and retail. The city is home to several large manufacturing plants, including the Southside Cotton Mill, which opened in 1906. Other major employers in the city include the Gadsden Regional Medical Center, the Gadsden State Community College, and the Gadsden City Schools.
The city also has a thriving retail sector, with several large shopping centers and numerous small businesses. The city is also home to several restaurants, bars, and other entertainment venues.
Demographics
As of the 2010 census, Southside had a population of 8,000 people. The racial makeup of the city was 79.3% White, 17.2% African American, 0.7% Native American, 0.4% Asian, 0.1% Pacific Islander, and 2.3% from other races. Hispanic or Latino of any race were 2.7% of the population.
The median household income in Southside was $37,917 and the median family income was $45,917. The per capita income for the city was $19,917. About 16.2% of the population was below the poverty line.
Southside is a small city with a rich history and a friendly atmosphere. The city has experienced a period of growth in recent years and is home to several large employers. The city also has a thriving retail sector and numerous entertainment venues. Southside is a great place to live and work and is a great example of a small town with big city amenities.
Common Questions
What is Per Capita Income in Southside?
Per Capita income in Southside is $32,630.
What is the Median Family Income in Southside?
Median Family Income in Southside is $73,646.
What is the Median Household income in Southside?
Median Household Income in Southside is $70,843.
What is Income or Wage Gap in Southside?
Income or Wage Gap in Southside is 34.0%.
Women in Southside earn 66.0 cents for every dollar earned by a man.
What is Inequality or Gini Index in Southside?
Inequality or Gini Index in Southside is 0.38.
What is the Total Population of Southside?
Total Population of Southside is 9,358.
What is the Total Male Population of Southside?
Total Male Population of Southside is 4,636.
What is the Total Female Population of Southside?
Total Female Population of Southside is 4,722.
What is the Ratio of Males per 100 Females in Southside?
There are 98.18 Males per 100 Females in Southside.
What is the Ratio of Females per 100 Males in Southside?
There are 101.86 Females per 100 Males in Southside.
What is the Median Population Age in Southside?
Median Population Age in Southside is 41.0 Years.
What is the Average Family Size in Southside
Average Family Size in Southside is 3.4 People.
What is the Average Household Size in Southside
Average Household Size in Southside is 3.0 People.
How Large is the Labor Force in Southside?
There are 4,263 People in the Labor Forcein in Southside.
What is the Percentage of People in the Labor Force in Southside?
59.4% of People are in the Labor Force in Southside.
What is the Unemployment Rate in Southside?
Unemployment Rate in Southside is 3.4%.