Fort Rucker, AL Map & Demographics
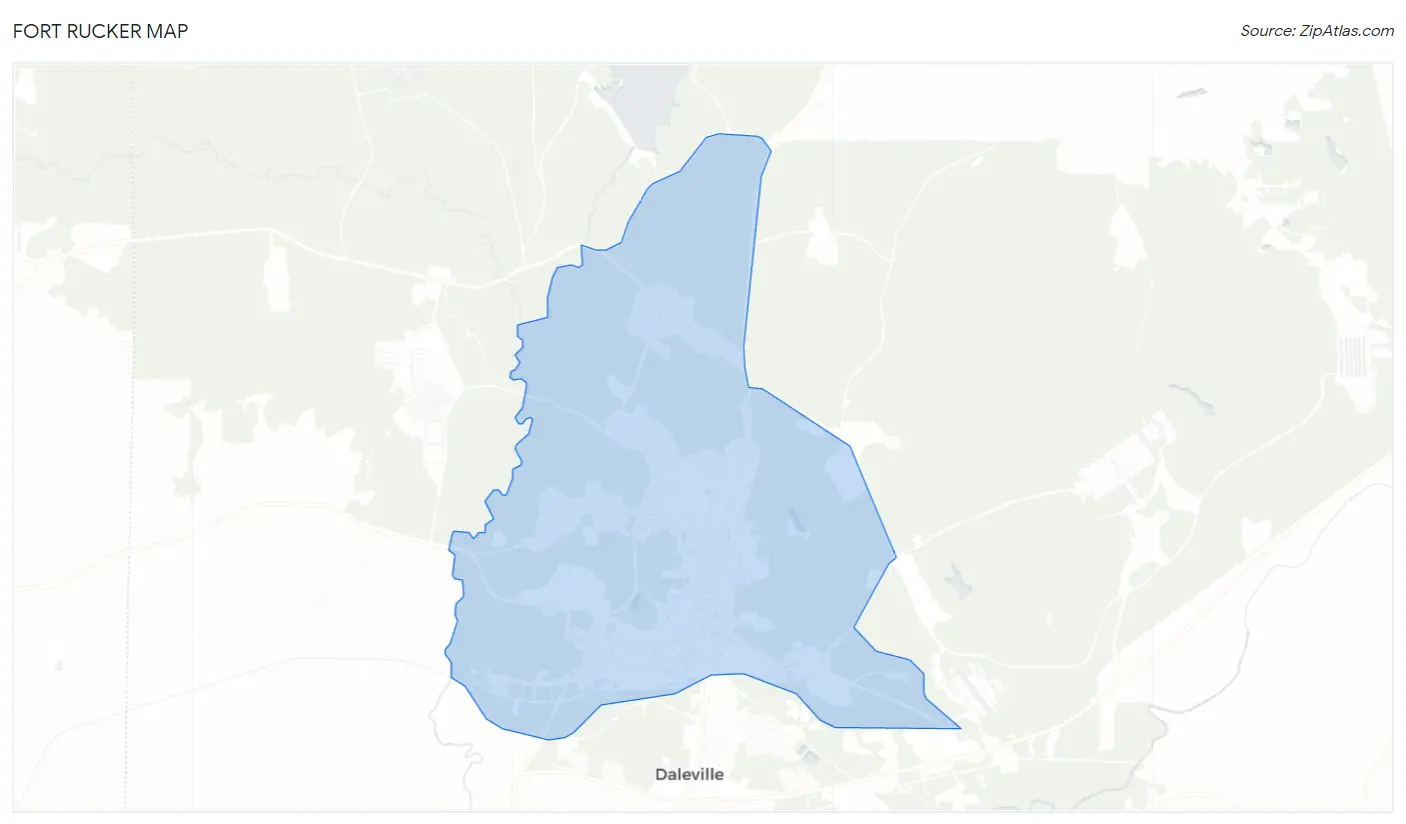
Fort Rucker Map
Fort Rucker Overview
$23,588
PER CAPITA INCOME
$66,471
AVG FAMILY INCOME
$72,681
AVG HOUSEHOLD INCOME
49.6%
WAGE / INCOME GAP [ % ]
50.4¢/ $1
WAGE / INCOME GAP [ $ ]
0.35
INEQUALITY / GINI INDEX
5,422
TOTAL POPULATION
2,981
MALE POPULATION
2,441
FEMALE POPULATION
122.12
MALES / 100 FEMALES
81.89
FEMALES / 100 MALES
24.2
MEDIAN AGE
3.7
AVG FAMILY SIZE
3.4
AVG HOUSEHOLD SIZE
2,558
LABOR FORCE [ PEOPLE ]
74.1%
PERCENT IN LABOR FORCE
16.1%
UNEMPLOYMENT RATE
Fort Rucker Zip Codes
Fort Rucker Area Codes
Income in Fort Rucker
Income Overview in Fort Rucker
Per Capita Income in Fort Rucker is $23,588, while median incomes of families and households are $66,471 and $72,681 respectively.
| Characteristic | Number | Measure |
| Per Capita Income | 5,422 | $23,588 |
| Median Family Income | 1,166 | $66,471 |
| Mean Family Income | 1,166 | $68,168 |
| Median Household Income | 1,465 | $72,681 |
| Mean Household Income | 1,465 | $72,891 |
| Income Deficit | 1,166 | $0 |
| Wage / Income Gap (%) | 5,422 | 49.65% |
| Wage / Income Gap ($) | 5,422 | 50.35¢ per $1 |
| Gini / Inequality Index | 5,422 | 0.35 |
Earnings by Sex in Fort Rucker
Average Earnings in Fort Rucker are $39,368, $45,241 for men and $22,781 for women, a difference of 49.6%.
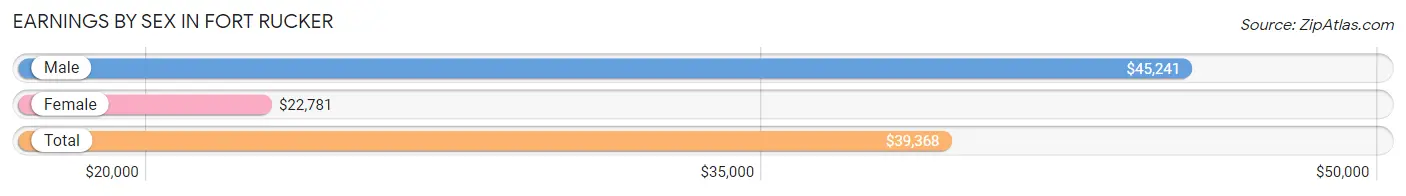
| Sex | Number | Average Earnings |
| Male | 1,963 (71.1%) | $45,241 |
| Female | 798 (28.9%) | $22,781 |
| Total | 2,761 (100.0%) | $39,368 |
Earnings by Sex by Income Bracket in Fort Rucker
The most common earnings brackets in Fort Rucker are $75,000 to $99,999 for men (291 | 14.8%) and $2,499 or less for women (129 | 16.2%).
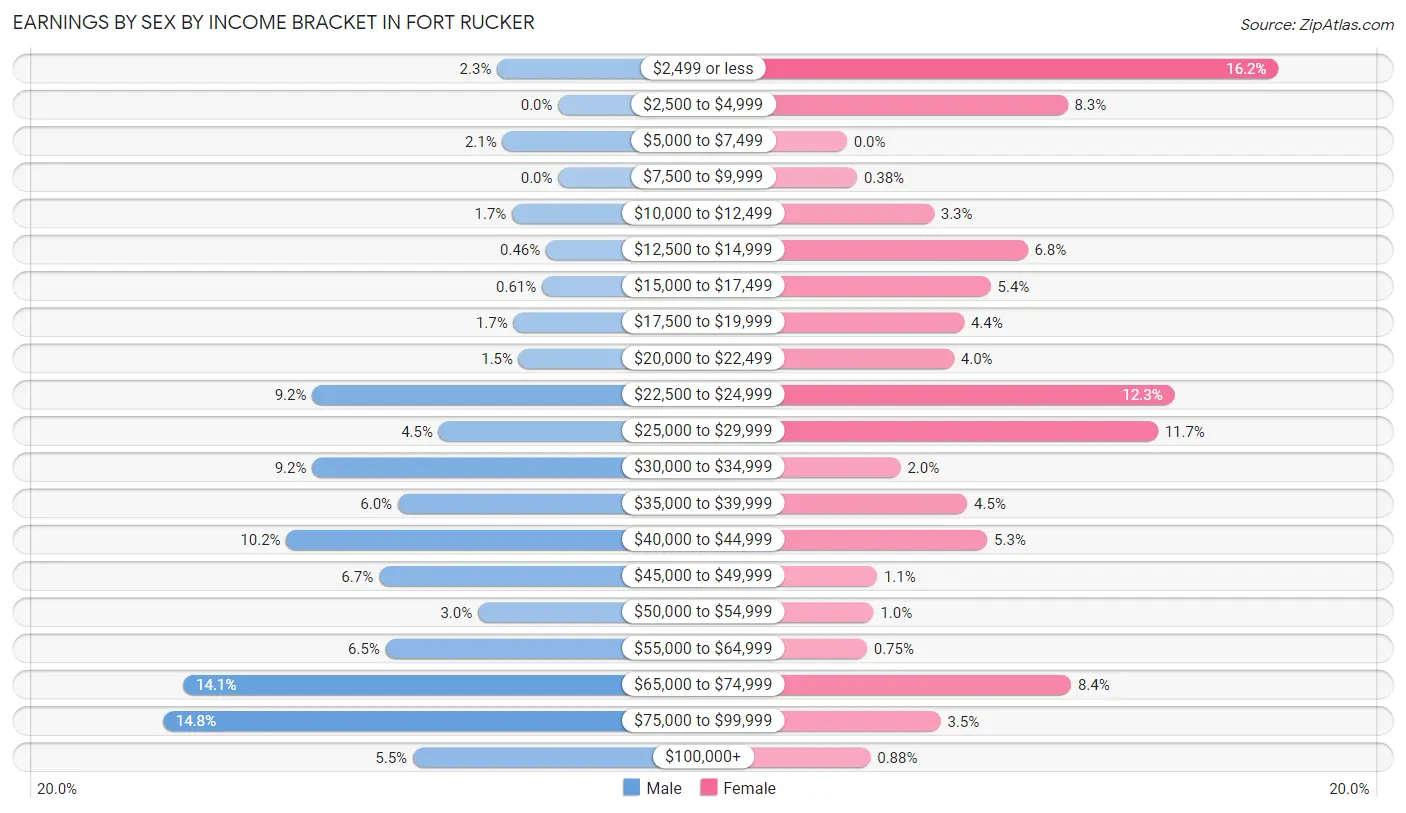
| Income | Male | Female |
| $2,499 or less | 45 (2.3%) | 129 (16.2%) |
| $2,500 to $4,999 | 0 (0.0%) | 66 (8.3%) |
| $5,000 to $7,499 | 41 (2.1%) | 0 (0.0%) |
| $7,500 to $9,999 | 0 (0.0%) | 3 (0.4%) |
| $10,000 to $12,499 | 34 (1.7%) | 26 (3.3%) |
| $12,500 to $14,999 | 9 (0.5%) | 54 (6.8%) |
| $15,000 to $17,499 | 12 (0.6%) | 43 (5.4%) |
| $17,500 to $19,999 | 33 (1.7%) | 35 (4.4%) |
| $20,000 to $22,499 | 29 (1.5%) | 32 (4.0%) |
| $22,500 to $24,999 | 181 (9.2%) | 98 (12.3%) |
| $25,000 to $29,999 | 88 (4.5%) | 93 (11.7%) |
| $30,000 to $34,999 | 181 (9.2%) | 16 (2.0%) |
| $35,000 to $39,999 | 118 (6.0%) | 36 (4.5%) |
| $40,000 to $44,999 | 200 (10.2%) | 42 (5.3%) |
| $45,000 to $49,999 | 132 (6.7%) | 9 (1.1%) |
| $50,000 to $54,999 | 59 (3.0%) | 8 (1.0%) |
| $55,000 to $64,999 | 127 (6.5%) | 6 (0.7%) |
| $65,000 to $74,999 | 276 (14.1%) | 67 (8.4%) |
| $75,000 to $99,999 | 291 (14.8%) | 28 (3.5%) |
| $100,000+ | 107 (5.4%) | 7 (0.9%) |
| Total | 1,963 (100.0%) | 798 (100.0%) |
Earnings by Sex by Educational Attainment in Fort Rucker
Average earnings in Fort Rucker are $63,750 for men and $24,042 for women, a difference of 62.3%. Men with an educational attainment of graduate degree enjoy the highest average annual earnings of $99,018, while those with high school diploma education earn the least with $34,583. Women with an educational attainment of graduate degree earn the most with the average annual earnings of $70,000, while those with college or associate's degree education have the smallest earnings of $21,908.
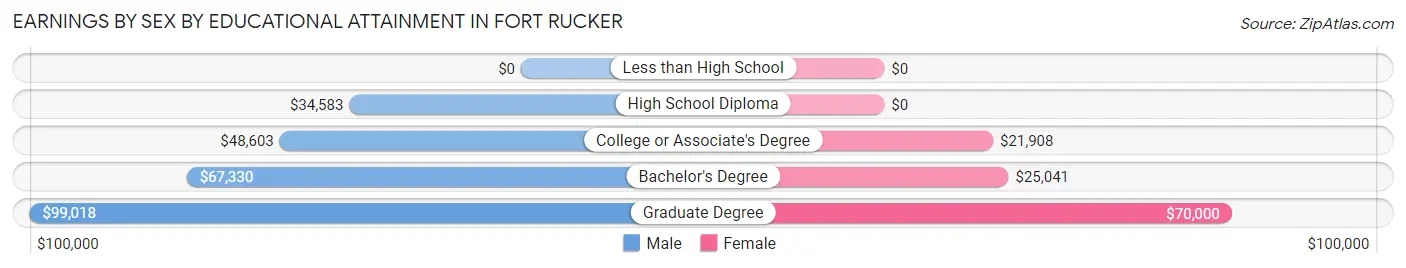
| Educational Attainment | Male Income | Female Income |
| Less than High School | - | - |
| High School Diploma | $34,583 | $0 |
| College or Associate's Degree | $48,603 | $21,908 |
| Bachelor's Degree | $67,330 | $25,041 |
| Graduate Degree | $99,018 | $70,000 |
| Total | $63,750 | $24,042 |
Family Income in Fort Rucker
Family Income Brackets in Fort Rucker
According to the Fort Rucker family income data, there are 286 families falling into the $75,000 to $99,999 income range, which is the most common income bracket and makes up 24.5% of all families.
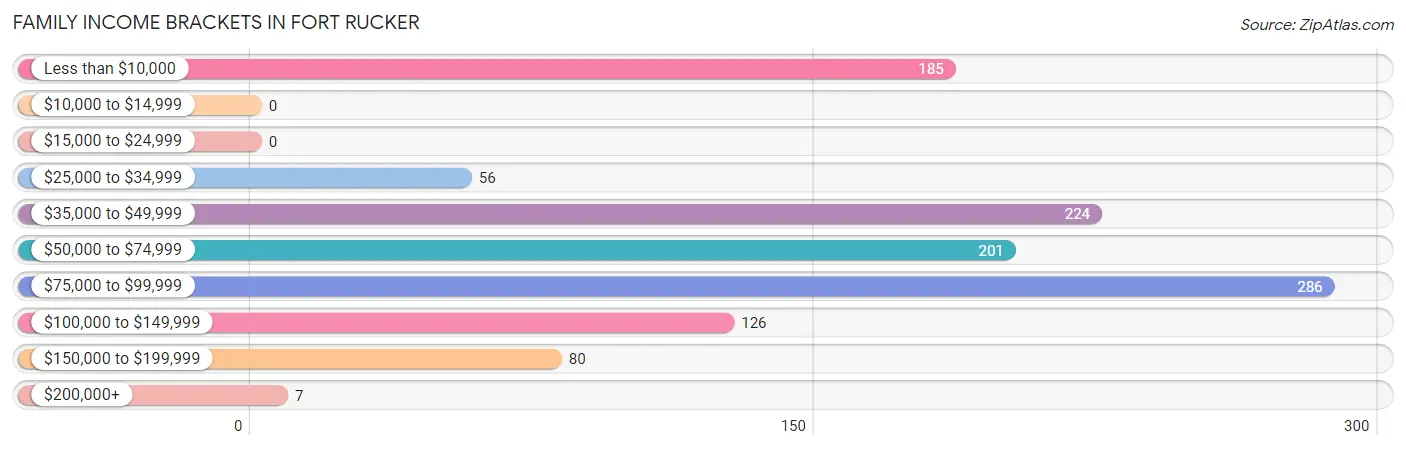
| Income Bracket | # Families | % Families |
| Less than $10,000 | 185 | 15.9% |
| $10,000 to $14,999 | 0 | 0.0% |
| $15,000 to $24,999 | 0 | 0.0% |
| $25,000 to $34,999 | 56 | 4.8% |
| $35,000 to $49,999 | 224 | 19.2% |
| $50,000 to $74,999 | 201 | 17.2% |
| $75,000 to $99,999 | 286 | 24.5% |
| $100,000 to $149,999 | 126 | 10.8% |
| $150,000 to $199,999 | 80 | 6.9% |
| $200,000+ | 7 | 0.6% |
Family Income by Famaliy Size in Fort Rucker
5-person families (220 | 18.9%) account for the highest median family income in Fort Rucker with $76,452 per family, while 2-person families (225 | 19.3%) have the highest median income of $37,938 per family member.
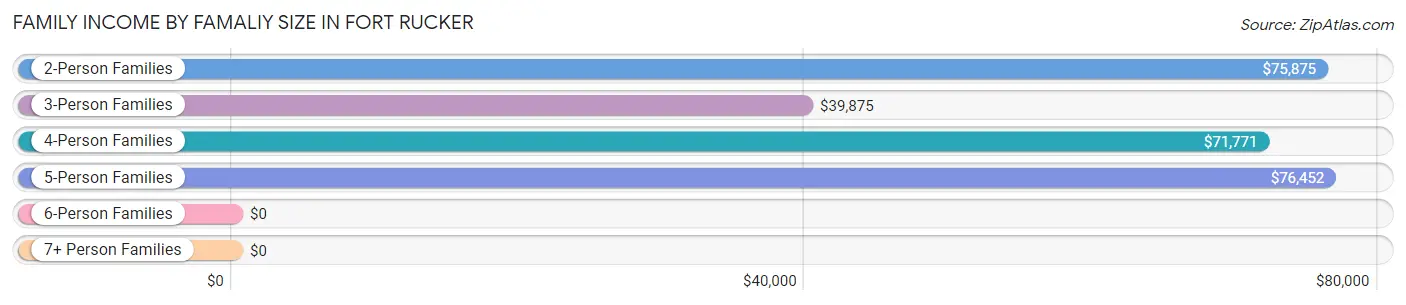
| Income Bracket | # Families | Median Income |
| 2-Person Families | 225 (19.3%) | $75,875 |
| 3-Person Families | 444 (38.1%) | $39,875 |
| 4-Person Families | 233 (20.0%) | $71,771 |
| 5-Person Families | 220 (18.9%) | $76,452 |
| 6-Person Families | 44 (3.8%) | $0 |
| 7+ Person Families | 0 (0.0%) | $0 |
| Total | 1,166 (100.0%) | $66,471 |
Family Income by Number of Earners in Fort Rucker
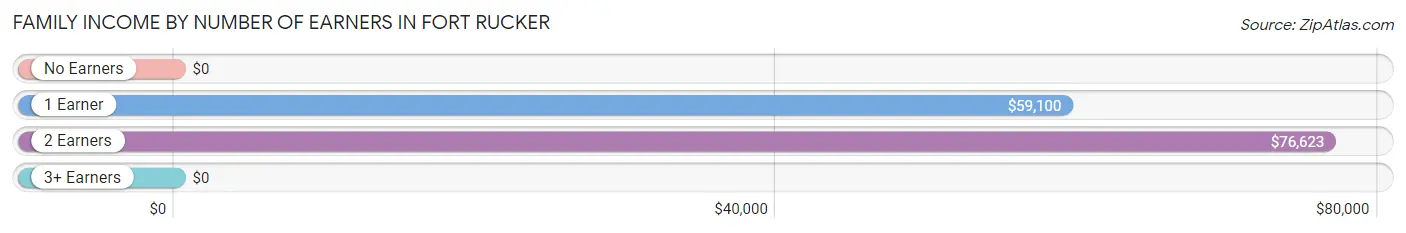
| Number of Earners | # Families | Median Income |
| No Earners | 142 (12.2%) | $0 |
| 1 Earner | 420 (36.0%) | $59,100 |
| 2 Earners | 604 (51.8%) | $76,623 |
| 3+ Earners | 0 (0.0%) | $0 |
| Total | 1,166 (100.0%) | $66,471 |
Household Income in Fort Rucker
Household Income Brackets in Fort Rucker
With 341 households falling in the category, the $75,000 to $99,999 income range is the most frequent in Fort Rucker, accounting for 23.3% of all households.
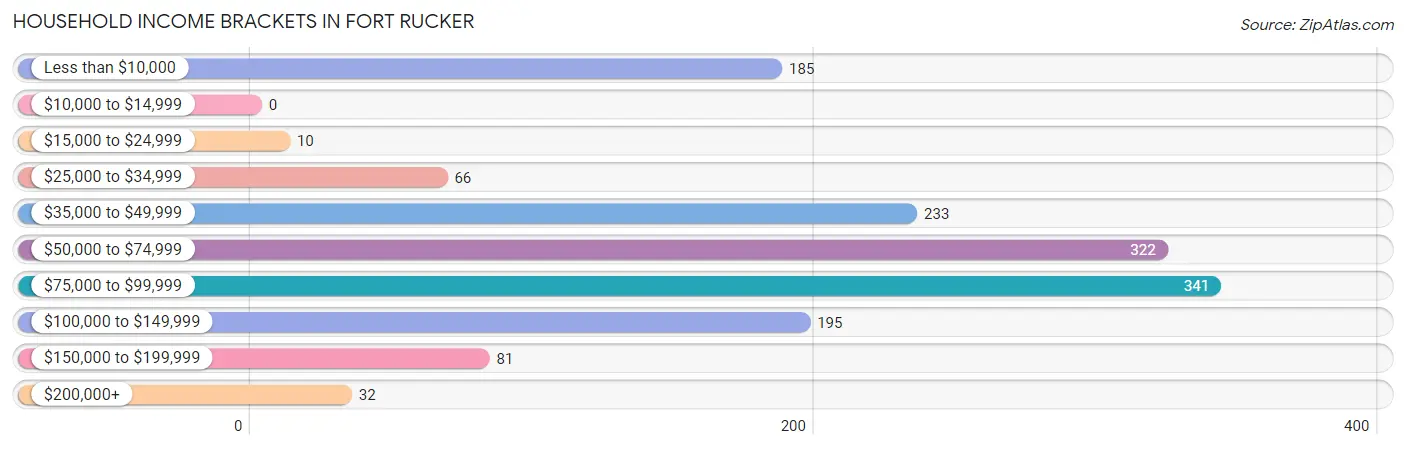
| Income Bracket | # Households | % Households |
| Less than $10,000 | 185 | 12.6% |
| $10,000 to $14,999 | 0 | 0.0% |
| $15,000 to $24,999 | 10 | 0.7% |
| $25,000 to $34,999 | 66 | 4.5% |
| $35,000 to $49,999 | 233 | 15.9% |
| $50,000 to $74,999 | 322 | 22.0% |
| $75,000 to $99,999 | 341 | 23.3% |
| $100,000 to $149,999 | 195 | 13.3% |
| $150,000 to $199,999 | 81 | 5.5% |
| $200,000+ | 32 | 2.2% |
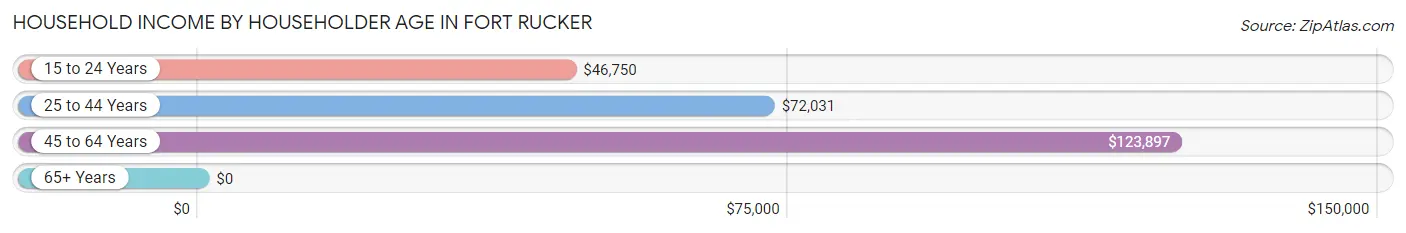
Household Income by Householder Age in Fort Rucker
The median household income in Fort Rucker is $72,681, with the highest median household income of $123,897 found in the 45 to 64 years age bracket for the primary householder. A total of 115 households (7.9%) fall into this category. Meanwhile, the 65+ years age bracket for the primary householder has the lowest median household income of $0, with 13 households (0.9%) in this group.
| Income Bracket | # Households | Median Income |
| 15 to 24 Years | 138 (9.4%) | $46,750 |
| 25 to 44 Years | 1,199 (81.8%) | $72,031 |
| 45 to 64 Years | 115 (7.9%) | $123,897 |
| 65+ Years | 13 (0.9%) | $0 |
| Total | 1,465 (100.0%) | $72,681 |
Poverty in Fort Rucker
Income Below Poverty by Sex and Age in Fort Rucker
With 13.6% poverty level for males and 15.3% for females among the residents of Fort Rucker, 6 to 11 year old males and 5 year old females are the most vulnerable to poverty, with 244 males (58.1%) and 48 females (92.3%) in their respective age groups living below the poverty level.
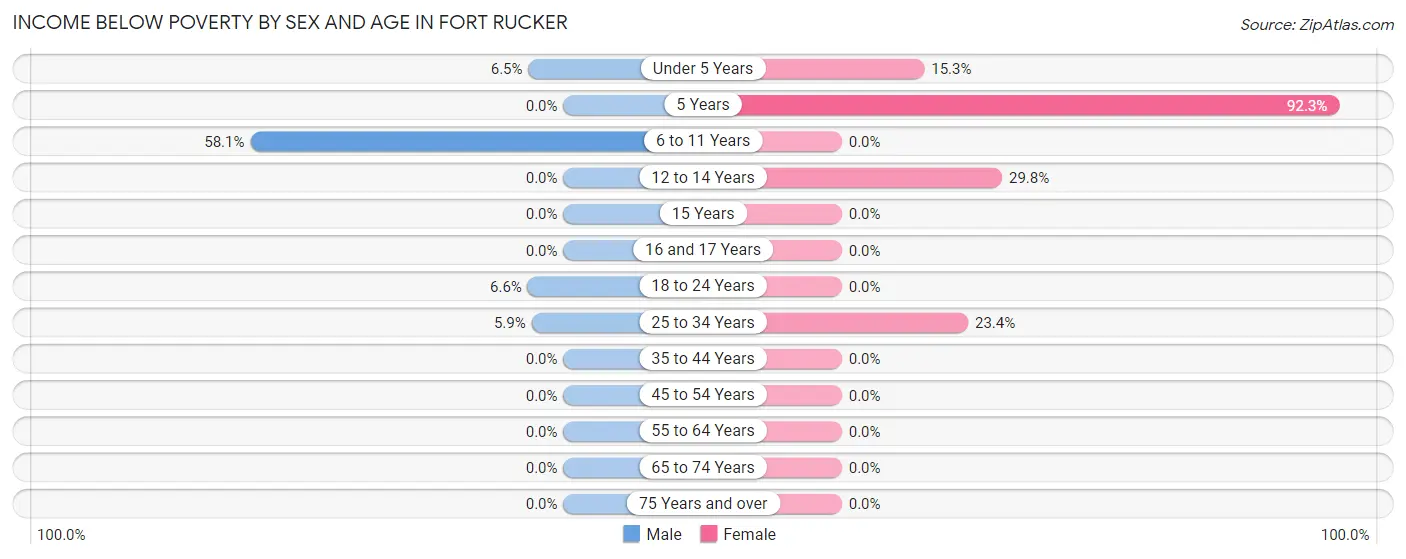
| Age Bracket | Male | Female |
| Under 5 Years | 28 (6.5%) | 77 (15.3%) |
| 5 Years | 0 (0.0%) | 48 (92.3%) |
| 6 to 11 Years | 244 (58.1%) | 0 (0.0%) |
| 12 to 14 Years | 0 (0.0%) | 47 (29.7%) |
| 15 Years | 0 (0.0%) | 0 (0.0%) |
| 16 and 17 Years | 0 (0.0%) | 0 (0.0%) |
| 18 to 24 Years | 21 (6.6%) | 0 (0.0%) |
| 25 to 34 Years | 53 (5.9%) | 192 (23.4%) |
| 35 to 44 Years | 0 (0.0%) | 0 (0.0%) |
| 45 to 54 Years | 0 (0.0%) | 0 (0.0%) |
| 55 to 64 Years | 0 (0.0%) | 0 (0.0%) |
| 65 to 74 Years | 0 (0.0%) | 0 (0.0%) |
| 75 Years and over | 0 (0.0%) | 0 (0.0%) |
| Total | 346 (13.6%) | 364 (15.3%) |
Income Above Poverty by Sex and Age in Fort Rucker
According to the poverty statistics in Fort Rucker, males aged 5 years and females aged 6 to 11 years are the age groups that are most secure financially, with 100.0% of males and 100.0% of females in these age groups living above the poverty line.
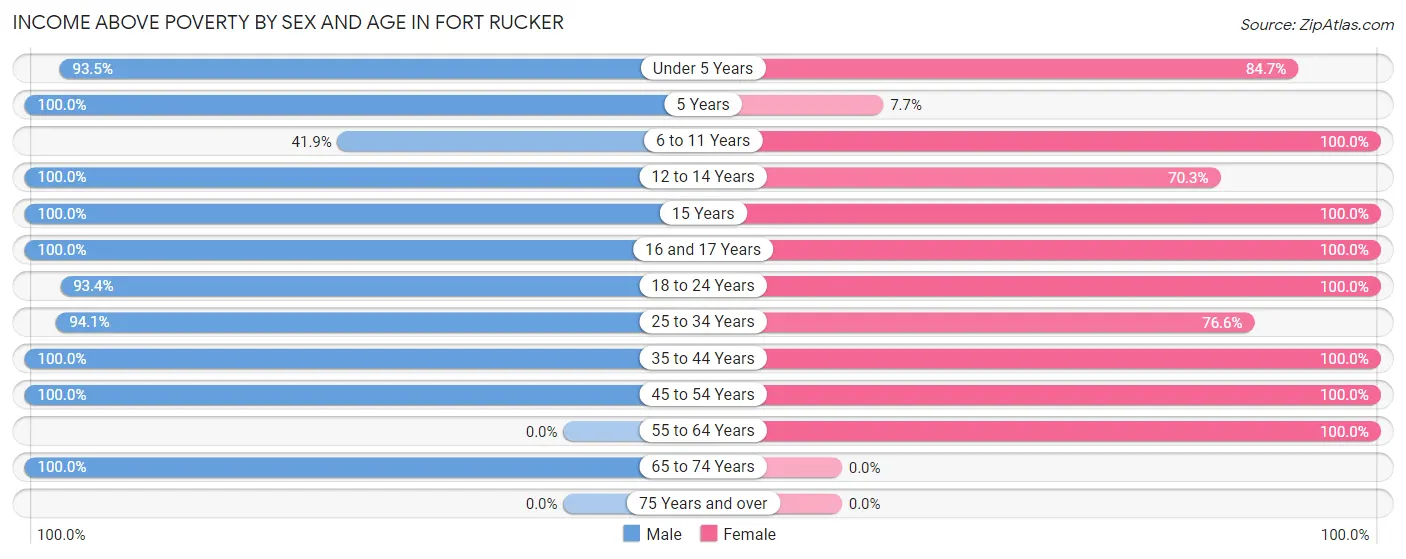
| Age Bracket | Male | Female |
| Under 5 Years | 403 (93.5%) | 426 (84.7%) |
| 5 Years | 16 (100.0%) | 4 (7.7%) |
| 6 to 11 Years | 176 (41.9%) | 270 (100.0%) |
| 12 to 14 Years | 50 (100.0%) | 111 (70.3%) |
| 15 Years | 40 (100.0%) | 30 (100.0%) |
| 16 and 17 Years | 39 (100.0%) | 16 (100.0%) |
| 18 to 24 Years | 296 (93.4%) | 188 (100.0%) |
| 25 to 34 Years | 845 (94.1%) | 627 (76.6%) |
| 35 to 44 Years | 209 (100.0%) | 276 (100.0%) |
| 45 to 54 Years | 116 (100.0%) | 54 (100.0%) |
| 55 to 64 Years | 0 (0.0%) | 12 (100.0%) |
| 65 to 74 Years | 13 (100.0%) | 0 (0.0%) |
| 75 Years and over | 0 (0.0%) | 0 (0.0%) |
| Total | 2,203 (86.4%) | 2,014 (84.7%) |
Income Below Poverty Among Married-Couple Families in Fort Rucker
The poverty statistics for married-couple families in Fort Rucker show that 5.6% or 56 of the total 1,006 families live below the poverty line. Families with 3 or 4 children have the highest poverty rate of 16.7%, comprising of 44 families. On the other hand, families with no children have the lowest poverty rate of 0.0%, which includes 0 families.
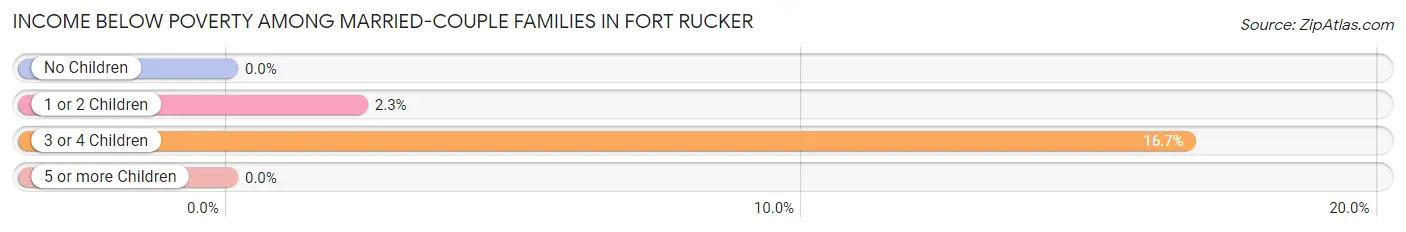
| Children | Above Poverty | Below Poverty |
| No Children | 211 (100.0%) | 0 (0.0%) |
| 1 or 2 Children | 519 (97.7%) | 12 (2.3%) |
| 3 or 4 Children | 220 (83.3%) | 44 (16.7%) |
| 5 or more Children | 0 (0.0%) | 0 (0.0%) |
| Total | 950 (94.4%) | 56 (5.6%) |
Income Below Poverty Among Single-Parent Households in Fort Rucker
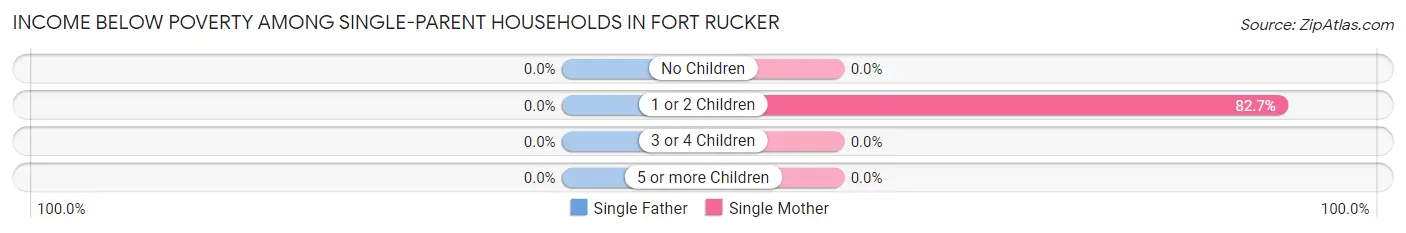
| Children | Single Father | Single Mother |
| No Children | 0 (0.0%) | 0 (0.0%) |
| 1 or 2 Children | 0 (0.0%) | 129 (82.7%) |
| 3 or 4 Children | 0 (0.0%) | 0 (0.0%) |
| 5 or more Children | 0 (0.0%) | 0 (0.0%) |
| Total | 0 (0.0%) | 129 (80.6%) |
Income Below Poverty Among Married-Couple vs Single-Parent Households in Fort Rucker
The poverty data for Fort Rucker shows that 56 of the married-couple family households (5.6%) and 129 of the single-parent households (80.6%) are living below the poverty level. Within the married-couple family households, those with 3 or 4 children have the highest poverty rate, with 44 households (16.7%) falling below the poverty line. Among the single-parent households, those with 1 or 2 children have the highest poverty rate, with 129 household (82.7%) living below poverty.
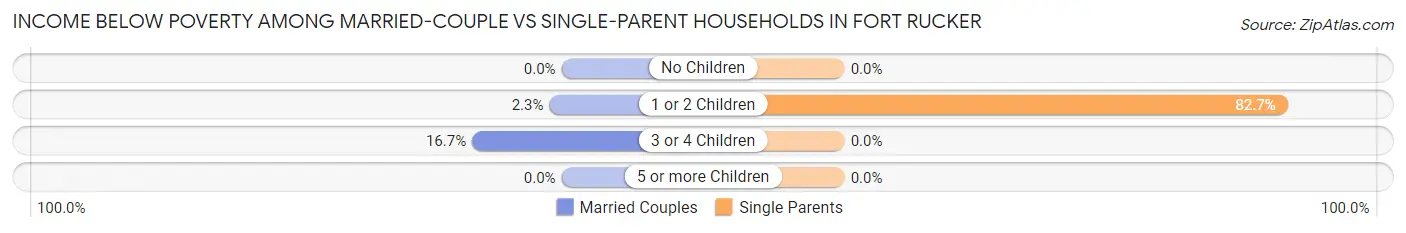
| Children | Married-Couple Families | Single-Parent Households |
| No Children | 0 (0.0%) | 0 (0.0%) |
| 1 or 2 Children | 12 (2.3%) | 129 (82.7%) |
| 3 or 4 Children | 44 (16.7%) | 0 (0.0%) |
| 5 or more Children | 0 (0.0%) | 0 (0.0%) |
| Total | 56 (5.6%) | 129 (80.6%) |
Race in Fort Rucker
The most populous races in Fort Rucker are White / Caucasian (4,108 | 75.8%), Hispanic or Latino (802 | 14.8%), and Black / African American (593 | 10.9%).
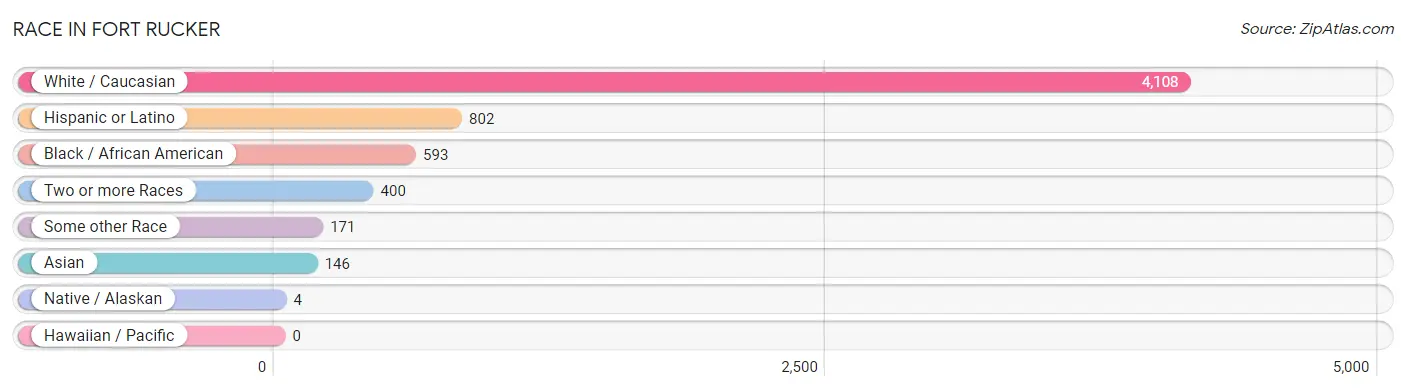
| Race | # Population | % Population |
| Asian | 146 | 2.7% |
| Black / African American | 593 | 10.9% |
| Hawaiian / Pacific | 0 | 0.0% |
| Hispanic or Latino | 802 | 14.8% |
| Native / Alaskan | 4 | 0.1% |
| White / Caucasian | 4,108 | 75.8% |
| Two or more Races | 400 | 7.4% |
| Some other Race | 171 | 3.2% |
| Total | 5,422 | 100.0% |
Ancestry in Fort Rucker
The most populous ancestries reported in Fort Rucker are German (723 | 13.3%), American (592 | 10.9%), English (582 | 10.7%), Irish (447 | 8.2%), and Puerto Rican (426 | 7.9%), together accounting for 51.1% of all Fort Rucker residents.
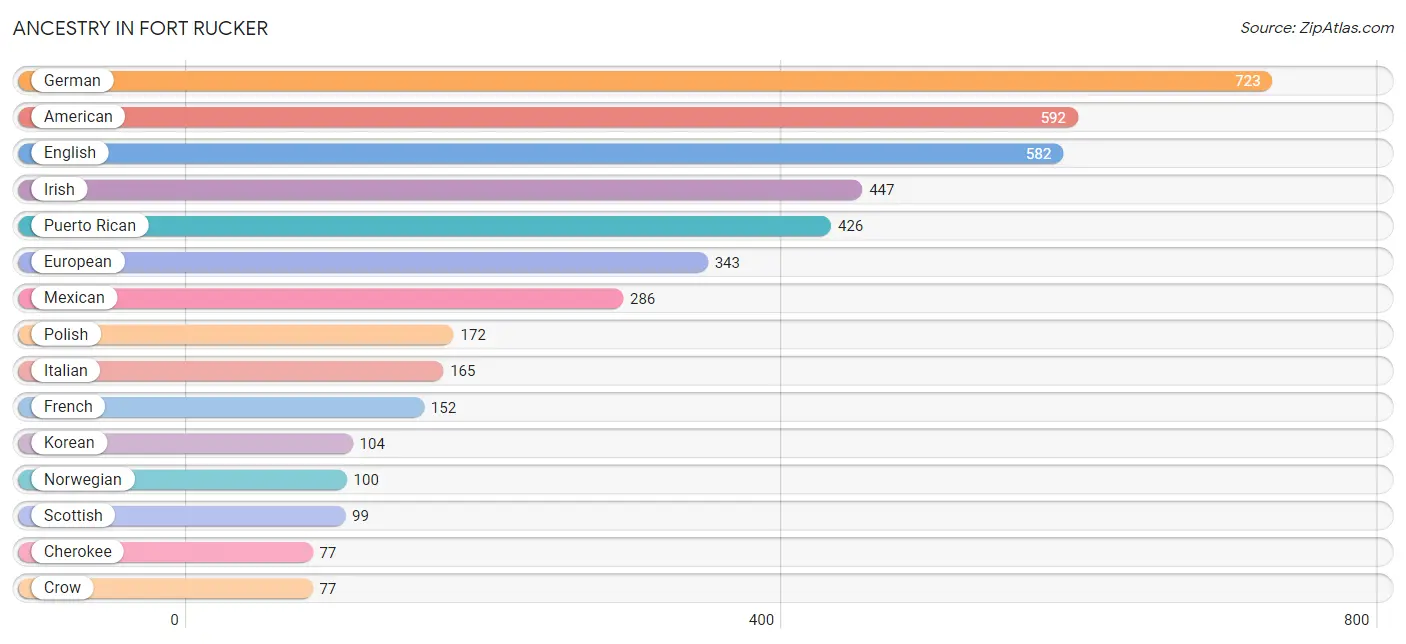
| Ancestry | # Population | % Population |
| African | 6 | 0.1% |
| American | 592 | 10.9% |
| Bhutanese | 53 | 1.0% |
| Blackfeet | 44 | 0.8% |
| Burmese | 66 | 1.2% |
| Cherokee | 77 | 1.4% |
| Colombian | 3 | 0.1% |
| Crow | 77 | 1.4% |
| Czech | 58 | 1.1% |
| Danish | 39 | 0.7% |
| Dominican | 53 | 1.0% |
| Dutch | 35 | 0.6% |
| Eastern European | 26 | 0.5% |
| English | 582 | 10.7% |
| European | 343 | 6.3% |
| French | 152 | 2.8% |
| French Canadian | 31 | 0.6% |
| German | 723 | 13.3% |
| Greek | 5 | 0.1% |
| Hungarian | 23 | 0.4% |
| Indian (Asian) | 14 | 0.3% |
| Irish | 447 | 8.2% |
| Iroquois | 43 | 0.8% |
| Italian | 165 | 3.0% |
| Korean | 104 | 1.9% |
| Malaysian | 6 | 0.1% |
| Mexican | 286 | 5.3% |
| Norwegian | 100 | 1.8% |
| Polish | 172 | 3.2% |
| Puerto Rican | 426 | 7.9% |
| Russian | 6 | 0.1% |
| Scandinavian | 37 | 0.7% |
| Scottish | 99 | 1.8% |
| Sioux | 77 | 1.4% |
| South American | 3 | 0.1% |
| Spaniard | 34 | 0.6% |
| Sri Lankan | 10 | 0.2% |
| Subsaharan African | 6 | 0.1% |
| Thai | 3 | 0.1% |
| Trinidadian and Tobagonian | 13 | 0.2% |
| Welsh | 66 | 1.2% | View All 41 Rows |
Immigrants in Fort Rucker
The most numerous immigrant groups reported in Fort Rucker came from Asia (49 | 0.9%), Europe (44 | 0.8%), Oceania (43 | 0.8%), Germany (37 | 0.7%), and Western Europe (37 | 0.7%), together accounting for 3.9% of all Fort Rucker residents.
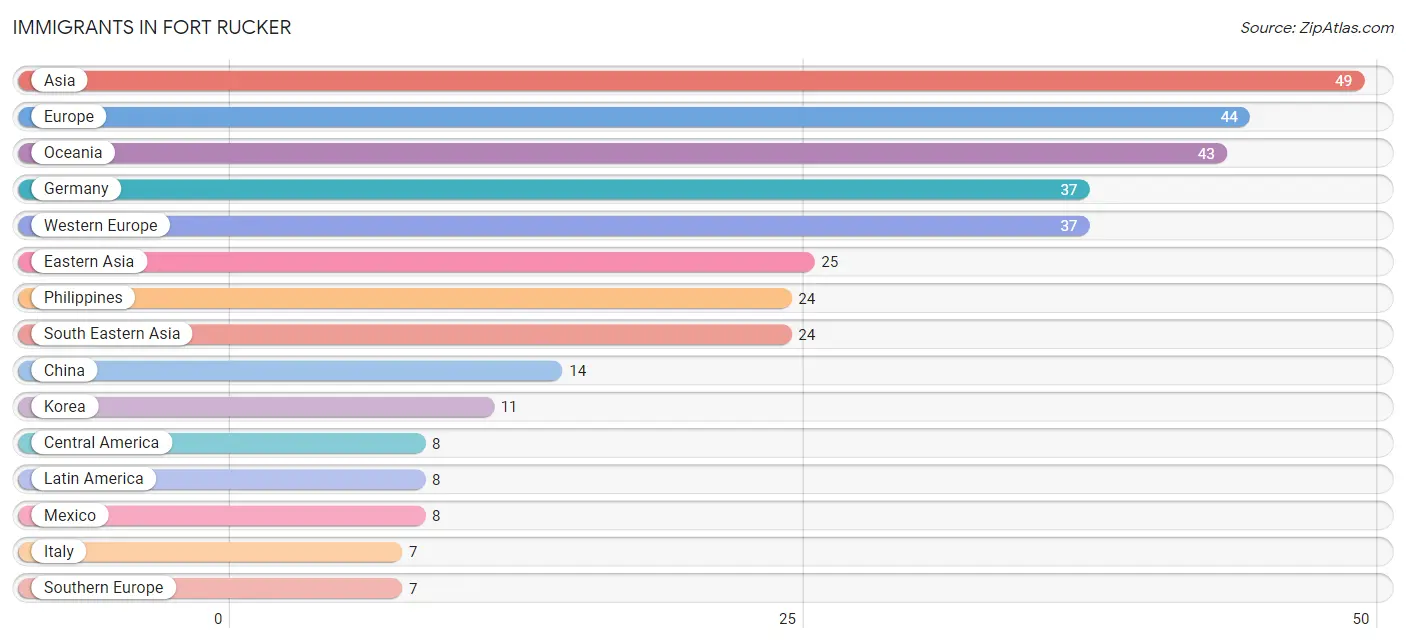
| Immigration Origin | # Population | % Population |
| Asia | 49 | 0.9% |
| Central America | 8 | 0.2% |
| China | 14 | 0.3% |
| Eastern Asia | 25 | 0.5% |
| Europe | 44 | 0.8% |
| Germany | 37 | 0.7% |
| Italy | 7 | 0.1% |
| Korea | 11 | 0.2% |
| Latin America | 8 | 0.2% |
| Mexico | 8 | 0.2% |
| Oceania | 43 | 0.8% |
| Philippines | 24 | 0.4% |
| South Eastern Asia | 24 | 0.4% |
| Southern Europe | 7 | 0.1% |
| Western Europe | 37 | 0.7% | View All 15 Rows |
Sex and Age in Fort Rucker
Sex and Age in Fort Rucker
The most populous age groups in Fort Rucker are 25 to 29 Years (582 | 19.5%) for men and Under 5 Years (503 | 20.6%) for women.
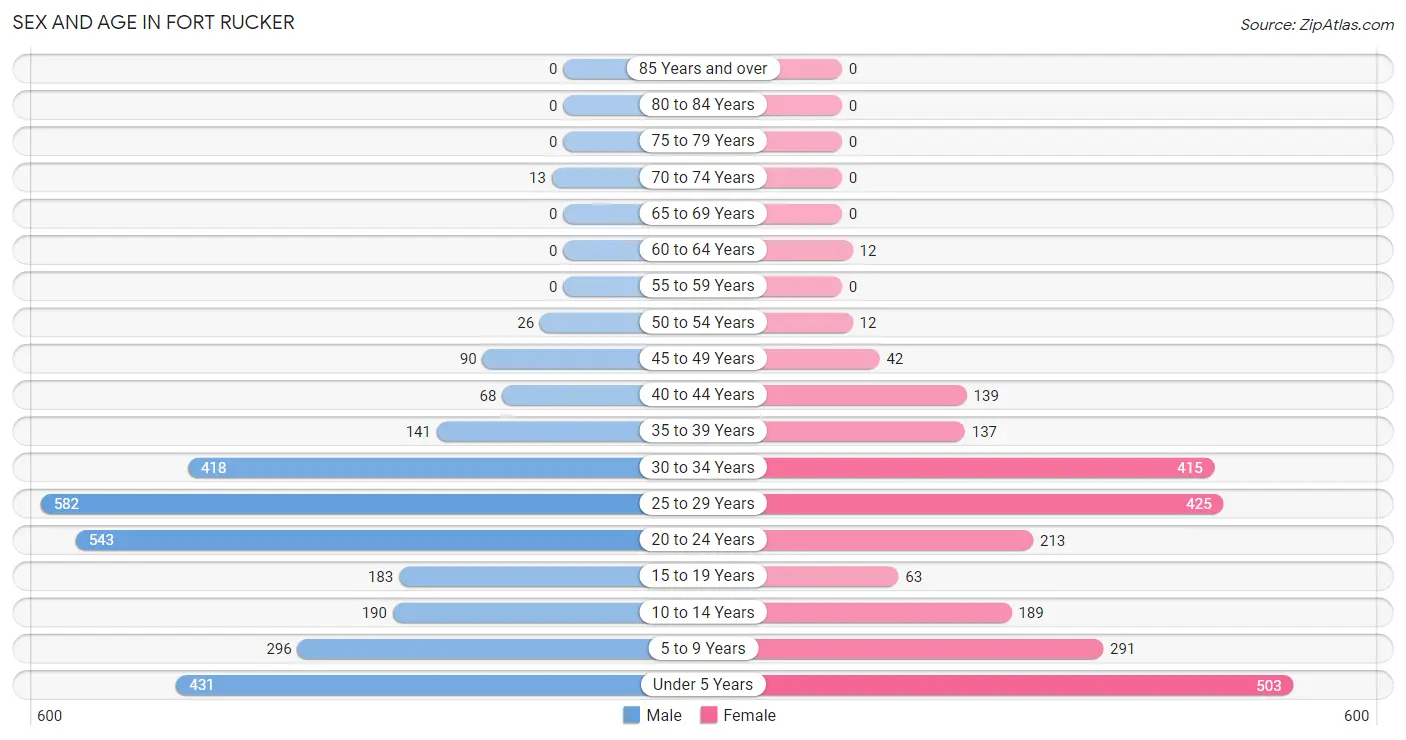
| Age Bracket | Male | Female |
| Under 5 Years | 431 (14.5%) | 503 (20.6%) |
| 5 to 9 Years | 296 (9.9%) | 291 (11.9%) |
| 10 to 14 Years | 190 (6.4%) | 189 (7.7%) |
| 15 to 19 Years | 183 (6.1%) | 63 (2.6%) |
| 20 to 24 Years | 543 (18.2%) | 213 (8.7%) |
| 25 to 29 Years | 582 (19.5%) | 425 (17.4%) |
| 30 to 34 Years | 418 (14.0%) | 415 (17.0%) |
| 35 to 39 Years | 141 (4.7%) | 137 (5.6%) |
| 40 to 44 Years | 68 (2.3%) | 139 (5.7%) |
| 45 to 49 Years | 90 (3.0%) | 42 (1.7%) |
| 50 to 54 Years | 26 (0.9%) | 12 (0.5%) |
| 55 to 59 Years | 0 (0.0%) | 0 (0.0%) |
| 60 to 64 Years | 0 (0.0%) | 12 (0.5%) |
| 65 to 69 Years | 0 (0.0%) | 0 (0.0%) |
| 70 to 74 Years | 13 (0.4%) | 0 (0.0%) |
| 75 to 79 Years | 0 (0.0%) | 0 (0.0%) |
| 80 to 84 Years | 0 (0.0%) | 0 (0.0%) |
| 85 Years and over | 0 (0.0%) | 0 (0.0%) |
| Total | 2,981 (100.0%) | 2,441 (100.0%) |
Families and Households in Fort Rucker
Median Family Size in Fort Rucker
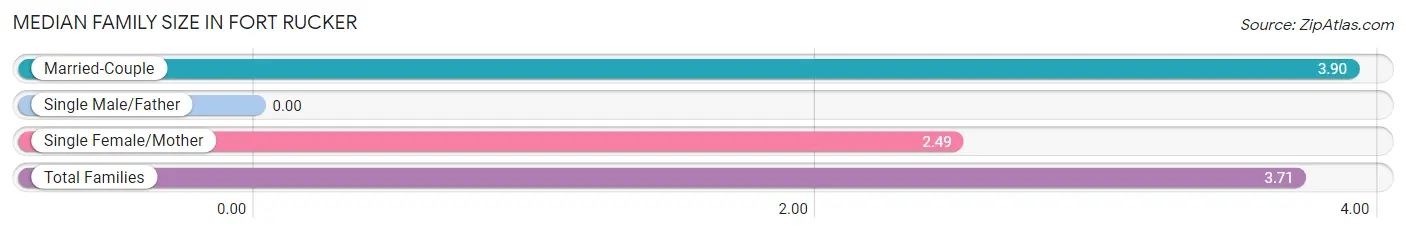
| Family Type | # Families | Family Size |
| Married-Couple | 1,006 (86.3%) | 3.90 |
| Single Male/Father | 0 (0.0%) | - |
| Single Female/Mother | 160 (13.7%) | 2.49 |
| Total Families | 1,166 (100.0%) | 3.71 |
Median Household Size in Fort Rucker
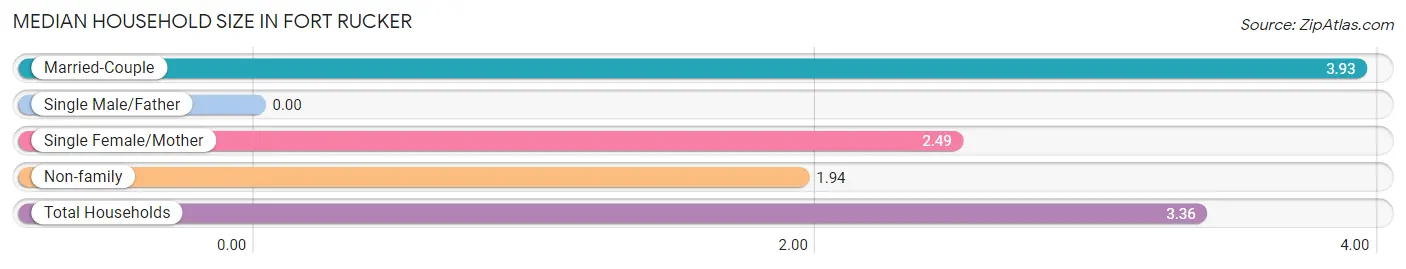
| Household Type | # Households | Household Size |
| Married-Couple | 1,006 (68.7%) | 3.93 |
| Single Male/Father | 0 (0.0%) | - |
| Single Female/Mother | 160 (10.9%) | 2.49 |
| Non-family | 299 (20.4%) | 1.94 |
| Total Households | 1,465 (100.0%) | 3.36 |
Household Size by Marriage Status in Fort Rucker
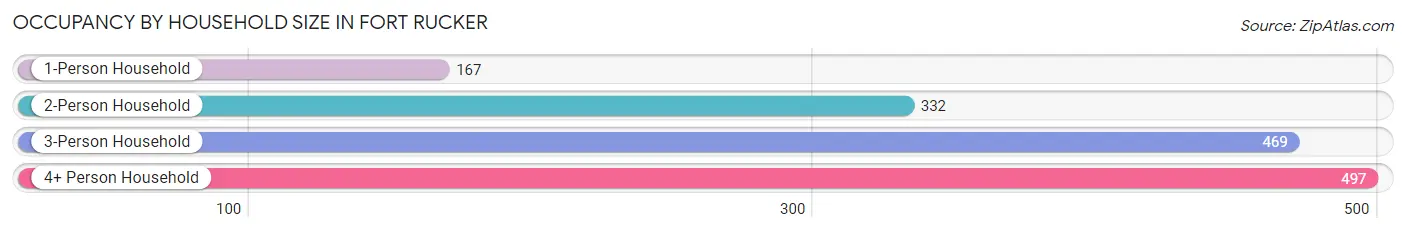
Out of a total of 1,465 households in Fort Rucker, 1,166 (79.6%) are family households, while 299 (20.4%) are nonfamily households. The most numerous type of family households are 3-person households, comprising 444, and the most common type of nonfamily households are 1-person households, comprising 167.
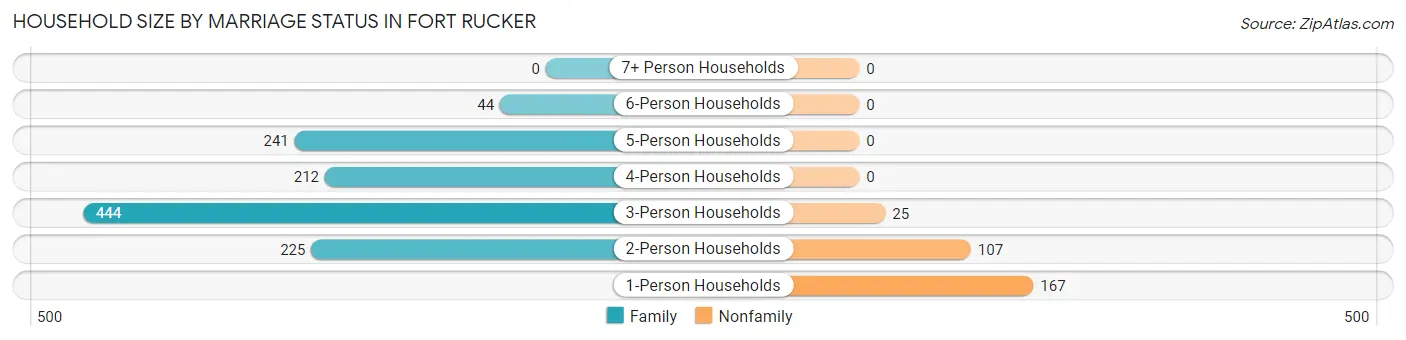
| Household Size | Family Households | Nonfamily Households |
| 1-Person Households | - | 167 (11.4%) |
| 2-Person Households | 225 (15.4%) | 107 (7.3%) |
| 3-Person Households | 444 (30.3%) | 25 (1.7%) |
| 4-Person Households | 212 (14.5%) | 0 (0.0%) |
| 5-Person Households | 241 (16.5%) | 0 (0.0%) |
| 6-Person Households | 44 (3.0%) | 0 (0.0%) |
| 7+ Person Households | 0 (0.0%) | 0 (0.0%) |
| Total | 1,166 (79.6%) | 299 (20.4%) |
Female Fertility in Fort Rucker
Fertility by Age in Fort Rucker
Average fertility rate in Fort Rucker is 100.0 births per 1,000 women. Women in the age bracket of 20 to 34 years have the highest fertility rate with 106.0 births per 1,000 women. Women in the age bracket of 20 to 34 years acount for 78.3% of all women with births.
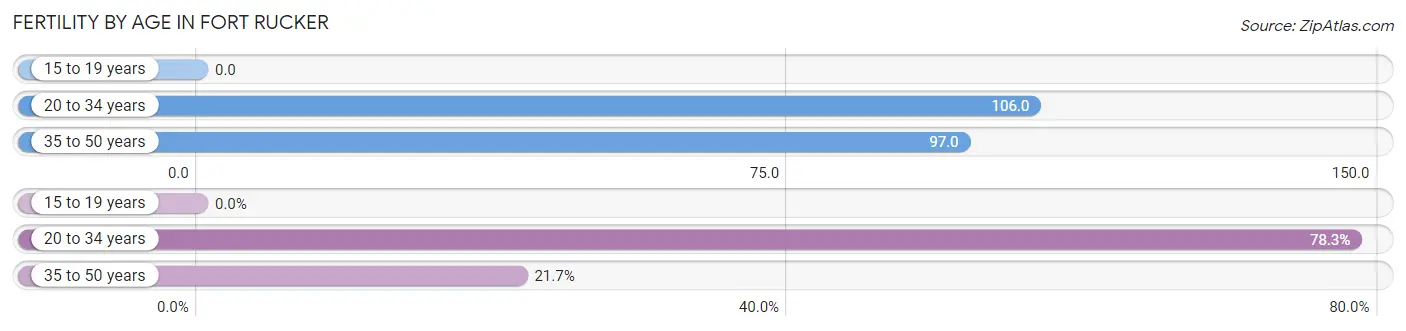
| Age Bracket | Women with Births | Births / 1,000 Women |
| 15 to 19 years | 0 (0.0%) | 0.0 |
| 20 to 34 years | 112 (78.3%) | 106.0 |
| 35 to 50 years | 31 (21.7%) | 97.0 |
| Total | 143 (100.0%) | 100.0 |
Fertility by Age by Marriage Status in Fort Rucker
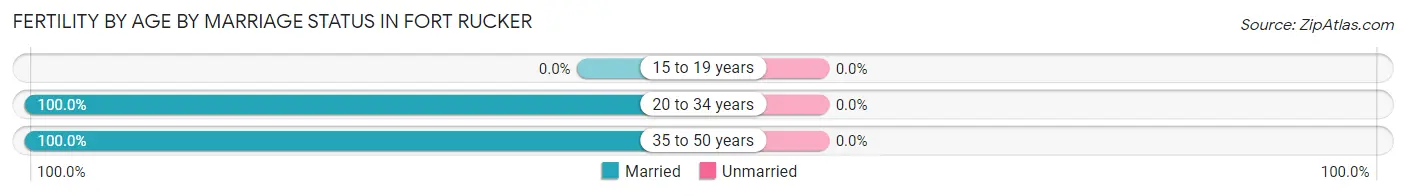
| Age Bracket | Married | Unmarried |
| 15 to 19 years | 0 (0.0%) | 0 (0.0%) |
| 20 to 34 years | 112 (100.0%) | 0 (0.0%) |
| 35 to 50 years | 31 (100.0%) | 0 (0.0%) |
| Total | 143 (100.0%) | 0 (0.0%) |
Fertility by Education in Fort Rucker
Average fertility rate in Fort Rucker is 100.0 births per 1,000 women. Women with the education attainment of less than high school have the highest fertility rate of 324.0 births per 1,000 women, while women with the education attainment of high school diploma have the lowest fertility at 60.0 births per 1,000 women. Women with the education attainment of college or associate's degree represent 43.4% of all women with births.
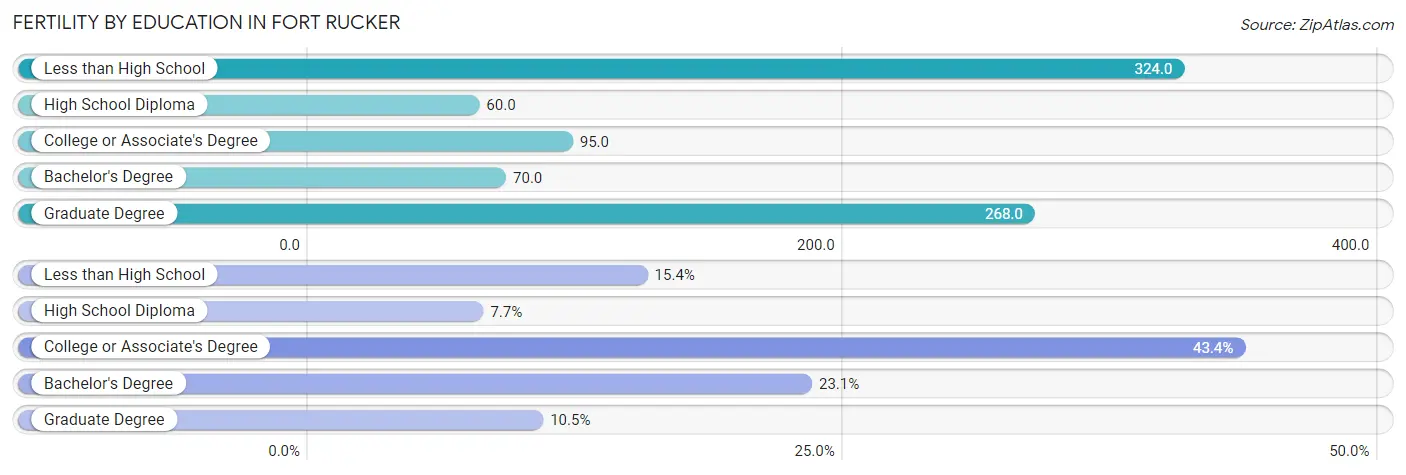
| Educational Attainment | Women with Births | Births / 1,000 Women |
| Less than High School | 22 (15.4%) | 324.0 |
| High School Diploma | 11 (7.7%) | 60.0 |
| College or Associate's Degree | 62 (43.4%) | 95.0 |
| Bachelor's Degree | 33 (23.1%) | 70.0 |
| Graduate Degree | 15 (10.5%) | 268.0 |
| Total | 143 (100.0%) | 100.0 |
Fertility by Education by Marriage Status in Fort Rucker
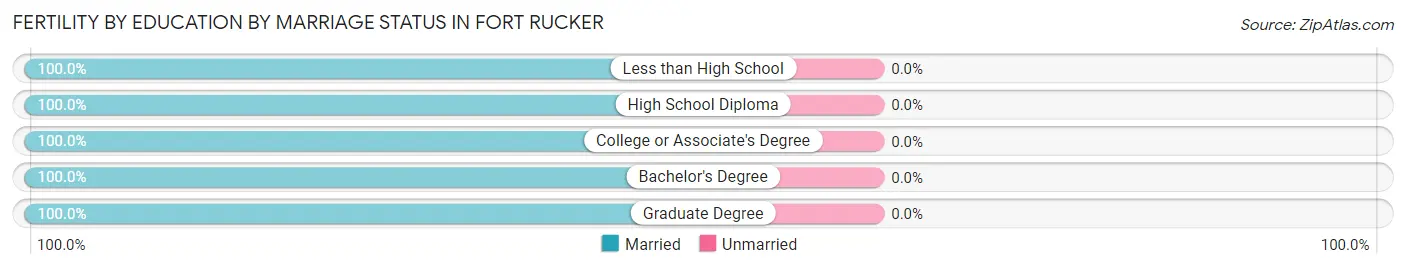
| Educational Attainment | Married | Unmarried |
| Less than High School | 22 (100.0%) | 0 (0.0%) |
| High School Diploma | 11 (100.0%) | 0 (0.0%) |
| College or Associate's Degree | 62 (100.0%) | 0 (0.0%) |
| Bachelor's Degree | 33 (100.0%) | 0 (0.0%) |
| Graduate Degree | 15 (100.0%) | 0 (0.0%) |
| Total | 143 (100.0%) | 0 (0.0%) |
Employment Characteristics in Fort Rucker
Employment by Class of Employer in Fort Rucker
Among the 2,412 employed individuals in Fort Rucker, federal government employees (2,049 | 85.0%), private company employees (292 | 12.1%), and self-employed (not incorporated) (33 | 1.4%) make up the most common classes of employment.
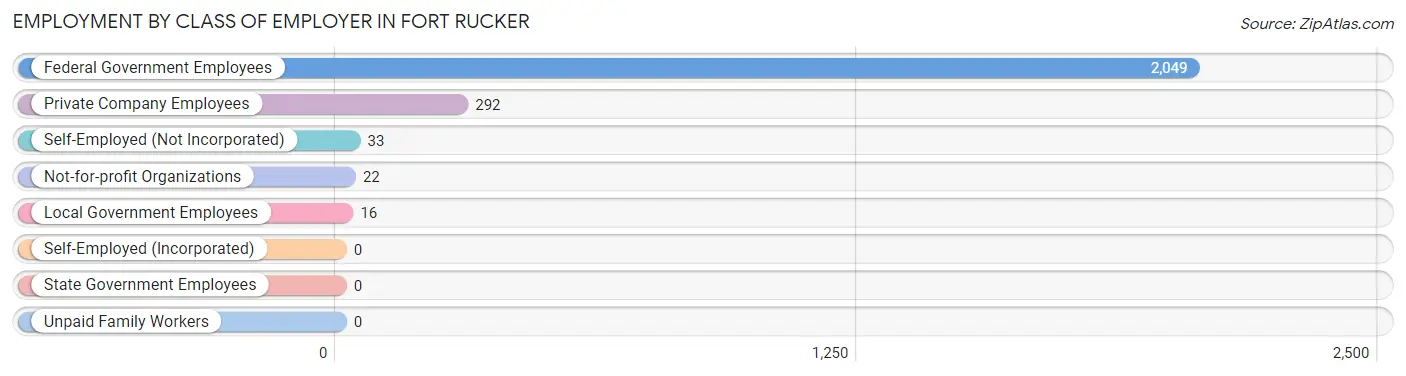
| Employer Class | # Employees | % Employees |
| Private Company Employees | 292 | 12.1% |
| Self-Employed (Incorporated) | 0 | 0.0% |
| Self-Employed (Not Incorporated) | 33 | 1.4% |
| Not-for-profit Organizations | 22 | 0.9% |
| Local Government Employees | 16 | 0.7% |
| State Government Employees | 0 | 0.0% |
| Federal Government Employees | 2,049 | 85.0% |
| Unpaid Family Workers | 0 | 0.0% |
| Total | 2,412 | 100.0% |
Employment Status by Age in Fort Rucker
According to the labor force statistics for Fort Rucker, out of the total population over 16 years of age (3,452), 74.1% or 2,558 individuals are in the labor force, with 16.1% or 412 of them unemployed. The age group with the highest labor force participation rate is 25 to 29 years, with 78.3% or 788 individuals in the labor force. Within the labor force, the 16 to 19 years age range has the highest percentage of unemployed individuals, with 77.8% or 103 of them being unemployed.
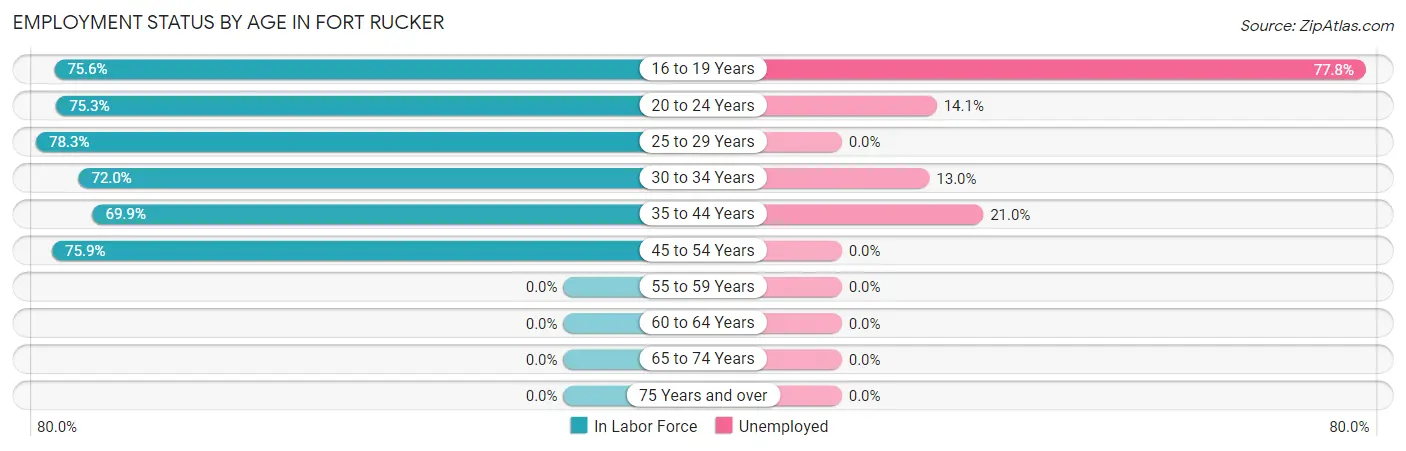
| Age Bracket | In Labor Force | Unemployed |
| 16 to 19 Years | 133 (75.6%) | 103 (77.8%) |
| 20 to 24 Years | 569 (75.3%) | 80 (14.1%) |
| 25 to 29 Years | 788 (78.3%) | 0 (0.0%) |
| 30 to 34 Years | 600 (72.0%) | 78 (13.0%) |
| 35 to 44 Years | 339 (69.9%) | 71 (21.0%) |
| 45 to 54 Years | 129 (75.9%) | 0 (0.0%) |
| 55 to 59 Years | 0 (0.0%) | 0 (0.0%) |
| 60 to 64 Years | 0 (0.0%) | 0 (0.0%) |
| 65 to 74 Years | 0 (0.0%) | 0 (0.0%) |
| 75 Years and over | 0 (0.0%) | 0 (0.0%) |
| Total | 2,558 (74.1%) | 412 (16.1%) |
Employment Status by Educational Attainment in Fort Rucker
According to labor force statistics for Fort Rucker, 74.0% of individuals (1,855) out of the total population between 25 and 64 years of age (2,507) are in the labor force, with 10.3% or 191 of them being unemployed. The group with the highest labor force participation rate are those with the educational attainment of less than high school, with 100.0% or 22 individuals in the labor force. Within the labor force, individuals with high school diploma education have the highest percentage of unemployment, with 18.9% or 36 of them being unemployed.
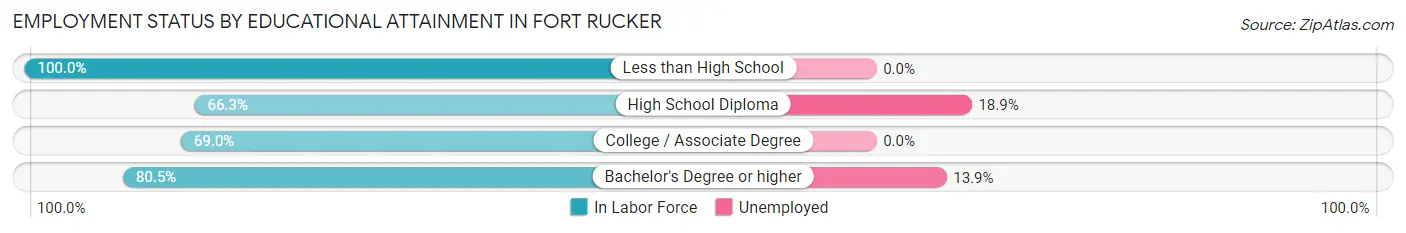
| Educational Attainment | In Labor Force | Unemployed |
| Less than High School | 22 (100.0%) | 0 (0.0%) |
| High School Diploma | 193 (66.3%) | 55 (18.9%) |
| College / Associate Degree | 753 (69.0%) | 0 (0.0%) |
| Bachelor's Degree or higher | 887 (80.5%) | 153 (13.9%) |
| Total | 1,855 (74.0%) | 258 (10.3%) |
Employment Occupations by Sex in Fort Rucker
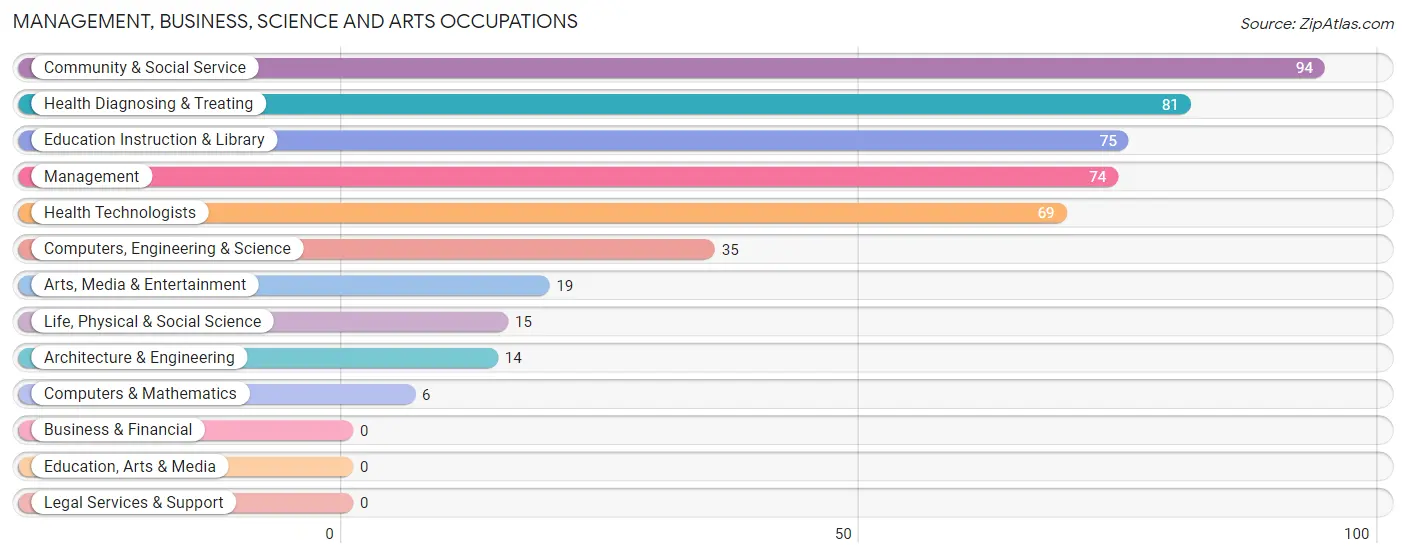
Management, Business, Science and Arts Occupations
The most common Management, Business, Science and Arts occupations in Fort Rucker are Community & Social Service (94 | 16.2%), Health Diagnosing & Treating (81 | 14.0%), Education Instruction & Library (75 | 13.0%), Management (74 | 12.8%), and Health Technologists (69 | 11.9%).
Management, Business, Science and Arts Occupations by Sex
Within the Management, Business, Science and Arts occupations in Fort Rucker, the most male-oriented occupations are Computers & Mathematics (100.0%), Architecture & Engineering (100.0%), and Computers, Engineering & Science (57.1%), while the most female-oriented occupations are Life, Physical & Social Science (100.0%), Community & Social Service (100.0%), and Education Instruction & Library (100.0%).
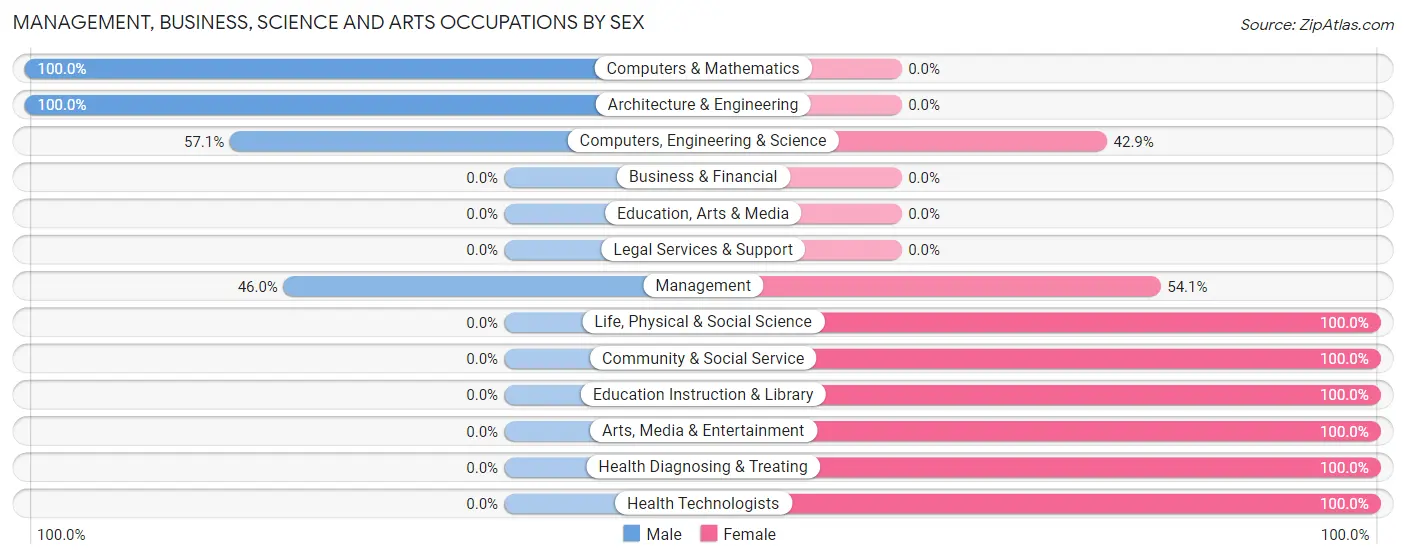
| Occupation | Male | Female |
| Management | 34 (46.0%) | 40 (54.0%) |
| Business & Financial | 0 (0.0%) | 0 (0.0%) |
| Computers, Engineering & Science | 20 (57.1%) | 15 (42.9%) |
| Computers & Mathematics | 6 (100.0%) | 0 (0.0%) |
| Architecture & Engineering | 14 (100.0%) | 0 (0.0%) |
| Life, Physical & Social Science | 0 (0.0%) | 15 (100.0%) |
| Community & Social Service | 0 (0.0%) | 94 (100.0%) |
| Education, Arts & Media | 0 (0.0%) | 0 (0.0%) |
| Legal Services & Support | 0 (0.0%) | 0 (0.0%) |
| Education Instruction & Library | 0 (0.0%) | 75 (100.0%) |
| Arts, Media & Entertainment | 0 (0.0%) | 19 (100.0%) |
| Health Diagnosing & Treating | 0 (0.0%) | 81 (100.0%) |
| Health Technologists | 0 (0.0%) | 69 (100.0%) |
| Total (Category) | 54 (19.0%) | 230 (81.0%) |
| Total (Overall) | 154 (26.6%) | 425 (73.4%) |
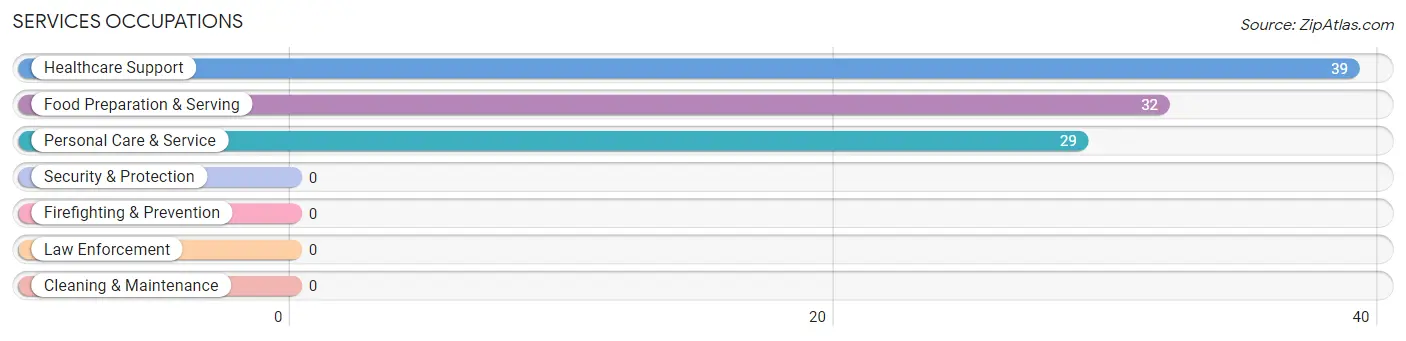
Services Occupations
The most common Services occupations in Fort Rucker are Healthcare Support (39 | 6.7%), Food Preparation & Serving (32 | 5.5%), and Personal Care & Service (29 | 5.0%).
Services Occupations by Sex
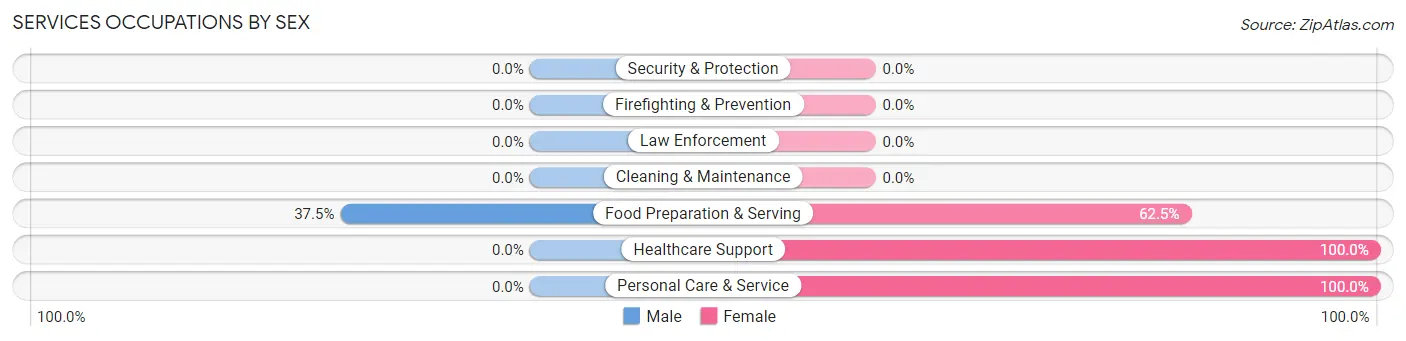
| Occupation | Male | Female |
| Healthcare Support | 0 (0.0%) | 39 (100.0%) |
| Security & Protection | 0 (0.0%) | 0 (0.0%) |
| Firefighting & Prevention | 0 (0.0%) | 0 (0.0%) |
| Law Enforcement | 0 (0.0%) | 0 (0.0%) |
| Food Preparation & Serving | 12 (37.5%) | 20 (62.5%) |
| Cleaning & Maintenance | 0 (0.0%) | 0 (0.0%) |
| Personal Care & Service | 0 (0.0%) | 29 (100.0%) |
| Total (Category) | 12 (12.0%) | 88 (88.0%) |
| Total (Overall) | 154 (26.6%) | 425 (73.4%) |
Sales and Office Occupations
The most common Sales and Office occupations in Fort Rucker are Office & Administration (69 | 11.9%), and Sales & Related (36 | 6.2%).
Sales and Office Occupations by Sex
| Occupation | Male | Female |
| Sales & Related | 0 (0.0%) | 36 (100.0%) |
| Office & Administration | 18 (26.1%) | 51 (73.9%) |
| Total (Category) | 18 (17.1%) | 87 (82.9%) |
| Total (Overall) | 154 (26.6%) | 425 (73.4%) |
Natural Resources, Construction and Maintenance Occupations
The most common Natural Resources, Construction and Maintenance occupations in Fort Rucker are Construction & Extraction (26 | 4.5%), and Installation, Maintenance & Repair (12 | 2.1%).
Natural Resources, Construction and Maintenance Occupations by Sex
| Occupation | Male | Female |
| Farming, Fishing & Forestry | 0 (0.0%) | 0 (0.0%) |
| Construction & Extraction | 26 (100.0%) | 0 (0.0%) |
| Installation, Maintenance & Repair | 0 (0.0%) | 12 (100.0%) |
| Total (Category) | 26 (68.4%) | 12 (31.6%) |
| Total (Overall) | 154 (26.6%) | 425 (73.4%) |
Production, Transportation and Moving Occupations
The most common Production, Transportation and Moving occupations in Fort Rucker are Transportation (40 | 6.9%), and Production (12 | 2.1%).
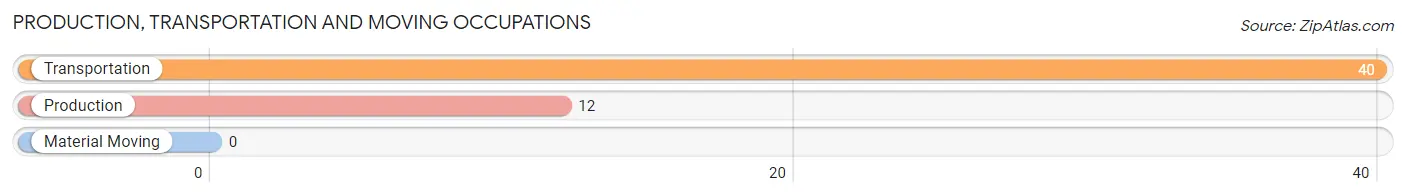
Production, Transportation and Moving Occupations by Sex
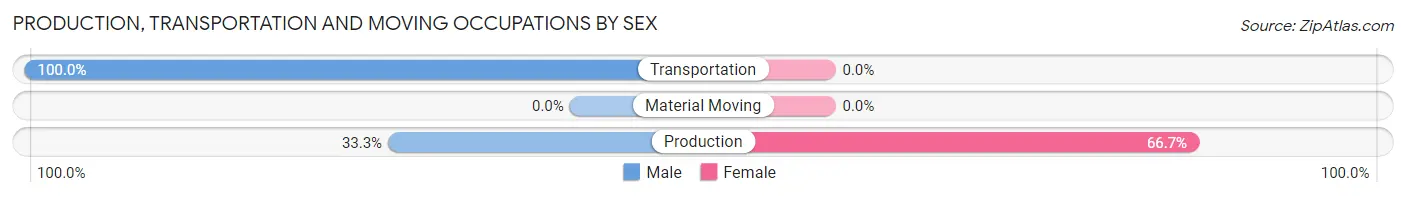
| Occupation | Male | Female |
| Production | 4 (33.3%) | 8 (66.7%) |
| Transportation | 40 (100.0%) | 0 (0.0%) |
| Material Moving | 0 (0.0%) | 0 (0.0%) |
| Total (Category) | 44 (84.6%) | 8 (15.4%) |
| Total (Overall) | 154 (26.6%) | 425 (73.4%) |
Employment Industries by Sex in Fort Rucker
Employment Industries in Fort Rucker
The major employment industries in Fort Rucker include Health Care & Social Assistance (105 | 18.1%), Public Administration (79 | 13.6%), Retail Trade (75 | 13.0%), Educational Services (75 | 13.0%), and Accommodation & Food Services (66 | 11.4%).
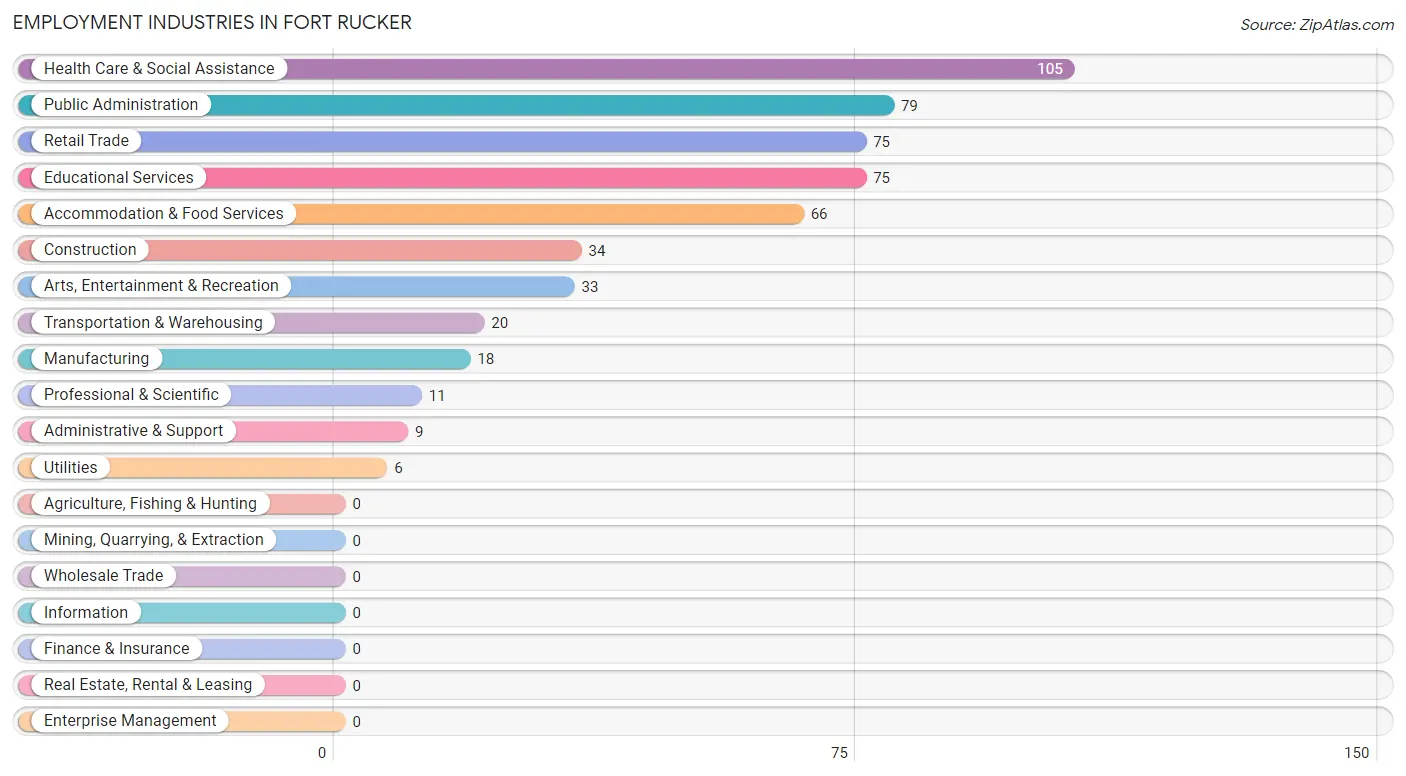
Employment Industries by Sex in Fort Rucker
The Fort Rucker industries that see more men than women are Manufacturing (100.0%), Utilities (100.0%), and Construction (76.5%), whereas the industries that tend to have a higher number of women are Professional & Scientific (100.0%), Administrative & Support (100.0%), and Educational Services (100.0%).
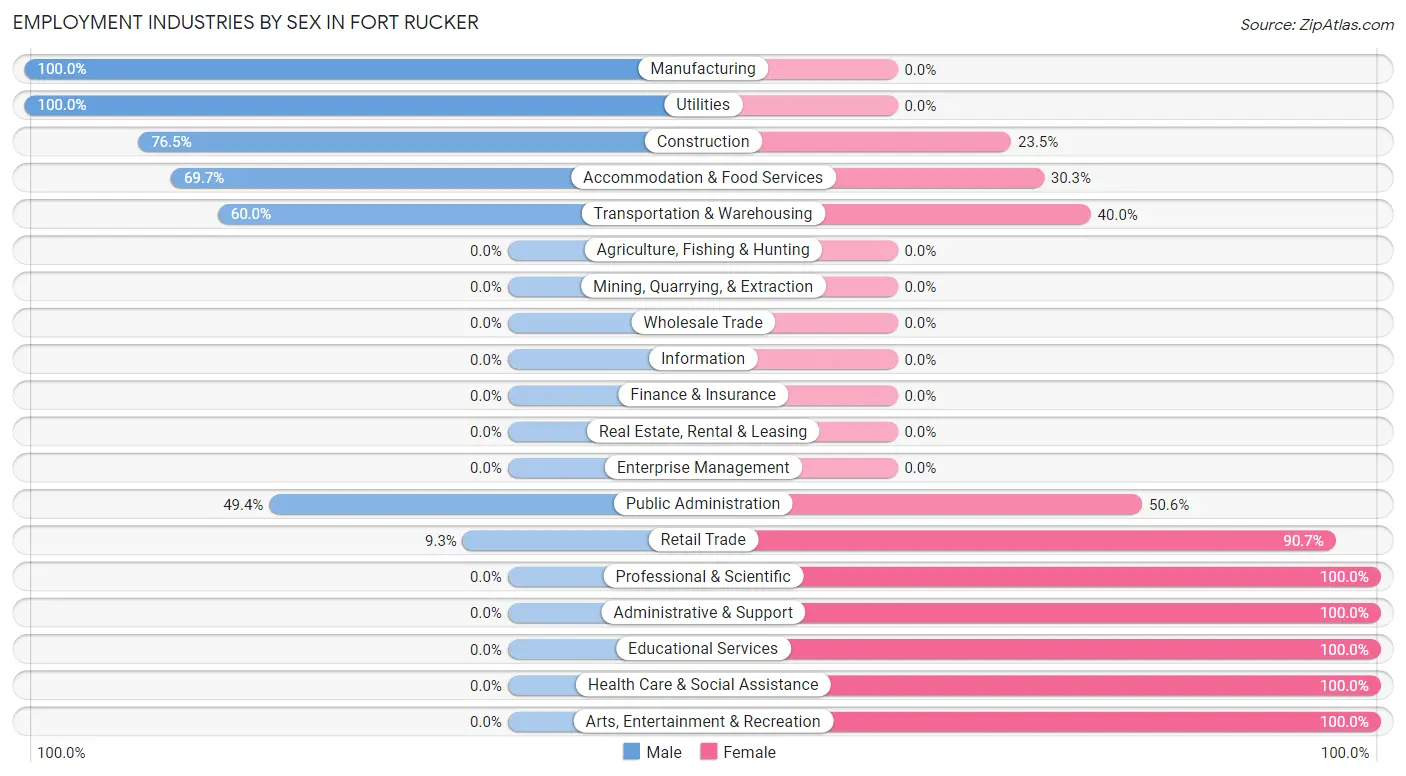
| Industry | Male | Female |
| Agriculture, Fishing & Hunting | 0 (0.0%) | 0 (0.0%) |
| Mining, Quarrying, & Extraction | 0 (0.0%) | 0 (0.0%) |
| Construction | 26 (76.5%) | 8 (23.5%) |
| Manufacturing | 18 (100.0%) | 0 (0.0%) |
| Wholesale Trade | 0 (0.0%) | 0 (0.0%) |
| Retail Trade | 7 (9.3%) | 68 (90.7%) |
| Transportation & Warehousing | 12 (60.0%) | 8 (40.0%) |
| Utilities | 6 (100.0%) | 0 (0.0%) |
| Information | 0 (0.0%) | 0 (0.0%) |
| Finance & Insurance | 0 (0.0%) | 0 (0.0%) |
| Real Estate, Rental & Leasing | 0 (0.0%) | 0 (0.0%) |
| Professional & Scientific | 0 (0.0%) | 11 (100.0%) |
| Enterprise Management | 0 (0.0%) | 0 (0.0%) |
| Administrative & Support | 0 (0.0%) | 9 (100.0%) |
| Educational Services | 0 (0.0%) | 75 (100.0%) |
| Health Care & Social Assistance | 0 (0.0%) | 105 (100.0%) |
| Arts, Entertainment & Recreation | 0 (0.0%) | 33 (100.0%) |
| Accommodation & Food Services | 46 (69.7%) | 20 (30.3%) |
| Public Administration | 39 (49.4%) | 40 (50.6%) |
| Total | 154 (26.6%) | 425 (73.4%) |
Education in Fort Rucker
School Enrollment in Fort Rucker
The most common levels of schooling among the 1,695 students in Fort Rucker are elementary school (439 | 25.9%), college / undergraduate (317 | 18.7%), and middle school (246 | 14.5%).
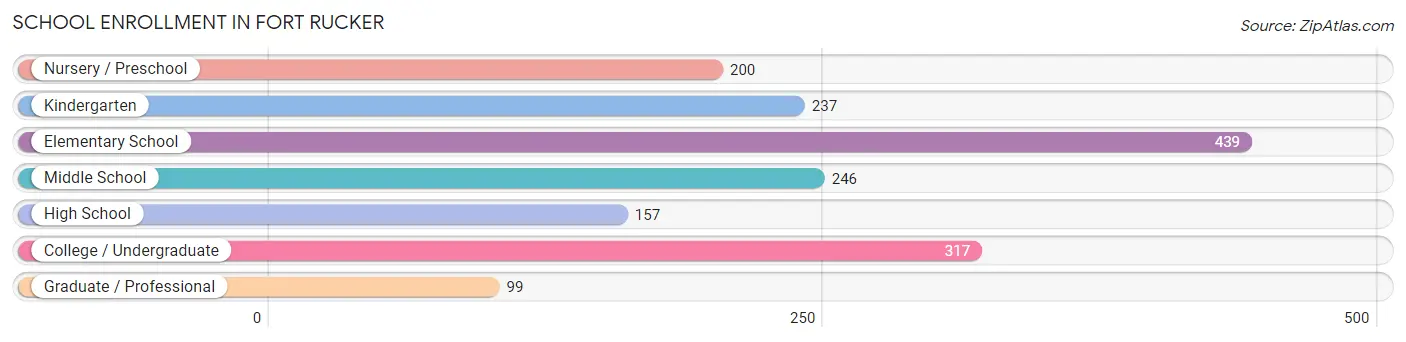
| School Level | # Students | % Students |
| Nursery / Preschool | 200 | 11.8% |
| Kindergarten | 237 | 14.0% |
| Elementary School | 439 | 25.9% |
| Middle School | 246 | 14.5% |
| High School | 157 | 9.3% |
| College / Undergraduate | 317 | 18.7% |
| Graduate / Professional | 99 | 5.8% |
| Total | 1,695 | 100.0% |
School Enrollment by Age by Funding Source in Fort Rucker
Out of a total of 1,695 students who are enrolled in schools in Fort Rucker, 97 (5.7%) attend a private institution, while the remaining 1,598 (94.3%) are enrolled in public schools. The age group of 25 to 34 year olds has the highest likelihood of being enrolled in private schools, with 39 (17.5% in the age bracket) enrolled. Conversely, the age group of 5 to 9 year old has the lowest likelihood of being enrolled in a private school, with 587 (100.0% in the age bracket) attending a public institution.
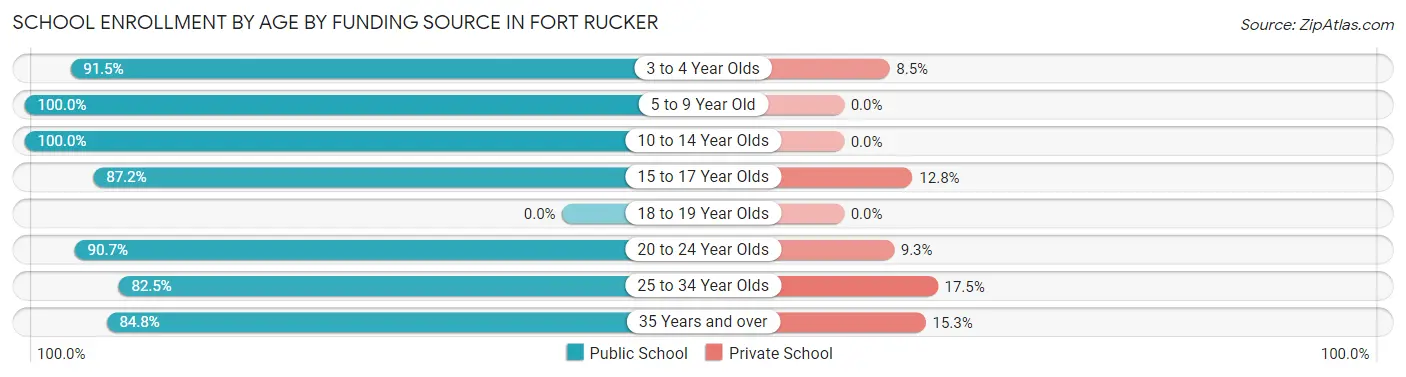
| Age Bracket | Public School | Private School |
| 3 to 4 Year Olds | 172 (91.5%) | 16 (8.5%) |
| 5 to 9 Year Old | 587 (100.0%) | 0 (0.0%) |
| 10 to 14 Year Olds | 379 (100.0%) | 0 (0.0%) |
| 15 to 17 Year Olds | 109 (87.2%) | 16 (12.8%) |
| 18 to 19 Year Olds | 0 (0.0%) | 0 (0.0%) |
| 20 to 24 Year Olds | 68 (90.7%) | 7 (9.3%) |
| 25 to 34 Year Olds | 184 (82.5%) | 39 (17.5%) |
| 35 Years and over | 100 (84.8%) | 18 (15.2%) |
| Total | 1,598 (94.3%) | 97 (5.7%) |
Educational Attainment by Field of Study in Fort Rucker
Arts & humanities (257 | 20.8%), psychology (140 | 11.4%), education (137 | 11.1%), business (136 | 11.0%), and science & technology (109 | 8.8%) are the most common fields of study among 1,233 individuals in Fort Rucker who have obtained a bachelor's degree or higher.
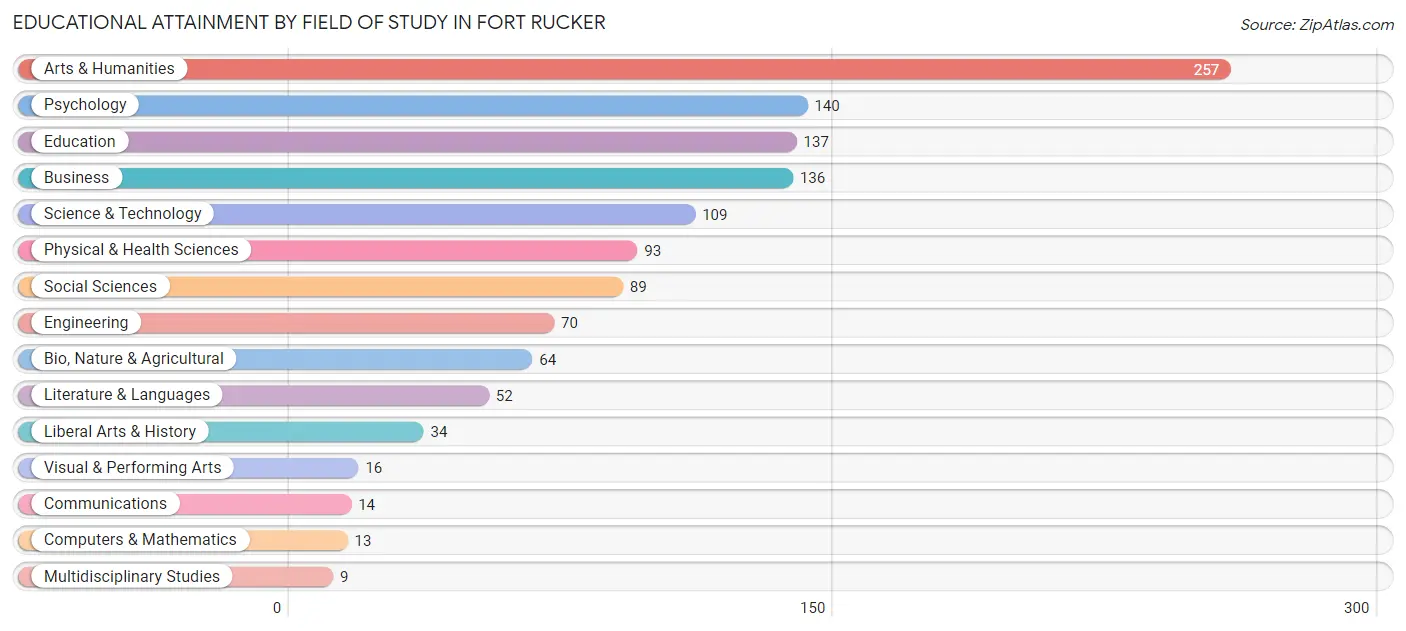
| Field of Study | # Graduates | % Graduates |
| Computers & Mathematics | 13 | 1.1% |
| Bio, Nature & Agricultural | 64 | 5.2% |
| Physical & Health Sciences | 93 | 7.5% |
| Psychology | 140 | 11.4% |
| Social Sciences | 89 | 7.2% |
| Engineering | 70 | 5.7% |
| Multidisciplinary Studies | 9 | 0.7% |
| Science & Technology | 109 | 8.8% |
| Business | 136 | 11.0% |
| Education | 137 | 11.1% |
| Literature & Languages | 52 | 4.2% |
| Liberal Arts & History | 34 | 2.8% |
| Visual & Performing Arts | 16 | 1.3% |
| Communications | 14 | 1.1% |
| Arts & Humanities | 257 | 20.8% |
| Total | 1,233 | 100.0% |
Transportation & Commute in Fort Rucker
Vehicle Availability by Sex in Fort Rucker
The most prevalent vehicle ownership categories in Fort Rucker are males with 2 vehicles (888, accounting for 63.4%) and females with 2 vehicles (306, making up 171.8%).
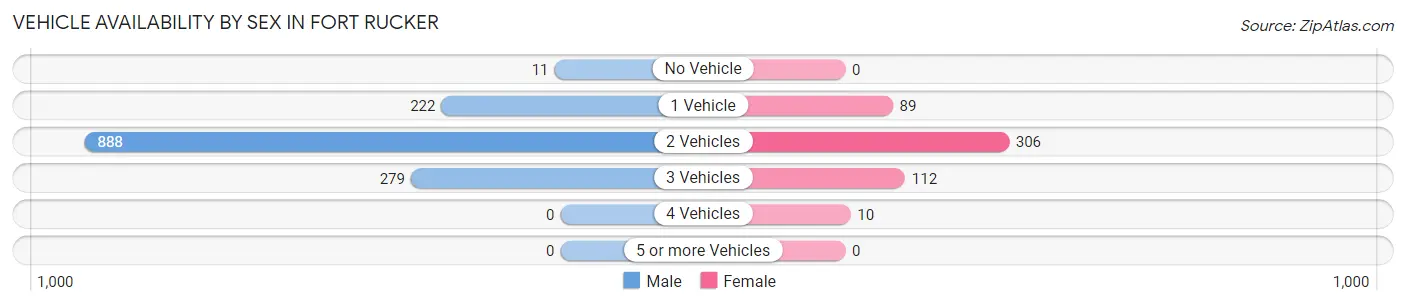
| Vehicles Available | Male | Female |
| No Vehicle | 11 (0.8%) | 0 (0.0%) |
| 1 Vehicle | 222 (15.9%) | 89 (17.2%) |
| 2 Vehicles | 888 (63.4%) | 306 (59.2%) |
| 3 Vehicles | 279 (19.9%) | 112 (21.7%) |
| 4 Vehicles | 0 (0.0%) | 10 (1.9%) |
| 5 or more Vehicles | 0 (0.0%) | 0 (0.0%) |
| Total | 1,400 (100.0%) | 517 (100.0%) |
Commute Time in Fort Rucker
The most frequently occuring commute durations in Fort Rucker are 5 to 9 minutes (723 commuters, 33.0%), 10 to 14 minutes (642 commuters, 29.3%), and 15 to 19 minutes (389 commuters, 17.7%).
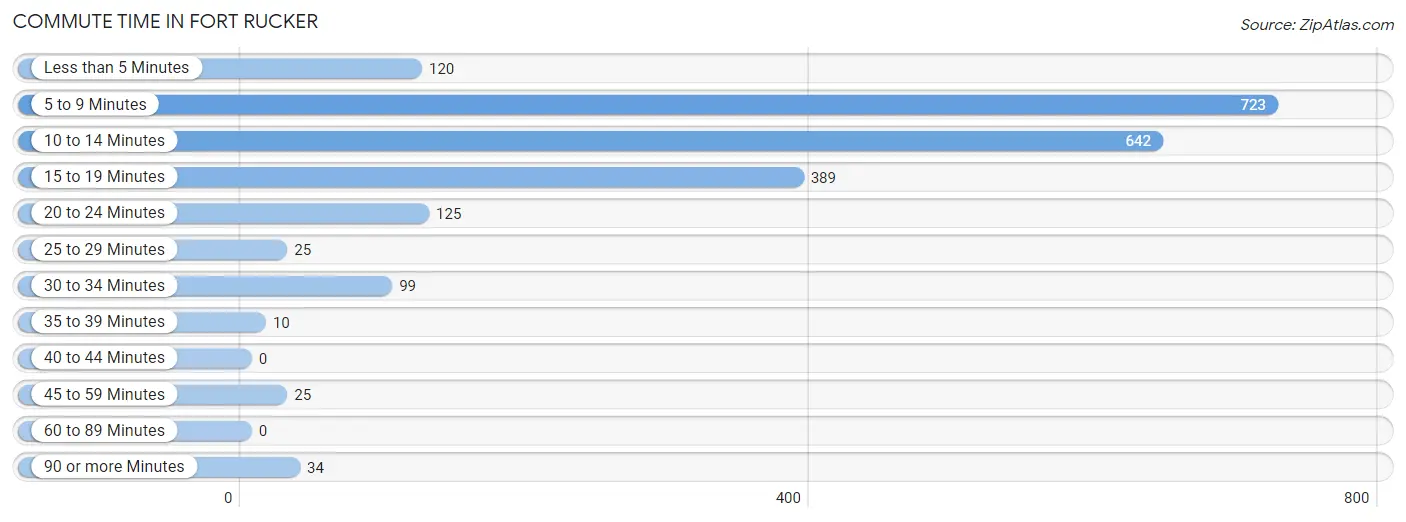
| Commute Time | # Commuters | % Commuters |
| Less than 5 Minutes | 120 | 5.5% |
| 5 to 9 Minutes | 723 | 33.0% |
| 10 to 14 Minutes | 642 | 29.3% |
| 15 to 19 Minutes | 389 | 17.7% |
| 20 to 24 Minutes | 125 | 5.7% |
| 25 to 29 Minutes | 25 | 1.1% |
| 30 to 34 Minutes | 99 | 4.5% |
| 35 to 39 Minutes | 10 | 0.5% |
| 40 to 44 Minutes | 0 | 0.0% |
| 45 to 59 Minutes | 25 | 1.1% |
| 60 to 89 Minutes | 0 | 0.0% |
| 90 or more Minutes | 34 | 1.5% |
Commute Time by Sex in Fort Rucker
The most common commute times in Fort Rucker are 5 to 9 minutes (660 commuters, 39.3%) for males and 10 to 14 minutes (213 commuters, 41.5%) for females.
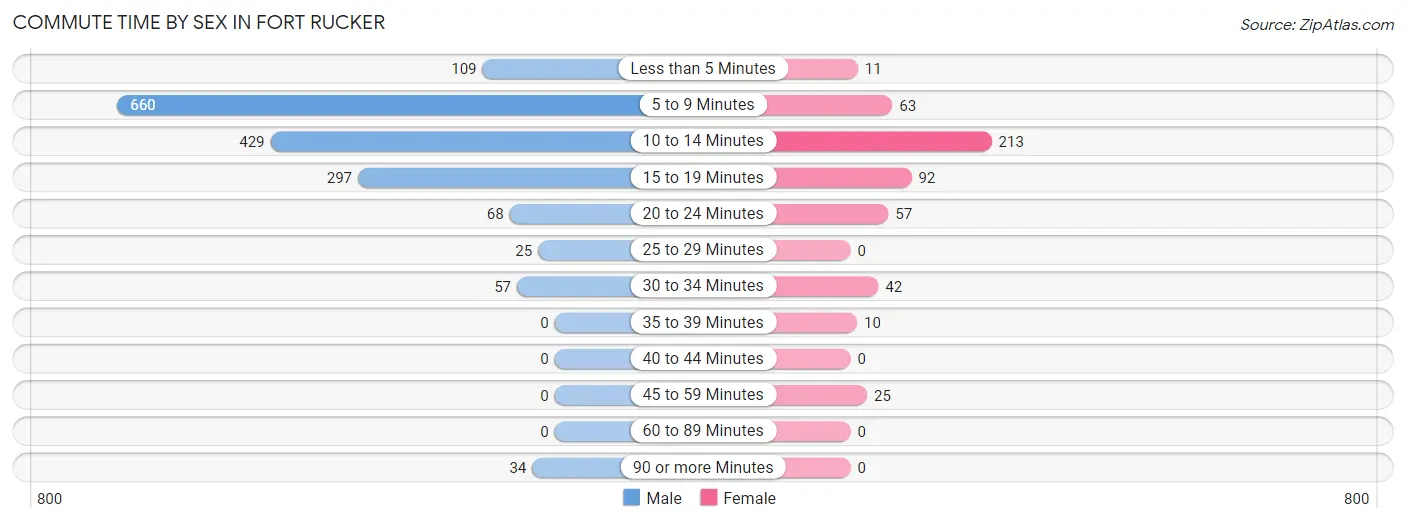
| Commute Time | Male | Female |
| Less than 5 Minutes | 109 (6.5%) | 11 (2.1%) |
| 5 to 9 Minutes | 660 (39.3%) | 63 (12.3%) |
| 10 to 14 Minutes | 429 (25.6%) | 213 (41.5%) |
| 15 to 19 Minutes | 297 (17.7%) | 92 (17.9%) |
| 20 to 24 Minutes | 68 (4.1%) | 57 (11.1%) |
| 25 to 29 Minutes | 25 (1.5%) | 0 (0.0%) |
| 30 to 34 Minutes | 57 (3.4%) | 42 (8.2%) |
| 35 to 39 Minutes | 0 (0.0%) | 10 (1.9%) |
| 40 to 44 Minutes | 0 (0.0%) | 0 (0.0%) |
| 45 to 59 Minutes | 0 (0.0%) | 25 (4.9%) |
| 60 to 89 Minutes | 0 (0.0%) | 0 (0.0%) |
| 90 or more Minutes | 34 (2.0%) | 0 (0.0%) |
Time of Departure to Work by Sex in Fort Rucker
The most frequent times of departure to work in Fort Rucker are 5:30 AM to 5:59 AM (256, 15.2%) for males and 7:00 AM to 7:29 AM (133, 25.9%) for females.
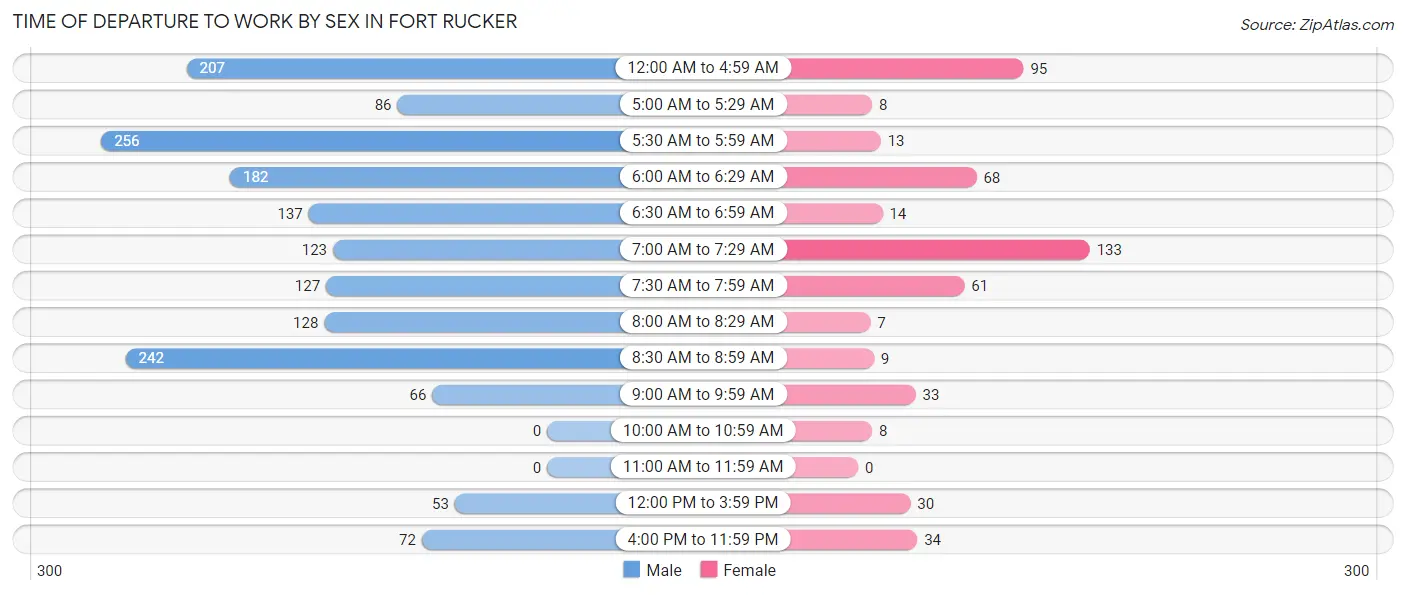
| Time of Departure | Male | Female |
| 12:00 AM to 4:59 AM | 207 (12.3%) | 95 (18.5%) |
| 5:00 AM to 5:29 AM | 86 (5.1%) | 8 (1.6%) |
| 5:30 AM to 5:59 AM | 256 (15.2%) | 13 (2.5%) |
| 6:00 AM to 6:29 AM | 182 (10.8%) | 68 (13.3%) |
| 6:30 AM to 6:59 AM | 137 (8.2%) | 14 (2.7%) |
| 7:00 AM to 7:29 AM | 123 (7.3%) | 133 (25.9%) |
| 7:30 AM to 7:59 AM | 127 (7.6%) | 61 (11.9%) |
| 8:00 AM to 8:29 AM | 128 (7.6%) | 7 (1.4%) |
| 8:30 AM to 8:59 AM | 242 (14.4%) | 9 (1.8%) |
| 9:00 AM to 9:59 AM | 66 (3.9%) | 33 (6.4%) |
| 10:00 AM to 10:59 AM | 0 (0.0%) | 8 (1.6%) |
| 11:00 AM to 11:59 AM | 0 (0.0%) | 0 (0.0%) |
| 12:00 PM to 3:59 PM | 53 (3.2%) | 30 (5.9%) |
| 4:00 PM to 11:59 PM | 72 (4.3%) | 34 (6.6%) |
| Total | 1,679 (100.0%) | 513 (100.0%) |
Housing Occupancy in Fort Rucker
Occupancy by Ownership in Fort Rucker
Of the total 1,465 dwellings in Fort Rucker, owner-occupied units account for 12 (0.8%), while renter-occupied units make up 1,453 (99.2%).
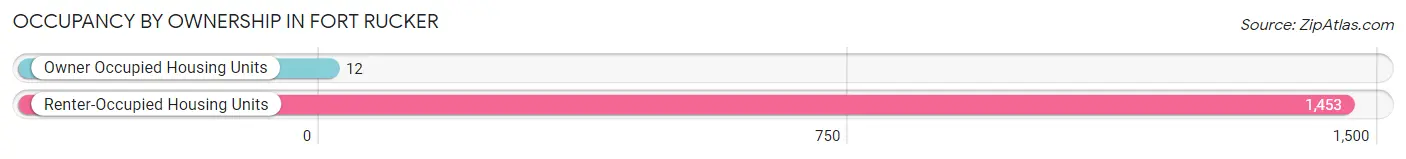
| Occupancy | # Housing Units | % Housing Units |
| Owner Occupied Housing Units | 12 | 0.8% |
| Renter-Occupied Housing Units | 1,453 | 99.2% |
| Total Occupied Housing Units | 1,465 | 100.0% |
Occupancy by Household Size in Fort Rucker
| Household Size | # Housing Units | % Housing Units |
| 1-Person Household | 167 | 11.4% |
| 2-Person Household | 332 | 22.7% |
| 3-Person Household | 469 | 32.0% |
| 4+ Person Household | 497 | 33.9% |
| Total Housing Units | 1,465 | 100.0% |
Occupancy by Ownership by Household Size in Fort Rucker
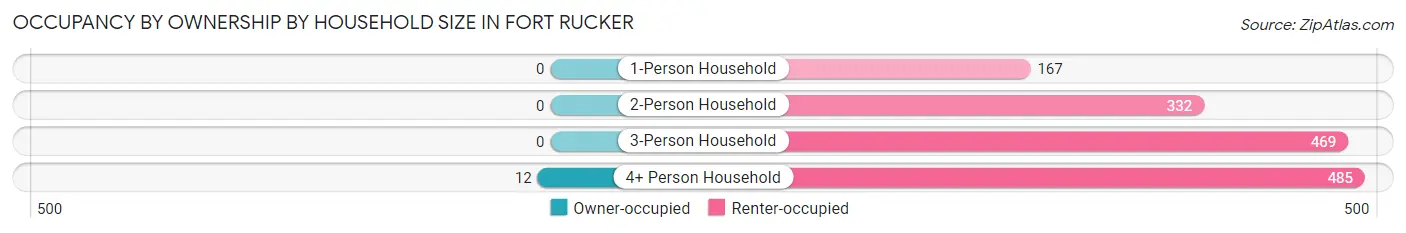
| Household Size | Owner-occupied | Renter-occupied |
| 1-Person Household | 0 (0.0%) | 167 (100.0%) |
| 2-Person Household | 0 (0.0%) | 332 (100.0%) |
| 3-Person Household | 0 (0.0%) | 469 (100.0%) |
| 4+ Person Household | 12 (2.4%) | 485 (97.6%) |
| Total Housing Units | 12 (0.8%) | 1,453 (99.2%) |
Occupancy by Educational Attainment in Fort Rucker
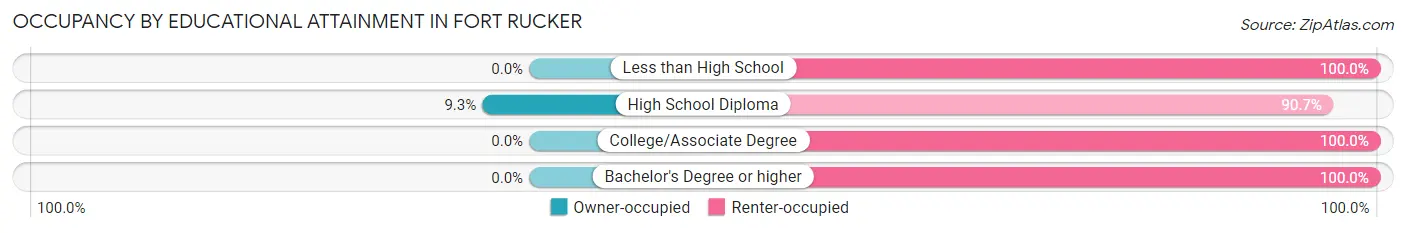
| Household Size | Owner-occupied | Renter-occupied |
| Less than High School | 0 (0.0%) | 4 (100.0%) |
| High School Diploma | 12 (9.3%) | 117 (90.7%) |
| College/Associate Degree | 0 (0.0%) | 715 (100.0%) |
| Bachelor's Degree or higher | 0 (0.0%) | 617 (100.0%) |
Occupancy by Age of Householder in Fort Rucker
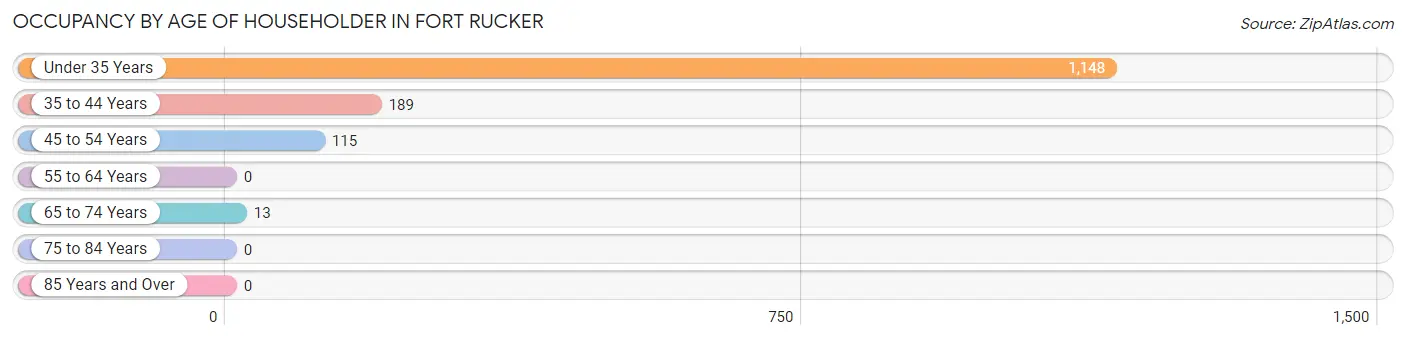
| Age Bracket | # Households | % Households |
| Under 35 Years | 1,148 | 78.4% |
| 35 to 44 Years | 189 | 12.9% |
| 45 to 54 Years | 115 | 7.9% |
| 55 to 64 Years | 0 | 0.0% |
| 65 to 74 Years | 13 | 0.9% |
| 75 to 84 Years | 0 | 0.0% |
| 85 Years and Over | 0 | 0.0% |
| Total | 1,465 | 100.0% |
Housing Finances in Fort Rucker
Median Income by Occupancy in Fort Rucker
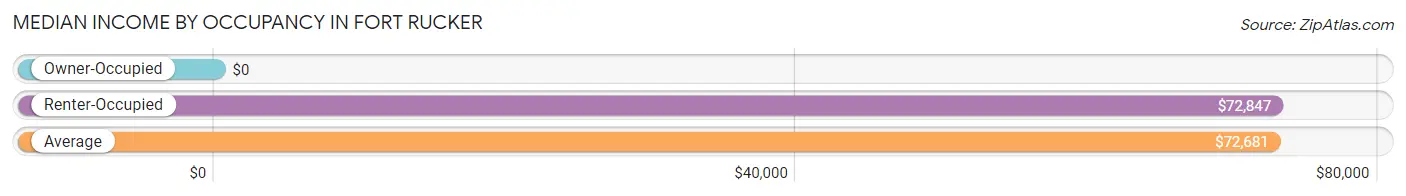
| Occupancy Type | # Households | Median Income |
| Owner-Occupied | 12 (0.8%) | $0 |
| Renter-Occupied | 1,453 (99.2%) | $72,847 |
| Average | 1,465 (100.0%) | $72,681 |
Occupancy by Householder Income Bracket in Fort Rucker
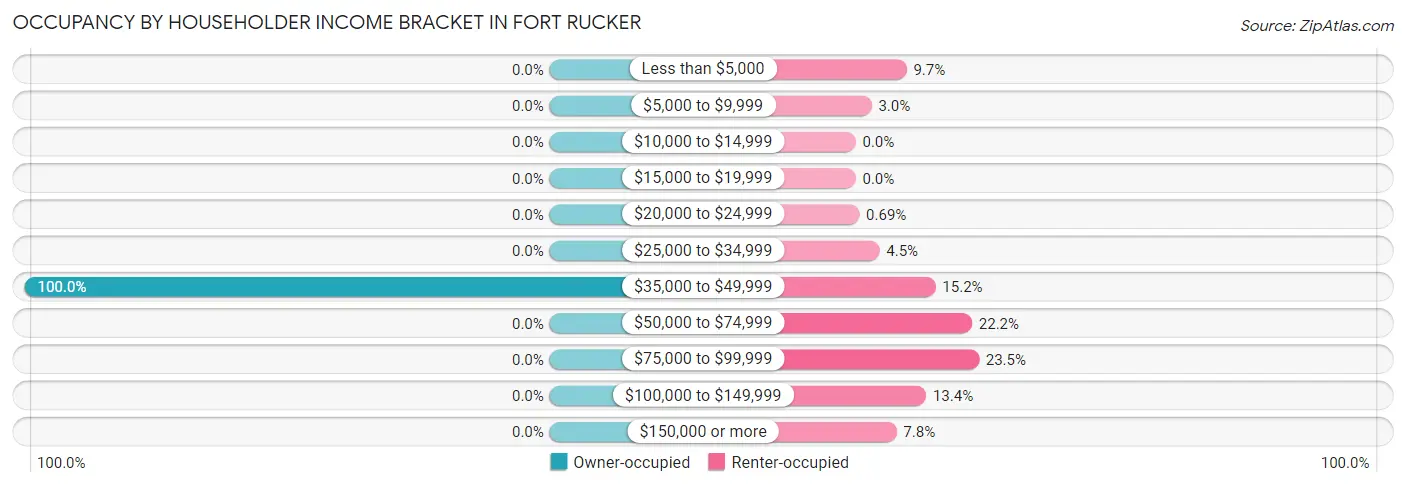
| Income Bracket | Owner-occupied | Renter-occupied |
| Less than $5,000 | 0 (0.0%) | 141 (9.7%) |
| $5,000 to $9,999 | 0 (0.0%) | 44 (3.0%) |
| $10,000 to $14,999 | 0 (0.0%) | 0 (0.0%) |
| $15,000 to $19,999 | 0 (0.0%) | 0 (0.0%) |
| $20,000 to $24,999 | 0 (0.0%) | 10 (0.7%) |
| $25,000 to $34,999 | 0 (0.0%) | 66 (4.5%) |
| $35,000 to $49,999 | 12 (100.0%) | 221 (15.2%) |
| $50,000 to $74,999 | 0 (0.0%) | 322 (22.2%) |
| $75,000 to $99,999 | 0 (0.0%) | 341 (23.5%) |
| $100,000 to $149,999 | 0 (0.0%) | 195 (13.4%) |
| $150,000 or more | 0 (0.0%) | 113 (7.8%) |
| Total | 12 (100.0%) | 1,453 (100.0%) |
Monthly Housing Cost Tiers in Fort Rucker
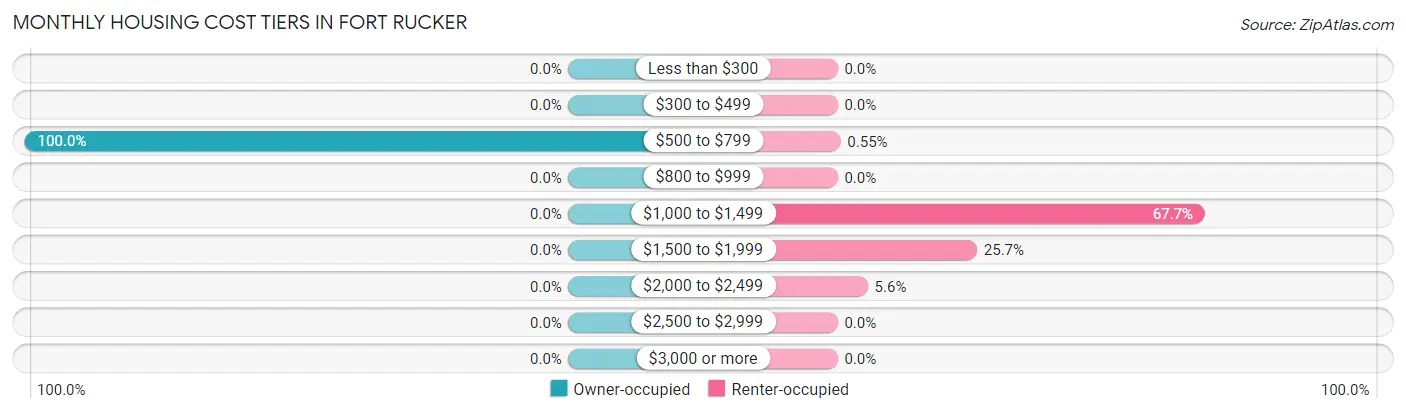
| Monthly Cost | Owner-occupied | Renter-occupied |
| Less than $300 | 0 (0.0%) | 0 (0.0%) |
| $300 to $499 | 0 (0.0%) | 0 (0.0%) |
| $500 to $799 | 12 (100.0%) | 8 (0.5%) |
| $800 to $999 | 0 (0.0%) | 0 (0.0%) |
| $1,000 to $1,499 | 0 (0.0%) | 983 (67.6%) |
| $1,500 to $1,999 | 0 (0.0%) | 373 (25.7%) |
| $2,000 to $2,499 | 0 (0.0%) | 81 (5.6%) |
| $2,500 to $2,999 | 0 (0.0%) | 0 (0.0%) |
| $3,000 or more | 0 (0.0%) | 0 (0.0%) |
| Total | 12 (100.0%) | 1,453 (100.0%) |
Physical Housing Characteristics in Fort Rucker
Housing Structures in Fort Rucker
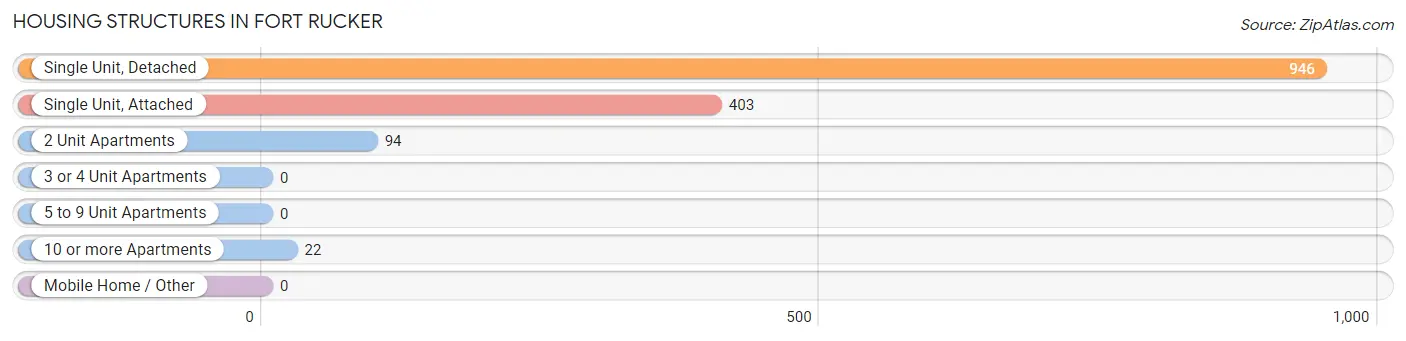
| Structure Type | # Housing Units | % Housing Units |
| Single Unit, Detached | 946 | 64.6% |
| Single Unit, Attached | 403 | 27.5% |
| 2 Unit Apartments | 94 | 6.4% |
| 3 or 4 Unit Apartments | 0 | 0.0% |
| 5 to 9 Unit Apartments | 0 | 0.0% |
| 10 or more Apartments | 22 | 1.5% |
| Mobile Home / Other | 0 | 0.0% |
| Total | 1,465 | 100.0% |
Housing Structures by Occupancy in Fort Rucker
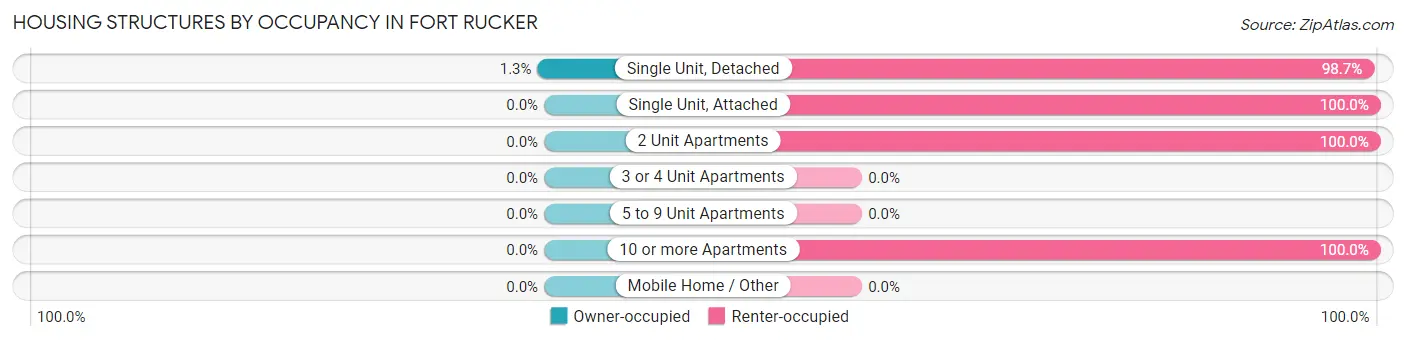
| Structure Type | Owner-occupied | Renter-occupied |
| Single Unit, Detached | 12 (1.3%) | 934 (98.7%) |
| Single Unit, Attached | 0 (0.0%) | 403 (100.0%) |
| 2 Unit Apartments | 0 (0.0%) | 94 (100.0%) |
| 3 or 4 Unit Apartments | 0 (0.0%) | 0 (0.0%) |
| 5 to 9 Unit Apartments | 0 (0.0%) | 0 (0.0%) |
| 10 or more Apartments | 0 (0.0%) | 22 (100.0%) |
| Mobile Home / Other | 0 (0.0%) | 0 (0.0%) |
| Total | 12 (0.8%) | 1,453 (99.2%) |
Housing Structures by Number of Rooms in Fort Rucker
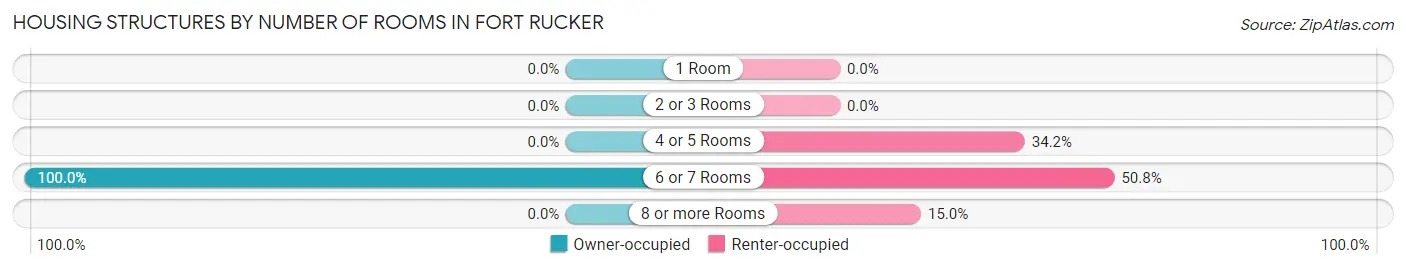
| Number of Rooms | Owner-occupied | Renter-occupied |
| 1 Room | 0 (0.0%) | 0 (0.0%) |
| 2 or 3 Rooms | 0 (0.0%) | 0 (0.0%) |
| 4 or 5 Rooms | 0 (0.0%) | 497 (34.2%) |
| 6 or 7 Rooms | 12 (100.0%) | 738 (50.8%) |
| 8 or more Rooms | 0 (0.0%) | 218 (15.0%) |
| Total | 12 (100.0%) | 1,453 (100.0%) |
Housing Structure by Heating Type in Fort Rucker
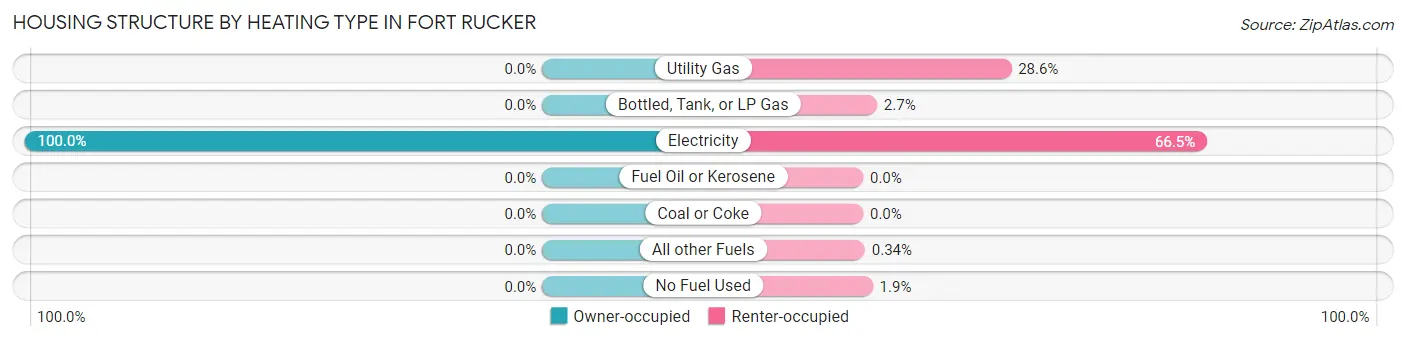
| Heating Type | Owner-occupied | Renter-occupied |
| Utility Gas | 0 (0.0%) | 416 (28.6%) |
| Bottled, Tank, or LP Gas | 0 (0.0%) | 39 (2.7%) |
| Electricity | 12 (100.0%) | 966 (66.5%) |
| Fuel Oil or Kerosene | 0 (0.0%) | 0 (0.0%) |
| Coal or Coke | 0 (0.0%) | 0 (0.0%) |
| All other Fuels | 0 (0.0%) | 5 (0.3%) |
| No Fuel Used | 0 (0.0%) | 27 (1.9%) |
| Total | 12 (100.0%) | 1,453 (100.0%) |
Household Vehicle Usage in Fort Rucker
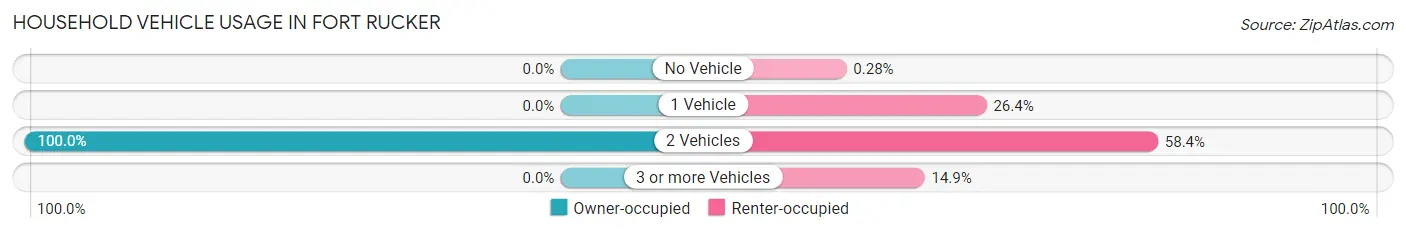
| Vehicles per Household | Owner-occupied | Renter-occupied |
| No Vehicle | 0 (0.0%) | 4 (0.3%) |
| 1 Vehicle | 0 (0.0%) | 384 (26.4%) |
| 2 Vehicles | 12 (100.0%) | 849 (58.4%) |
| 3 or more Vehicles | 0 (0.0%) | 216 (14.9%) |
| Total | 12 (100.0%) | 1,453 (100.0%) |
Real Estate & Mortgages in Fort Rucker
Real Estate and Mortgage Overview in Fort Rucker
| Characteristic | Without Mortgage | With Mortgage |
| Housing Units | 12 | 0 |
| Median Property Value | - | - |
| Median Household Income | - | - |
| Monthly Housing Costs | - | - |
| Real Estate Taxes | - | - |
Property Value by Mortgage Status in Fort Rucker
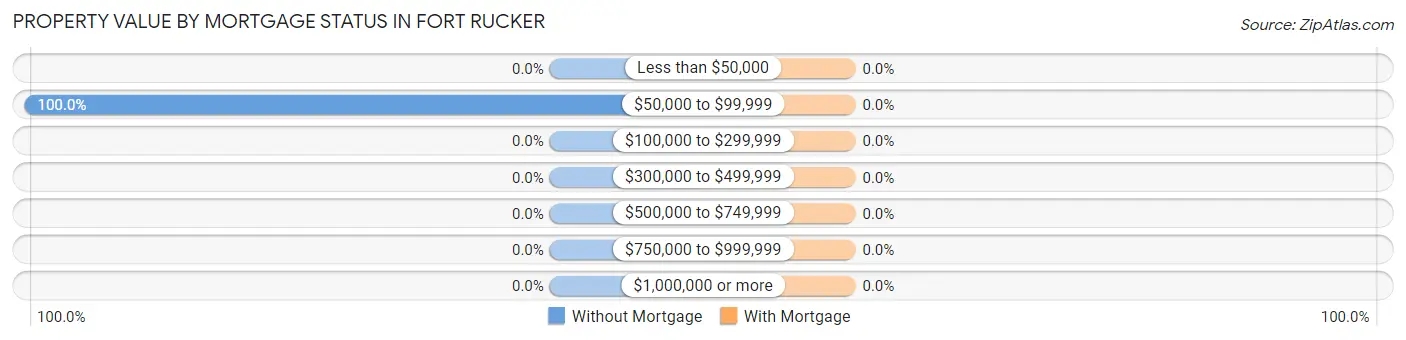
| Property Value | Without Mortgage | With Mortgage |
| Less than $50,000 | 0 (0.0%) | 0 (0.0%) |
| $50,000 to $99,999 | 12 (100.0%) | 0 (0.0%) |
| $100,000 to $299,999 | 0 (0.0%) | 0 (0.0%) |
| $300,000 to $499,999 | 0 (0.0%) | 0 (0.0%) |
| $500,000 to $749,999 | 0 (0.0%) | 0 (0.0%) |
| $750,000 to $999,999 | 0 (0.0%) | 0 (0.0%) |
| $1,000,000 or more | 0 (0.0%) | 0 (0.0%) |
| Total | 12 (100.0%) | 0 (0.0%) |
Household Income by Mortgage Status in Fort Rucker
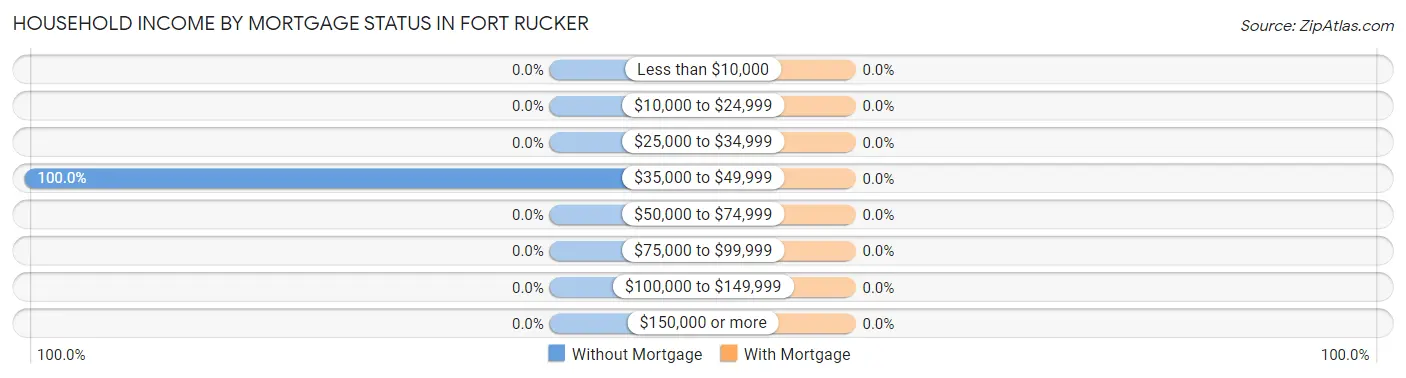
| Household Income | Without Mortgage | With Mortgage |
| Less than $10,000 | 0 (0.0%) | 0 (0.0%) |
| $10,000 to $24,999 | 0 (0.0%) | 0 (0.0%) |
| $25,000 to $34,999 | 0 (0.0%) | 0 (0.0%) |
| $35,000 to $49,999 | 12 (100.0%) | 0 (0.0%) |
| $50,000 to $74,999 | 0 (0.0%) | 0 (0.0%) |
| $75,000 to $99,999 | 0 (0.0%) | 0 (0.0%) |
| $100,000 to $149,999 | 0 (0.0%) | 0 (0.0%) |
| $150,000 or more | 0 (0.0%) | 0 (0.0%) |
| Total | 12 (100.0%) | 0 (0.0%) |
Property Value to Household Income Ratio in Fort Rucker
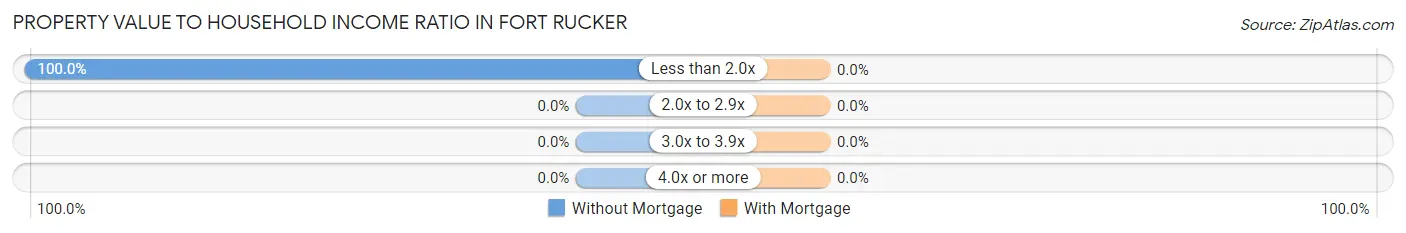
| Value-to-Income Ratio | Without Mortgage | With Mortgage |
| Less than 2.0x | 12 (100.0%) | 0 (0.0%) |
| 2.0x to 2.9x | 0 (0.0%) | 0 (0.0%) |
| 3.0x to 3.9x | 0 (0.0%) | 0 (0.0%) |
| 4.0x or more | 0 (0.0%) | 0 (0.0%) |
| Total | 12 (100.0%) | 0 (0.0%) |
Real Estate Taxes by Mortgage Status in Fort Rucker
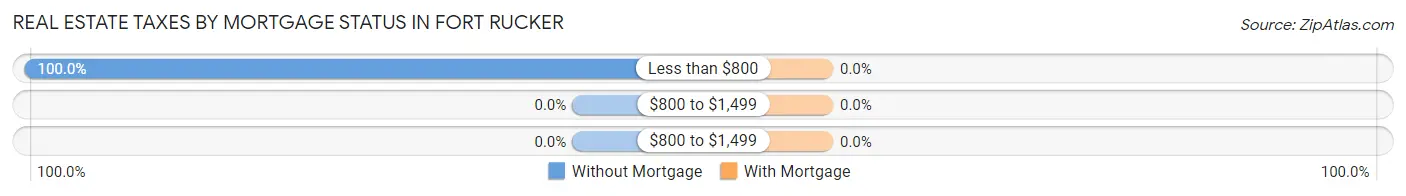
| Property Taxes | Without Mortgage | With Mortgage |
| Less than $800 | 12 (100.0%) | 0 (0.0%) |
| $800 to $1,499 | 0 (0.0%) | 0 (0.0%) |
| $800 to $1,499 | 0 (0.0%) | 0 (0.0%) |
| Total | 12 (100.0%) | 0 (0.0%) |
Health & Disability in Fort Rucker
Health Insurance Coverage by Age in Fort Rucker
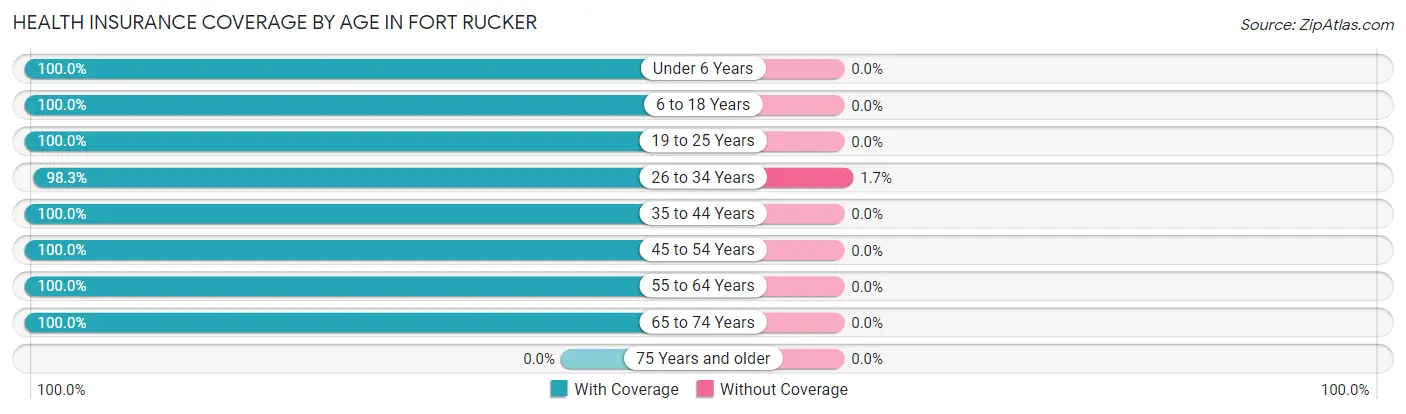
| Age Bracket | With Coverage | Without Coverage |
| Under 6 Years | 1,002 (100.0%) | 0 (0.0%) |
| 6 to 18 Years | 1,044 (100.0%) | 0 (0.0%) |
| 19 to 25 Years | 384 (100.0%) | 0 (0.0%) |
| 26 to 34 Years | 761 (98.3%) | 13 (1.7%) |
| 35 to 44 Years | 284 (100.0%) | 0 (0.0%) |
| 45 to 54 Years | 41 (100.0%) | 0 (0.0%) |
| 55 to 64 Years | 12 (100.0%) | 0 (0.0%) |
| 65 to 74 Years | 13 (100.0%) | 0 (0.0%) |
| 75 Years and older | 0 (0.0%) | 0 (0.0%) |
| Total | 3,541 (99.6%) | 13 (0.4%) |
Health Insurance Coverage by Citizenship Status in Fort Rucker
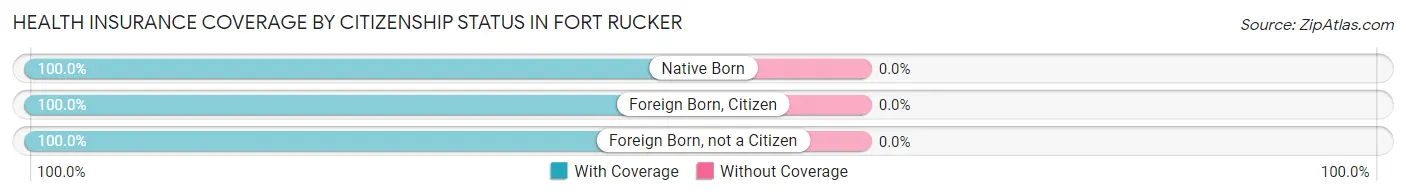
| Citizenship Status | With Coverage | Without Coverage |
| Native Born | 1,002 (100.0%) | 0 (0.0%) |
| Foreign Born, Citizen | 1,044 (100.0%) | 0 (0.0%) |
| Foreign Born, not a Citizen | 384 (100.0%) | 0 (0.0%) |
Health Insurance Coverage by Household Income in Fort Rucker
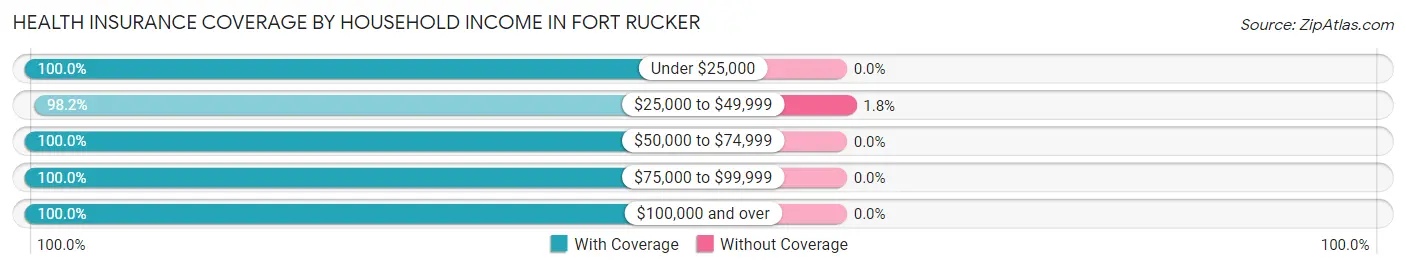
| Household Income | With Coverage | Without Coverage |
| Under $25,000 | 648 (100.0%) | 0 (0.0%) |
| $25,000 to $49,999 | 712 (98.2%) | 13 (1.8%) |
| $50,000 to $74,999 | 572 (100.0%) | 0 (0.0%) |
| $75,000 to $99,999 | 905 (100.0%) | 0 (0.0%) |
| $100,000 and over | 704 (100.0%) | 0 (0.0%) |
Public vs Private Health Insurance Coverage by Age in Fort Rucker
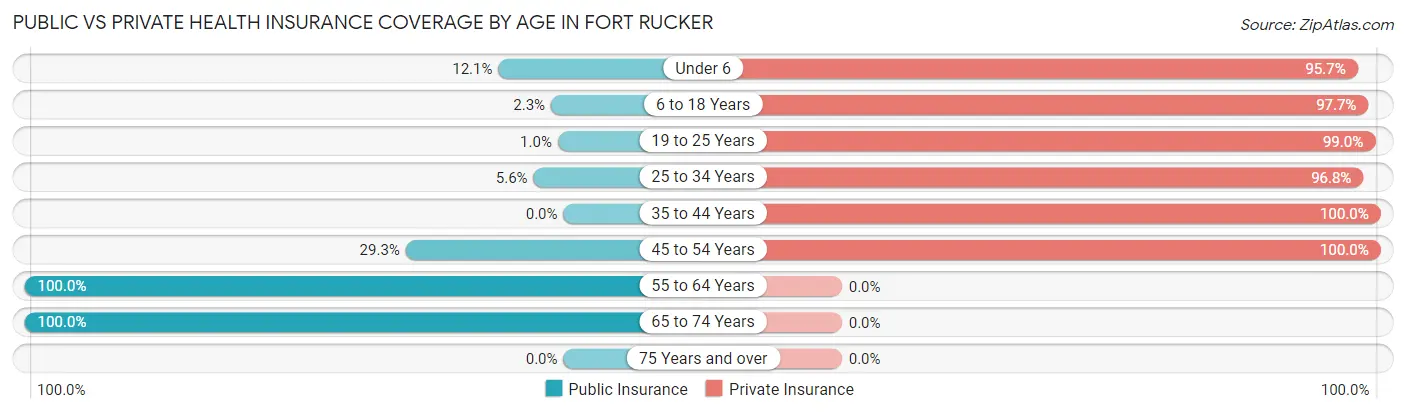
| Age Bracket | Public Insurance | Private Insurance |
| Under 6 | 121 (12.1%) | 959 (95.7%) |
| 6 to 18 Years | 24 (2.3%) | 1,020 (97.7%) |
| 19 to 25 Years | 4 (1.0%) | 380 (99.0%) |
| 25 to 34 Years | 43 (5.6%) | 749 (96.8%) |
| 35 to 44 Years | 0 (0.0%) | 284 (100.0%) |
| 45 to 54 Years | 12 (29.3%) | 41 (100.0%) |
| 55 to 64 Years | 12 (100.0%) | 0 (0.0%) |
| 65 to 74 Years | 13 (100.0%) | 0 (0.0%) |
| 75 Years and over | 0 (0.0%) | 0 (0.0%) |
| Total | 229 (6.4%) | 3,433 (96.6%) |
Disability Status by Sex by Age in Fort Rucker
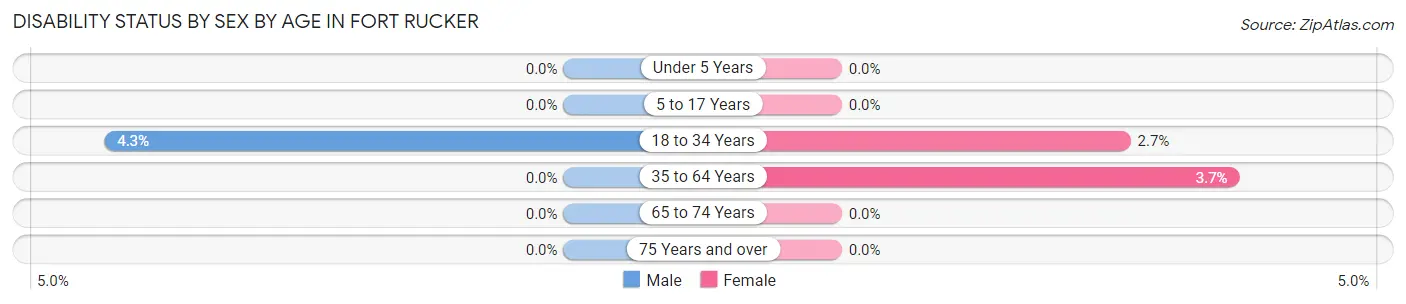
| Age Bracket | Male | Female |
| Under 5 Years | 0 (0.0%) | 0 (0.0%) |
| 5 to 17 Years | 0 (0.0%) | 0 (0.0%) |
| 18 to 34 Years | 12 (4.3%) | 24 (2.7%) |
| 35 to 64 Years | 0 (0.0%) | 12 (3.7%) |
| 65 to 74 Years | 0 (0.0%) | 0 (0.0%) |
| 75 Years and over | 0 (0.0%) | 0 (0.0%) |
Disability Class by Sex by Age in Fort Rucker
Disability Class: Hearing Difficulty
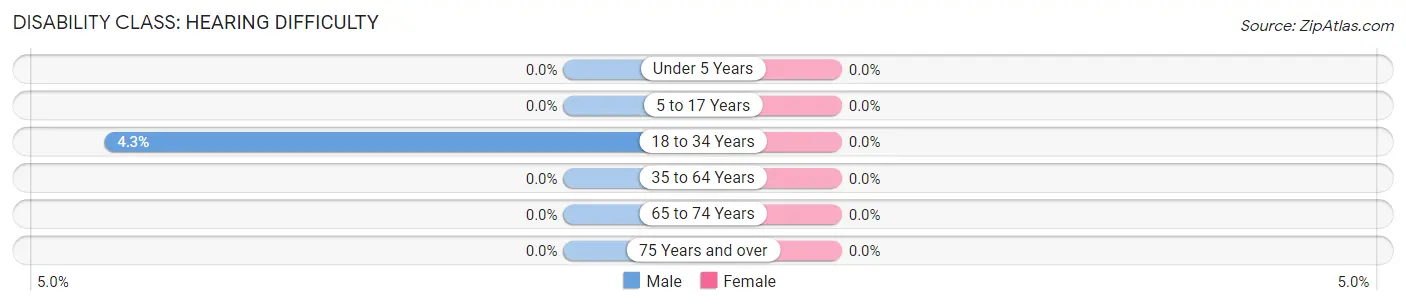
| Age Bracket | Male | Female |
| Under 5 Years | 0 (0.0%) | 0 (0.0%) |
| 5 to 17 Years | 0 (0.0%) | 0 (0.0%) |
| 18 to 34 Years | 12 (4.3%) | 0 (0.0%) |
| 35 to 64 Years | 0 (0.0%) | 0 (0.0%) |
| 65 to 74 Years | 0 (0.0%) | 0 (0.0%) |
| 75 Years and over | 0 (0.0%) | 0 (0.0%) |
Disability Class: Vision Difficulty
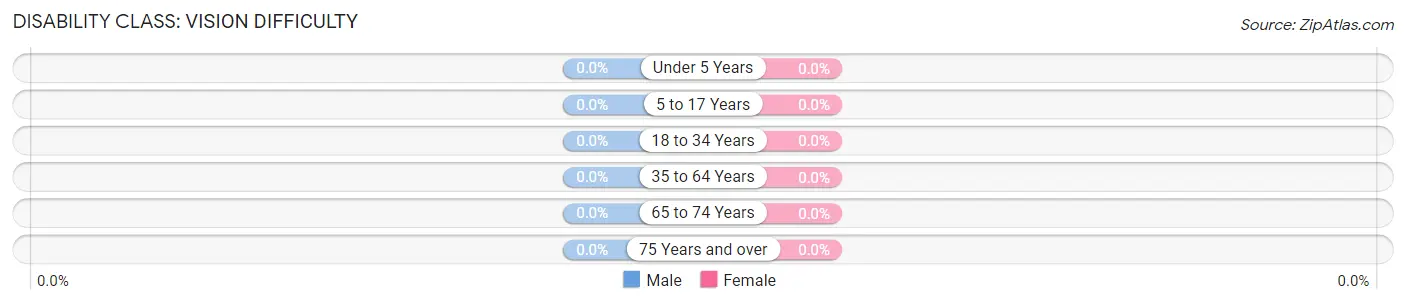
| Age Bracket | Male | Female |
| Under 5 Years | 0 (0.0%) | 0 (0.0%) |
| 5 to 17 Years | 0 (0.0%) | 0 (0.0%) |
| 18 to 34 Years | 0 (0.0%) | 0 (0.0%) |
| 35 to 64 Years | 0 (0.0%) | 0 (0.0%) |
| 65 to 74 Years | 0 (0.0%) | 0 (0.0%) |
| 75 Years and over | 0 (0.0%) | 0 (0.0%) |
Disability Class: Cognitive Difficulty
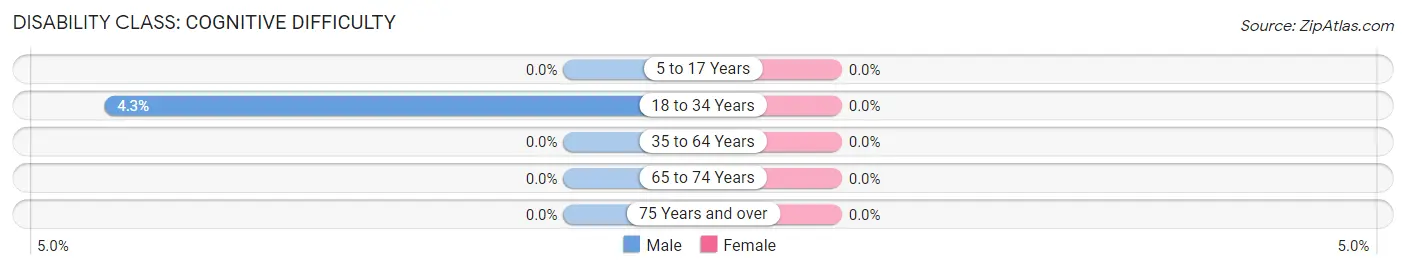
| Age Bracket | Male | Female |
| 5 to 17 Years | 0 (0.0%) | 0 (0.0%) |
| 18 to 34 Years | 12 (4.3%) | 0 (0.0%) |
| 35 to 64 Years | 0 (0.0%) | 0 (0.0%) |
| 65 to 74 Years | 0 (0.0%) | 0 (0.0%) |
| 75 Years and over | 0 (0.0%) | 0 (0.0%) |
Disability Class: Ambulatory Difficulty

| Age Bracket | Male | Female |
| 5 to 17 Years | 0 (0.0%) | 0 (0.0%) |
| 18 to 34 Years | 0 (0.0%) | 0 (0.0%) |
| 35 to 64 Years | 0 (0.0%) | 12 (3.7%) |
| 65 to 74 Years | 0 (0.0%) | 0 (0.0%) |
| 75 Years and over | 0 (0.0%) | 0 (0.0%) |
Disability Class: Self-Care Difficulty
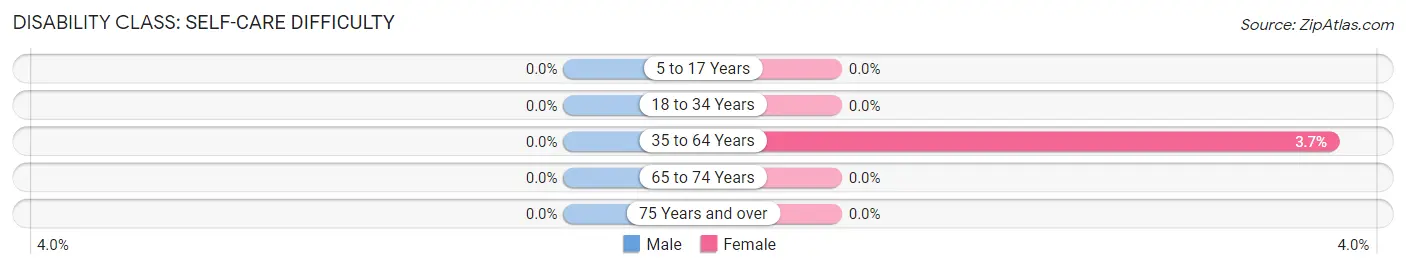
| Age Bracket | Male | Female |
| 5 to 17 Years | 0 (0.0%) | 0 (0.0%) |
| 18 to 34 Years | 0 (0.0%) | 0 (0.0%) |
| 35 to 64 Years | 0 (0.0%) | 12 (3.7%) |
| 65 to 74 Years | 0 (0.0%) | 0 (0.0%) |
| 75 Years and over | 0 (0.0%) | 0 (0.0%) |
Technology Access in Fort Rucker
Computing Device Access in Fort Rucker
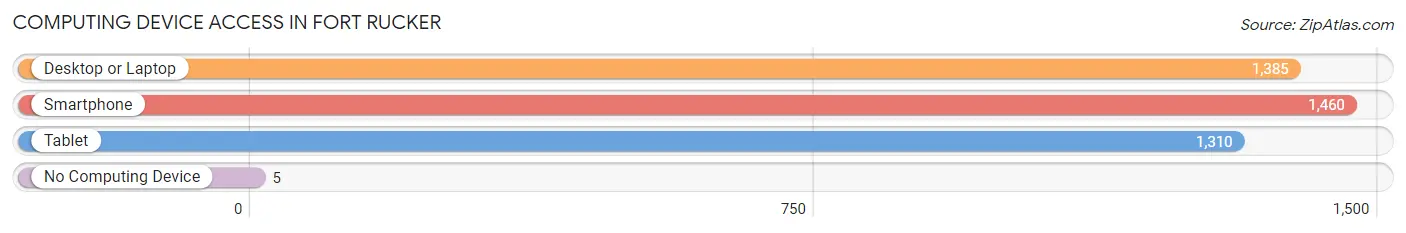
| Device Type | # Households | % Households |
| Desktop or Laptop | 1,385 | 94.5% |
| Smartphone | 1,460 | 99.7% |
| Tablet | 1,310 | 89.4% |
| No Computing Device | 5 | 0.3% |
| Total | 1,465 | 100.0% |
Internet Access in Fort Rucker
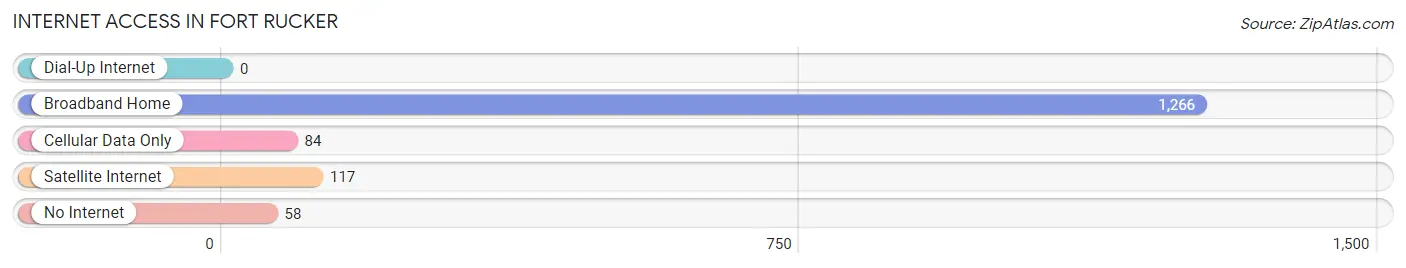
| Internet Type | # Households | % Households |
| Dial-Up Internet | 0 | 0.0% |
| Broadband Home | 1,266 | 86.4% |
| Cellular Data Only | 84 | 5.7% |
| Satellite Internet | 117 | 8.0% |
| No Internet | 58 | 4.0% |
| Total | 1,465 | 100.0% |
Fort Rucker Summary
Fort Rucker, AL is a United States Army post located in Dale County, Alabama. It is the primary flight training base for Army Aviation and is home to the United States Army Aviation Center of Excellence (USAACE). The post was established in 1942 and is named after Confederate General Edmund Rucker.
History
Fort Rucker was established in 1942 as Camp Rucker, a training camp for the United States Army Air Corps. The camp was located on the site of a former Civilian Conservation Corps camp and was used to train pilots for World War II. In 1955, the camp was renamed Fort Rucker and became the home of the Army Aviation Center. The center was responsible for training Army aviators and providing support for Army aviation operations.
In the 1960s, Fort Rucker was expanded to include a helicopter training school and a helicopter maintenance school. The post also became the home of the Army Aviation School, which provided advanced training for Army aviators. In the 1970s, the post was further expanded to include a flight simulator training center and a research and development center.
In the 1980s, Fort Rucker was designated as the home of the United States Army Aviation Center of Excellence (USAACE). The center is responsible for training Army aviators, providing support for Army aviation operations, and conducting research and development in the field of Army aviation.
Geography
Fort Rucker is located in Dale County, Alabama, approximately 20 miles south of Ozark, Alabama. The post is situated on the banks of the Choctawhatchee River and covers an area of approximately 28,000 acres. The terrain of the post is mostly flat and is covered with pine and hardwood forests.
Economy
Fort Rucker is a major economic driver for the region. The post is home to more than 10,000 military personnel and civilian employees, and has an annual economic impact of more than $1 billion. The post is also home to a number of businesses, including hotels, restaurants, retail stores, and other services.
Demographics
As of the 2010 census, the population of Fort Rucker was 8,945. The racial makeup of the post was 79.3% White, 11.2% African American, 0.7% Native American, 2.2% Asian, 0.1% Pacific Islander, 4.2% from other races, and 2.5% from two or more races. The median household income was $45,945 and the median family income was $50,945.
Conclusion
Fort Rucker is a United States Army post located in Dale County, Alabama. It is the primary flight training base for Army Aviation and is home to the United States Army Aviation Center of Excellence (USAACE). The post was established in 1942 and is named after Confederate General Edmund Rucker. Fort Rucker is a major economic driver for the region, with an annual economic impact of more than $1 billion. The post is home to more than 10,000 military personnel and civilian employees, and the population of Fort Rucker was 8,945 as of the 2010 census.
Common Questions
What is Per Capita Income in Fort Rucker?
Per Capita income in Fort Rucker is $23,588.
What is the Median Family Income in Fort Rucker?
Median Family Income in Fort Rucker is $66,471.
What is the Median Household income in Fort Rucker?
Median Household Income in Fort Rucker is $72,681.
What is Income or Wage Gap in Fort Rucker?
Income or Wage Gap in Fort Rucker is 49.6%.
Women in Fort Rucker earn 50.4 cents for every dollar earned by a man.
What is Inequality or Gini Index in Fort Rucker?
Inequality or Gini Index in Fort Rucker is 0.35.
What is the Total Population of Fort Rucker?
Total Population of Fort Rucker is 5,422.
What is the Total Male Population of Fort Rucker?
Total Male Population of Fort Rucker is 2,981.
What is the Total Female Population of Fort Rucker?
Total Female Population of Fort Rucker is 2,441.
What is the Ratio of Males per 100 Females in Fort Rucker?
There are 122.12 Males per 100 Females in Fort Rucker.
What is the Ratio of Females per 100 Males in Fort Rucker?
There are 81.89 Females per 100 Males in Fort Rucker.
What is the Median Population Age in Fort Rucker?
Median Population Age in Fort Rucker is 24.2 Years.
What is the Average Family Size in Fort Rucker
Average Family Size in Fort Rucker is 3.7 People.
What is the Average Household Size in Fort Rucker
Average Household Size in Fort Rucker is 3.4 People.
How Large is the Labor Force in Fort Rucker?
There are 2,558 People in the Labor Forcein in Fort Rucker.
What is the Percentage of People in the Labor Force in Fort Rucker?
74.1% of People are in the Labor Force in Fort Rucker.
What is the Unemployment Rate in Fort Rucker?
Unemployment Rate in Fort Rucker is 16.1%.