Calera, AL Map & Demographics
Calera Map
Calera Overview
$34,165
PER CAPITA INCOME
$85,065
AVG FAMILY INCOME
$73,775
AVG HOUSEHOLD INCOME
25.1%
WAGE / INCOME GAP [ % ]
74.9¢/ $1
WAGE / INCOME GAP [ $ ]
0.36
INEQUALITY / GINI INDEX
16,644
TOTAL POPULATION
7,903
MALE POPULATION
8,741
FEMALE POPULATION
90.41
MALES / 100 FEMALES
110.60
FEMALES / 100 MALES
33.1
MEDIAN AGE
3.1
AVG FAMILY SIZE
2.6
AVG HOUSEHOLD SIZE
9,423
LABOR FORCE [ PEOPLE ]
75.4%
PERCENT IN LABOR FORCE
1.0%
UNEMPLOYMENT RATE
Calera Zip Codes
Calera Area Codes
Income in Calera
Income Overview in Calera
Per Capita Income in Calera is $34,165, while median incomes of families and households are $85,065 and $73,775 respectively.
| Characteristic | Number | Measure |
| Per Capita Income | 16,644 | $34,165 |
| Median Family Income | 4,669 | $85,065 |
| Mean Family Income | 4,669 | $96,238 |
| Median Household Income | 6,299 | $73,775 |
| Mean Household Income | 6,299 | $86,187 |
| Income Deficit | 4,669 | $0 |
| Wage / Income Gap (%) | 16,644 | 25.07% |
| Wage / Income Gap ($) | 16,644 | 74.93¢ per $1 |
| Gini / Inequality Index | 16,644 | 0.36 |
Earnings by Sex in Calera
Average Earnings in Calera are $47,154, $53,520 for men and $40,101 for women, a difference of 25.1%.
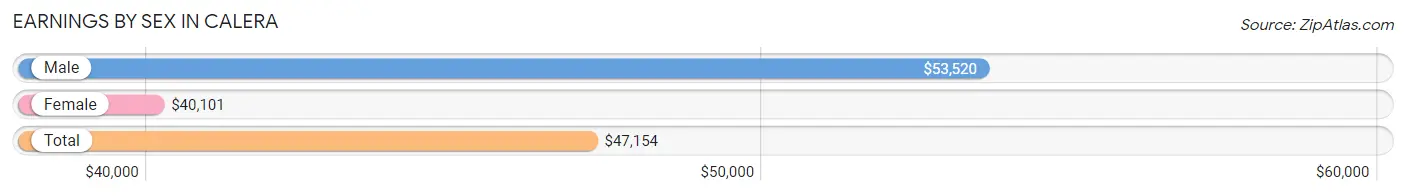
| Sex | Number | Average Earnings |
| Male | 4,986 (51.5%) | $53,520 |
| Female | 4,687 (48.4%) | $40,101 |
| Total | 9,673 (100.0%) | $47,154 |
Earnings by Sex by Income Bracket in Calera
The most common earnings brackets in Calera are $75,000 to $99,999 for men (874 | 17.5%) and $65,000 to $74,999 for women (442 | 9.4%).
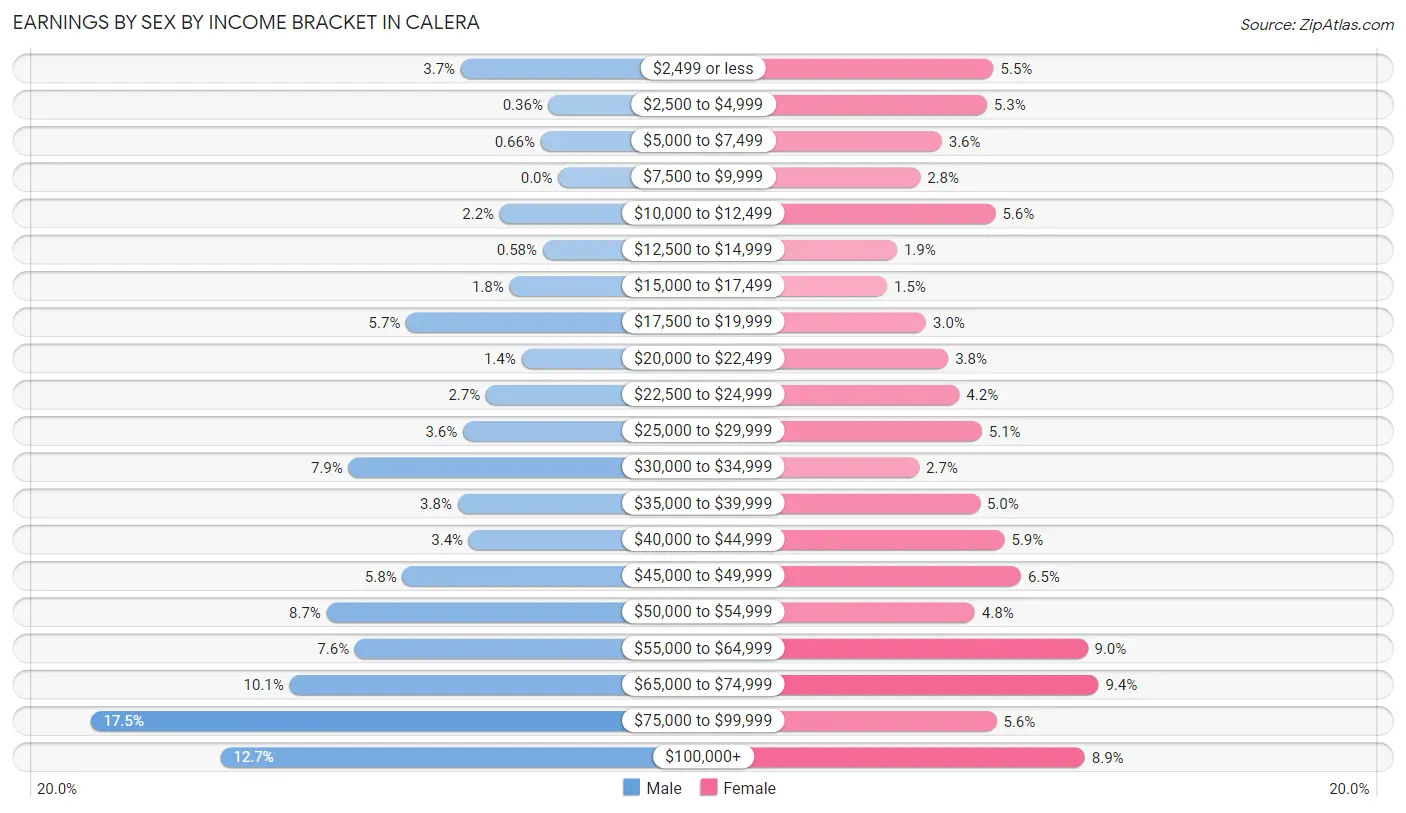
| Income | Male | Female |
| $2,499 or less | 182 (3.6%) | 258 (5.5%) |
| $2,500 to $4,999 | 18 (0.4%) | 246 (5.2%) |
| $5,000 to $7,499 | 33 (0.7%) | 167 (3.6%) |
| $7,500 to $9,999 | 0 (0.0%) | 129 (2.8%) |
| $10,000 to $12,499 | 109 (2.2%) | 261 (5.6%) |
| $12,500 to $14,999 | 29 (0.6%) | 88 (1.9%) |
| $15,000 to $17,499 | 91 (1.8%) | 71 (1.5%) |
| $17,500 to $19,999 | 284 (5.7%) | 139 (3.0%) |
| $20,000 to $22,499 | 69 (1.4%) | 178 (3.8%) |
| $22,500 to $24,999 | 135 (2.7%) | 198 (4.2%) |
| $25,000 to $29,999 | 178 (3.6%) | 237 (5.1%) |
| $30,000 to $34,999 | 392 (7.9%) | 127 (2.7%) |
| $35,000 to $39,999 | 188 (3.8%) | 234 (5.0%) |
| $40,000 to $44,999 | 167 (3.4%) | 277 (5.9%) |
| $45,000 to $49,999 | 291 (5.8%) | 306 (6.5%) |
| $50,000 to $54,999 | 433 (8.7%) | 225 (4.8%) |
| $55,000 to $64,999 | 380 (7.6%) | 423 (9.0%) |
| $65,000 to $74,999 | 502 (10.1%) | 442 (9.4%) |
| $75,000 to $99,999 | 874 (17.5%) | 263 (5.6%) |
| $100,000+ | 631 (12.7%) | 418 (8.9%) |
| Total | 4,986 (100.0%) | 4,687 (100.0%) |
Earnings by Sex by Educational Attainment in Calera
Average earnings in Calera are $58,531 for men and $44,926 for women, a difference of 23.2%. Men with an educational attainment of graduate degree enjoy the highest average annual earnings of $88,750, while those with high school diploma education earn the least with $55,412. Women with an educational attainment of graduate degree earn the most with the average annual earnings of $68,267, while those with less than high school education have the smallest earnings of $17,763.
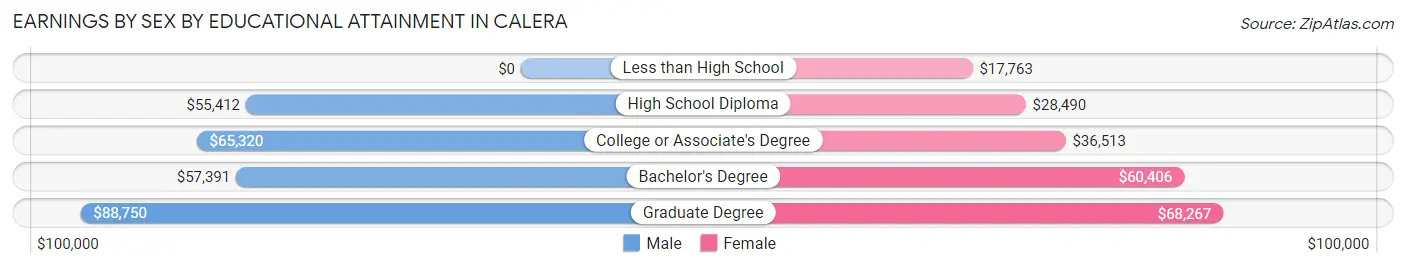
| Educational Attainment | Male Income | Female Income |
| Less than High School | - | - |
| High School Diploma | $55,412 | $28,490 |
| College or Associate's Degree | $65,320 | $36,513 |
| Bachelor's Degree | $57,391 | $60,406 |
| Graduate Degree | $88,750 | $68,267 |
| Total | $58,531 | $44,926 |
Family Income in Calera
Family Income Brackets in Calera
According to the Calera family income data, there are 1,074 families falling into the $50,000 to $74,999 income range, which is the most common income bracket and makes up 23.0% of all families. Conversely, the $15,000 to $24,999 income bracket is the least frequent group with only 42 families (0.9%) belonging to this category.
| Income Bracket | # Families | % Families |
| Less than $10,000 | 159 | 3.4% |
| $10,000 to $14,999 | 79 | 1.7% |
| $15,000 to $24,999 | 42 | 0.9% |
| $25,000 to $34,999 | 215 | 4.6% |
| $35,000 to $49,999 | 448 | 9.6% |
| $50,000 to $74,999 | 1,074 | 23.0% |
| $75,000 to $99,999 | 752 | 16.1% |
| $100,000 to $149,999 | 1,027 | 22.0% |
| $150,000 to $199,999 | 668 | 14.3% |
| $200,000+ | 210 | 4.5% |
Family Income by Famaliy Size in Calera
6-person families (58 | 1.2%) account for the highest median family income in Calera with $152,692 per family, while 2-person families (2,189 | 46.9%) have the highest median income of $36,950 per family member.
| Income Bracket | # Families | Median Income |
| 2-Person Families | 2,189 (46.9%) | $73,899 |
| 3-Person Families | 1,390 (29.8%) | $97,500 |
| 4-Person Families | 672 (14.4%) | $88,688 |
| 5-Person Families | 341 (7.3%) | $111,380 |
| 6-Person Families | 58 (1.2%) | $152,692 |
| 7+ Person Families | 19 (0.4%) | $0 |
| Total | 4,669 (100.0%) | $85,065 |
Family Income by Number of Earners in Calera
The median family income in Calera is $85,065, with families comprising 3+ earners (212) having the highest median family income of $160,064, while families with no earners (315) have the lowest median family income of $43,229, accounting for 4.5% and 6.8% of families, respectively.
| Number of Earners | # Families | Median Income |
| No Earners | 315 (6.8%) | $43,229 |
| 1 Earner | 1,402 (30.0%) | $63,049 |
| 2 Earners | 2,740 (58.7%) | $114,226 |
| 3+ Earners | 212 (4.5%) | $160,064 |
| Total | 4,669 (100.0%) | $85,065 |
Household Income in Calera
Household Income Brackets in Calera
With 1,411 households falling in the category, the $50,000 to $74,999 income range is the most frequent in Calera, accounting for 22.4% of all households. In contrast, only 164 households (2.6%) fall into the $10,000 to $14,999 income bracket, making it the least populous group.
| Income Bracket | # Households | % Households |
| Less than $10,000 | 271 | 4.3% |
| $10,000 to $14,999 | 164 | 2.6% |
| $15,000 to $24,999 | 334 | 5.3% |
| $25,000 to $34,999 | 195 | 3.1% |
| $35,000 to $49,999 | 825 | 13.1% |
| $50,000 to $74,999 | 1,411 | 22.4% |
| $75,000 to $99,999 | 945 | 15.0% |
| $100,000 to $149,999 | 1,216 | 19.3% |
| $150,000 to $199,999 | 718 | 11.4% |
| $200,000+ | 227 | 3.6% |
Household Income by Householder Age in Calera
The median household income in Calera is $73,775, with the highest median household income of $103,542 found in the 45 to 64 years age bracket for the primary householder. A total of 2,068 households (32.8%) fall into this category. Meanwhile, the 65+ years age bracket for the primary householder has the lowest median household income of $43,633, with 930 households (14.8%) in this group.
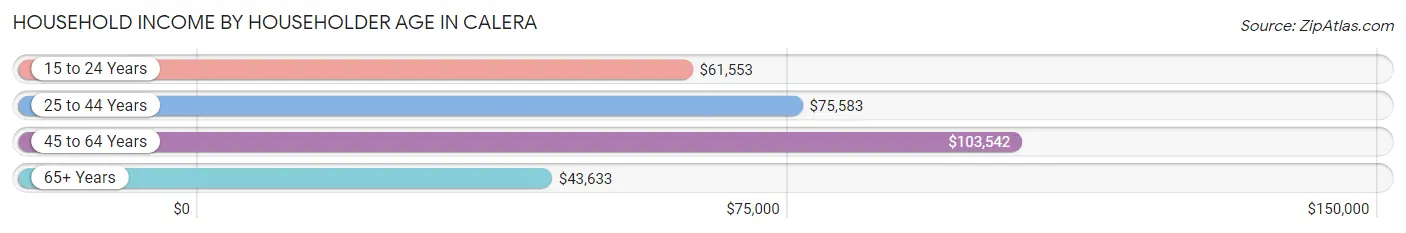
| Income Bracket | # Households | Median Income |
| 15 to 24 Years | 253 (4.0%) | $61,553 |
| 25 to 44 Years | 3,048 (48.4%) | $75,583 |
| 45 to 64 Years | 2,068 (32.8%) | $103,542 |
| 65+ Years | 930 (14.8%) | $43,633 |
| Total | 6,299 (100.0%) | $73,775 |
Poverty in Calera
Income Below Poverty by Sex and Age in Calera
With 7.5% poverty level for males and 9.8% for females among the residents of Calera, 5 year old males and 55 to 64 year old females are the most vulnerable to poverty, with 52 males (29.5%) and 186 females (20.2%) in their respective age groups living below the poverty level.
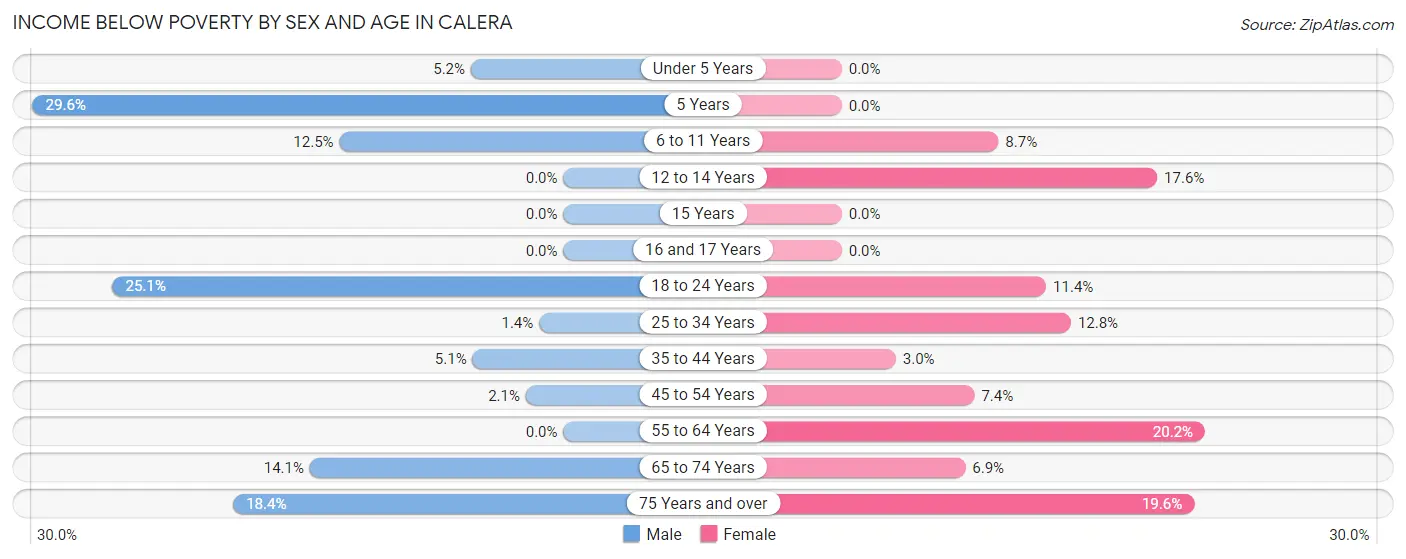
| Age Bracket | Male | Female |
| Under 5 Years | 40 (5.1%) | 0 (0.0%) |
| 5 Years | 52 (29.5%) | 0 (0.0%) |
| 6 to 11 Years | 95 (12.5%) | 91 (8.7%) |
| 12 to 14 Years | 0 (0.0%) | 59 (17.6%) |
| 15 Years | 0 (0.0%) | 0 (0.0%) |
| 16 and 17 Years | 0 (0.0%) | 0 (0.0%) |
| 18 to 24 Years | 191 (25.1%) | 65 (11.4%) |
| 25 to 34 Years | 17 (1.3%) | 229 (12.8%) |
| 35 to 44 Years | 80 (5.1%) | 37 (3.0%) |
| 45 to 54 Years | 23 (2.1%) | 63 (7.4%) |
| 55 to 64 Years | 0 (0.0%) | 186 (20.2%) |
| 65 to 74 Years | 49 (14.1%) | 33 (6.9%) |
| 75 Years and over | 43 (18.4%) | 90 (19.6%) |
| Total | 590 (7.5%) | 853 (9.8%) |
Income Above Poverty by Sex and Age in Calera
According to the poverty statistics in Calera, males aged 12 to 14 years and females aged under 5 years are the age groups that are most secure financially, with 100.0% of males and 100.0% of females in these age groups living above the poverty line.
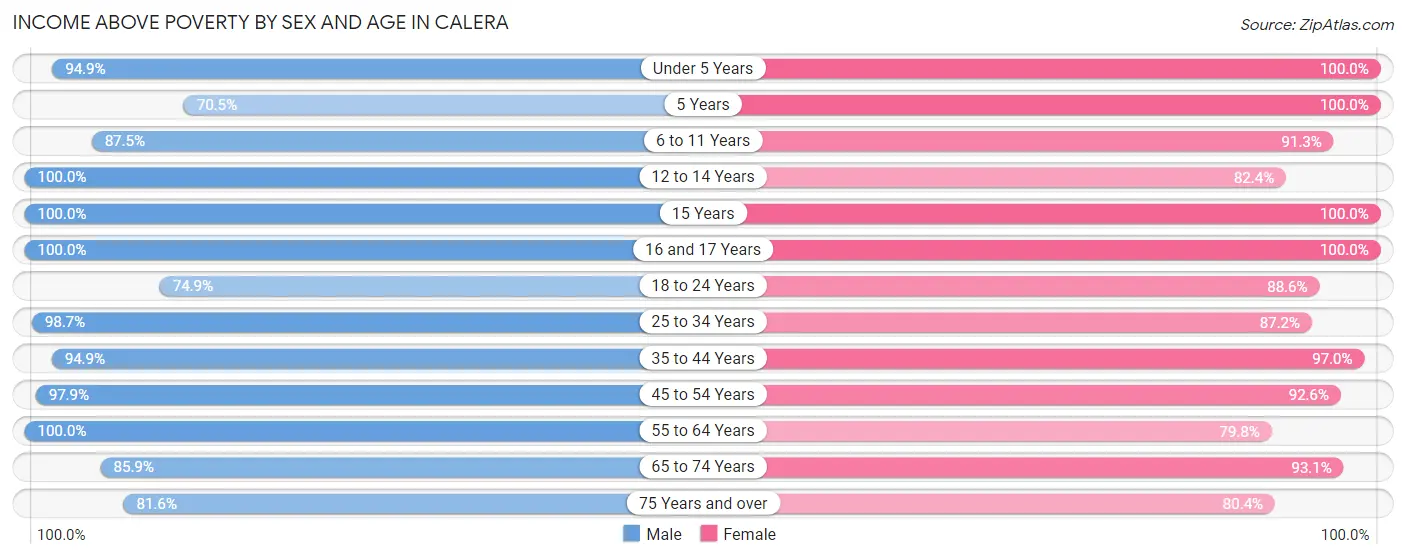
| Age Bracket | Male | Female |
| Under 5 Years | 737 (94.9%) | 585 (100.0%) |
| 5 Years | 124 (70.5%) | 17 (100.0%) |
| 6 to 11 Years | 667 (87.5%) | 953 (91.3%) |
| 12 to 14 Years | 258 (100.0%) | 277 (82.4%) |
| 15 Years | 36 (100.0%) | 145 (100.0%) |
| 16 and 17 Years | 132 (100.0%) | 291 (100.0%) |
| 18 to 24 Years | 570 (74.9%) | 506 (88.6%) |
| 25 to 34 Years | 1,246 (98.7%) | 1,566 (87.2%) |
| 35 to 44 Years | 1,500 (94.9%) | 1,191 (97.0%) |
| 45 to 54 Years | 1,080 (97.9%) | 790 (92.6%) |
| 55 to 64 Years | 474 (100.0%) | 734 (79.8%) |
| 65 to 74 Years | 298 (85.9%) | 447 (93.1%) |
| 75 Years and over | 191 (81.6%) | 369 (80.4%) |
| Total | 7,313 (92.5%) | 7,871 (90.2%) |
Income Below Poverty Among Married-Couple Families in Calera
The poverty statistics for married-couple families in Calera show that 3.1% or 100 of the total 3,237 families live below the poverty line. Families with no children have the highest poverty rate of 3.4%, comprising of 49 families. On the other hand, families with 3 or 4 children have the lowest poverty rate of 0.0%, which includes 0 families.
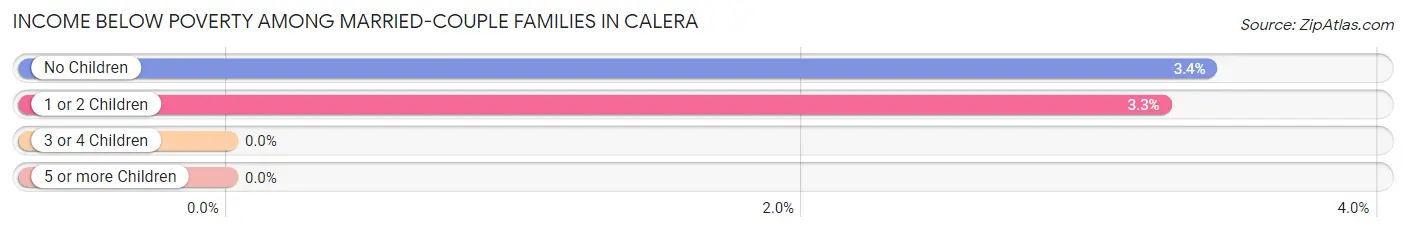
| Children | Above Poverty | Below Poverty |
| No Children | 1,387 (96.6%) | 49 (3.4%) |
| 1 or 2 Children | 1,519 (96.8%) | 51 (3.3%) |
| 3 or 4 Children | 231 (100.0%) | 0 (0.0%) |
| 5 or more Children | 0 (0.0%) | 0 (0.0%) |
| Total | 3,137 (96.9%) | 100 (3.1%) |
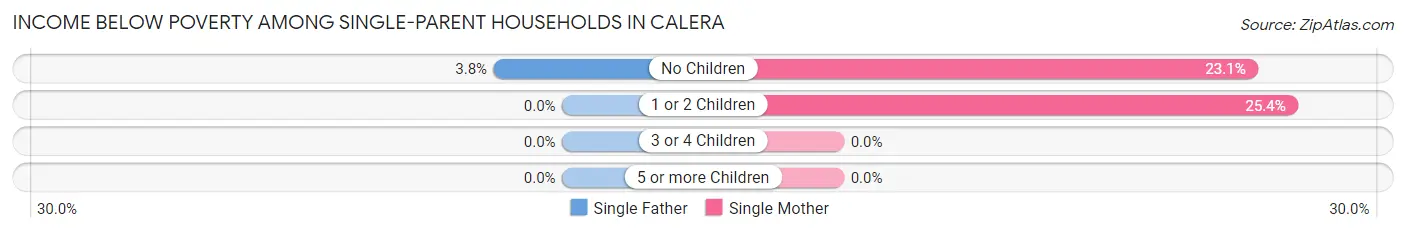
Income Below Poverty Among Single-Parent Households in Calera
According to the poverty data in Calera, 1.9% or 7 single-father households and 20.8% or 220 single-mother households are living below the poverty line. Among single-father households, those with no children have the highest poverty rate, with 7 households (3.8%) experiencing poverty. Likewise, among single-mother households, those with 1 or 2 children have the highest poverty rate, with 140 households (25.4%) falling below the poverty line.
| Children | Single Father | Single Mother |
| No Children | 7 (3.8%) | 80 (23.1%) |
| 1 or 2 Children | 0 (0.0%) | 140 (25.4%) |
| 3 or 4 Children | 0 (0.0%) | 0 (0.0%) |
| 5 or more Children | 0 (0.0%) | 0 (0.0%) |
| Total | 7 (1.9%) | 220 (20.8%) |
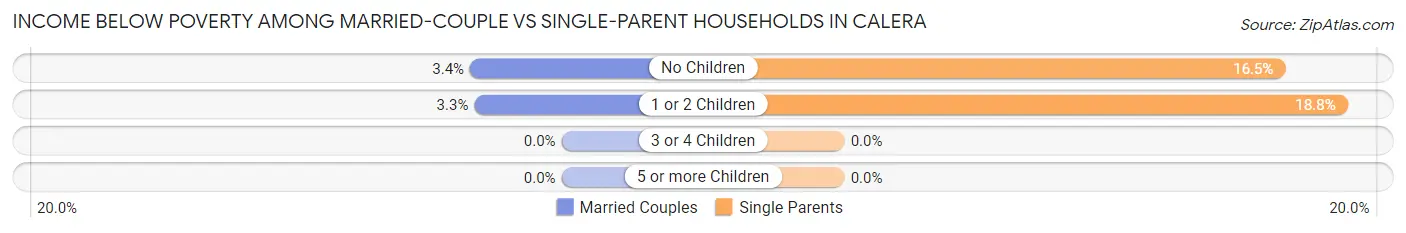
Income Below Poverty Among Married-Couple vs Single-Parent Households in Calera
The poverty data for Calera shows that 100 of the married-couple family households (3.1%) and 227 of the single-parent households (15.9%) are living below the poverty level. Within the married-couple family households, those with no children have the highest poverty rate, with 49 households (3.4%) falling below the poverty line. Among the single-parent households, those with 1 or 2 children have the highest poverty rate, with 140 household (18.8%) living below poverty.
| Children | Married-Couple Families | Single-Parent Households |
| No Children | 49 (3.4%) | 87 (16.5%) |
| 1 or 2 Children | 51 (3.3%) | 140 (18.8%) |
| 3 or 4 Children | 0 (0.0%) | 0 (0.0%) |
| 5 or more Children | 0 (0.0%) | 0 (0.0%) |
| Total | 100 (3.1%) | 227 (15.9%) |
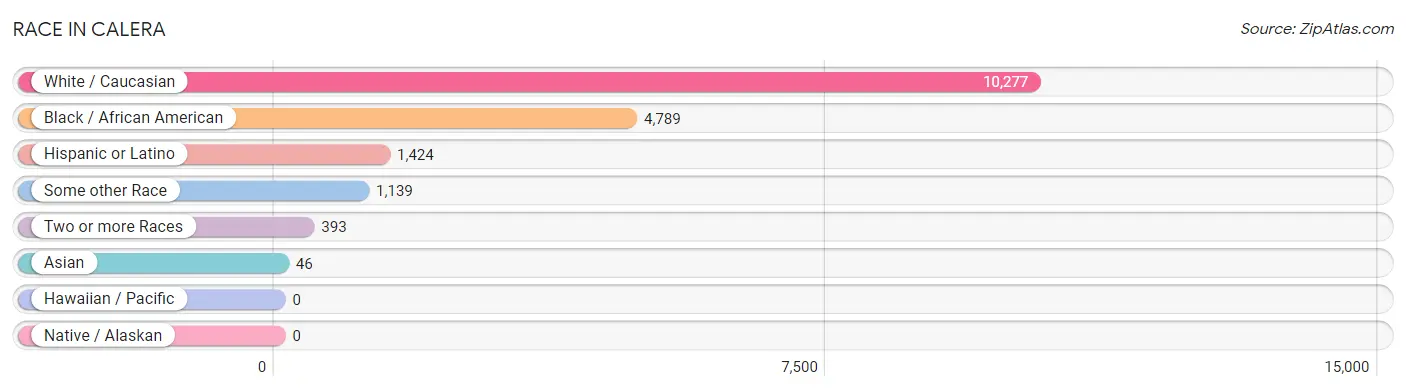
Race in Calera
The most populous races in Calera are White / Caucasian (10,277 | 61.8%), Black / African American (4,789 | 28.8%), and Hispanic or Latino (1,424 | 8.6%).
| Race | # Population | % Population |
| Asian | 46 | 0.3% |
| Black / African American | 4,789 | 28.8% |
| Hawaiian / Pacific | 0 | 0.0% |
| Hispanic or Latino | 1,424 | 8.6% |
| Native / Alaskan | 0 | 0.0% |
| White / Caucasian | 10,277 | 61.8% |
| Two or more Races | 393 | 2.4% |
| Some other Race | 1,139 | 6.8% |
| Total | 16,644 | 100.0% |
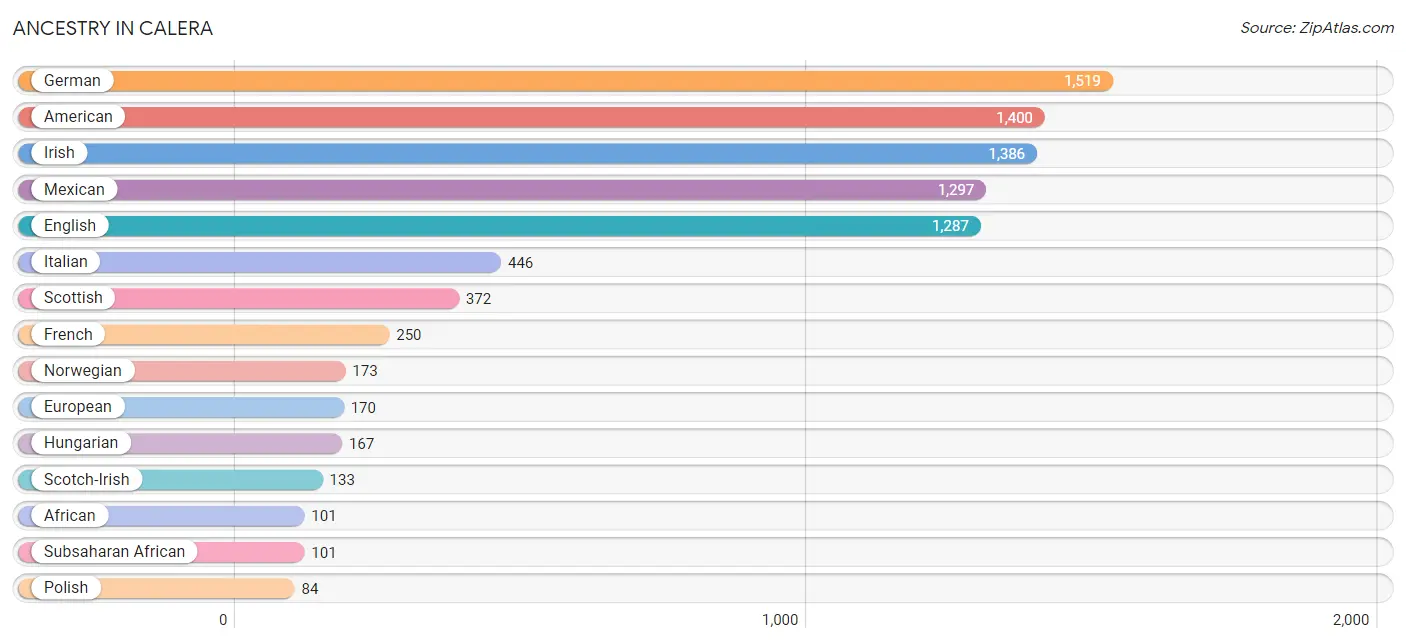
Ancestry in Calera
The most populous ancestries reported in Calera are German (1,519 | 9.1%), American (1,400 | 8.4%), Irish (1,386 | 8.3%), Mexican (1,297 | 7.8%), and English (1,287 | 7.7%), together accounting for 41.4% of all Calera residents.
| Ancestry | # Population | % Population |
| African | 101 | 0.6% |
| American | 1,400 | 8.4% |
| Arab | 22 | 0.1% |
| Bhutanese | 64 | 0.4% |
| British | 79 | 0.5% |
| Burmese | 75 | 0.4% |
| Central American | 60 | 0.4% |
| Cherokee | 12 | 0.1% |
| Colombian | 4 | 0.0% |
| Cuban | 16 | 0.1% |
| Danish | 15 | 0.1% |
| Dutch | 22 | 0.1% |
| Eastern European | 8 | 0.1% |
| Ecuadorian | 14 | 0.1% |
| Egyptian | 22 | 0.1% |
| English | 1,287 | 7.7% |
| European | 170 | 1.0% |
| French | 250 | 1.5% |
| German | 1,519 | 9.1% |
| Guatemalan | 60 | 0.4% |
| Hungarian | 167 | 1.0% |
| Irish | 1,386 | 8.3% |
| Italian | 446 | 2.7% |
| Korean | 37 | 0.2% |
| Lithuanian | 6 | 0.0% |
| Mexican | 1,297 | 7.8% |
| Northern European | 30 | 0.2% |
| Norwegian | 173 | 1.0% |
| Polish | 84 | 0.5% |
| Puerto Rican | 14 | 0.1% |
| Russian | 33 | 0.2% |
| Scandinavian | 26 | 0.2% |
| Scotch-Irish | 133 | 0.8% |
| Scottish | 372 | 2.2% |
| South American | 18 | 0.1% |
| Spanish | 19 | 0.1% |
| Subsaharan African | 101 | 0.6% |
| Swedish | 77 | 0.5% |
| Swiss | 12 | 0.1% |
| Welsh | 66 | 0.4% | View All 40 Rows |
Immigrants in Calera
The most numerous immigrant groups reported in Calera came from Latin America (630 | 3.8%), Central America (616 | 3.7%), Mexico (616 | 3.7%), Asia (50 | 0.3%), and Europe (27 | 0.2%), together accounting for 11.7% of all Calera residents.
| Immigration Origin | # Population | % Population |
| Africa | 11 | 0.1% |
| Asia | 50 | 0.3% |
| Austria | 16 | 0.1% |
| Central America | 616 | 3.7% |
| Eastern Asia | 24 | 0.1% |
| Ecuador | 14 | 0.1% |
| Egypt | 11 | 0.1% |
| England | 11 | 0.1% |
| Europe | 27 | 0.2% |
| Japan | 15 | 0.1% |
| Korea | 9 | 0.1% |
| Latin America | 630 | 3.8% |
| Mexico | 616 | 3.7% |
| Northern Africa | 11 | 0.1% |
| Northern Europe | 11 | 0.1% |
| Philippines | 26 | 0.2% |
| South America | 14 | 0.1% |
| South Eastern Asia | 26 | 0.2% |
| Western Europe | 16 | 0.1% | View All 19 Rows |
Sex and Age in Calera
Sex and Age in Calera
The most populous age groups in Calera are 40 to 44 Years (873 | 11.1%) for men and 30 to 34 Years (1,069 | 12.2%) for women.
| Age Bracket | Male | Female |
| Under 5 Years | 777 (9.8%) | 585 (6.7%) |
| 5 to 9 Years | 679 (8.6%) | 662 (7.6%) |
| 10 to 14 Years | 517 (6.5%) | 746 (8.5%) |
| 15 to 19 Years | 359 (4.5%) | 555 (6.4%) |
| 20 to 24 Years | 570 (7.2%) | 452 (5.2%) |
| 25 to 29 Years | 570 (7.2%) | 726 (8.3%) |
| 30 to 34 Years | 693 (8.8%) | 1,069 (12.2%) |
| 35 to 39 Years | 707 (8.9%) | 608 (7.0%) |
| 40 to 44 Years | 873 (11.1%) | 626 (7.2%) |
| 45 to 49 Years | 859 (10.9%) | 568 (6.5%) |
| 50 to 54 Years | 244 (3.1%) | 285 (3.3%) |
| 55 to 59 Years | 294 (3.7%) | 516 (5.9%) |
| 60 to 64 Years | 180 (2.3%) | 404 (4.6%) |
| 65 to 69 Years | 211 (2.7%) | 303 (3.5%) |
| 70 to 74 Years | 136 (1.7%) | 177 (2.0%) |
| 75 to 79 Years | 95 (1.2%) | 116 (1.3%) |
| 80 to 84 Years | 69 (0.9%) | 257 (2.9%) |
| 85 Years and over | 70 (0.9%) | 86 (1.0%) |
| Total | 7,903 (100.0%) | 8,741 (100.0%) |
Families and Households in Calera
Median Family Size in Calera
The median family size in Calera is 3.09 persons per family, with married-couple families (3,237 | 69.3%) accounting for the largest median family size of 3.27 persons per family. On the other hand, single male/father families (377 | 8.1%) represent the smallest median family size with 2.66 persons per family.
| Family Type | # Families | Family Size |
| Married-Couple | 3,237 (69.3%) | 3.27 |
| Single Male/Father | 377 (8.1%) | 2.66 |
| Single Female/Mother | 1,055 (22.6%) | 2.71 |
| Total Families | 4,669 (100.0%) | 3.09 |
Median Household Size in Calera
The median household size in Calera is 2.64 persons per household, with married-couple households (3,237 | 51.4%) accounting for the largest median household size of 3.27 persons per household. non-family households (1,630 | 25.9%) represent the smallest median household size with 1.24 persons per household.
| Household Type | # Households | Household Size |
| Married-Couple | 3,237 (51.4%) | 3.27 |
| Single Male/Father | 377 (6.0%) | 2.90 |
| Single Female/Mother | 1,055 (16.8%) | 2.76 |
| Non-family | 1,630 (25.9%) | 1.24 |
| Total Households | 6,299 (100.0%) | 2.64 |
Household Size by Marriage Status in Calera
Out of a total of 6,299 households in Calera, 4,669 (74.1%) are family households, while 1,630 (25.9%) are nonfamily households. The most numerous type of family households are 2-person households, comprising 2,122, and the most common type of nonfamily households are 1-person households, comprising 1,307.
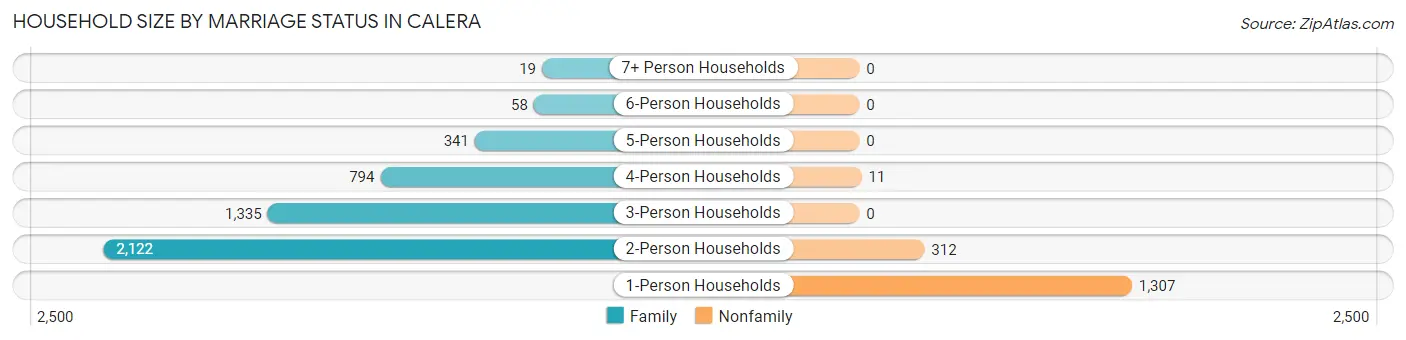
| Household Size | Family Households | Nonfamily Households |
| 1-Person Households | - | 1,307 (20.7%) |
| 2-Person Households | 2,122 (33.7%) | 312 (5.0%) |
| 3-Person Households | 1,335 (21.2%) | 0 (0.0%) |
| 4-Person Households | 794 (12.6%) | 11 (0.2%) |
| 5-Person Households | 341 (5.4%) | 0 (0.0%) |
| 6-Person Households | 58 (0.9%) | 0 (0.0%) |
| 7+ Person Households | 19 (0.3%) | 0 (0.0%) |
| Total | 4,669 (74.1%) | 1,630 (25.9%) |
Female Fertility in Calera
Fertility by Age in Calera
Average fertility rate in Calera is 49.0 births per 1,000 women. Women in the age bracket of 20 to 34 years have the highest fertility rate with 61.0 births per 1,000 women. Women in the age bracket of 20 to 34 years acount for 60.8% of all women with births.
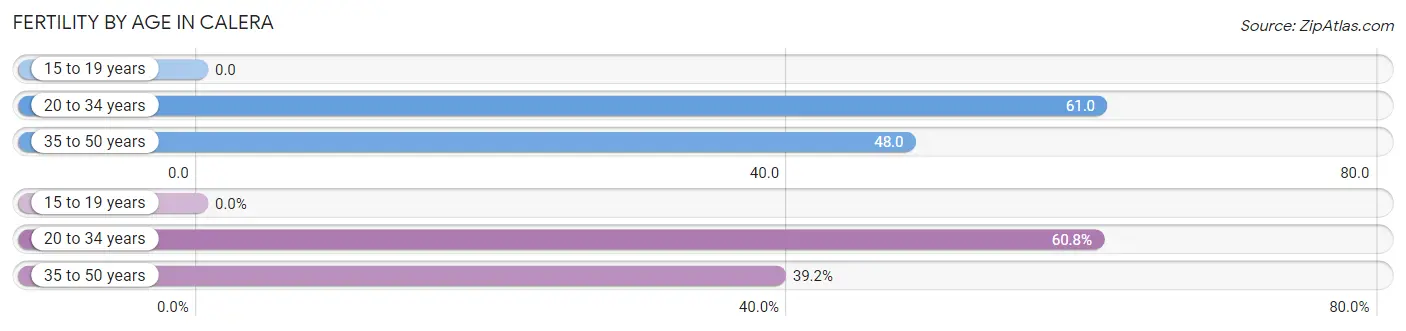
| Age Bracket | Women with Births | Births / 1,000 Women |
| 15 to 19 years | 0 (0.0%) | 0.0 |
| 20 to 34 years | 138 (60.8%) | 61.0 |
| 35 to 50 years | 89 (39.2%) | 48.0 |
| Total | 227 (100.0%) | 49.0 |
Fertility by Age by Marriage Status in Calera
63.9% of women with births (227) in Calera are married. The highest percentage of unmarried women with births falls into 20 to 34 years age bracket with 55.1% of them unmarried at the time of birth, while the lowest percentage of unmarried women with births belong to 35 to 50 years age bracket with 6.7% of them unmarried.
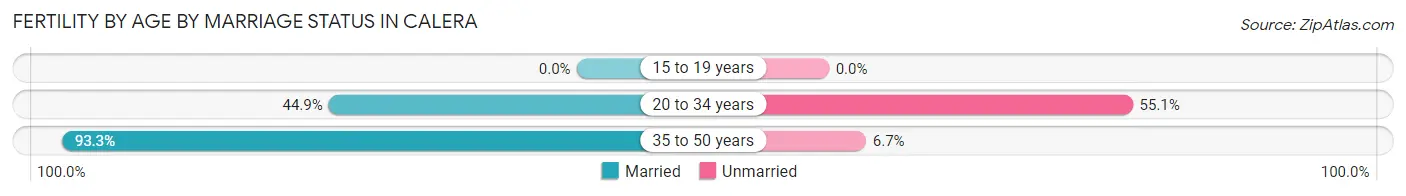
| Age Bracket | Married | Unmarried |
| 15 to 19 years | 0 (0.0%) | 0 (0.0%) |
| 20 to 34 years | 62 (44.9%) | 76 (55.1%) |
| 35 to 50 years | 83 (93.3%) | 6 (6.7%) |
| Total | 145 (63.9%) | 82 (36.1%) |
Fertility by Education in Calera
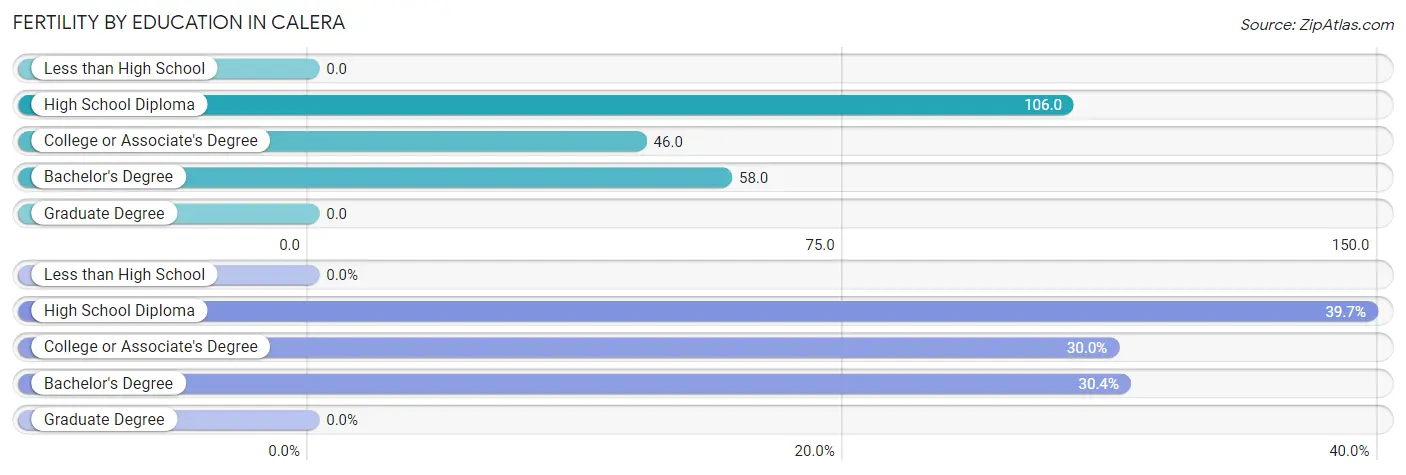
| Educational Attainment | Women with Births | Births / 1,000 Women |
| Less than High School | 0 (0.0%) | 0.0 |
| High School Diploma | 90 (39.7%) | 106.0 |
| College or Associate's Degree | 68 (30.0%) | 46.0 |
| Bachelor's Degree | 69 (30.4%) | 58.0 |
| Graduate Degree | 0 (0.0%) | 0.0 |
| Total | 227 (100.0%) | 49.0 |
Fertility by Education by Marriage Status in Calera
36.1% of women with births in Calera are unmarried. Women with the educational attainment of bachelor's degree are most likely to be married with 78.3% of them married at childbirth, while women with the educational attainment of high school diploma are least likely to be married with 48.9% of them unmarried at childbirth.
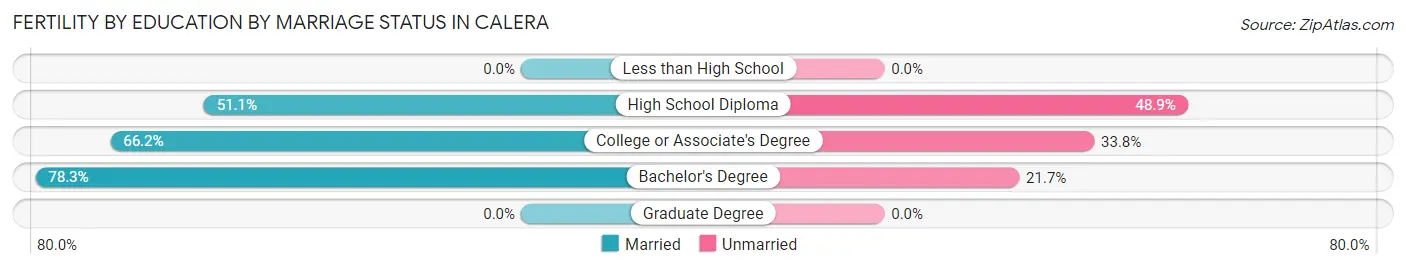
| Educational Attainment | Married | Unmarried |
| Less than High School | 0 (0.0%) | 0 (0.0%) |
| High School Diploma | 46 (51.1%) | 44 (48.9%) |
| College or Associate's Degree | 45 (66.2%) | 23 (33.8%) |
| Bachelor's Degree | 54 (78.3%) | 15 (21.7%) |
| Graduate Degree | 0 (0.0%) | 0 (0.0%) |
| Total | 145 (63.9%) | 82 (36.1%) |
Employment Characteristics in Calera
Employment by Class of Employer in Calera
Among the 9,301 employed individuals in Calera, private company employees (6,450 | 69.4%), not-for-profit organizations (1,036 | 11.1%), and local government employees (727 | 7.8%) make up the most common classes of employment.
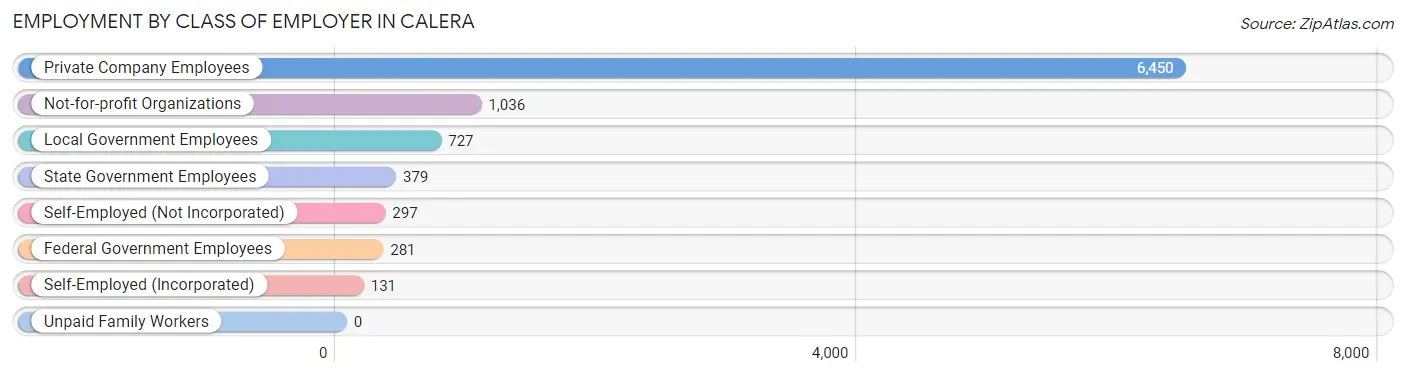
| Employer Class | # Employees | % Employees |
| Private Company Employees | 6,450 | 69.4% |
| Self-Employed (Incorporated) | 131 | 1.4% |
| Self-Employed (Not Incorporated) | 297 | 3.2% |
| Not-for-profit Organizations | 1,036 | 11.1% |
| Local Government Employees | 727 | 7.8% |
| State Government Employees | 379 | 4.1% |
| Federal Government Employees | 281 | 3.0% |
| Unpaid Family Workers | 0 | 0.0% |
| Total | 9,301 | 100.0% |
Employment Status by Age in Calera
According to the labor force statistics for Calera, out of the total population over 16 years of age (12,497), 75.4% or 9,423 individuals are in the labor force, with 1.0% or 94 of them unemployed. The age group with the highest labor force participation rate is 30 to 34 years, with 93.5% or 1,647 individuals in the labor force. Within the labor force, the 20 to 24 years age range has the highest percentage of unemployed individuals, with 7.0% or 53 of them being unemployed.
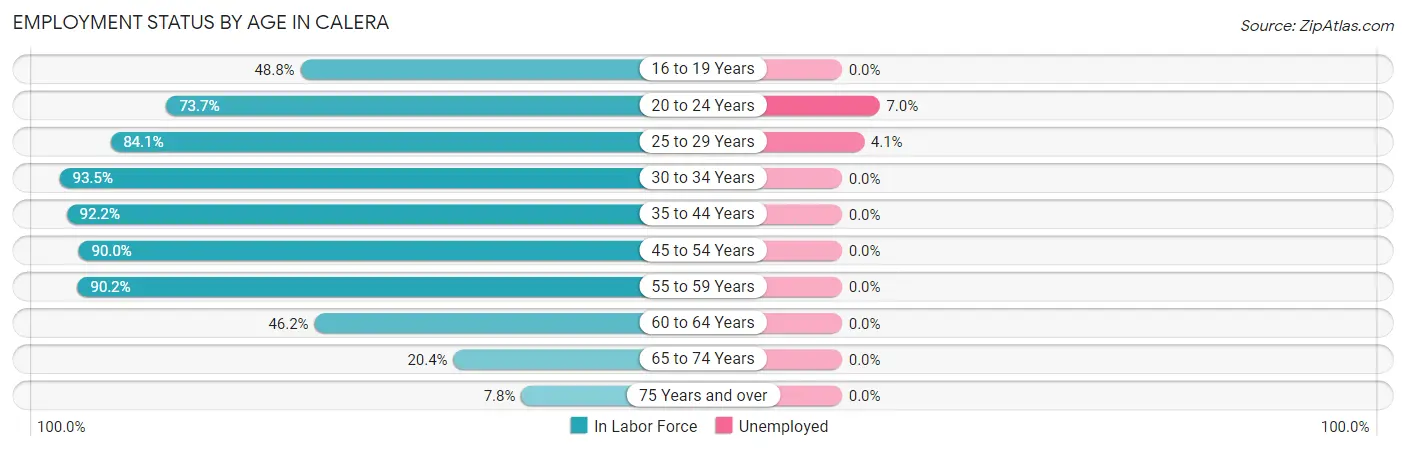
| Age Bracket | In Labor Force | Unemployed |
| 16 to 19 Years | 358 (48.8%) | 0 (0.0%) |
| 20 to 24 Years | 753 (73.7%) | 53 (7.0%) |
| 25 to 29 Years | 1,090 (84.1%) | 45 (4.1%) |
| 30 to 34 Years | 1,647 (93.5%) | 0 (0.0%) |
| 35 to 44 Years | 2,595 (92.2%) | 0 (0.0%) |
| 45 to 54 Years | 1,760 (90.0%) | 0 (0.0%) |
| 55 to 59 Years | 731 (90.2%) | 0 (0.0%) |
| 60 to 64 Years | 270 (46.2%) | 0 (0.0%) |
| 65 to 74 Years | 169 (20.4%) | 0 (0.0%) |
| 75 Years and over | 54 (7.8%) | 0 (0.0%) |
| Total | 9,423 (75.4%) | 94 (1.0%) |
Employment Status by Educational Attainment in Calera
According to labor force statistics for Calera, 87.8% of individuals (8,097) out of the total population between 25 and 64 years of age (9,222) are in the labor force, with 0.6% or 49 of them being unemployed. The group with the highest labor force participation rate are those with the educational attainment of bachelor's degree or higher, with 96.1% or 3,413 individuals in the labor force. Within the labor force, individuals with bachelor's degree or higher education have the highest percentage of unemployment, with 1.3% or 44 of them being unemployed.
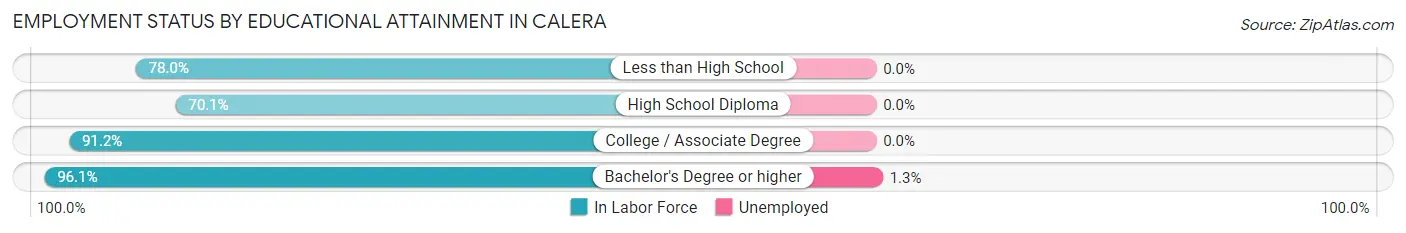
| Educational Attainment | In Labor Force | Unemployed |
| Less than High School | 365 (78.0%) | 0 (0.0%) |
| High School Diploma | 1,429 (70.1%) | 0 (0.0%) |
| College / Associate Degree | 2,886 (91.2%) | 0 (0.0%) |
| Bachelor's Degree or higher | 3,413 (96.1%) | 46 (1.3%) |
| Total | 8,097 (87.8%) | 55 (0.6%) |
Employment Occupations by Sex in Calera
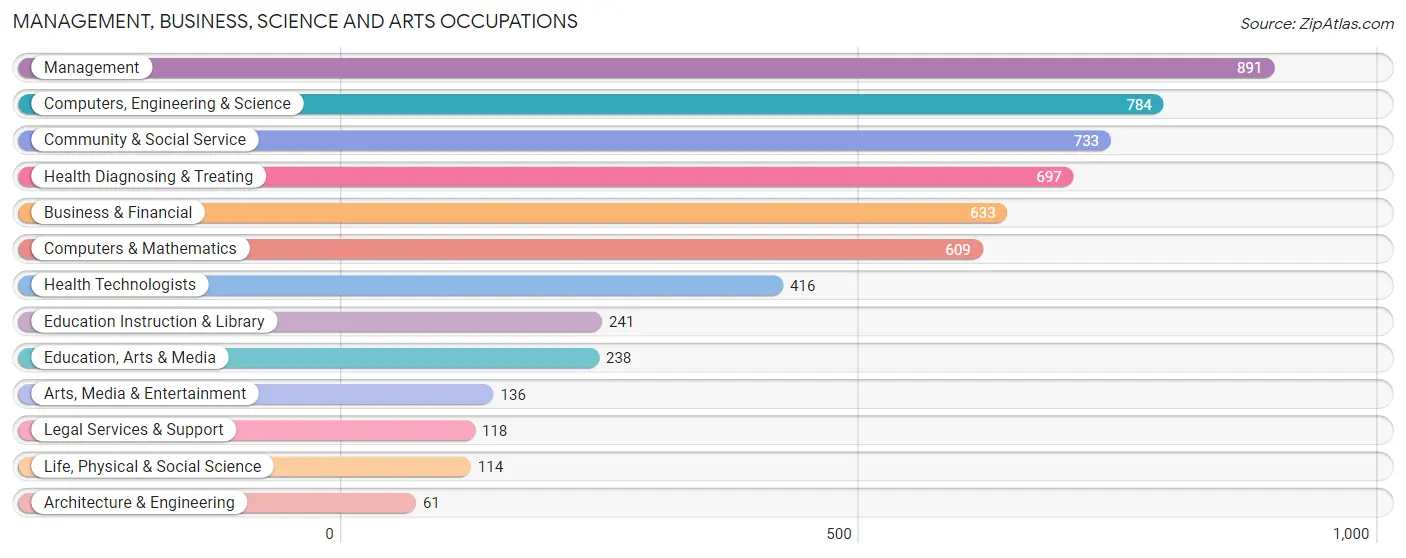
Management, Business, Science and Arts Occupations
The most common Management, Business, Science and Arts occupations in Calera are Management (891 | 9.6%), Computers, Engineering & Science (784 | 8.4%), Community & Social Service (733 | 7.9%), Health Diagnosing & Treating (697 | 7.5%), and Business & Financial (633 | 6.8%).
Management, Business, Science and Arts Occupations by Sex
Within the Management, Business, Science and Arts occupations in Calera, the most male-oriented occupations are Life, Physical & Social Science (92.1%), Management (63.1%), and Education, Arts & Media (48.3%), while the most female-oriented occupations are Education Instruction & Library (90.5%), Health Technologists (89.4%), and Legal Services & Support (81.4%).
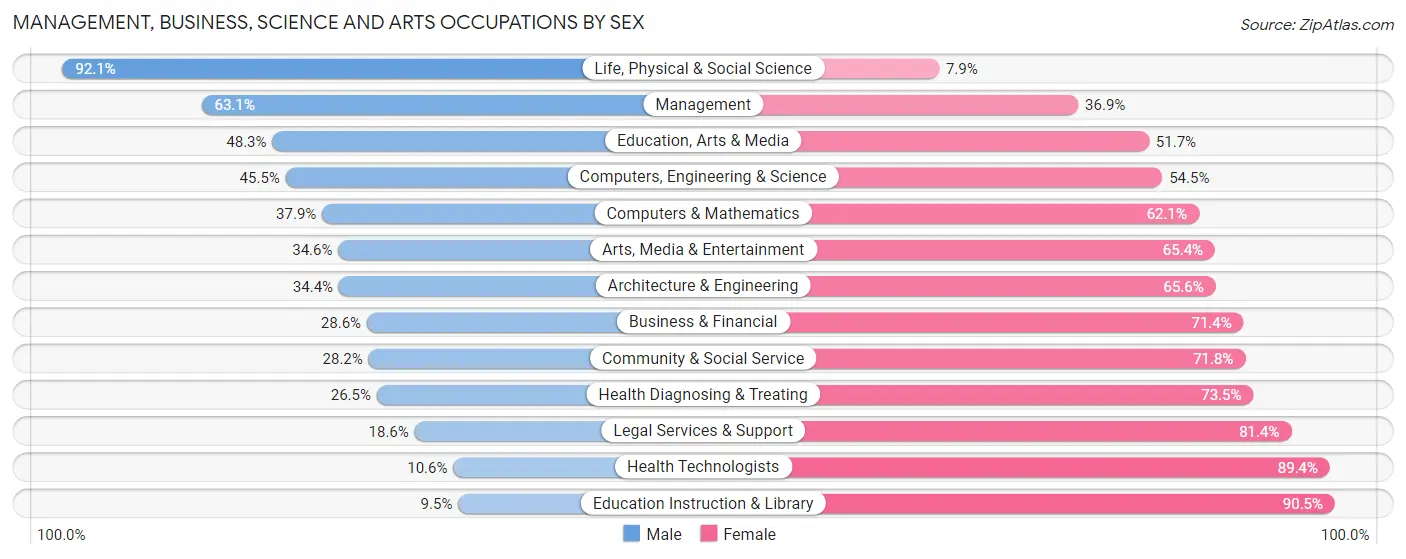
| Occupation | Male | Female |
| Management | 562 (63.1%) | 329 (36.9%) |
| Business & Financial | 181 (28.6%) | 452 (71.4%) |
| Computers, Engineering & Science | 357 (45.5%) | 427 (54.5%) |
| Computers & Mathematics | 231 (37.9%) | 378 (62.1%) |
| Architecture & Engineering | 21 (34.4%) | 40 (65.6%) |
| Life, Physical & Social Science | 105 (92.1%) | 9 (7.9%) |
| Community & Social Service | 207 (28.2%) | 526 (71.8%) |
| Education, Arts & Media | 115 (48.3%) | 123 (51.7%) |
| Legal Services & Support | 22 (18.6%) | 96 (81.4%) |
| Education Instruction & Library | 23 (9.5%) | 218 (90.5%) |
| Arts, Media & Entertainment | 47 (34.6%) | 89 (65.4%) |
| Health Diagnosing & Treating | 185 (26.5%) | 512 (73.5%) |
| Health Technologists | 44 (10.6%) | 372 (89.4%) |
| Total (Category) | 1,492 (39.9%) | 2,246 (60.1%) |
| Total (Overall) | 4,827 (51.8%) | 4,487 (48.2%) |
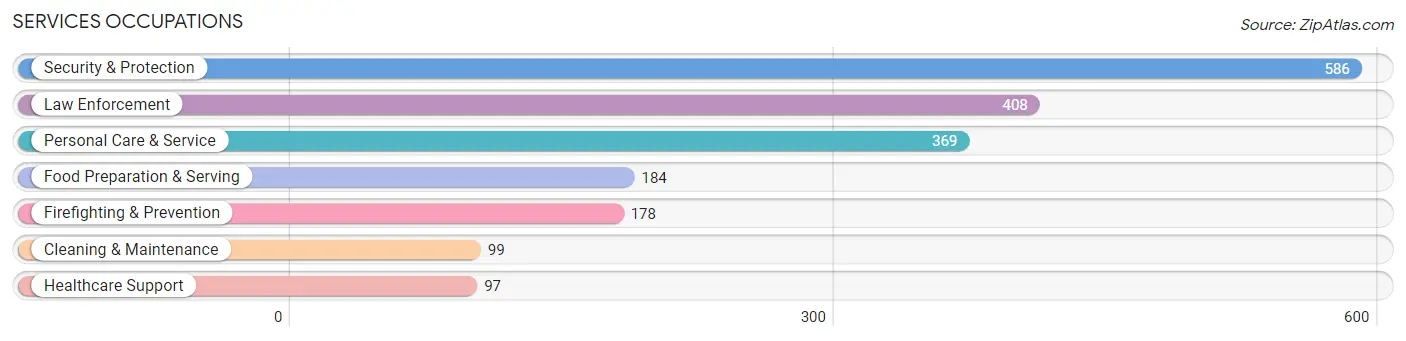
Services Occupations
The most common Services occupations in Calera are Security & Protection (586 | 6.3%), Law Enforcement (408 | 4.4%), Personal Care & Service (369 | 4.0%), Food Preparation & Serving (184 | 2.0%), and Firefighting & Prevention (178 | 1.9%).
Services Occupations by Sex
Within the Services occupations in Calera, the most male-oriented occupations are Firefighting & Prevention (100.0%), Security & Protection (92.3%), and Law Enforcement (89.0%), while the most female-oriented occupations are Healthcare Support (100.0%), Personal Care & Service (92.4%), and Food Preparation & Serving (78.3%).
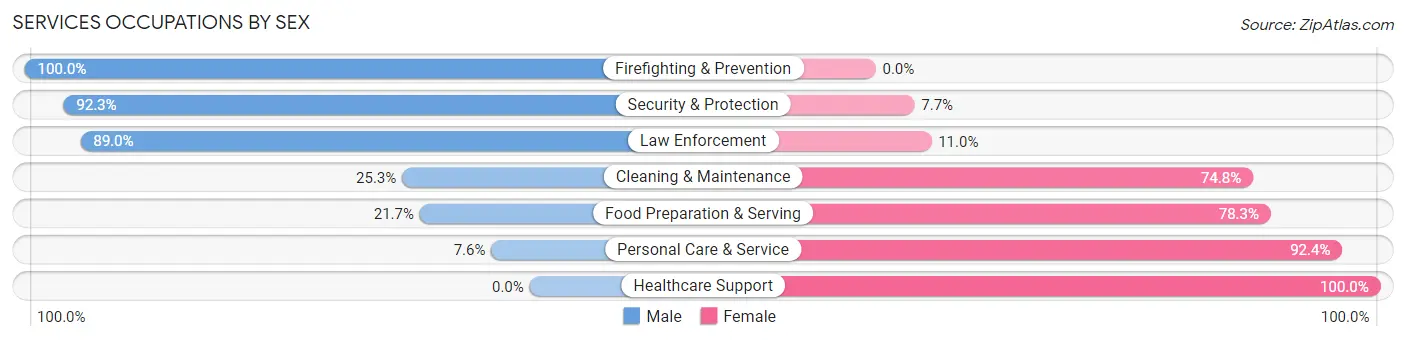
| Occupation | Male | Female |
| Healthcare Support | 0 (0.0%) | 97 (100.0%) |
| Security & Protection | 541 (92.3%) | 45 (7.7%) |
| Firefighting & Prevention | 178 (100.0%) | 0 (0.0%) |
| Law Enforcement | 363 (89.0%) | 45 (11.0%) |
| Food Preparation & Serving | 40 (21.7%) | 144 (78.3%) |
| Cleaning & Maintenance | 25 (25.3%) | 74 (74.8%) |
| Personal Care & Service | 28 (7.6%) | 341 (92.4%) |
| Total (Category) | 634 (47.5%) | 701 (52.5%) |
| Total (Overall) | 4,827 (51.8%) | 4,487 (48.2%) |
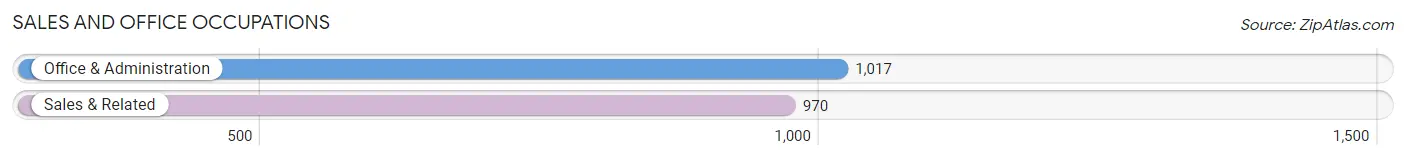
Sales and Office Occupations
The most common Sales and Office occupations in Calera are Office & Administration (1,017 | 10.9%), and Sales & Related (970 | 10.4%).
Sales and Office Occupations by Sex
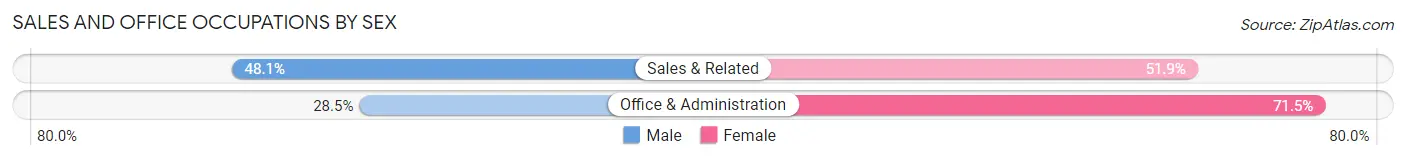
| Occupation | Male | Female |
| Sales & Related | 467 (48.1%) | 503 (51.9%) |
| Office & Administration | 290 (28.5%) | 727 (71.5%) |
| Total (Category) | 757 (38.1%) | 1,230 (61.9%) |
| Total (Overall) | 4,827 (51.8%) | 4,487 (48.2%) |
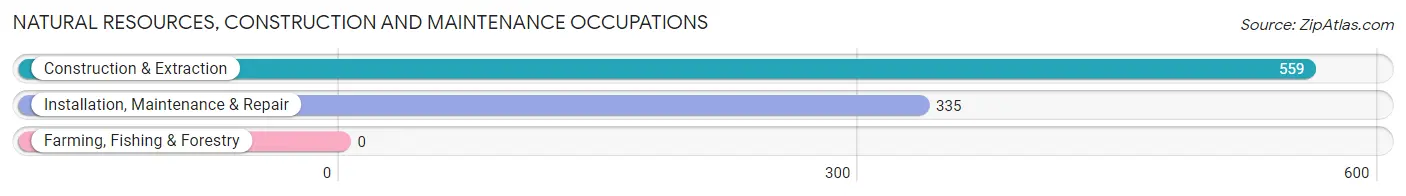
Natural Resources, Construction and Maintenance Occupations
The most common Natural Resources, Construction and Maintenance occupations in Calera are Construction & Extraction (559 | 6.0%), and Installation, Maintenance & Repair (335 | 3.6%).
Natural Resources, Construction and Maintenance Occupations by Sex
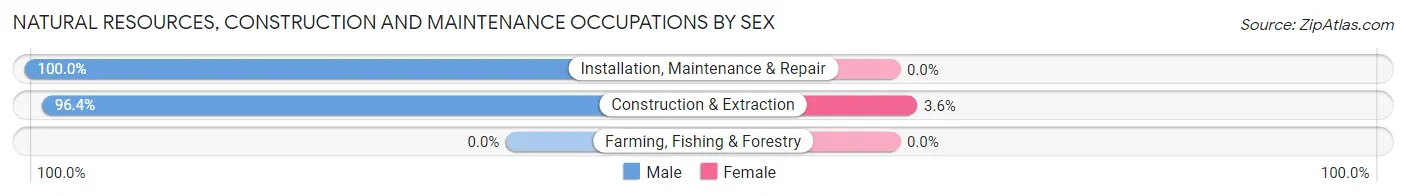
| Occupation | Male | Female |
| Farming, Fishing & Forestry | 0 (0.0%) | 0 (0.0%) |
| Construction & Extraction | 539 (96.4%) | 20 (3.6%) |
| Installation, Maintenance & Repair | 335 (100.0%) | 0 (0.0%) |
| Total (Category) | 874 (97.8%) | 20 (2.2%) |
| Total (Overall) | 4,827 (51.8%) | 4,487 (48.2%) |
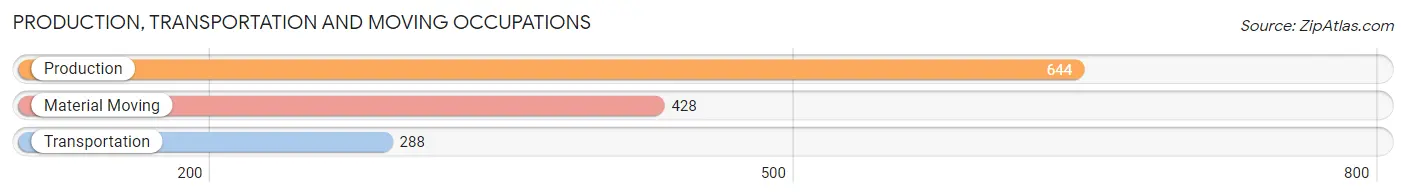
Production, Transportation and Moving Occupations
The most common Production, Transportation and Moving occupations in Calera are Production (644 | 6.9%), Material Moving (428 | 4.6%), and Transportation (288 | 3.1%).
Production, Transportation and Moving Occupations by Sex
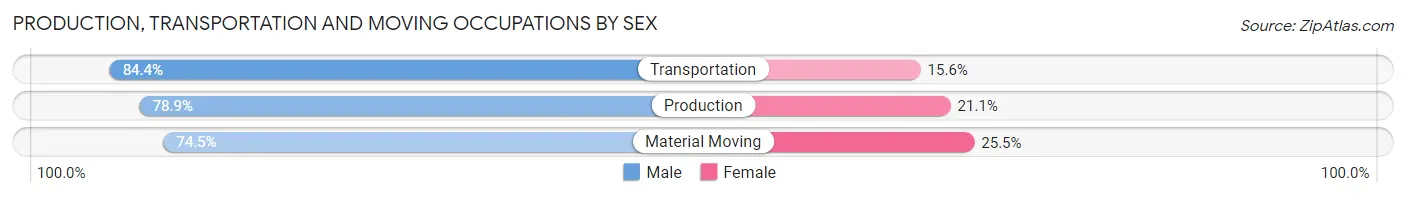
| Occupation | Male | Female |
| Production | 508 (78.9%) | 136 (21.1%) |
| Transportation | 243 (84.4%) | 45 (15.6%) |
| Material Moving | 319 (74.5%) | 109 (25.5%) |
| Total (Category) | 1,070 (78.7%) | 290 (21.3%) |
| Total (Overall) | 4,827 (51.8%) | 4,487 (48.2%) |
Employment Industries by Sex in Calera
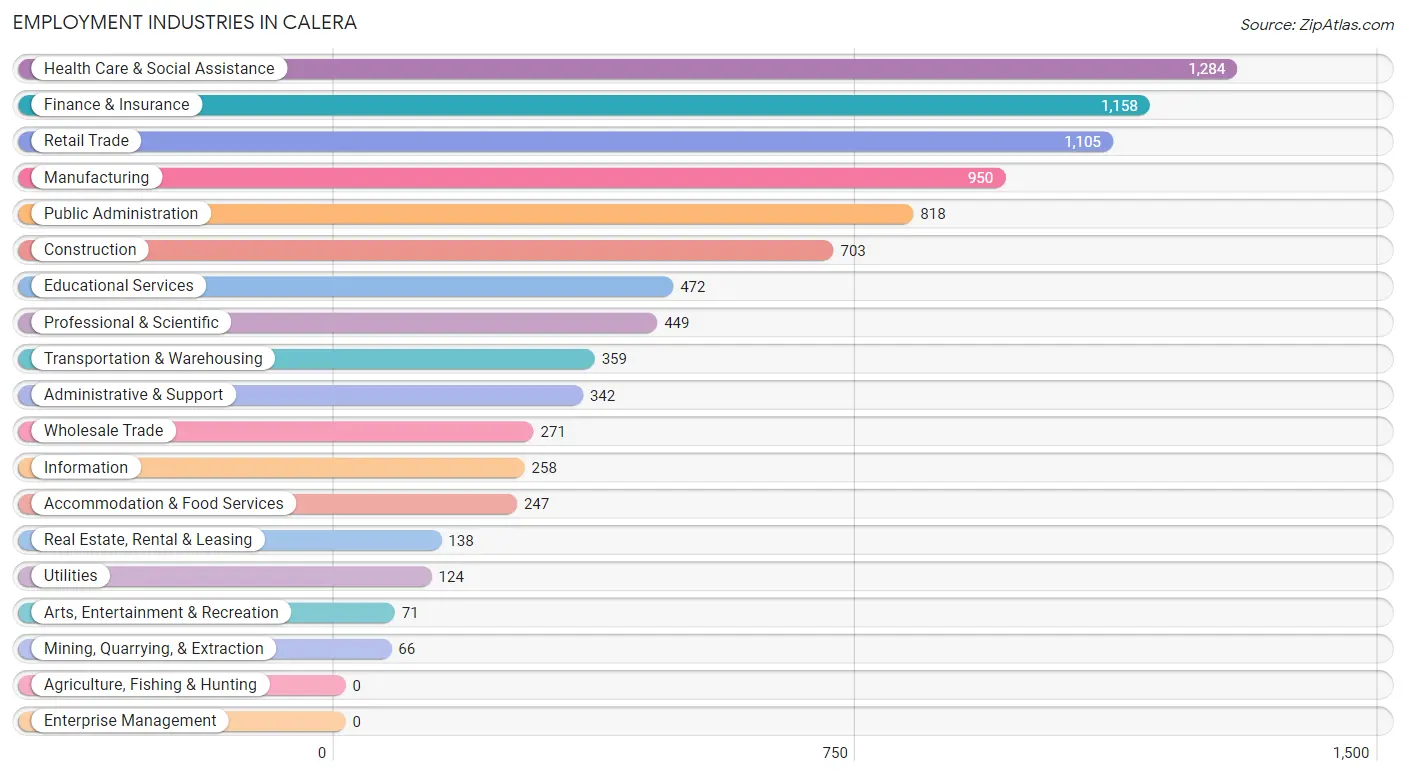
Employment Industries in Calera
The major employment industries in Calera include Health Care & Social Assistance (1,284 | 13.8%), Finance & Insurance (1,158 | 12.4%), Retail Trade (1,105 | 11.9%), Manufacturing (950 | 10.2%), and Public Administration (818 | 8.8%).
Employment Industries by Sex in Calera
The Calera industries that see more men than women are Mining, Quarrying, & Extraction (100.0%), Transportation & Warehousing (100.0%), and Construction (92.9%), whereas the industries that tend to have a higher number of women are Health Care & Social Assistance (82.8%), Educational Services (74.6%), and Finance & Insurance (69.3%).
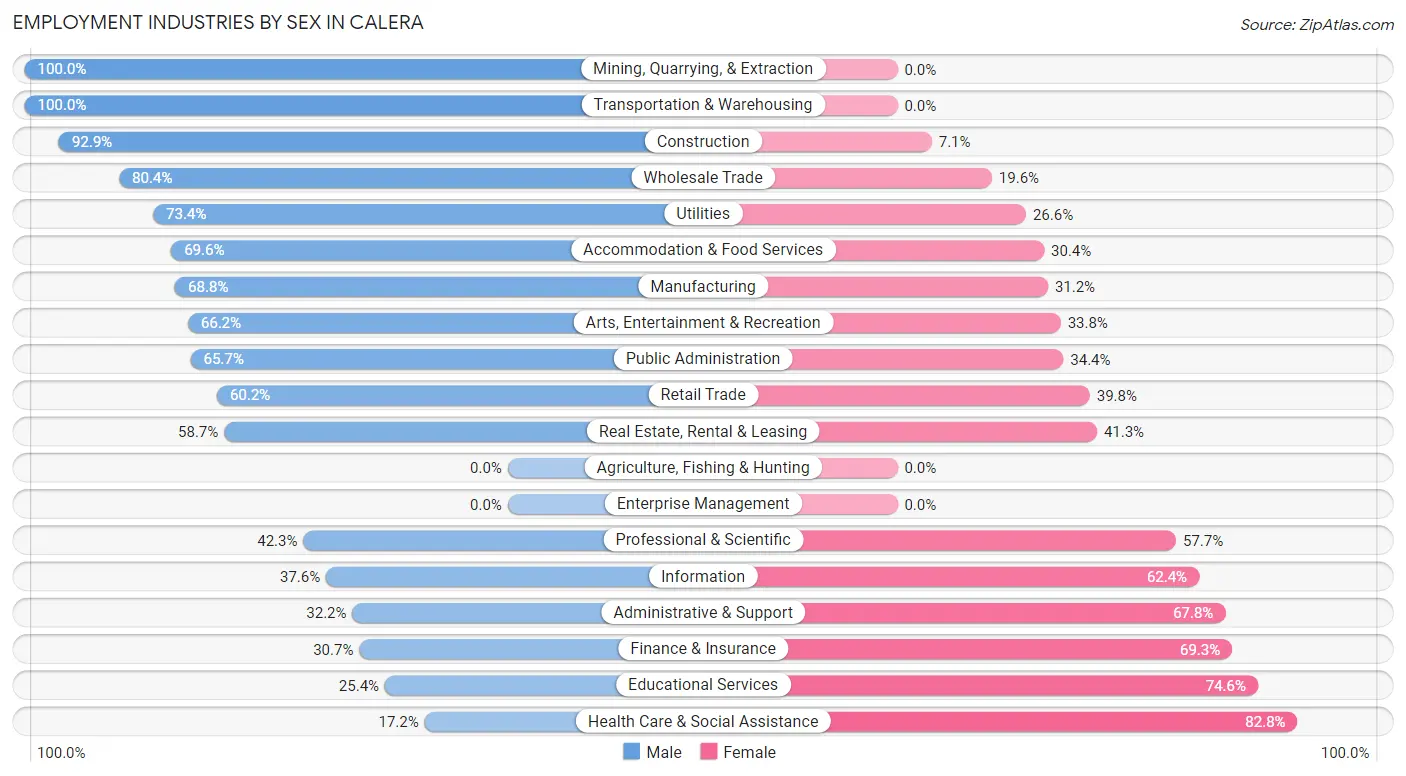
| Industry | Male | Female |
| Agriculture, Fishing & Hunting | 0 (0.0%) | 0 (0.0%) |
| Mining, Quarrying, & Extraction | 66 (100.0%) | 0 (0.0%) |
| Construction | 653 (92.9%) | 50 (7.1%) |
| Manufacturing | 654 (68.8%) | 296 (31.2%) |
| Wholesale Trade | 218 (80.4%) | 53 (19.6%) |
| Retail Trade | 665 (60.2%) | 440 (39.8%) |
| Transportation & Warehousing | 359 (100.0%) | 0 (0.0%) |
| Utilities | 91 (73.4%) | 33 (26.6%) |
| Information | 97 (37.6%) | 161 (62.4%) |
| Finance & Insurance | 356 (30.7%) | 802 (69.3%) |
| Real Estate, Rental & Leasing | 81 (58.7%) | 57 (41.3%) |
| Professional & Scientific | 190 (42.3%) | 259 (57.7%) |
| Enterprise Management | 0 (0.0%) | 0 (0.0%) |
| Administrative & Support | 110 (32.2%) | 232 (67.8%) |
| Educational Services | 120 (25.4%) | 352 (74.6%) |
| Health Care & Social Assistance | 221 (17.2%) | 1,063 (82.8%) |
| Arts, Entertainment & Recreation | 47 (66.2%) | 24 (33.8%) |
| Accommodation & Food Services | 172 (69.6%) | 75 (30.4%) |
| Public Administration | 537 (65.6%) | 281 (34.4%) |
| Total | 4,827 (51.8%) | 4,487 (48.2%) |
Education in Calera
School Enrollment in Calera
The most common levels of schooling among the 4,945 students in Calera are elementary school (1,158 | 23.4%), middle school (1,133 | 22.9%), and college / undergraduate (752 | 15.2%).
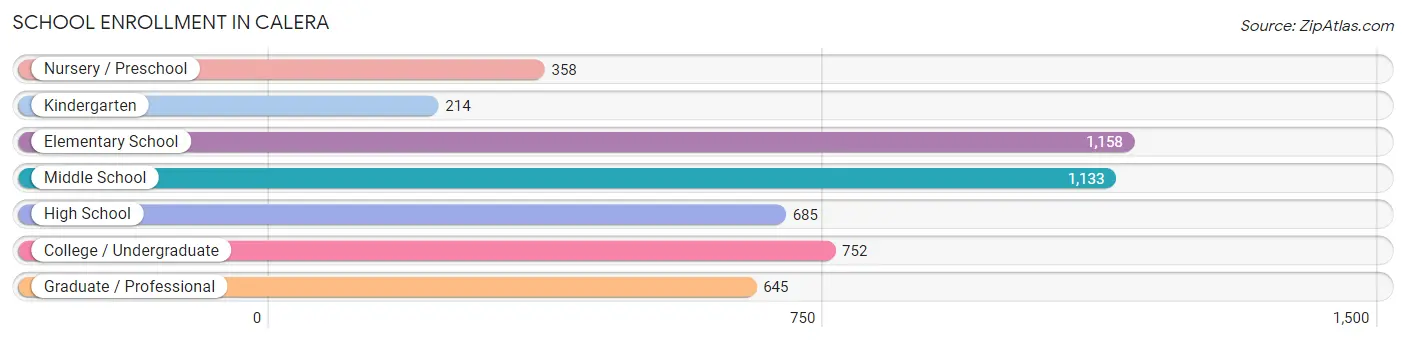
| School Level | # Students | % Students |
| Nursery / Preschool | 358 | 7.2% |
| Kindergarten | 214 | 4.3% |
| Elementary School | 1,158 | 23.4% |
| Middle School | 1,133 | 22.9% |
| High School | 685 | 13.9% |
| College / Undergraduate | 752 | 15.2% |
| Graduate / Professional | 645 | 13.0% |
| Total | 4,945 | 100.0% |
School Enrollment by Age by Funding Source in Calera
Out of a total of 4,945 students who are enrolled in schools in Calera, 974 (19.7%) attend a private institution, while the remaining 3,971 (80.3%) are enrolled in public schools. The age group of 3 to 4 year olds has the highest likelihood of being enrolled in private schools, with 203 (62.3% in the age bracket) enrolled. Conversely, the age group of 18 to 19 year olds has the lowest likelihood of being enrolled in a private school, with 109 (100.0% in the age bracket) attending a public institution.
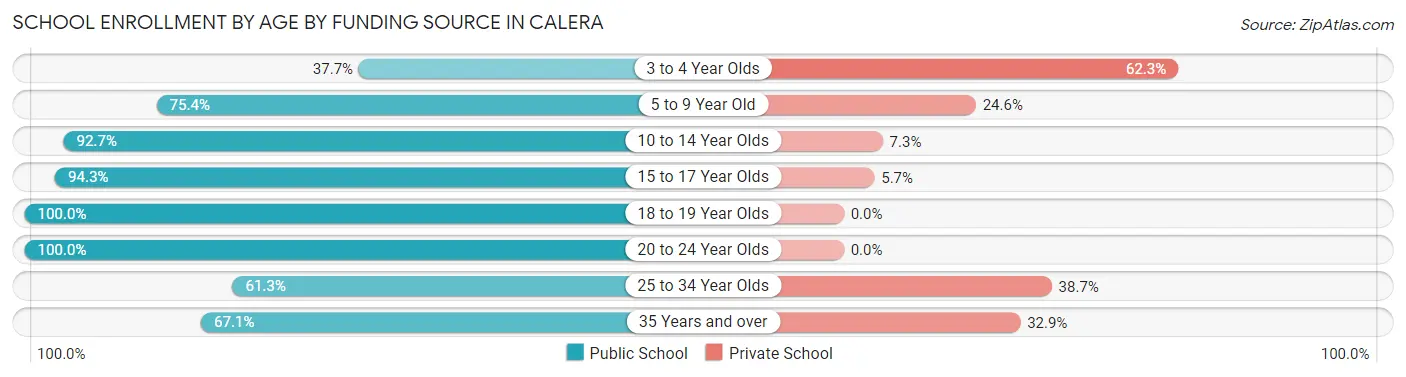
| Age Bracket | Public School | Private School |
| 3 to 4 Year Olds | 123 (37.7%) | 203 (62.3%) |
| 5 to 9 Year Old | 996 (75.4%) | 325 (24.6%) |
| 10 to 14 Year Olds | 1,163 (92.7%) | 91 (7.3%) |
| 15 to 17 Year Olds | 562 (94.3%) | 34 (5.7%) |
| 18 to 19 Year Olds | 109 (100.0%) | 0 (0.0%) |
| 20 to 24 Year Olds | 439 (100.0%) | 0 (0.0%) |
| 25 to 34 Year Olds | 283 (61.3%) | 179 (38.7%) |
| 35 Years and over | 294 (67.1%) | 144 (32.9%) |
| Total | 3,971 (80.3%) | 974 (19.7%) |
Educational Attainment by Field of Study in Calera
Business (899 | 22.4%), arts & humanities (650 | 16.2%), computers & mathematics (411 | 10.2%), science & technology (311 | 7.7%), and psychology (301 | 7.5%) are the most common fields of study among 4,016 individuals in Calera who have obtained a bachelor's degree or higher.
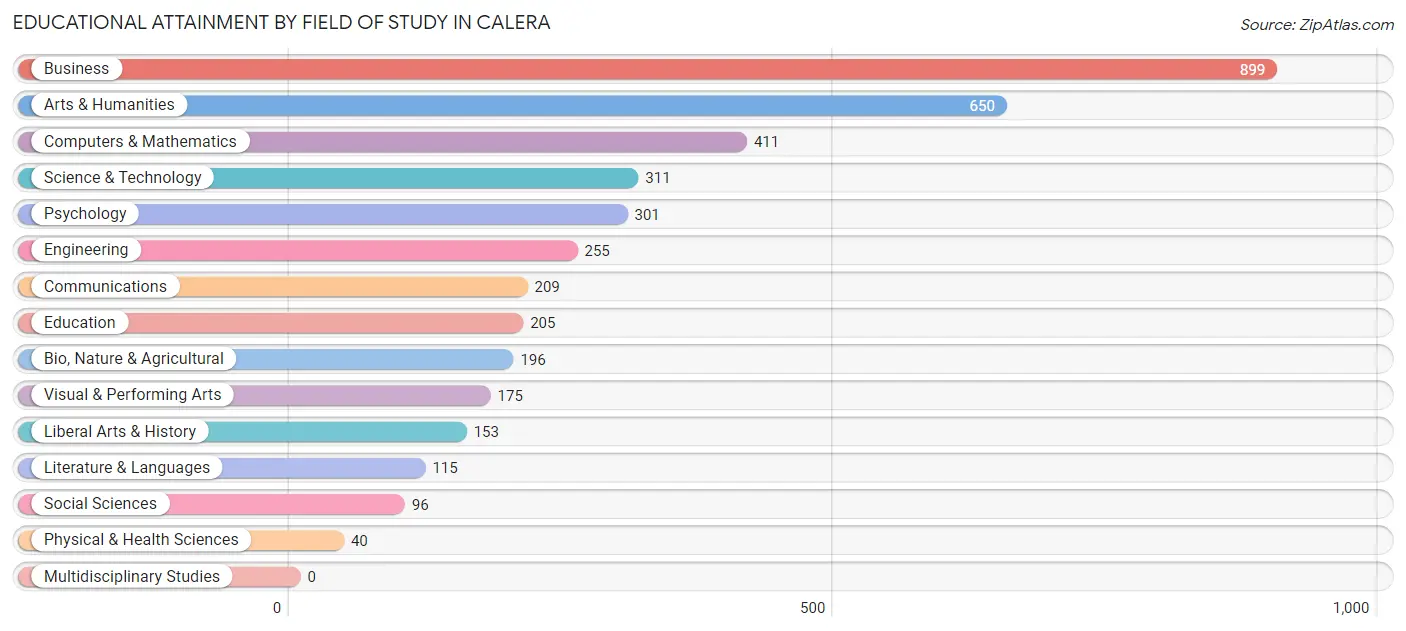
| Field of Study | # Graduates | % Graduates |
| Computers & Mathematics | 411 | 10.2% |
| Bio, Nature & Agricultural | 196 | 4.9% |
| Physical & Health Sciences | 40 | 1.0% |
| Psychology | 301 | 7.5% |
| Social Sciences | 96 | 2.4% |
| Engineering | 255 | 6.4% |
| Multidisciplinary Studies | 0 | 0.0% |
| Science & Technology | 311 | 7.7% |
| Business | 899 | 22.4% |
| Education | 205 | 5.1% |
| Literature & Languages | 115 | 2.9% |
| Liberal Arts & History | 153 | 3.8% |
| Visual & Performing Arts | 175 | 4.4% |
| Communications | 209 | 5.2% |
| Arts & Humanities | 650 | 16.2% |
| Total | 4,016 | 100.0% |
Transportation & Commute in Calera
Vehicle Availability by Sex in Calera
The most prevalent vehicle ownership categories in Calera are males with 2 vehicles (2,309, accounting for 47.8%) and females with 2 vehicles (2,363, making up 51.7%).
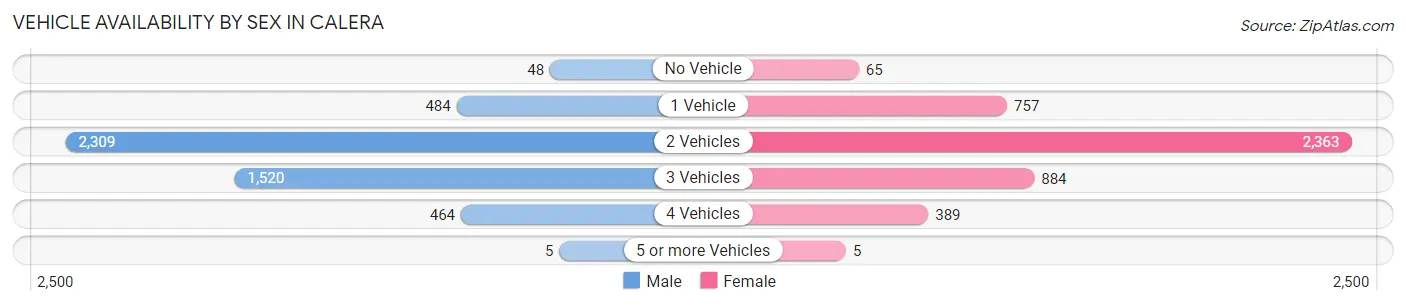
| Vehicles Available | Male | Female |
| No Vehicle | 48 (1.0%) | 65 (1.5%) |
| 1 Vehicle | 484 (10.0%) | 757 (17.0%) |
| 2 Vehicles | 2,309 (47.8%) | 2,363 (52.9%) |
| 3 Vehicles | 1,520 (31.5%) | 884 (19.8%) |
| 4 Vehicles | 464 (9.6%) | 389 (8.7%) |
| 5 or more Vehicles | 5 (0.1%) | 5 (0.1%) |
| Total | 4,830 (100.0%) | 4,463 (100.0%) |
Commute Time in Calera
The most frequently occuring commute durations in Calera are 45 to 59 minutes (1,333 commuters, 16.5%), 20 to 24 minutes (1,038 commuters, 12.8%), and 10 to 14 minutes (1,001 commuters, 12.4%).
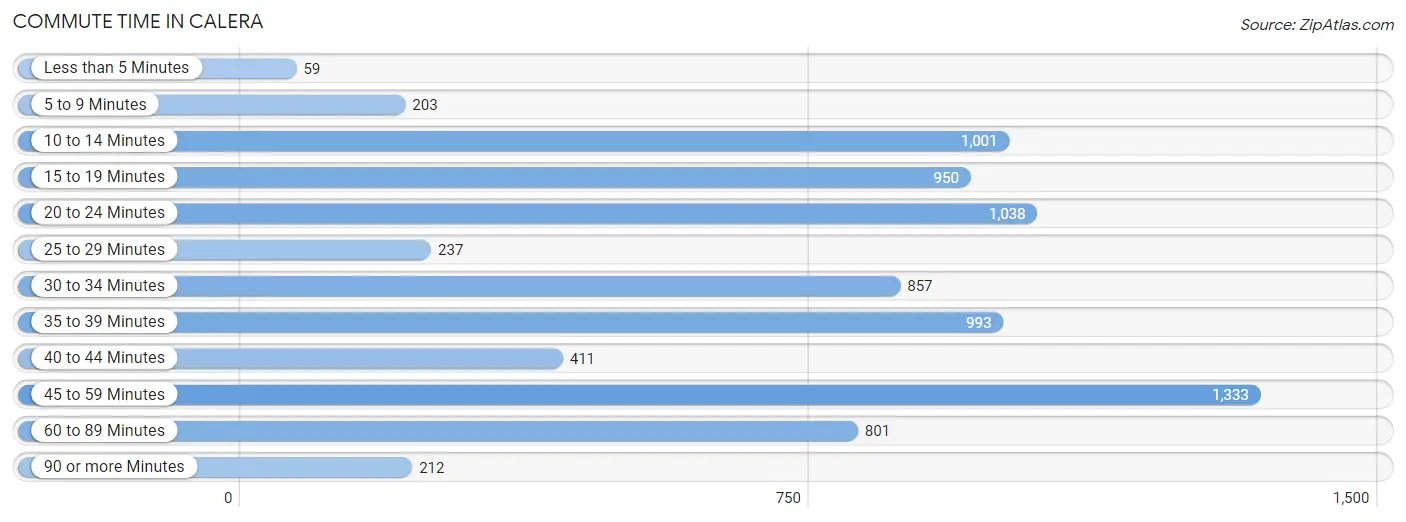
| Commute Time | # Commuters | % Commuters |
| Less than 5 Minutes | 59 | 0.7% |
| 5 to 9 Minutes | 203 | 2.5% |
| 10 to 14 Minutes | 1,001 | 12.4% |
| 15 to 19 Minutes | 950 | 11.7% |
| 20 to 24 Minutes | 1,038 | 12.8% |
| 25 to 29 Minutes | 237 | 2.9% |
| 30 to 34 Minutes | 857 | 10.6% |
| 35 to 39 Minutes | 993 | 12.3% |
| 40 to 44 Minutes | 411 | 5.1% |
| 45 to 59 Minutes | 1,333 | 16.5% |
| 60 to 89 Minutes | 801 | 9.9% |
| 90 or more Minutes | 212 | 2.6% |
Commute Time by Sex in Calera
The most common commute times in Calera are 20 to 24 minutes (669 commuters, 15.2%) for males and 45 to 59 minutes (700 commuters, 19.0%) for females.
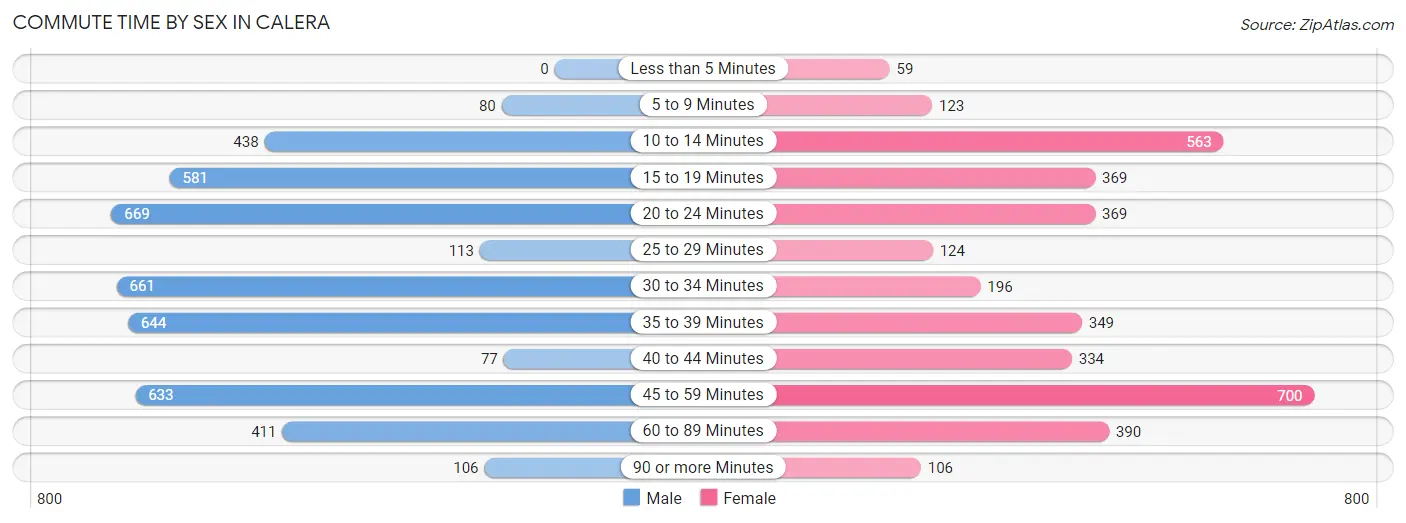
| Commute Time | Male | Female |
| Less than 5 Minutes | 0 (0.0%) | 59 (1.6%) |
| 5 to 9 Minutes | 80 (1.8%) | 123 (3.3%) |
| 10 to 14 Minutes | 438 (9.9%) | 563 (15.3%) |
| 15 to 19 Minutes | 581 (13.2%) | 369 (10.0%) |
| 20 to 24 Minutes | 669 (15.2%) | 369 (10.0%) |
| 25 to 29 Minutes | 113 (2.6%) | 124 (3.4%) |
| 30 to 34 Minutes | 661 (15.0%) | 196 (5.3%) |
| 35 to 39 Minutes | 644 (14.6%) | 349 (9.5%) |
| 40 to 44 Minutes | 77 (1.7%) | 334 (9.1%) |
| 45 to 59 Minutes | 633 (14.3%) | 700 (19.0%) |
| 60 to 89 Minutes | 411 (9.3%) | 390 (10.6%) |
| 90 or more Minutes | 106 (2.4%) | 106 (2.9%) |
Time of Departure to Work by Sex in Calera
The most frequent times of departure to work in Calera are 7:00 AM to 7:29 AM (642, 14.5%) for males and 7:00 AM to 7:29 AM (900, 24.4%) for females.
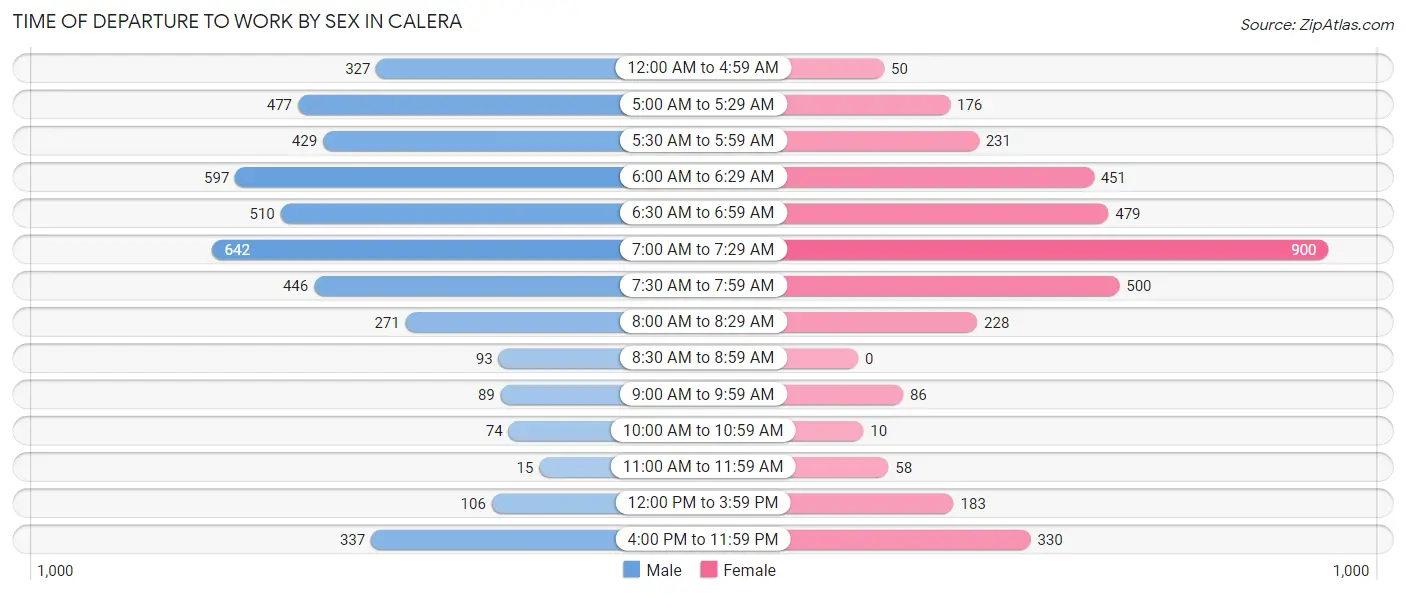
| Time of Departure | Male | Female |
| 12:00 AM to 4:59 AM | 327 (7.4%) | 50 (1.4%) |
| 5:00 AM to 5:29 AM | 477 (10.8%) | 176 (4.8%) |
| 5:30 AM to 5:59 AM | 429 (9.7%) | 231 (6.3%) |
| 6:00 AM to 6:29 AM | 597 (13.5%) | 451 (12.2%) |
| 6:30 AM to 6:59 AM | 510 (11.6%) | 479 (13.0%) |
| 7:00 AM to 7:29 AM | 642 (14.5%) | 900 (24.4%) |
| 7:30 AM to 7:59 AM | 446 (10.1%) | 500 (13.6%) |
| 8:00 AM to 8:29 AM | 271 (6.1%) | 228 (6.2%) |
| 8:30 AM to 8:59 AM | 93 (2.1%) | 0 (0.0%) |
| 9:00 AM to 9:59 AM | 89 (2.0%) | 86 (2.3%) |
| 10:00 AM to 10:59 AM | 74 (1.7%) | 10 (0.3%) |
| 11:00 AM to 11:59 AM | 15 (0.3%) | 58 (1.6%) |
| 12:00 PM to 3:59 PM | 106 (2.4%) | 183 (5.0%) |
| 4:00 PM to 11:59 PM | 337 (7.6%) | 330 (9.0%) |
| Total | 4,413 (100.0%) | 3,682 (100.0%) |
Housing Occupancy in Calera
Occupancy by Ownership in Calera
Of the total 6,299 dwellings in Calera, owner-occupied units account for 5,048 (80.1%), while renter-occupied units make up 1,251 (19.9%).
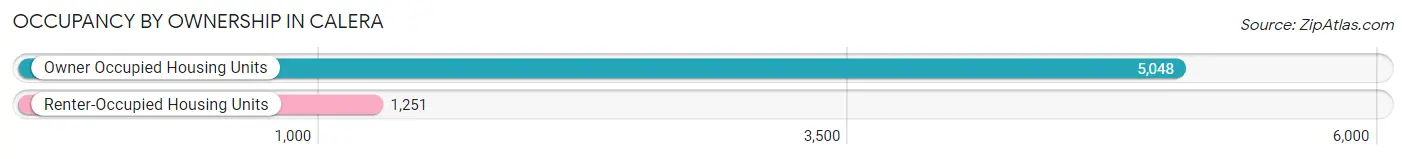
| Occupancy | # Housing Units | % Housing Units |
| Owner Occupied Housing Units | 5,048 | 80.1% |
| Renter-Occupied Housing Units | 1,251 | 19.9% |
| Total Occupied Housing Units | 6,299 | 100.0% |
Occupancy by Household Size in Calera
| Household Size | # Housing Units | % Housing Units |
| 1-Person Household | 1,307 | 20.7% |
| 2-Person Household | 2,434 | 38.6% |
| 3-Person Household | 1,335 | 21.2% |
| 4+ Person Household | 1,223 | 19.4% |
| Total Housing Units | 6,299 | 100.0% |
Occupancy by Ownership by Household Size in Calera
| Household Size | Owner-occupied | Renter-occupied |
| 1-Person Household | 1,062 (81.2%) | 245 (18.8%) |
| 2-Person Household | 1,991 (81.8%) | 443 (18.2%) |
| 3-Person Household | 1,097 (82.2%) | 238 (17.8%) |
| 4+ Person Household | 898 (73.4%) | 325 (26.6%) |
| Total Housing Units | 5,048 (80.1%) | 1,251 (19.9%) |
Occupancy by Educational Attainment in Calera
| Household Size | Owner-occupied | Renter-occupied |
| Less than High School | 55 (25.1%) | 164 (74.9%) |
| High School Diploma | 958 (79.0%) | 255 (21.0%) |
| College/Associate Degree | 1,836 (77.3%) | 538 (22.7%) |
| Bachelor's Degree or higher | 2,199 (88.2%) | 294 (11.8%) |
Occupancy by Age of Householder in Calera
| Age Bracket | # Households | % Households |
| Under 35 Years | 1,802 | 28.6% |
| 35 to 44 Years | 1,499 | 23.8% |
| 45 to 54 Years | 1,090 | 17.3% |
| 55 to 64 Years | 978 | 15.5% |
| 65 to 74 Years | 516 | 8.2% |
| 75 to 84 Years | 288 | 4.6% |
| 85 Years and Over | 126 | 2.0% |
| Total | 6,299 | 100.0% |
Housing Finances in Calera
Median Income by Occupancy in Calera
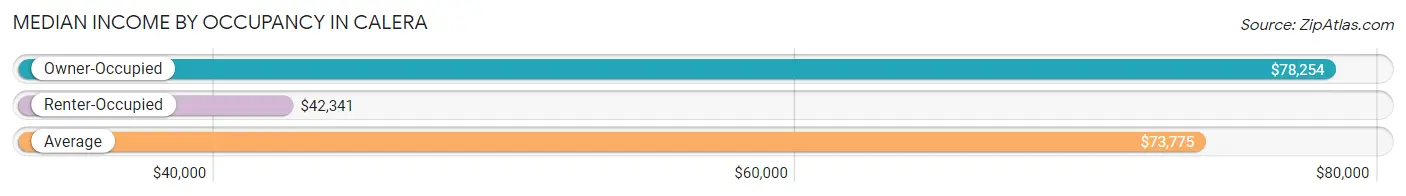
| Occupancy Type | # Households | Median Income |
| Owner-Occupied | 5,048 (80.1%) | $78,254 |
| Renter-Occupied | 1,251 (19.9%) | $42,341 |
| Average | 6,299 (100.0%) | $73,775 |
Occupancy by Householder Income Bracket in Calera
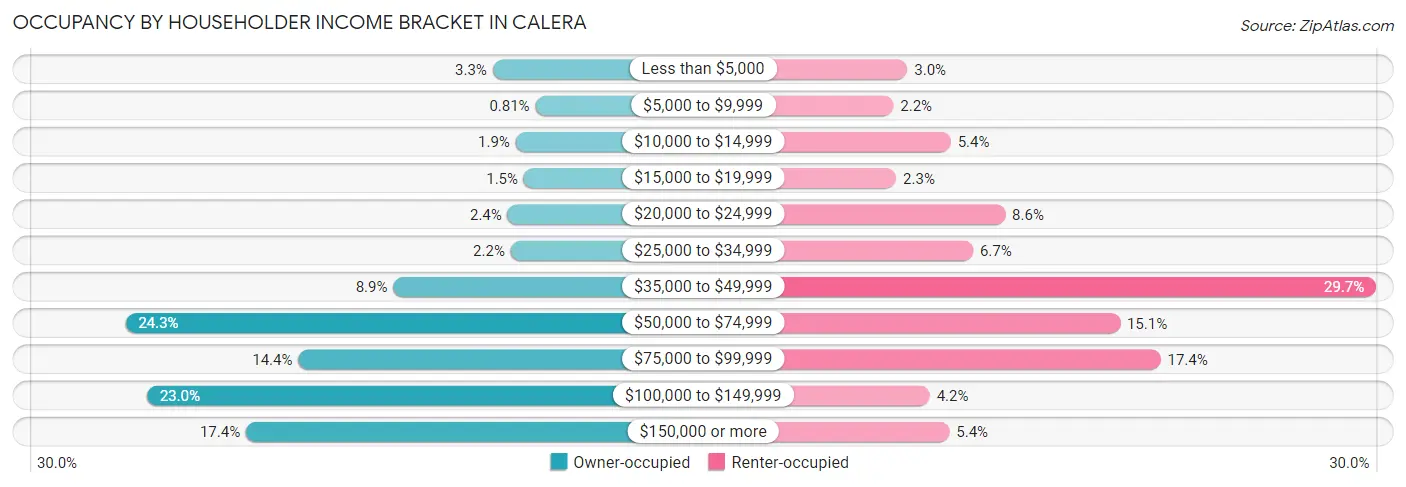
| Income Bracket | Owner-occupied | Renter-occupied |
| Less than $5,000 | 164 (3.3%) | 37 (3.0%) |
| $5,000 to $9,999 | 41 (0.8%) | 27 (2.2%) |
| $10,000 to $14,999 | 98 (1.9%) | 68 (5.4%) |
| $15,000 to $19,999 | 74 (1.5%) | 29 (2.3%) |
| $20,000 to $24,999 | 121 (2.4%) | 107 (8.6%) |
| $25,000 to $34,999 | 112 (2.2%) | 84 (6.7%) |
| $35,000 to $49,999 | 451 (8.9%) | 372 (29.7%) |
| $50,000 to $74,999 | 1,224 (24.2%) | 189 (15.1%) |
| $75,000 to $99,999 | 725 (14.4%) | 218 (17.4%) |
| $100,000 to $149,999 | 1,162 (23.0%) | 53 (4.2%) |
| $150,000 or more | 876 (17.3%) | 67 (5.4%) |
| Total | 5,048 (100.0%) | 1,251 (100.0%) |
Monthly Housing Cost Tiers in Calera
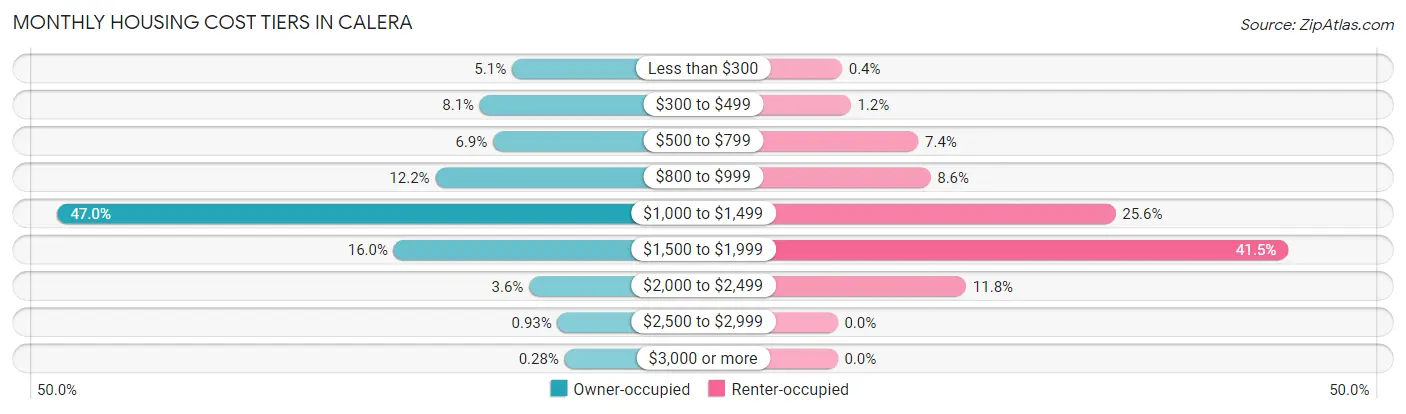
| Monthly Cost | Owner-occupied | Renter-occupied |
| Less than $300 | 259 (5.1%) | 5 (0.4%) |
| $300 to $499 | 408 (8.1%) | 15 (1.2%) |
| $500 to $799 | 347 (6.9%) | 93 (7.4%) |
| $800 to $999 | 615 (12.2%) | 107 (8.6%) |
| $1,000 to $1,499 | 2,371 (47.0%) | 320 (25.6%) |
| $1,500 to $1,999 | 808 (16.0%) | 519 (41.5%) |
| $2,000 to $2,499 | 179 (3.5%) | 148 (11.8%) |
| $2,500 to $2,999 | 47 (0.9%) | 0 (0.0%) |
| $3,000 or more | 14 (0.3%) | 0 (0.0%) |
| Total | 5,048 (100.0%) | 1,251 (100.0%) |
Physical Housing Characteristics in Calera
Housing Structures in Calera
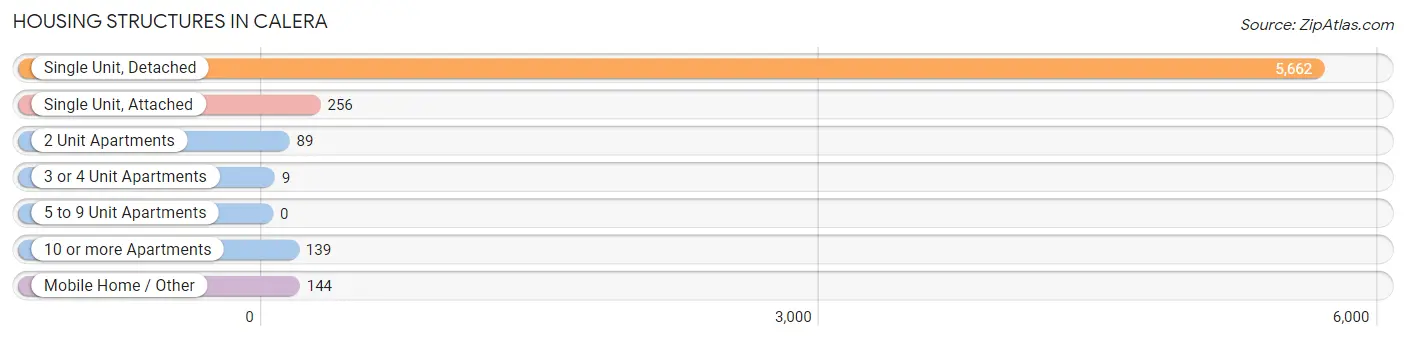
| Structure Type | # Housing Units | % Housing Units |
| Single Unit, Detached | 5,662 | 89.9% |
| Single Unit, Attached | 256 | 4.1% |
| 2 Unit Apartments | 89 | 1.4% |
| 3 or 4 Unit Apartments | 9 | 0.1% |
| 5 to 9 Unit Apartments | 0 | 0.0% |
| 10 or more Apartments | 139 | 2.2% |
| Mobile Home / Other | 144 | 2.3% |
| Total | 6,299 | 100.0% |
Housing Structures by Occupancy in Calera
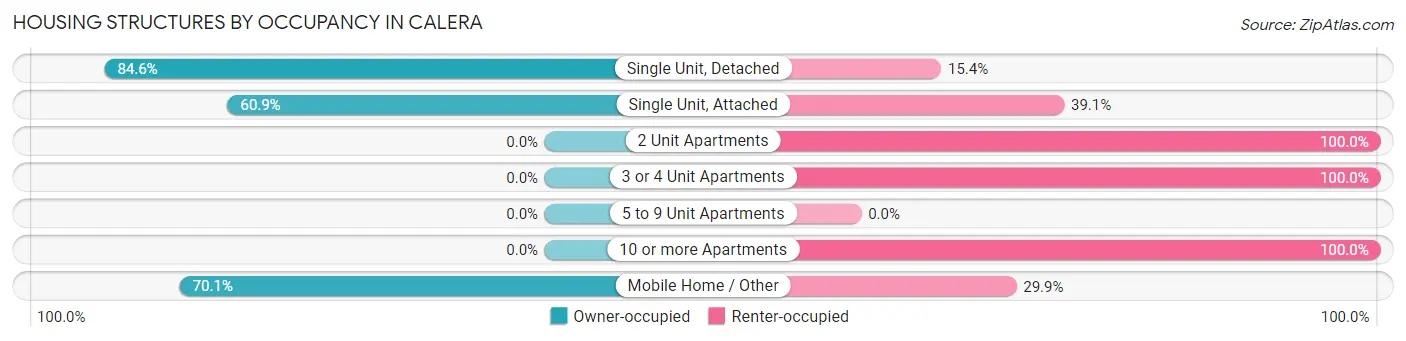
| Structure Type | Owner-occupied | Renter-occupied |
| Single Unit, Detached | 4,791 (84.6%) | 871 (15.4%) |
| Single Unit, Attached | 156 (60.9%) | 100 (39.1%) |
| 2 Unit Apartments | 0 (0.0%) | 89 (100.0%) |
| 3 or 4 Unit Apartments | 0 (0.0%) | 9 (100.0%) |
| 5 to 9 Unit Apartments | 0 (0.0%) | 0 (0.0%) |
| 10 or more Apartments | 0 (0.0%) | 139 (100.0%) |
| Mobile Home / Other | 101 (70.1%) | 43 (29.9%) |
| Total | 5,048 (80.1%) | 1,251 (19.9%) |
Housing Structures by Number of Rooms in Calera
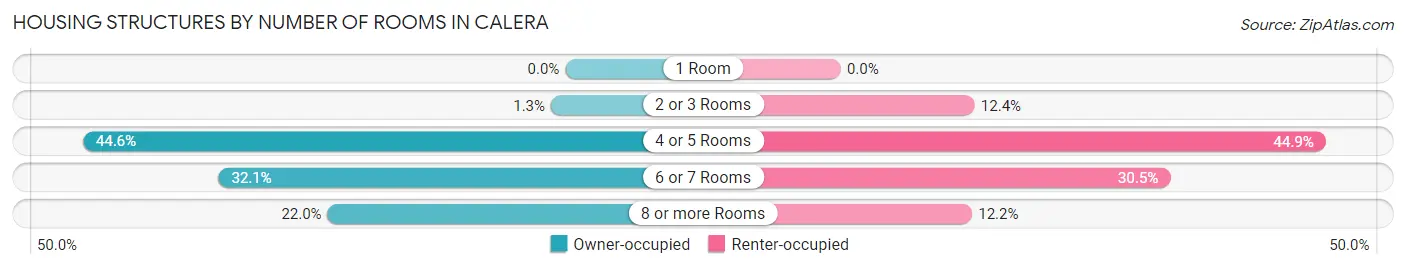
| Number of Rooms | Owner-occupied | Renter-occupied |
| 1 Room | 0 (0.0%) | 0 (0.0%) |
| 2 or 3 Rooms | 67 (1.3%) | 155 (12.4%) |
| 4 or 5 Rooms | 2,252 (44.6%) | 562 (44.9%) |
| 6 or 7 Rooms | 1,619 (32.1%) | 382 (30.5%) |
| 8 or more Rooms | 1,110 (22.0%) | 152 (12.1%) |
| Total | 5,048 (100.0%) | 1,251 (100.0%) |
Housing Structure by Heating Type in Calera
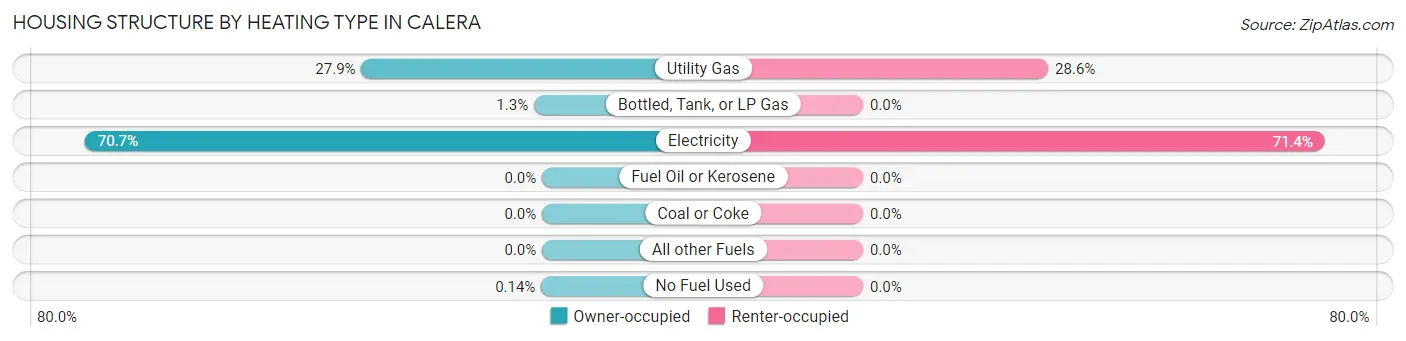
| Heating Type | Owner-occupied | Renter-occupied |
| Utility Gas | 1,410 (27.9%) | 358 (28.6%) |
| Bottled, Tank, or LP Gas | 63 (1.3%) | 0 (0.0%) |
| Electricity | 3,568 (70.7%) | 893 (71.4%) |
| Fuel Oil or Kerosene | 0 (0.0%) | 0 (0.0%) |
| Coal or Coke | 0 (0.0%) | 0 (0.0%) |
| All other Fuels | 0 (0.0%) | 0 (0.0%) |
| No Fuel Used | 7 (0.1%) | 0 (0.0%) |
| Total | 5,048 (100.0%) | 1,251 (100.0%) |
Household Vehicle Usage in Calera
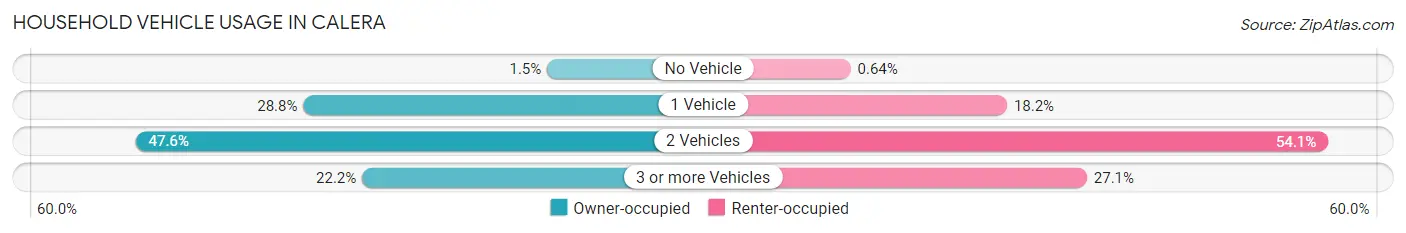
| Vehicles per Household | Owner-occupied | Renter-occupied |
| No Vehicle | 74 (1.5%) | 8 (0.6%) |
| 1 Vehicle | 1,453 (28.8%) | 227 (18.1%) |
| 2 Vehicles | 2,401 (47.6%) | 677 (54.1%) |
| 3 or more Vehicles | 1,120 (22.2%) | 339 (27.1%) |
| Total | 5,048 (100.0%) | 1,251 (100.0%) |
Real Estate & Mortgages in Calera
Real Estate and Mortgage Overview in Calera
| Characteristic | Without Mortgage | With Mortgage |
| Housing Units | 940 | 4,108 |
| Median Property Value | $179,600 | $185,800 |
| Median Household Income | $63,804 | $773 |
| Monthly Housing Costs | $374 | $14 |
| Real Estate Taxes | $816 | $254 |
Property Value by Mortgage Status in Calera
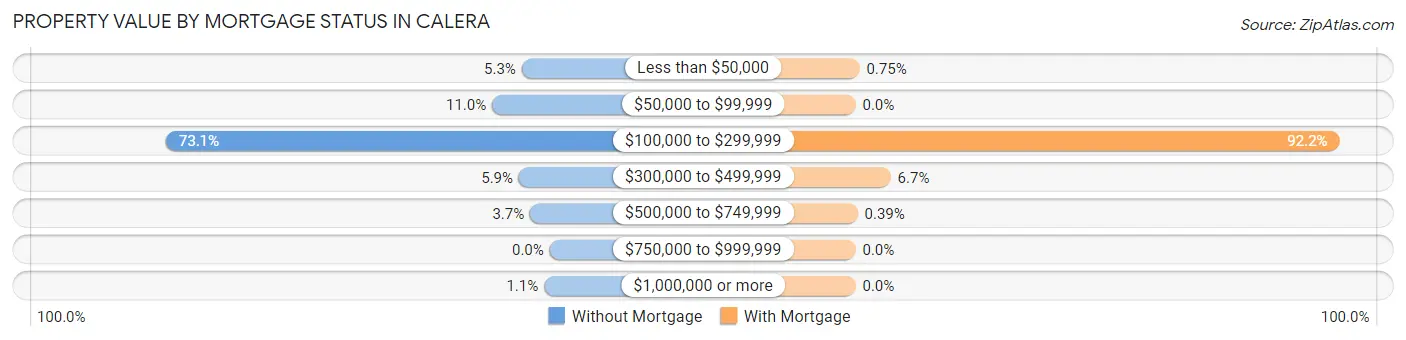
| Property Value | Without Mortgage | With Mortgage |
| Less than $50,000 | 50 (5.3%) | 31 (0.7%) |
| $50,000 to $99,999 | 103 (11.0%) | 0 (0.0%) |
| $100,000 to $299,999 | 687 (73.1%) | 3,786 (92.2%) |
| $300,000 to $499,999 | 55 (5.9%) | 275 (6.7%) |
| $500,000 to $749,999 | 35 (3.7%) | 16 (0.4%) |
| $750,000 to $999,999 | 0 (0.0%) | 0 (0.0%) |
| $1,000,000 or more | 10 (1.1%) | 0 (0.0%) |
| Total | 940 (100.0%) | 4,108 (100.0%) |
Household Income by Mortgage Status in Calera
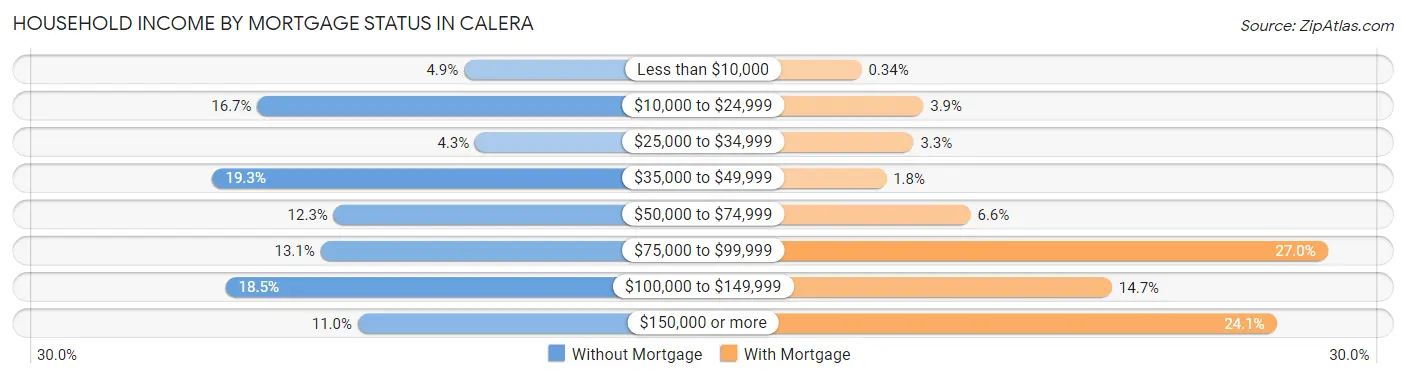
| Household Income | Without Mortgage | With Mortgage |
| Less than $10,000 | 46 (4.9%) | 14 (0.3%) |
| $10,000 to $24,999 | 157 (16.7%) | 159 (3.9%) |
| $25,000 to $34,999 | 40 (4.3%) | 136 (3.3%) |
| $35,000 to $49,999 | 181 (19.3%) | 72 (1.8%) |
| $50,000 to $74,999 | 116 (12.3%) | 270 (6.6%) |
| $75,000 to $99,999 | 123 (13.1%) | 1,108 (27.0%) |
| $100,000 to $149,999 | 174 (18.5%) | 602 (14.6%) |
| $150,000 or more | 103 (11.0%) | 988 (24.0%) |
| Total | 940 (100.0%) | 4,108 (100.0%) |
Property Value to Household Income Ratio in Calera
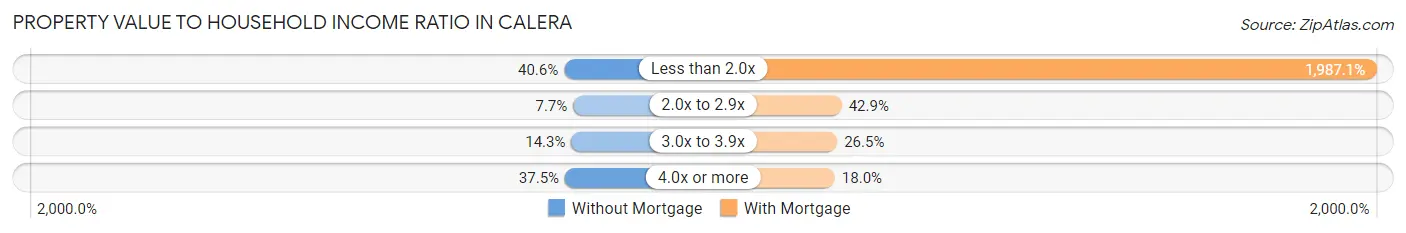
| Value-to-Income Ratio | Without Mortgage | With Mortgage |
| Less than 2.0x | 382 (40.6%) | 81,628 (1,987.0%) |
| 2.0x to 2.9x | 72 (7.7%) | 1,762 (42.9%) |
| 3.0x to 3.9x | 134 (14.3%) | 1,089 (26.5%) |
| 4.0x or more | 352 (37.4%) | 741 (18.0%) |
| Total | 940 (100.0%) | 4,108 (100.0%) |
Real Estate Taxes by Mortgage Status in Calera
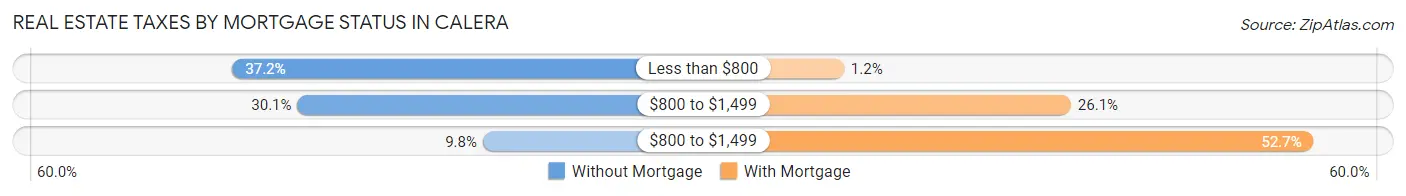
| Property Taxes | Without Mortgage | With Mortgage |
| Less than $800 | 350 (37.2%) | 49 (1.2%) |
| $800 to $1,499 | 283 (30.1%) | 1,071 (26.1%) |
| $800 to $1,499 | 92 (9.8%) | 2,163 (52.6%) |
| Total | 940 (100.0%) | 4,108 (100.0%) |
Health & Disability in Calera
Health Insurance Coverage by Age in Calera
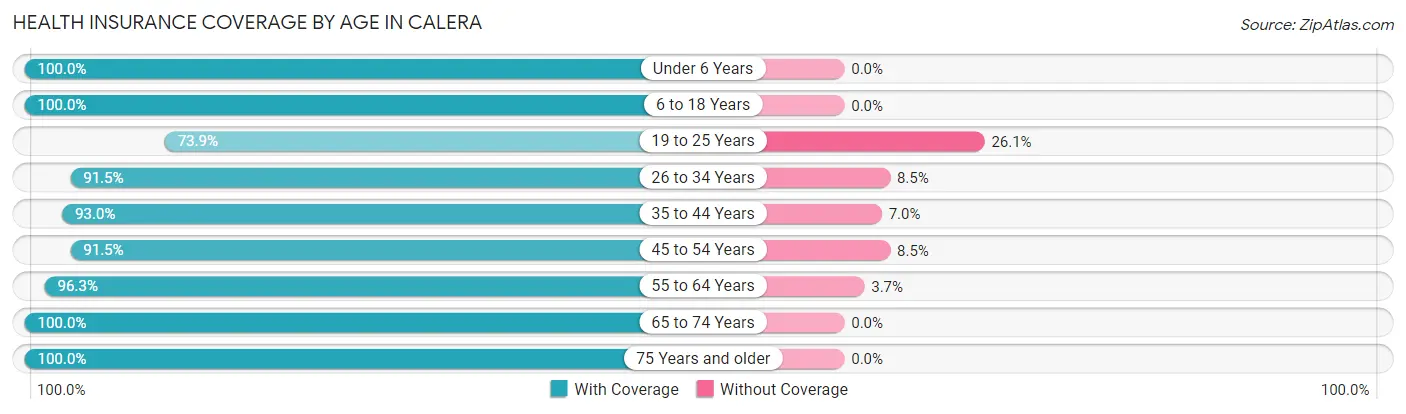
| Age Bracket | With Coverage | Without Coverage |
| Under 6 Years | 1,555 (100.0%) | 0 (0.0%) |
| 6 to 18 Years | 3,101 (100.0%) | 0 (0.0%) |
| 19 to 25 Years | 1,037 (73.9%) | 367 (26.1%) |
| 26 to 34 Years | 2,653 (91.5%) | 247 (8.5%) |
| 35 to 44 Years | 2,598 (93.0%) | 195 (7.0%) |
| 45 to 54 Years | 1,789 (91.5%) | 167 (8.5%) |
| 55 to 64 Years | 1,342 (96.3%) | 52 (3.7%) |
| 65 to 74 Years | 827 (100.0%) | 0 (0.0%) |
| 75 Years and older | 693 (100.0%) | 0 (0.0%) |
| Total | 15,595 (93.8%) | 1,028 (6.2%) |
Health Insurance Coverage by Citizenship Status in Calera
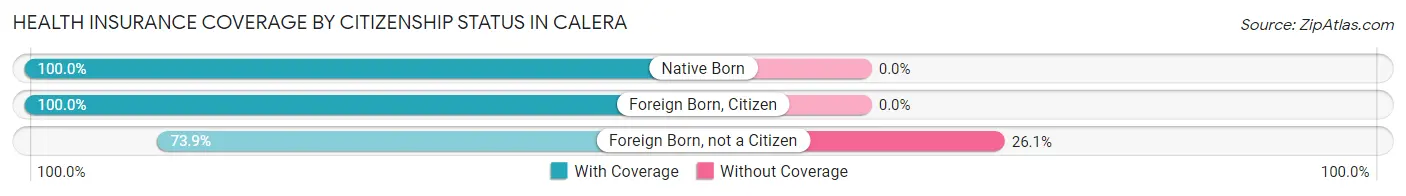
| Citizenship Status | With Coverage | Without Coverage |
| Native Born | 1,555 (100.0%) | 0 (0.0%) |
| Foreign Born, Citizen | 3,101 (100.0%) | 0 (0.0%) |
| Foreign Born, not a Citizen | 1,037 (73.9%) | 367 (26.1%) |
Health Insurance Coverage by Household Income in Calera
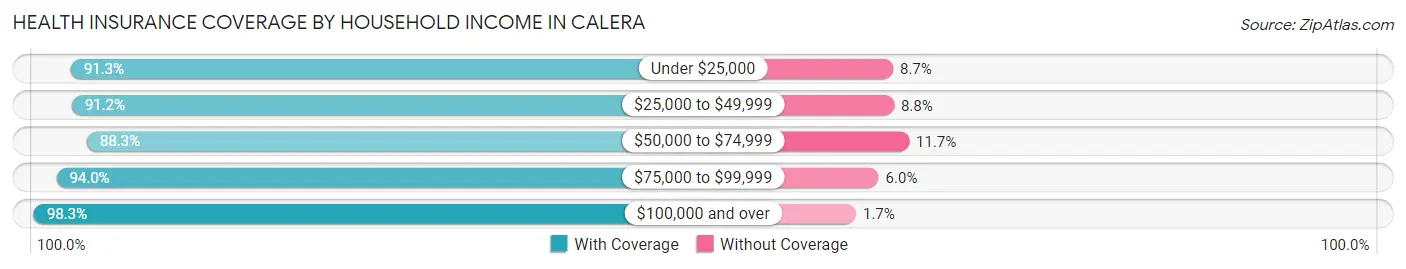
| Household Income | With Coverage | Without Coverage |
| Under $25,000 | 1,171 (91.3%) | 111 (8.7%) |
| $25,000 to $49,999 | 2,319 (91.2%) | 225 (8.8%) |
| $50,000 to $74,999 | 3,034 (88.3%) | 401 (11.7%) |
| $75,000 to $99,999 | 2,520 (94.0%) | 160 (6.0%) |
| $100,000 and over | 6,534 (98.3%) | 115 (1.7%) |
Public vs Private Health Insurance Coverage by Age in Calera
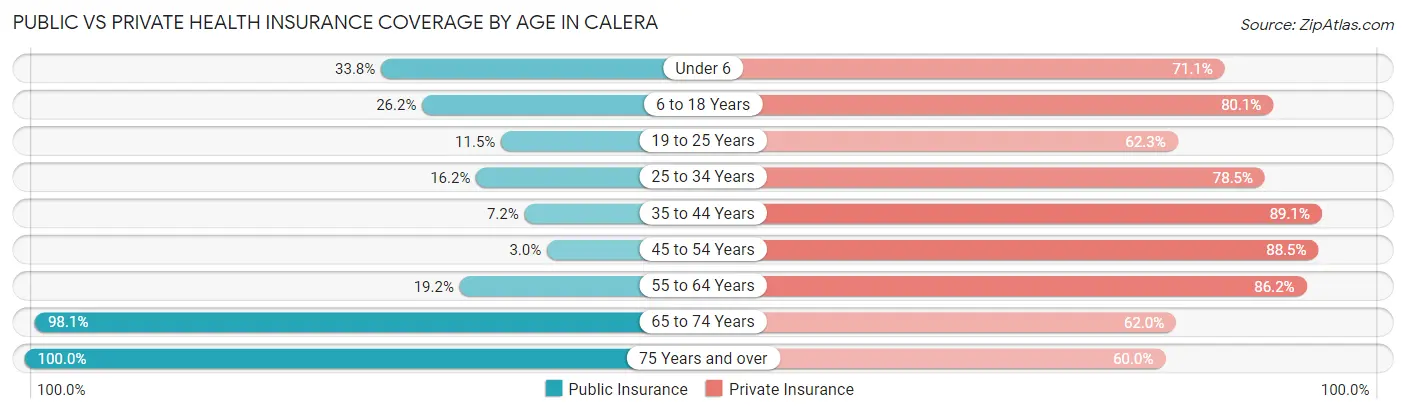
| Age Bracket | Public Insurance | Private Insurance |
| Under 6 | 526 (33.8%) | 1,105 (71.1%) |
| 6 to 18 Years | 812 (26.2%) | 2,483 (80.1%) |
| 19 to 25 Years | 162 (11.5%) | 875 (62.3%) |
| 25 to 34 Years | 469 (16.2%) | 2,277 (78.5%) |
| 35 to 44 Years | 201 (7.2%) | 2,488 (89.1%) |
| 45 to 54 Years | 59 (3.0%) | 1,730 (88.4%) |
| 55 to 64 Years | 268 (19.2%) | 1,202 (86.2%) |
| 65 to 74 Years | 811 (98.1%) | 513 (62.0%) |
| 75 Years and over | 693 (100.0%) | 416 (60.0%) |
| Total | 4,001 (24.1%) | 13,089 (78.7%) |
Disability Status by Sex by Age in Calera
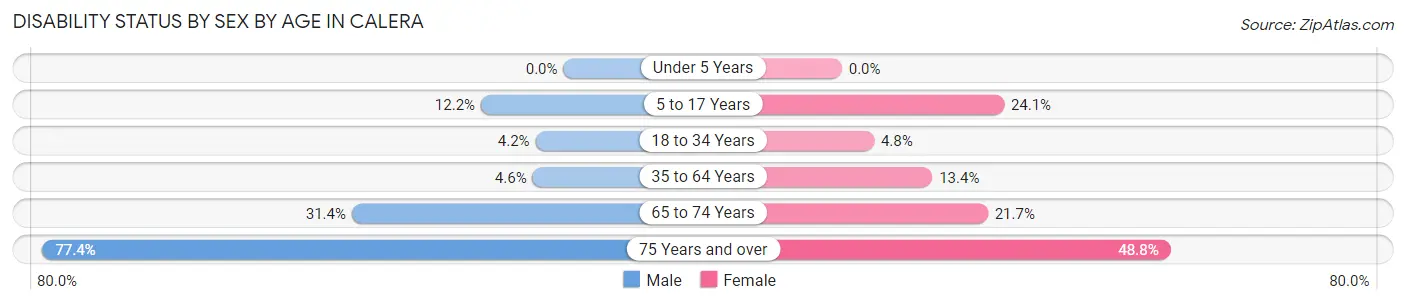
| Age Bracket | Male | Female |
| Under 5 Years | 0 (0.0%) | 0 (0.0%) |
| 5 to 17 Years | 167 (12.2%) | 444 (24.1%) |
| 18 to 34 Years | 84 (4.2%) | 113 (4.8%) |
| 35 to 64 Years | 144 (4.6%) | 403 (13.4%) |
| 65 to 74 Years | 109 (31.4%) | 104 (21.7%) |
| 75 Years and over | 181 (77.3%) | 224 (48.8%) |
Disability Class by Sex by Age in Calera
Disability Class: Hearing Difficulty
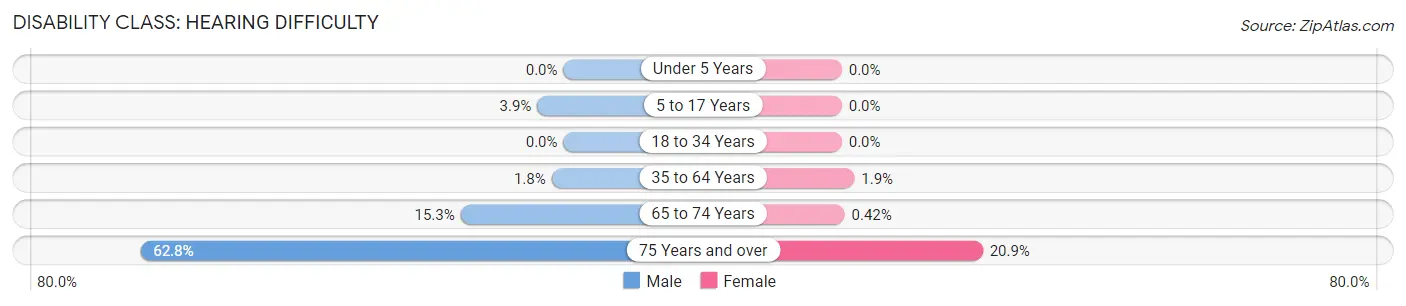
| Age Bracket | Male | Female |
| Under 5 Years | 0 (0.0%) | 0 (0.0%) |
| 5 to 17 Years | 53 (3.9%) | 0 (0.0%) |
| 18 to 34 Years | 0 (0.0%) | 0 (0.0%) |
| 35 to 64 Years | 55 (1.8%) | 56 (1.9%) |
| 65 to 74 Years | 53 (15.3%) | 2 (0.4%) |
| 75 Years and over | 147 (62.8%) | 96 (20.9%) |
Disability Class: Vision Difficulty
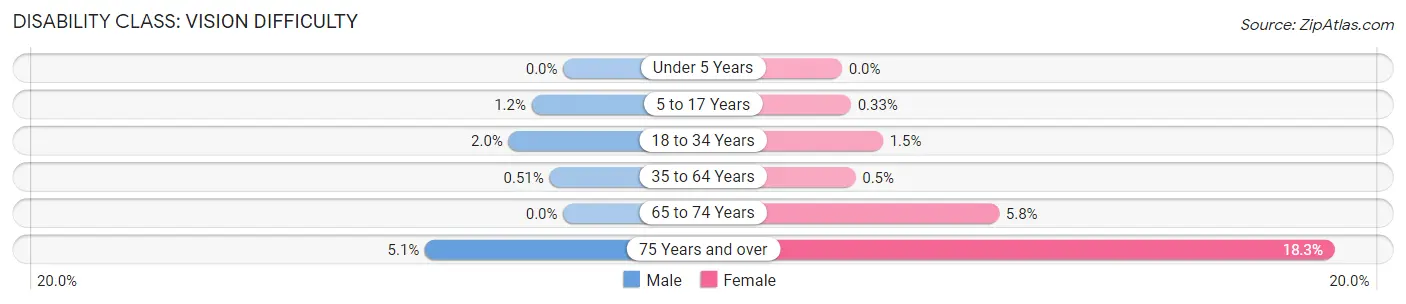
| Age Bracket | Male | Female |
| Under 5 Years | 0 (0.0%) | 0 (0.0%) |
| 5 to 17 Years | 16 (1.2%) | 6 (0.3%) |
| 18 to 34 Years | 41 (2.0%) | 36 (1.5%) |
| 35 to 64 Years | 16 (0.5%) | 15 (0.5%) |
| 65 to 74 Years | 0 (0.0%) | 28 (5.8%) |
| 75 Years and over | 12 (5.1%) | 84 (18.3%) |
Disability Class: Cognitive Difficulty
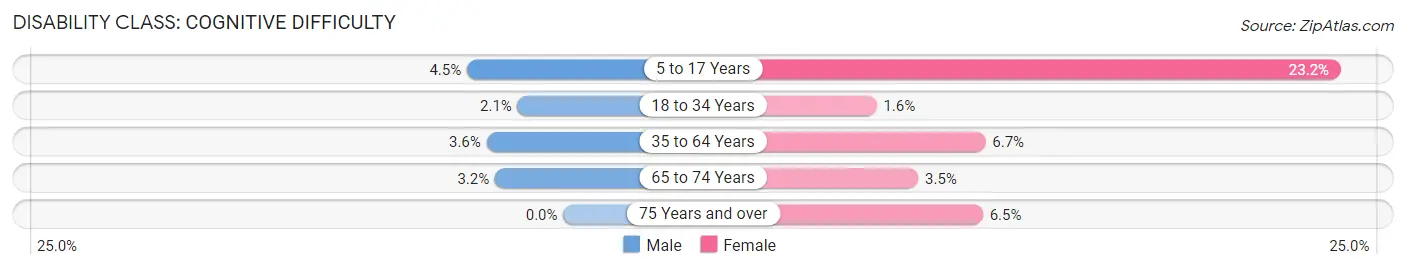
| Age Bracket | Male | Female |
| 5 to 17 Years | 61 (4.5%) | 427 (23.2%) |
| 18 to 34 Years | 43 (2.1%) | 38 (1.6%) |
| 35 to 64 Years | 112 (3.6%) | 200 (6.7%) |
| 65 to 74 Years | 11 (3.2%) | 17 (3.5%) |
| 75 Years and over | 0 (0.0%) | 30 (6.5%) |
Disability Class: Ambulatory Difficulty
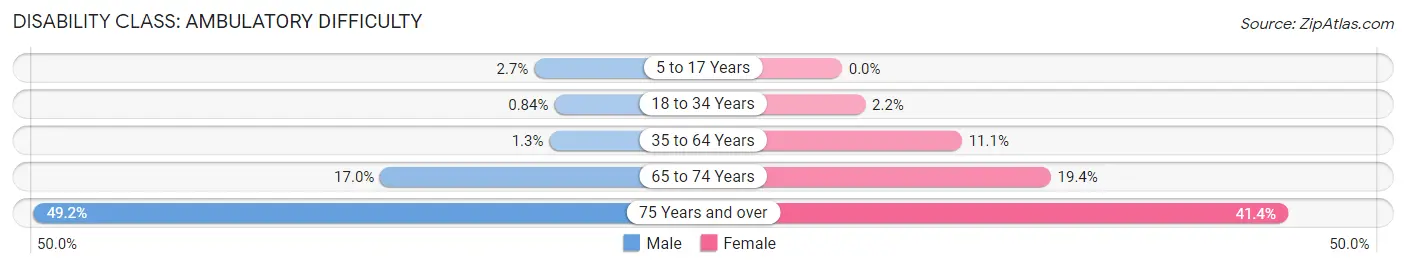
| Age Bracket | Male | Female |
| 5 to 17 Years | 37 (2.7%) | 0 (0.0%) |
| 18 to 34 Years | 17 (0.8%) | 51 (2.2%) |
| 35 to 64 Years | 41 (1.3%) | 334 (11.1%) |
| 65 to 74 Years | 59 (17.0%) | 93 (19.4%) |
| 75 Years and over | 115 (49.1%) | 190 (41.4%) |
Disability Class: Self-Care Difficulty
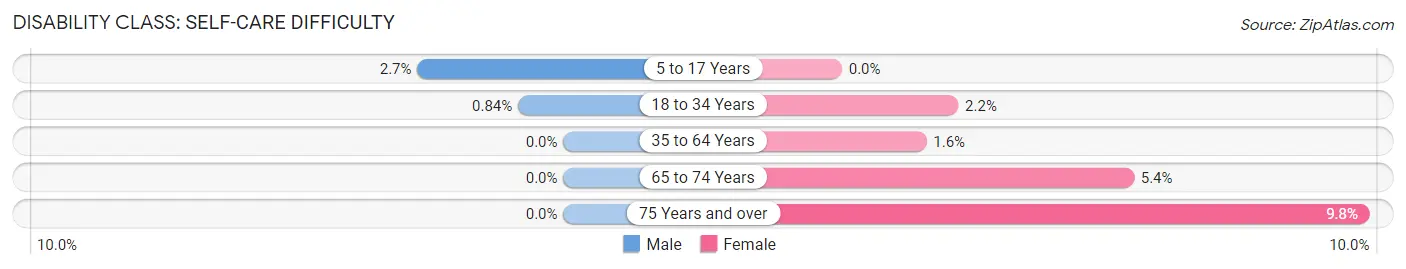
| Age Bracket | Male | Female |
| 5 to 17 Years | 37 (2.7%) | 0 (0.0%) |
| 18 to 34 Years | 17 (0.8%) | 51 (2.2%) |
| 35 to 64 Years | 0 (0.0%) | 47 (1.6%) |
| 65 to 74 Years | 0 (0.0%) | 26 (5.4%) |
| 75 Years and over | 0 (0.0%) | 45 (9.8%) |
Technology Access in Calera
Computing Device Access in Calera
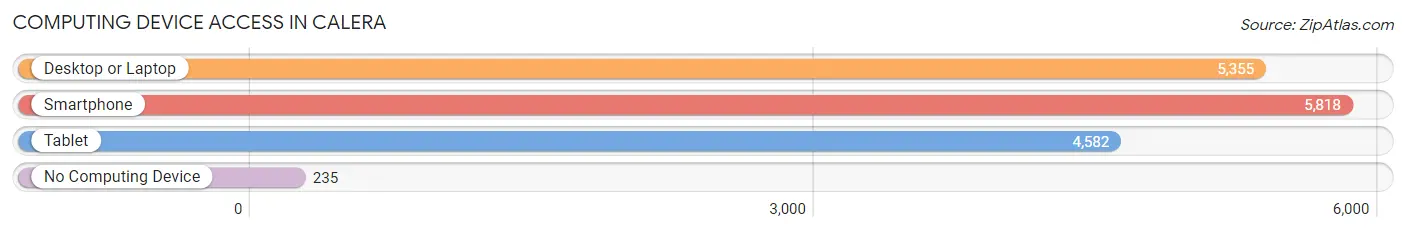
| Device Type | # Households | % Households |
| Desktop or Laptop | 5,355 | 85.0% |
| Smartphone | 5,818 | 92.4% |
| Tablet | 4,582 | 72.7% |
| No Computing Device | 235 | 3.7% |
| Total | 6,299 | 100.0% |
Internet Access in Calera
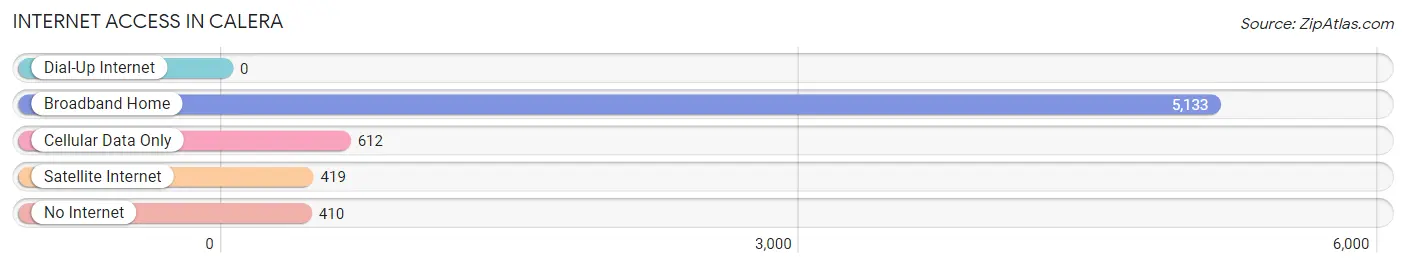
| Internet Type | # Households | % Households |
| Dial-Up Internet | 0 | 0.0% |
| Broadband Home | 5,133 | 81.5% |
| Cellular Data Only | 612 | 9.7% |
| Satellite Internet | 419 | 6.7% |
| No Internet | 410 | 6.5% |
| Total | 6,299 | 100.0% |
Calera Summary
Calera, Alabama is a small city located in Shelby County, Alabama. It is situated about 25 miles south of Birmingham and is part of the Birmingham-Hoover Metropolitan Statistical Area. The city was founded in 1887 and has a population of 11,620 as of the 2010 census.
Geography
Calera is located at 33°09'N 86°41'W (33.15, -86.68). It is situated in the foothills of the Appalachian Mountains and is part of the Black Belt region of Alabama. The city is located on the banks of the Cahaba River and is surrounded by rolling hills and forests. The city has a total area of 8.3 square miles, of which 8.2 square miles is land and 0.1 square miles is water.
Climate
Calera has a humid subtropical climate, with hot, humid summers and mild winters. The average annual temperature is 64°F, with an average high of 87°F in July and an average low of 41°F in January. The average annual precipitation is 52.3 inches, with an average of 4.7 inches of snowfall per year.
Demographics
As of the 2010 census, there were 11,620 people, 4,093 households, and 2,945 families residing in the city. The population density was 1,417.3 people per square mile. The racial makeup of the city was 73.3% White, 22.2% African American, 0.3% Native American, 0.7% Asian, 0.1% Pacific Islander, 1.7% from other races, and 1.9% from two or more races. Hispanic or Latino of any race were 3.7% of the population.
Economy
Calera is home to several industries, including manufacturing, retail, and healthcare. The city is home to several large employers, including Honda Manufacturing of Alabama, which produces the Honda Odyssey minivan, and the Calera Medical Center. The city also has a thriving retail sector, with several large shopping centers and restaurants.
Education
Calera is served by the Shelby County School System. The city has two elementary schools, one middle school, and one high school. The city also has a branch of the University of Montevallo, which offers a variety of undergraduate and graduate degree programs.
Conclusion
Calera, Alabama is a small city located in Shelby County, Alabama. It is situated about 25 miles south of Birmingham and is part of the Birmingham-Hoover Metropolitan Statistical Area. The city was founded in 1887 and has a population of 11,620 as of the 2010 census. Calera has a humid subtropical climate, with hot, humid summers and mild winters. As of the 2010 census, there were 11,620 people, 4,093 households, and 2,945 families residing in the city. The city is home to several large employers, including Honda Manufacturing of Alabama, and the Calera Medical Center. The city is served by the Shelby County School System, and has a branch of the University of Montevallo.
Common Questions
What is Per Capita Income in Calera?
Per Capita income in Calera is $34,165.
What is the Median Family Income in Calera?
Median Family Income in Calera is $85,065.
What is the Median Household income in Calera?
Median Household Income in Calera is $73,775.
What is Income or Wage Gap in Calera?
Income or Wage Gap in Calera is 25.1%.
Women in Calera earn 74.9 cents for every dollar earned by a man.
What is Inequality or Gini Index in Calera?
Inequality or Gini Index in Calera is 0.36.
What is the Total Population of Calera?
Total Population of Calera is 16,644.
What is the Total Male Population of Calera?
Total Male Population of Calera is 7,903.
What is the Total Female Population of Calera?
Total Female Population of Calera is 8,741.
What is the Ratio of Males per 100 Females in Calera?
There are 90.41 Males per 100 Females in Calera.
What is the Ratio of Females per 100 Males in Calera?
There are 110.60 Females per 100 Males in Calera.
What is the Median Population Age in Calera?
Median Population Age in Calera is 33.1 Years.
What is the Average Family Size in Calera
Average Family Size in Calera is 3.1 People.
What is the Average Household Size in Calera
Average Household Size in Calera is 2.6 People.
How Large is the Labor Force in Calera?
There are 9,423 People in the Labor Forcein in Calera.
What is the Percentage of People in the Labor Force in Calera?
75.4% of People are in the Labor Force in Calera.
What is the Unemployment Rate in Calera?
Unemployment Rate in Calera is 1.0%.