Grove Hill, AL Map & Demographics
Grove Hill Map
Grove Hill Overview
$32,241
PER CAPITA INCOME
$70,888
AVG FAMILY INCOME
$46,218
AVG HOUSEHOLD INCOME
14.7%
WAGE / INCOME GAP [ % ]
85.3¢/ $1
WAGE / INCOME GAP [ $ ]
0.55
INEQUALITY / GINI INDEX
1,995
TOTAL POPULATION
1,129
MALE POPULATION
866
FEMALE POPULATION
130.37
MALES / 100 FEMALES
76.71
FEMALES / 100 MALES
43.5
MEDIAN AGE
3.2
AVG FAMILY SIZE
2.6
AVG HOUSEHOLD SIZE
852
LABOR FORCE [ PEOPLE ]
49.8%
PERCENT IN LABOR FORCE
13.0%
UNEMPLOYMENT RATE
Grove Hill Zip Codes
Grove Hill Area Codes
Income in Grove Hill
Income Overview in Grove Hill
Per Capita Income in Grove Hill is $32,241, while median incomes of families and households are $70,888 and $46,218 respectively.
| Characteristic | Number | Measure |
| Per Capita Income | 1,995 | $32,241 |
| Median Family Income | 479 | $70,888 |
| Mean Family Income | 479 | $108,052 |
| Median Household Income | 722 | $46,218 |
| Mean Household Income | 722 | $81,332 |
| Income Deficit | 479 | $0 |
| Wage / Income Gap (%) | 1,995 | 14.67% |
| Wage / Income Gap ($) | 1,995 | 85.33¢ per $1 |
| Gini / Inequality Index | 1,995 | 0.55 |
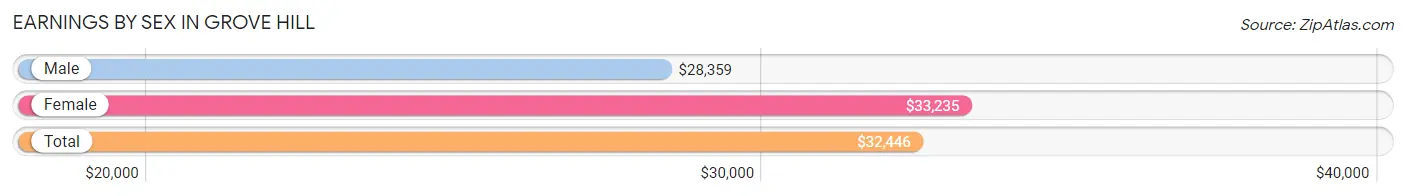
Earnings by Sex in Grove Hill
Average Earnings in Grove Hill are $32,446, $28,359 for men and $33,235 for women, a difference of 14.7%.
| Sex | Number | Average Earnings |
| Male | 541 (59.4%) | $28,359 |
| Female | 370 (40.6%) | $33,235 |
| Total | 911 (100.0%) | $32,446 |
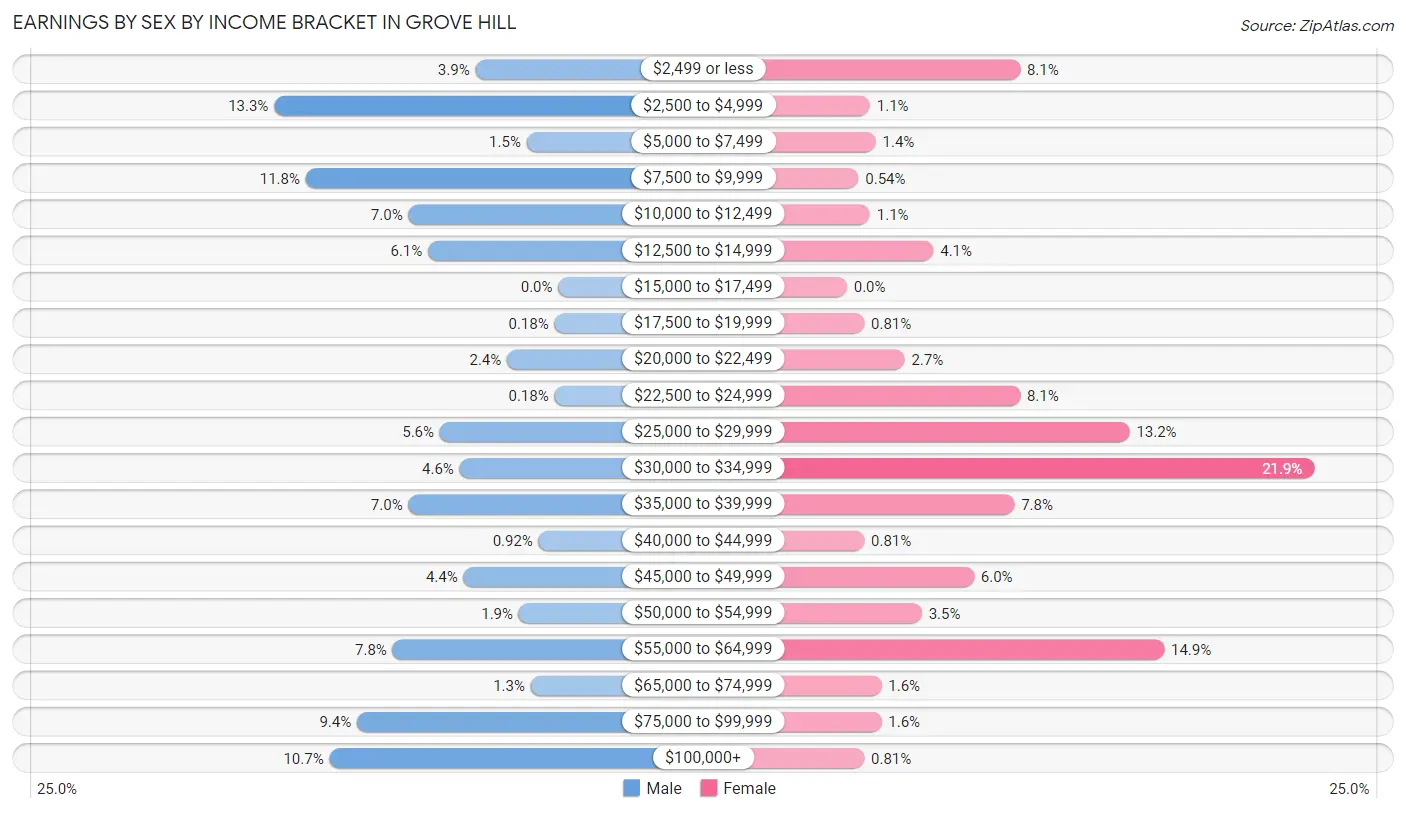
Earnings by Sex by Income Bracket in Grove Hill
The most common earnings brackets in Grove Hill are $2,500 to $4,999 for men (72 | 13.3%) and $30,000 to $34,999 for women (81 | 21.9%).
| Income | Male | Female |
| $2,499 or less | 21 (3.9%) | 30 (8.1%) |
| $2,500 to $4,999 | 72 (13.3%) | 4 (1.1%) |
| $5,000 to $7,499 | 8 (1.5%) | 5 (1.3%) |
| $7,500 to $9,999 | 64 (11.8%) | 2 (0.5%) |
| $10,000 to $12,499 | 38 (7.0%) | 4 (1.1%) |
| $12,500 to $14,999 | 33 (6.1%) | 15 (4.1%) |
| $15,000 to $17,499 | 0 (0.0%) | 0 (0.0%) |
| $17,500 to $19,999 | 1 (0.2%) | 3 (0.8%) |
| $20,000 to $22,499 | 13 (2.4%) | 10 (2.7%) |
| $22,500 to $24,999 | 1 (0.2%) | 30 (8.1%) |
| $25,000 to $29,999 | 30 (5.6%) | 49 (13.2%) |
| $30,000 to $34,999 | 25 (4.6%) | 81 (21.9%) |
| $35,000 to $39,999 | 38 (7.0%) | 29 (7.8%) |
| $40,000 to $44,999 | 5 (0.9%) | 3 (0.8%) |
| $45,000 to $49,999 | 24 (4.4%) | 22 (5.9%) |
| $50,000 to $54,999 | 10 (1.8%) | 13 (3.5%) |
| $55,000 to $64,999 | 42 (7.8%) | 55 (14.9%) |
| $65,000 to $74,999 | 7 (1.3%) | 6 (1.6%) |
| $75,000 to $99,999 | 51 (9.4%) | 6 (1.6%) |
| $100,000+ | 58 (10.7%) | 3 (0.8%) |
| Total | 541 (100.0%) | 370 (100.0%) |
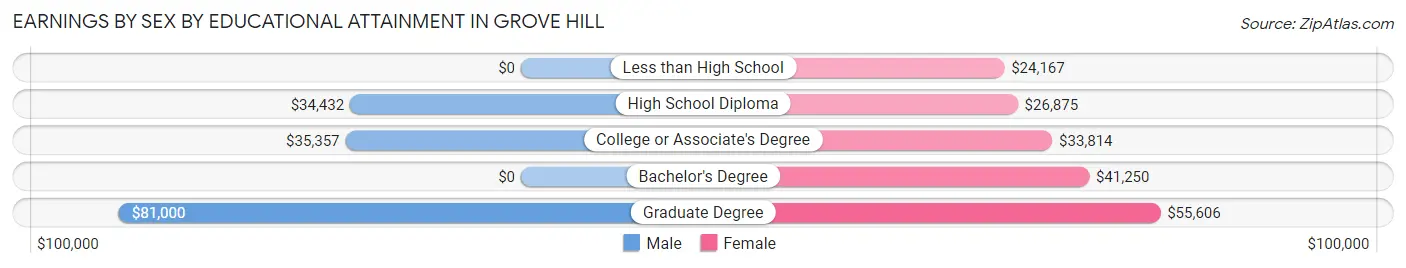
Earnings by Sex by Educational Attainment in Grove Hill
Average earnings in Grove Hill are $36,974 for men and $33,427 for women, a difference of 9.6%. Men with an educational attainment of graduate degree enjoy the highest average annual earnings of $81,000, while those with high school diploma education earn the least with $34,432. Women with an educational attainment of graduate degree earn the most with the average annual earnings of $55,606, while those with less than high school education have the smallest earnings of $24,167.
| Educational Attainment | Male Income | Female Income |
| Less than High School | - | - |
| High School Diploma | $34,432 | $26,875 |
| College or Associate's Degree | $35,357 | $33,814 |
| Bachelor's Degree | - | - |
| Graduate Degree | $81,000 | $55,606 |
| Total | $36,974 | $33,427 |
Family Income in Grove Hill
Family Income Brackets in Grove Hill
According to the Grove Hill family income data, there are 86 families falling into the $75,000 to $99,999 income range, which is the most common income bracket and makes up 17.9% of all families. Conversely, the $15,000 to $24,999 income bracket is the least frequent group with only 4 families (0.8%) belonging to this category.
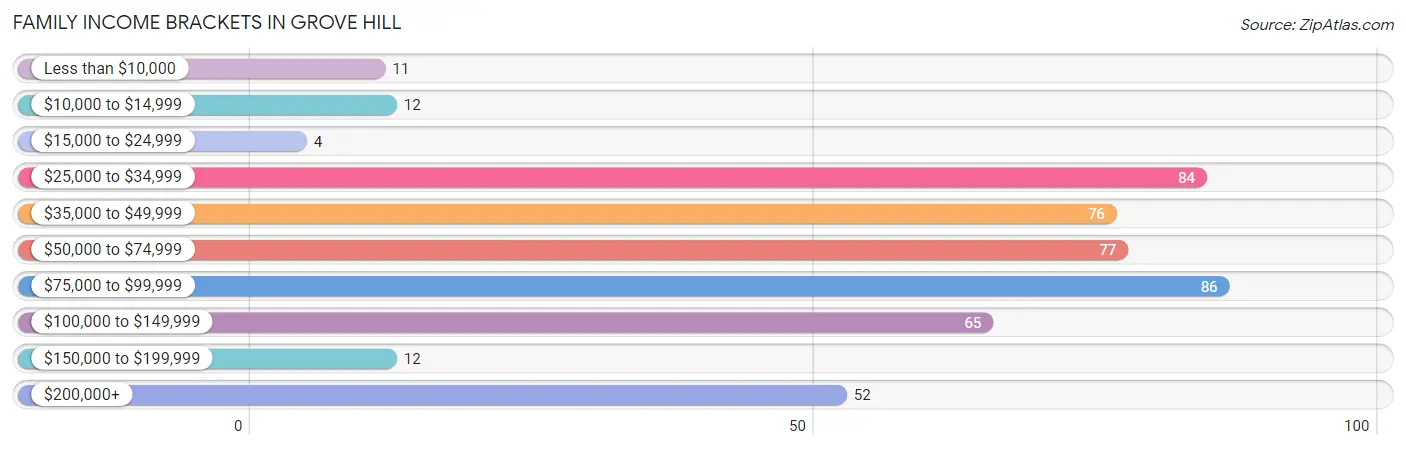
| Income Bracket | # Families | % Families |
| Less than $10,000 | 11 | 2.3% |
| $10,000 to $14,999 | 12 | 2.5% |
| $15,000 to $24,999 | 4 | 0.8% |
| $25,000 to $34,999 | 84 | 17.5% |
| $35,000 to $49,999 | 76 | 15.9% |
| $50,000 to $74,999 | 77 | 16.1% |
| $75,000 to $99,999 | 86 | 18.0% |
| $100,000 to $149,999 | 65 | 13.6% |
| $150,000 to $199,999 | 12 | 2.5% |
| $200,000+ | 52 | 10.9% |
Family Income by Famaliy Size in Grove Hill
2-person families (286 | 59.7%) account for the highest median family income in Grove Hill with $56,364 per family, while 2-person families (286 | 59.7%) have the highest median income of $28,182 per family member.
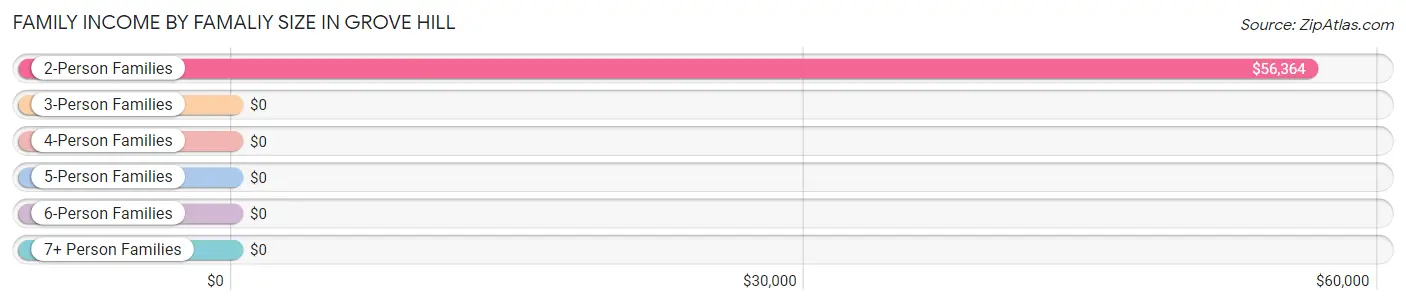
| Income Bracket | # Families | Median Income |
| 2-Person Families | 286 (59.7%) | $56,364 |
| 3-Person Families | 127 (26.5%) | $0 |
| 4-Person Families | 54 (11.3%) | $0 |
| 5-Person Families | 10 (2.1%) | $0 |
| 6-Person Families | 2 (0.4%) | $0 |
| 7+ Person Families | 0 (0.0%) | $0 |
| Total | 479 (100.0%) | $70,888 |
Family Income by Number of Earners in Grove Hill
The median family income in Grove Hill is $70,888, with families comprising 2 earners (206) having the highest median family income of $102,857, while families with no earners (88) have the lowest median family income of $31,458, accounting for 43.0% and 18.4% of families, respectively.
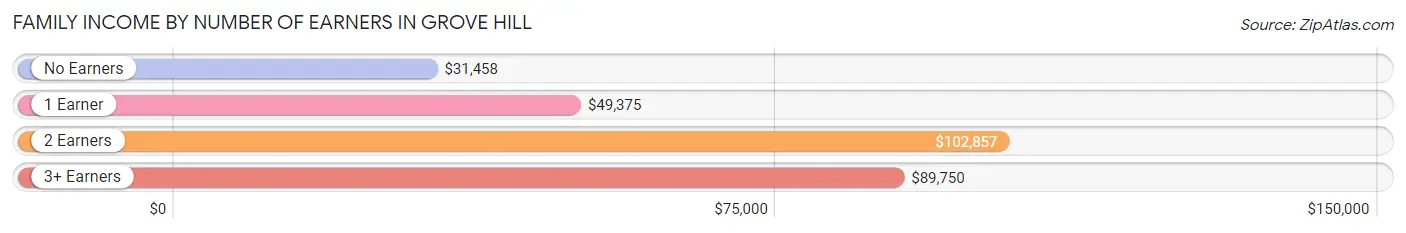
| Number of Earners | # Families | Median Income |
| No Earners | 88 (18.4%) | $31,458 |
| 1 Earner | 168 (35.1%) | $49,375 |
| 2 Earners | 206 (43.0%) | $102,857 |
| 3+ Earners | 17 (3.5%) | $89,750 |
| Total | 479 (100.0%) | $70,888 |
Household Income in Grove Hill
Household Income Brackets in Grove Hill
With 128 households falling in the category, the $25,000 to $34,999 income range is the most frequent in Grove Hill, accounting for 17.7% of all households. In contrast, only 12 households (1.7%) fall into the $150,000 to $199,999 income bracket, making it the least populous group.
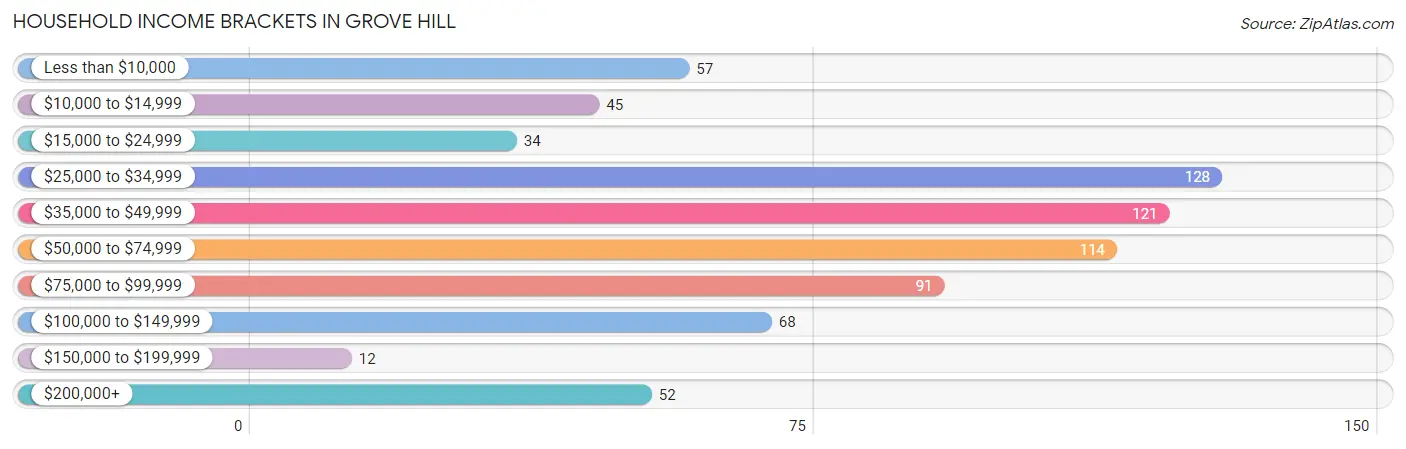
| Income Bracket | # Households | % Households |
| Less than $10,000 | 57 | 7.9% |
| $10,000 to $14,999 | 45 | 6.2% |
| $15,000 to $24,999 | 34 | 4.7% |
| $25,000 to $34,999 | 128 | 17.7% |
| $35,000 to $49,999 | 121 | 16.8% |
| $50,000 to $74,999 | 114 | 15.8% |
| $75,000 to $99,999 | 91 | 12.6% |
| $100,000 to $149,999 | 68 | 9.4% |
| $150,000 to $199,999 | 12 | 1.7% |
| $200,000+ | 52 | 7.2% |
Household Income by Householder Age in Grove Hill
The median household income in Grove Hill is $46,218, with the highest median household income of $68,750 found in the 25 to 44 years age bracket for the primary householder. A total of 142 households (19.7%) fall into this category. Meanwhile, the 15 to 24 years age bracket for the primary householder has the lowest median household income of $0, with 8 households (1.1%) in this group.
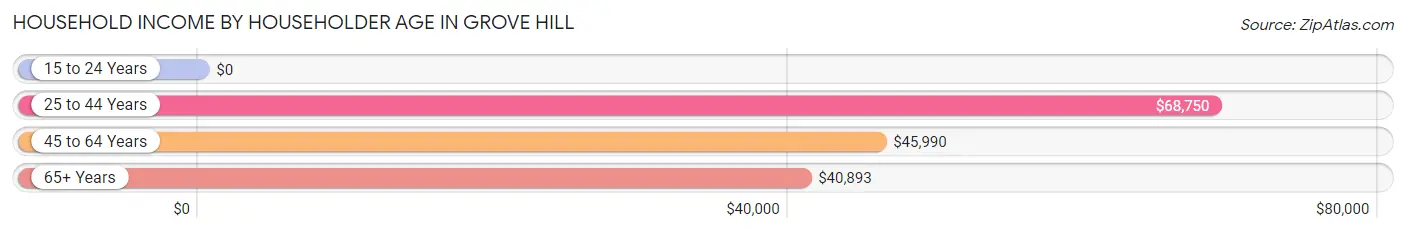
| Income Bracket | # Households | Median Income |
| 15 to 24 Years | 8 (1.1%) | $0 |
| 25 to 44 Years | 142 (19.7%) | $68,750 |
| 45 to 64 Years | 361 (50.0%) | $45,990 |
| 65+ Years | 211 (29.2%) | $40,893 |
| Total | 722 (100.0%) | $46,218 |
Poverty in Grove Hill
Income Below Poverty by Sex and Age in Grove Hill
With 21.7% poverty level for males and 16.5% for females among the residents of Grove Hill, 5 year old males and 18 to 24 year old females are the most vulnerable to poverty, with 4 males (100.0%) and 17 females (48.6%) in their respective age groups living below the poverty level.
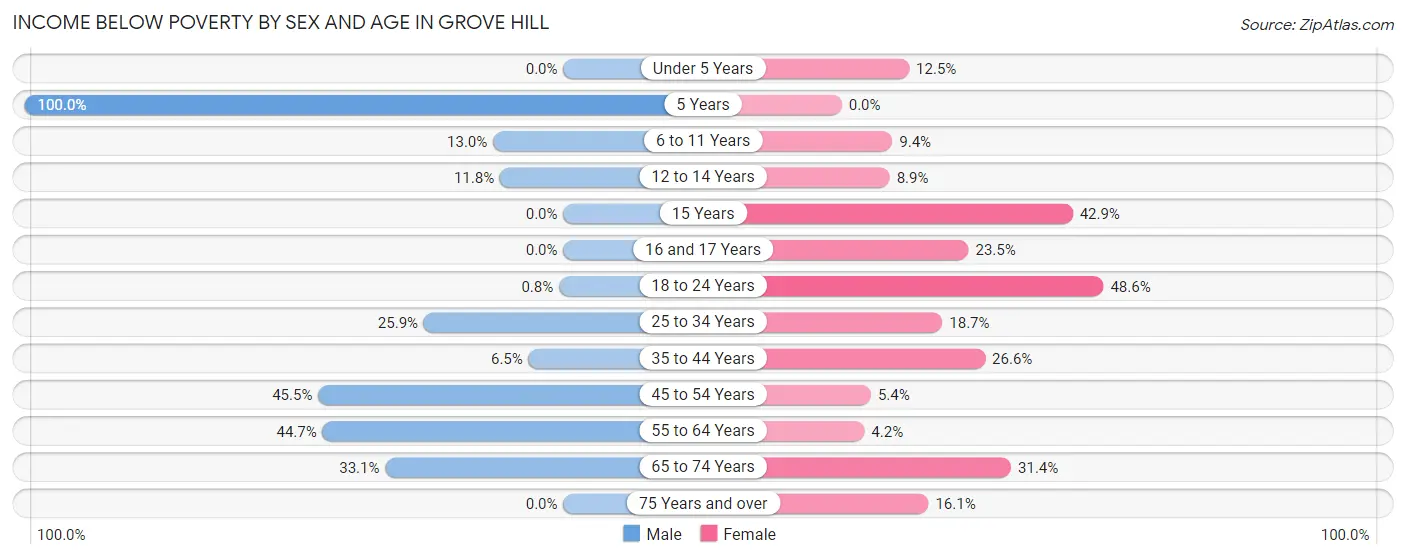
| Age Bracket | Male | Female |
| Under 5 Years | 0 (0.0%) | 3 (12.5%) |
| 5 Years | 4 (100.0%) | 0 (0.0%) |
| 6 to 11 Years | 3 (13.0%) | 3 (9.4%) |
| 12 to 14 Years | 6 (11.8%) | 4 (8.9%) |
| 15 Years | 0 (0.0%) | 3 (42.9%) |
| 16 and 17 Years | 0 (0.0%) | 12 (23.5%) |
| 18 to 24 Years | 2 (0.8%) | 17 (48.6%) |
| 25 to 34 Years | 22 (25.9%) | 14 (18.7%) |
| 35 to 44 Years | 4 (6.5%) | 33 (26.6%) |
| 45 to 54 Years | 91 (45.5%) | 8 (5.4%) |
| 55 to 64 Years | 59 (44.7%) | 6 (4.2%) |
| 65 to 74 Years | 39 (33.1%) | 22 (31.4%) |
| 75 Years and over | 0 (0.0%) | 14 (16.1%) |
| Total | 230 (21.7%) | 139 (16.5%) |
Income Above Poverty by Sex and Age in Grove Hill
According to the poverty statistics in Grove Hill, males aged under 5 years and females aged 55 to 64 years are the age groups that are most secure financially, with 100.0% of males and 95.8% of females in these age groups living above the poverty line.
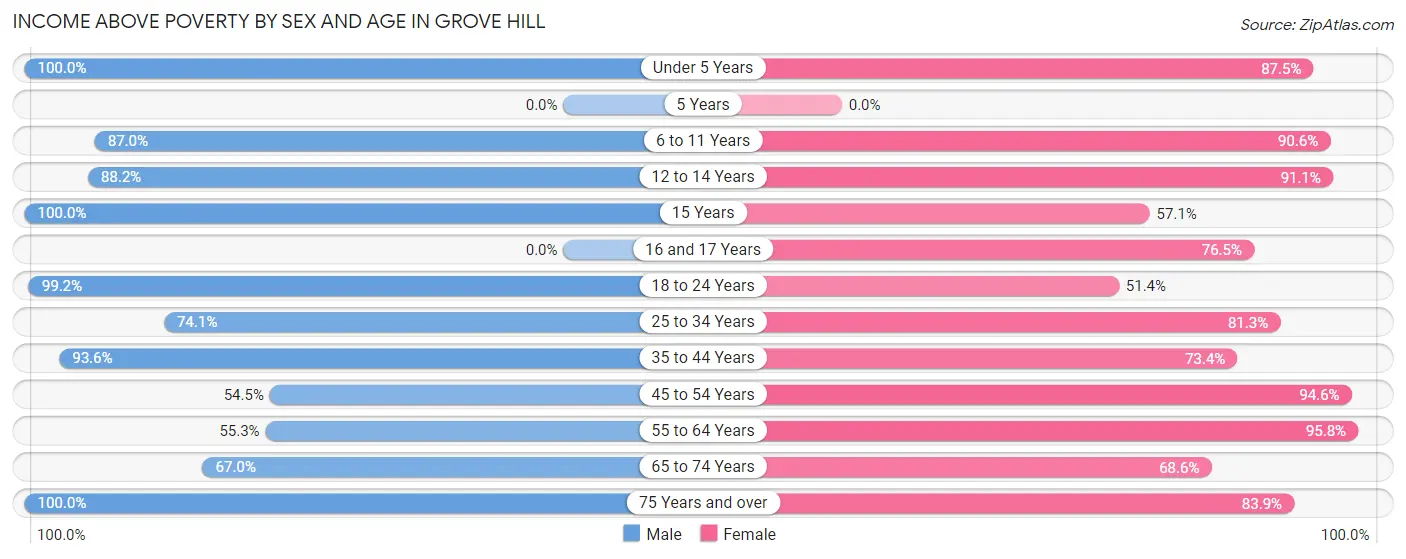
| Age Bracket | Male | Female |
| Under 5 Years | 8 (100.0%) | 21 (87.5%) |
| 5 Years | 0 (0.0%) | 0 (0.0%) |
| 6 to 11 Years | 20 (87.0%) | 29 (90.6%) |
| 12 to 14 Years | 45 (88.2%) | 41 (91.1%) |
| 15 Years | 78 (100.0%) | 4 (57.1%) |
| 16 and 17 Years | 0 (0.0%) | 39 (76.5%) |
| 18 to 24 Years | 248 (99.2%) | 18 (51.4%) |
| 25 to 34 Years | 63 (74.1%) | 61 (81.3%) |
| 35 to 44 Years | 58 (93.5%) | 91 (73.4%) |
| 45 to 54 Years | 109 (54.5%) | 140 (94.6%) |
| 55 to 64 Years | 73 (55.3%) | 137 (95.8%) |
| 65 to 74 Years | 79 (66.9%) | 48 (68.6%) |
| 75 Years and over | 50 (100.0%) | 73 (83.9%) |
| Total | 831 (78.3%) | 702 (83.5%) |
Income Below Poverty Among Married-Couple Families in Grove Hill
The poverty statistics for married-couple families in Grove Hill show that 7.6% or 19 of the total 250 families live below the poverty line. Families with no children have the highest poverty rate of 10.5%, comprising of 19 families. On the other hand, families with 1 or 2 children have the lowest poverty rate of 0.0%, which includes 0 families.
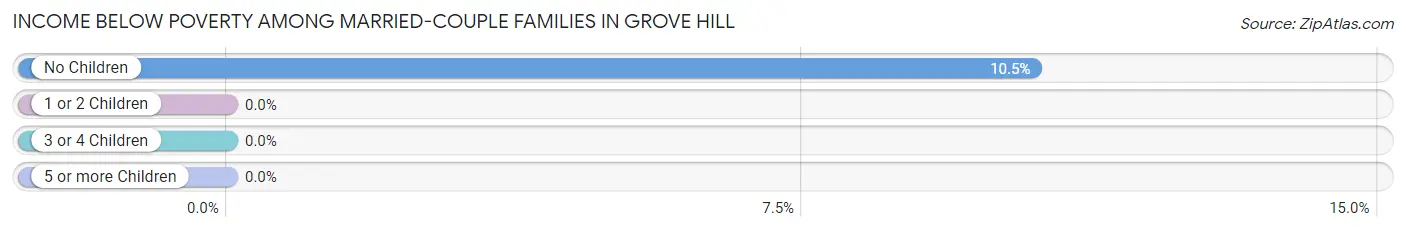
| Children | Above Poverty | Below Poverty |
| No Children | 162 (89.5%) | 19 (10.5%) |
| 1 or 2 Children | 63 (100.0%) | 0 (0.0%) |
| 3 or 4 Children | 6 (100.0%) | 0 (0.0%) |
| 5 or more Children | 0 (0.0%) | 0 (0.0%) |
| Total | 231 (92.4%) | 19 (7.6%) |
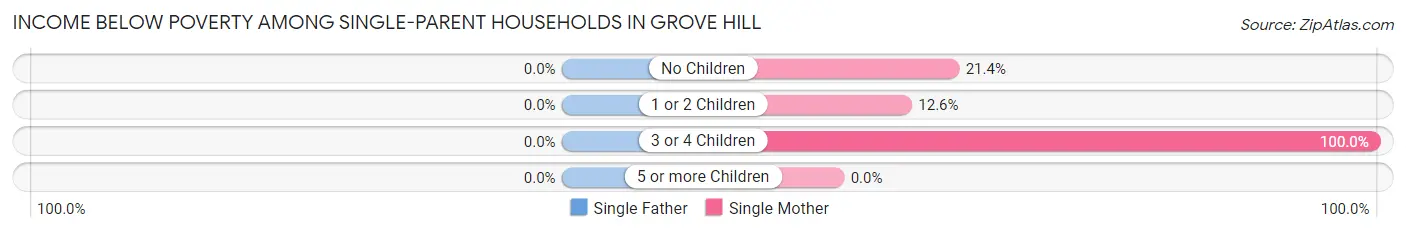
Income Below Poverty Among Single-Parent Households in Grove Hill
| Children | Single Father | Single Mother |
| No Children | 0 (0.0%) | 12 (21.4%) |
| 1 or 2 Children | 0 (0.0%) | 14 (12.6%) |
| 3 or 4 Children | 0 (0.0%) | 2 (100.0%) |
| 5 or more Children | 0 (0.0%) | 0 (0.0%) |
| Total | 0 (0.0%) | 28 (16.6%) |
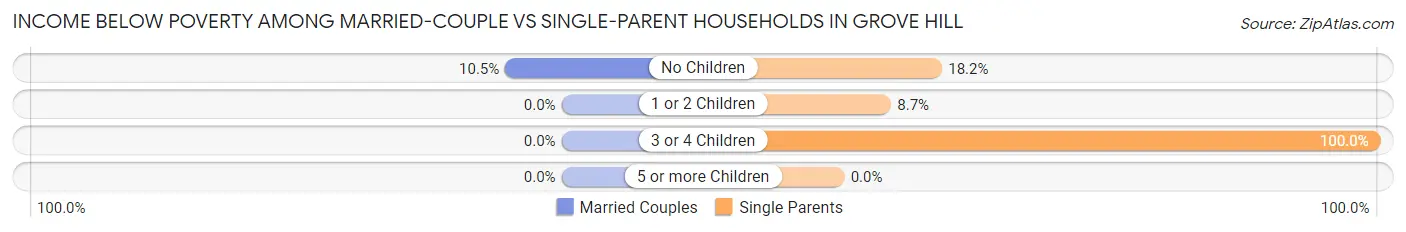
Income Below Poverty Among Married-Couple vs Single-Parent Households in Grove Hill
The poverty data for Grove Hill shows that 19 of the married-couple family households (7.6%) and 28 of the single-parent households (12.2%) are living below the poverty level. Within the married-couple family households, those with no children have the highest poverty rate, with 19 households (10.5%) falling below the poverty line. Among the single-parent households, those with 3 or 4 children have the highest poverty rate, with 2 household (100.0%) living below poverty.
| Children | Married-Couple Families | Single-Parent Households |
| No Children | 19 (10.5%) | 12 (18.2%) |
| 1 or 2 Children | 0 (0.0%) | 14 (8.7%) |
| 3 or 4 Children | 0 (0.0%) | 2 (100.0%) |
| 5 or more Children | 0 (0.0%) | 0 (0.0%) |
| Total | 19 (7.6%) | 28 (12.2%) |
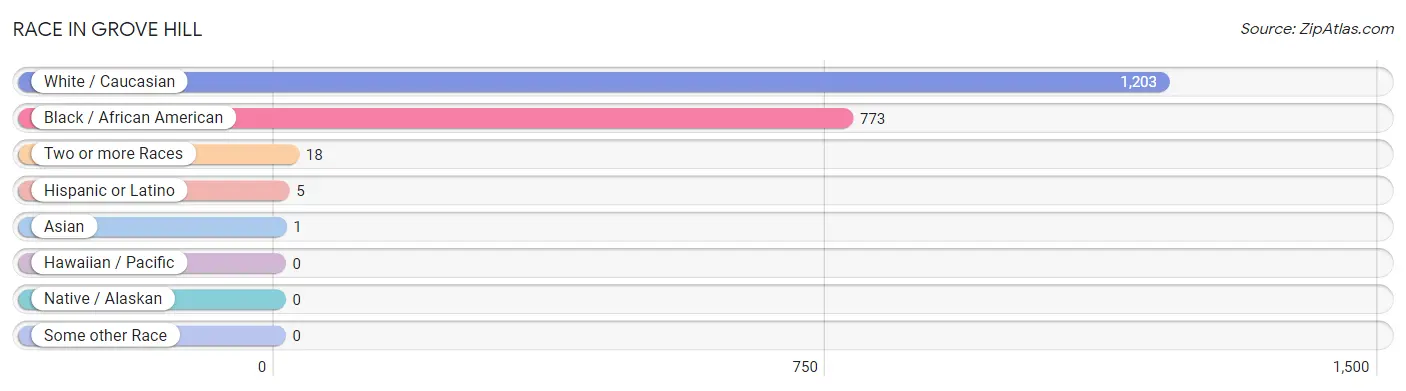
Race in Grove Hill
The most populous races in Grove Hill are White / Caucasian (1,203 | 60.3%), Black / African American (773 | 38.8%), and Two or more Races (18 | 0.9%).
| Race | # Population | % Population |
| Asian | 1 | 0.1% |
| Black / African American | 773 | 38.8% |
| Hawaiian / Pacific | 0 | 0.0% |
| Hispanic or Latino | 5 | 0.3% |
| Native / Alaskan | 0 | 0.0% |
| White / Caucasian | 1,203 | 60.3% |
| Two or more Races | 18 | 0.9% |
| Some other Race | 0 | 0.0% |
| Total | 1,995 | 100.0% |
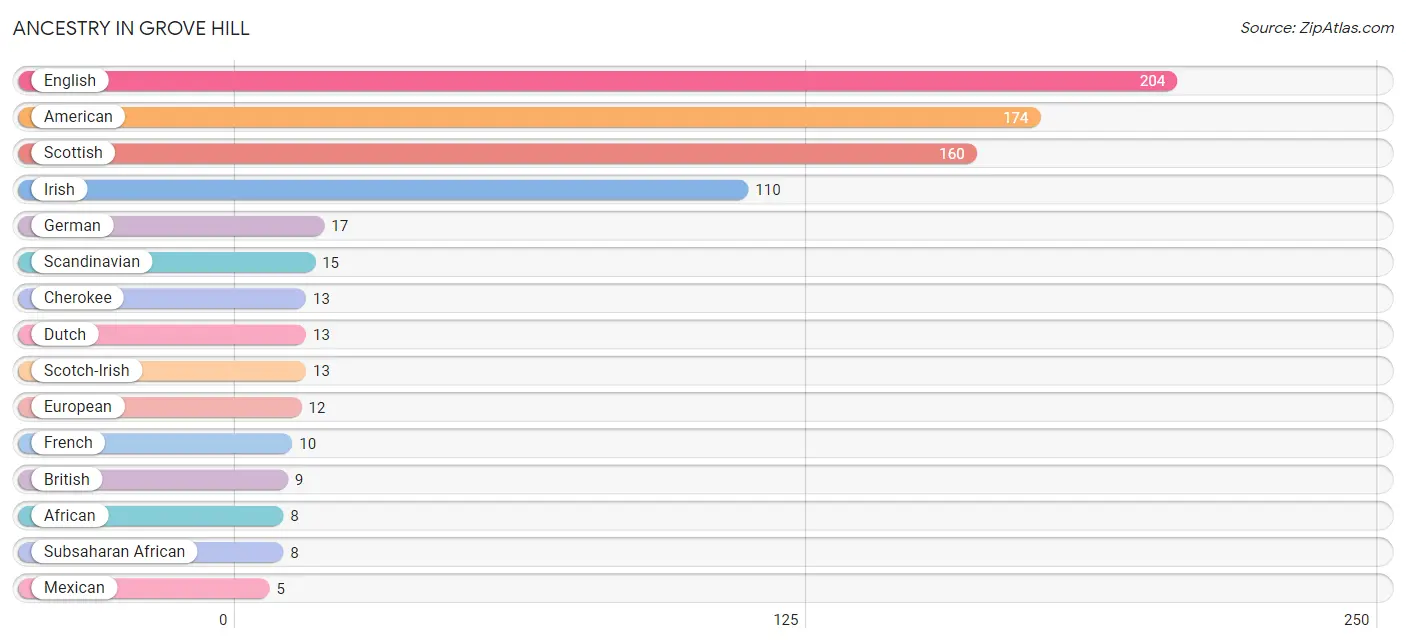
Ancestry in Grove Hill
The most populous ancestries reported in Grove Hill are English (204 | 10.2%), American (174 | 8.7%), Scottish (160 | 8.0%), Irish (110 | 5.5%), and German (17 | 0.9%), together accounting for 33.3% of all Grove Hill residents.
| Ancestry | # Population | % Population |
| African | 8 | 0.4% |
| American | 174 | 8.7% |
| British | 9 | 0.4% |
| Cherokee | 13 | 0.6% |
| Dutch | 13 | 0.6% |
| English | 204 | 10.2% |
| European | 12 | 0.6% |
| French | 10 | 0.5% |
| French Canadian | 3 | 0.2% |
| German | 17 | 0.9% |
| Irish | 110 | 5.5% |
| Mexican | 5 | 0.3% |
| Scandinavian | 15 | 0.7% |
| Scotch-Irish | 13 | 0.6% |
| Scottish | 160 | 8.0% |
| Subsaharan African | 8 | 0.4% |
| Thai | 1 | 0.1% | View All 17 Rows |
Immigrants in Grove Hill
The most numerous immigrant groups reported in Grove Hill came from Central America (5 | 0.3%), Latin America (5 | 0.3%), Mexico (5 | 0.3%), Asia (1 | 0.1%), and India (1 | 0.1%), together accounting for 0.9% of all Grove Hill residents.
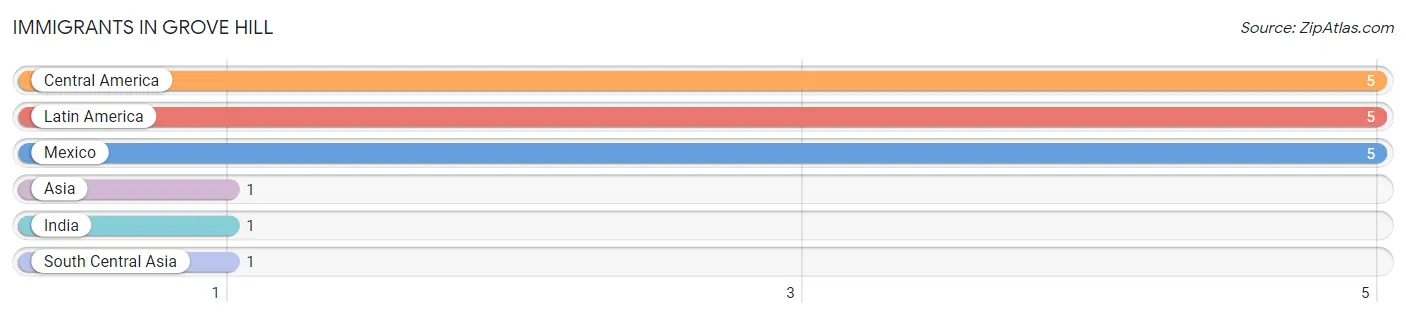
| Immigration Origin | # Population | % Population |
| Asia | 1 | 0.1% |
| Central America | 5 | 0.3% |
| India | 1 | 0.1% |
| Latin America | 5 | 0.3% |
| Mexico | 5 | 0.3% |
| South Central Asia | 1 | 0.1% | View All 6 Rows |
Sex and Age in Grove Hill
Sex and Age in Grove Hill
The most populous age groups in Grove Hill are 20 to 24 Years (202 | 17.9%) for men and 45 to 49 Years (104 | 12.0%) for women.
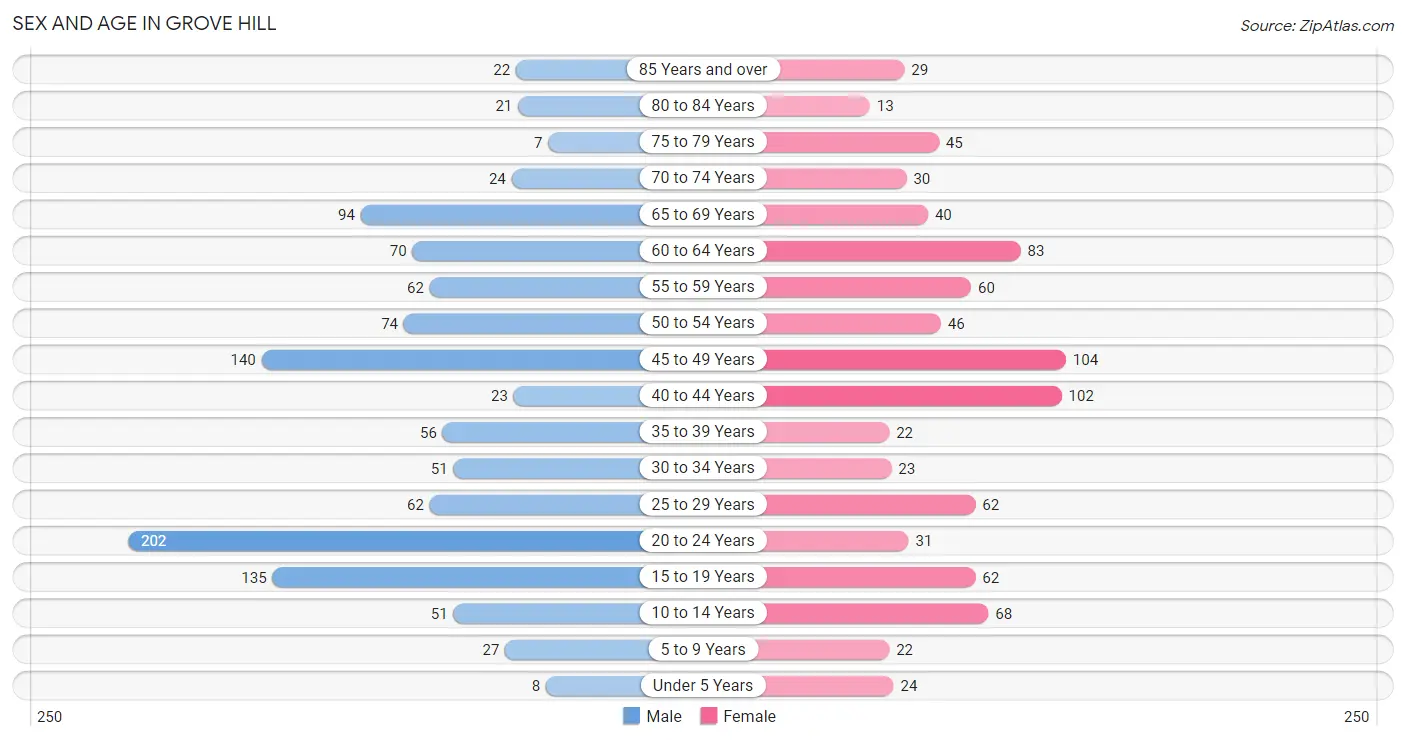
| Age Bracket | Male | Female |
| Under 5 Years | 8 (0.7%) | 24 (2.8%) |
| 5 to 9 Years | 27 (2.4%) | 22 (2.5%) |
| 10 to 14 Years | 51 (4.5%) | 68 (7.9%) |
| 15 to 19 Years | 135 (12.0%) | 62 (7.2%) |
| 20 to 24 Years | 202 (17.9%) | 31 (3.6%) |
| 25 to 29 Years | 62 (5.5%) | 62 (7.2%) |
| 30 to 34 Years | 51 (4.5%) | 23 (2.7%) |
| 35 to 39 Years | 56 (5.0%) | 22 (2.5%) |
| 40 to 44 Years | 23 (2.0%) | 102 (11.8%) |
| 45 to 49 Years | 140 (12.4%) | 104 (12.0%) |
| 50 to 54 Years | 74 (6.6%) | 46 (5.3%) |
| 55 to 59 Years | 62 (5.5%) | 60 (6.9%) |
| 60 to 64 Years | 70 (6.2%) | 83 (9.6%) |
| 65 to 69 Years | 94 (8.3%) | 40 (4.6%) |
| 70 to 74 Years | 24 (2.1%) | 30 (3.5%) |
| 75 to 79 Years | 7 (0.6%) | 45 (5.2%) |
| 80 to 84 Years | 21 (1.9%) | 13 (1.5%) |
| 85 Years and over | 22 (1.9%) | 29 (3.4%) |
| Total | 1,129 (100.0%) | 866 (100.0%) |
Families and Households in Grove Hill
Median Family Size in Grove Hill
The median family size in Grove Hill is 3.25 persons per family, with single male/father families (60 | 12.5%) accounting for the largest median family size of 3.53 persons per family. On the other hand, single female/mother families (169 | 35.3%) represent the smallest median family size with 2.95 persons per family.
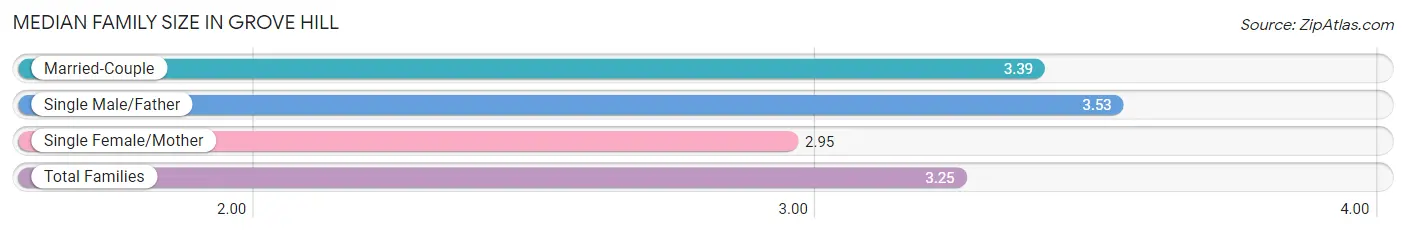
| Family Type | # Families | Family Size |
| Married-Couple | 250 (52.2%) | 3.39 |
| Single Male/Father | 60 (12.5%) | 3.53 |
| Single Female/Mother | 169 (35.3%) | 2.95 |
| Total Families | 479 (100.0%) | 3.25 |
Median Household Size in Grove Hill
The median household size in Grove Hill is 2.61 persons per household, with single male/father households (60 | 8.3%) accounting for the largest median household size of 4.12 persons per household. non-family households (243 | 33.7%) represent the smallest median household size with 1.02 persons per household.
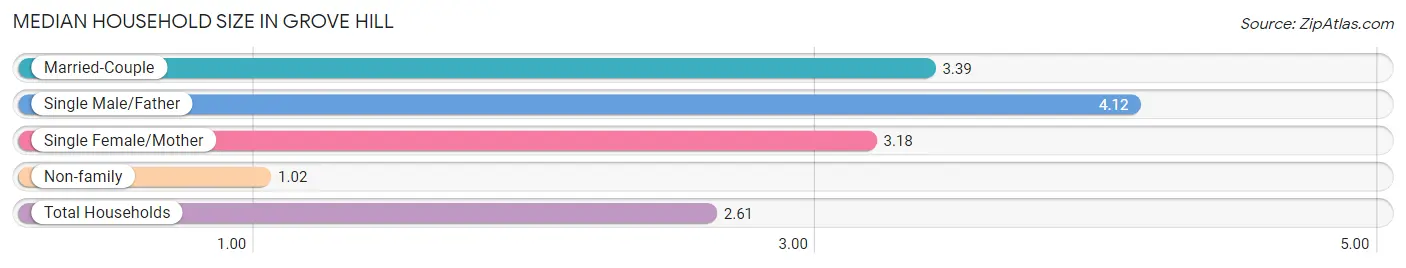
| Household Type | # Households | Household Size |
| Married-Couple | 250 (34.6%) | 3.39 |
| Single Male/Father | 60 (8.3%) | 4.12 |
| Single Female/Mother | 169 (23.4%) | 3.18 |
| Non-family | 243 (33.7%) | 1.02 |
| Total Households | 722 (100.0%) | 2.61 |
Household Size by Marriage Status in Grove Hill
Out of a total of 722 households in Grove Hill, 479 (66.3%) are family households, while 243 (33.7%) are nonfamily households. The most numerous type of family households are 2-person households, comprising 271, and the most common type of nonfamily households are 1-person households, comprising 241.
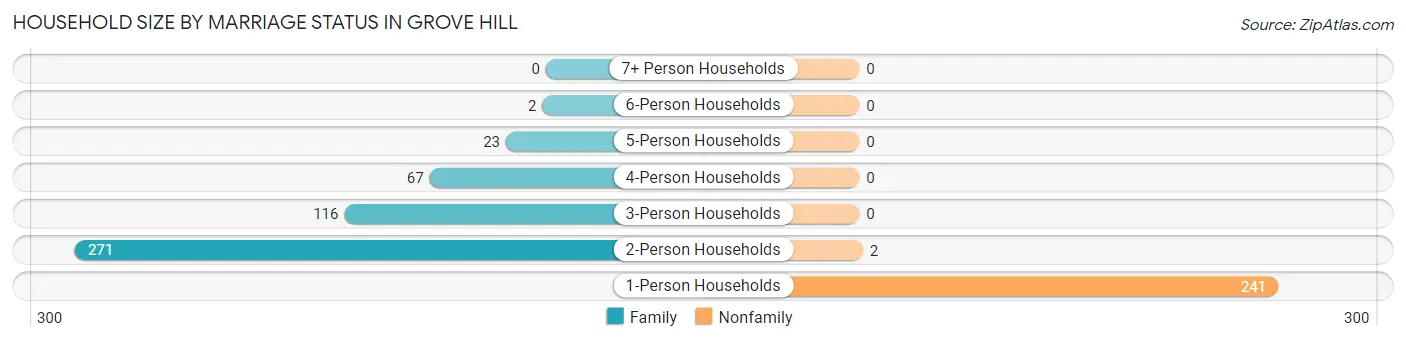
| Household Size | Family Households | Nonfamily Households |
| 1-Person Households | - | 241 (33.4%) |
| 2-Person Households | 271 (37.5%) | 2 (0.3%) |
| 3-Person Households | 116 (16.1%) | 0 (0.0%) |
| 4-Person Households | 67 (9.3%) | 0 (0.0%) |
| 5-Person Households | 23 (3.2%) | 0 (0.0%) |
| 6-Person Households | 2 (0.3%) | 0 (0.0%) |
| 7+ Person Households | 0 (0.0%) | 0 (0.0%) |
| Total | 479 (66.3%) | 243 (33.7%) |
Female Fertility in Grove Hill
Fertility by Age in Grove Hill
Average fertility rate in Grove Hill is 47.0 births per 1,000 women. Women in the age bracket of 20 to 34 years have the highest fertility rate with 164.0 births per 1,000 women. Women in the age bracket of 20 to 34 years acount for 100.0% of all women with births.
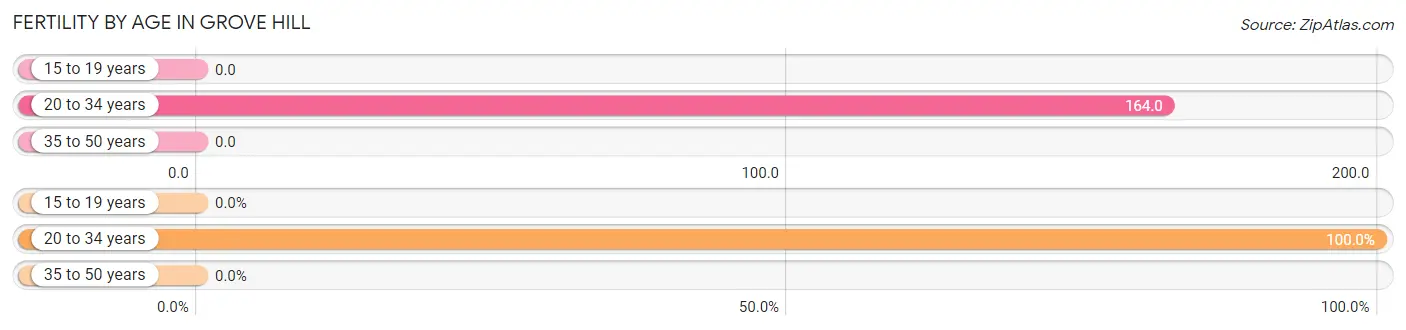
| Age Bracket | Women with Births | Births / 1,000 Women |
| 15 to 19 years | 0 (0.0%) | 0.0 |
| 20 to 34 years | 19 (100.0%) | 164.0 |
| 35 to 50 years | 0 (0.0%) | 0.0 |
| Total | 19 (100.0%) | 47.0 |
Fertility by Age by Marriage Status in Grove Hill
78.9% of women with births (19) in Grove Hill are married. The highest percentage of unmarried women with births falls into 20 to 34 years age bracket with 21.0% of them unmarried at the time of birth, while the lowest percentage of unmarried women with births belong to 20 to 34 years age bracket with 21.1% of them unmarried.
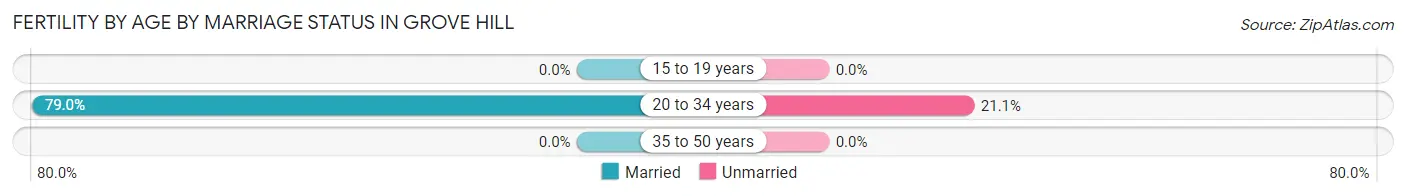
| Age Bracket | Married | Unmarried |
| 15 to 19 years | 0 (0.0%) | 0 (0.0%) |
| 20 to 34 years | 15 (78.9%) | 4 (21.0%) |
| 35 to 50 years | 0 (0.0%) | 0 (0.0%) |
| Total | 15 (78.9%) | 4 (21.0%) |
Fertility by Education in Grove Hill
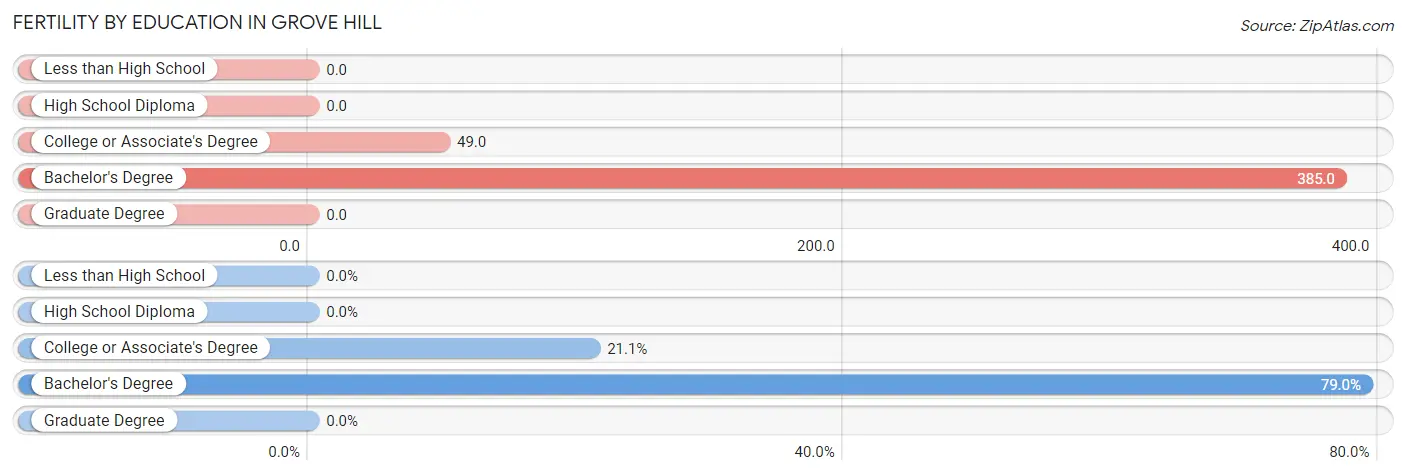
| Educational Attainment | Women with Births | Births / 1,000 Women |
| Less than High School | 0 (0.0%) | 0.0 |
| High School Diploma | 0 (0.0%) | 0.0 |
| College or Associate's Degree | 4 (21.0%) | 49.0 |
| Bachelor's Degree | 15 (78.9%) | 385.0 |
| Graduate Degree | 0 (0.0%) | 0.0 |
| Total | 19 (100.0%) | 47.0 |
Fertility by Education by Marriage Status in Grove Hill
21.0% of women with births in Grove Hill are unmarried. Women with the educational attainment of bachelor's degree are most likely to be married with 100.0% of them married at childbirth, while women with the educational attainment of college or associate's degree are least likely to be married with 100.0% of them unmarried at childbirth.
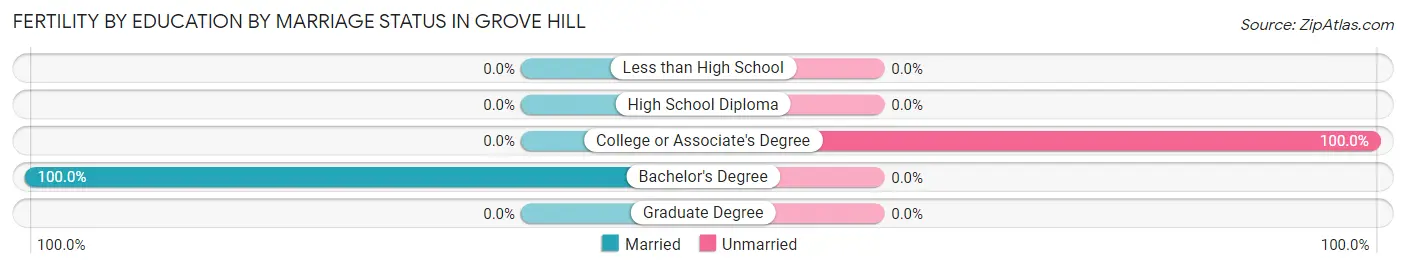
| Educational Attainment | Married | Unmarried |
| Less than High School | 0 (0.0%) | 0 (0.0%) |
| High School Diploma | 0 (0.0%) | 0 (0.0%) |
| College or Associate's Degree | 0 (0.0%) | 4 (100.0%) |
| Bachelor's Degree | 15 (100.0%) | 0 (0.0%) |
| Graduate Degree | 0 (0.0%) | 0 (0.0%) |
| Total | 15 (78.9%) | 4 (21.0%) |
Employment Characteristics in Grove Hill
Employment by Class of Employer in Grove Hill
Among the 732 employed individuals in Grove Hill, private company employees (477 | 65.2%), local government employees (112 | 15.3%), and not-for-profit organizations (38 | 5.2%) make up the most common classes of employment.
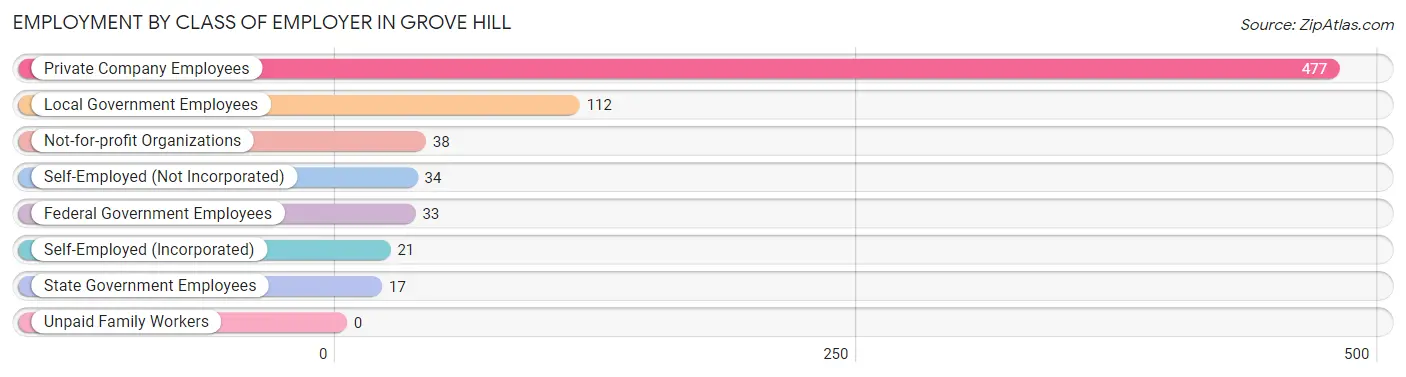
| Employer Class | # Employees | % Employees |
| Private Company Employees | 477 | 65.2% |
| Self-Employed (Incorporated) | 21 | 2.9% |
| Self-Employed (Not Incorporated) | 34 | 4.6% |
| Not-for-profit Organizations | 38 | 5.2% |
| Local Government Employees | 112 | 15.3% |
| State Government Employees | 17 | 2.3% |
| Federal Government Employees | 33 | 4.5% |
| Unpaid Family Workers | 0 | 0.0% |
| Total | 732 | 100.0% |
Employment Status by Age in Grove Hill
According to the labor force statistics for Grove Hill, out of the total population over 16 years of age (1,710), 49.8% or 852 individuals are in the labor force, with 13.0% or 111 of them unemployed. The age group with the highest labor force participation rate is 25 to 29 years, with 76.6% or 95 individuals in the labor force. Within the labor force, the 65 to 74 years age range has the highest percentage of unemployed individuals, with 38.5% or 25 of them being unemployed.
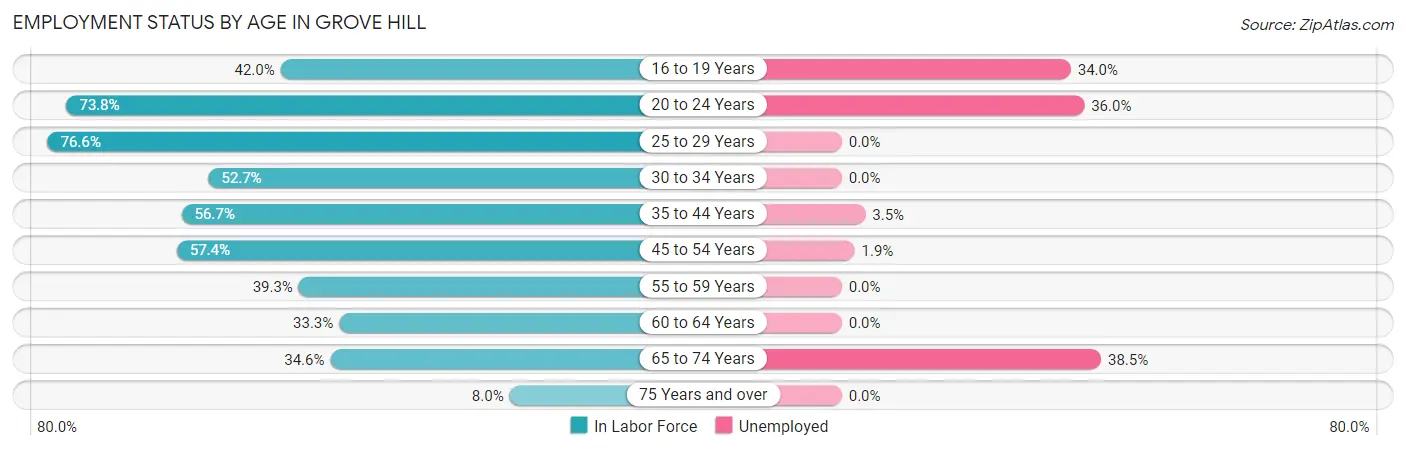
| Age Bracket | In Labor Force | Unemployed |
| 16 to 19 Years | 47 (42.0%) | 16 (34.0%) |
| 20 to 24 Years | 172 (73.8%) | 62 (36.0%) |
| 25 to 29 Years | 95 (76.6%) | 0 (0.0%) |
| 30 to 34 Years | 39 (52.7%) | 0 (0.0%) |
| 35 to 44 Years | 115 (56.7%) | 4 (3.5%) |
| 45 to 54 Years | 209 (57.4%) | 4 (1.9%) |
| 55 to 59 Years | 48 (39.3%) | 0 (0.0%) |
| 60 to 64 Years | 51 (33.3%) | 0 (0.0%) |
| 65 to 74 Years | 65 (34.6%) | 25 (38.5%) |
| 75 Years and over | 11 (8.0%) | 0 (0.0%) |
| Total | 852 (49.8%) | 111 (13.0%) |
Employment Status by Educational Attainment in Grove Hill
According to labor force statistics for Grove Hill, 53.6% of individuals (557) out of the total population between 25 and 64 years of age (1,040) are in the labor force, with 1.4% or 8 of them being unemployed. The group with the highest labor force participation rate are those with the educational attainment of bachelor's degree or higher, with 98.0% or 242 individuals in the labor force. Within the labor force, individuals with high school diploma education have the highest percentage of unemployment, with 3.5% or 4 of them being unemployed.
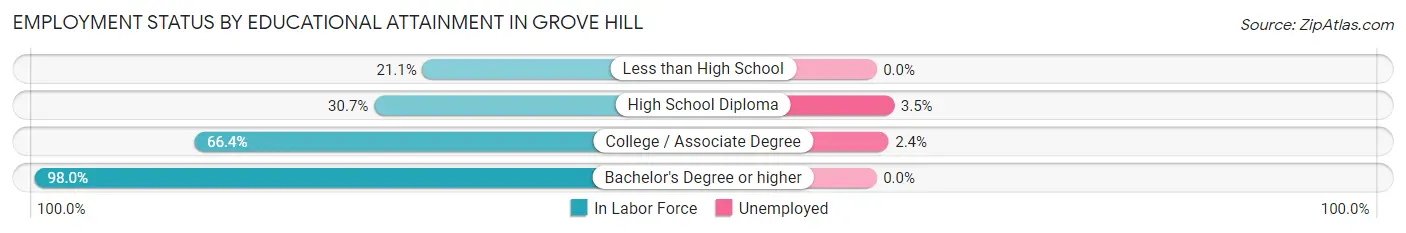
| Educational Attainment | In Labor Force | Unemployed |
| Less than High School | 36 (21.1%) | 0 (0.0%) |
| High School Diploma | 115 (30.7%) | 13 (3.5%) |
| College / Associate Degree | 164 (66.4%) | 6 (2.4%) |
| Bachelor's Degree or higher | 242 (98.0%) | 0 (0.0%) |
| Total | 557 (53.6%) | 15 (1.4%) |
Employment Occupations by Sex in Grove Hill
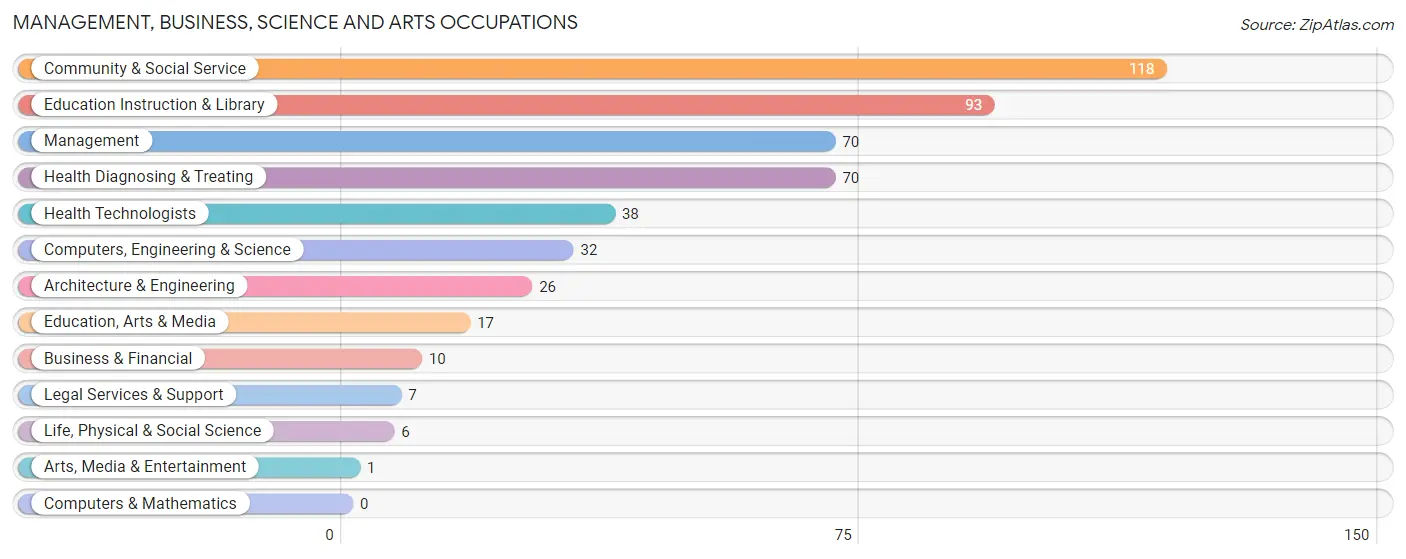
Management, Business, Science and Arts Occupations
The most common Management, Business, Science and Arts occupations in Grove Hill are Community & Social Service (118 | 15.9%), Education Instruction & Library (93 | 12.6%), Management (70 | 9.5%), Health Diagnosing & Treating (70 | 9.5%), and Health Technologists (38 | 5.1%).
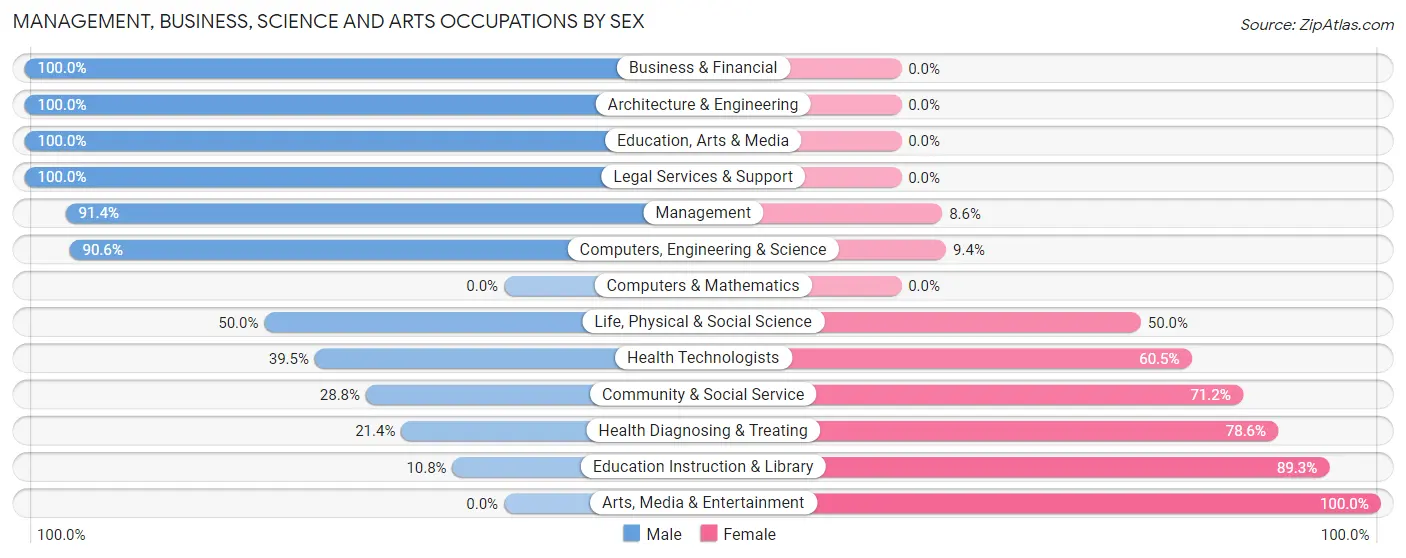
Management, Business, Science and Arts Occupations by Sex
Within the Management, Business, Science and Arts occupations in Grove Hill, the most male-oriented occupations are Business & Financial (100.0%), Architecture & Engineering (100.0%), and Education, Arts & Media (100.0%), while the most female-oriented occupations are Arts, Media & Entertainment (100.0%), Education Instruction & Library (89.2%), and Health Diagnosing & Treating (78.6%).
| Occupation | Male | Female |
| Management | 64 (91.4%) | 6 (8.6%) |
| Business & Financial | 10 (100.0%) | 0 (0.0%) |
| Computers, Engineering & Science | 29 (90.6%) | 3 (9.4%) |
| Computers & Mathematics | 0 (0.0%) | 0 (0.0%) |
| Architecture & Engineering | 26 (100.0%) | 0 (0.0%) |
| Life, Physical & Social Science | 3 (50.0%) | 3 (50.0%) |
| Community & Social Service | 34 (28.8%) | 84 (71.2%) |
| Education, Arts & Media | 17 (100.0%) | 0 (0.0%) |
| Legal Services & Support | 7 (100.0%) | 0 (0.0%) |
| Education Instruction & Library | 10 (10.7%) | 83 (89.2%) |
| Arts, Media & Entertainment | 0 (0.0%) | 1 (100.0%) |
| Health Diagnosing & Treating | 15 (21.4%) | 55 (78.6%) |
| Health Technologists | 15 (39.5%) | 23 (60.5%) |
| Total (Category) | 152 (50.7%) | 148 (49.3%) |
| Total (Overall) | 408 (55.1%) | 333 (44.9%) |
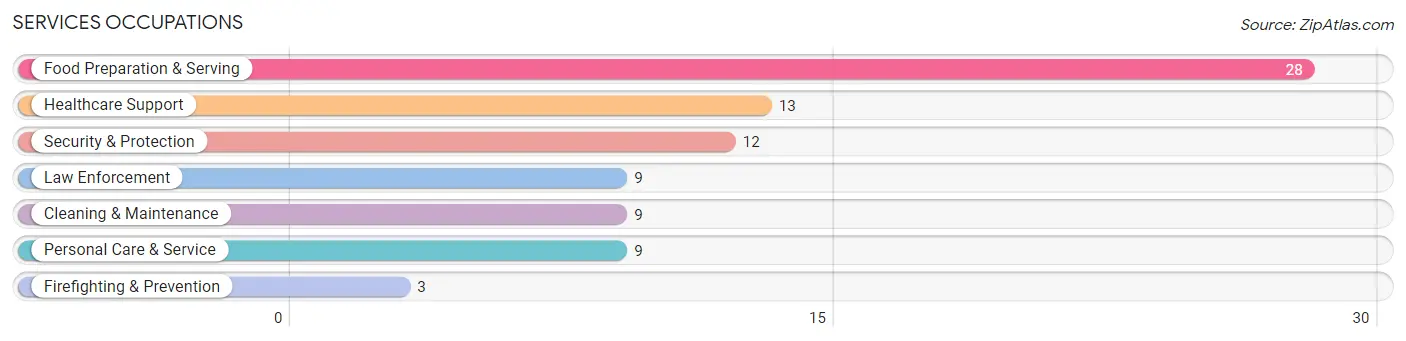
Services Occupations
The most common Services occupations in Grove Hill are Food Preparation & Serving (28 | 3.8%), Healthcare Support (13 | 1.8%), Security & Protection (12 | 1.6%), Law Enforcement (9 | 1.2%), and Cleaning & Maintenance (9 | 1.2%).
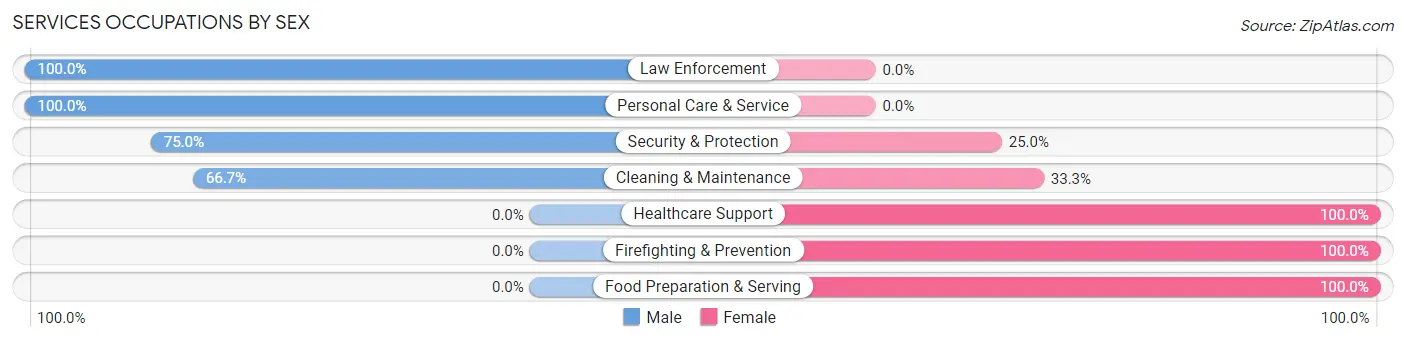
Services Occupations by Sex
Within the Services occupations in Grove Hill, the most male-oriented occupations are Law Enforcement (100.0%), Personal Care & Service (100.0%), and Security & Protection (75.0%), while the most female-oriented occupations are Healthcare Support (100.0%), Firefighting & Prevention (100.0%), and Food Preparation & Serving (100.0%).
| Occupation | Male | Female |
| Healthcare Support | 0 (0.0%) | 13 (100.0%) |
| Security & Protection | 9 (75.0%) | 3 (25.0%) |
| Firefighting & Prevention | 0 (0.0%) | 3 (100.0%) |
| Law Enforcement | 9 (100.0%) | 0 (0.0%) |
| Food Preparation & Serving | 0 (0.0%) | 28 (100.0%) |
| Cleaning & Maintenance | 6 (66.7%) | 3 (33.3%) |
| Personal Care & Service | 9 (100.0%) | 0 (0.0%) |
| Total (Category) | 24 (33.8%) | 47 (66.2%) |
| Total (Overall) | 408 (55.1%) | 333 (44.9%) |
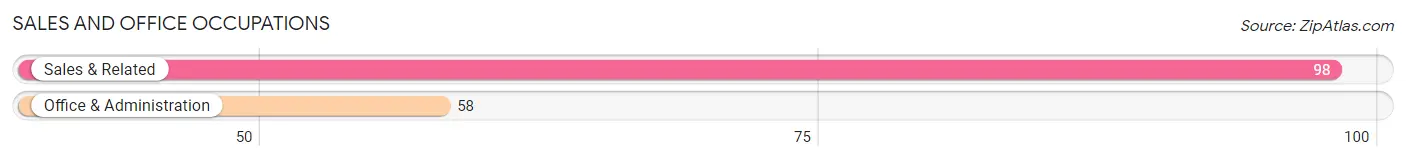
Sales and Office Occupations
The most common Sales and Office occupations in Grove Hill are Sales & Related (98 | 13.2%), and Office & Administration (58 | 7.8%).
Sales and Office Occupations by Sex
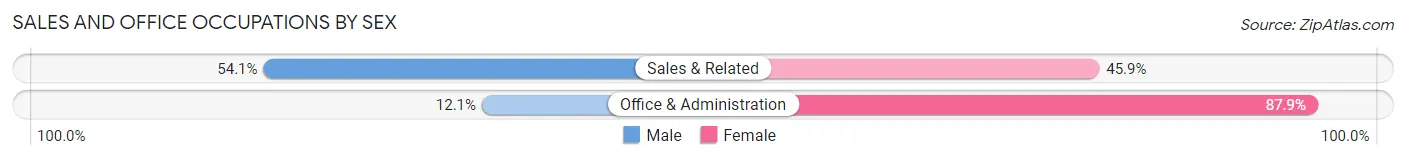
| Occupation | Male | Female |
| Sales & Related | 53 (54.1%) | 45 (45.9%) |
| Office & Administration | 7 (12.1%) | 51 (87.9%) |
| Total (Category) | 60 (38.5%) | 96 (61.5%) |
| Total (Overall) | 408 (55.1%) | 333 (44.9%) |
Natural Resources, Construction and Maintenance Occupations
The most common Natural Resources, Construction and Maintenance occupations in Grove Hill are Farming, Fishing & Forestry (11 | 1.5%), Installation, Maintenance & Repair (10 | 1.3%), and Construction & Extraction (9 | 1.2%).

Natural Resources, Construction and Maintenance Occupations by Sex
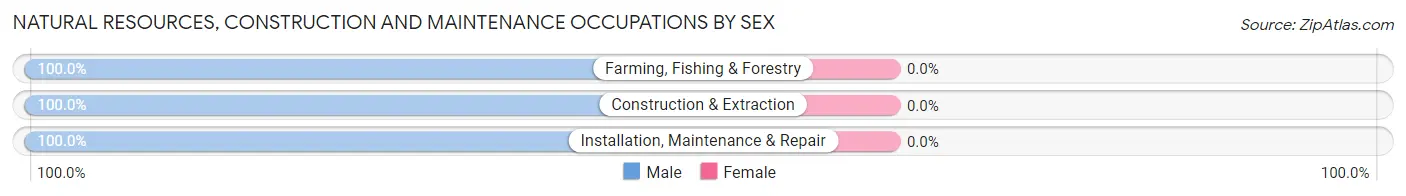
| Occupation | Male | Female |
| Farming, Fishing & Forestry | 11 (100.0%) | 0 (0.0%) |
| Construction & Extraction | 9 (100.0%) | 0 (0.0%) |
| Installation, Maintenance & Repair | 10 (100.0%) | 0 (0.0%) |
| Total (Category) | 30 (100.0%) | 0 (0.0%) |
| Total (Overall) | 408 (55.1%) | 333 (44.9%) |
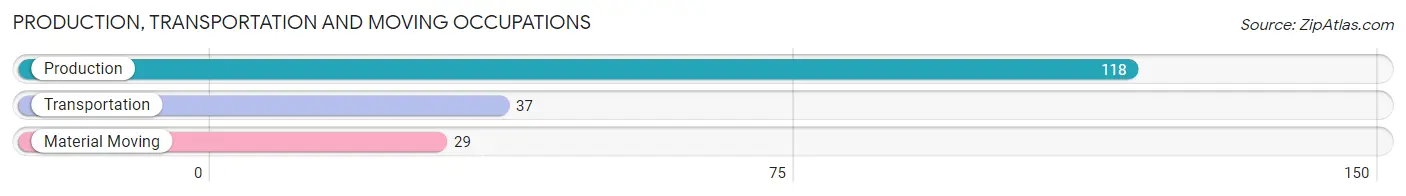
Production, Transportation and Moving Occupations
The most common Production, Transportation and Moving occupations in Grove Hill are Production (118 | 15.9%), Transportation (37 | 5.0%), and Material Moving (29 | 3.9%).
Production, Transportation and Moving Occupations by Sex
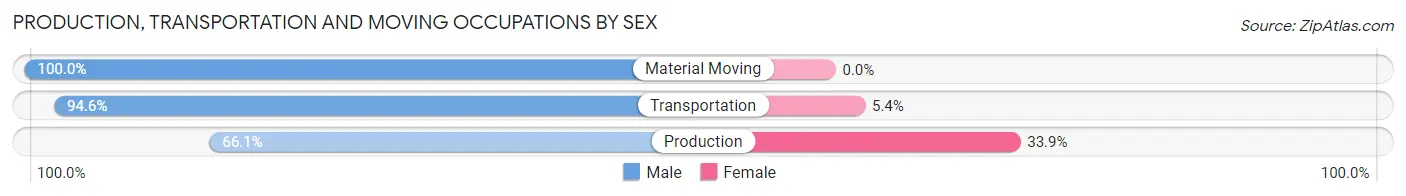
| Occupation | Male | Female |
| Production | 78 (66.1%) | 40 (33.9%) |
| Transportation | 35 (94.6%) | 2 (5.4%) |
| Material Moving | 29 (100.0%) | 0 (0.0%) |
| Total (Category) | 142 (77.2%) | 42 (22.8%) |
| Total (Overall) | 408 (55.1%) | 333 (44.9%) |
Employment Industries by Sex in Grove Hill
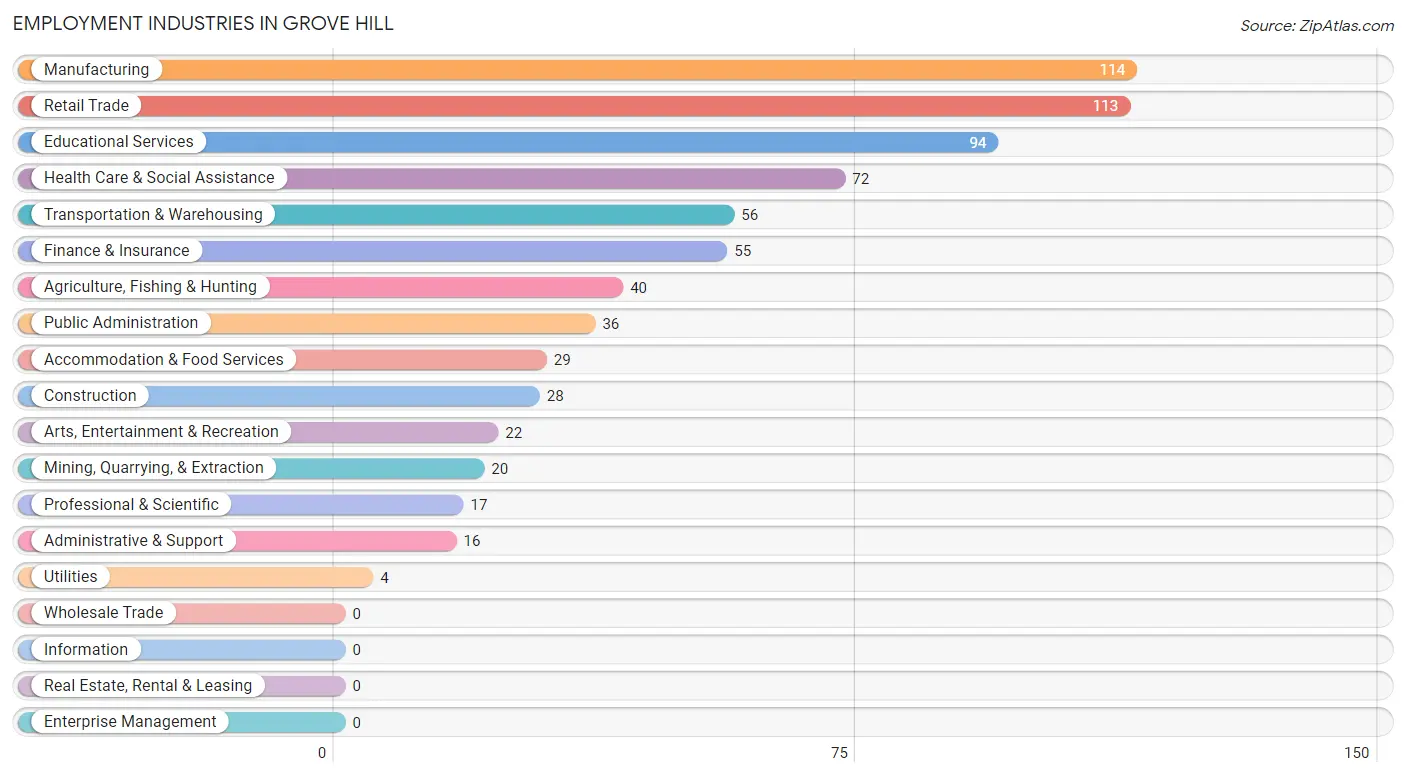
Employment Industries in Grove Hill
The major employment industries in Grove Hill include Manufacturing (114 | 15.4%), Retail Trade (113 | 15.2%), Educational Services (94 | 12.7%), Health Care & Social Assistance (72 | 9.7%), and Transportation & Warehousing (56 | 7.6%).
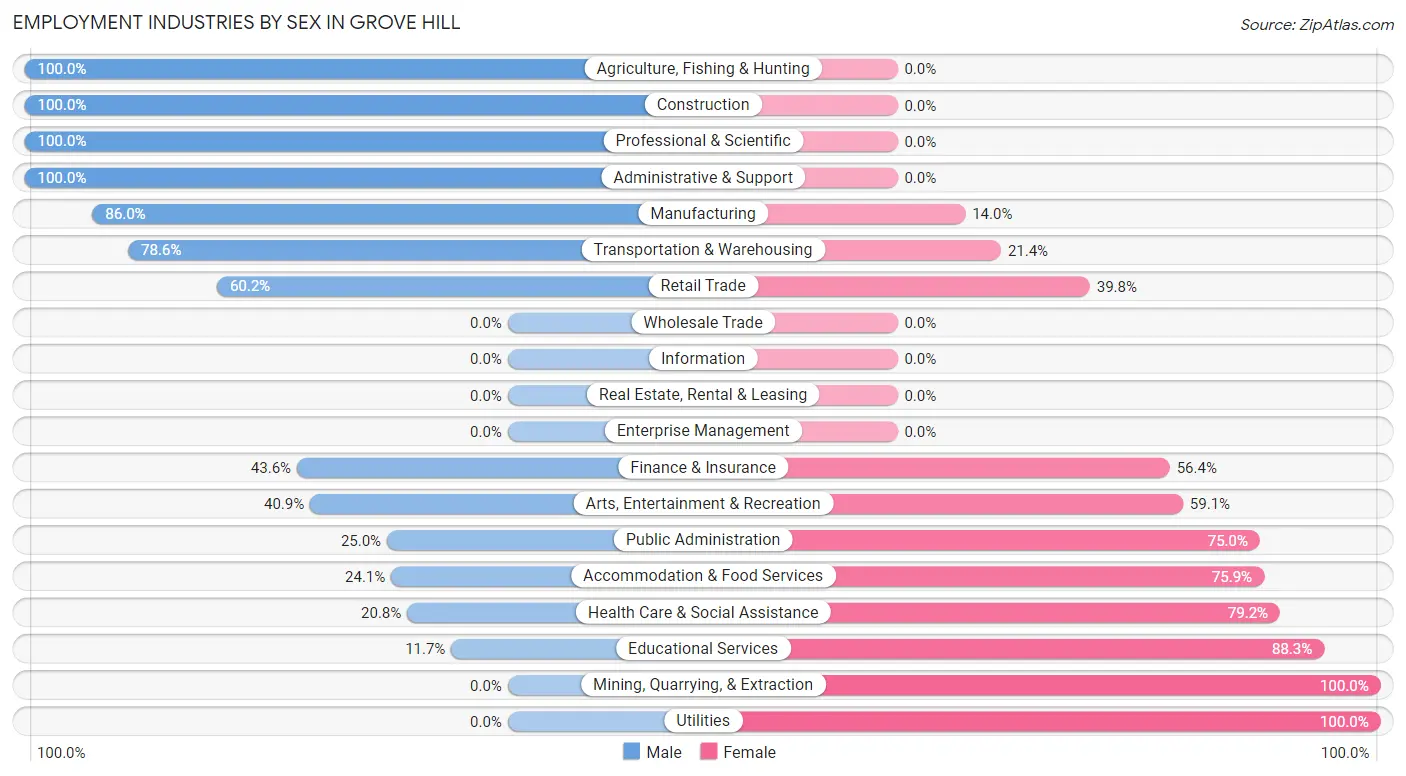
Employment Industries by Sex in Grove Hill
The Grove Hill industries that see more men than women are Agriculture, Fishing & Hunting (100.0%), Construction (100.0%), and Professional & Scientific (100.0%), whereas the industries that tend to have a higher number of women are Mining, Quarrying, & Extraction (100.0%), Utilities (100.0%), and Educational Services (88.3%).
| Industry | Male | Female |
| Agriculture, Fishing & Hunting | 40 (100.0%) | 0 (0.0%) |
| Mining, Quarrying, & Extraction | 0 (0.0%) | 20 (100.0%) |
| Construction | 28 (100.0%) | 0 (0.0%) |
| Manufacturing | 98 (86.0%) | 16 (14.0%) |
| Wholesale Trade | 0 (0.0%) | 0 (0.0%) |
| Retail Trade | 68 (60.2%) | 45 (39.8%) |
| Transportation & Warehousing | 44 (78.6%) | 12 (21.4%) |
| Utilities | 0 (0.0%) | 4 (100.0%) |
| Information | 0 (0.0%) | 0 (0.0%) |
| Finance & Insurance | 24 (43.6%) | 31 (56.4%) |
| Real Estate, Rental & Leasing | 0 (0.0%) | 0 (0.0%) |
| Professional & Scientific | 17 (100.0%) | 0 (0.0%) |
| Enterprise Management | 0 (0.0%) | 0 (0.0%) |
| Administrative & Support | 16 (100.0%) | 0 (0.0%) |
| Educational Services | 11 (11.7%) | 83 (88.3%) |
| Health Care & Social Assistance | 15 (20.8%) | 57 (79.2%) |
| Arts, Entertainment & Recreation | 9 (40.9%) | 13 (59.1%) |
| Accommodation & Food Services | 7 (24.1%) | 22 (75.9%) |
| Public Administration | 9 (25.0%) | 27 (75.0%) |
| Total | 408 (55.1%) | 333 (44.9%) |
Education in Grove Hill
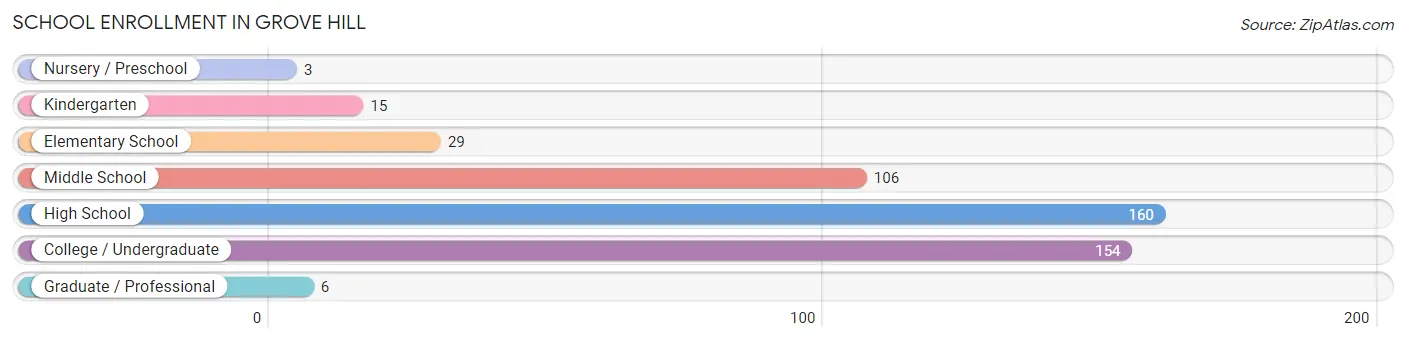
School Enrollment in Grove Hill
The most common levels of schooling among the 473 students in Grove Hill are high school (160 | 33.8%), college / undergraduate (154 | 32.6%), and middle school (106 | 22.4%).
| School Level | # Students | % Students |
| Nursery / Preschool | 3 | 0.6% |
| Kindergarten | 15 | 3.2% |
| Elementary School | 29 | 6.1% |
| Middle School | 106 | 22.4% |
| High School | 160 | 33.8% |
| College / Undergraduate | 154 | 32.6% |
| Graduate / Professional | 6 | 1.3% |
| Total | 473 | 100.0% |
School Enrollment by Age by Funding Source in Grove Hill
Out of a total of 473 students who are enrolled in schools in Grove Hill, 175 (37.0%) attend a private institution, while the remaining 298 (63.0%) are enrolled in public schools. The age group of 15 to 17 year olds has the highest likelihood of being enrolled in private schools, with 99 (72.8% in the age bracket) enrolled. Conversely, the age group of 18 to 19 year olds has the lowest likelihood of being enrolled in a private school, with 43 (100.0% in the age bracket) attending a public institution.
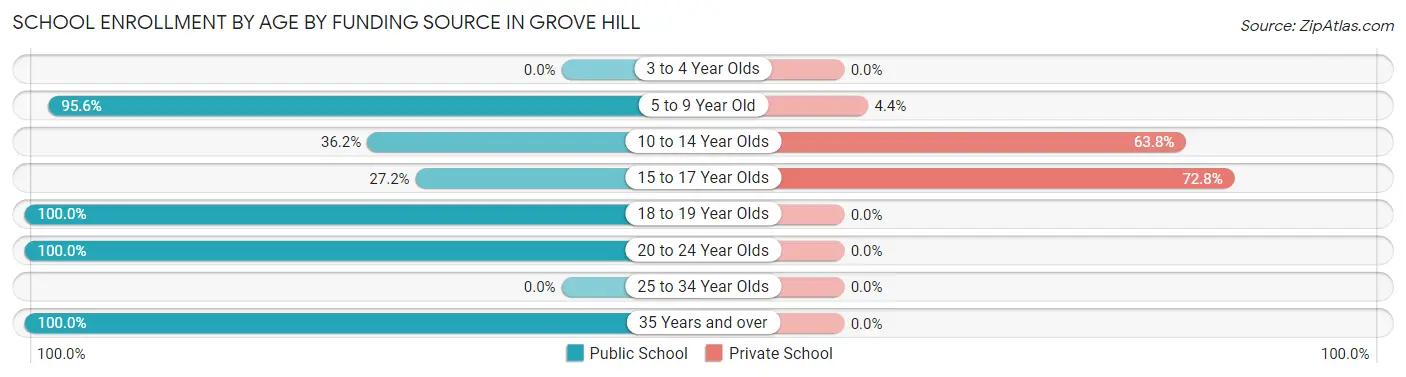
| Age Bracket | Public School | Private School |
| 3 to 4 Year Olds | 0 (0.0%) | 0 (0.0%) |
| 5 to 9 Year Old | 43 (95.6%) | 2 (4.4%) |
| 10 to 14 Year Olds | 42 (36.2%) | 74 (63.8%) |
| 15 to 17 Year Olds | 37 (27.2%) | 99 (72.8%) |
| 18 to 19 Year Olds | 43 (100.0%) | 0 (0.0%) |
| 20 to 24 Year Olds | 127 (100.0%) | 0 (0.0%) |
| 25 to 34 Year Olds | 0 (0.0%) | 0 (0.0%) |
| 35 Years and over | 6 (100.0%) | 0 (0.0%) |
| Total | 298 (63.0%) | 175 (37.0%) |
Educational Attainment by Field of Study in Grove Hill
Science & technology (76 | 24.5%), education (45 | 14.5%), physical & health sciences (38 | 12.3%), bio, nature & agricultural (36 | 11.6%), and business (36 | 11.6%) are the most common fields of study among 310 individuals in Grove Hill who have obtained a bachelor's degree or higher.
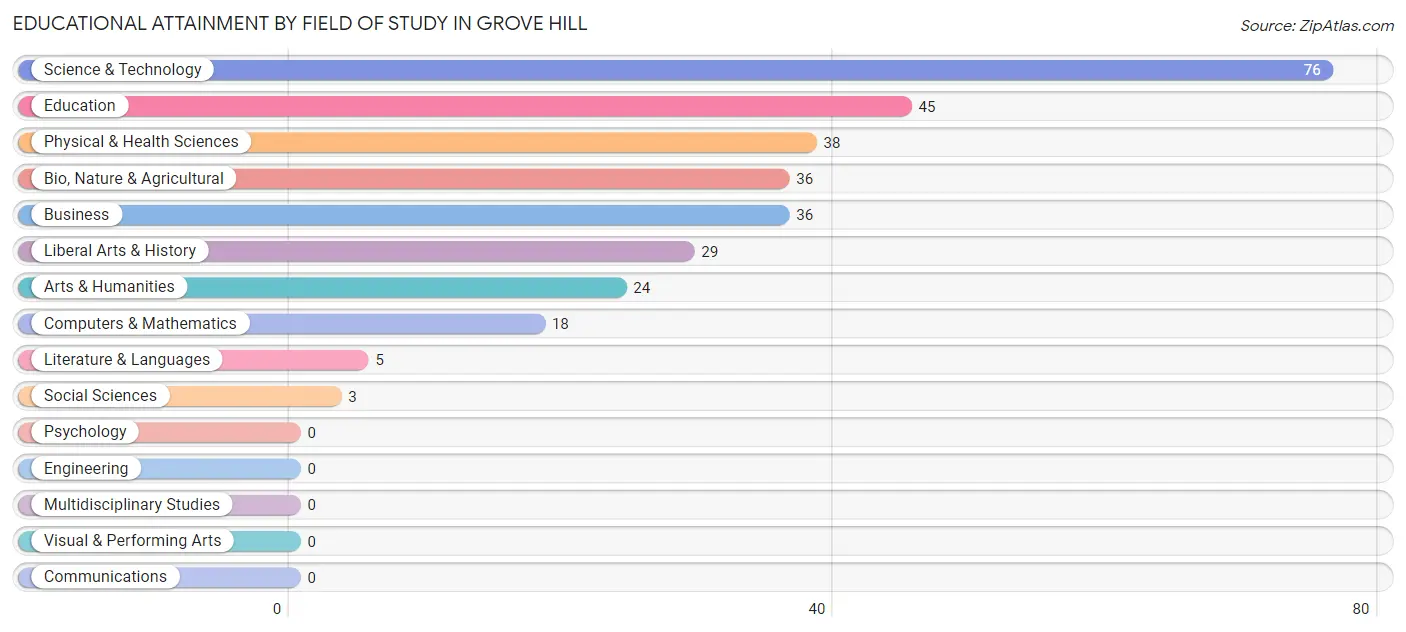
| Field of Study | # Graduates | % Graduates |
| Computers & Mathematics | 18 | 5.8% |
| Bio, Nature & Agricultural | 36 | 11.6% |
| Physical & Health Sciences | 38 | 12.3% |
| Psychology | 0 | 0.0% |
| Social Sciences | 3 | 1.0% |
| Engineering | 0 | 0.0% |
| Multidisciplinary Studies | 0 | 0.0% |
| Science & Technology | 76 | 24.5% |
| Business | 36 | 11.6% |
| Education | 45 | 14.5% |
| Literature & Languages | 5 | 1.6% |
| Liberal Arts & History | 29 | 9.3% |
| Visual & Performing Arts | 0 | 0.0% |
| Communications | 0 | 0.0% |
| Arts & Humanities | 24 | 7.7% |
| Total | 310 | 100.0% |
Transportation & Commute in Grove Hill
Vehicle Availability by Sex in Grove Hill
The most prevalent vehicle ownership categories in Grove Hill are males with 2 vehicles (222, accounting for 55.5%) and females with 2 vehicles (152, making up 67.9%).
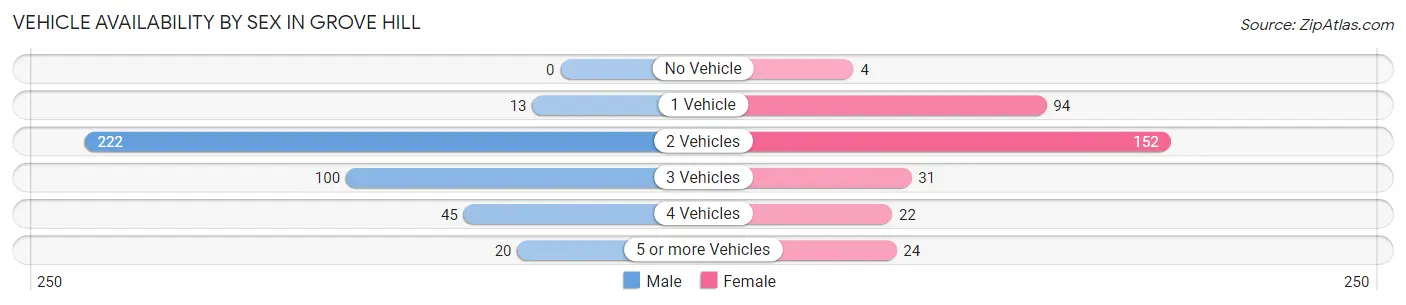
| Vehicles Available | Male | Female |
| No Vehicle | 0 (0.0%) | 4 (1.2%) |
| 1 Vehicle | 13 (3.3%) | 94 (28.7%) |
| 2 Vehicles | 222 (55.5%) | 152 (46.5%) |
| 3 Vehicles | 100 (25.0%) | 31 (9.5%) |
| 4 Vehicles | 45 (11.3%) | 22 (6.7%) |
| 5 or more Vehicles | 20 (5.0%) | 24 (7.3%) |
| Total | 400 (100.0%) | 327 (100.0%) |
Commute Time in Grove Hill
The most frequently occuring commute durations in Grove Hill are 20 to 24 minutes (178 commuters, 24.9%), less than 5 minutes (128 commuters, 17.9%), and 30 to 34 minutes (107 commuters, 15.0%).
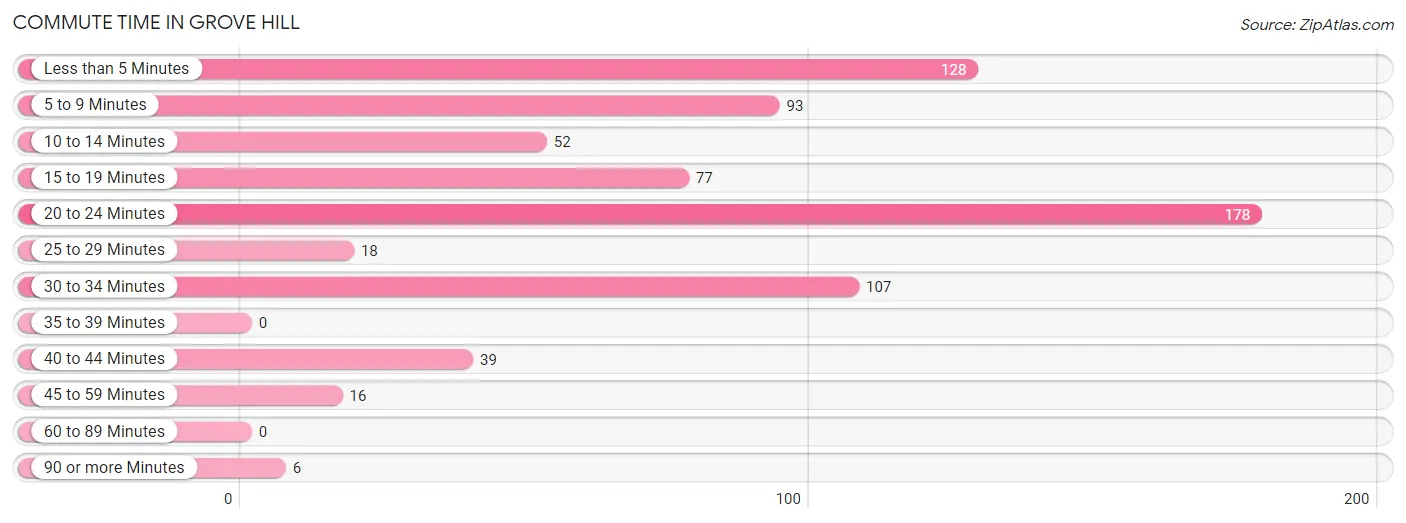
| Commute Time | # Commuters | % Commuters |
| Less than 5 Minutes | 128 | 17.9% |
| 5 to 9 Minutes | 93 | 13.0% |
| 10 to 14 Minutes | 52 | 7.3% |
| 15 to 19 Minutes | 77 | 10.8% |
| 20 to 24 Minutes | 178 | 24.9% |
| 25 to 29 Minutes | 18 | 2.5% |
| 30 to 34 Minutes | 107 | 15.0% |
| 35 to 39 Minutes | 0 | 0.0% |
| 40 to 44 Minutes | 39 | 5.5% |
| 45 to 59 Minutes | 16 | 2.2% |
| 60 to 89 Minutes | 0 | 0.0% |
| 90 or more Minutes | 6 | 0.8% |
Commute Time by Sex in Grove Hill
The most common commute times in Grove Hill are 20 to 24 minutes (132 commuters, 33.9%) for males and less than 5 minutes (93 commuters, 28.7%) for females.
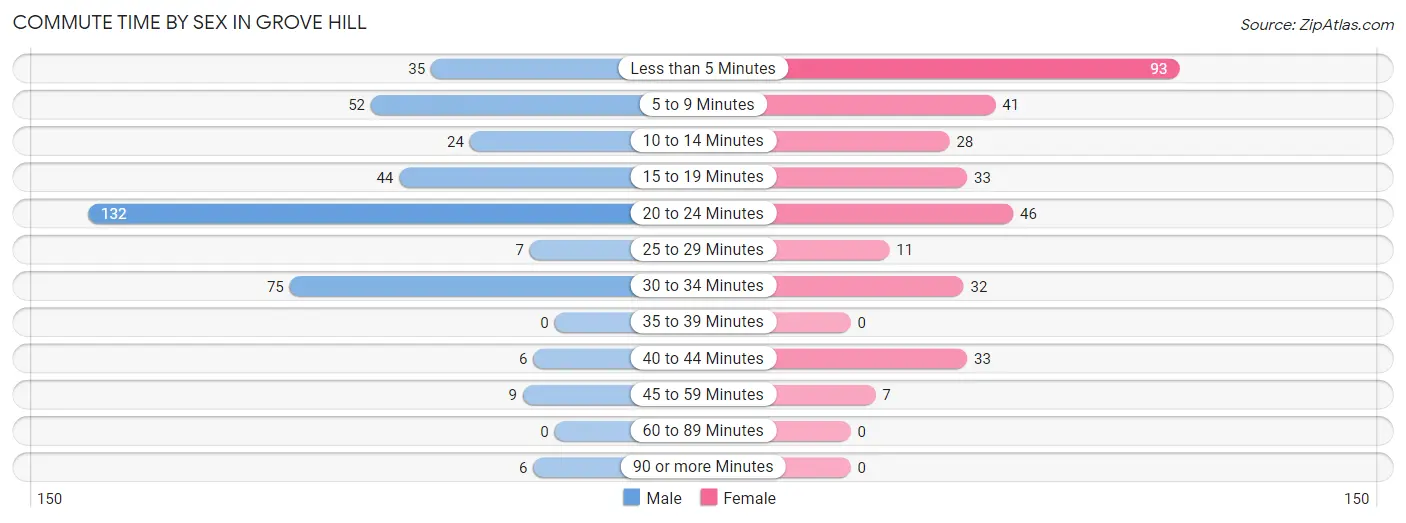
| Commute Time | Male | Female |
| Less than 5 Minutes | 35 (9.0%) | 93 (28.7%) |
| 5 to 9 Minutes | 52 (13.3%) | 41 (12.7%) |
| 10 to 14 Minutes | 24 (6.1%) | 28 (8.6%) |
| 15 to 19 Minutes | 44 (11.3%) | 33 (10.2%) |
| 20 to 24 Minutes | 132 (33.9%) | 46 (14.2%) |
| 25 to 29 Minutes | 7 (1.8%) | 11 (3.4%) |
| 30 to 34 Minutes | 75 (19.2%) | 32 (9.9%) |
| 35 to 39 Minutes | 0 (0.0%) | 0 (0.0%) |
| 40 to 44 Minutes | 6 (1.5%) | 33 (10.2%) |
| 45 to 59 Minutes | 9 (2.3%) | 7 (2.2%) |
| 60 to 89 Minutes | 0 (0.0%) | 0 (0.0%) |
| 90 or more Minutes | 6 (1.5%) | 0 (0.0%) |
Time of Departure to Work by Sex in Grove Hill
The most frequent times of departure to work in Grove Hill are 7:00 AM to 7:29 AM (84, 21.5%) for males and 7:30 AM to 7:59 AM (83, 25.6%) for females.
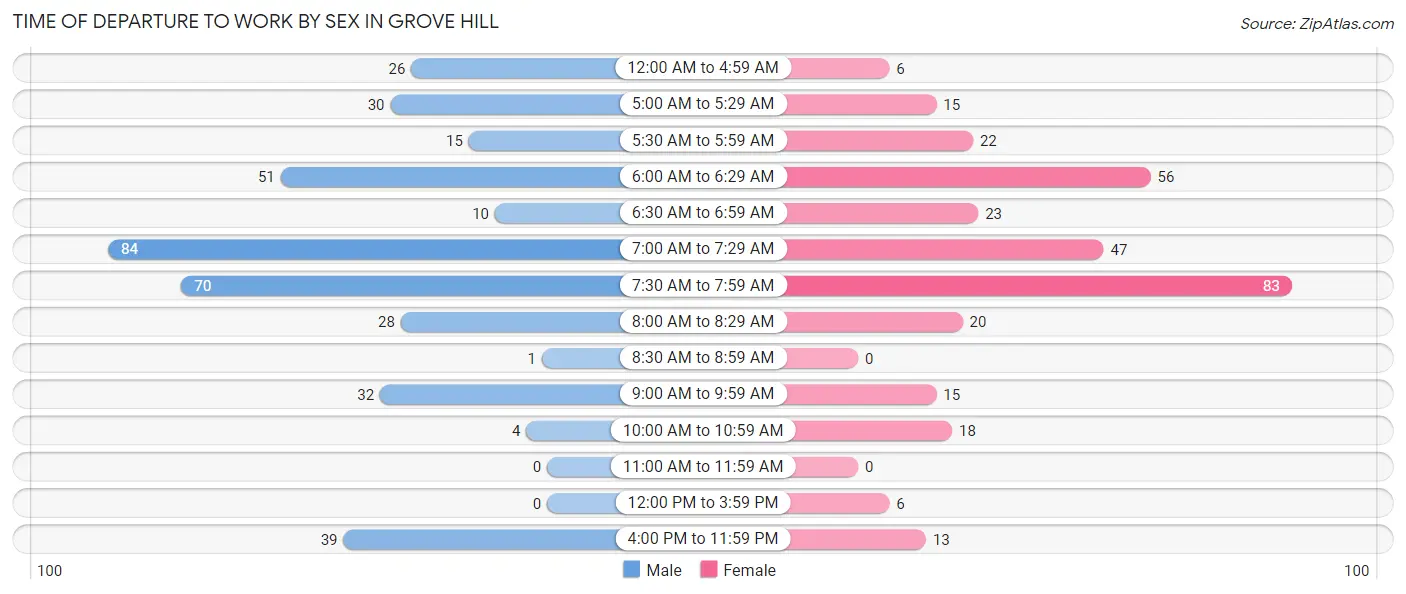
| Time of Departure | Male | Female |
| 12:00 AM to 4:59 AM | 26 (6.7%) | 6 (1.8%) |
| 5:00 AM to 5:29 AM | 30 (7.7%) | 15 (4.6%) |
| 5:30 AM to 5:59 AM | 15 (3.8%) | 22 (6.8%) |
| 6:00 AM to 6:29 AM | 51 (13.1%) | 56 (17.3%) |
| 6:30 AM to 6:59 AM | 10 (2.6%) | 23 (7.1%) |
| 7:00 AM to 7:29 AM | 84 (21.5%) | 47 (14.5%) |
| 7:30 AM to 7:59 AM | 70 (17.9%) | 83 (25.6%) |
| 8:00 AM to 8:29 AM | 28 (7.2%) | 20 (6.2%) |
| 8:30 AM to 8:59 AM | 1 (0.3%) | 0 (0.0%) |
| 9:00 AM to 9:59 AM | 32 (8.2%) | 15 (4.6%) |
| 10:00 AM to 10:59 AM | 4 (1.0%) | 18 (5.6%) |
| 11:00 AM to 11:59 AM | 0 (0.0%) | 0 (0.0%) |
| 12:00 PM to 3:59 PM | 0 (0.0%) | 6 (1.8%) |
| 4:00 PM to 11:59 PM | 39 (10.0%) | 13 (4.0%) |
| Total | 390 (100.0%) | 324 (100.0%) |
Housing Occupancy in Grove Hill
Occupancy by Ownership in Grove Hill
Of the total 722 dwellings in Grove Hill, owner-occupied units account for 528 (73.1%), while renter-occupied units make up 194 (26.9%).
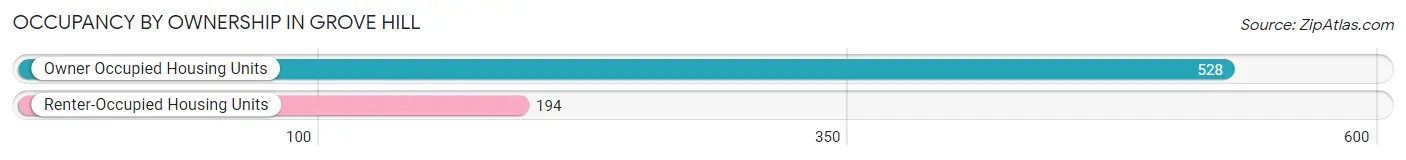
| Occupancy | # Housing Units | % Housing Units |
| Owner Occupied Housing Units | 528 | 73.1% |
| Renter-Occupied Housing Units | 194 | 26.9% |
| Total Occupied Housing Units | 722 | 100.0% |
Occupancy by Household Size in Grove Hill
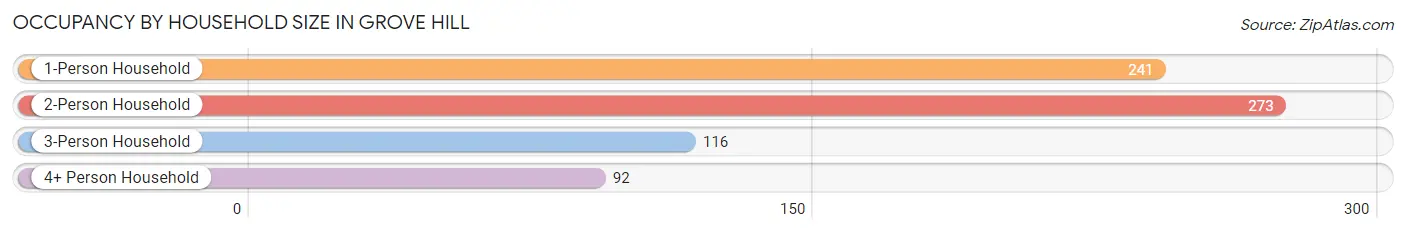
| Household Size | # Housing Units | % Housing Units |
| 1-Person Household | 241 | 33.4% |
| 2-Person Household | 273 | 37.8% |
| 3-Person Household | 116 | 16.1% |
| 4+ Person Household | 92 | 12.7% |
| Total Housing Units | 722 | 100.0% |
Occupancy by Ownership by Household Size in Grove Hill
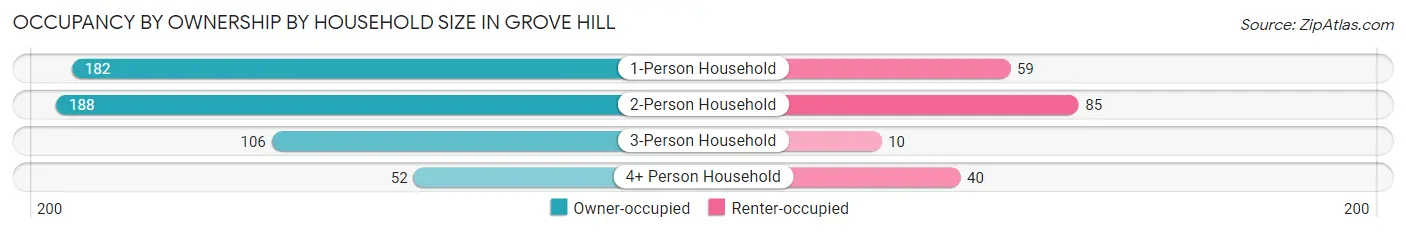
| Household Size | Owner-occupied | Renter-occupied |
| 1-Person Household | 182 (75.5%) | 59 (24.5%) |
| 2-Person Household | 188 (68.9%) | 85 (31.1%) |
| 3-Person Household | 106 (91.4%) | 10 (8.6%) |
| 4+ Person Household | 52 (56.5%) | 40 (43.5%) |
| Total Housing Units | 528 (73.1%) | 194 (26.9%) |
Occupancy by Educational Attainment in Grove Hill
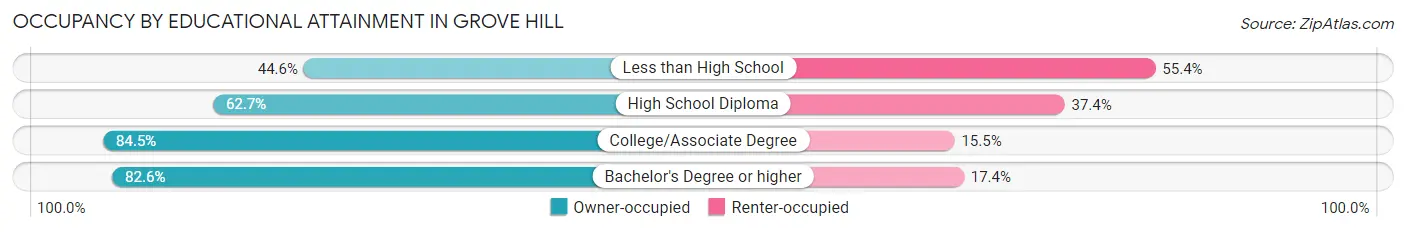
| Household Size | Owner-occupied | Renter-occupied |
| Less than High School | 25 (44.6%) | 31 (55.4%) |
| High School Diploma | 161 (62.6%) | 96 (37.3%) |
| College/Associate Degree | 185 (84.5%) | 34 (15.5%) |
| Bachelor's Degree or higher | 157 (82.6%) | 33 (17.4%) |
Occupancy by Age of Householder in Grove Hill
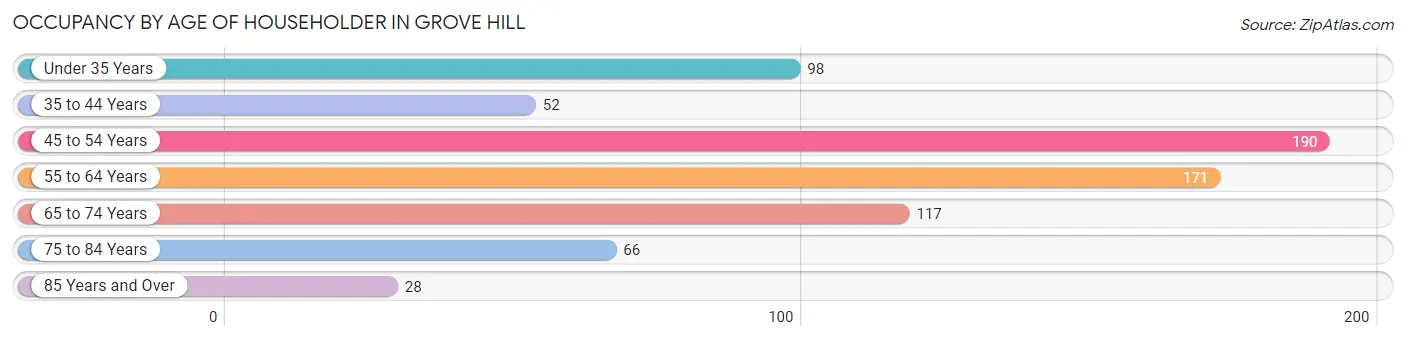
| Age Bracket | # Households | % Households |
| Under 35 Years | 98 | 13.6% |
| 35 to 44 Years | 52 | 7.2% |
| 45 to 54 Years | 190 | 26.3% |
| 55 to 64 Years | 171 | 23.7% |
| 65 to 74 Years | 117 | 16.2% |
| 75 to 84 Years | 66 | 9.1% |
| 85 Years and Over | 28 | 3.9% |
| Total | 722 | 100.0% |
Housing Finances in Grove Hill
Median Income by Occupancy in Grove Hill
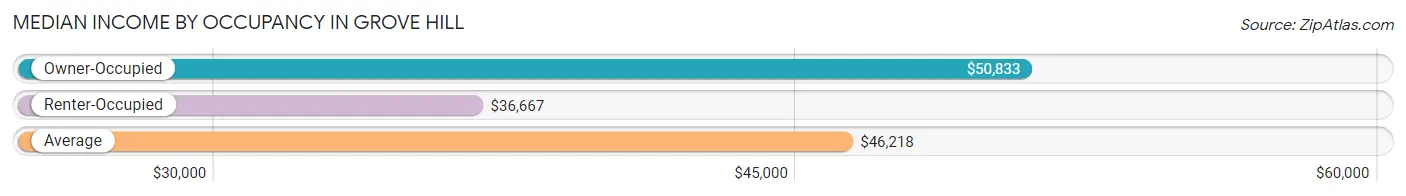
| Occupancy Type | # Households | Median Income |
| Owner-Occupied | 528 (73.1%) | $50,833 |
| Renter-Occupied | 194 (26.9%) | $36,667 |
| Average | 722 (100.0%) | $46,218 |
Occupancy by Householder Income Bracket in Grove Hill
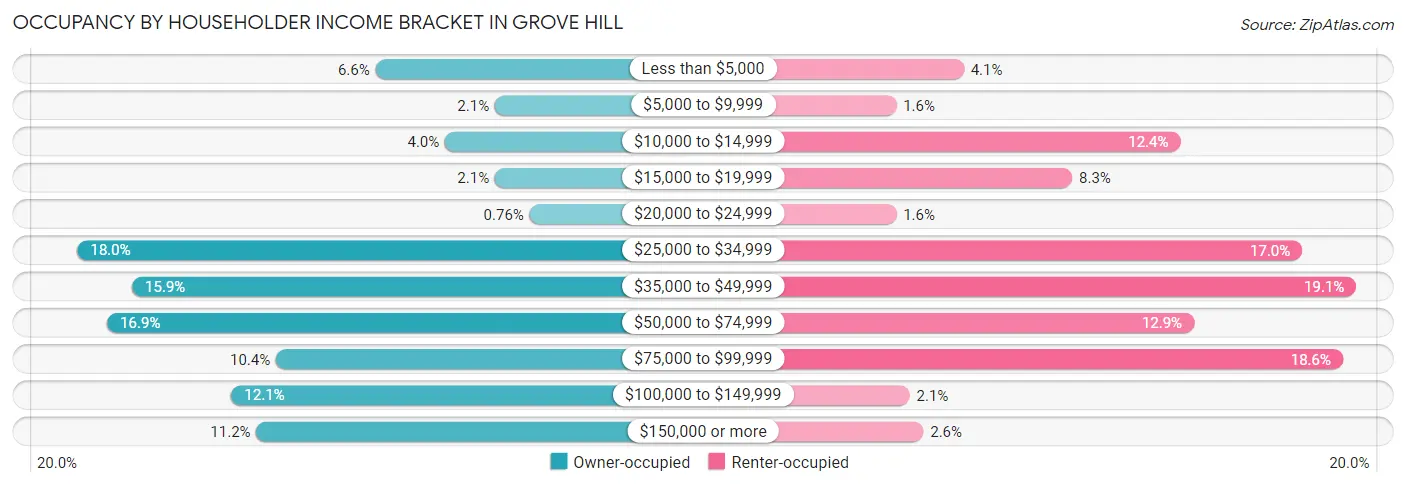
| Income Bracket | Owner-occupied | Renter-occupied |
| Less than $5,000 | 35 (6.6%) | 8 (4.1%) |
| $5,000 to $9,999 | 11 (2.1%) | 3 (1.5%) |
| $10,000 to $14,999 | 21 (4.0%) | 24 (12.4%) |
| $15,000 to $19,999 | 11 (2.1%) | 16 (8.3%) |
| $20,000 to $24,999 | 4 (0.8%) | 3 (1.5%) |
| $25,000 to $34,999 | 95 (18.0%) | 33 (17.0%) |
| $35,000 to $49,999 | 84 (15.9%) | 37 (19.1%) |
| $50,000 to $74,999 | 89 (16.9%) | 25 (12.9%) |
| $75,000 to $99,999 | 55 (10.4%) | 36 (18.6%) |
| $100,000 to $149,999 | 64 (12.1%) | 4 (2.1%) |
| $150,000 or more | 59 (11.2%) | 5 (2.6%) |
| Total | 528 (100.0%) | 194 (100.0%) |
Monthly Housing Cost Tiers in Grove Hill
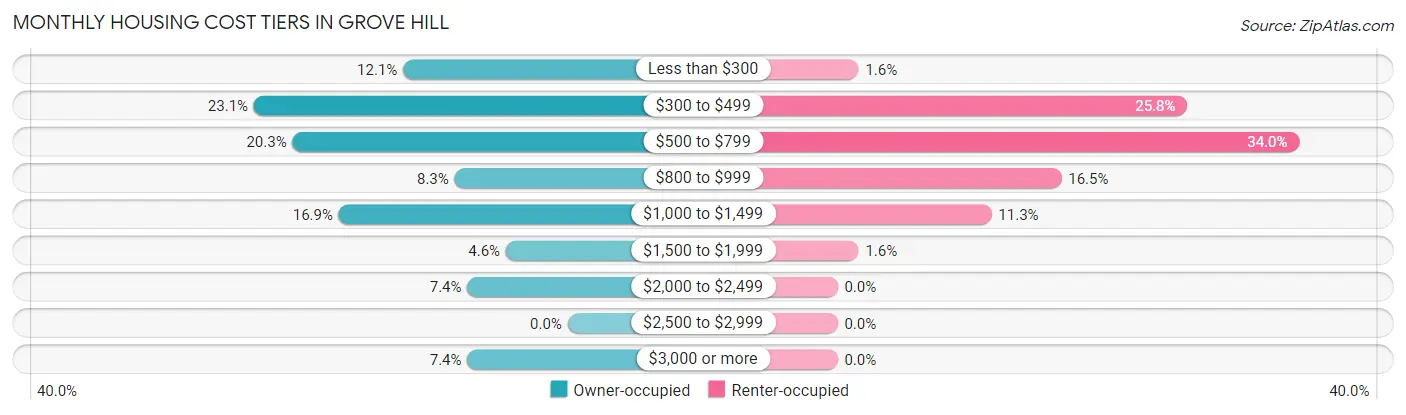
| Monthly Cost | Owner-occupied | Renter-occupied |
| Less than $300 | 64 (12.1%) | 3 (1.5%) |
| $300 to $499 | 122 (23.1%) | 50 (25.8%) |
| $500 to $799 | 107 (20.3%) | 66 (34.0%) |
| $800 to $999 | 44 (8.3%) | 32 (16.5%) |
| $1,000 to $1,499 | 89 (16.9%) | 22 (11.3%) |
| $1,500 to $1,999 | 24 (4.5%) | 3 (1.5%) |
| $2,000 to $2,499 | 39 (7.4%) | 0 (0.0%) |
| $2,500 to $2,999 | 0 (0.0%) | 0 (0.0%) |
| $3,000 or more | 39 (7.4%) | 0 (0.0%) |
| Total | 528 (100.0%) | 194 (100.0%) |
Physical Housing Characteristics in Grove Hill
Housing Structures in Grove Hill
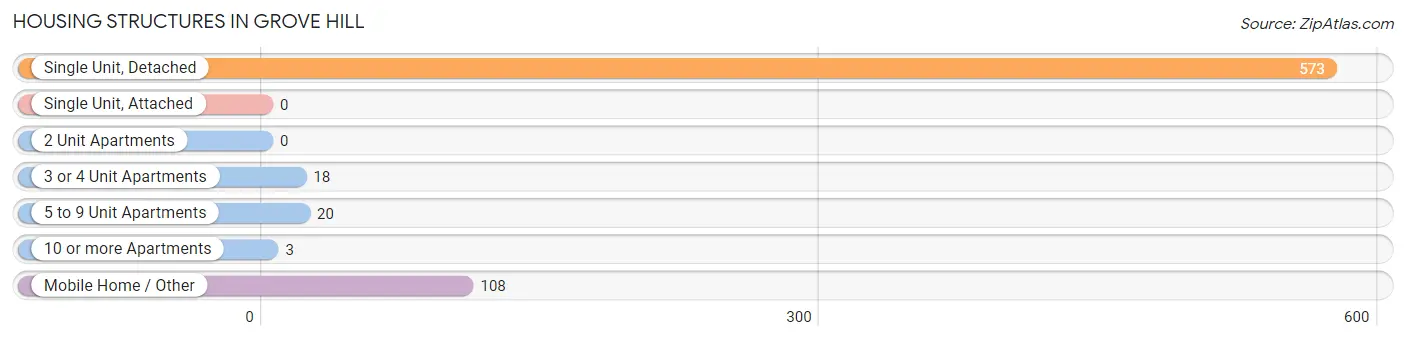
| Structure Type | # Housing Units | % Housing Units |
| Single Unit, Detached | 573 | 79.4% |
| Single Unit, Attached | 0 | 0.0% |
| 2 Unit Apartments | 0 | 0.0% |
| 3 or 4 Unit Apartments | 18 | 2.5% |
| 5 to 9 Unit Apartments | 20 | 2.8% |
| 10 or more Apartments | 3 | 0.4% |
| Mobile Home / Other | 108 | 15.0% |
| Total | 722 | 100.0% |
Housing Structures by Occupancy in Grove Hill
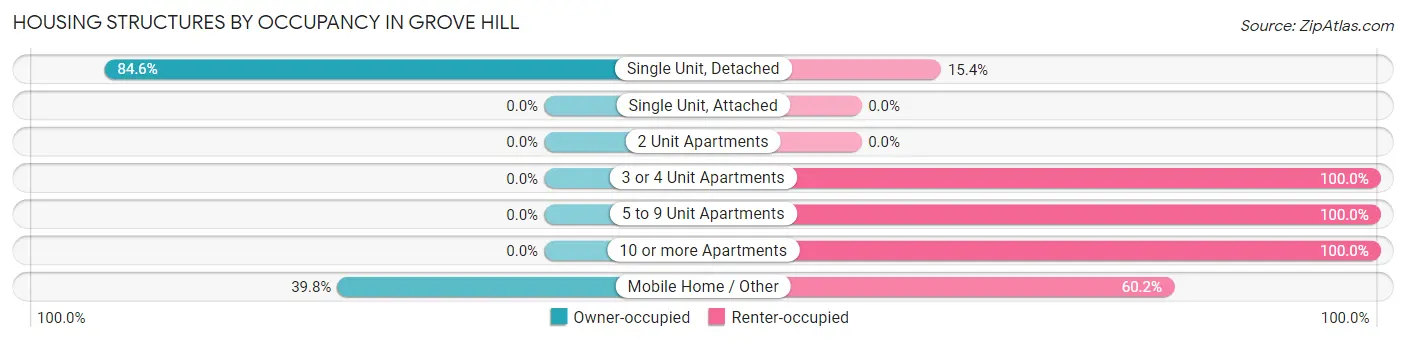
| Structure Type | Owner-occupied | Renter-occupied |
| Single Unit, Detached | 485 (84.6%) | 88 (15.4%) |
| Single Unit, Attached | 0 (0.0%) | 0 (0.0%) |
| 2 Unit Apartments | 0 (0.0%) | 0 (0.0%) |
| 3 or 4 Unit Apartments | 0 (0.0%) | 18 (100.0%) |
| 5 to 9 Unit Apartments | 0 (0.0%) | 20 (100.0%) |
| 10 or more Apartments | 0 (0.0%) | 3 (100.0%) |
| Mobile Home / Other | 43 (39.8%) | 65 (60.2%) |
| Total | 528 (73.1%) | 194 (26.9%) |
Housing Structures by Number of Rooms in Grove Hill
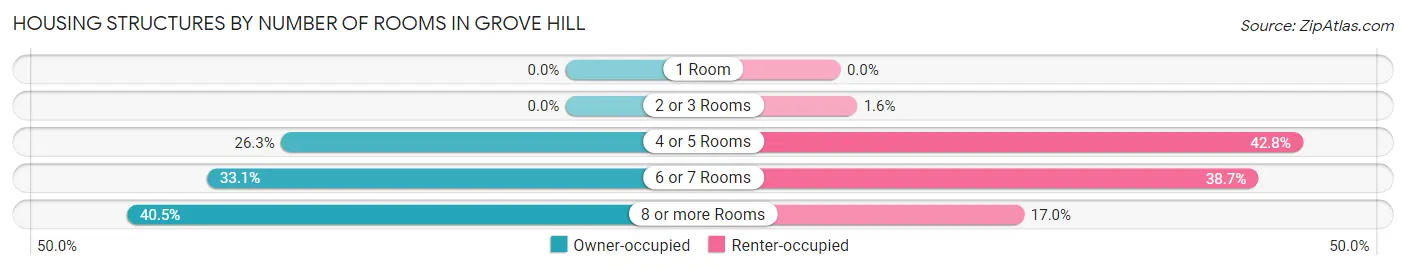
| Number of Rooms | Owner-occupied | Renter-occupied |
| 1 Room | 0 (0.0%) | 0 (0.0%) |
| 2 or 3 Rooms | 0 (0.0%) | 3 (1.5%) |
| 4 or 5 Rooms | 139 (26.3%) | 83 (42.8%) |
| 6 or 7 Rooms | 175 (33.1%) | 75 (38.7%) |
| 8 or more Rooms | 214 (40.5%) | 33 (17.0%) |
| Total | 528 (100.0%) | 194 (100.0%) |
Housing Structure by Heating Type in Grove Hill
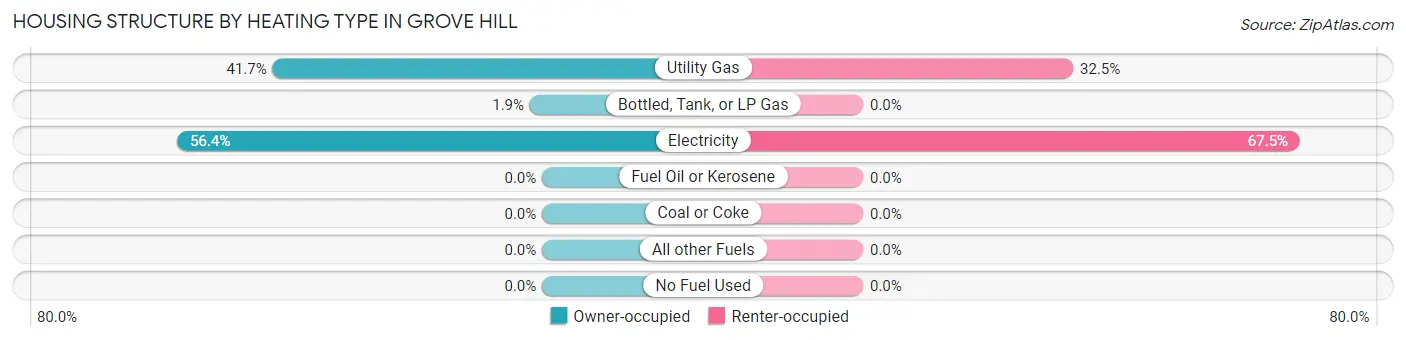
| Heating Type | Owner-occupied | Renter-occupied |
| Utility Gas | 220 (41.7%) | 63 (32.5%) |
| Bottled, Tank, or LP Gas | 10 (1.9%) | 0 (0.0%) |
| Electricity | 298 (56.4%) | 131 (67.5%) |
| Fuel Oil or Kerosene | 0 (0.0%) | 0 (0.0%) |
| Coal or Coke | 0 (0.0%) | 0 (0.0%) |
| All other Fuels | 0 (0.0%) | 0 (0.0%) |
| No Fuel Used | 0 (0.0%) | 0 (0.0%) |
| Total | 528 (100.0%) | 194 (100.0%) |
Household Vehicle Usage in Grove Hill
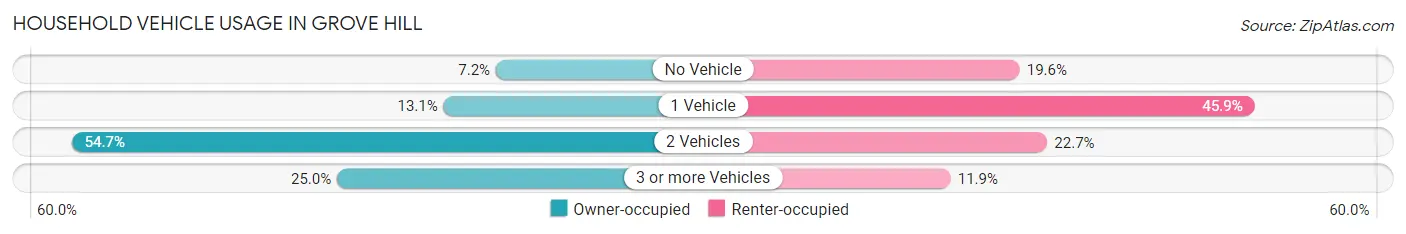
| Vehicles per Household | Owner-occupied | Renter-occupied |
| No Vehicle | 38 (7.2%) | 38 (19.6%) |
| 1 Vehicle | 69 (13.1%) | 89 (45.9%) |
| 2 Vehicles | 289 (54.7%) | 44 (22.7%) |
| 3 or more Vehicles | 132 (25.0%) | 23 (11.9%) |
| Total | 528 (100.0%) | 194 (100.0%) |
Real Estate & Mortgages in Grove Hill
Real Estate and Mortgage Overview in Grove Hill
| Characteristic | Without Mortgage | With Mortgage |
| Housing Units | 267 | 261 |
| Median Property Value | $97,000 | $165,100 |
| Median Household Income | $37,112 | $43 |
| Monthly Housing Costs | $419 | $39 |
| Real Estate Taxes | $352 | $27 |
Property Value by Mortgage Status in Grove Hill
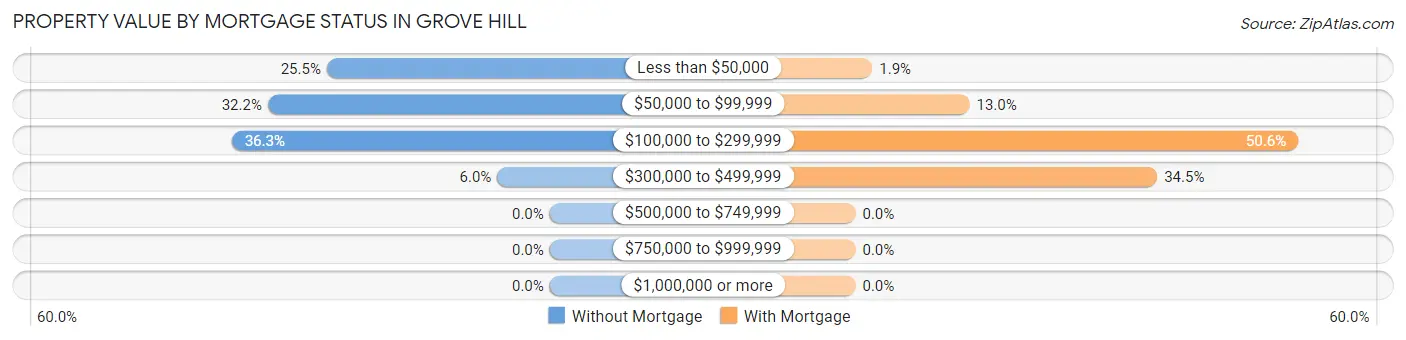
| Property Value | Without Mortgage | With Mortgage |
| Less than $50,000 | 68 (25.5%) | 5 (1.9%) |
| $50,000 to $99,999 | 86 (32.2%) | 34 (13.0%) |
| $100,000 to $299,999 | 97 (36.3%) | 132 (50.6%) |
| $300,000 to $499,999 | 16 (6.0%) | 90 (34.5%) |
| $500,000 to $749,999 | 0 (0.0%) | 0 (0.0%) |
| $750,000 to $999,999 | 0 (0.0%) | 0 (0.0%) |
| $1,000,000 or more | 0 (0.0%) | 0 (0.0%) |
| Total | 267 (100.0%) | 261 (100.0%) |
Household Income by Mortgage Status in Grove Hill
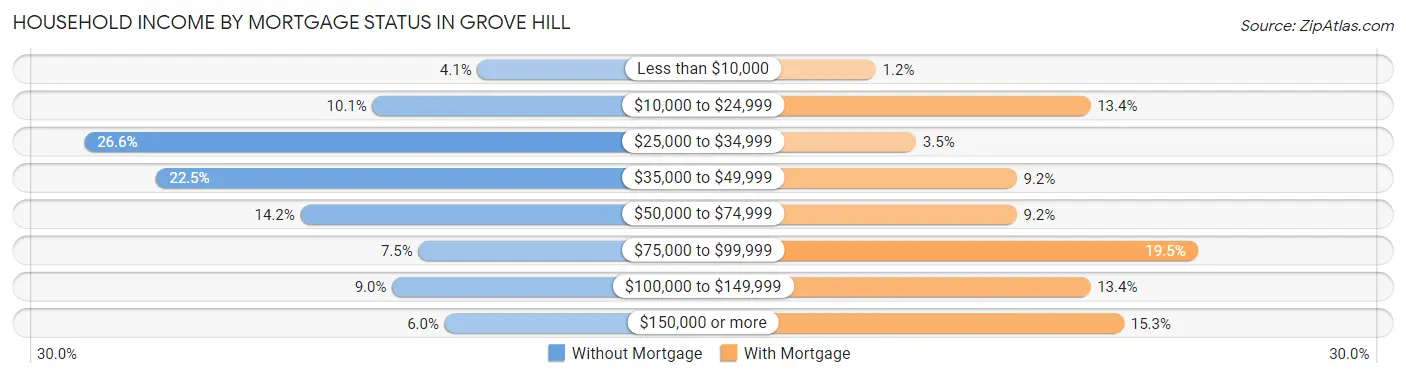
| Household Income | Without Mortgage | With Mortgage |
| Less than $10,000 | 11 (4.1%) | 3 (1.1%) |
| $10,000 to $24,999 | 27 (10.1%) | 35 (13.4%) |
| $25,000 to $34,999 | 71 (26.6%) | 9 (3.5%) |
| $35,000 to $49,999 | 60 (22.5%) | 24 (9.2%) |
| $50,000 to $74,999 | 38 (14.2%) | 24 (9.2%) |
| $75,000 to $99,999 | 20 (7.5%) | 51 (19.5%) |
| $100,000 to $149,999 | 24 (9.0%) | 35 (13.4%) |
| $150,000 or more | 16 (6.0%) | 40 (15.3%) |
| Total | 267 (100.0%) | 261 (100.0%) |
Property Value to Household Income Ratio in Grove Hill
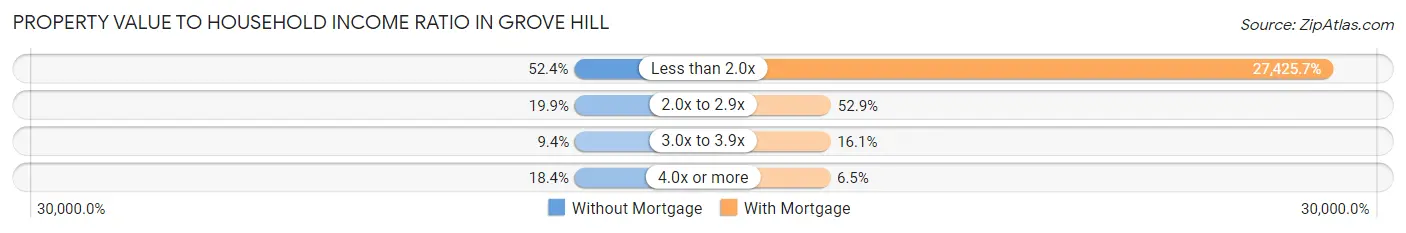
| Value-to-Income Ratio | Without Mortgage | With Mortgage |
| Less than 2.0x | 140 (52.4%) | 71,581 (27,425.7%) |
| 2.0x to 2.9x | 53 (19.9%) | 138 (52.9%) |
| 3.0x to 3.9x | 25 (9.4%) | 42 (16.1%) |
| 4.0x or more | 49 (18.3%) | 17 (6.5%) |
| Total | 267 (100.0%) | 261 (100.0%) |
Real Estate Taxes by Mortgage Status in Grove Hill
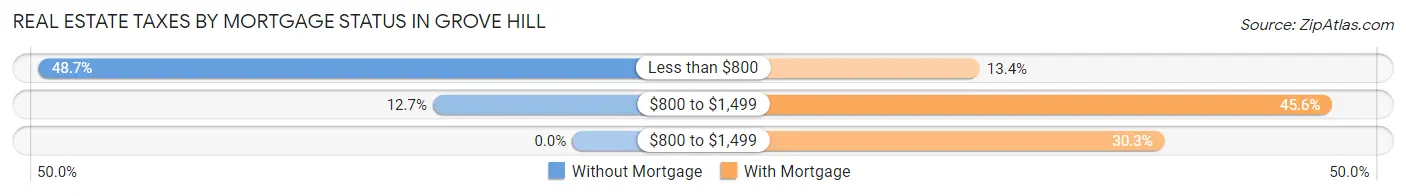
| Property Taxes | Without Mortgage | With Mortgage |
| Less than $800 | 130 (48.7%) | 35 (13.4%) |
| $800 to $1,499 | 34 (12.7%) | 119 (45.6%) |
| $800 to $1,499 | 0 (0.0%) | 79 (30.3%) |
| Total | 267 (100.0%) | 261 (100.0%) |
Health & Disability in Grove Hill
Health Insurance Coverage by Age in Grove Hill
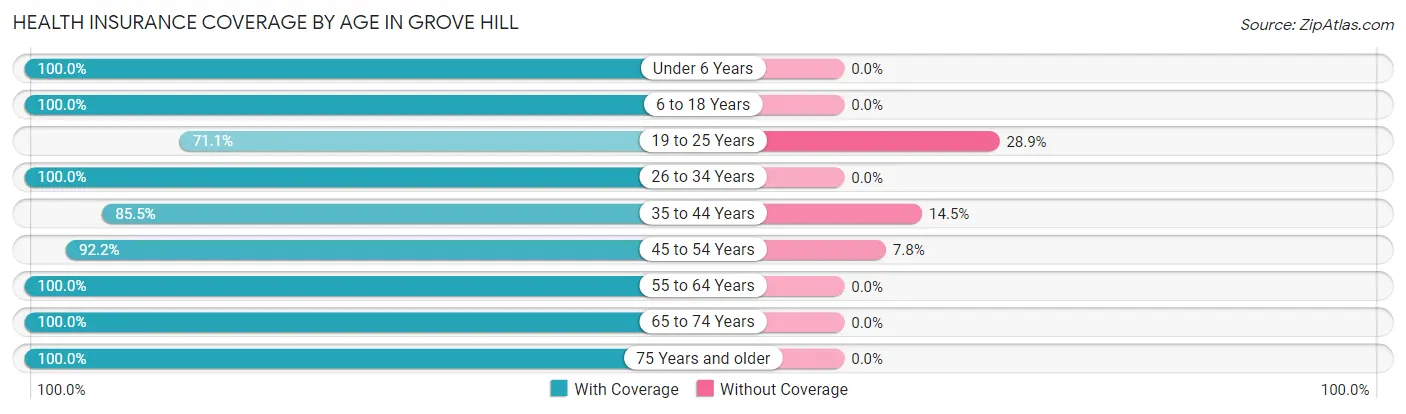
| Age Bracket | With Coverage | Without Coverage |
| Under 6 Years | 36 (100.0%) | 0 (0.0%) |
| 6 to 18 Years | 325 (100.0%) | 0 (0.0%) |
| 19 to 25 Years | 199 (71.1%) | 81 (28.9%) |
| 26 to 34 Years | 140 (100.0%) | 0 (0.0%) |
| 35 to 44 Years | 159 (85.5%) | 27 (14.5%) |
| 45 to 54 Years | 321 (92.2%) | 27 (7.8%) |
| 55 to 64 Years | 275 (100.0%) | 0 (0.0%) |
| 65 to 74 Years | 188 (100.0%) | 0 (0.0%) |
| 75 Years and older | 137 (100.0%) | 0 (0.0%) |
| Total | 1,780 (92.9%) | 135 (7.0%) |
Health Insurance Coverage by Citizenship Status in Grove Hill
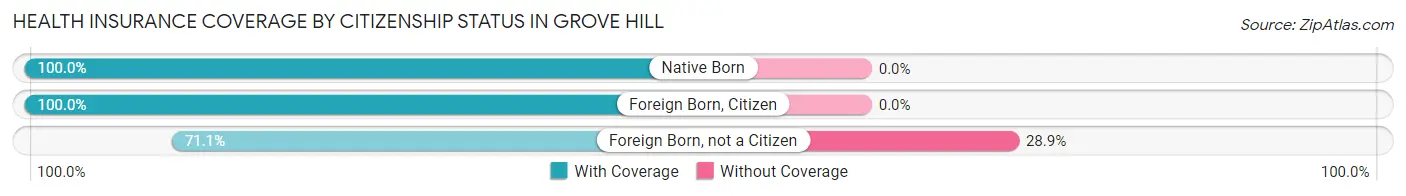
| Citizenship Status | With Coverage | Without Coverage |
| Native Born | 36 (100.0%) | 0 (0.0%) |
| Foreign Born, Citizen | 325 (100.0%) | 0 (0.0%) |
| Foreign Born, not a Citizen | 199 (71.1%) | 81 (28.9%) |
Health Insurance Coverage by Household Income in Grove Hill
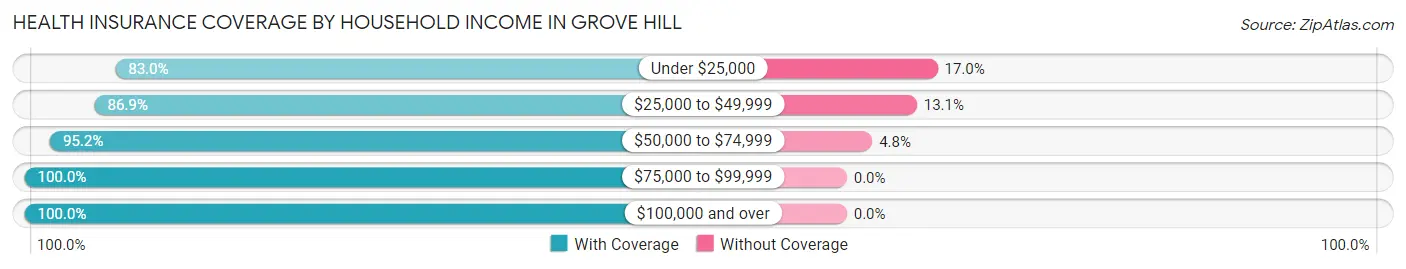
| Household Income | With Coverage | Without Coverage |
| Under $25,000 | 166 (83.0%) | 34 (17.0%) |
| $25,000 to $49,999 | 537 (86.9%) | 81 (13.1%) |
| $50,000 to $74,999 | 340 (95.2%) | 17 (4.8%) |
| $75,000 to $99,999 | 215 (100.0%) | 0 (0.0%) |
| $100,000 and over | 491 (100.0%) | 0 (0.0%) |
Public vs Private Health Insurance Coverage by Age in Grove Hill
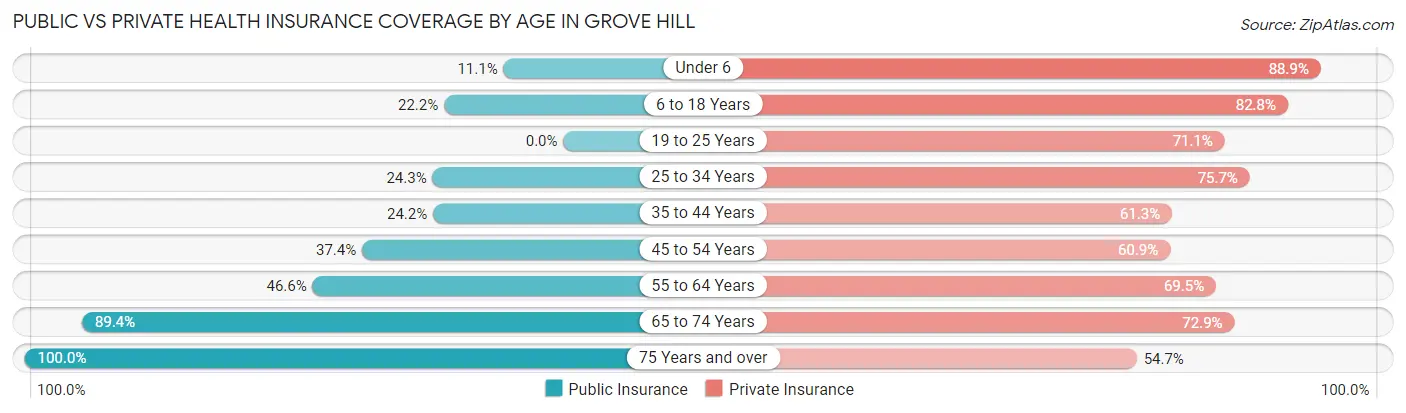
| Age Bracket | Public Insurance | Private Insurance |
| Under 6 | 4 (11.1%) | 32 (88.9%) |
| 6 to 18 Years | 72 (22.2%) | 269 (82.8%) |
| 19 to 25 Years | 0 (0.0%) | 199 (71.1%) |
| 25 to 34 Years | 34 (24.3%) | 106 (75.7%) |
| 35 to 44 Years | 45 (24.2%) | 114 (61.3%) |
| 45 to 54 Years | 130 (37.4%) | 212 (60.9%) |
| 55 to 64 Years | 128 (46.6%) | 191 (69.5%) |
| 65 to 74 Years | 168 (89.4%) | 137 (72.9%) |
| 75 Years and over | 137 (100.0%) | 75 (54.7%) |
| Total | 718 (37.5%) | 1,335 (69.7%) |
Disability Status by Sex by Age in Grove Hill
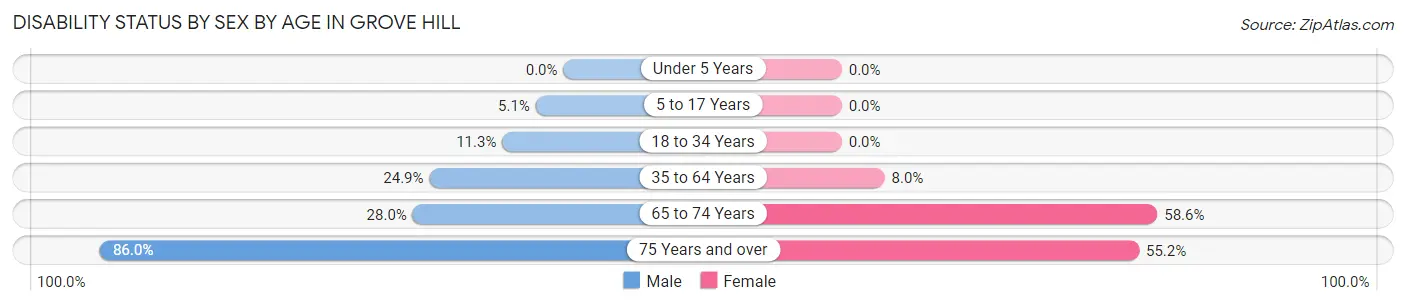
| Age Bracket | Male | Female |
| Under 5 Years | 0 (0.0%) | 0 (0.0%) |
| 5 to 17 Years | 8 (5.1%) | 0 (0.0%) |
| 18 to 34 Years | 38 (11.3%) | 0 (0.0%) |
| 35 to 64 Years | 98 (24.9%) | 33 (8.0%) |
| 65 to 74 Years | 33 (28.0%) | 41 (58.6%) |
| 75 Years and over | 43 (86.0%) | 48 (55.2%) |
Disability Class by Sex by Age in Grove Hill
Disability Class: Hearing Difficulty
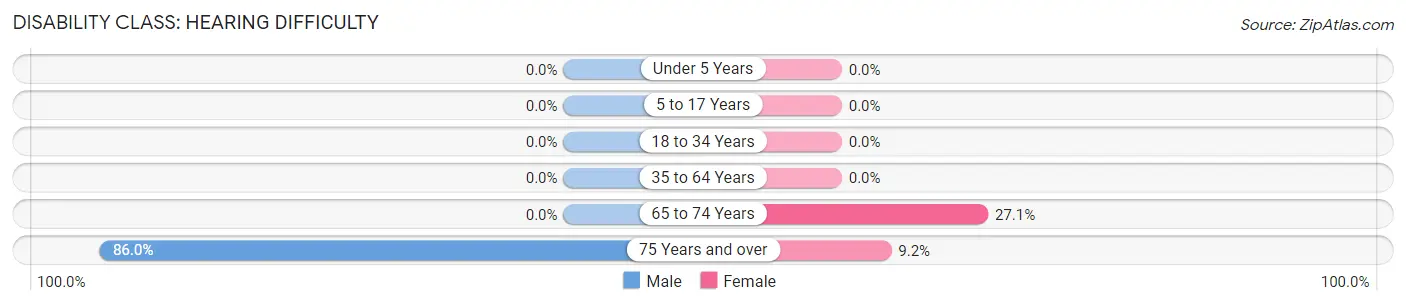
| Age Bracket | Male | Female |
| Under 5 Years | 0 (0.0%) | 0 (0.0%) |
| 5 to 17 Years | 0 (0.0%) | 0 (0.0%) |
| 18 to 34 Years | 0 (0.0%) | 0 (0.0%) |
| 35 to 64 Years | 0 (0.0%) | 0 (0.0%) |
| 65 to 74 Years | 0 (0.0%) | 19 (27.1%) |
| 75 Years and over | 43 (86.0%) | 8 (9.2%) |
Disability Class: Vision Difficulty
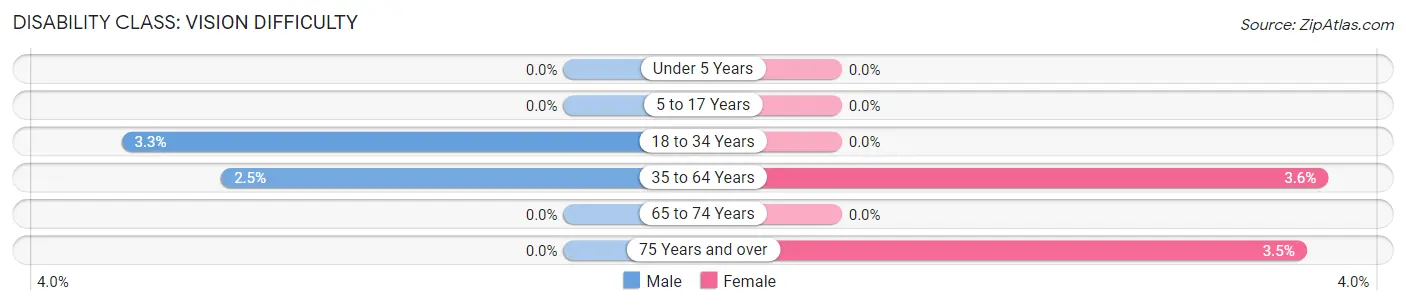
| Age Bracket | Male | Female |
| Under 5 Years | 0 (0.0%) | 0 (0.0%) |
| 5 to 17 Years | 0 (0.0%) | 0 (0.0%) |
| 18 to 34 Years | 11 (3.3%) | 0 (0.0%) |
| 35 to 64 Years | 10 (2.5%) | 15 (3.6%) |
| 65 to 74 Years | 0 (0.0%) | 0 (0.0%) |
| 75 Years and over | 0 (0.0%) | 3 (3.5%) |
Disability Class: Cognitive Difficulty
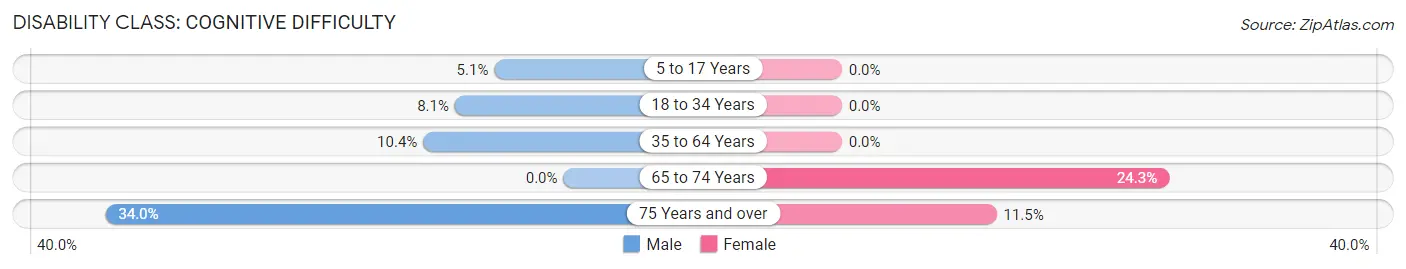
| Age Bracket | Male | Female |
| 5 to 17 Years | 8 (5.1%) | 0 (0.0%) |
| 18 to 34 Years | 27 (8.1%) | 0 (0.0%) |
| 35 to 64 Years | 41 (10.4%) | 0 (0.0%) |
| 65 to 74 Years | 0 (0.0%) | 17 (24.3%) |
| 75 Years and over | 17 (34.0%) | 10 (11.5%) |
Disability Class: Ambulatory Difficulty
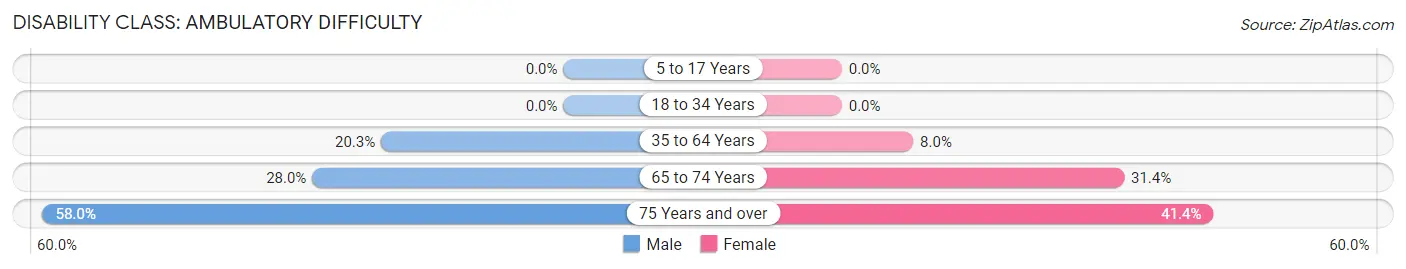
| Age Bracket | Male | Female |
| 5 to 17 Years | 0 (0.0%) | 0 (0.0%) |
| 18 to 34 Years | 0 (0.0%) | 0 (0.0%) |
| 35 to 64 Years | 80 (20.3%) | 33 (8.0%) |
| 65 to 74 Years | 33 (28.0%) | 22 (31.4%) |
| 75 Years and over | 29 (58.0%) | 36 (41.4%) |
Disability Class: Self-Care Difficulty
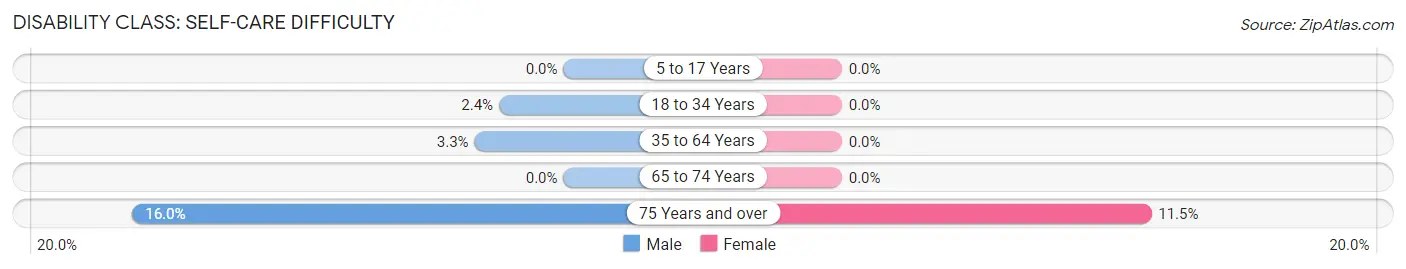
| Age Bracket | Male | Female |
| 5 to 17 Years | 0 (0.0%) | 0 (0.0%) |
| 18 to 34 Years | 8 (2.4%) | 0 (0.0%) |
| 35 to 64 Years | 13 (3.3%) | 0 (0.0%) |
| 65 to 74 Years | 0 (0.0%) | 0 (0.0%) |
| 75 Years and over | 8 (16.0%) | 10 (11.5%) |
Technology Access in Grove Hill
Computing Device Access in Grove Hill
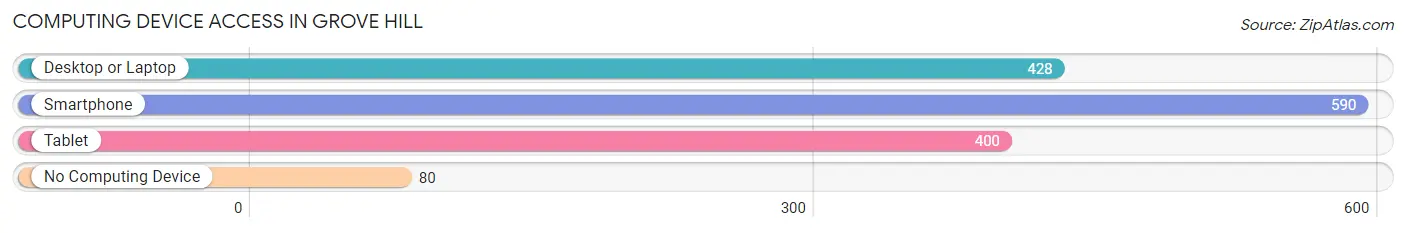
| Device Type | # Households | % Households |
| Desktop or Laptop | 428 | 59.3% |
| Smartphone | 590 | 81.7% |
| Tablet | 400 | 55.4% |
| No Computing Device | 80 | 11.1% |
| Total | 722 | 100.0% |
Internet Access in Grove Hill
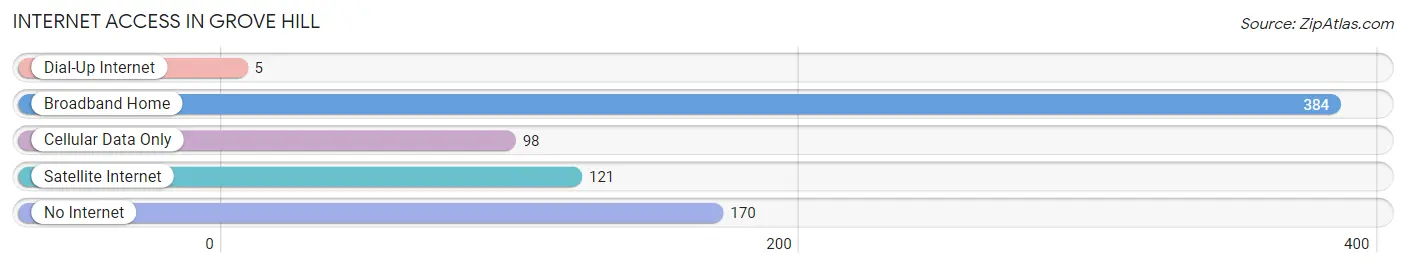
| Internet Type | # Households | % Households |
| Dial-Up Internet | 5 | 0.7% |
| Broadband Home | 384 | 53.2% |
| Cellular Data Only | 98 | 13.6% |
| Satellite Internet | 121 | 16.8% |
| No Internet | 170 | 23.5% |
| Total | 722 | 100.0% |
Grove Hill Summary
Grove Hill, Alabama is a small town located in Clarke County, Alabama. It is situated in the southwestern part of the state, approximately 40 miles north of Mobile. The town has a population of 2,717 people, according to the 2010 census.
Geography
Grove Hill is located in the southwestern part of Clarke County, Alabama. It is situated on the banks of the Tombigbee River, which forms the western boundary of the town. The town is located in the Coastal Plain region of the state, and is characterized by flat terrain and sandy soils. The climate is humid subtropical, with hot, humid summers and mild winters.
Economy
The economy of Grove Hill is largely based on agriculture and timber production. The town is home to several large timber companies, including Weyerhaeuser, International Paper, and Georgia-Pacific. The town also has a number of small businesses, including restaurants, retail stores, and service providers.
Demographics
According to the 2010 census, the population of Grove Hill was 2,717. The racial makeup of the town was 79.3% White, 18.2% African American, 0.3% Native American, 0.3% Asian, 0.1% Pacific Islander, 0.7% from other races, and 1.3% from two or more races. Hispanic or Latino of any race were 1.7% of the population.
The median income for a household in the town was $30,938, and the median income for a family was $37,917. The per capita income for the town was $15,945. About 17.3% of families and 20.2% of the population were below the poverty line, including 28.3% of those under age 18 and 16.2% of those age 65 or over.
History
Grove Hill was founded in 1819 by settlers from Georgia and South Carolina. The town was named after a grove of trees that grew near the original settlement. The town was incorporated in 1837, and the first post office was established in 1838.
In the late 19th century, Grove Hill was a major center for the timber industry. The town was home to several large sawmills, and the timber industry provided the town with a steady source of income.
In the early 20th century, Grove Hill was a major center for the cotton industry. The town was home to several cotton gins, and the cotton industry provided the town with a steady source of income.
In the late 20th century, Grove Hill began to experience a decline in population as many of its residents moved away in search of better economic opportunities. The town has since experienced a resurgence in population, and is now home to a diverse population of residents.
Common Questions
What is Per Capita Income in Grove Hill?
Per Capita income in Grove Hill is $32,241.
What is the Median Family Income in Grove Hill?
Median Family Income in Grove Hill is $70,888.
What is the Median Household income in Grove Hill?
Median Household Income in Grove Hill is $46,218.
What is Income or Wage Gap in Grove Hill?
Income or Wage Gap in Grove Hill is 14.7%.
Women in Grove Hill earn 85.3 cents for every dollar earned by a man.
What is Inequality or Gini Index in Grove Hill?
Inequality or Gini Index in Grove Hill is 0.55.
What is the Total Population of Grove Hill?
Total Population of Grove Hill is 1,995.
What is the Total Male Population of Grove Hill?
Total Male Population of Grove Hill is 1,129.
What is the Total Female Population of Grove Hill?
Total Female Population of Grove Hill is 866.
What is the Ratio of Males per 100 Females in Grove Hill?
There are 130.37 Males per 100 Females in Grove Hill.
What is the Ratio of Females per 100 Males in Grove Hill?
There are 76.71 Females per 100 Males in Grove Hill.
What is the Median Population Age in Grove Hill?
Median Population Age in Grove Hill is 43.5 Years.
What is the Average Family Size in Grove Hill
Average Family Size in Grove Hill is 3.2 People.
What is the Average Household Size in Grove Hill
Average Household Size in Grove Hill is 2.6 People.
How Large is the Labor Force in Grove Hill?
There are 852 People in the Labor Forcein in Grove Hill.
What is the Percentage of People in the Labor Force in Grove Hill?
49.8% of People are in the Labor Force in Grove Hill.
What is the Unemployment Rate in Grove Hill?
Unemployment Rate in Grove Hill is 13.0%.