Muscle Shoals, AL Map & Demographics
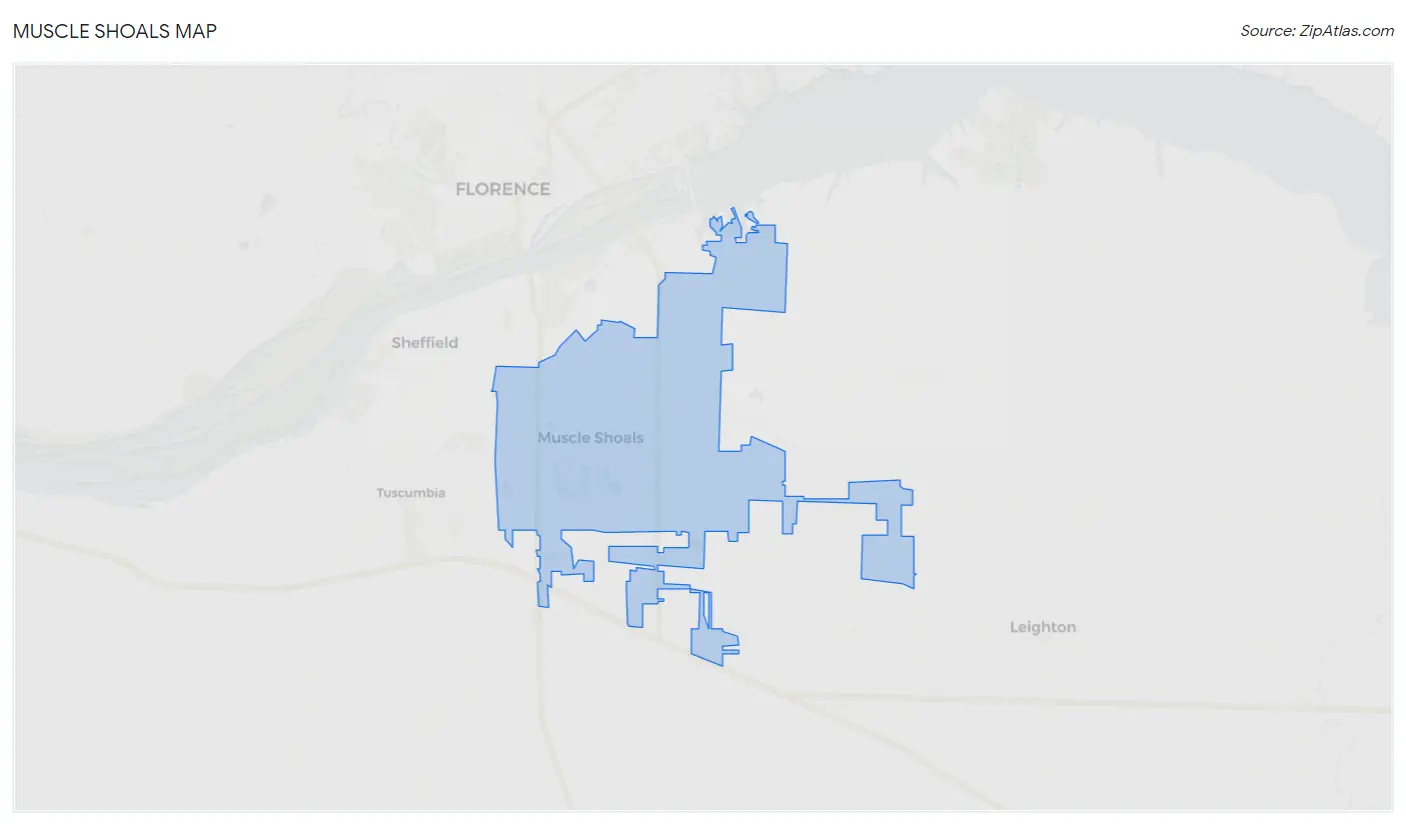
Muscle Shoals Map
Muscle Shoals Overview
$35,791
PER CAPITA INCOME
$74,270
AVG FAMILY INCOME
$70,493
AVG HOUSEHOLD INCOME
24.6%
WAGE / INCOME GAP [ % ]
75.4¢/ $1
WAGE / INCOME GAP [ $ ]
0.42
INEQUALITY / GINI INDEX
16,334
TOTAL POPULATION
7,773
MALE POPULATION
8,561
FEMALE POPULATION
90.80
MALES / 100 FEMALES
110.14
FEMALES / 100 MALES
38.9
MEDIAN AGE
3.0
AVG FAMILY SIZE
2.5
AVG HOUSEHOLD SIZE
8,404
LABOR FORCE [ PEOPLE ]
62.6%
PERCENT IN LABOR FORCE
3.2%
UNEMPLOYMENT RATE
Muscle Shoals Zip Codes
Muscle Shoals Area Codes
Income in Muscle Shoals
Income Overview in Muscle Shoals
Per Capita Income in Muscle Shoals is $35,791, while median incomes of families and households are $74,270 and $70,493 respectively.
| Characteristic | Number | Measure |
| Per Capita Income | 16,334 | $35,791 |
| Median Family Income | 4,501 | $74,270 |
| Mean Family Income | 4,501 | $93,058 |
| Median Household Income | 6,534 | $70,493 |
| Mean Household Income | 6,534 | $85,567 |
| Income Deficit | 4,501 | $0 |
| Wage / Income Gap (%) | 16,334 | 24.61% |
| Wage / Income Gap ($) | 16,334 | 75.39¢ per $1 |
| Gini / Inequality Index | 16,334 | 0.42 |
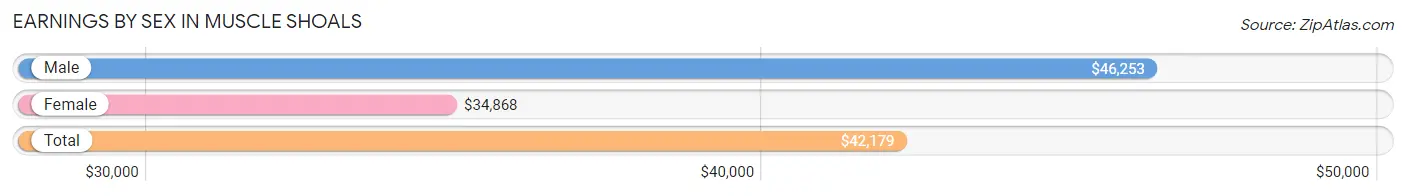
Earnings by Sex in Muscle Shoals
Average Earnings in Muscle Shoals are $42,179, $46,253 for men and $34,868 for women, a difference of 24.6%.
| Sex | Number | Average Earnings |
| Male | 4,314 (50.4%) | $46,253 |
| Female | 4,242 (49.6%) | $34,868 |
| Total | 8,556 (100.0%) | $42,179 |
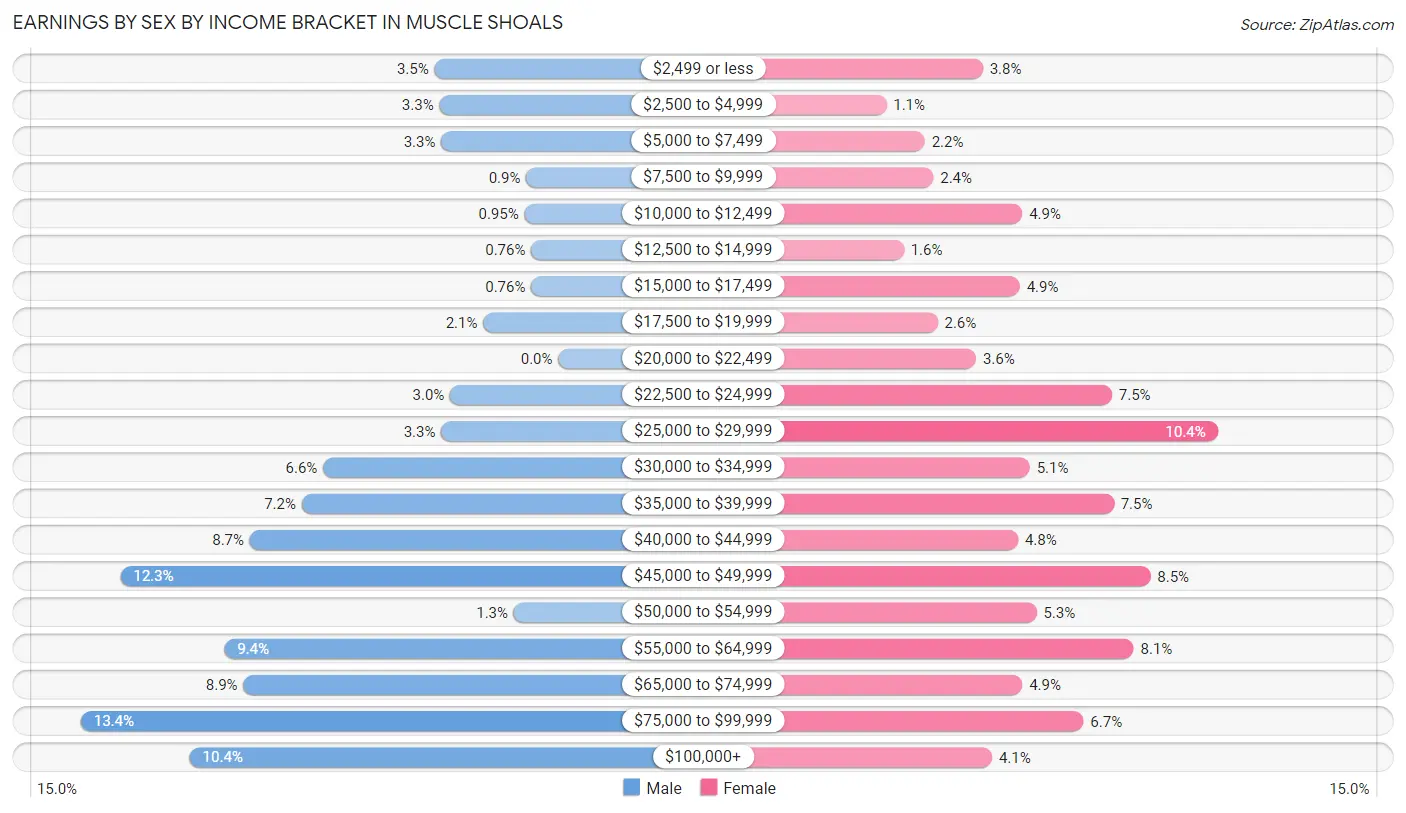
Earnings by Sex by Income Bracket in Muscle Shoals
The most common earnings brackets in Muscle Shoals are $75,000 to $99,999 for men (579 | 13.4%) and $25,000 to $29,999 for women (442 | 10.4%).
| Income | Male | Female |
| $2,499 or less | 150 (3.5%) | 162 (3.8%) |
| $2,500 to $4,999 | 144 (3.3%) | 47 (1.1%) |
| $5,000 to $7,499 | 142 (3.3%) | 93 (2.2%) |
| $7,500 to $9,999 | 39 (0.9%) | 103 (2.4%) |
| $10,000 to $12,499 | 41 (0.9%) | 209 (4.9%) |
| $12,500 to $14,999 | 33 (0.8%) | 68 (1.6%) |
| $15,000 to $17,499 | 33 (0.8%) | 206 (4.9%) |
| $17,500 to $19,999 | 91 (2.1%) | 108 (2.5%) |
| $20,000 to $22,499 | 0 (0.0%) | 154 (3.6%) |
| $22,500 to $24,999 | 131 (3.0%) | 316 (7.4%) |
| $25,000 to $29,999 | 142 (3.3%) | 442 (10.4%) |
| $30,000 to $34,999 | 285 (6.6%) | 218 (5.1%) |
| $35,000 to $39,999 | 311 (7.2%) | 318 (7.5%) |
| $40,000 to $44,999 | 374 (8.7%) | 204 (4.8%) |
| $45,000 to $49,999 | 531 (12.3%) | 362 (8.5%) |
| $50,000 to $54,999 | 54 (1.3%) | 226 (5.3%) |
| $55,000 to $64,999 | 405 (9.4%) | 342 (8.1%) |
| $65,000 to $74,999 | 382 (8.8%) | 209 (4.9%) |
| $75,000 to $99,999 | 579 (13.4%) | 282 (6.7%) |
| $100,000+ | 447 (10.4%) | 173 (4.1%) |
| Total | 4,314 (100.0%) | 4,242 (100.0%) |
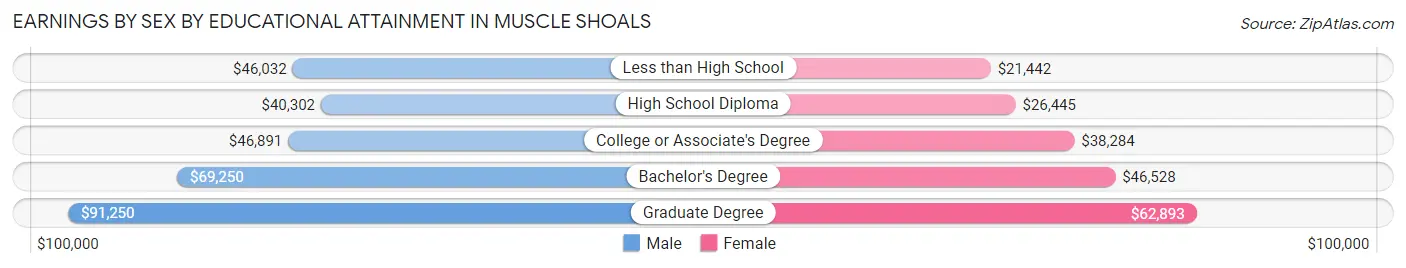
Earnings by Sex by Educational Attainment in Muscle Shoals
Average earnings in Muscle Shoals are $47,458 for men and $39,663 for women, a difference of 16.4%. Men with an educational attainment of graduate degree enjoy the highest average annual earnings of $91,250, while those with high school diploma education earn the least with $40,302. Women with an educational attainment of graduate degree earn the most with the average annual earnings of $62,893, while those with less than high school education have the smallest earnings of $21,442.
| Educational Attainment | Male Income | Female Income |
| Less than High School | $46,032 | $21,442 |
| High School Diploma | $40,302 | $26,445 |
| College or Associate's Degree | $46,891 | $38,284 |
| Bachelor's Degree | $69,250 | $46,528 |
| Graduate Degree | $91,250 | $62,893 |
| Total | $47,458 | $39,663 |
Family Income in Muscle Shoals
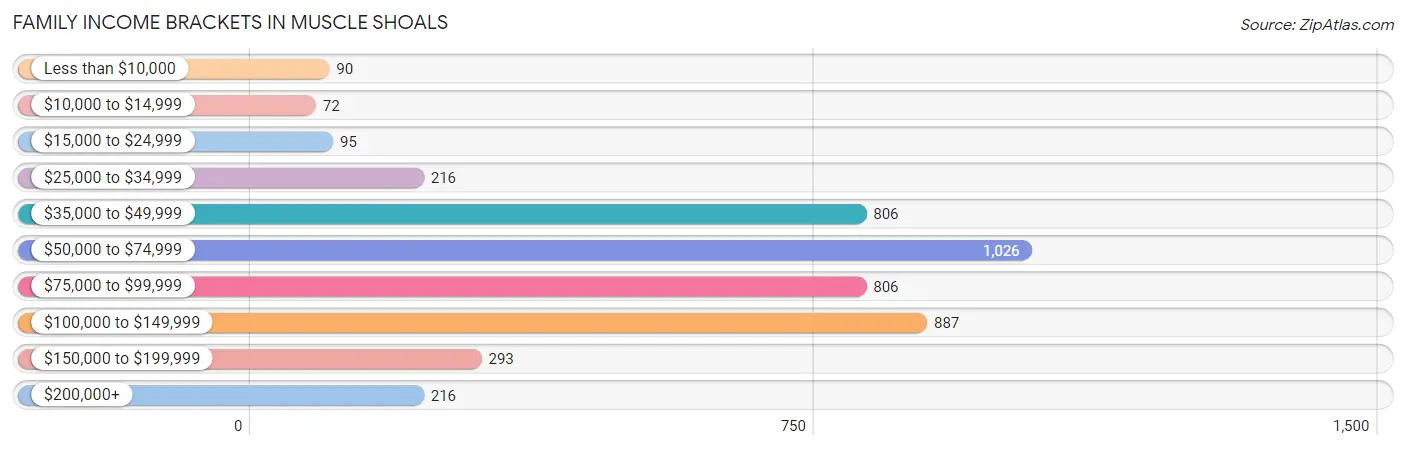
Family Income Brackets in Muscle Shoals
According to the Muscle Shoals family income data, there are 1,026 families falling into the $50,000 to $74,999 income range, which is the most common income bracket and makes up 22.8% of all families. Conversely, the $10,000 to $14,999 income bracket is the least frequent group with only 72 families (1.6%) belonging to this category.
| Income Bracket | # Families | % Families |
| Less than $10,000 | 90 | 2.0% |
| $10,000 to $14,999 | 72 | 1.6% |
| $15,000 to $24,999 | 95 | 2.1% |
| $25,000 to $34,999 | 216 | 4.8% |
| $35,000 to $49,999 | 806 | 17.9% |
| $50,000 to $74,999 | 1,026 | 22.8% |
| $75,000 to $99,999 | 806 | 17.9% |
| $100,000 to $149,999 | 887 | 19.7% |
| $150,000 to $199,999 | 293 | 6.5% |
| $200,000+ | 216 | 4.8% |
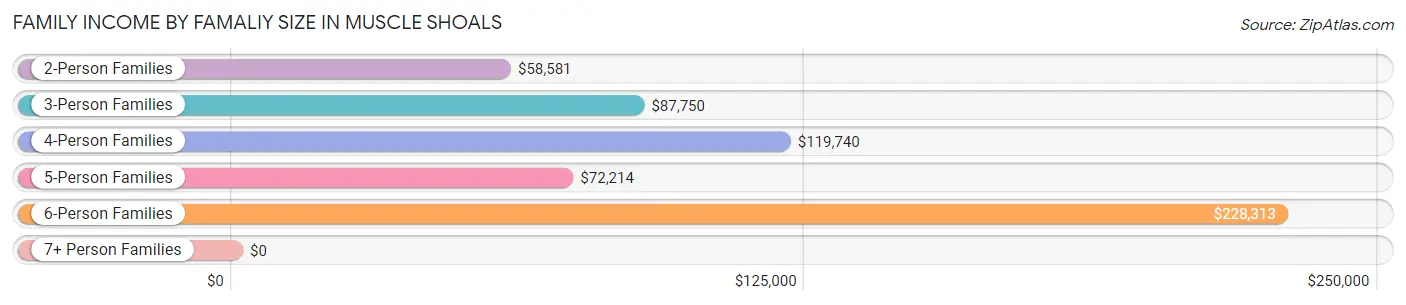
Family Income by Famaliy Size in Muscle Shoals
6-person families (92 | 2.0%) account for the highest median family income in Muscle Shoals with $228,313 per family, while 6-person families (92 | 2.0%) have the highest median income of $38,052 per family member.
| Income Bracket | # Families | Median Income |
| 2-Person Families | 2,350 (52.2%) | $58,581 |
| 3-Person Families | 1,017 (22.6%) | $87,750 |
| 4-Person Families | 751 (16.7%) | $119,740 |
| 5-Person Families | 268 (5.9%) | $72,214 |
| 6-Person Families | 92 (2.0%) | $228,313 |
| 7+ Person Families | 23 (0.5%) | $0 |
| Total | 4,501 (100.0%) | $74,270 |
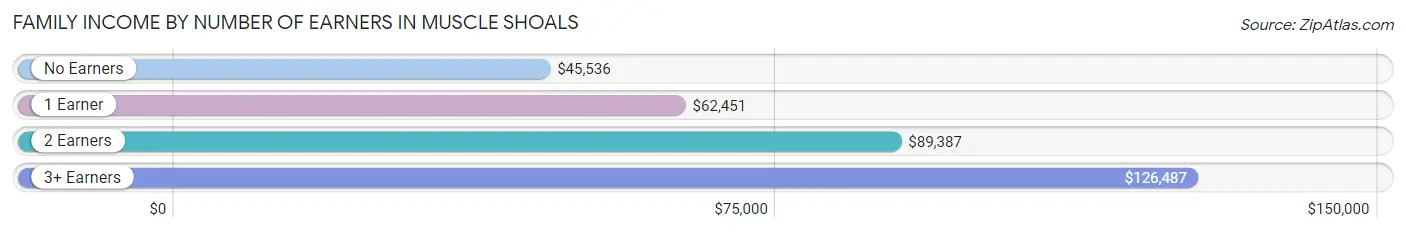
Family Income by Number of Earners in Muscle Shoals
The median family income in Muscle Shoals is $74,270, with families comprising 3+ earners (551) having the highest median family income of $126,487, while families with no earners (972) have the lowest median family income of $45,536, accounting for 12.2% and 21.6% of families, respectively.
| Number of Earners | # Families | Median Income |
| No Earners | 972 (21.6%) | $45,536 |
| 1 Earner | 1,398 (31.1%) | $62,451 |
| 2 Earners | 1,580 (35.1%) | $89,387 |
| 3+ Earners | 551 (12.2%) | $126,487 |
| Total | 4,501 (100.0%) | $74,270 |
Household Income in Muscle Shoals
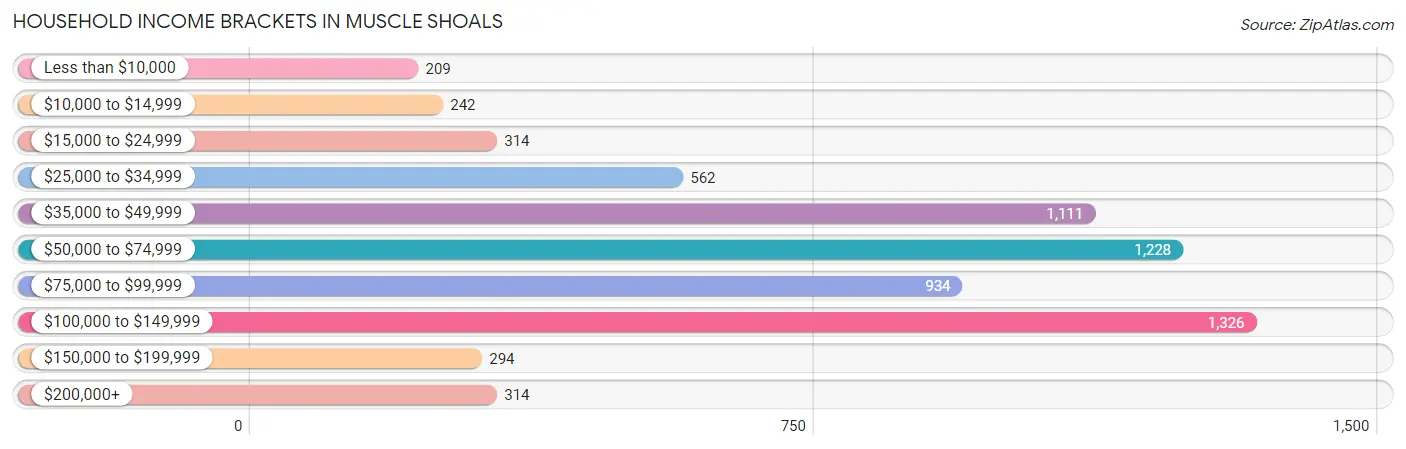
Household Income Brackets in Muscle Shoals
With 1,326 households falling in the category, the $100,000 to $149,999 income range is the most frequent in Muscle Shoals, accounting for 20.3% of all households. In contrast, only 209 households (3.2%) fall into the less than $10,000 income bracket, making it the least populous group.
| Income Bracket | # Households | % Households |
| Less than $10,000 | 209 | 3.2% |
| $10,000 to $14,999 | 242 | 3.7% |
| $15,000 to $24,999 | 314 | 4.8% |
| $25,000 to $34,999 | 562 | 8.6% |
| $35,000 to $49,999 | 1,111 | 17.0% |
| $50,000 to $74,999 | 1,228 | 18.8% |
| $75,000 to $99,999 | 934 | 14.3% |
| $100,000 to $149,999 | 1,326 | 20.3% |
| $150,000 to $199,999 | 294 | 4.5% |
| $200,000+ | 314 | 4.8% |
Household Income by Householder Age in Muscle Shoals
The median household income in Muscle Shoals is $70,493, with the highest median household income of $88,227 found in the 25 to 44 years age bracket for the primary householder. A total of 2,147 households (32.9%) fall into this category. Meanwhile, the 65+ years age bracket for the primary householder has the lowest median household income of $46,800, with 1,838 households (28.1%) in this group.
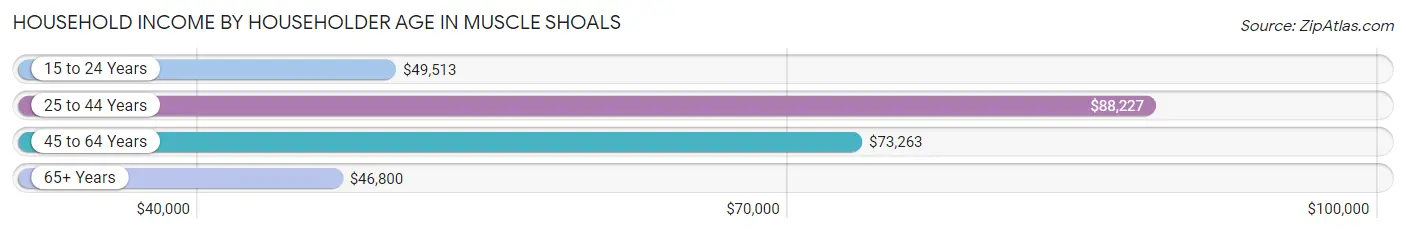
| Income Bracket | # Households | Median Income |
| 15 to 24 Years | 230 (3.5%) | $49,513 |
| 25 to 44 Years | 2,147 (32.9%) | $88,227 |
| 45 to 64 Years | 2,319 (35.5%) | $73,263 |
| 65+ Years | 1,838 (28.1%) | $46,800 |
| Total | 6,534 (100.0%) | $70,493 |
Poverty in Muscle Shoals
Income Below Poverty by Sex and Age in Muscle Shoals
With 4.7% poverty level for males and 8.2% for females among the residents of Muscle Shoals, 6 to 11 year old males and 5 year old females are the most vulnerable to poverty, with 53 males (9.7%) and 54 females (60.0%) in their respective age groups living below the poverty level.
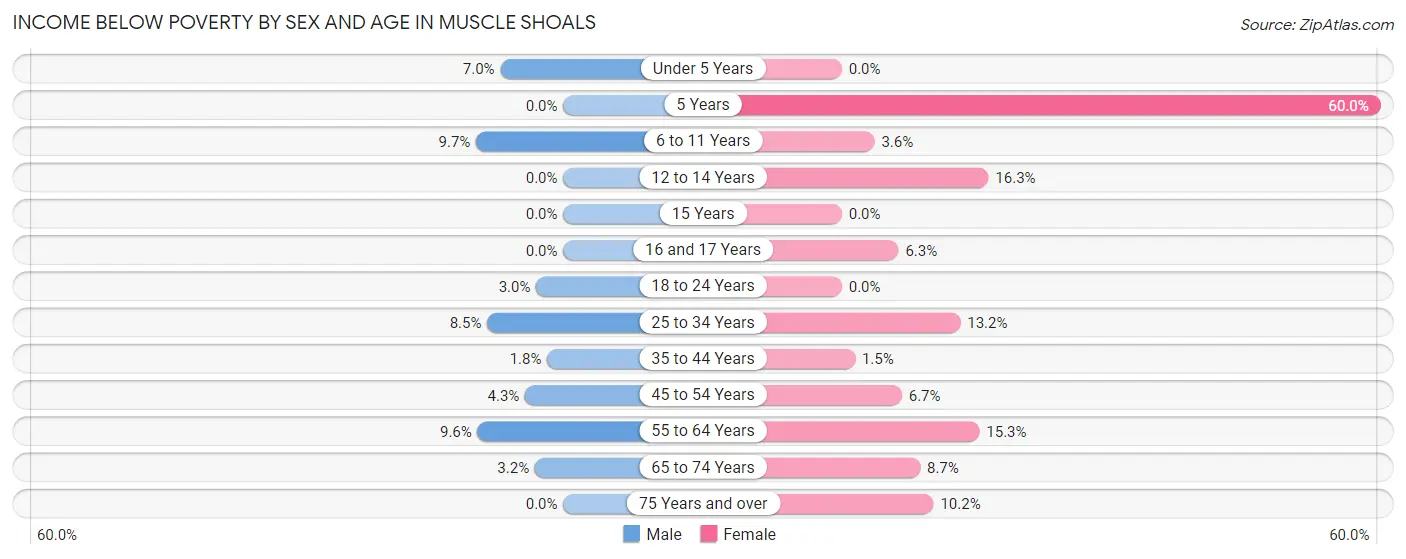
| Age Bracket | Male | Female |
| Under 5 Years | 30 (7.0%) | 0 (0.0%) |
| 5 Years | 0 (0.0%) | 54 (60.0%) |
| 6 to 11 Years | 53 (9.7%) | 19 (3.6%) |
| 12 to 14 Years | 0 (0.0%) | 40 (16.3%) |
| 15 Years | 0 (0.0%) | 0 (0.0%) |
| 16 and 17 Years | 0 (0.0%) | 20 (6.3%) |
| 18 to 24 Years | 18 (3.0%) | 0 (0.0%) |
| 25 to 34 Years | 90 (8.5%) | 128 (13.2%) |
| 35 to 44 Years | 22 (1.8%) | 16 (1.5%) |
| 45 to 54 Years | 43 (4.3%) | 82 (6.7%) |
| 55 to 64 Years | 87 (9.6%) | 170 (15.3%) |
| 65 to 74 Years | 23 (3.2%) | 75 (8.7%) |
| 75 Years and over | 0 (0.0%) | 79 (10.2%) |
| Total | 366 (4.7%) | 683 (8.2%) |
Income Above Poverty by Sex and Age in Muscle Shoals
According to the poverty statistics in Muscle Shoals, males aged 5 years and females aged under 5 years are the age groups that are most secure financially, with 100.0% of males and 100.0% of females in these age groups living above the poverty line.
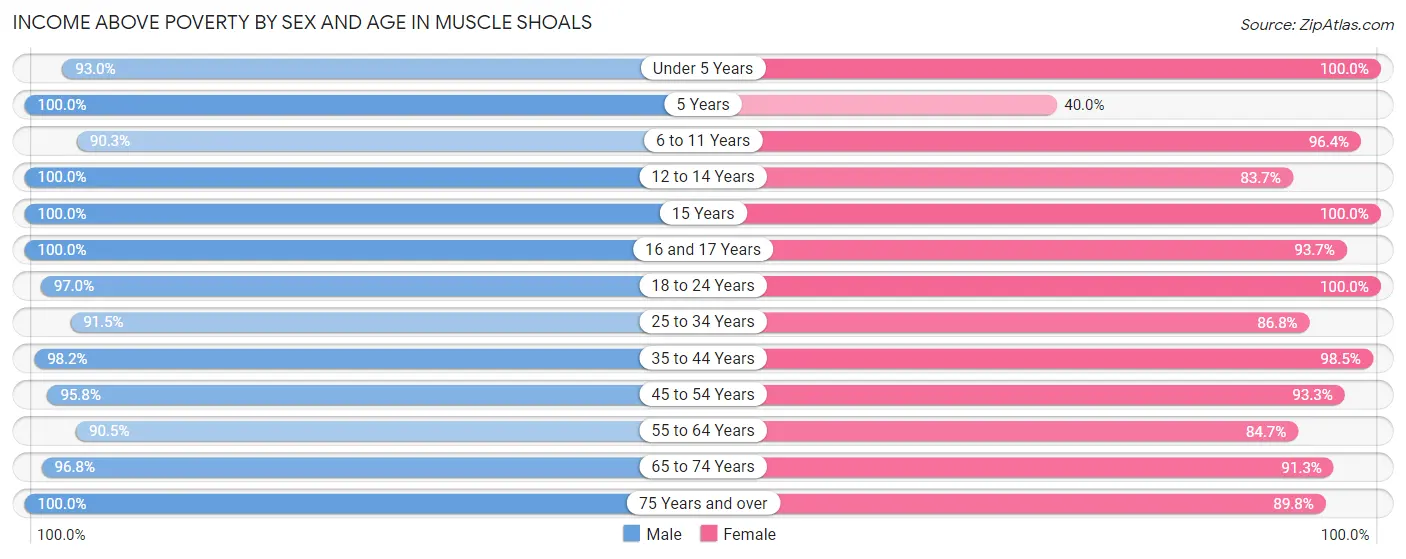
| Age Bracket | Male | Female |
| Under 5 Years | 398 (93.0%) | 338 (100.0%) |
| 5 Years | 115 (100.0%) | 36 (40.0%) |
| 6 to 11 Years | 493 (90.3%) | 503 (96.4%) |
| 12 to 14 Years | 265 (100.0%) | 205 (83.7%) |
| 15 Years | 174 (100.0%) | 78 (100.0%) |
| 16 and 17 Years | 149 (100.0%) | 297 (93.7%) |
| 18 to 24 Years | 580 (97.0%) | 680 (100.0%) |
| 25 to 34 Years | 972 (91.5%) | 842 (86.8%) |
| 35 to 44 Years | 1,204 (98.2%) | 1,075 (98.5%) |
| 45 to 54 Years | 968 (95.8%) | 1,146 (93.3%) |
| 55 to 64 Years | 824 (90.4%) | 940 (84.7%) |
| 65 to 74 Years | 705 (96.8%) | 786 (91.3%) |
| 75 Years and over | 551 (100.0%) | 695 (89.8%) |
| Total | 7,398 (95.3%) | 7,621 (91.8%) |
Income Below Poverty Among Married-Couple Families in Muscle Shoals
The poverty statistics for married-couple families in Muscle Shoals show that 4.9% or 165 of the total 3,340 families live below the poverty line. Families with 1 or 2 children have the highest poverty rate of 5.6%, comprising of 61 families. On the other hand, families with 3 or 4 children have the lowest poverty rate of 0.0%, which includes 0 families.
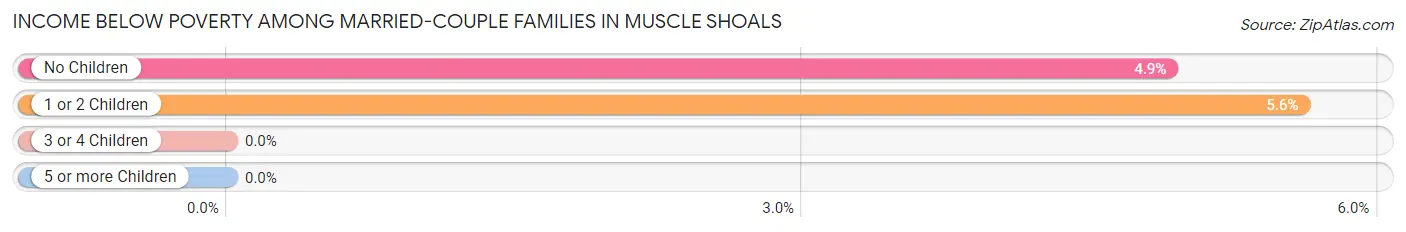
| Children | Above Poverty | Below Poverty |
| No Children | 2,015 (95.1%) | 104 (4.9%) |
| 1 or 2 Children | 1,028 (94.4%) | 61 (5.6%) |
| 3 or 4 Children | 132 (100.0%) | 0 (0.0%) |
| 5 or more Children | 0 (0.0%) | 0 (0.0%) |
| Total | 3,175 (95.1%) | 165 (4.9%) |
Income Below Poverty Among Single-Parent Households in Muscle Shoals
According to the poverty data in Muscle Shoals, 11.0% or 26 single-father households and 8.1% or 75 single-mother households are living below the poverty line. Among single-father households, those with 1 or 2 children have the highest poverty rate, with 26 households (27.1%) experiencing poverty. Likewise, among single-mother households, those with 1 or 2 children have the highest poverty rate, with 50 households (13.0%) falling below the poverty line.
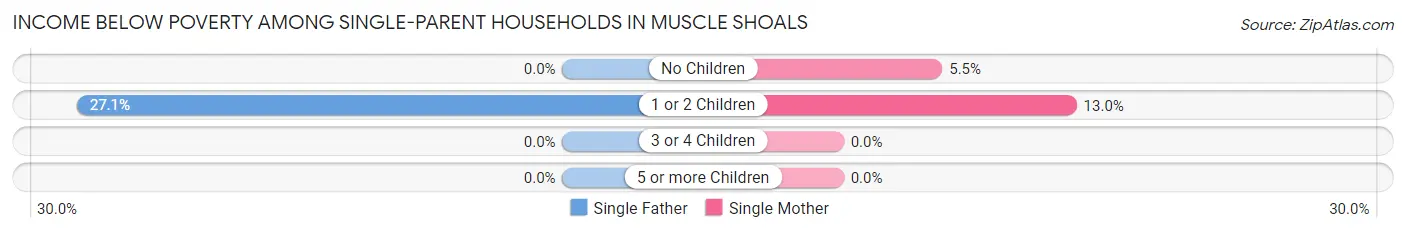
| Children | Single Father | Single Mother |
| No Children | 0 (0.0%) | 25 (5.5%) |
| 1 or 2 Children | 26 (27.1%) | 50 (13.0%) |
| 3 or 4 Children | 0 (0.0%) | 0 (0.0%) |
| 5 or more Children | 0 (0.0%) | 0 (0.0%) |
| Total | 26 (11.0%) | 75 (8.1%) |
Income Below Poverty Among Married-Couple vs Single-Parent Households in Muscle Shoals
The poverty data for Muscle Shoals shows that 165 of the married-couple family households (4.9%) and 101 of the single-parent households (8.7%) are living below the poverty level. Within the married-couple family households, those with 1 or 2 children have the highest poverty rate, with 61 households (5.6%) falling below the poverty line. Among the single-parent households, those with 1 or 2 children have the highest poverty rate, with 76 household (15.8%) living below poverty.
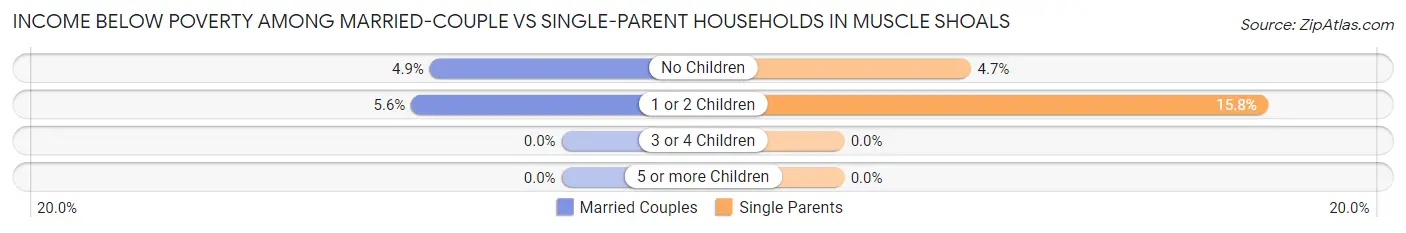
| Children | Married-Couple Families | Single-Parent Households |
| No Children | 104 (4.9%) | 25 (4.7%) |
| 1 or 2 Children | 61 (5.6%) | 76 (15.8%) |
| 3 or 4 Children | 0 (0.0%) | 0 (0.0%) |
| 5 or more Children | 0 (0.0%) | 0 (0.0%) |
| Total | 165 (4.9%) | 101 (8.7%) |
Race in Muscle Shoals
The most populous races in Muscle Shoals are White / Caucasian (12,623 | 77.3%), Black / African American (2,410 | 14.7%), and Hispanic or Latino (807 | 4.9%).
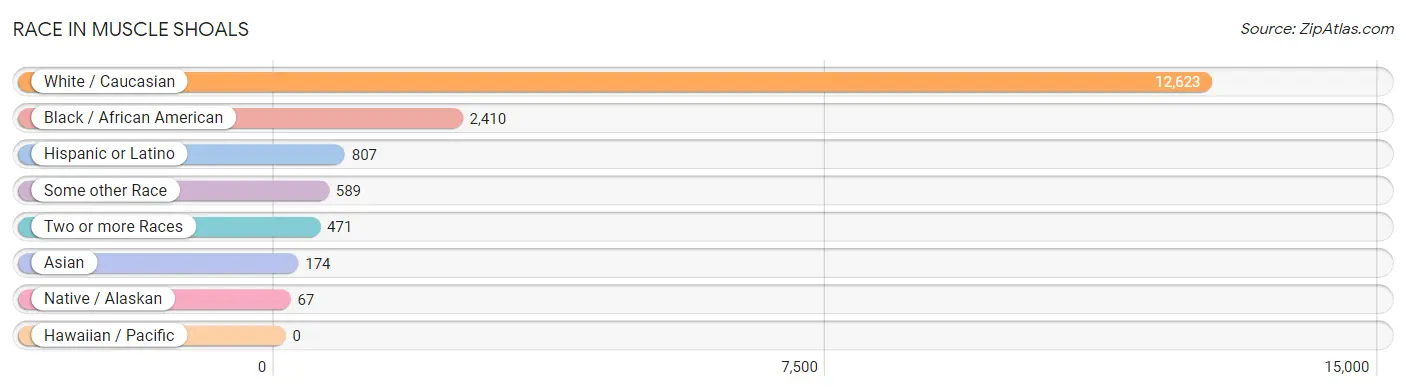
| Race | # Population | % Population |
| Asian | 174 | 1.1% |
| Black / African American | 2,410 | 14.7% |
| Hawaiian / Pacific | 0 | 0.0% |
| Hispanic or Latino | 807 | 4.9% |
| Native / Alaskan | 67 | 0.4% |
| White / Caucasian | 12,623 | 77.3% |
| Two or more Races | 471 | 2.9% |
| Some other Race | 589 | 3.6% |
| Total | 16,334 | 100.0% |
Ancestry in Muscle Shoals
The most populous ancestries reported in Muscle Shoals are American (3,405 | 20.8%), English (1,799 | 11.0%), Mexican (740 | 4.5%), Irish (719 | 4.4%), and German (568 | 3.5%), together accounting for 44.3% of all Muscle Shoals residents.
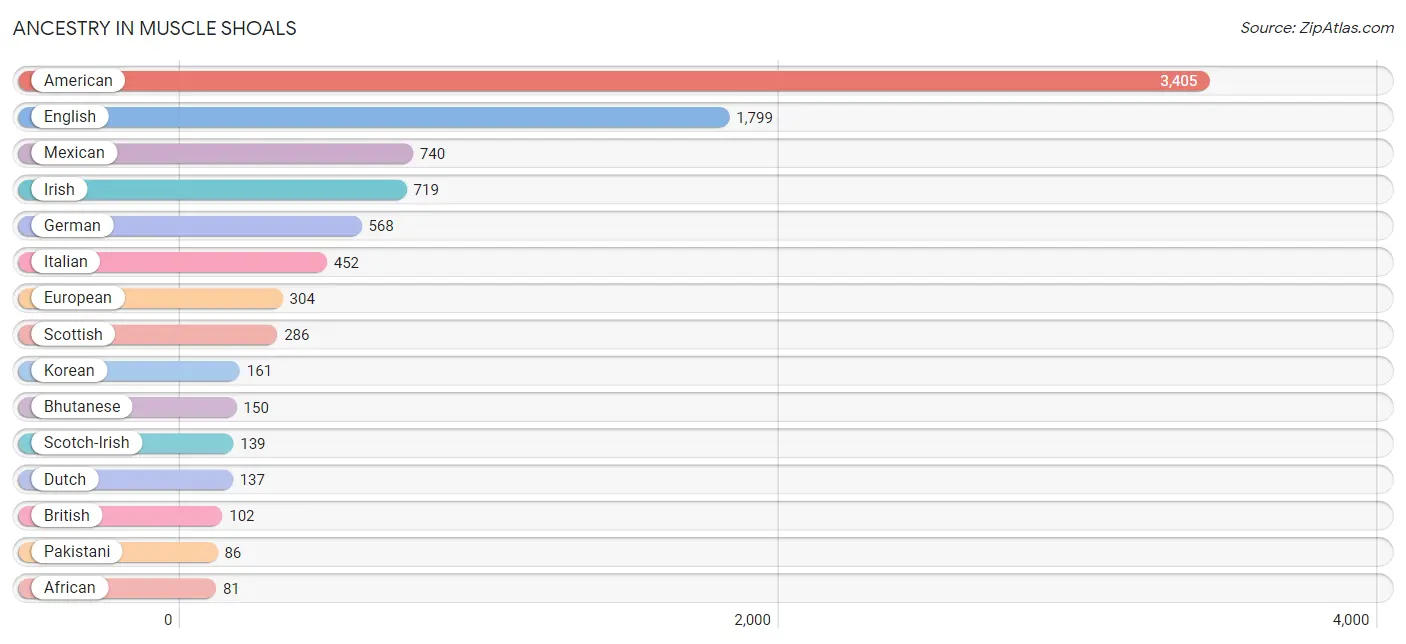
| Ancestry | # Population | % Population |
| African | 81 | 0.5% |
| American | 3,405 | 20.8% |
| Bhutanese | 150 | 0.9% |
| British | 102 | 0.6% |
| Central American | 46 | 0.3% |
| Cherokee | 17 | 0.1% |
| Chickasaw | 9 | 0.1% |
| Choctaw | 17 | 0.1% |
| Cuban | 21 | 0.1% |
| Dutch | 137 | 0.8% |
| English | 1,799 | 11.0% |
| European | 304 | 1.9% |
| French | 79 | 0.5% |
| German | 568 | 3.5% |
| Greek | 13 | 0.1% |
| Guatemalan | 18 | 0.1% |
| Irish | 719 | 4.4% |
| Italian | 452 | 2.8% |
| Korean | 161 | 1.0% |
| Mexican | 740 | 4.5% |
| Mexican American Indian | 45 | 0.3% |
| Norwegian | 9 | 0.1% |
| Pakistani | 86 | 0.5% |
| Polish | 22 | 0.1% |
| Portuguese | 21 | 0.1% |
| Romanian | 16 | 0.1% |
| Russian | 9 | 0.1% |
| Salvadoran | 28 | 0.2% |
| Scandinavian | 43 | 0.3% |
| Scotch-Irish | 139 | 0.9% |
| Scottish | 286 | 1.8% |
| Subsaharan African | 81 | 0.5% |
| Swedish | 56 | 0.3% |
| Swiss | 17 | 0.1% |
| Thai | 76 | 0.5% |
| Welsh | 68 | 0.4% | View All 36 Rows |
Immigrants in Muscle Shoals
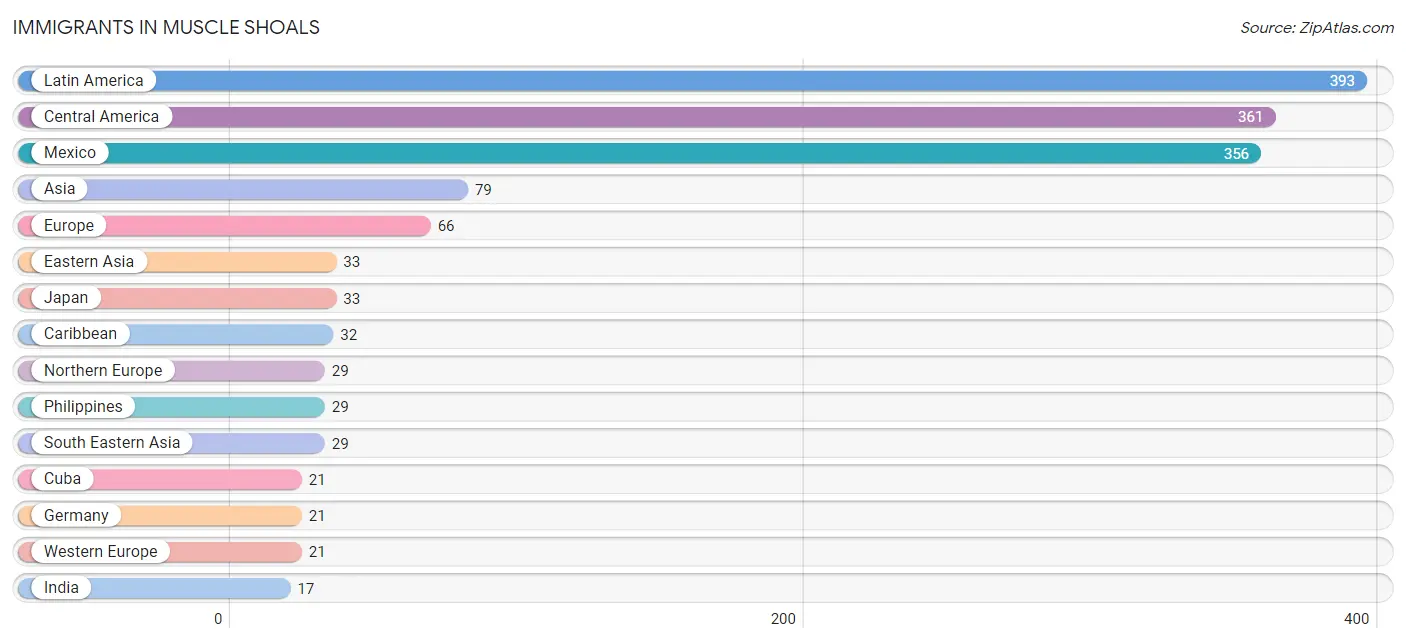
The most numerous immigrant groups reported in Muscle Shoals came from Latin America (393 | 2.4%), Central America (361 | 2.2%), Mexico (356 | 2.2%), Asia (79 | 0.5%), and Europe (66 | 0.4%), together accounting for 7.7% of all Muscle Shoals residents.
| Immigration Origin | # Population | % Population |
| Asia | 79 | 0.5% |
| Caribbean | 32 | 0.2% |
| Central America | 361 | 2.2% |
| Cuba | 21 | 0.1% |
| Eastern Asia | 33 | 0.2% |
| Eastern Europe | 16 | 0.1% |
| Europe | 66 | 0.4% |
| Germany | 21 | 0.1% |
| Guatemala | 5 | 0.0% |
| India | 17 | 0.1% |
| Jamaica | 11 | 0.1% |
| Japan | 33 | 0.2% |
| Latin America | 393 | 2.4% |
| Mexico | 356 | 2.2% |
| Northern Europe | 29 | 0.2% |
| Philippines | 29 | 0.2% |
| Romania | 16 | 0.1% |
| South Central Asia | 17 | 0.1% |
| South Eastern Asia | 29 | 0.2% |
| Western Europe | 21 | 0.1% | View All 20 Rows |
Sex and Age in Muscle Shoals
Sex and Age in Muscle Shoals
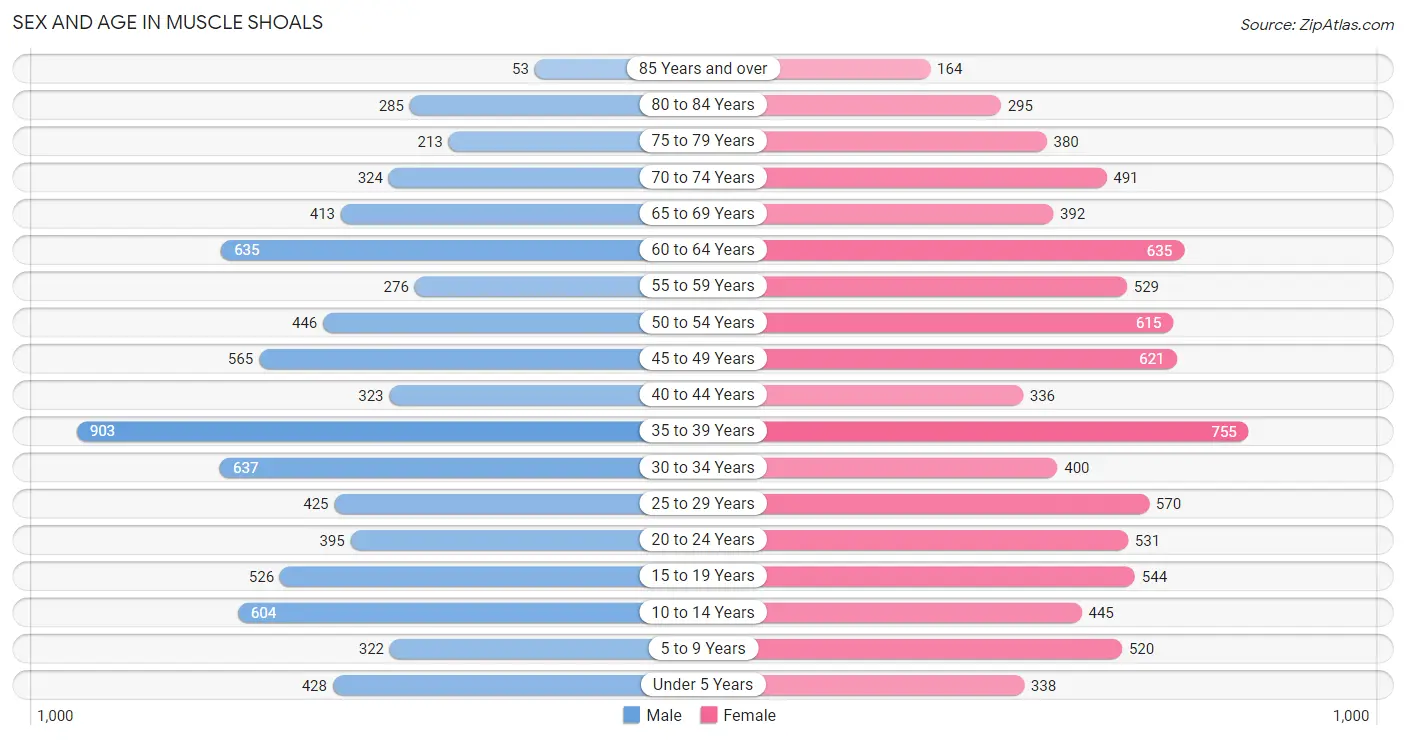
The most populous age groups in Muscle Shoals are 35 to 39 Years (903 | 11.6%) for men and 35 to 39 Years (755 | 8.8%) for women.
| Age Bracket | Male | Female |
| Under 5 Years | 428 (5.5%) | 338 (4.0%) |
| 5 to 9 Years | 322 (4.1%) | 520 (6.1%) |
| 10 to 14 Years | 604 (7.8%) | 445 (5.2%) |
| 15 to 19 Years | 526 (6.8%) | 544 (6.4%) |
| 20 to 24 Years | 395 (5.1%) | 531 (6.2%) |
| 25 to 29 Years | 425 (5.5%) | 570 (6.7%) |
| 30 to 34 Years | 637 (8.2%) | 400 (4.7%) |
| 35 to 39 Years | 903 (11.6%) | 755 (8.8%) |
| 40 to 44 Years | 323 (4.2%) | 336 (3.9%) |
| 45 to 49 Years | 565 (7.3%) | 621 (7.2%) |
| 50 to 54 Years | 446 (5.7%) | 615 (7.2%) |
| 55 to 59 Years | 276 (3.5%) | 529 (6.2%) |
| 60 to 64 Years | 635 (8.2%) | 635 (7.4%) |
| 65 to 69 Years | 413 (5.3%) | 392 (4.6%) |
| 70 to 74 Years | 324 (4.2%) | 491 (5.7%) |
| 75 to 79 Years | 213 (2.7%) | 380 (4.4%) |
| 80 to 84 Years | 285 (3.7%) | 295 (3.5%) |
| 85 Years and over | 53 (0.7%) | 164 (1.9%) |
| Total | 7,773 (100.0%) | 8,561 (100.0%) |
Families and Households in Muscle Shoals
Median Family Size in Muscle Shoals
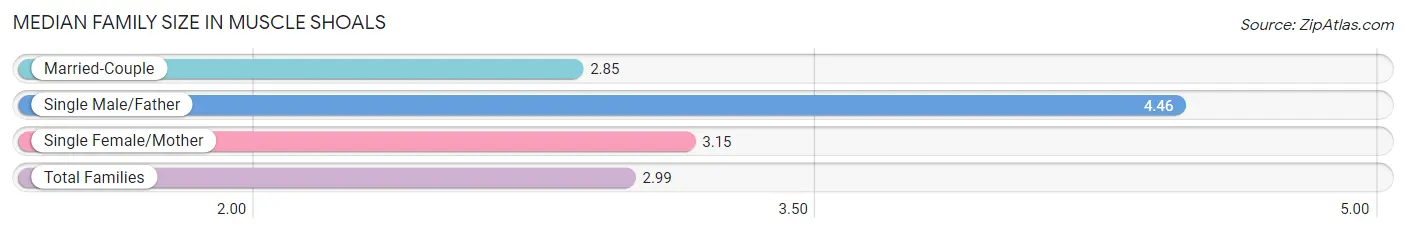
The median family size in Muscle Shoals is 2.99 persons per family, with single male/father families (236 | 5.2%) accounting for the largest median family size of 4.46 persons per family. On the other hand, married-couple families (3,340 | 74.2%) represent the smallest median family size with 2.85 persons per family.
| Family Type | # Families | Family Size |
| Married-Couple | 3,340 (74.2%) | 2.85 |
| Single Male/Father | 236 (5.2%) | 4.46 |
| Single Female/Mother | 925 (20.5%) | 3.15 |
| Total Families | 4,501 (100.0%) | 2.99 |
Median Household Size in Muscle Shoals
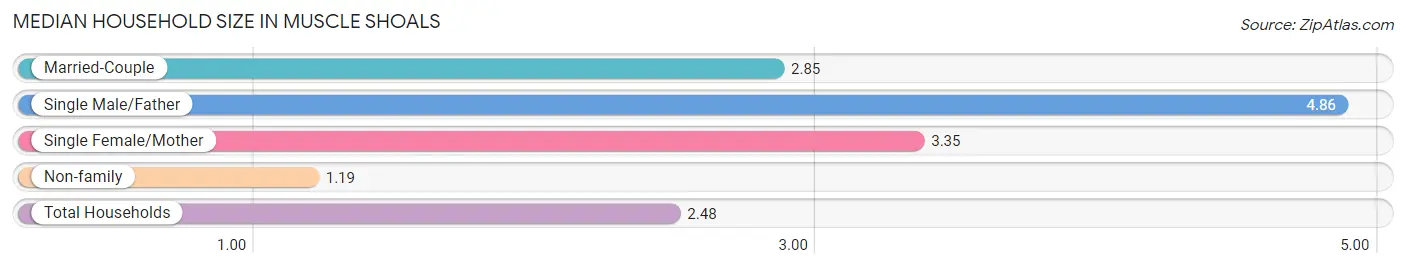
The median household size in Muscle Shoals is 2.48 persons per household, with single male/father households (236 | 3.6%) accounting for the largest median household size of 4.86 persons per household. non-family households (2,033 | 31.1%) represent the smallest median household size with 1.19 persons per household.
| Household Type | # Households | Household Size |
| Married-Couple | 3,340 (51.1%) | 2.85 |
| Single Male/Father | 236 (3.6%) | 4.86 |
| Single Female/Mother | 925 (14.2%) | 3.35 |
| Non-family | 2,033 (31.1%) | 1.19 |
| Total Households | 6,534 (100.0%) | 2.48 |
Household Size by Marriage Status in Muscle Shoals
Out of a total of 6,534 households in Muscle Shoals, 4,501 (68.9%) are family households, while 2,033 (31.1%) are nonfamily households. The most numerous type of family households are 2-person households, comprising 2,285, and the most common type of nonfamily households are 1-person households, comprising 1,661.
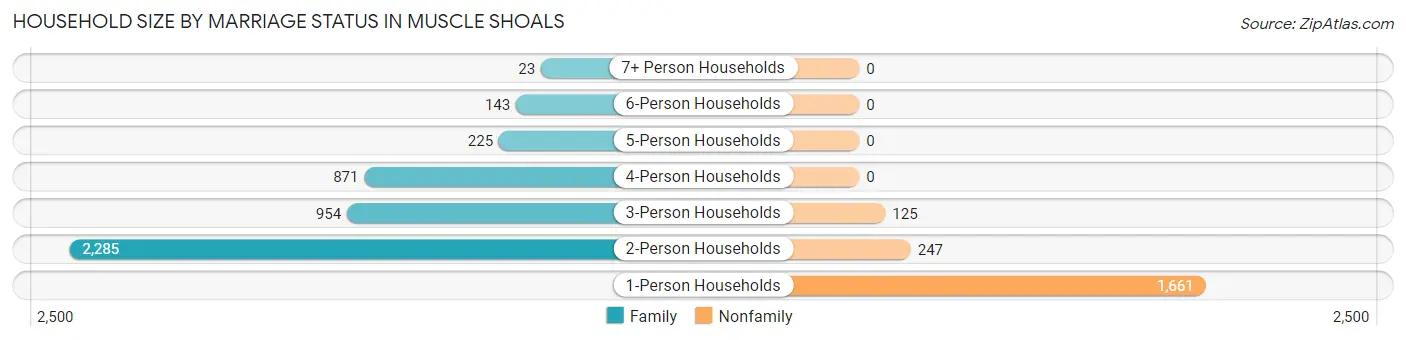
| Household Size | Family Households | Nonfamily Households |
| 1-Person Households | - | 1,661 (25.4%) |
| 2-Person Households | 2,285 (35.0%) | 247 (3.8%) |
| 3-Person Households | 954 (14.6%) | 125 (1.9%) |
| 4-Person Households | 871 (13.3%) | 0 (0.0%) |
| 5-Person Households | 225 (3.4%) | 0 (0.0%) |
| 6-Person Households | 143 (2.2%) | 0 (0.0%) |
| 7+ Person Households | 23 (0.4%) | 0 (0.0%) |
| Total | 4,501 (68.9%) | 2,033 (31.1%) |
Female Fertility in Muscle Shoals
Fertility by Age in Muscle Shoals
Average fertility rate in Muscle Shoals is 67.0 births per 1,000 women. Women in the age bracket of 20 to 34 years have the highest fertility rate with 162.0 births per 1,000 women. Women in the age bracket of 20 to 34 years acount for 92.4% of all women with births.
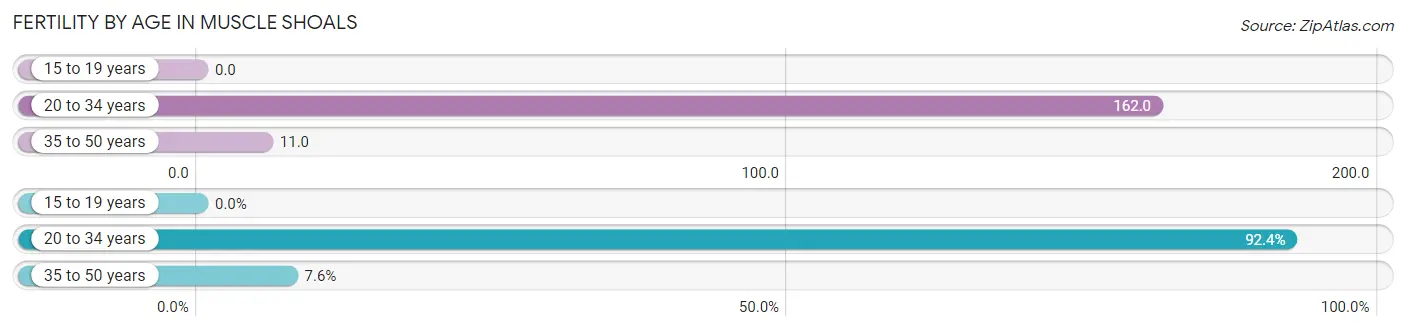
| Age Bracket | Women with Births | Births / 1,000 Women |
| 15 to 19 years | 0 (0.0%) | 0.0 |
| 20 to 34 years | 243 (92.4%) | 162.0 |
| 35 to 50 years | 20 (7.6%) | 11.0 |
| Total | 263 (100.0%) | 67.0 |
Fertility by Age by Marriage Status in Muscle Shoals
70.0% of women with births (263) in Muscle Shoals are married. The highest percentage of unmarried women with births falls into 20 to 34 years age bracket with 32.5% of them unmarried at the time of birth, while the lowest percentage of unmarried women with births belong to 35 to 50 years age bracket with 0.0% of them unmarried.
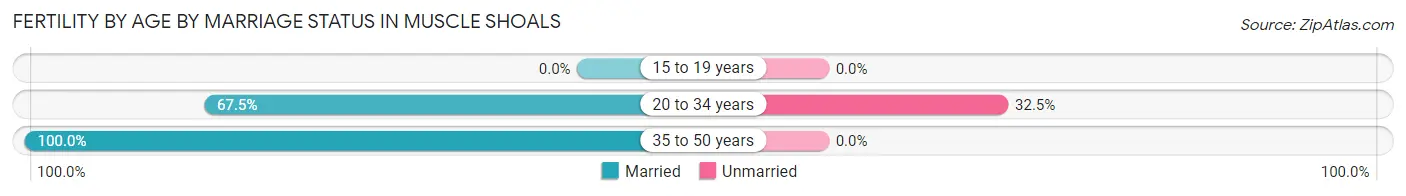
| Age Bracket | Married | Unmarried |
| 15 to 19 years | 0 (0.0%) | 0 (0.0%) |
| 20 to 34 years | 164 (67.5%) | 79 (32.5%) |
| 35 to 50 years | 20 (100.0%) | 0 (0.0%) |
| Total | 184 (70.0%) | 79 (30.0%) |
Fertility by Education in Muscle Shoals
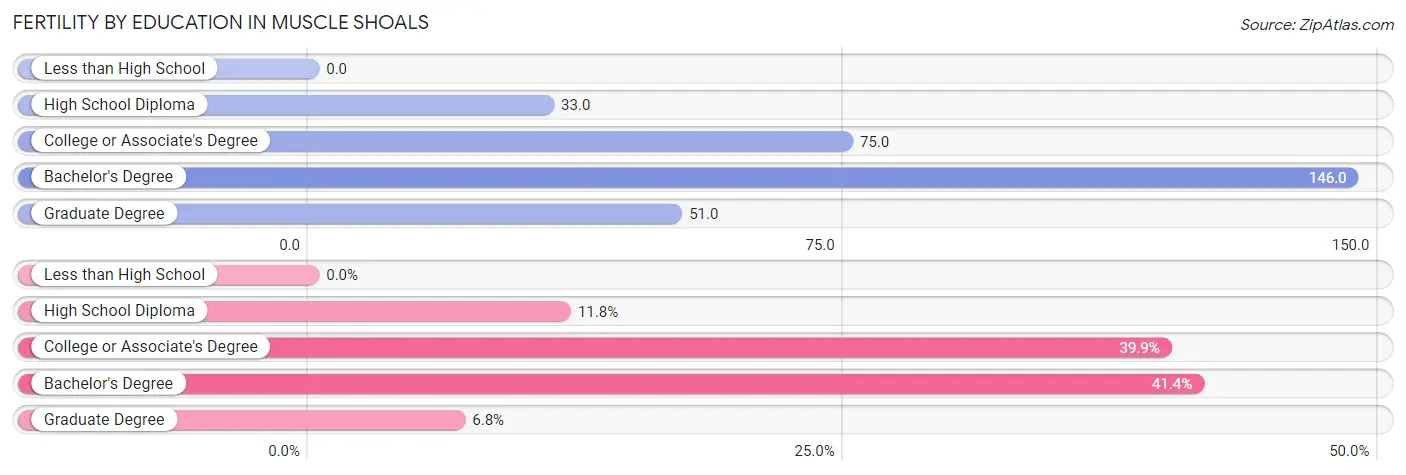
| Educational Attainment | Women with Births | Births / 1,000 Women |
| Less than High School | 0 (0.0%) | 0.0 |
| High School Diploma | 31 (11.8%) | 33.0 |
| College or Associate's Degree | 105 (39.9%) | 75.0 |
| Bachelor's Degree | 109 (41.4%) | 146.0 |
| Graduate Degree | 18 (6.8%) | 51.0 |
| Total | 263 (100.0%) | 67.0 |
Fertility by Education by Marriage Status in Muscle Shoals
30.0% of women with births in Muscle Shoals are unmarried. Women with the educational attainment of high school diploma are most likely to be married with 100.0% of them married at childbirth, while women with the educational attainment of bachelor's degree are least likely to be married with 39.5% of them unmarried at childbirth.
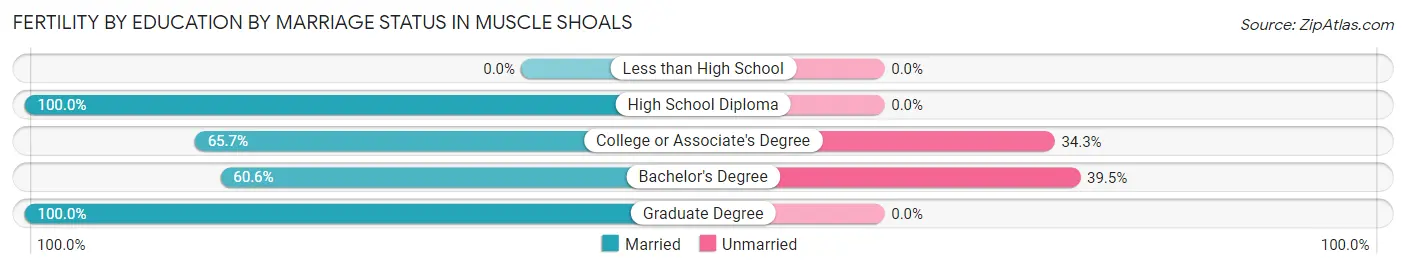
| Educational Attainment | Married | Unmarried |
| Less than High School | 0 (0.0%) | 0 (0.0%) |
| High School Diploma | 31 (100.0%) | 0 (0.0%) |
| College or Associate's Degree | 69 (65.7%) | 36 (34.3%) |
| Bachelor's Degree | 66 (60.6%) | 43 (39.5%) |
| Graduate Degree | 18 (100.0%) | 0 (0.0%) |
| Total | 184 (70.0%) | 79 (30.0%) |
Employment Characteristics in Muscle Shoals
Employment by Class of Employer in Muscle Shoals
Among the 8,018 employed individuals in Muscle Shoals, private company employees (5,974 | 74.5%), self-employed (not incorporated) (545 | 6.8%), and local government employees (393 | 4.9%) make up the most common classes of employment.
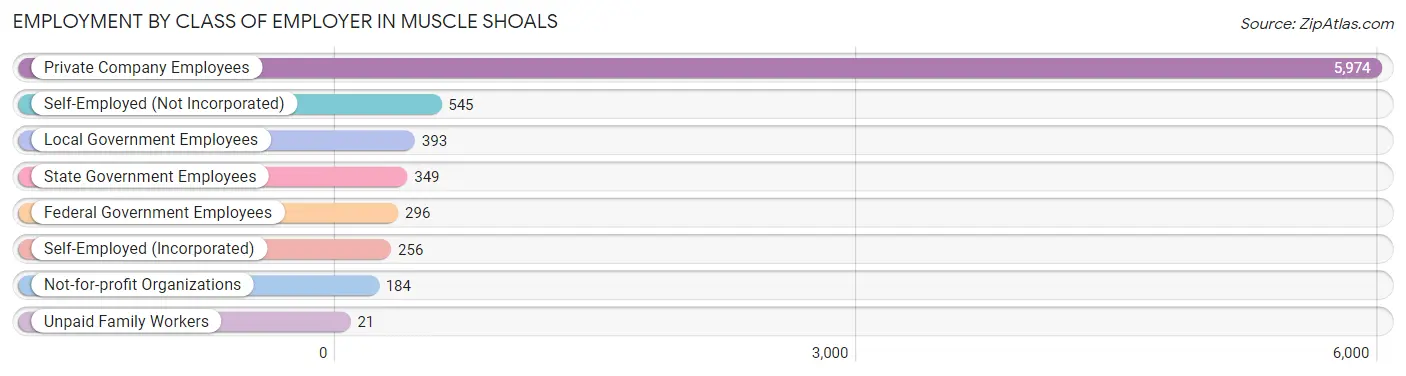
| Employer Class | # Employees | % Employees |
| Private Company Employees | 5,974 | 74.5% |
| Self-Employed (Incorporated) | 256 | 3.2% |
| Self-Employed (Not Incorporated) | 545 | 6.8% |
| Not-for-profit Organizations | 184 | 2.3% |
| Local Government Employees | 393 | 4.9% |
| State Government Employees | 349 | 4.3% |
| Federal Government Employees | 296 | 3.7% |
| Unpaid Family Workers | 21 | 0.3% |
| Total | 8,018 | 100.0% |
Employment Status by Age in Muscle Shoals
According to the labor force statistics for Muscle Shoals, out of the total population over 16 years of age (13,425), 62.6% or 8,404 individuals are in the labor force, with 3.2% or 269 of them unemployed. The age group with the highest labor force participation rate is 20 to 24 years, with 93.8% or 869 individuals in the labor force. Within the labor force, the 65 to 74 years age range has the highest percentage of unemployed individuals, with 16.0% or 34 of them being unemployed.
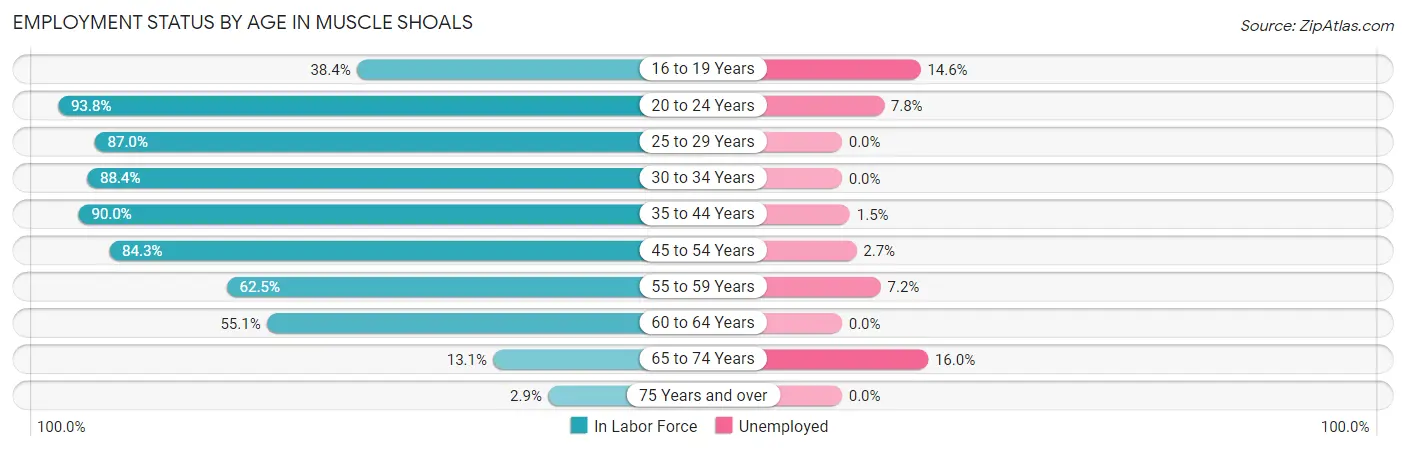
| Age Bracket | In Labor Force | Unemployed |
| 16 to 19 Years | 314 (38.4%) | 46 (14.6%) |
| 20 to 24 Years | 869 (93.8%) | 68 (7.8%) |
| 25 to 29 Years | 866 (87.0%) | 0 (0.0%) |
| 30 to 34 Years | 917 (88.4%) | 0 (0.0%) |
| 35 to 44 Years | 2,085 (90.0%) | 31 (1.5%) |
| 45 to 54 Years | 1,894 (84.3%) | 51 (2.7%) |
| 55 to 59 Years | 503 (62.5%) | 36 (7.2%) |
| 60 to 64 Years | 700 (55.1%) | 0 (0.0%) |
| 65 to 74 Years | 212 (13.1%) | 34 (16.0%) |
| 75 Years and over | 40 (2.9%) | 0 (0.0%) |
| Total | 8,404 (62.6%) | 269 (3.2%) |
Employment Status by Educational Attainment in Muscle Shoals
According to labor force statistics for Muscle Shoals, 80.3% of individuals (6,963) out of the total population between 25 and 64 years of age (8,671) are in the labor force, with 1.7% or 118 of them being unemployed. The group with the highest labor force participation rate are those with the educational attainment of bachelor's degree or higher, with 88.9% or 1,857 individuals in the labor force. Within the labor force, individuals with less than high school education have the highest percentage of unemployment, with 4.3% or 25 of them being unemployed.
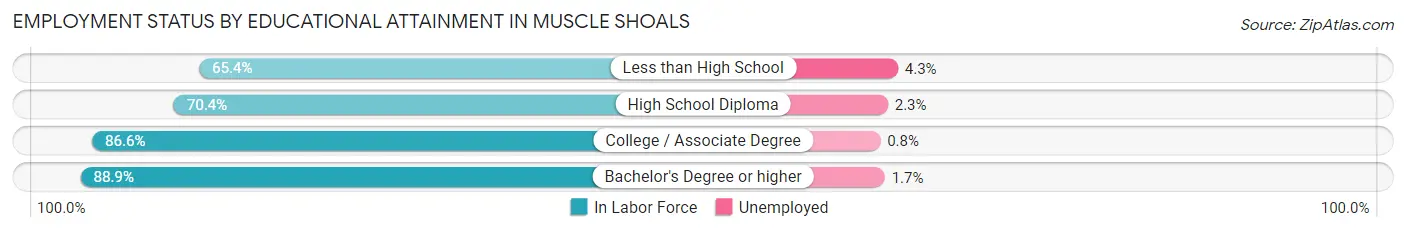
| Educational Attainment | In Labor Force | Unemployed |
| Less than High School | 583 (65.4%) | 38 (4.3%) |
| High School Diploma | 1,745 (70.4%) | 57 (2.3%) |
| College / Associate Degree | 2,782 (86.6%) | 26 (0.8%) |
| Bachelor's Degree or higher | 1,857 (88.9%) | 36 (1.7%) |
| Total | 6,963 (80.3%) | 147 (1.7%) |
Employment Occupations by Sex in Muscle Shoals
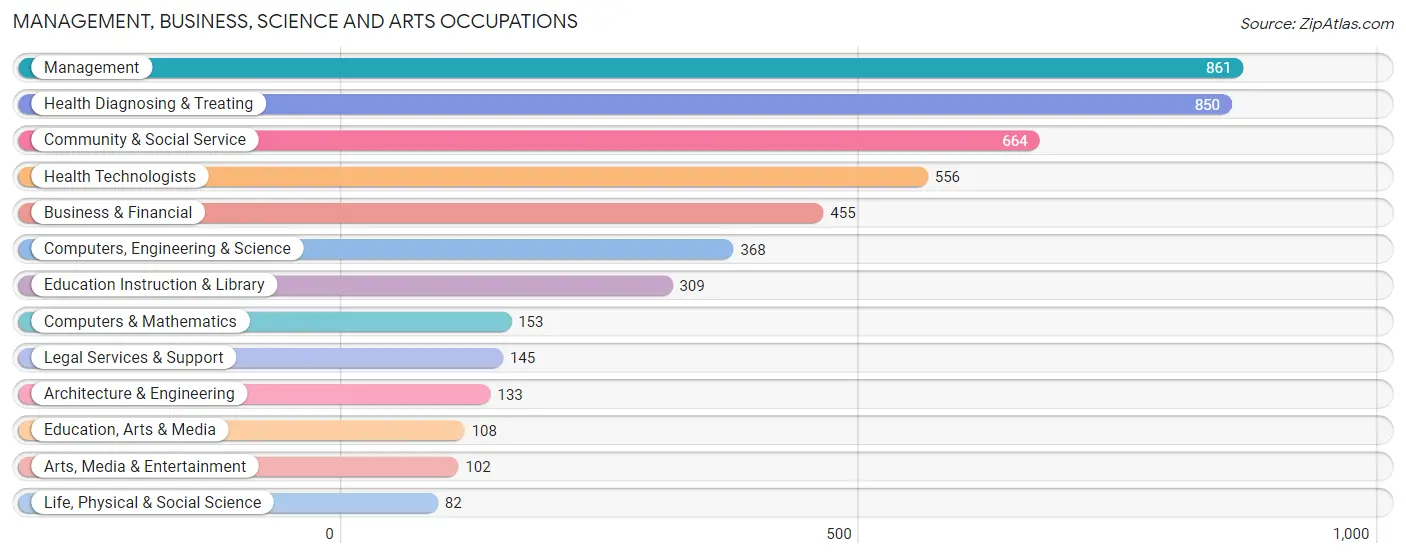
Management, Business, Science and Arts Occupations
The most common Management, Business, Science and Arts occupations in Muscle Shoals are Management (861 | 10.6%), Health Diagnosing & Treating (850 | 10.5%), Community & Social Service (664 | 8.2%), Health Technologists (556 | 6.9%), and Business & Financial (455 | 5.6%).
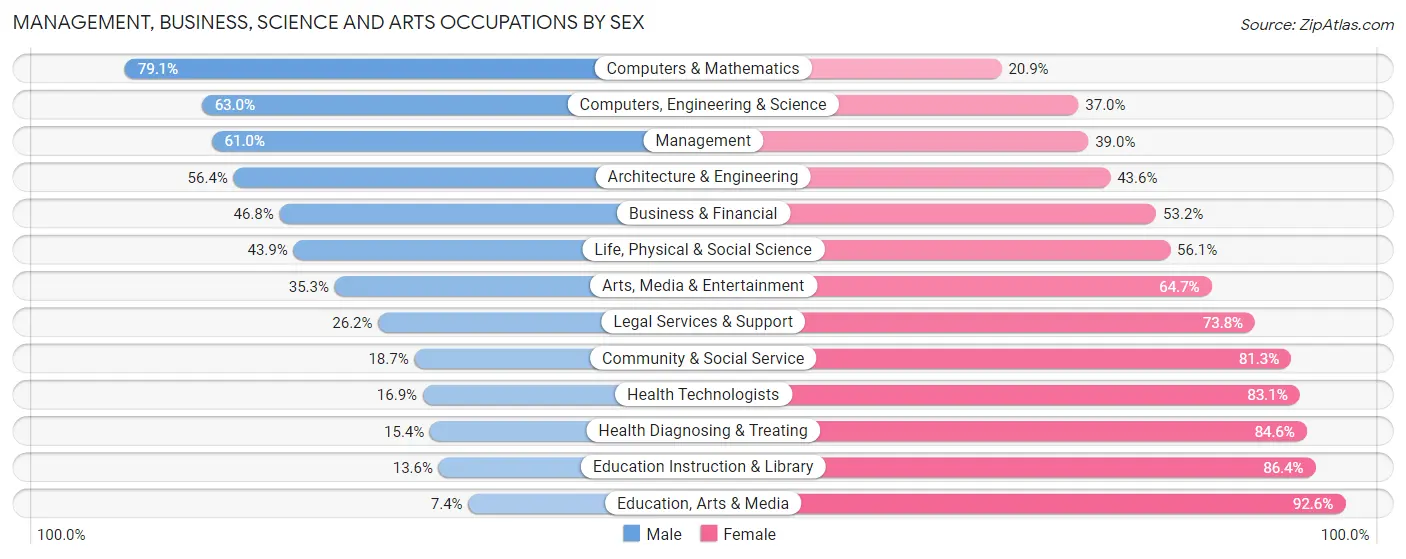
Management, Business, Science and Arts Occupations by Sex
Within the Management, Business, Science and Arts occupations in Muscle Shoals, the most male-oriented occupations are Computers & Mathematics (79.1%), Computers, Engineering & Science (63.0%), and Management (61.0%), while the most female-oriented occupations are Education, Arts & Media (92.6%), Education Instruction & Library (86.4%), and Health Diagnosing & Treating (84.6%).
| Occupation | Male | Female |
| Management | 525 (61.0%) | 336 (39.0%) |
| Business & Financial | 213 (46.8%) | 242 (53.2%) |
| Computers, Engineering & Science | 232 (63.0%) | 136 (37.0%) |
| Computers & Mathematics | 121 (79.1%) | 32 (20.9%) |
| Architecture & Engineering | 75 (56.4%) | 58 (43.6%) |
| Life, Physical & Social Science | 36 (43.9%) | 46 (56.1%) |
| Community & Social Service | 124 (18.7%) | 540 (81.3%) |
| Education, Arts & Media | 8 (7.4%) | 100 (92.6%) |
| Legal Services & Support | 38 (26.2%) | 107 (73.8%) |
| Education Instruction & Library | 42 (13.6%) | 267 (86.4%) |
| Arts, Media & Entertainment | 36 (35.3%) | 66 (64.7%) |
| Health Diagnosing & Treating | 131 (15.4%) | 719 (84.6%) |
| Health Technologists | 94 (16.9%) | 462 (83.1%) |
| Total (Category) | 1,225 (38.3%) | 1,973 (61.7%) |
| Total (Overall) | 4,067 (50.3%) | 4,022 (49.7%) |
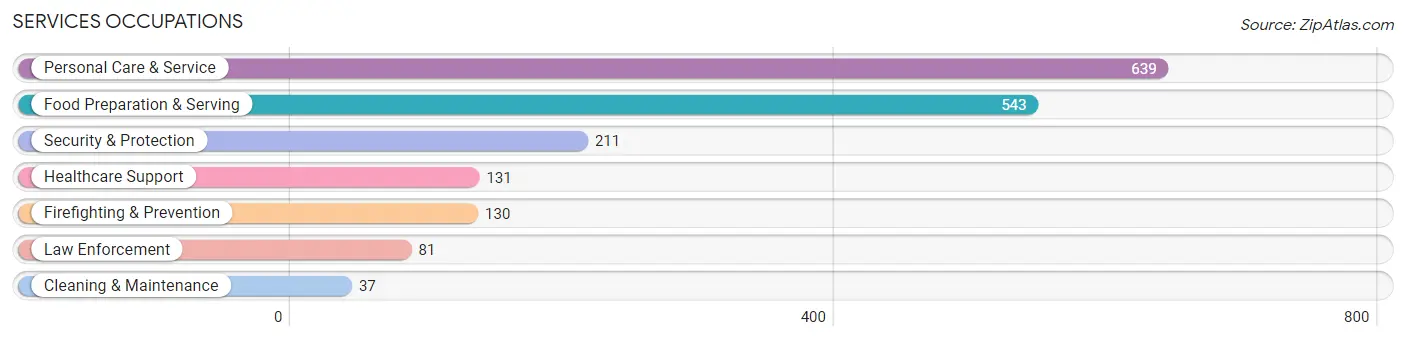
Services Occupations
The most common Services occupations in Muscle Shoals are Personal Care & Service (639 | 7.9%), Food Preparation & Serving (543 | 6.7%), Security & Protection (211 | 2.6%), Healthcare Support (131 | 1.6%), and Firefighting & Prevention (130 | 1.6%).
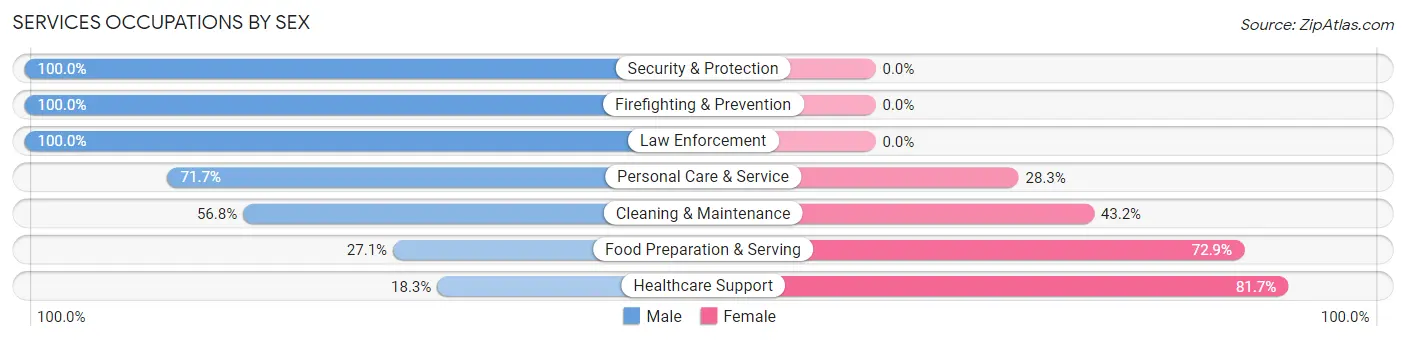
Services Occupations by Sex
Within the Services occupations in Muscle Shoals, the most male-oriented occupations are Security & Protection (100.0%), Firefighting & Prevention (100.0%), and Law Enforcement (100.0%), while the most female-oriented occupations are Healthcare Support (81.7%), Food Preparation & Serving (72.9%), and Cleaning & Maintenance (43.2%).
| Occupation | Male | Female |
| Healthcare Support | 24 (18.3%) | 107 (81.7%) |
| Security & Protection | 211 (100.0%) | 0 (0.0%) |
| Firefighting & Prevention | 130 (100.0%) | 0 (0.0%) |
| Law Enforcement | 81 (100.0%) | 0 (0.0%) |
| Food Preparation & Serving | 147 (27.1%) | 396 (72.9%) |
| Cleaning & Maintenance | 21 (56.8%) | 16 (43.2%) |
| Personal Care & Service | 458 (71.7%) | 181 (28.3%) |
| Total (Category) | 861 (55.2%) | 700 (44.8%) |
| Total (Overall) | 4,067 (50.3%) | 4,022 (49.7%) |
Sales and Office Occupations
The most common Sales and Office occupations in Muscle Shoals are Office & Administration (874 | 10.8%), and Sales & Related (433 | 5.3%).
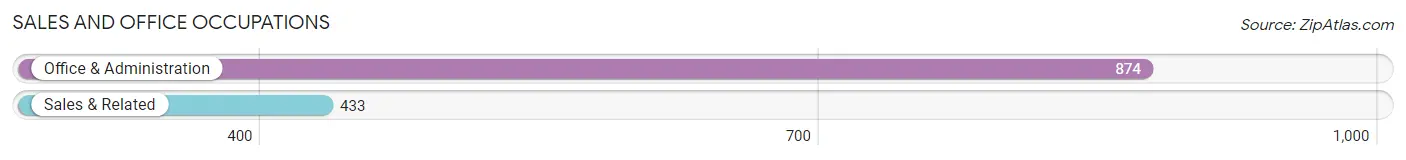
Sales and Office Occupations by Sex
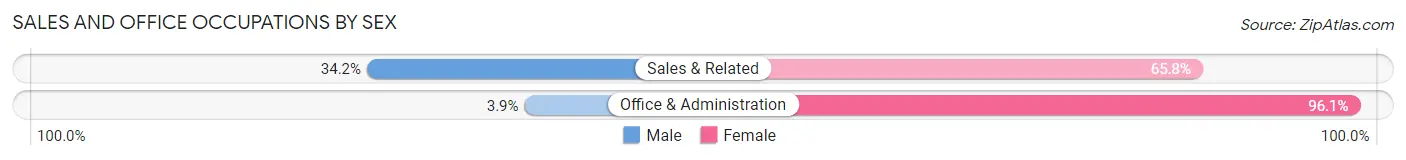
| Occupation | Male | Female |
| Sales & Related | 148 (34.2%) | 285 (65.8%) |
| Office & Administration | 34 (3.9%) | 840 (96.1%) |
| Total (Category) | 182 (13.9%) | 1,125 (86.1%) |
| Total (Overall) | 4,067 (50.3%) | 4,022 (49.7%) |
Natural Resources, Construction and Maintenance Occupations
The most common Natural Resources, Construction and Maintenance occupations in Muscle Shoals are Construction & Extraction (323 | 4.0%), and Installation, Maintenance & Repair (246 | 3.0%).
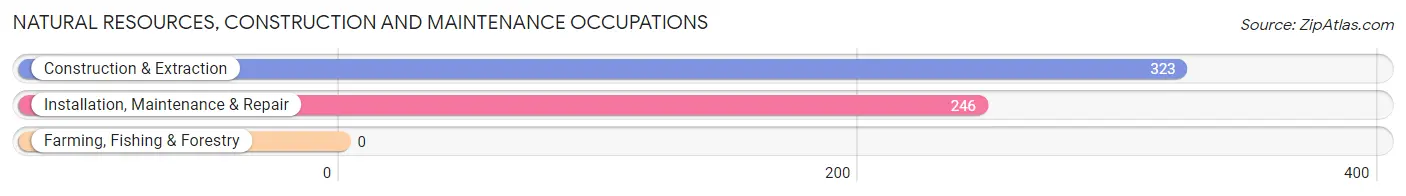
Natural Resources, Construction and Maintenance Occupations by Sex
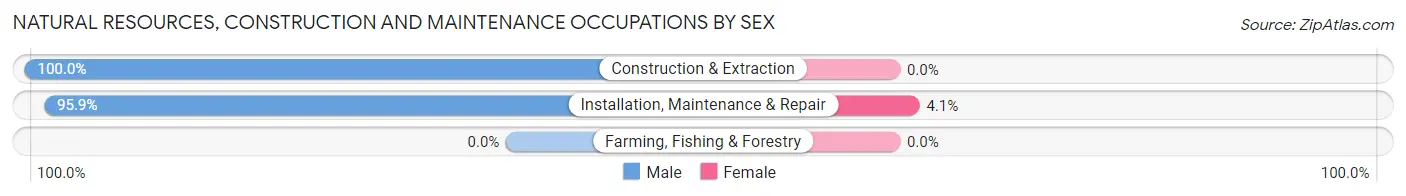
| Occupation | Male | Female |
| Farming, Fishing & Forestry | 0 (0.0%) | 0 (0.0%) |
| Construction & Extraction | 323 (100.0%) | 0 (0.0%) |
| Installation, Maintenance & Repair | 236 (95.9%) | 10 (4.1%) |
| Total (Category) | 559 (98.2%) | 10 (1.8%) |
| Total (Overall) | 4,067 (50.3%) | 4,022 (49.7%) |
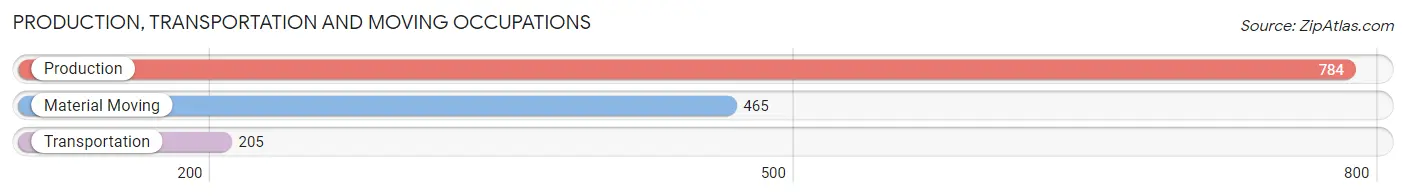
Production, Transportation and Moving Occupations
The most common Production, Transportation and Moving occupations in Muscle Shoals are Production (784 | 9.7%), Material Moving (465 | 5.8%), and Transportation (205 | 2.5%).
Production, Transportation and Moving Occupations by Sex
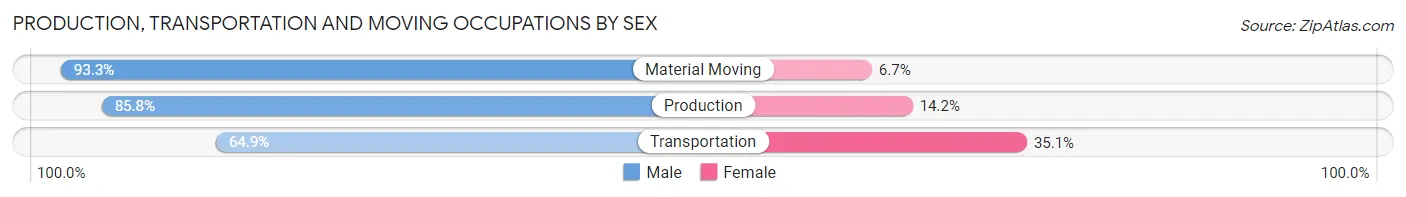
| Occupation | Male | Female |
| Production | 673 (85.8%) | 111 (14.2%) |
| Transportation | 133 (64.9%) | 72 (35.1%) |
| Material Moving | 434 (93.3%) | 31 (6.7%) |
| Total (Category) | 1,240 (85.3%) | 214 (14.7%) |
| Total (Overall) | 4,067 (50.3%) | 4,022 (49.7%) |
Employment Industries by Sex in Muscle Shoals
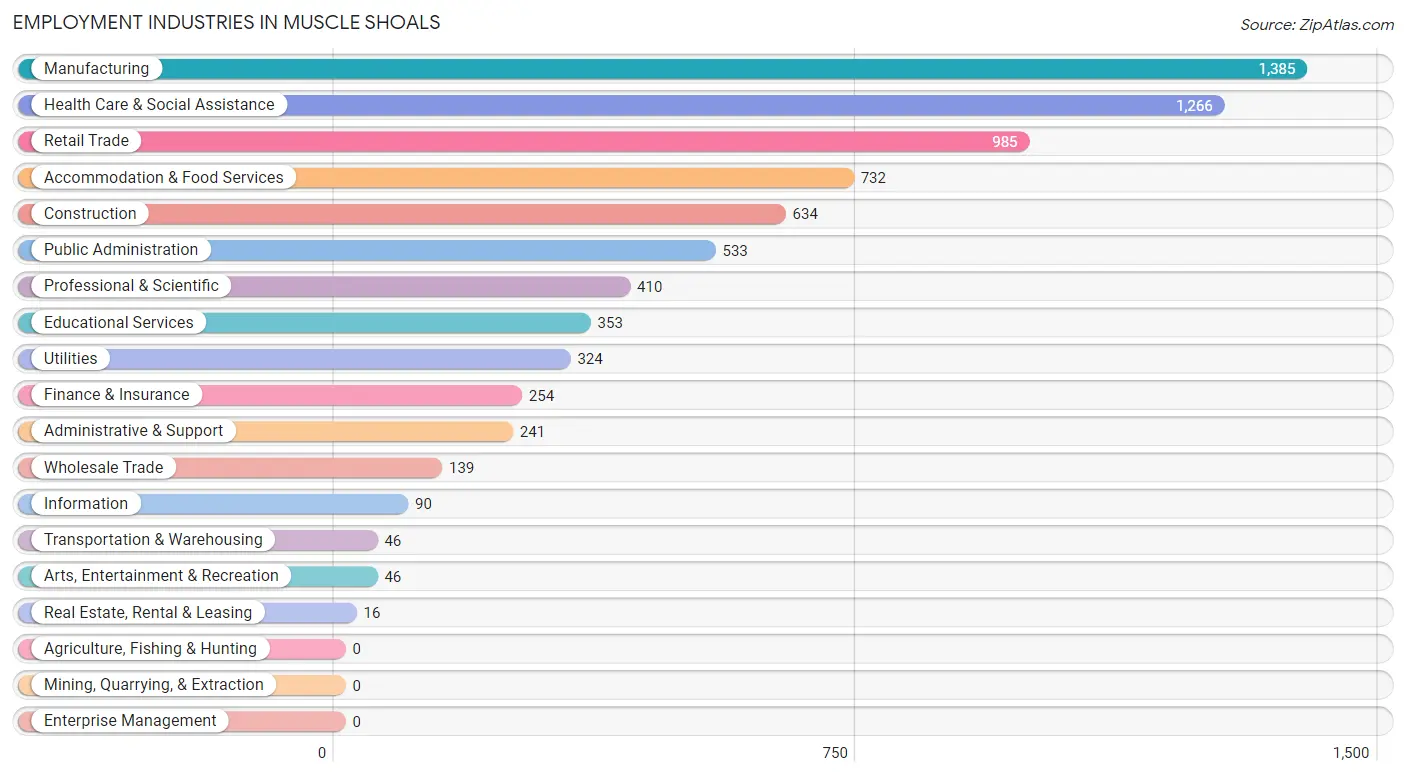
Employment Industries in Muscle Shoals
The major employment industries in Muscle Shoals include Manufacturing (1,385 | 17.1%), Health Care & Social Assistance (1,266 | 15.7%), Retail Trade (985 | 12.2%), Accommodation & Food Services (732 | 9.0%), and Construction (634 | 7.8%).
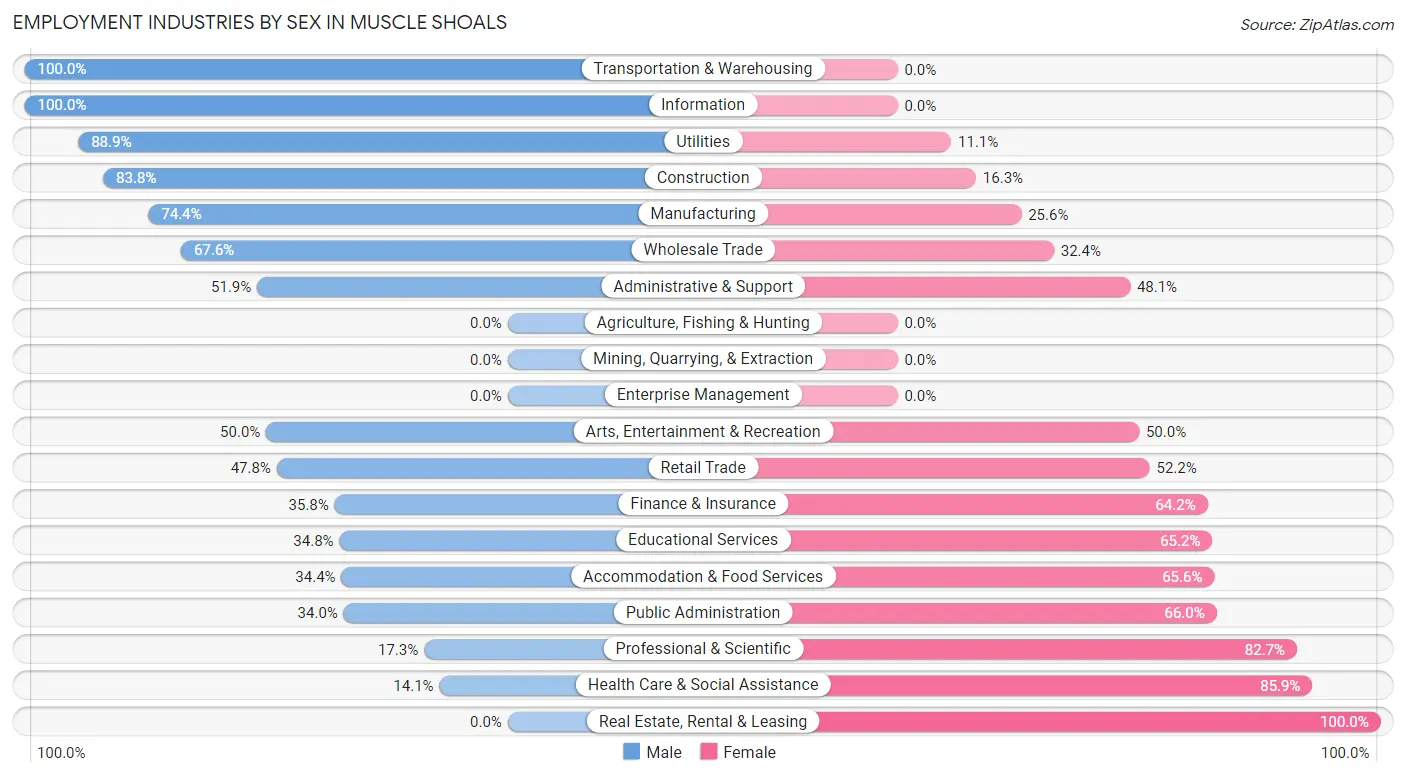
Employment Industries by Sex in Muscle Shoals
The Muscle Shoals industries that see more men than women are Transportation & Warehousing (100.0%), Information (100.0%), and Utilities (88.9%), whereas the industries that tend to have a higher number of women are Real Estate, Rental & Leasing (100.0%), Health Care & Social Assistance (85.9%), and Professional & Scientific (82.7%).
| Industry | Male | Female |
| Agriculture, Fishing & Hunting | 0 (0.0%) | 0 (0.0%) |
| Mining, Quarrying, & Extraction | 0 (0.0%) | 0 (0.0%) |
| Construction | 531 (83.8%) | 103 (16.3%) |
| Manufacturing | 1,030 (74.4%) | 355 (25.6%) |
| Wholesale Trade | 94 (67.6%) | 45 (32.4%) |
| Retail Trade | 471 (47.8%) | 514 (52.2%) |
| Transportation & Warehousing | 46 (100.0%) | 0 (0.0%) |
| Utilities | 288 (88.9%) | 36 (11.1%) |
| Information | 90 (100.0%) | 0 (0.0%) |
| Finance & Insurance | 91 (35.8%) | 163 (64.2%) |
| Real Estate, Rental & Leasing | 0 (0.0%) | 16 (100.0%) |
| Professional & Scientific | 71 (17.3%) | 339 (82.7%) |
| Enterprise Management | 0 (0.0%) | 0 (0.0%) |
| Administrative & Support | 125 (51.9%) | 116 (48.1%) |
| Educational Services | 123 (34.8%) | 230 (65.2%) |
| Health Care & Social Assistance | 179 (14.1%) | 1,087 (85.9%) |
| Arts, Entertainment & Recreation | 23 (50.0%) | 23 (50.0%) |
| Accommodation & Food Services | 252 (34.4%) | 480 (65.6%) |
| Public Administration | 181 (34.0%) | 352 (66.0%) |
| Total | 4,067 (50.3%) | 4,022 (49.7%) |
Education in Muscle Shoals
School Enrollment in Muscle Shoals
The most common levels of schooling among the 3,483 students in Muscle Shoals are middle school (866 | 24.9%), high school (802 | 23.0%), and elementary school (606 | 17.4%).
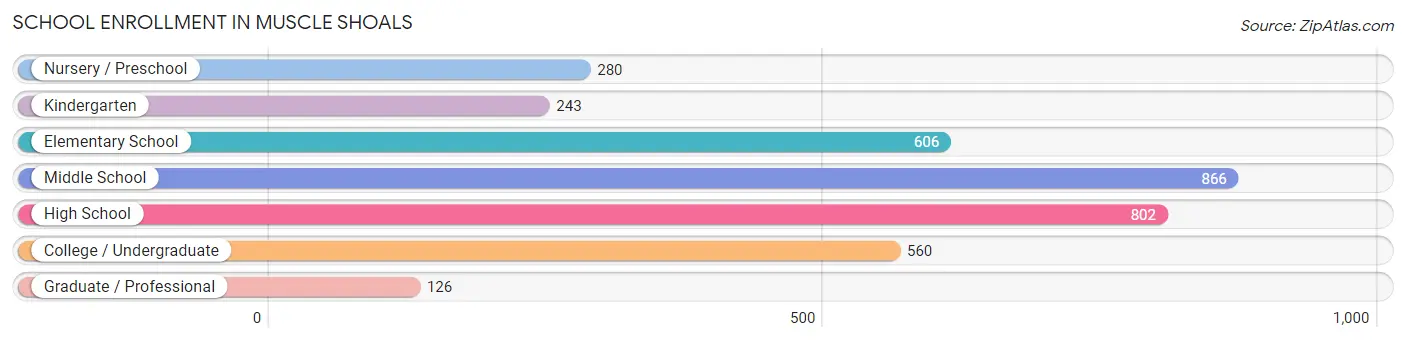
| School Level | # Students | % Students |
| Nursery / Preschool | 280 | 8.0% |
| Kindergarten | 243 | 7.0% |
| Elementary School | 606 | 17.4% |
| Middle School | 866 | 24.9% |
| High School | 802 | 23.0% |
| College / Undergraduate | 560 | 16.1% |
| Graduate / Professional | 126 | 3.6% |
| Total | 3,483 | 100.0% |
School Enrollment by Age by Funding Source in Muscle Shoals
Out of a total of 3,483 students who are enrolled in schools in Muscle Shoals, 488 (14.0%) attend a private institution, while the remaining 2,995 (86.0%) are enrolled in public schools. The age group of 3 to 4 year olds has the highest likelihood of being enrolled in private schools, with 78 (43.1% in the age bracket) enrolled. Conversely, the age group of 20 to 24 year olds has the lowest likelihood of being enrolled in a private school, with 206 (100.0% in the age bracket) attending a public institution.
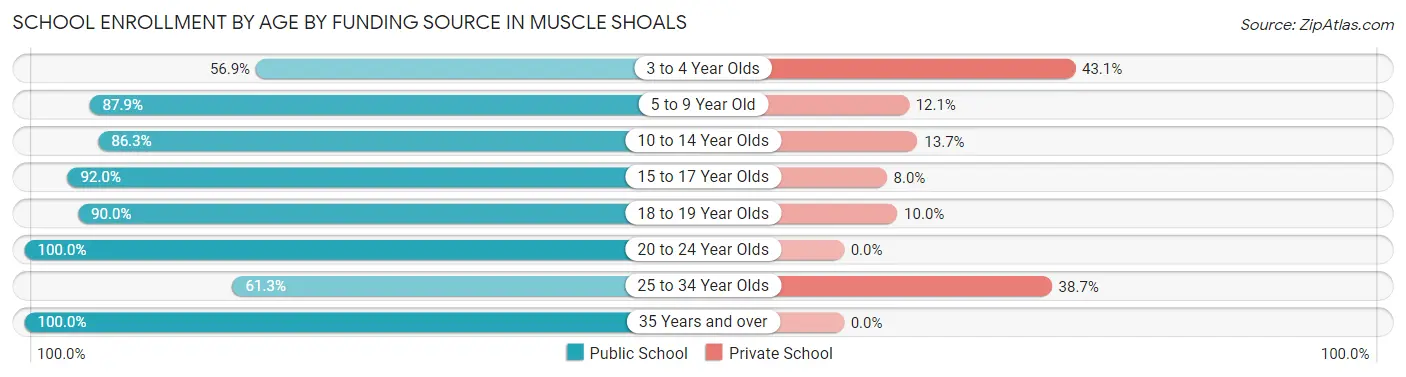
| Age Bracket | Public School | Private School |
| 3 to 4 Year Olds | 103 (56.9%) | 78 (43.1%) |
| 5 to 9 Year Old | 740 (87.9%) | 102 (12.1%) |
| 10 to 14 Year Olds | 905 (86.3%) | 144 (13.7%) |
| 15 to 17 Year Olds | 587 (92.0%) | 51 (8.0%) |
| 18 to 19 Year Olds | 226 (90.0%) | 25 (10.0%) |
| 20 to 24 Year Olds | 206 (100.0%) | 0 (0.0%) |
| 25 to 34 Year Olds | 136 (61.3%) | 86 (38.7%) |
| 35 Years and over | 94 (100.0%) | 0 (0.0%) |
| Total | 2,995 (86.0%) | 488 (14.0%) |
Educational Attainment by Field of Study in Muscle Shoals
Business (630 | 23.4%), science & technology (512 | 19.0%), education (370 | 13.7%), arts & humanities (248 | 9.2%), and psychology (206 | 7.6%) are the most common fields of study among 2,696 individuals in Muscle Shoals who have obtained a bachelor's degree or higher.
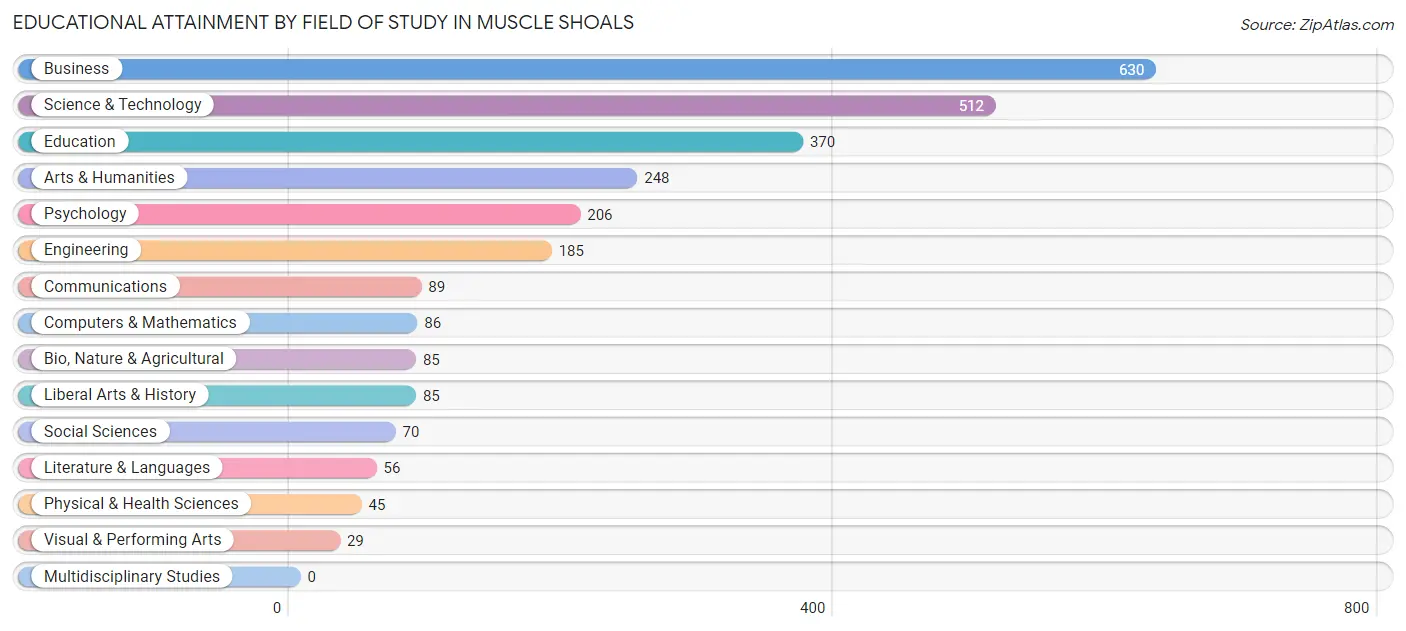
| Field of Study | # Graduates | % Graduates |
| Computers & Mathematics | 86 | 3.2% |
| Bio, Nature & Agricultural | 85 | 3.2% |
| Physical & Health Sciences | 45 | 1.7% |
| Psychology | 206 | 7.6% |
| Social Sciences | 70 | 2.6% |
| Engineering | 185 | 6.9% |
| Multidisciplinary Studies | 0 | 0.0% |
| Science & Technology | 512 | 19.0% |
| Business | 630 | 23.4% |
| Education | 370 | 13.7% |
| Literature & Languages | 56 | 2.1% |
| Liberal Arts & History | 85 | 3.2% |
| Visual & Performing Arts | 29 | 1.1% |
| Communications | 89 | 3.3% |
| Arts & Humanities | 248 | 9.2% |
| Total | 2,696 | 100.0% |
Transportation & Commute in Muscle Shoals
Vehicle Availability by Sex in Muscle Shoals
The most prevalent vehicle ownership categories in Muscle Shoals are males with 2 vehicles (1,391, accounting for 34.4%) and females with 2 vehicles (1,451, making up 35.0%).
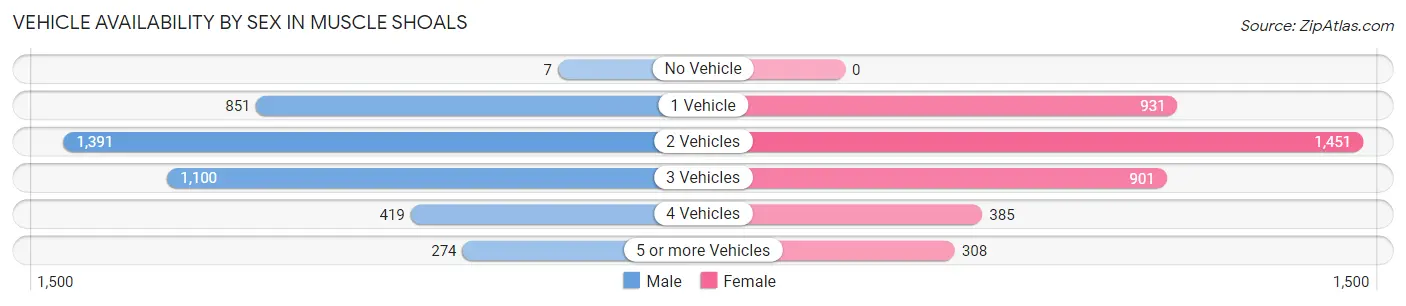
| Vehicles Available | Male | Female |
| No Vehicle | 7 (0.2%) | 0 (0.0%) |
| 1 Vehicle | 851 (21.0%) | 931 (23.4%) |
| 2 Vehicles | 1,391 (34.4%) | 1,451 (36.5%) |
| 3 Vehicles | 1,100 (27.2%) | 901 (22.7%) |
| 4 Vehicles | 419 (10.4%) | 385 (9.7%) |
| 5 or more Vehicles | 274 (6.8%) | 308 (7.7%) |
| Total | 4,042 (100.0%) | 3,976 (100.0%) |
Commute Time in Muscle Shoals
The most frequently occuring commute durations in Muscle Shoals are 15 to 19 minutes (2,057 commuters, 28.3%), 10 to 14 minutes (1,642 commuters, 22.6%), and 5 to 9 minutes (871 commuters, 12.0%).
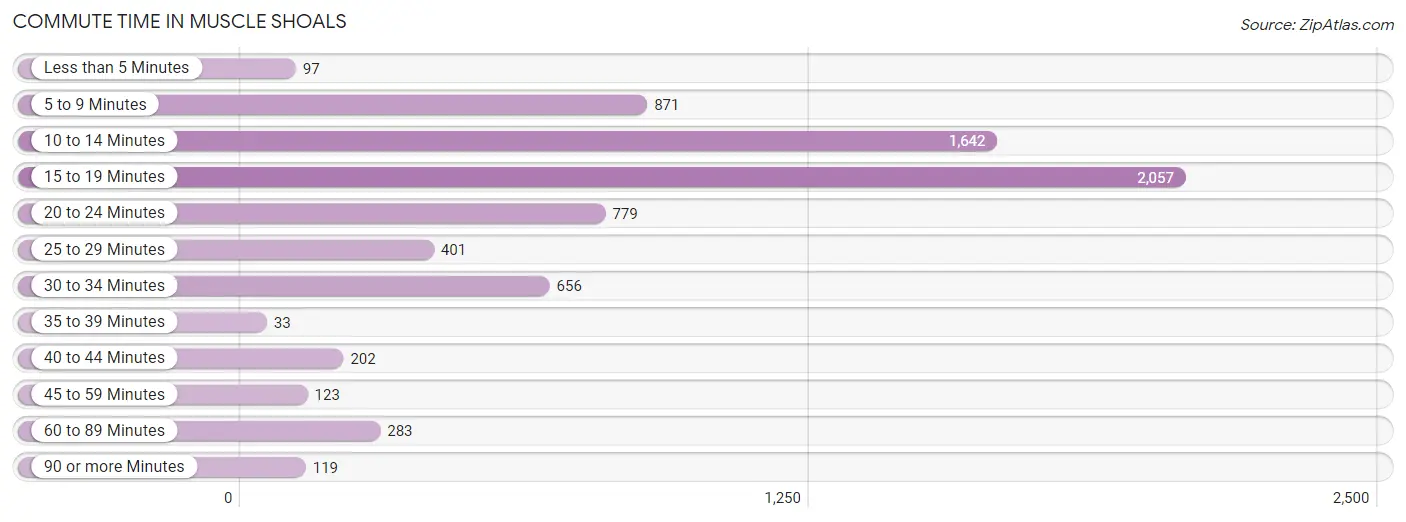
| Commute Time | # Commuters | % Commuters |
| Less than 5 Minutes | 97 | 1.3% |
| 5 to 9 Minutes | 871 | 12.0% |
| 10 to 14 Minutes | 1,642 | 22.6% |
| 15 to 19 Minutes | 2,057 | 28.3% |
| 20 to 24 Minutes | 779 | 10.7% |
| 25 to 29 Minutes | 401 | 5.5% |
| 30 to 34 Minutes | 656 | 9.0% |
| 35 to 39 Minutes | 33 | 0.4% |
| 40 to 44 Minutes | 202 | 2.8% |
| 45 to 59 Minutes | 123 | 1.7% |
| 60 to 89 Minutes | 283 | 3.9% |
| 90 or more Minutes | 119 | 1.6% |
Commute Time by Sex in Muscle Shoals
The most common commute times in Muscle Shoals are 15 to 19 minutes (799 commuters, 22.7%) for males and 15 to 19 minutes (1,258 commuters, 33.6%) for females.
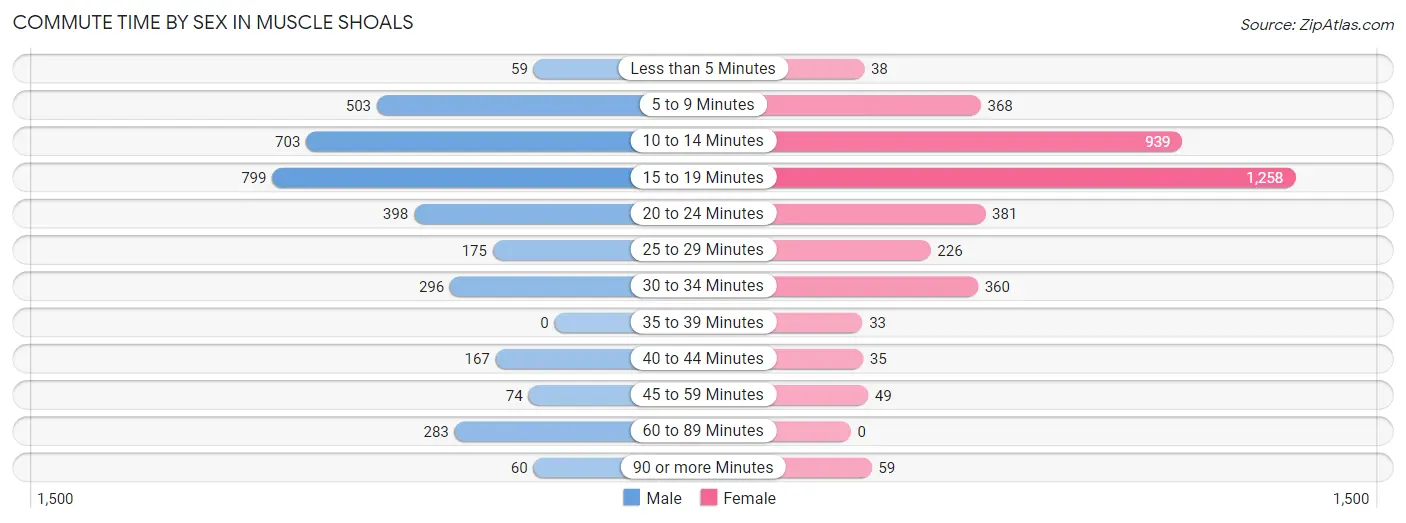
| Commute Time | Male | Female |
| Less than 5 Minutes | 59 (1.7%) | 38 (1.0%) |
| 5 to 9 Minutes | 503 (14.3%) | 368 (9.8%) |
| 10 to 14 Minutes | 703 (20.0%) | 939 (25.1%) |
| 15 to 19 Minutes | 799 (22.7%) | 1,258 (33.6%) |
| 20 to 24 Minutes | 398 (11.3%) | 381 (10.2%) |
| 25 to 29 Minutes | 175 (5.0%) | 226 (6.0%) |
| 30 to 34 Minutes | 296 (8.4%) | 360 (9.6%) |
| 35 to 39 Minutes | 0 (0.0%) | 33 (0.9%) |
| 40 to 44 Minutes | 167 (4.8%) | 35 (0.9%) |
| 45 to 59 Minutes | 74 (2.1%) | 49 (1.3%) |
| 60 to 89 Minutes | 283 (8.1%) | 0 (0.0%) |
| 90 or more Minutes | 60 (1.7%) | 59 (1.6%) |
Time of Departure to Work by Sex in Muscle Shoals
The most frequent times of departure to work in Muscle Shoals are 7:00 AM to 7:29 AM (594, 16.9%) for males and 7:30 AM to 7:59 AM (1,009, 26.9%) for females.
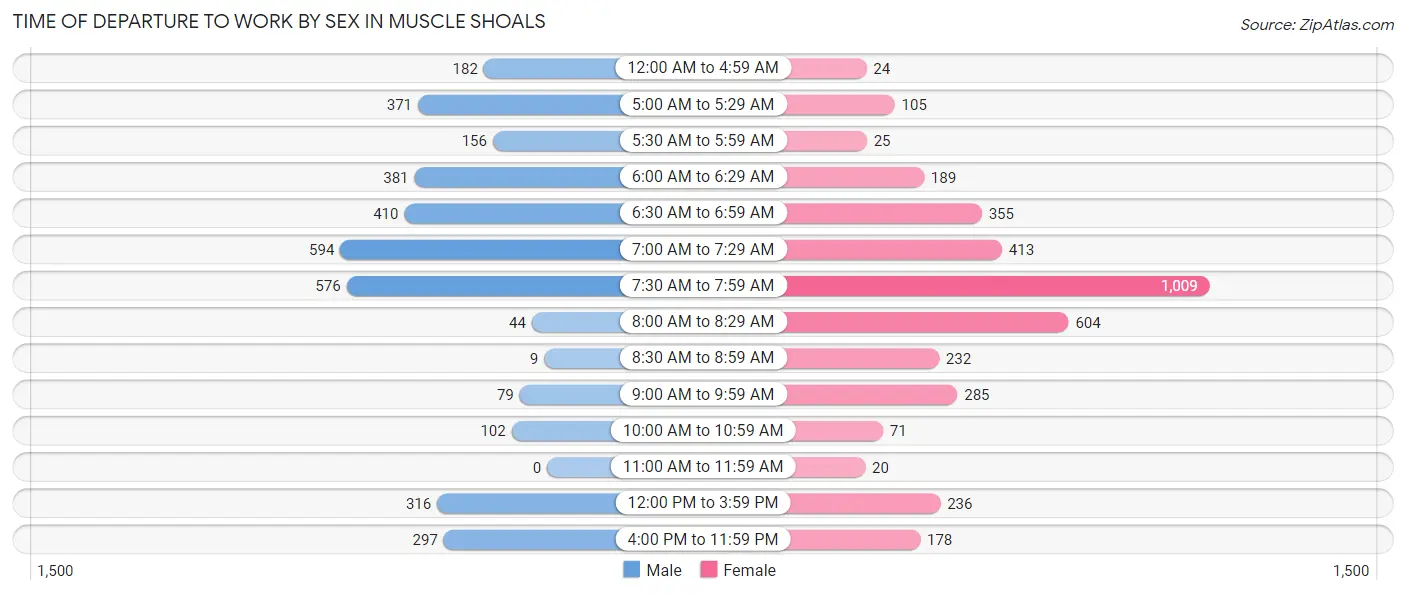
| Time of Departure | Male | Female |
| 12:00 AM to 4:59 AM | 182 (5.2%) | 24 (0.6%) |
| 5:00 AM to 5:29 AM | 371 (10.5%) | 105 (2.8%) |
| 5:30 AM to 5:59 AM | 156 (4.4%) | 25 (0.7%) |
| 6:00 AM to 6:29 AM | 381 (10.8%) | 189 (5.1%) |
| 6:30 AM to 6:59 AM | 410 (11.7%) | 355 (9.5%) |
| 7:00 AM to 7:29 AM | 594 (16.9%) | 413 (11.0%) |
| 7:30 AM to 7:59 AM | 576 (16.4%) | 1,009 (26.9%) |
| 8:00 AM to 8:29 AM | 44 (1.3%) | 604 (16.1%) |
| 8:30 AM to 8:59 AM | 9 (0.3%) | 232 (6.2%) |
| 9:00 AM to 9:59 AM | 79 (2.2%) | 285 (7.6%) |
| 10:00 AM to 10:59 AM | 102 (2.9%) | 71 (1.9%) |
| 11:00 AM to 11:59 AM | 0 (0.0%) | 20 (0.5%) |
| 12:00 PM to 3:59 PM | 316 (9.0%) | 236 (6.3%) |
| 4:00 PM to 11:59 PM | 297 (8.4%) | 178 (4.8%) |
| Total | 3,517 (100.0%) | 3,746 (100.0%) |
Housing Occupancy in Muscle Shoals
Occupancy by Ownership in Muscle Shoals
Of the total 6,534 dwellings in Muscle Shoals, owner-occupied units account for 4,786 (73.3%), while renter-occupied units make up 1,748 (26.8%).
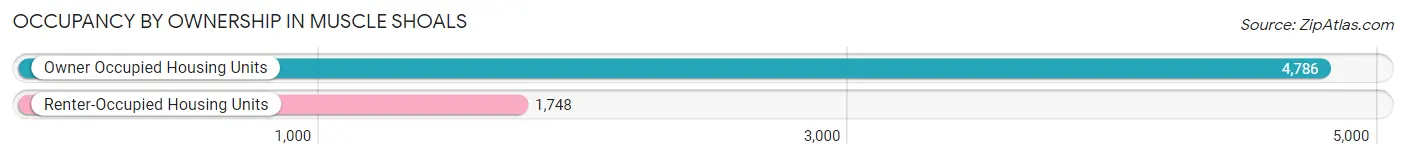
| Occupancy | # Housing Units | % Housing Units |
| Owner Occupied Housing Units | 4,786 | 73.3% |
| Renter-Occupied Housing Units | 1,748 | 26.8% |
| Total Occupied Housing Units | 6,534 | 100.0% |
Occupancy by Household Size in Muscle Shoals
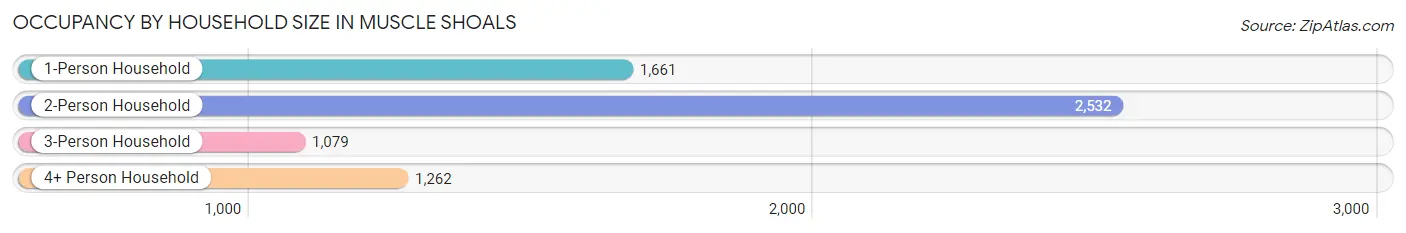
| Household Size | # Housing Units | % Housing Units |
| 1-Person Household | 1,661 | 25.4% |
| 2-Person Household | 2,532 | 38.8% |
| 3-Person Household | 1,079 | 16.5% |
| 4+ Person Household | 1,262 | 19.3% |
| Total Housing Units | 6,534 | 100.0% |
Occupancy by Ownership by Household Size in Muscle Shoals
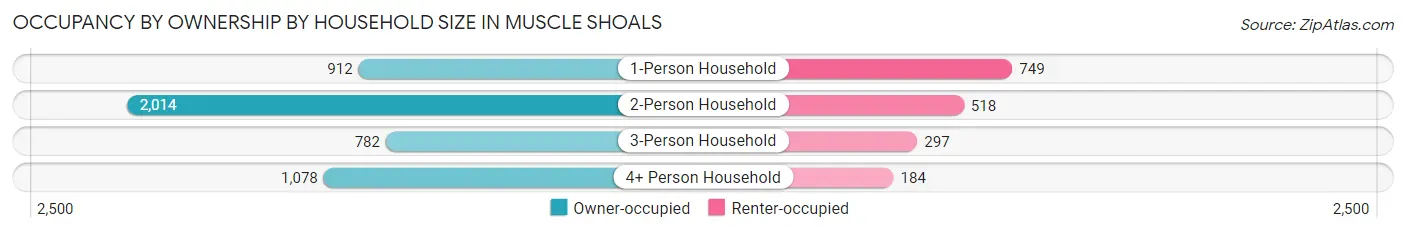
| Household Size | Owner-occupied | Renter-occupied |
| 1-Person Household | 912 (54.9%) | 749 (45.1%) |
| 2-Person Household | 2,014 (79.5%) | 518 (20.5%) |
| 3-Person Household | 782 (72.5%) | 297 (27.5%) |
| 4+ Person Household | 1,078 (85.4%) | 184 (14.6%) |
| Total Housing Units | 4,786 (73.3%) | 1,748 (26.8%) |
Occupancy by Educational Attainment in Muscle Shoals
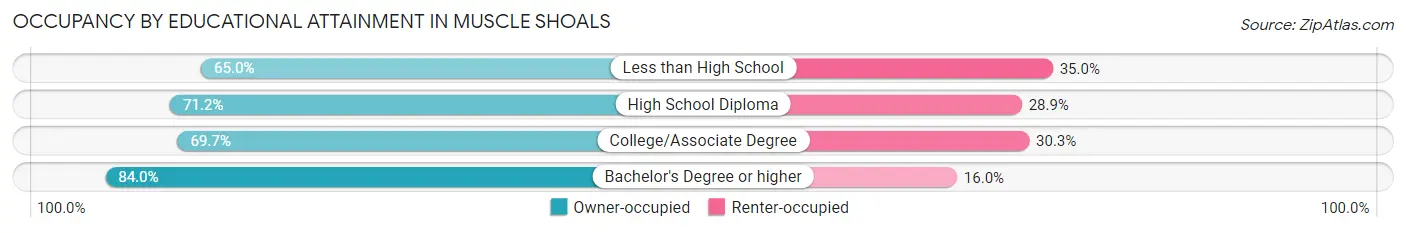
| Household Size | Owner-occupied | Renter-occupied |
| Less than High School | 349 (65.0%) | 188 (35.0%) |
| High School Diploma | 1,554 (71.2%) | 630 (28.8%) |
| College/Associate Degree | 1,556 (69.7%) | 677 (30.3%) |
| Bachelor's Degree or higher | 1,327 (84.0%) | 253 (16.0%) |
Occupancy by Age of Householder in Muscle Shoals
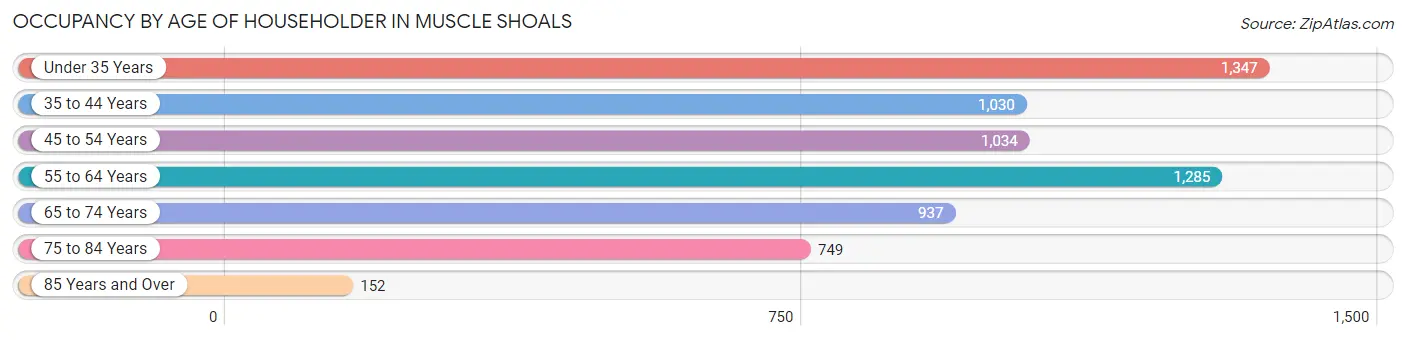
| Age Bracket | # Households | % Households |
| Under 35 Years | 1,347 | 20.6% |
| 35 to 44 Years | 1,030 | 15.8% |
| 45 to 54 Years | 1,034 | 15.8% |
| 55 to 64 Years | 1,285 | 19.7% |
| 65 to 74 Years | 937 | 14.3% |
| 75 to 84 Years | 749 | 11.5% |
| 85 Years and Over | 152 | 2.3% |
| Total | 6,534 | 100.0% |
Housing Finances in Muscle Shoals
Median Income by Occupancy in Muscle Shoals
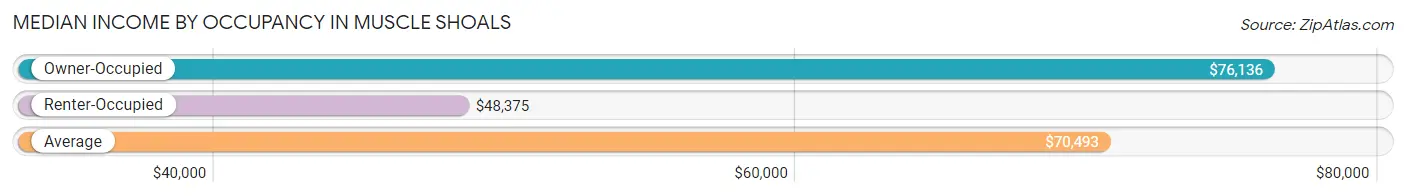
| Occupancy Type | # Households | Median Income |
| Owner-Occupied | 4,786 (73.3%) | $76,136 |
| Renter-Occupied | 1,748 (26.8%) | $48,375 |
| Average | 6,534 (100.0%) | $70,493 |
Occupancy by Householder Income Bracket in Muscle Shoals
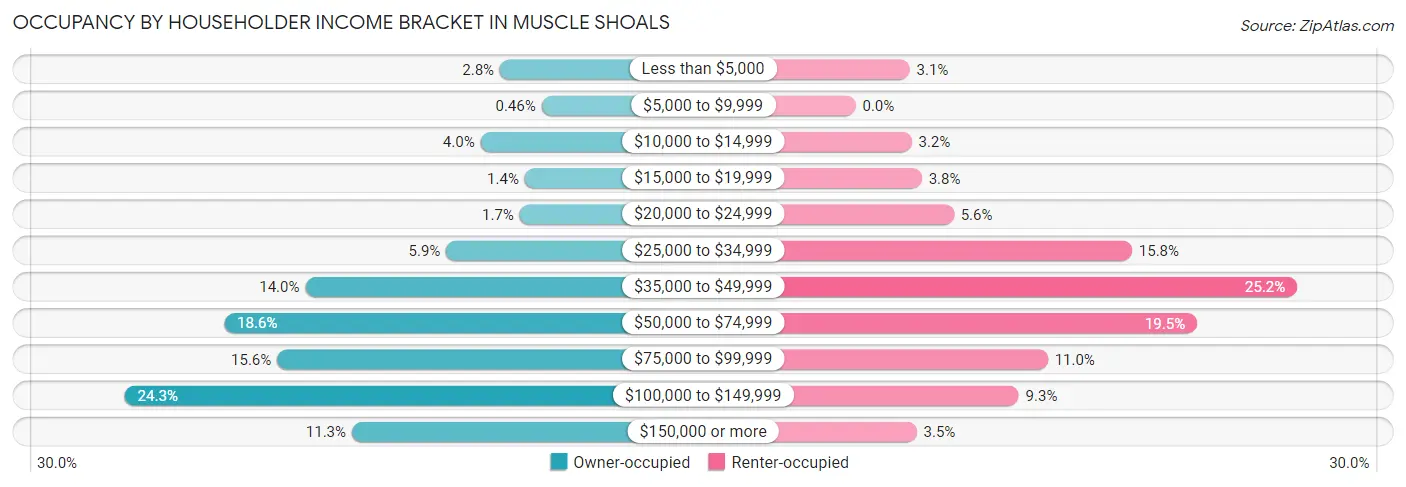
| Income Bracket | Owner-occupied | Renter-occupied |
| Less than $5,000 | 136 (2.8%) | 54 (3.1%) |
| $5,000 to $9,999 | 22 (0.5%) | 0 (0.0%) |
| $10,000 to $14,999 | 189 (4.0%) | 56 (3.2%) |
| $15,000 to $19,999 | 68 (1.4%) | 66 (3.8%) |
| $20,000 to $24,999 | 82 (1.7%) | 98 (5.6%) |
| $25,000 to $34,999 | 283 (5.9%) | 276 (15.8%) |
| $35,000 to $49,999 | 668 (14.0%) | 441 (25.2%) |
| $50,000 to $74,999 | 890 (18.6%) | 341 (19.5%) |
| $75,000 to $99,999 | 745 (15.6%) | 192 (11.0%) |
| $100,000 to $149,999 | 1,162 (24.3%) | 163 (9.3%) |
| $150,000 or more | 541 (11.3%) | 61 (3.5%) |
| Total | 4,786 (100.0%) | 1,748 (100.0%) |
Monthly Housing Cost Tiers in Muscle Shoals
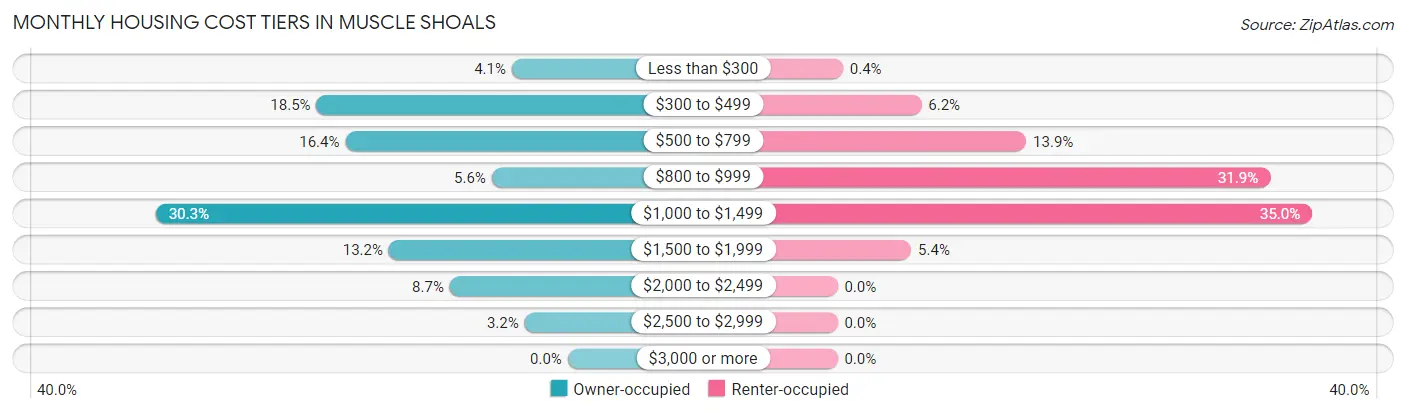
| Monthly Cost | Owner-occupied | Renter-occupied |
| Less than $300 | 197 (4.1%) | 7 (0.4%) |
| $300 to $499 | 886 (18.5%) | 108 (6.2%) |
| $500 to $799 | 784 (16.4%) | 243 (13.9%) |
| $800 to $999 | 268 (5.6%) | 557 (31.9%) |
| $1,000 to $1,499 | 1,452 (30.3%) | 611 (34.9%) |
| $1,500 to $1,999 | 631 (13.2%) | 95 (5.4%) |
| $2,000 to $2,499 | 416 (8.7%) | 0 (0.0%) |
| $2,500 to $2,999 | 152 (3.2%) | 0 (0.0%) |
| $3,000 or more | 0 (0.0%) | 0 (0.0%) |
| Total | 4,786 (100.0%) | 1,748 (100.0%) |
Physical Housing Characteristics in Muscle Shoals
Housing Structures in Muscle Shoals
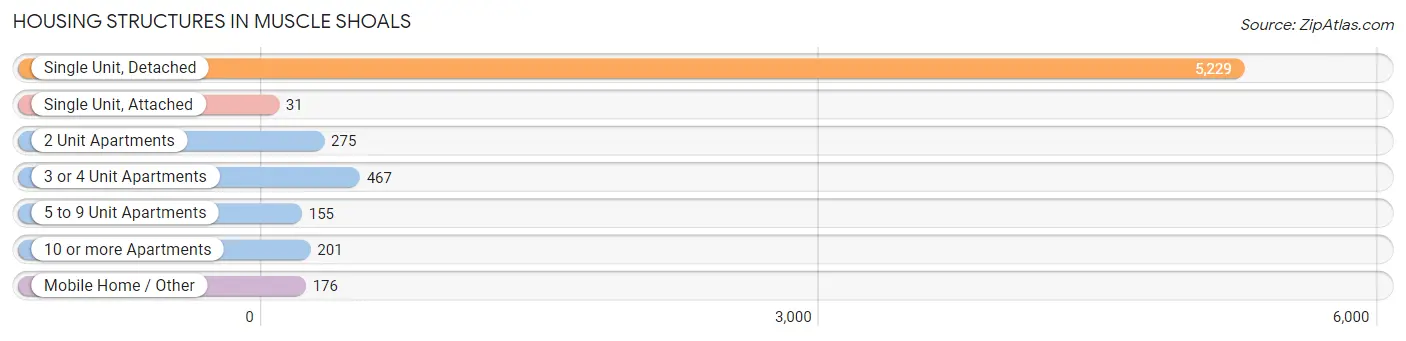
| Structure Type | # Housing Units | % Housing Units |
| Single Unit, Detached | 5,229 | 80.0% |
| Single Unit, Attached | 31 | 0.5% |
| 2 Unit Apartments | 275 | 4.2% |
| 3 or 4 Unit Apartments | 467 | 7.1% |
| 5 to 9 Unit Apartments | 155 | 2.4% |
| 10 or more Apartments | 201 | 3.1% |
| Mobile Home / Other | 176 | 2.7% |
| Total | 6,534 | 100.0% |
Housing Structures by Occupancy in Muscle Shoals
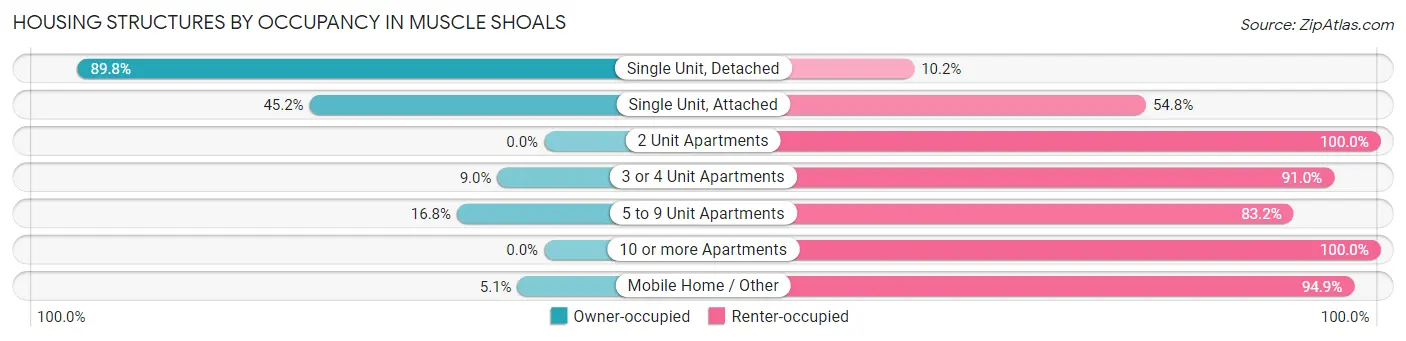
| Structure Type | Owner-occupied | Renter-occupied |
| Single Unit, Detached | 4,695 (89.8%) | 534 (10.2%) |
| Single Unit, Attached | 14 (45.2%) | 17 (54.8%) |
| 2 Unit Apartments | 0 (0.0%) | 275 (100.0%) |
| 3 or 4 Unit Apartments | 42 (9.0%) | 425 (91.0%) |
| 5 to 9 Unit Apartments | 26 (16.8%) | 129 (83.2%) |
| 10 or more Apartments | 0 (0.0%) | 201 (100.0%) |
| Mobile Home / Other | 9 (5.1%) | 167 (94.9%) |
| Total | 4,786 (73.3%) | 1,748 (26.8%) |
Housing Structures by Number of Rooms in Muscle Shoals
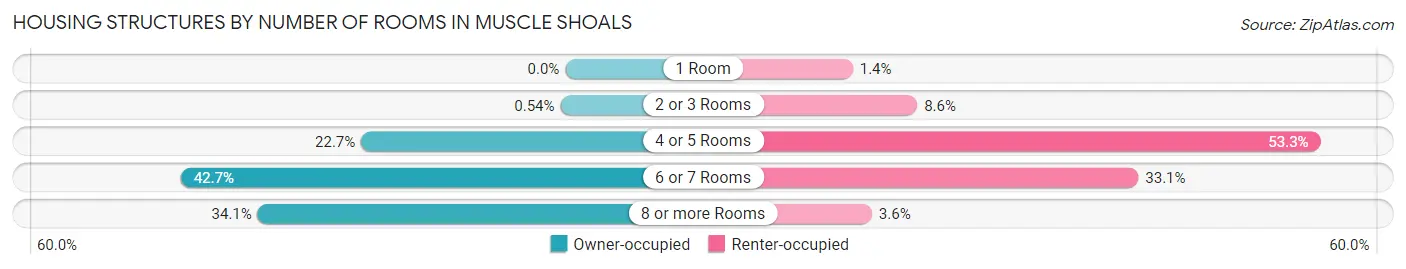
| Number of Rooms | Owner-occupied | Renter-occupied |
| 1 Room | 0 (0.0%) | 25 (1.4%) |
| 2 or 3 Rooms | 26 (0.5%) | 150 (8.6%) |
| 4 or 5 Rooms | 1,084 (22.7%) | 932 (53.3%) |
| 6 or 7 Rooms | 2,042 (42.7%) | 579 (33.1%) |
| 8 or more Rooms | 1,634 (34.1%) | 62 (3.5%) |
| Total | 4,786 (100.0%) | 1,748 (100.0%) |
Housing Structure by Heating Type in Muscle Shoals
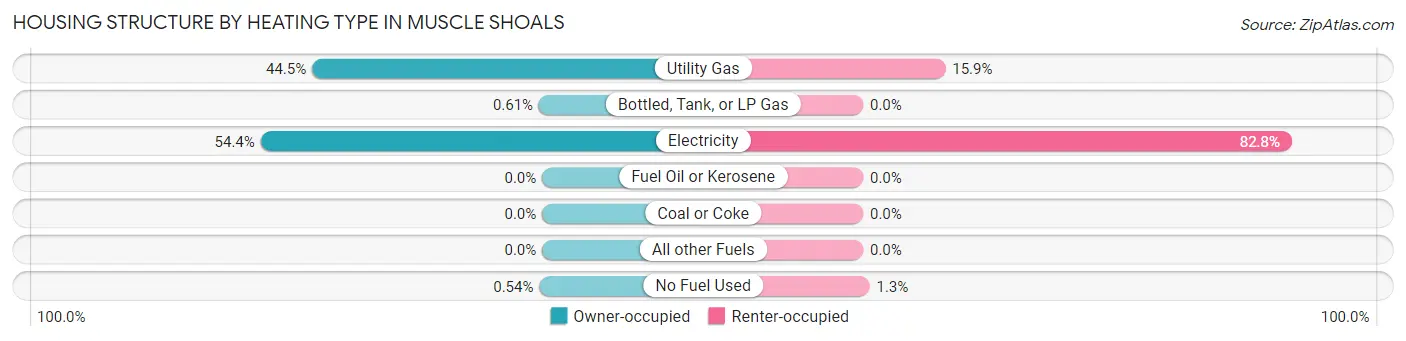
| Heating Type | Owner-occupied | Renter-occupied |
| Utility Gas | 2,128 (44.5%) | 278 (15.9%) |
| Bottled, Tank, or LP Gas | 29 (0.6%) | 0 (0.0%) |
| Electricity | 2,603 (54.4%) | 1,448 (82.8%) |
| Fuel Oil or Kerosene | 0 (0.0%) | 0 (0.0%) |
| Coal or Coke | 0 (0.0%) | 0 (0.0%) |
| All other Fuels | 0 (0.0%) | 0 (0.0%) |
| No Fuel Used | 26 (0.5%) | 22 (1.3%) |
| Total | 4,786 (100.0%) | 1,748 (100.0%) |
Household Vehicle Usage in Muscle Shoals
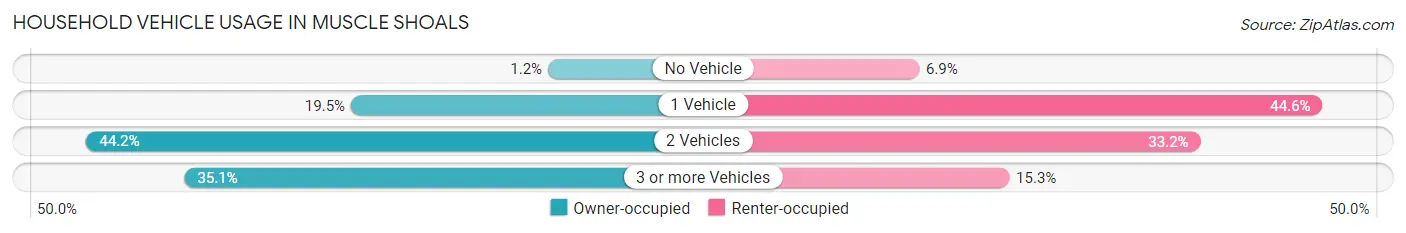
| Vehicles per Household | Owner-occupied | Renter-occupied |
| No Vehicle | 55 (1.1%) | 121 (6.9%) |
| 1 Vehicle | 935 (19.5%) | 779 (44.6%) |
| 2 Vehicles | 2,117 (44.2%) | 580 (33.2%) |
| 3 or more Vehicles | 1,679 (35.1%) | 268 (15.3%) |
| Total | 4,786 (100.0%) | 1,748 (100.0%) |
Real Estate & Mortgages in Muscle Shoals
Real Estate and Mortgage Overview in Muscle Shoals
| Characteristic | Without Mortgage | With Mortgage |
| Housing Units | 1,683 | 3,103 |
| Median Property Value | $176,400 | $187,000 |
| Median Household Income | $52,595 | $394 |
| Monthly Housing Costs | $441 | $0 |
| Real Estate Taxes | $813 | $398 |
Property Value by Mortgage Status in Muscle Shoals
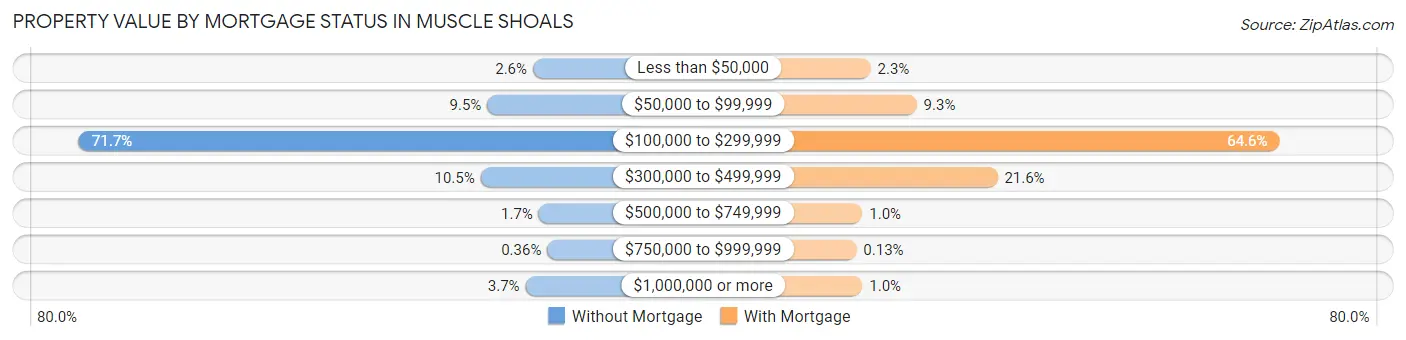
| Property Value | Without Mortgage | With Mortgage |
| Less than $50,000 | 43 (2.5%) | 71 (2.3%) |
| $50,000 to $99,999 | 160 (9.5%) | 289 (9.3%) |
| $100,000 to $299,999 | 1,207 (71.7%) | 2,004 (64.6%) |
| $300,000 to $499,999 | 177 (10.5%) | 671 (21.6%) |
| $500,000 to $749,999 | 28 (1.7%) | 32 (1.0%) |
| $750,000 to $999,999 | 6 (0.4%) | 4 (0.1%) |
| $1,000,000 or more | 62 (3.7%) | 32 (1.0%) |
| Total | 1,683 (100.0%) | 3,103 (100.0%) |
Household Income by Mortgage Status in Muscle Shoals
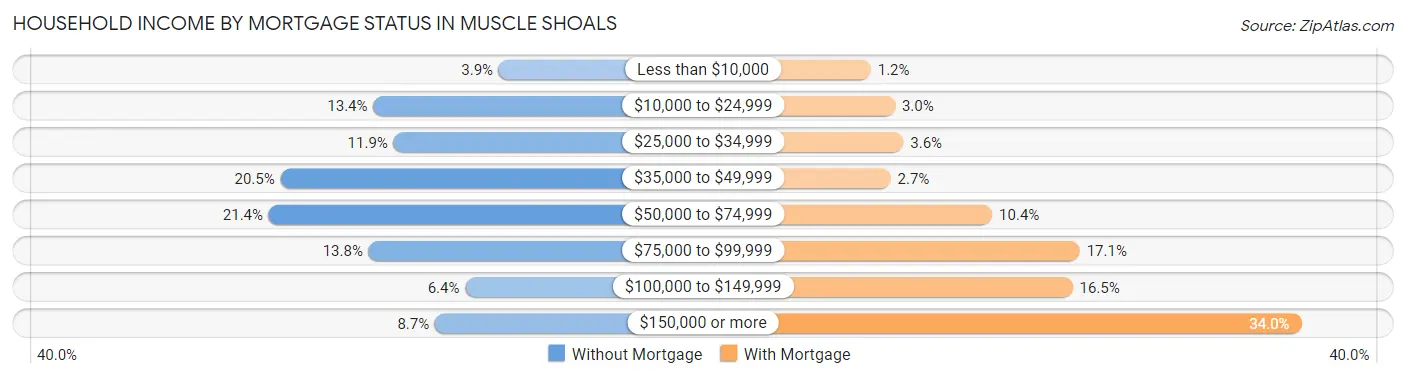
| Household Income | Without Mortgage | With Mortgage |
| Less than $10,000 | 65 (3.9%) | 36 (1.2%) |
| $10,000 to $24,999 | 226 (13.4%) | 93 (3.0%) |
| $25,000 to $34,999 | 200 (11.9%) | 113 (3.6%) |
| $35,000 to $49,999 | 345 (20.5%) | 83 (2.7%) |
| $50,000 to $74,999 | 360 (21.4%) | 323 (10.4%) |
| $75,000 to $99,999 | 232 (13.8%) | 530 (17.1%) |
| $100,000 to $149,999 | 108 (6.4%) | 513 (16.5%) |
| $150,000 or more | 147 (8.7%) | 1,054 (34.0%) |
| Total | 1,683 (100.0%) | 3,103 (100.0%) |
Property Value to Household Income Ratio in Muscle Shoals
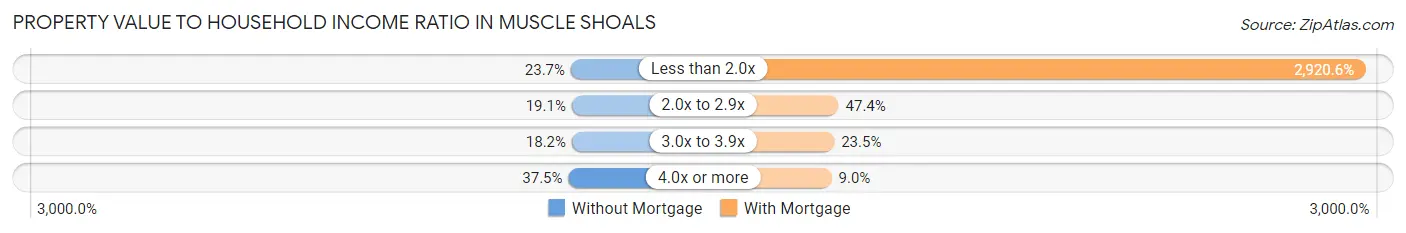
| Value-to-Income Ratio | Without Mortgage | With Mortgage |
| Less than 2.0x | 398 (23.6%) | 90,625 (2,920.6%) |
| 2.0x to 2.9x | 321 (19.1%) | 1,472 (47.4%) |
| 3.0x to 3.9x | 307 (18.2%) | 729 (23.5%) |
| 4.0x or more | 631 (37.5%) | 280 (9.0%) |
| Total | 1,683 (100.0%) | 3,103 (100.0%) |
Real Estate Taxes by Mortgage Status in Muscle Shoals
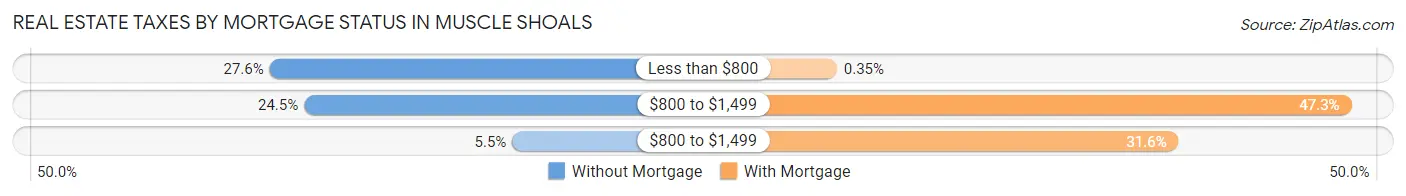
| Property Taxes | Without Mortgage | With Mortgage |
| Less than $800 | 465 (27.6%) | 11 (0.4%) |
| $800 to $1,499 | 412 (24.5%) | 1,469 (47.3%) |
| $800 to $1,499 | 92 (5.5%) | 979 (31.6%) |
| Total | 1,683 (100.0%) | 3,103 (100.0%) |
Health & Disability in Muscle Shoals
Health Insurance Coverage by Age in Muscle Shoals
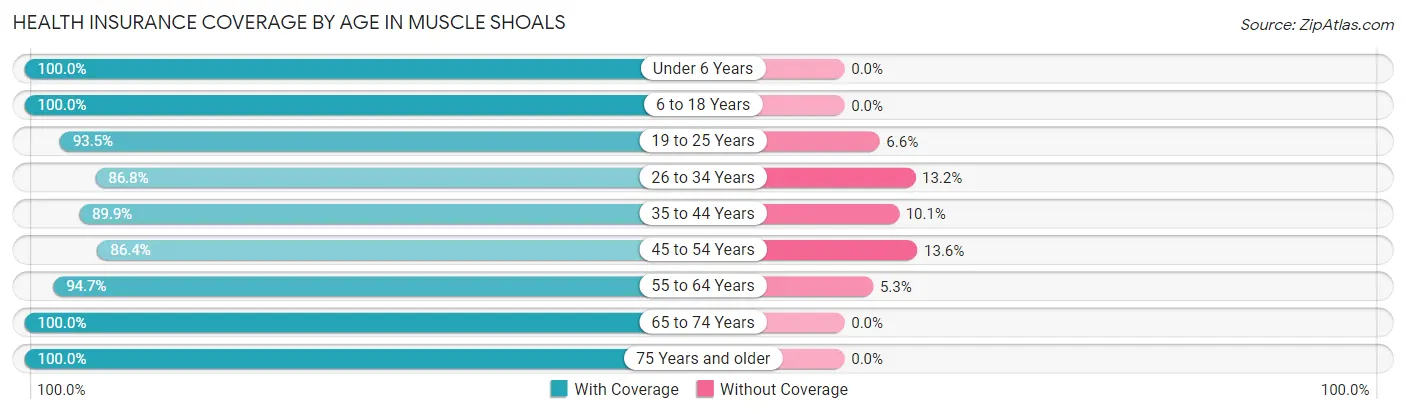
| Age Bracket | With Coverage | Without Coverage |
| Under 6 Years | 971 (100.0%) | 0 (0.0%) |
| 6 to 18 Years | 2,689 (100.0%) | 0 (0.0%) |
| 19 to 25 Years | 1,013 (93.4%) | 71 (6.6%) |
| 26 to 34 Years | 1,646 (86.8%) | 250 (13.2%) |
| 35 to 44 Years | 2,082 (89.9%) | 235 (10.1%) |
| 45 to 54 Years | 1,935 (86.4%) | 304 (13.6%) |
| 55 to 64 Years | 1,913 (94.7%) | 108 (5.3%) |
| 65 to 74 Years | 1,589 (100.0%) | 0 (0.0%) |
| 75 Years and older | 1,325 (100.0%) | 0 (0.0%) |
| Total | 15,163 (94.0%) | 968 (6.0%) |
Health Insurance Coverage by Citizenship Status in Muscle Shoals
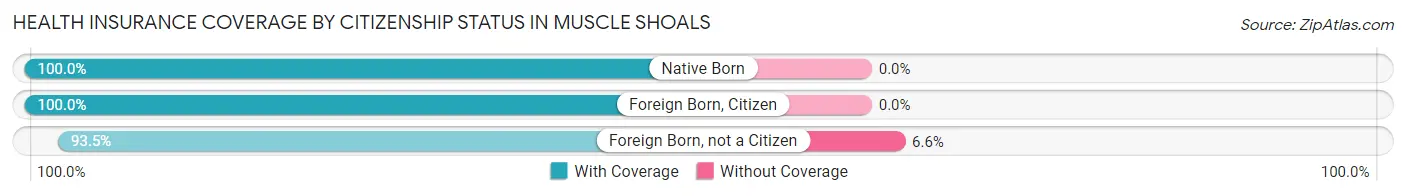
| Citizenship Status | With Coverage | Without Coverage |
| Native Born | 971 (100.0%) | 0 (0.0%) |
| Foreign Born, Citizen | 2,689 (100.0%) | 0 (0.0%) |
| Foreign Born, not a Citizen | 1,013 (93.4%) | 71 (6.6%) |
Health Insurance Coverage by Household Income in Muscle Shoals
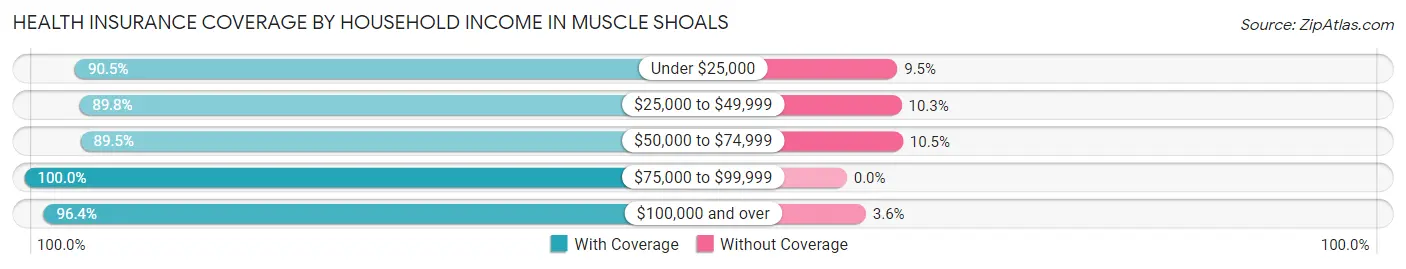
| Household Income | With Coverage | Without Coverage |
| Under $25,000 | 1,014 (90.5%) | 106 (9.5%) |
| $25,000 to $49,999 | 2,619 (89.7%) | 299 (10.2%) |
| $50,000 to $74,999 | 2,779 (89.5%) | 326 (10.5%) |
| $75,000 to $99,999 | 2,353 (100.0%) | 0 (0.0%) |
| $100,000 and over | 6,398 (96.4%) | 237 (3.6%) |
Public vs Private Health Insurance Coverage by Age in Muscle Shoals
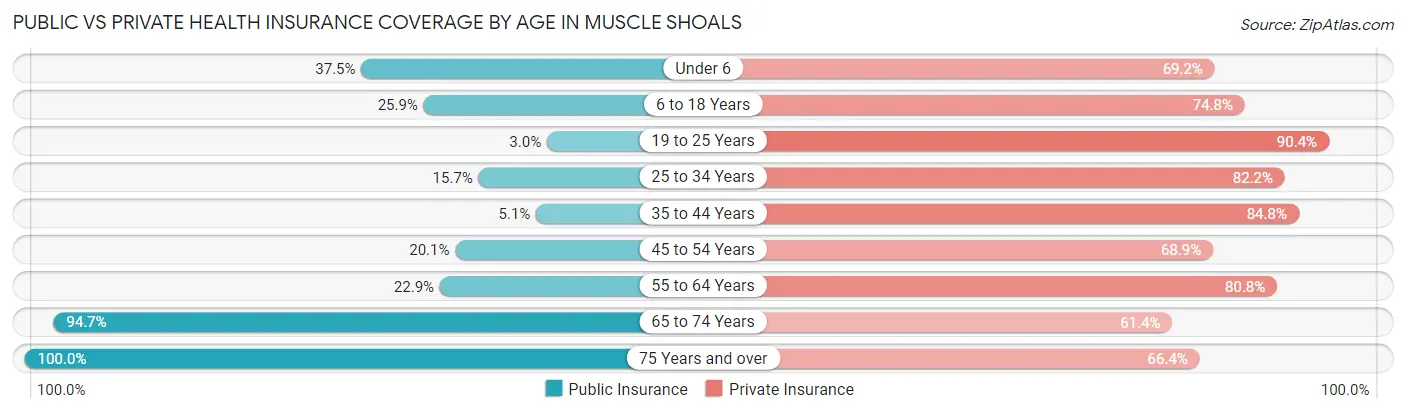
| Age Bracket | Public Insurance | Private Insurance |
| Under 6 | 364 (37.5%) | 672 (69.2%) |
| 6 to 18 Years | 697 (25.9%) | 2,011 (74.8%) |
| 19 to 25 Years | 33 (3.0%) | 980 (90.4%) |
| 25 to 34 Years | 298 (15.7%) | 1,559 (82.2%) |
| 35 to 44 Years | 117 (5.1%) | 1,965 (84.8%) |
| 45 to 54 Years | 449 (20.1%) | 1,543 (68.9%) |
| 55 to 64 Years | 463 (22.9%) | 1,633 (80.8%) |
| 65 to 74 Years | 1,504 (94.7%) | 975 (61.4%) |
| 75 Years and over | 1,325 (100.0%) | 880 (66.4%) |
| Total | 5,250 (32.6%) | 12,218 (75.7%) |
Disability Status by Sex by Age in Muscle Shoals
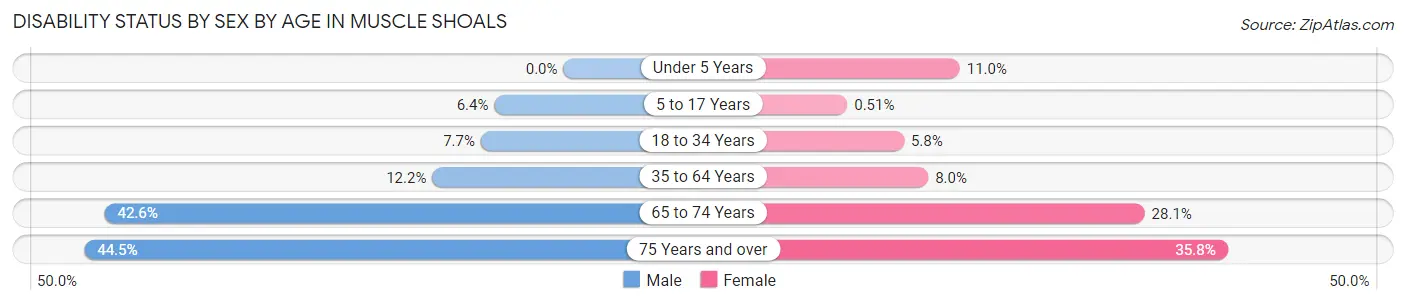
| Age Bracket | Male | Female |
| Under 5 Years | 0 (0.0%) | 37 (11.0%) |
| 5 to 17 Years | 80 (6.4%) | 7 (0.5%) |
| 18 to 34 Years | 124 (7.7%) | 95 (5.8%) |
| 35 to 64 Years | 383 (12.2%) | 275 (8.0%) |
| 65 to 74 Years | 310 (42.6%) | 242 (28.1%) |
| 75 Years and over | 245 (44.5%) | 277 (35.8%) |
Disability Class by Sex by Age in Muscle Shoals
Disability Class: Hearing Difficulty
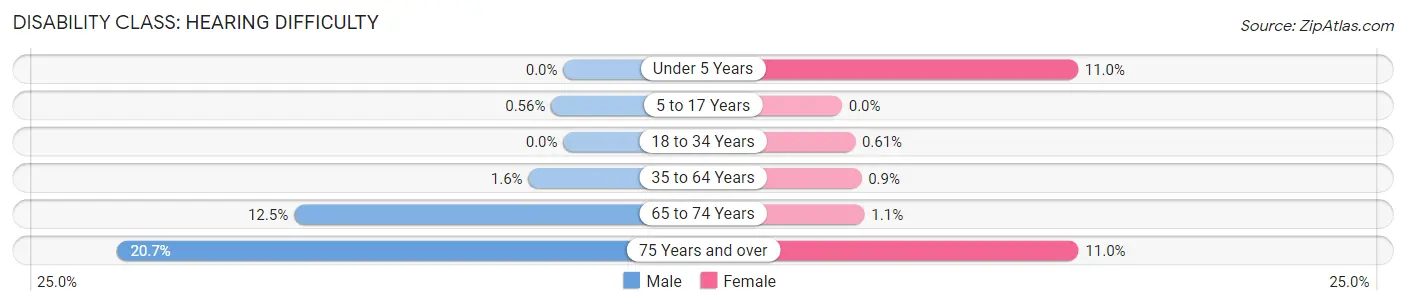
| Age Bracket | Male | Female |
| Under 5 Years | 0 (0.0%) | 37 (11.0%) |
| 5 to 17 Years | 7 (0.6%) | 0 (0.0%) |
| 18 to 34 Years | 0 (0.0%) | 10 (0.6%) |
| 35 to 64 Years | 51 (1.6%) | 31 (0.9%) |
| 65 to 74 Years | 91 (12.5%) | 9 (1.1%) |
| 75 Years and over | 114 (20.7%) | 85 (11.0%) |
Disability Class: Vision Difficulty
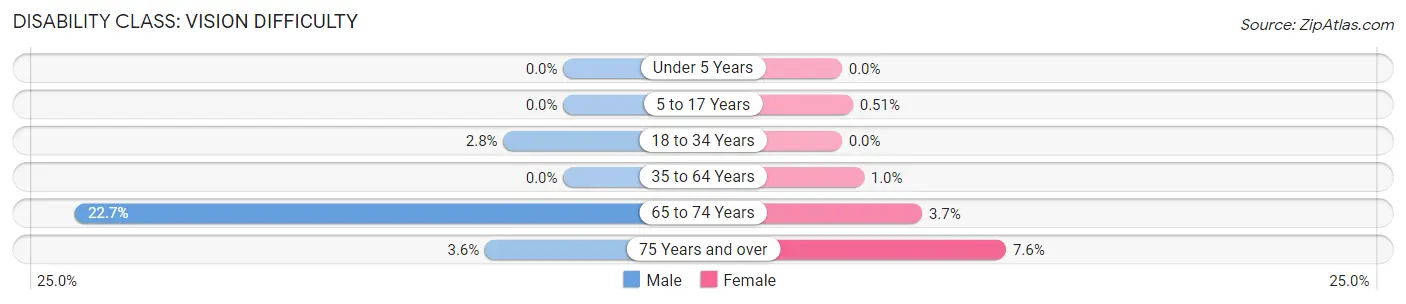
| Age Bracket | Male | Female |
| Under 5 Years | 0 (0.0%) | 0 (0.0%) |
| 5 to 17 Years | 0 (0.0%) | 7 (0.5%) |
| 18 to 34 Years | 45 (2.8%) | 0 (0.0%) |
| 35 to 64 Years | 0 (0.0%) | 35 (1.0%) |
| 65 to 74 Years | 165 (22.7%) | 32 (3.7%) |
| 75 Years and over | 20 (3.6%) | 59 (7.6%) |
Disability Class: Cognitive Difficulty
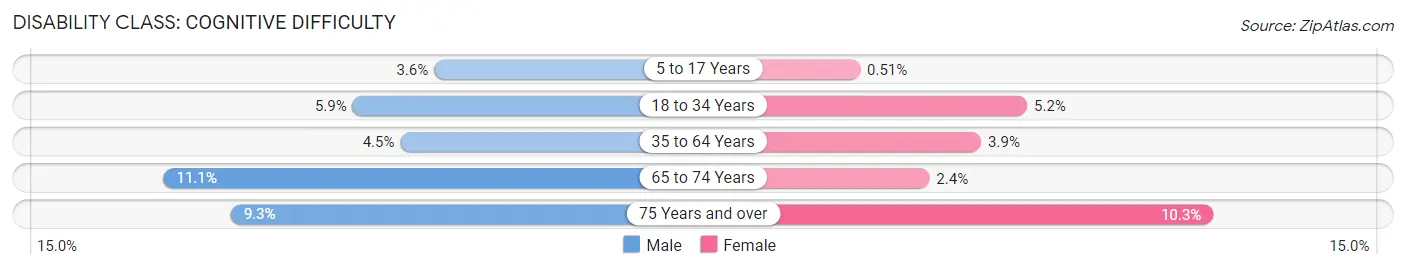
| Age Bracket | Male | Female |
| 5 to 17 Years | 45 (3.6%) | 7 (0.5%) |
| 18 to 34 Years | 95 (5.9%) | 85 (5.2%) |
| 35 to 64 Years | 143 (4.5%) | 133 (3.9%) |
| 65 to 74 Years | 81 (11.1%) | 21 (2.4%) |
| 75 Years and over | 51 (9.3%) | 80 (10.3%) |
Disability Class: Ambulatory Difficulty
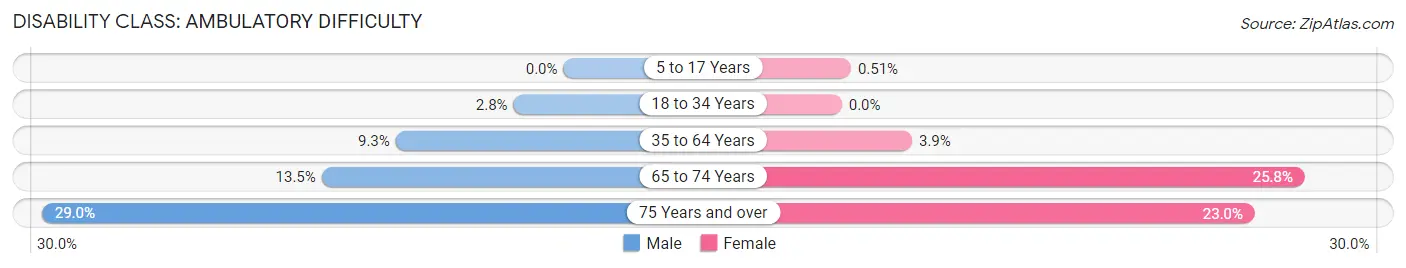
| Age Bracket | Male | Female |
| 5 to 17 Years | 0 (0.0%) | 7 (0.5%) |
| 18 to 34 Years | 45 (2.8%) | 0 (0.0%) |
| 35 to 64 Years | 294 (9.3%) | 134 (3.9%) |
| 65 to 74 Years | 98 (13.5%) | 222 (25.8%) |
| 75 Years and over | 160 (29.0%) | 178 (23.0%) |
Disability Class: Self-Care Difficulty
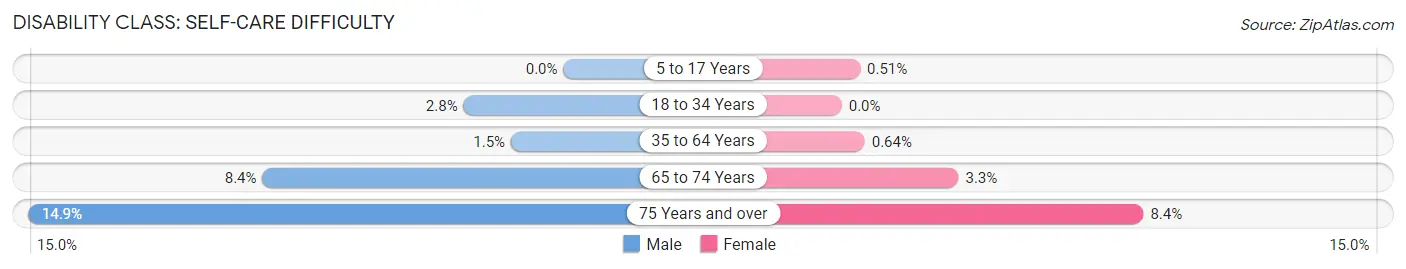
| Age Bracket | Male | Female |
| 5 to 17 Years | 0 (0.0%) | 7 (0.5%) |
| 18 to 34 Years | 45 (2.8%) | 0 (0.0%) |
| 35 to 64 Years | 46 (1.5%) | 22 (0.6%) |
| 65 to 74 Years | 61 (8.4%) | 28 (3.3%) |
| 75 Years and over | 82 (14.9%) | 65 (8.4%) |
Technology Access in Muscle Shoals
Computing Device Access in Muscle Shoals
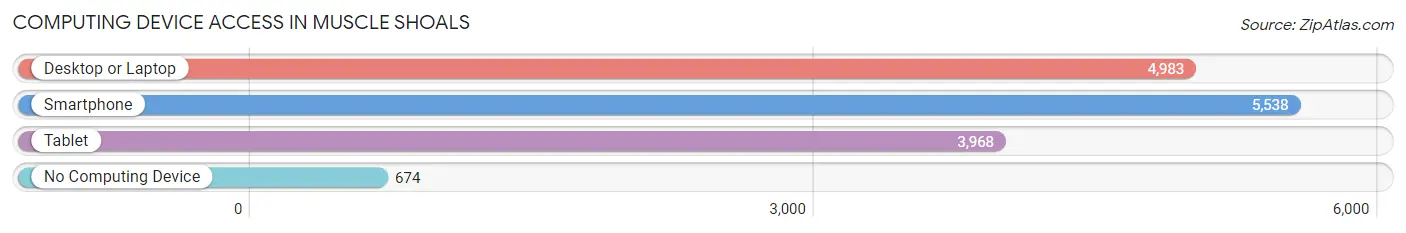
| Device Type | # Households | % Households |
| Desktop or Laptop | 4,983 | 76.3% |
| Smartphone | 5,538 | 84.8% |
| Tablet | 3,968 | 60.7% |
| No Computing Device | 674 | 10.3% |
| Total | 6,534 | 100.0% |
Internet Access in Muscle Shoals
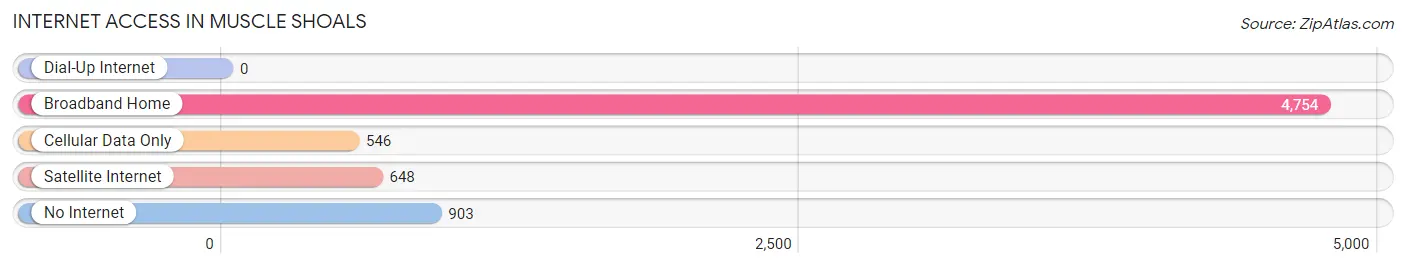
| Internet Type | # Households | % Households |
| Dial-Up Internet | 0 | 0.0% |
| Broadband Home | 4,754 | 72.8% |
| Cellular Data Only | 546 | 8.4% |
| Satellite Internet | 648 | 9.9% |
| No Internet | 903 | 13.8% |
| Total | 6,534 | 100.0% |
Muscle Shoals Summary
Muscle Shoals, Alabama is a city located in the northwestern corner of the state, along the Tennessee River. It is part of the Florence-Muscle Shoals Metropolitan Statistical Area, and is the county seat of Colbert County. The city is known for its music industry, which has produced a number of hit songs and albums over the years.
History
The area that is now Muscle Shoals was originally inhabited by the Chickasaw and Cherokee Native American tribes. The first European settlers arrived in the area in the late 1700s, and the city was officially founded in 1819. The city was named after the shoals in the Tennessee River, which were used by Native Americans to fish for mussels.
In the early 1900s, the city began to develop as an industrial center, with the construction of a hydroelectric dam and the Tennessee Valley Authority (TVA). This led to the development of a number of factories and businesses in the area, including the Tennessee Valley Iron and Steel Company.
During World War II, the city was home to a number of military bases, including the Redstone Arsenal and the Huntsville Army Airfield. After the war, the city continued to grow, and in the 1960s it became known as the “Hit Recording Capital of the World” due to the success of the local recording studios.
Geography
Muscle Shoals is located in the northwestern corner of Alabama, along the Tennessee River. It is part of the Florence-Muscle Shoals Metropolitan Statistical Area, and is the county seat of Colbert County. The city covers an area of 16.3 square miles, and has a population of 13,146 as of the 2010 census.
The city is located in a hilly region, with the Tennessee River forming the western border. The city is located in the foothills of the Appalachian Mountains, and is surrounded by forests and rolling hills.
Economy
The economy of Muscle Shoals is largely based on manufacturing and tourism. The city is home to a number of factories, including the Tennessee Valley Iron and Steel Company, which produces steel products. The city is also home to a number of tourist attractions, including the Alabama Music Hall of Fame and the W.C. Handy Home and Museum.
The city is also home to a number of recording studios, which have produced a number of hit songs and albums over the years. The city is also home to a number of educational institutions, including the University of North Alabama and the Northwest-Shoals Community College.
Demographics
As of the 2010 census, the population of Muscle Shoals was 13,146. The racial makeup of the city was 79.2% White, 17.3% African American, 0.4% Native American, 0.7% Asian, 0.1% Pacific Islander, and 2.3% from other races. Hispanic or Latino of any race were 2.3% of the population.
The median income for a household in the city was $35,945, and the median income for a family was $45,945. The per capita income for the city was $20,945. About 15.2% of families and 19.2% of the population were below the poverty line, including 28.2% of those under age 18 and 11.2% of those age 65 or over.
Common Questions
What is Per Capita Income in Muscle Shoals?
Per Capita income in Muscle Shoals is $35,791.
What is the Median Family Income in Muscle Shoals?
Median Family Income in Muscle Shoals is $74,270.
What is the Median Household income in Muscle Shoals?
Median Household Income in Muscle Shoals is $70,493.
What is Income or Wage Gap in Muscle Shoals?
Income or Wage Gap in Muscle Shoals is 24.6%.
Women in Muscle Shoals earn 75.4 cents for every dollar earned by a man.
What is Inequality or Gini Index in Muscle Shoals?
Inequality or Gini Index in Muscle Shoals is 0.42.
What is the Total Population of Muscle Shoals?
Total Population of Muscle Shoals is 16,334.
What is the Total Male Population of Muscle Shoals?
Total Male Population of Muscle Shoals is 7,773.
What is the Total Female Population of Muscle Shoals?
Total Female Population of Muscle Shoals is 8,561.
What is the Ratio of Males per 100 Females in Muscle Shoals?
There are 90.80 Males per 100 Females in Muscle Shoals.
What is the Ratio of Females per 100 Males in Muscle Shoals?
There are 110.14 Females per 100 Males in Muscle Shoals.
What is the Median Population Age in Muscle Shoals?
Median Population Age in Muscle Shoals is 38.9 Years.
What is the Average Family Size in Muscle Shoals
Average Family Size in Muscle Shoals is 3.0 People.
What is the Average Household Size in Muscle Shoals
Average Household Size in Muscle Shoals is 2.5 People.
How Large is the Labor Force in Muscle Shoals?
There are 8,404 People in the Labor Forcein in Muscle Shoals.
What is the Percentage of People in the Labor Force in Muscle Shoals?
62.6% of People are in the Labor Force in Muscle Shoals.
What is the Unemployment Rate in Muscle Shoals?
Unemployment Rate in Muscle Shoals is 3.2%.