Madison, AL Map & Demographics
Madison Map
Madison Overview
$51,788
PER CAPITA INCOME
$142,113
AVG FAMILY INCOME
$118,132
AVG HOUSEHOLD INCOME
56.0%
WAGE / INCOME GAP [ % ]
44.0¢/ $1
WAGE / INCOME GAP [ $ ]
$8,795
FAMILY INCOME DEFICIT
0.39
INEQUALITY / GINI INDEX
56,967
TOTAL POPULATION
28,203
MALE POPULATION
28,764
FEMALE POPULATION
98.05
MALES / 100 FEMALES
101.99
FEMALES / 100 MALES
39.1
MEDIAN AGE
3.1
AVG FAMILY SIZE
2.6
AVG HOUSEHOLD SIZE
28,194
LABOR FORCE [ PEOPLE ]
65.0%
PERCENT IN LABOR FORCE
3.0%
UNEMPLOYMENT RATE
Madison Area Codes
Income in Madison
Income Overview in Madison
Per Capita Income in Madison is $51,788, while median incomes of families and households are $142,113 and $118,132 respectively.
| Characteristic | Number | Measure |
| Per Capita Income | 56,967 | $51,788 |
| Median Family Income | 15,622 | $142,113 |
| Mean Family Income | 15,622 | $156,244 |
| Median Household Income | 22,073 | $118,132 |
| Mean Household Income | 22,073 | $132,478 |
| Income Deficit | 15,622 | $8,795 |
| Wage / Income Gap (%) | 56,967 | 56.03% |
| Wage / Income Gap ($) | 56,967 | 43.97¢ per $1 |
| Gini / Inequality Index | 56,967 | 0.39 |
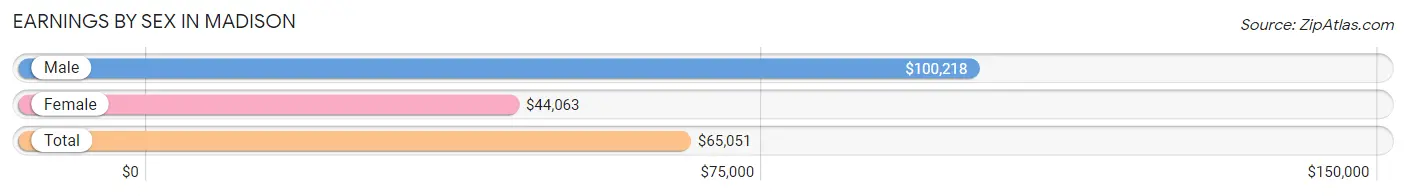
Earnings by Sex in Madison
Average Earnings in Madison are $65,051, $100,218 for men and $44,063 for women, a difference of 56.0%.
| Sex | Number | Average Earnings |
| Male | 16,420 (55.9%) | $100,218 |
| Female | 12,929 (44.1%) | $44,063 |
| Total | 29,349 (100.0%) | $65,051 |
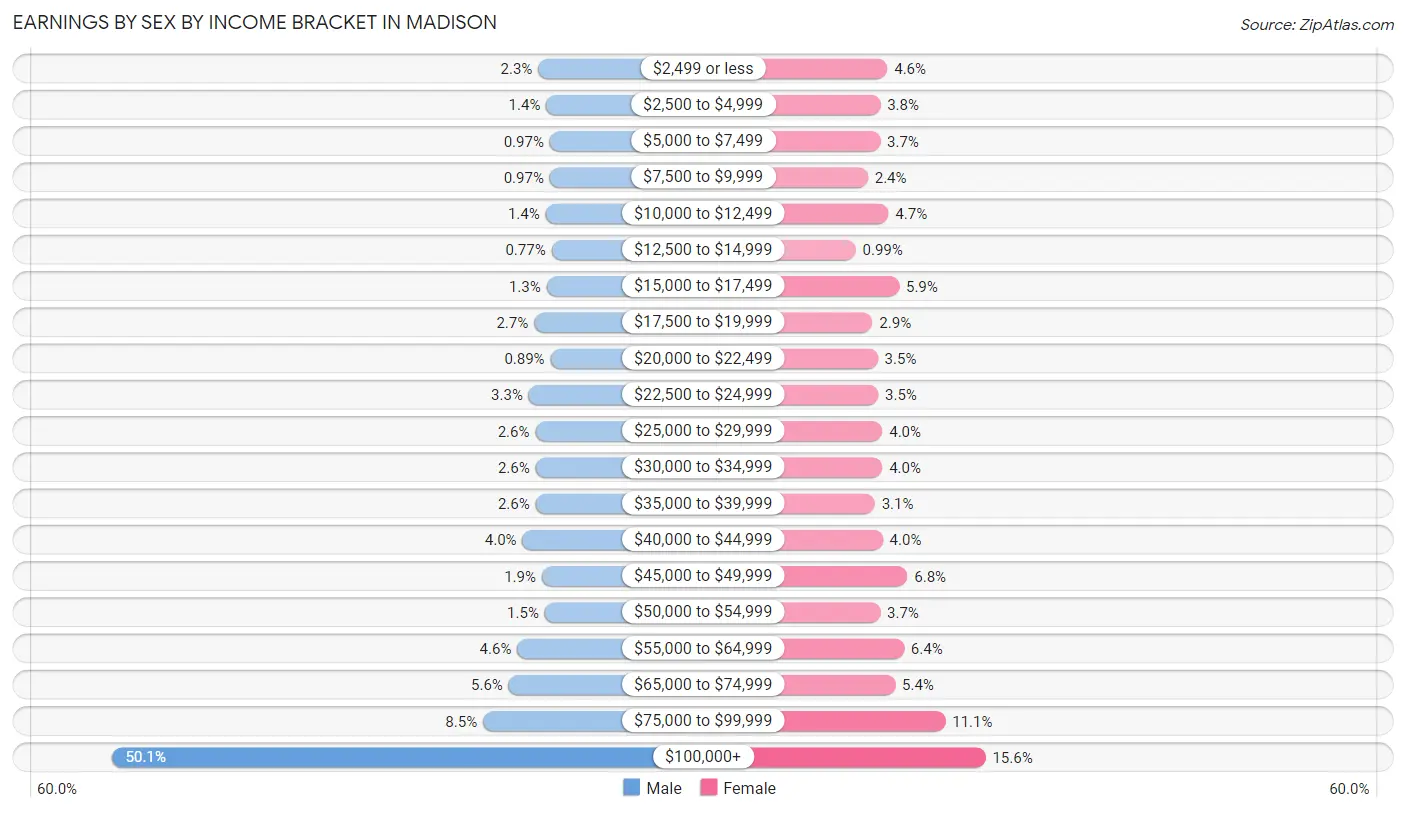
Earnings by Sex by Income Bracket in Madison
The most common earnings brackets in Madison are $100,000+ for men (8,230 | 50.1%) and $100,000+ for women (2,015 | 15.6%).
| Income | Male | Female |
| $2,499 or less | 372 (2.3%) | 588 (4.5%) |
| $2,500 to $4,999 | 224 (1.4%) | 486 (3.8%) |
| $5,000 to $7,499 | 160 (1.0%) | 483 (3.7%) |
| $7,500 to $9,999 | 159 (1.0%) | 305 (2.4%) |
| $10,000 to $12,499 | 236 (1.4%) | 605 (4.7%) |
| $12,500 to $14,999 | 126 (0.8%) | 128 (1.0%) |
| $15,000 to $17,499 | 219 (1.3%) | 759 (5.9%) |
| $17,500 to $19,999 | 448 (2.7%) | 373 (2.9%) |
| $20,000 to $22,499 | 146 (0.9%) | 448 (3.5%) |
| $22,500 to $24,999 | 547 (3.3%) | 455 (3.5%) |
| $25,000 to $29,999 | 426 (2.6%) | 516 (4.0%) |
| $30,000 to $34,999 | 420 (2.6%) | 514 (4.0%) |
| $35,000 to $39,999 | 421 (2.6%) | 406 (3.1%) |
| $40,000 to $44,999 | 663 (4.0%) | 521 (4.0%) |
| $45,000 to $49,999 | 305 (1.9%) | 881 (6.8%) |
| $50,000 to $54,999 | 252 (1.5%) | 483 (3.7%) |
| $55,000 to $64,999 | 759 (4.6%) | 830 (6.4%) |
| $65,000 to $74,999 | 917 (5.6%) | 702 (5.4%) |
| $75,000 to $99,999 | 1,390 (8.5%) | 1,431 (11.1%) |
| $100,000+ | 8,230 (50.1%) | 2,015 (15.6%) |
| Total | 16,420 (100.0%) | 12,929 (100.0%) |
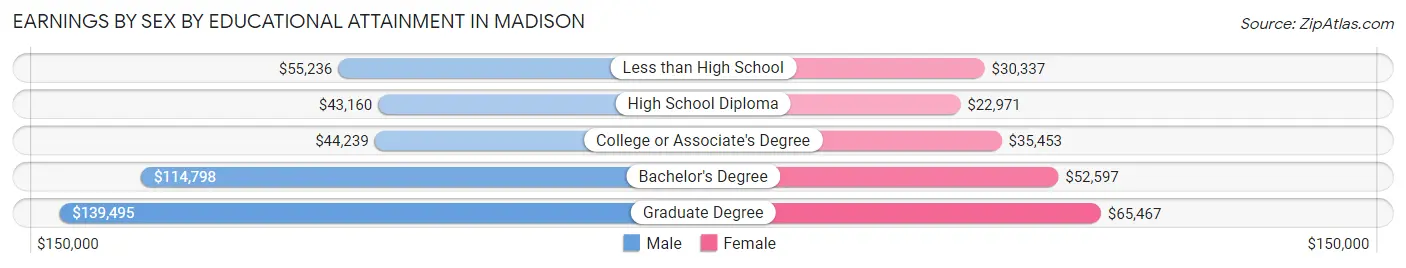
Earnings by Sex by Educational Attainment in Madison
Average earnings in Madison are $107,715 for men and $48,564 for women, a difference of 54.9%. Men with an educational attainment of graduate degree enjoy the highest average annual earnings of $139,495, while those with high school diploma education earn the least with $43,160. Women with an educational attainment of graduate degree earn the most with the average annual earnings of $65,467, while those with high school diploma education have the smallest earnings of $22,971.
| Educational Attainment | Male Income | Female Income |
| Less than High School | $55,236 | $30,337 |
| High School Diploma | $43,160 | $22,971 |
| College or Associate's Degree | $44,239 | $35,453 |
| Bachelor's Degree | $114,798 | $52,597 |
| Graduate Degree | $139,495 | $65,467 |
| Total | $107,715 | $48,564 |
Family Income in Madison
Family Income Brackets in Madison
According to the Madison family income data, there are 3,859 families falling into the $200,000+ income range, which is the most common income bracket and makes up 24.7% of all families. Conversely, the less than $10,000 income bracket is the least frequent group with only 125 families (0.8%) belonging to this category.
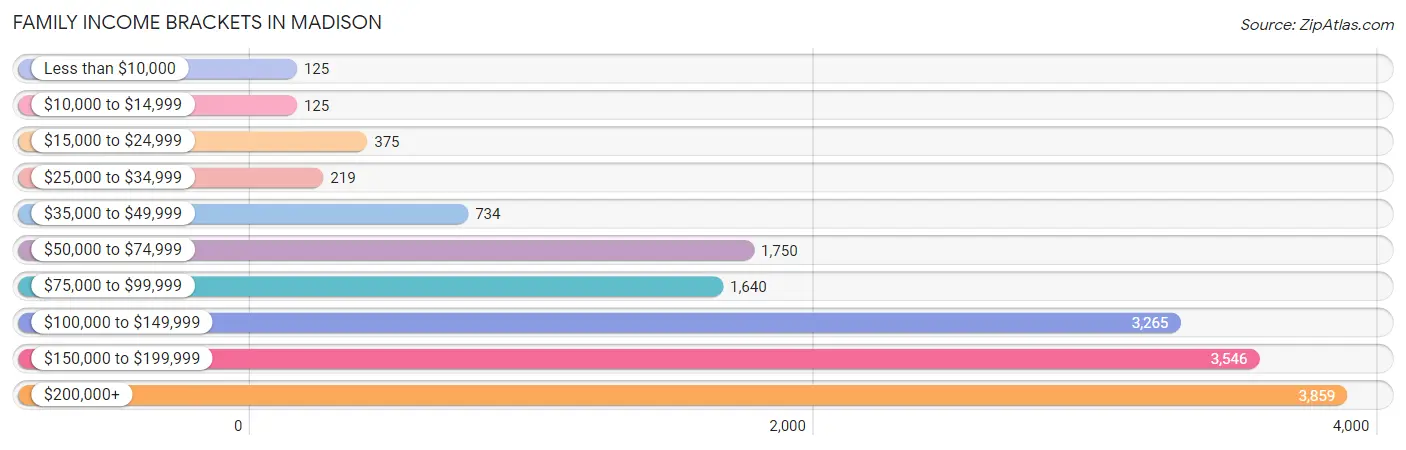
| Income Bracket | # Families | % Families |
| Less than $10,000 | 125 | 0.8% |
| $10,000 to $14,999 | 125 | 0.8% |
| $15,000 to $24,999 | 375 | 2.4% |
| $25,000 to $34,999 | 219 | 1.4% |
| $35,000 to $49,999 | 734 | 4.7% |
| $50,000 to $74,999 | 1,750 | 11.2% |
| $75,000 to $99,999 | 1,640 | 10.5% |
| $100,000 to $149,999 | 3,265 | 20.9% |
| $150,000 to $199,999 | 3,546 | 22.7% |
| $200,000+ | 3,859 | 24.7% |
Family Income by Famaliy Size in Madison
7+ person families (34 | 0.2%) account for the highest median family income in Madison with $227,955 per family, while 2-person families (6,371 | 40.8%) have the highest median income of $56,140 per family member.
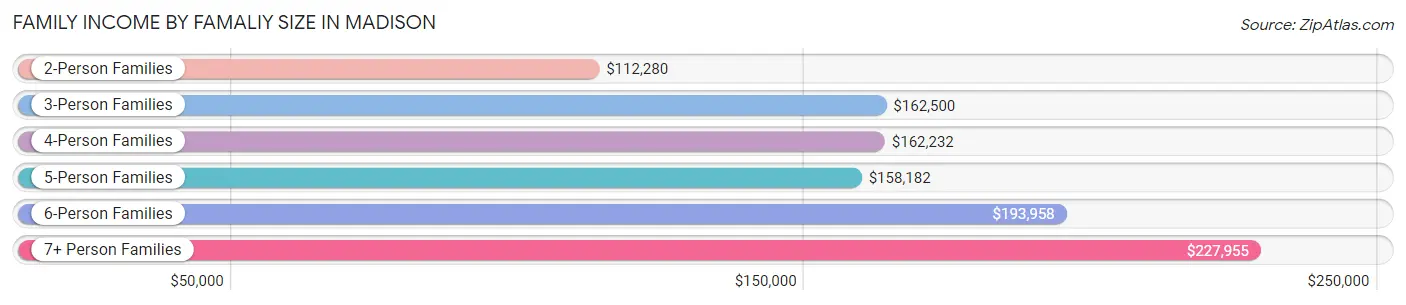
| Income Bracket | # Families | Median Income |
| 2-Person Families | 6,371 (40.8%) | $112,280 |
| 3-Person Families | 3,872 (24.8%) | $162,500 |
| 4-Person Families | 3,249 (20.8%) | $162,232 |
| 5-Person Families | 1,702 (10.9%) | $158,182 |
| 6-Person Families | 394 (2.5%) | $193,958 |
| 7+ Person Families | 34 (0.2%) | $227,955 |
| Total | 15,622 (100.0%) | $142,113 |
Family Income by Number of Earners in Madison
The median family income in Madison is $142,113, with families comprising 3+ earners (1,304) having the highest median family income of $189,129, while families with no earners (1,472) have the lowest median family income of $78,304, accounting for 8.4% and 9.4% of families, respectively.
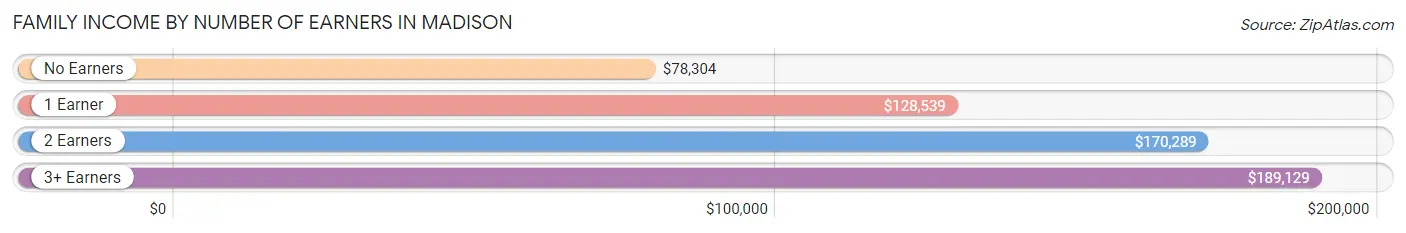
| Number of Earners | # Families | Median Income |
| No Earners | 1,472 (9.4%) | $78,304 |
| 1 Earner | 6,317 (40.4%) | $128,539 |
| 2 Earners | 6,529 (41.8%) | $170,289 |
| 3+ Earners | 1,304 (8.4%) | $189,129 |
| Total | 15,622 (100.0%) | $142,113 |
Household Income in Madison
Household Income Brackets in Madison
With 4,525 households falling in the category, the $100,000 to $149,999 income range is the most frequent in Madison, accounting for 20.5% of all households. In contrast, only 287 households (1.3%) fall into the $10,000 to $14,999 income bracket, making it the least populous group.
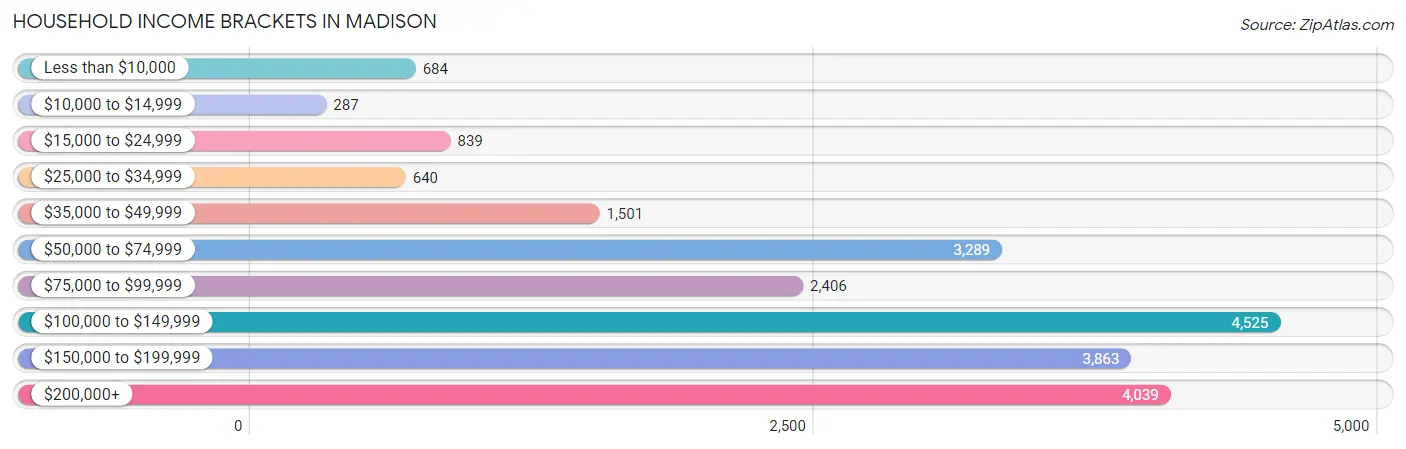
| Income Bracket | # Households | % Households |
| Less than $10,000 | 684 | 3.1% |
| $10,000 to $14,999 | 287 | 1.3% |
| $15,000 to $24,999 | 839 | 3.8% |
| $25,000 to $34,999 | 640 | 2.9% |
| $35,000 to $49,999 | 1,501 | 6.8% |
| $50,000 to $74,999 | 3,289 | 14.9% |
| $75,000 to $99,999 | 2,406 | 10.9% |
| $100,000 to $149,999 | 4,525 | 20.5% |
| $150,000 to $199,999 | 3,863 | 17.5% |
| $200,000+ | 4,039 | 18.3% |
Household Income by Householder Age in Madison
The median household income in Madison is $118,132, with the highest median household income of $143,735 found in the 45 to 64 years age bracket for the primary householder. A total of 9,107 households (41.3%) fall into this category. Meanwhile, the 15 to 24 years age bracket for the primary householder has the lowest median household income of $55,212, with 456 households (2.1%) in this group.
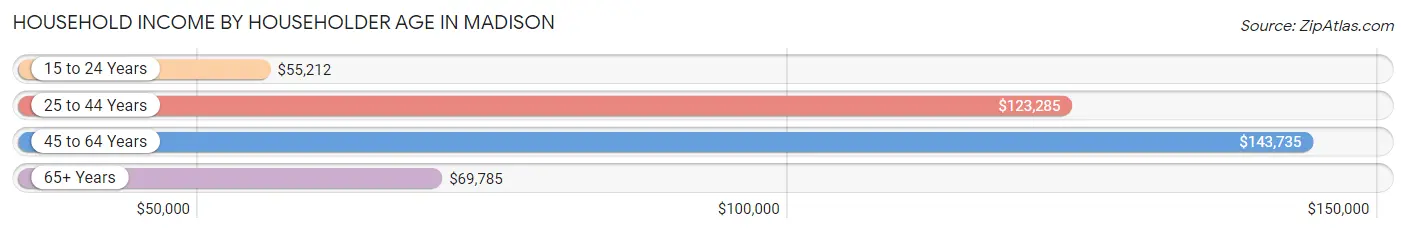
| Income Bracket | # Households | Median Income |
| 15 to 24 Years | 456 (2.1%) | $55,212 |
| 25 to 44 Years | 7,995 (36.2%) | $123,285 |
| 45 to 64 Years | 9,107 (41.3%) | $143,735 |
| 65+ Years | 4,515 (20.4%) | $69,785 |
| Total | 22,073 (100.0%) | $118,132 |
Poverty in Madison
Income Below Poverty by Sex and Age in Madison
With 4.5% poverty level for males and 4.5% for females among the residents of Madison, 16 and 17 year old males and 75 year old and over females are the most vulnerable to poverty, with 177 males (18.7%) and 167 females (10.3%) in their respective age groups living below the poverty level.
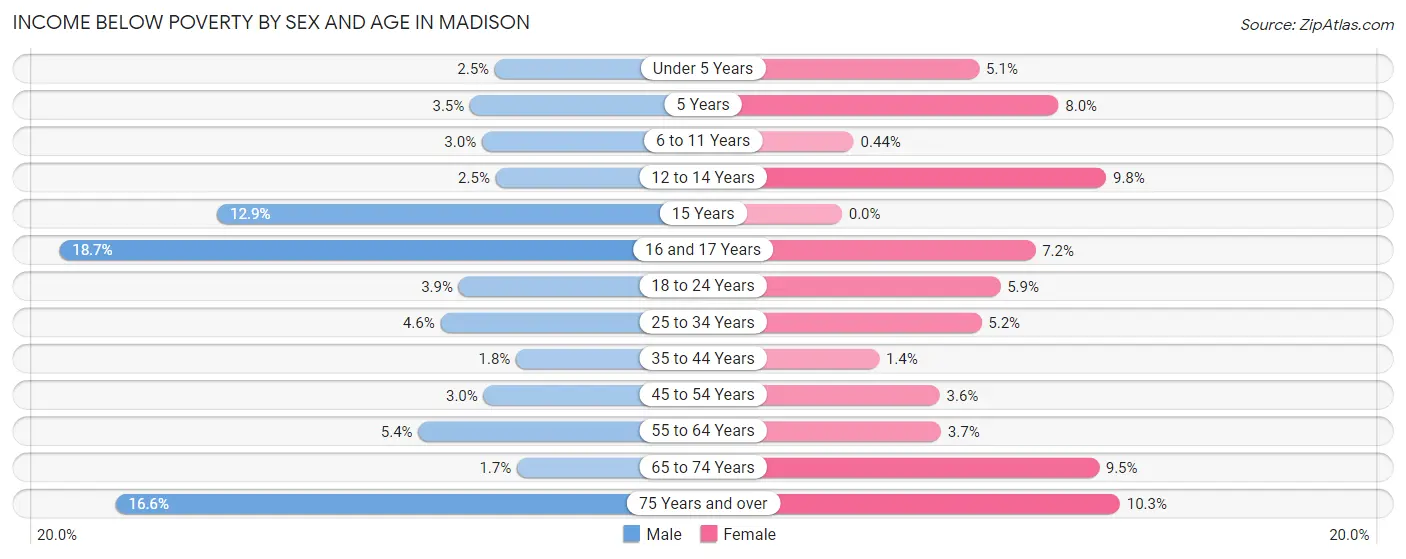
| Age Bracket | Male | Female |
| Under 5 Years | 42 (2.5%) | 78 (5.1%) |
| 5 Years | 14 (3.5%) | 23 (8.0%) |
| 6 to 11 Years | 86 (3.0%) | 12 (0.4%) |
| 12 to 14 Years | 47 (2.5%) | 94 (9.8%) |
| 15 Years | 88 (12.9%) | 0 (0.0%) |
| 16 and 17 Years | 177 (18.7%) | 90 (7.2%) |
| 18 to 24 Years | 55 (3.9%) | 91 (5.9%) |
| 25 to 34 Years | 142 (4.6%) | 161 (5.2%) |
| 35 to 44 Years | 73 (1.8%) | 65 (1.4%) |
| 45 to 54 Years | 126 (3.0%) | 147 (3.6%) |
| 55 to 64 Years | 195 (5.4%) | 151 (3.7%) |
| 65 to 74 Years | 33 (1.7%) | 203 (9.5%) |
| 75 Years and over | 188 (16.6%) | 167 (10.3%) |
| Total | 1,266 (4.5%) | 1,282 (4.5%) |
Income Above Poverty by Sex and Age in Madison
According to the poverty statistics in Madison, males aged 65 to 74 years and females aged 15 years are the age groups that are most secure financially, with 98.3% of males and 100.0% of females in these age groups living above the poverty line.
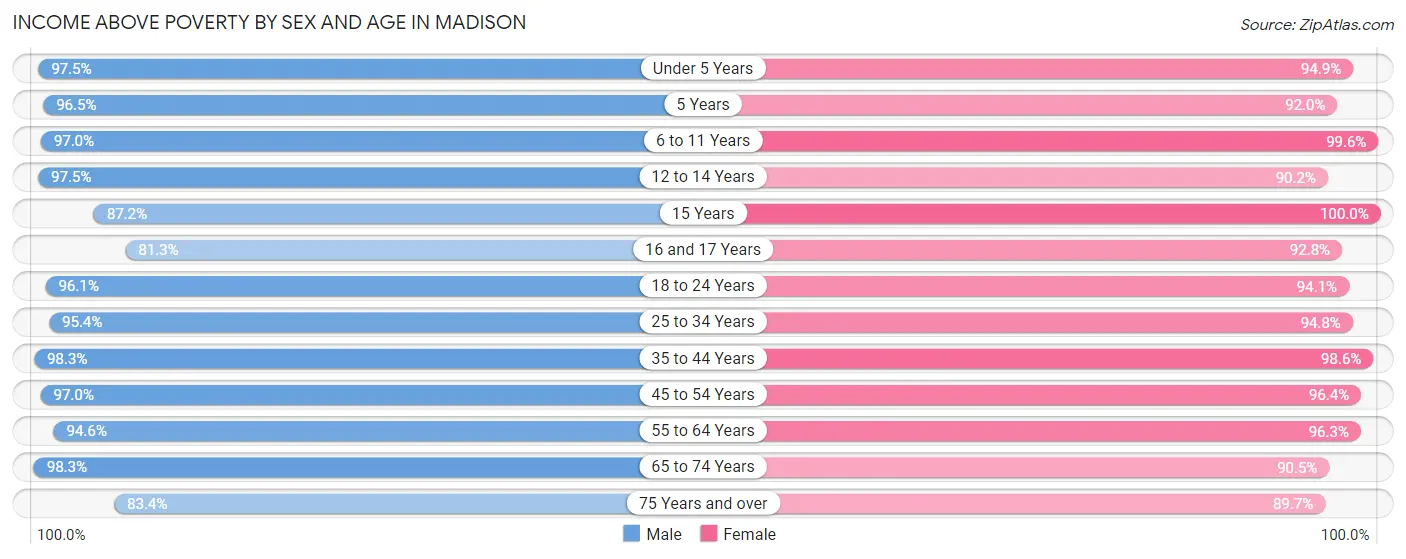
| Age Bracket | Male | Female |
| Under 5 Years | 1,614 (97.5%) | 1,451 (94.9%) |
| 5 Years | 391 (96.5%) | 263 (92.0%) |
| 6 to 11 Years | 2,765 (97.0%) | 2,745 (99.6%) |
| 12 to 14 Years | 1,829 (97.5%) | 864 (90.2%) |
| 15 Years | 597 (87.2%) | 450 (100.0%) |
| 16 and 17 Years | 769 (81.3%) | 1,164 (92.8%) |
| 18 to 24 Years | 1,362 (96.1%) | 1,456 (94.1%) |
| 25 to 34 Years | 2,974 (95.4%) | 2,948 (94.8%) |
| 35 to 44 Years | 4,108 (98.3%) | 4,658 (98.6%) |
| 45 to 54 Years | 4,127 (97.0%) | 3,901 (96.4%) |
| 55 to 64 Years | 3,430 (94.6%) | 3,956 (96.3%) |
| 65 to 74 Years | 1,885 (98.3%) | 1,924 (90.5%) |
| 75 Years and over | 943 (83.4%) | 1,451 (89.7%) |
| Total | 26,794 (95.5%) | 27,231 (95.5%) |
Income Below Poverty Among Married-Couple Families in Madison
The poverty statistics for married-couple families in Madison show that 1.6% or 214 of the total 13,182 families live below the poverty line. Families with 1 or 2 children have the highest poverty rate of 2.2%, comprising of 122 families. On the other hand, families with 3 or 4 children have the lowest poverty rate of 0.0%, which includes 0 families.
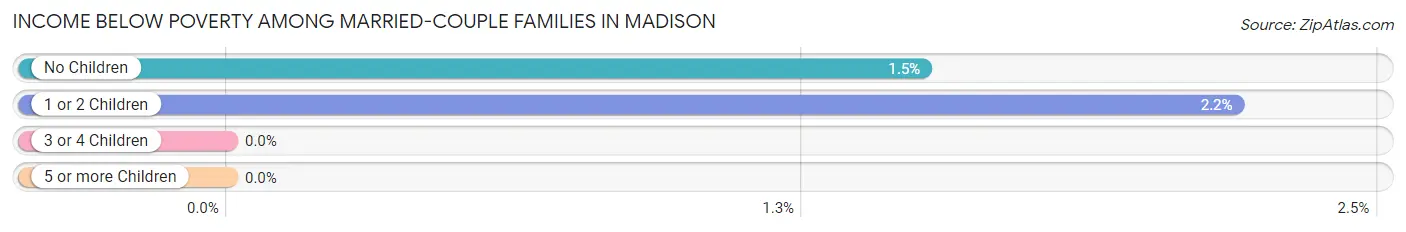
| Children | Above Poverty | Below Poverty |
| No Children | 6,012 (98.5%) | 92 (1.5%) |
| 1 or 2 Children | 5,461 (97.8%) | 122 (2.2%) |
| 3 or 4 Children | 1,487 (100.0%) | 0 (0.0%) |
| 5 or more Children | 8 (100.0%) | 0 (0.0%) |
| Total | 12,968 (98.4%) | 214 (1.6%) |
Income Below Poverty Among Single-Parent Households in Madison
According to the poverty data in Madison, 9.8% or 63 single-father households and 10.0% or 180 single-mother households are living below the poverty line. Among single-father households, those with 1 or 2 children have the highest poverty rate, with 63 households (13.6%) experiencing poverty. Likewise, among single-mother households, those with 3 or 4 children have the highest poverty rate, with 90 households (69.2%) falling below the poverty line.
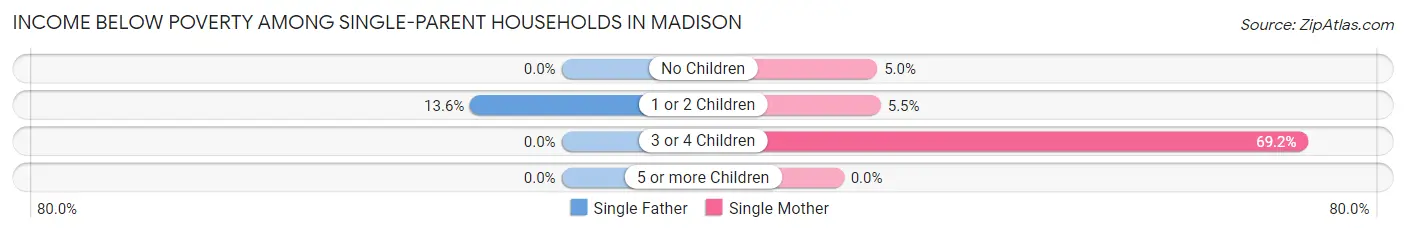
| Children | Single Father | Single Mother |
| No Children | 0 (0.0%) | 20 (5.0%) |
| 1 or 2 Children | 63 (13.6%) | 70 (5.5%) |
| 3 or 4 Children | 0 (0.0%) | 90 (69.2%) |
| 5 or more Children | 0 (0.0%) | 0 (0.0%) |
| Total | 63 (9.8%) | 180 (10.0%) |
Income Below Poverty Among Married-Couple vs Single-Parent Households in Madison
The poverty data for Madison shows that 214 of the married-couple family households (1.6%) and 243 of the single-parent households (10.0%) are living below the poverty level. Within the married-couple family households, those with 1 or 2 children have the highest poverty rate, with 122 households (2.2%) falling below the poverty line. Among the single-parent households, those with 3 or 4 children have the highest poverty rate, with 90 household (69.2%) living below poverty.
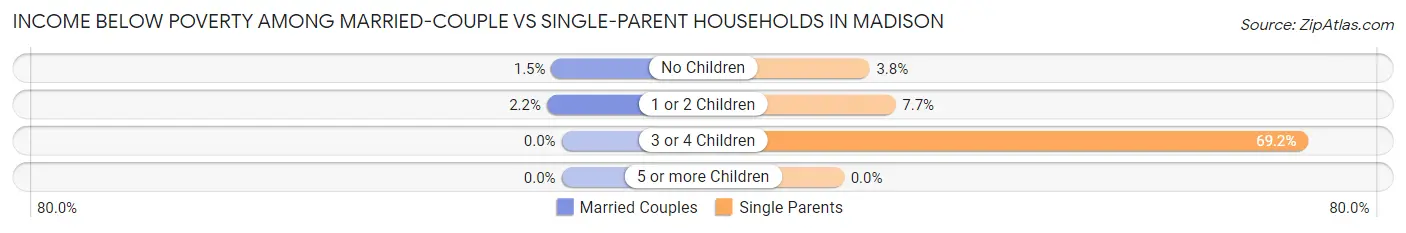
| Children | Married-Couple Families | Single-Parent Households |
| No Children | 92 (1.5%) | 20 (3.8%) |
| 1 or 2 Children | 122 (2.2%) | 133 (7.7%) |
| 3 or 4 Children | 0 (0.0%) | 90 (69.2%) |
| 5 or more Children | 0 (0.0%) | 0 (0.0%) |
| Total | 214 (1.6%) | 243 (10.0%) |
Race in Madison
The most populous races in Madison are White / Caucasian (40,540 | 71.2%), Black / African American (8,409 | 14.8%), and Asian (4,158 | 7.3%).
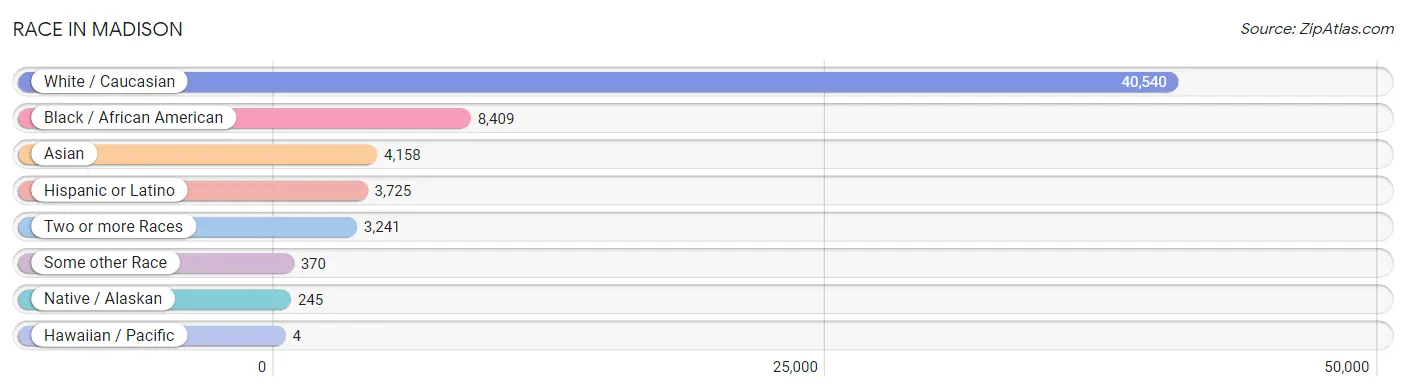
| Race | # Population | % Population |
| Asian | 4,158 | 7.3% |
| Black / African American | 8,409 | 14.8% |
| Hawaiian / Pacific | 4 | 0.0% |
| Hispanic or Latino | 3,725 | 6.5% |
| Native / Alaskan | 245 | 0.4% |
| White / Caucasian | 40,540 | 71.2% |
| Two or more Races | 3,241 | 5.7% |
| Some other Race | 370 | 0.6% |
| Total | 56,967 | 100.0% |
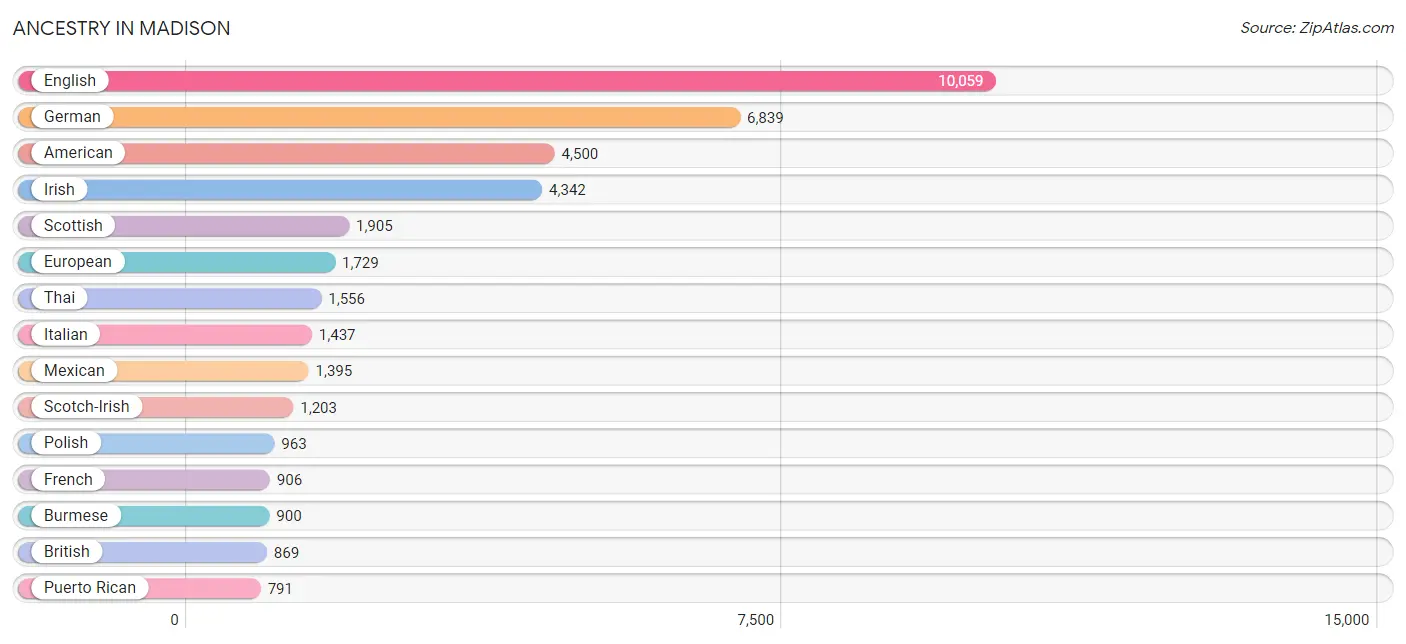
Ancestry in Madison
The most populous ancestries reported in Madison are English (10,059 | 17.7%), German (6,839 | 12.0%), American (4,500 | 7.9%), Irish (4,342 | 7.6%), and Scottish (1,905 | 3.3%), together accounting for 48.5% of all Madison residents.
| Ancestry | # Population | % Population |
| African | 341 | 0.6% |
| American | 4,500 | 7.9% |
| Apache | 20 | 0.0% |
| Arab | 411 | 0.7% |
| Armenian | 15 | 0.0% |
| Australian | 10 | 0.0% |
| Austrian | 108 | 0.2% |
| Basque | 5 | 0.0% |
| Bhutanese | 537 | 0.9% |
| Bolivian | 40 | 0.1% |
| Brazilian | 79 | 0.1% |
| British | 869 | 1.5% |
| British West Indian | 24 | 0.0% |
| Burmese | 900 | 1.6% |
| Cajun | 30 | 0.1% |
| Canadian | 85 | 0.2% |
| Celtic | 17 | 0.0% |
| Central American | 324 | 0.6% |
| Central American Indian | 21 | 0.0% |
| Cherokee | 343 | 0.6% |
| Chippewa | 17 | 0.0% |
| Colombian | 301 | 0.5% |
| Costa Rican | 43 | 0.1% |
| Cree | 11 | 0.0% |
| Creek | 53 | 0.1% |
| Cuban | 86 | 0.2% |
| Czech | 83 | 0.2% |
| Czechoslovakian | 8 | 0.0% |
| Danish | 274 | 0.5% |
| Dominican | 30 | 0.1% |
| Dutch | 194 | 0.3% |
| Eastern European | 42 | 0.1% |
| Ecuadorian | 17 | 0.0% |
| English | 10,059 | 17.7% |
| Estonian | 24 | 0.0% |
| European | 1,729 | 3.0% |
| Filipino | 123 | 0.2% |
| Finnish | 69 | 0.1% |
| French | 906 | 1.6% |
| French American Indian | 17 | 0.0% |
| French Canadian | 314 | 0.5% |
| German | 6,839 | 12.0% |
| Greek | 428 | 0.7% |
| Guamanian / Chamorro | 57 | 0.1% |
| Guatemalan | 89 | 0.2% |
| Honduran | 80 | 0.1% |
| Hungarian | 131 | 0.2% |
| Indian (Asian) | 721 | 1.3% |
| Iranian | 15 | 0.0% |
| Irish | 4,342 | 7.6% |
| Italian | 1,437 | 2.5% |
| Jamaican | 76 | 0.1% |
| Japanese | 30 | 0.1% |
| Kenyan | 109 | 0.2% |
| Korean | 270 | 0.5% |
| Laotian | 189 | 0.3% |
| Latvian | 155 | 0.3% |
| Lebanese | 141 | 0.3% |
| Lithuanian | 90 | 0.2% |
| Mexican | 1,395 | 2.5% |
| Mexican American Indian | 25 | 0.0% |
| Moroccan | 142 | 0.3% |
| Nigerian | 98 | 0.2% |
| Northern European | 130 | 0.2% |
| Norwegian | 434 | 0.8% |
| Pakistani | 190 | 0.3% |
| Palestinian | 12 | 0.0% |
| Panamanian | 36 | 0.1% |
| Pennsylvania German | 8 | 0.0% |
| Peruvian | 87 | 0.2% |
| Polish | 963 | 1.7% |
| Portuguese | 51 | 0.1% |
| Puerto Rican | 791 | 1.4% |
| Puget Sound Salish | 6 | 0.0% |
| Romanian | 65 | 0.1% |
| Russian | 390 | 0.7% |
| Salvadoran | 76 | 0.1% |
| Scandinavian | 484 | 0.9% |
| Scotch-Irish | 1,203 | 2.1% |
| Scottish | 1,905 | 3.3% |
| Sioux | 2 | 0.0% |
| Slovak | 94 | 0.2% |
| Slovene | 46 | 0.1% |
| South American | 683 | 1.2% |
| South American Indian | 75 | 0.1% |
| Spanish | 89 | 0.2% |
| Sri Lankan | 476 | 0.8% |
| Subsaharan African | 439 | 0.8% |
| Swedish | 264 | 0.5% |
| Swiss | 108 | 0.2% |
| Thai | 1,556 | 2.7% |
| Ukrainian | 54 | 0.1% |
| Venezuelan | 238 | 0.4% |
| Welsh | 322 | 0.6% |
| Yugoslavian | 23 | 0.0% | View All 95 Rows |
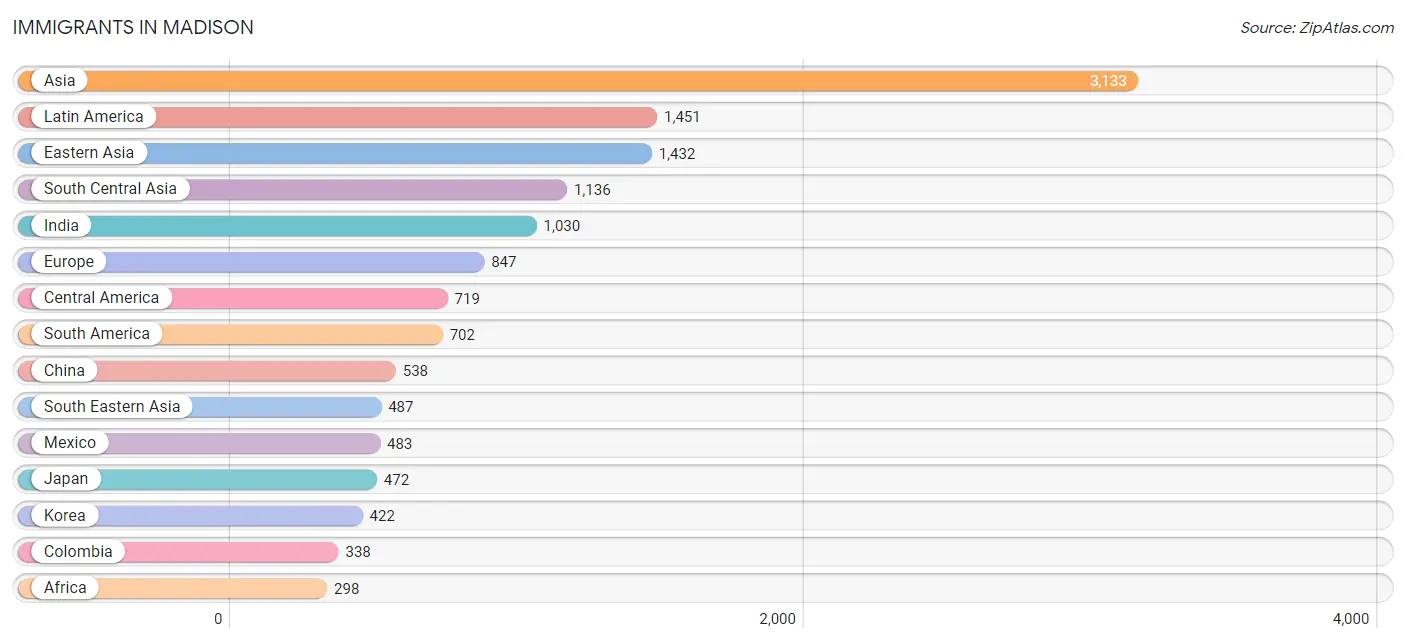
Immigrants in Madison
The most numerous immigrant groups reported in Madison came from Asia (3,133 | 5.5%), Latin America (1,451 | 2.5%), Eastern Asia (1,432 | 2.5%), South Central Asia (1,136 | 2.0%), and India (1,030 | 1.8%), together accounting for 14.4% of all Madison residents.
| Immigration Origin | # Population | % Population |
| Africa | 298 | 0.5% |
| Asia | 3,133 | 5.5% |
| Brazil | 101 | 0.2% |
| Bulgaria | 14 | 0.0% |
| Cambodia | 8 | 0.0% |
| Canada | 76 | 0.1% |
| Caribbean | 30 | 0.1% |
| Central America | 719 | 1.3% |
| China | 538 | 0.9% |
| Colombia | 338 | 0.6% |
| Costa Rica | 19 | 0.0% |
| Cuba | 12 | 0.0% |
| Eastern Africa | 128 | 0.2% |
| Eastern Asia | 1,432 | 2.5% |
| Eastern Europe | 290 | 0.5% |
| El Salvador | 61 | 0.1% |
| England | 17 | 0.0% |
| Europe | 847 | 1.5% |
| France | 15 | 0.0% |
| Germany | 260 | 0.5% |
| Guatemala | 82 | 0.1% |
| Honduras | 17 | 0.0% |
| India | 1,030 | 1.8% |
| Indonesia | 91 | 0.2% |
| Jamaica | 18 | 0.0% |
| Japan | 472 | 0.8% |
| Jordan | 12 | 0.0% |
| Kenya | 109 | 0.2% |
| Korea | 422 | 0.7% |
| Latin America | 1,451 | 2.5% |
| Lebanon | 7 | 0.0% |
| Mexico | 483 | 0.9% |
| Morocco | 142 | 0.3% |
| Nepal | 14 | 0.0% |
| Nigeria | 28 | 0.1% |
| Northern Africa | 142 | 0.3% |
| Northern Europe | 282 | 0.5% |
| Pakistan | 92 | 0.2% |
| Panama | 57 | 0.1% |
| Peru | 25 | 0.0% |
| Philippines | 45 | 0.1% |
| Romania | 34 | 0.1% |
| Russia | 168 | 0.3% |
| Saudi Arabia | 12 | 0.0% |
| Scotland | 25 | 0.0% |
| Singapore | 14 | 0.0% |
| South America | 702 | 1.2% |
| South Central Asia | 1,136 | 2.0% |
| South Eastern Asia | 487 | 0.9% |
| Syria | 47 | 0.1% |
| Taiwan | 80 | 0.1% |
| Thailand | 74 | 0.1% |
| Uganda | 19 | 0.0% |
| Ukraine | 74 | 0.1% |
| Venezuela | 238 | 0.4% |
| Vietnam | 255 | 0.4% |
| Western Africa | 28 | 0.1% |
| Western Asia | 78 | 0.1% |
| Western Europe | 275 | 0.5% | View All 59 Rows |
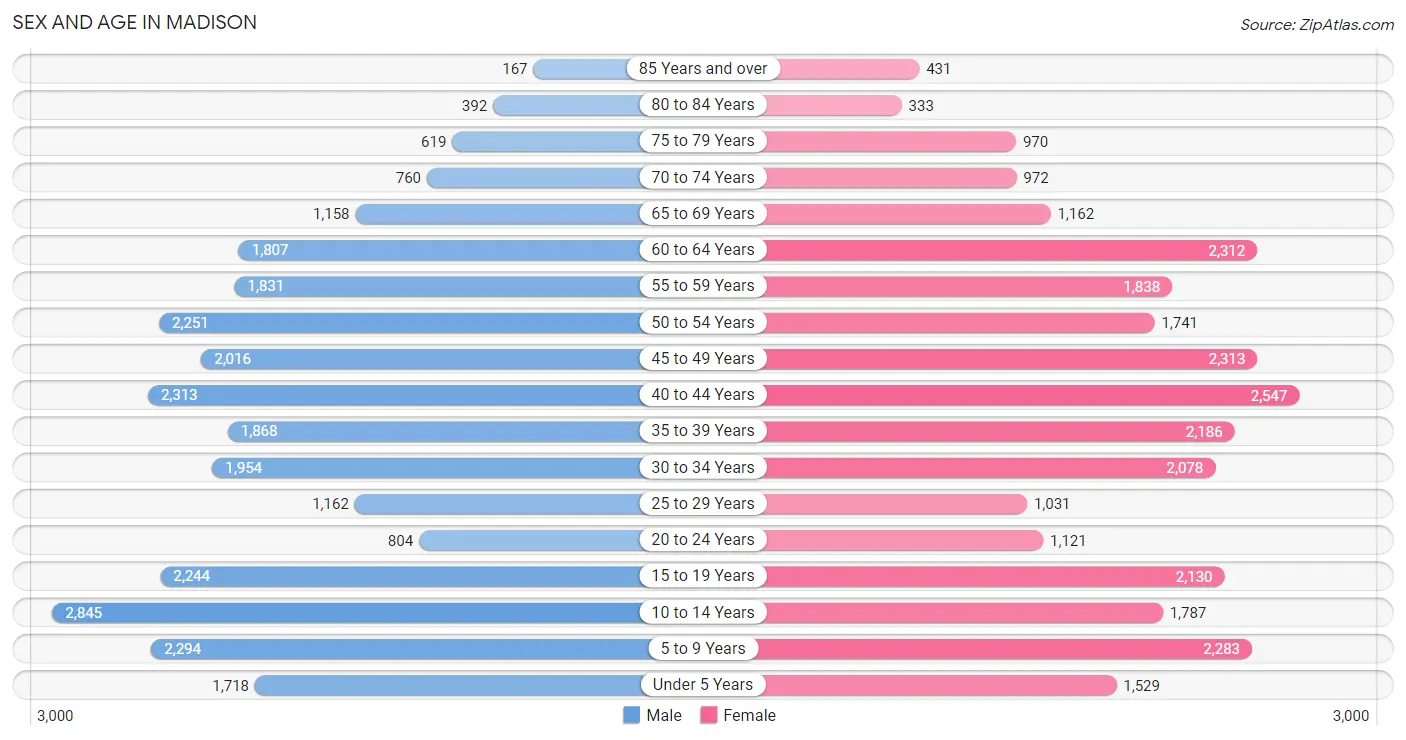
Sex and Age in Madison
Sex and Age in Madison
The most populous age groups in Madison are 10 to 14 Years (2,845 | 10.1%) for men and 40 to 44 Years (2,547 | 8.8%) for women.
| Age Bracket | Male | Female |
| Under 5 Years | 1,718 (6.1%) | 1,529 (5.3%) |
| 5 to 9 Years | 2,294 (8.1%) | 2,283 (7.9%) |
| 10 to 14 Years | 2,845 (10.1%) | 1,787 (6.2%) |
| 15 to 19 Years | 2,244 (8.0%) | 2,130 (7.4%) |
| 20 to 24 Years | 804 (2.9%) | 1,121 (3.9%) |
| 25 to 29 Years | 1,162 (4.1%) | 1,031 (3.6%) |
| 30 to 34 Years | 1,954 (6.9%) | 2,078 (7.2%) |
| 35 to 39 Years | 1,868 (6.6%) | 2,186 (7.6%) |
| 40 to 44 Years | 2,313 (8.2%) | 2,547 (8.8%) |
| 45 to 49 Years | 2,016 (7.1%) | 2,313 (8.0%) |
| 50 to 54 Years | 2,251 (8.0%) | 1,741 (6.0%) |
| 55 to 59 Years | 1,831 (6.5%) | 1,838 (6.4%) |
| 60 to 64 Years | 1,807 (6.4%) | 2,312 (8.0%) |
| 65 to 69 Years | 1,158 (4.1%) | 1,162 (4.0%) |
| 70 to 74 Years | 760 (2.7%) | 972 (3.4%) |
| 75 to 79 Years | 619 (2.2%) | 970 (3.4%) |
| 80 to 84 Years | 392 (1.4%) | 333 (1.2%) |
| 85 Years and over | 167 (0.6%) | 431 (1.5%) |
| Total | 28,203 (100.0%) | 28,764 (100.0%) |
Families and Households in Madison
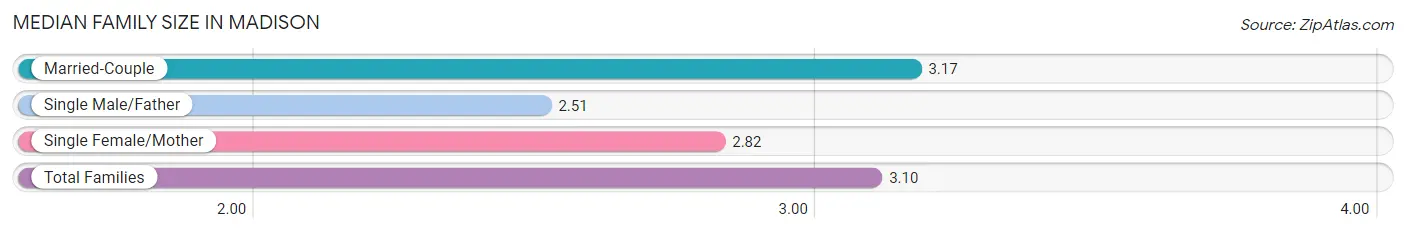
Median Family Size in Madison
The median family size in Madison is 3.10 persons per family, with married-couple families (13,182 | 84.4%) accounting for the largest median family size of 3.17 persons per family. On the other hand, single male/father families (645 | 4.1%) represent the smallest median family size with 2.51 persons per family.
| Family Type | # Families | Family Size |
| Married-Couple | 13,182 (84.4%) | 3.17 |
| Single Male/Father | 645 (4.1%) | 2.51 |
| Single Female/Mother | 1,795 (11.5%) | 2.82 |
| Total Families | 15,622 (100.0%) | 3.10 |
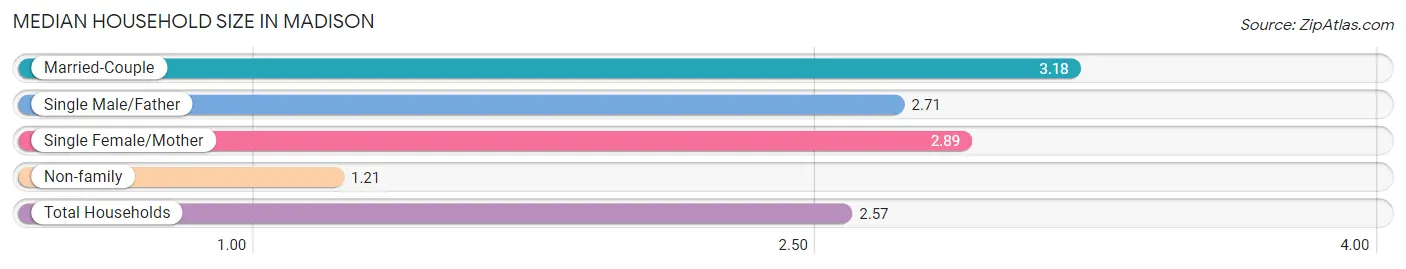
Median Household Size in Madison
The median household size in Madison is 2.57 persons per household, with married-couple households (13,182 | 59.7%) accounting for the largest median household size of 3.18 persons per household. non-family households (6,451 | 29.2%) represent the smallest median household size with 1.21 persons per household.
| Household Type | # Households | Household Size |
| Married-Couple | 13,182 (59.7%) | 3.18 |
| Single Male/Father | 645 (2.9%) | 2.71 |
| Single Female/Mother | 1,795 (8.1%) | 2.89 |
| Non-family | 6,451 (29.2%) | 1.21 |
| Total Households | 22,073 (100.0%) | 2.57 |
Household Size by Marriage Status in Madison
Out of a total of 22,073 households in Madison, 15,622 (70.8%) are family households, while 6,451 (29.2%) are nonfamily households. The most numerous type of family households are 2-person households, comprising 6,277, and the most common type of nonfamily households are 1-person households, comprising 5,194.
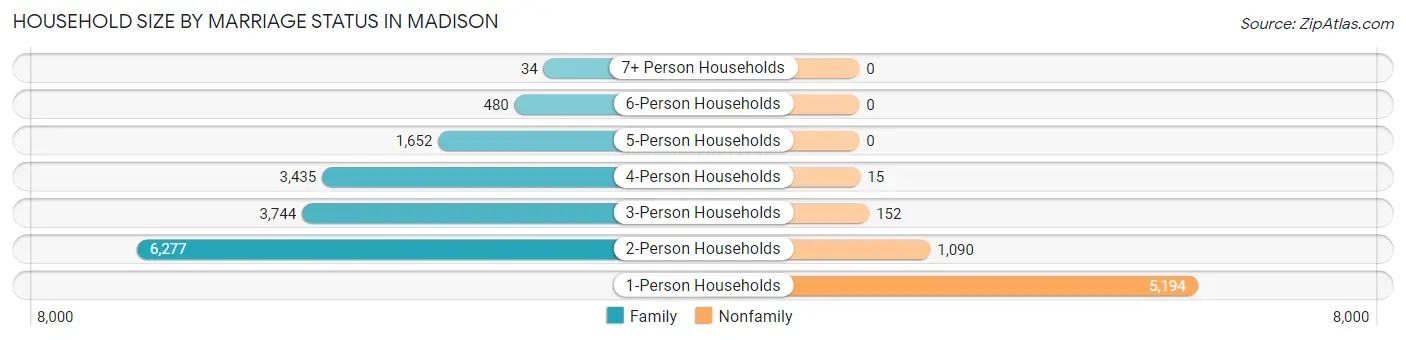
| Household Size | Family Households | Nonfamily Households |
| 1-Person Households | - | 5,194 (23.5%) |
| 2-Person Households | 6,277 (28.4%) | 1,090 (4.9%) |
| 3-Person Households | 3,744 (17.0%) | 152 (0.7%) |
| 4-Person Households | 3,435 (15.6%) | 15 (0.1%) |
| 5-Person Households | 1,652 (7.5%) | 0 (0.0%) |
| 6-Person Households | 480 (2.2%) | 0 (0.0%) |
| 7+ Person Households | 34 (0.2%) | 0 (0.0%) |
| Total | 15,622 (70.8%) | 6,451 (29.2%) |
Female Fertility in Madison
Fertility by Age in Madison
Average fertility rate in Madison is 49.0 births per 1,000 women. Women in the age bracket of 20 to 34 years have the highest fertility rate with 99.0 births per 1,000 women. Women in the age bracket of 20 to 34 years acount for 63.4% of all women with births.
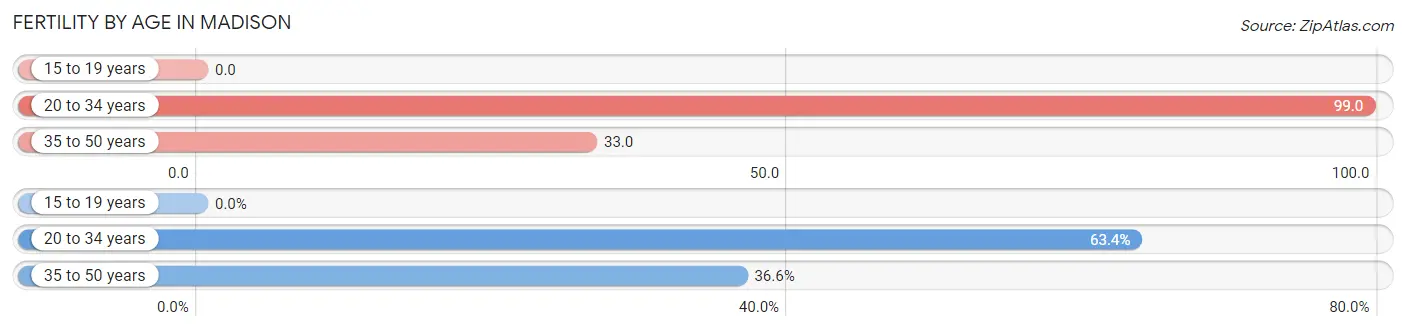
| Age Bracket | Women with Births | Births / 1,000 Women |
| 15 to 19 years | 0 (0.0%) | 0.0 |
| 20 to 34 years | 419 (63.4%) | 99.0 |
| 35 to 50 years | 242 (36.6%) | 33.0 |
| Total | 661 (100.0%) | 49.0 |
Fertility by Age by Marriage Status in Madison
96.2% of women with births (661) in Madison are married. The highest percentage of unmarried women with births falls into 20 to 34 years age bracket with 6.0% of them unmarried at the time of birth, while the lowest percentage of unmarried women with births belong to 35 to 50 years age bracket with 0.0% of them unmarried.
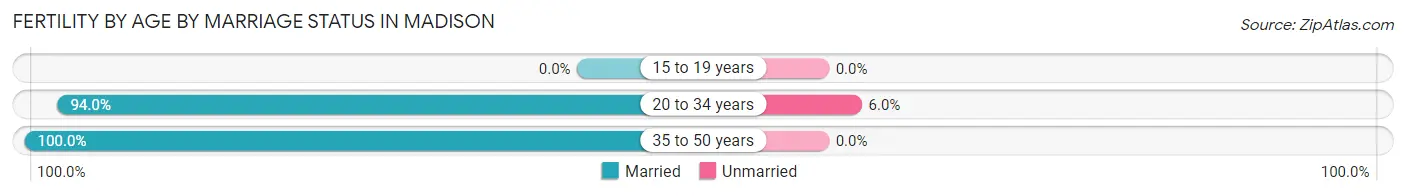
| Age Bracket | Married | Unmarried |
| 15 to 19 years | 0 (0.0%) | 0 (0.0%) |
| 20 to 34 years | 394 (94.0%) | 25 (6.0%) |
| 35 to 50 years | 242 (100.0%) | 0 (0.0%) |
| Total | 636 (96.2%) | 25 (3.8%) |
Fertility by Education in Madison
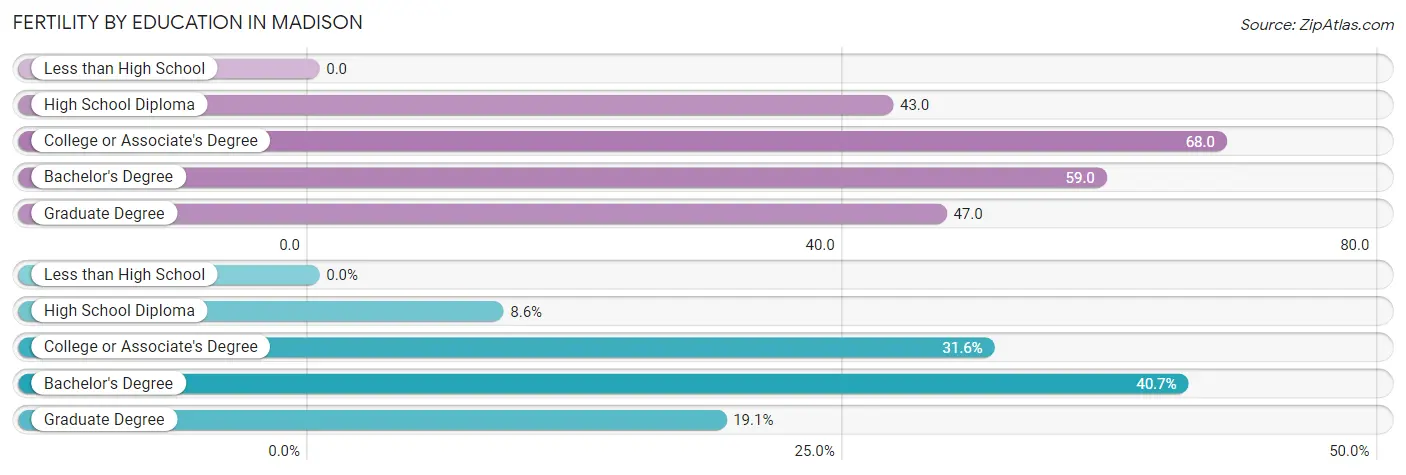
| Educational Attainment | Women with Births | Births / 1,000 Women |
| Less than High School | 0 (0.0%) | 0.0 |
| High School Diploma | 57 (8.6%) | 43.0 |
| College or Associate's Degree | 209 (31.6%) | 68.0 |
| Bachelor's Degree | 269 (40.7%) | 59.0 |
| Graduate Degree | 126 (19.1%) | 47.0 |
| Total | 661 (100.0%) | 49.0 |
Fertility by Education by Marriage Status in Madison
3.8% of women with births in Madison are unmarried. Women with the educational attainment of high school diploma are most likely to be married with 100.0% of them married at childbirth, while women with the educational attainment of college or associate's degree are least likely to be married with 12.0% of them unmarried at childbirth.
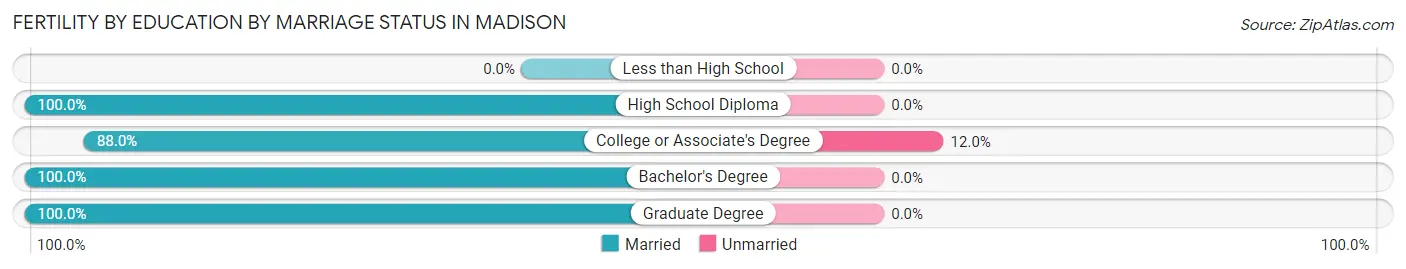
| Educational Attainment | Married | Unmarried |
| Less than High School | 0 (0.0%) | 0 (0.0%) |
| High School Diploma | 57 (100.0%) | 0 (0.0%) |
| College or Associate's Degree | 184 (88.0%) | 25 (12.0%) |
| Bachelor's Degree | 269 (100.0%) | 0 (0.0%) |
| Graduate Degree | 126 (100.0%) | 0 (0.0%) |
| Total | 636 (96.2%) | 25 (3.8%) |
Employment Characteristics in Madison
Employment by Class of Employer in Madison
Among the 26,839 employed individuals in Madison, private company employees (17,813 | 66.4%), federal government employees (3,796 | 14.1%), and not-for-profit organizations (2,126 | 7.9%) make up the most common classes of employment.
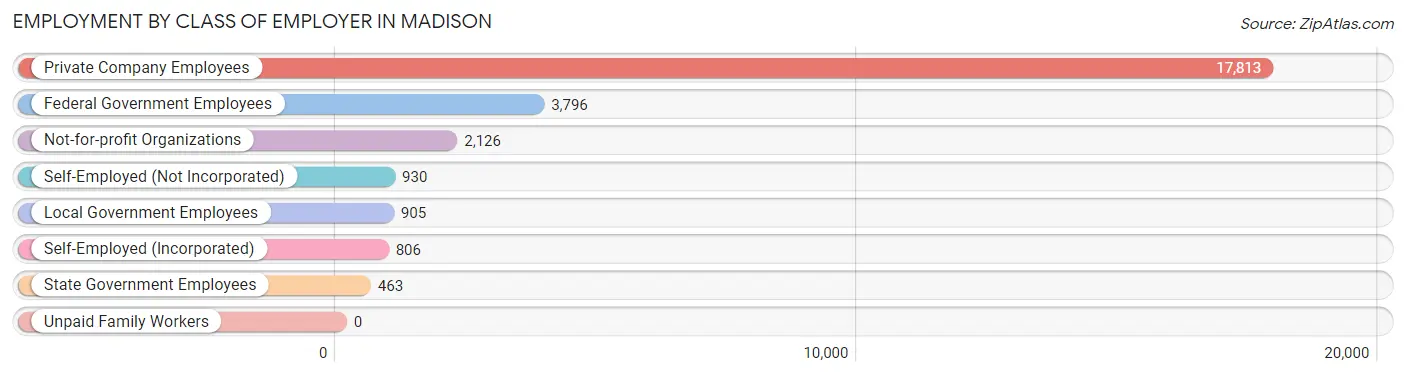
| Employer Class | # Employees | % Employees |
| Private Company Employees | 17,813 | 66.4% |
| Self-Employed (Incorporated) | 806 | 3.0% |
| Self-Employed (Not Incorporated) | 930 | 3.5% |
| Not-for-profit Organizations | 2,126 | 7.9% |
| Local Government Employees | 905 | 3.4% |
| State Government Employees | 463 | 1.7% |
| Federal Government Employees | 3,796 | 14.1% |
| Unpaid Family Workers | 0 | 0.0% |
| Total | 26,839 | 100.0% |
Employment Status by Age in Madison
According to the labor force statistics for Madison, out of the total population over 16 years of age (43,376), 65.0% or 28,194 individuals are in the labor force, with 3.0% or 846 of them unemployed. The age group with the highest labor force participation rate is 30 to 34 years, with 86.5% or 3,488 individuals in the labor force. Within the labor force, the 20 to 24 years age range has the highest percentage of unemployed individuals, with 7.1% or 106 of them being unemployed.
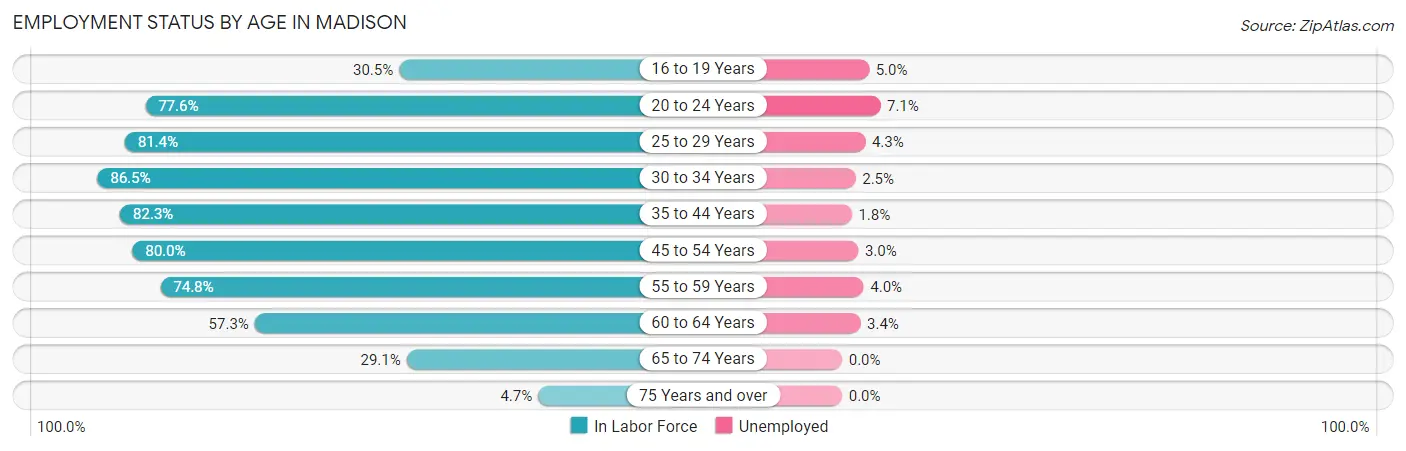
| Age Bracket | In Labor Force | Unemployed |
| 16 to 19 Years | 988 (30.5%) | 49 (5.0%) |
| 20 to 24 Years | 1,494 (77.6%) | 106 (7.1%) |
| 25 to 29 Years | 1,785 (81.4%) | 77 (4.3%) |
| 30 to 34 Years | 3,488 (86.5%) | 87 (2.5%) |
| 35 to 44 Years | 7,336 (82.3%) | 132 (1.8%) |
| 45 to 54 Years | 6,657 (80.0%) | 200 (3.0%) |
| 55 to 59 Years | 2,744 (74.8%) | 110 (4.0%) |
| 60 to 64 Years | 2,360 (57.3%) | 80 (3.4%) |
| 65 to 74 Years | 1,179 (29.1%) | 0 (0.0%) |
| 75 Years and over | 137 (4.7%) | 0 (0.0%) |
| Total | 28,194 (65.0%) | 846 (3.0%) |
Employment Status by Educational Attainment in Madison
According to labor force statistics for Madison, 78.0% of individuals (24,373) out of the total population between 25 and 64 years of age (31,248) are in the labor force, with 2.8% or 682 of them being unemployed. The group with the highest labor force participation rate are those with the educational attainment of bachelor's degree or higher, with 81.3% or 17,049 individuals in the labor force. Within the labor force, individuals with high school diploma education have the highest percentage of unemployment, with 4.0% or 87 of them being unemployed.
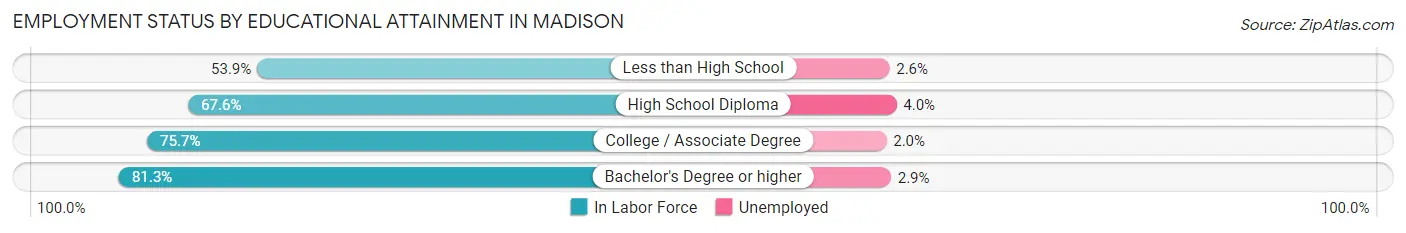
| Educational Attainment | In Labor Force | Unemployed |
| Less than High School | 464 (53.9%) | 22 (2.6%) |
| High School Diploma | 2,163 (67.6%) | 128 (4.0%) |
| College / Associate Degree | 4,706 (75.7%) | 124 (2.0%) |
| Bachelor's Degree or higher | 17,049 (81.3%) | 608 (2.9%) |
| Total | 24,373 (78.0%) | 875 (2.8%) |
Employment Occupations by Sex in Madison
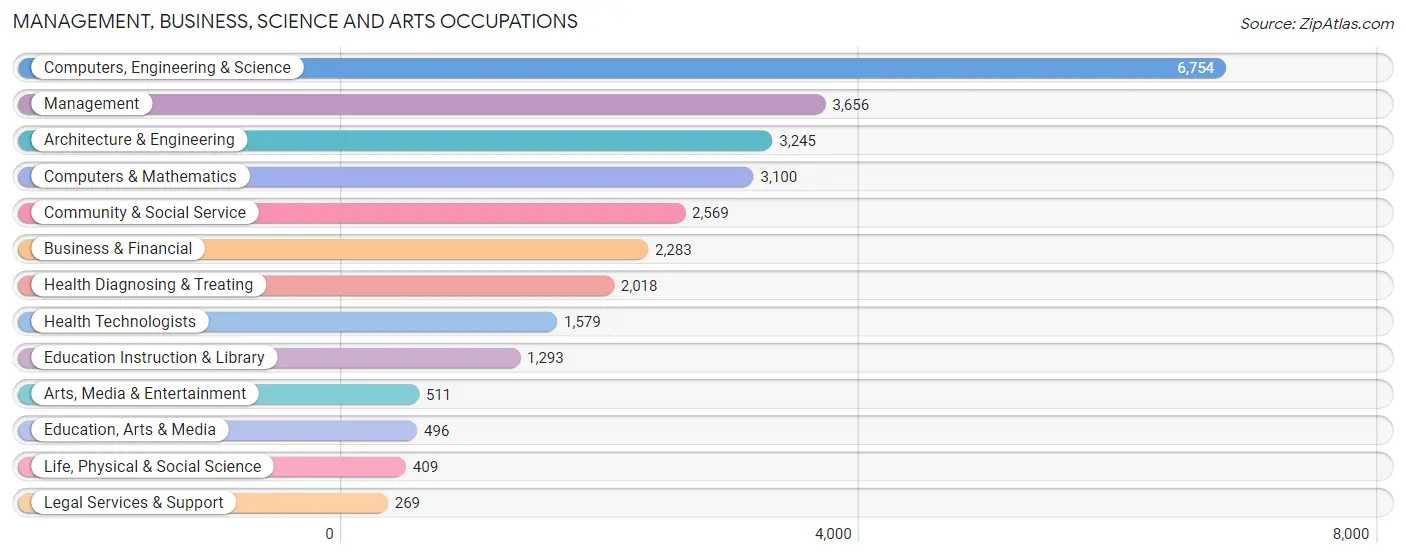
Management, Business, Science and Arts Occupations
The most common Management, Business, Science and Arts occupations in Madison are Computers, Engineering & Science (6,754 | 24.8%), Management (3,656 | 13.4%), Architecture & Engineering (3,245 | 11.9%), Computers & Mathematics (3,100 | 11.4%), and Community & Social Service (2,569 | 9.4%).
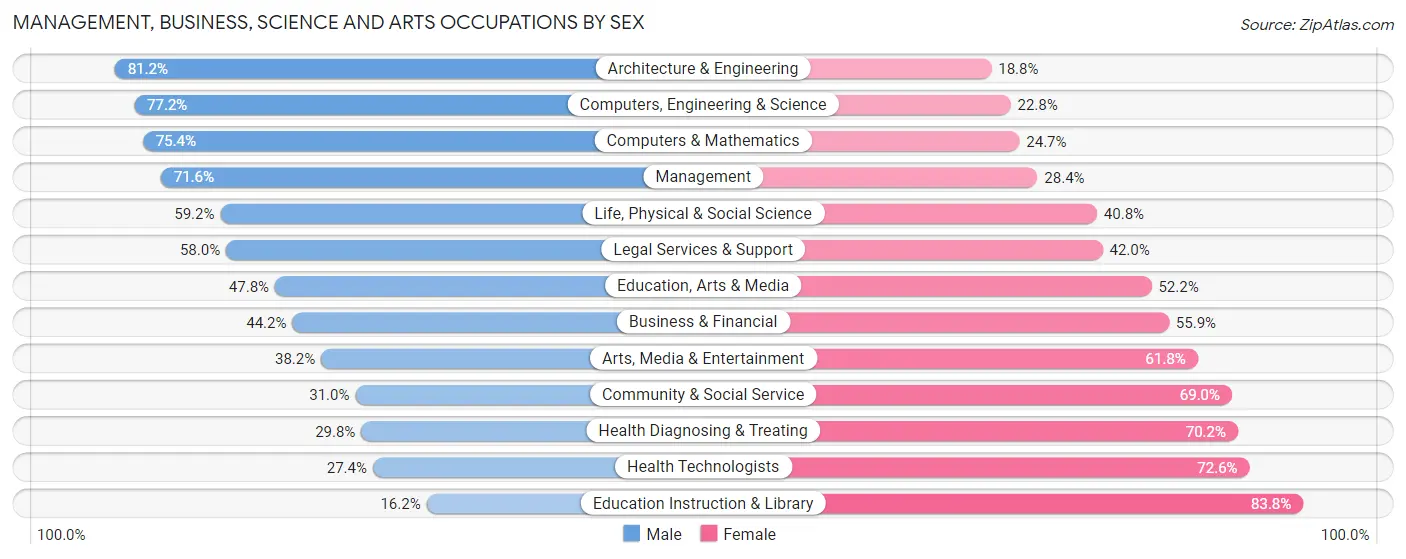
Management, Business, Science and Arts Occupations by Sex
Within the Management, Business, Science and Arts occupations in Madison, the most male-oriented occupations are Architecture & Engineering (81.2%), Computers, Engineering & Science (77.2%), and Computers & Mathematics (75.3%), while the most female-oriented occupations are Education Instruction & Library (83.8%), Health Technologists (72.6%), and Health Diagnosing & Treating (70.2%).
| Occupation | Male | Female |
| Management | 2,617 (71.6%) | 1,039 (28.4%) |
| Business & Financial | 1,008 (44.2%) | 1,275 (55.8%) |
| Computers, Engineering & Science | 5,213 (77.2%) | 1,541 (22.8%) |
| Computers & Mathematics | 2,336 (75.3%) | 764 (24.6%) |
| Architecture & Engineering | 2,635 (81.2%) | 610 (18.8%) |
| Life, Physical & Social Science | 242 (59.2%) | 167 (40.8%) |
| Community & Social Service | 797 (31.0%) | 1,772 (69.0%) |
| Education, Arts & Media | 237 (47.8%) | 259 (52.2%) |
| Legal Services & Support | 156 (58.0%) | 113 (42.0%) |
| Education Instruction & Library | 209 (16.2%) | 1,084 (83.8%) |
| Arts, Media & Entertainment | 195 (38.2%) | 316 (61.8%) |
| Health Diagnosing & Treating | 601 (29.8%) | 1,417 (70.2%) |
| Health Technologists | 432 (27.4%) | 1,147 (72.6%) |
| Total (Category) | 10,236 (59.2%) | 7,044 (40.8%) |
| Total (Overall) | 15,586 (57.2%) | 11,656 (42.8%) |
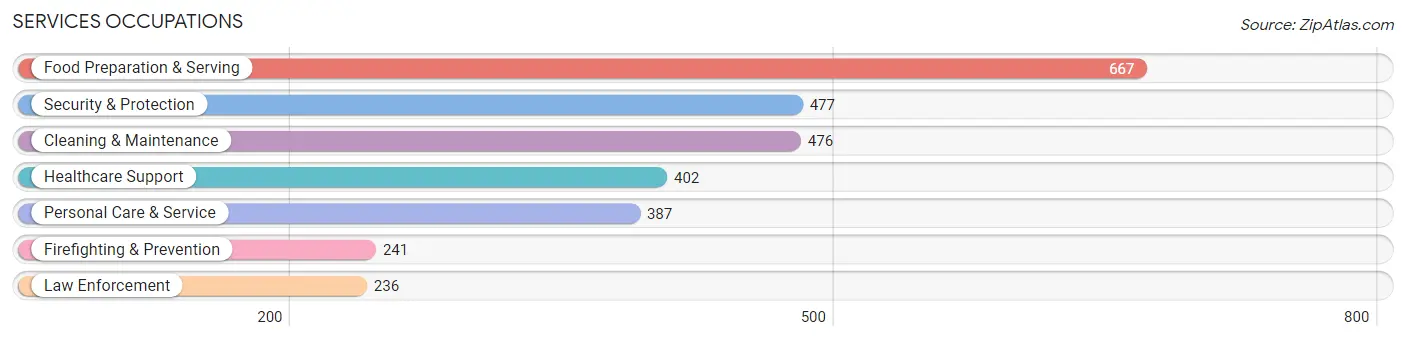
Services Occupations
The most common Services occupations in Madison are Food Preparation & Serving (667 | 2.5%), Security & Protection (477 | 1.8%), Cleaning & Maintenance (476 | 1.8%), Healthcare Support (402 | 1.5%), and Personal Care & Service (387 | 1.4%).
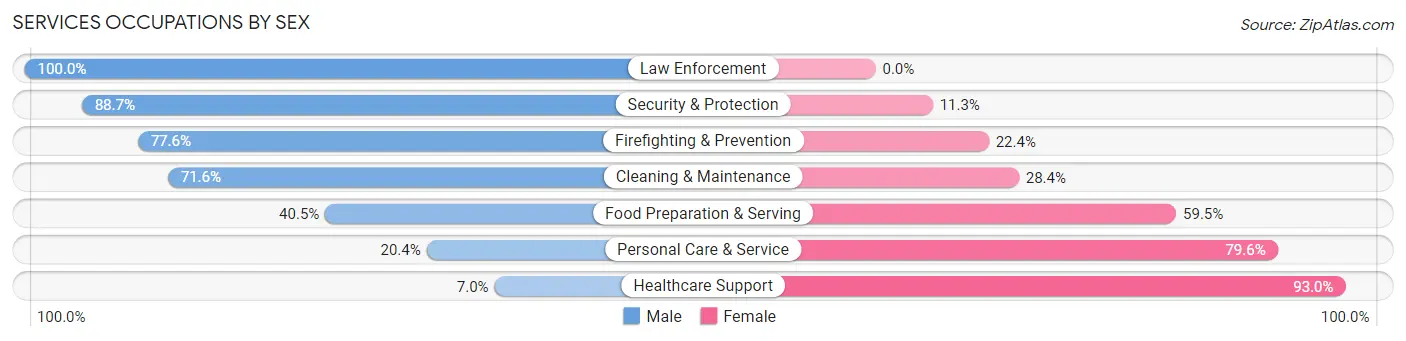
Services Occupations by Sex
Within the Services occupations in Madison, the most male-oriented occupations are Law Enforcement (100.0%), Security & Protection (88.7%), and Firefighting & Prevention (77.6%), while the most female-oriented occupations are Healthcare Support (93.0%), Personal Care & Service (79.6%), and Food Preparation & Serving (59.5%).
| Occupation | Male | Female |
| Healthcare Support | 28 (7.0%) | 374 (93.0%) |
| Security & Protection | 423 (88.7%) | 54 (11.3%) |
| Firefighting & Prevention | 187 (77.6%) | 54 (22.4%) |
| Law Enforcement | 236 (100.0%) | 0 (0.0%) |
| Food Preparation & Serving | 270 (40.5%) | 397 (59.5%) |
| Cleaning & Maintenance | 341 (71.6%) | 135 (28.4%) |
| Personal Care & Service | 79 (20.4%) | 308 (79.6%) |
| Total (Category) | 1,141 (47.4%) | 1,268 (52.6%) |
| Total (Overall) | 15,586 (57.2%) | 11,656 (42.8%) |
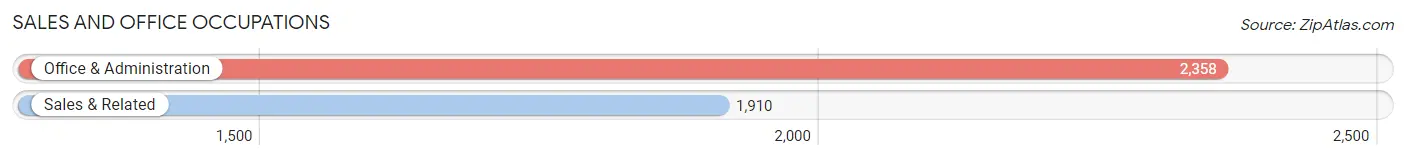
Sales and Office Occupations
The most common Sales and Office occupations in Madison are Office & Administration (2,358 | 8.7%), and Sales & Related (1,910 | 7.0%).
Sales and Office Occupations by Sex
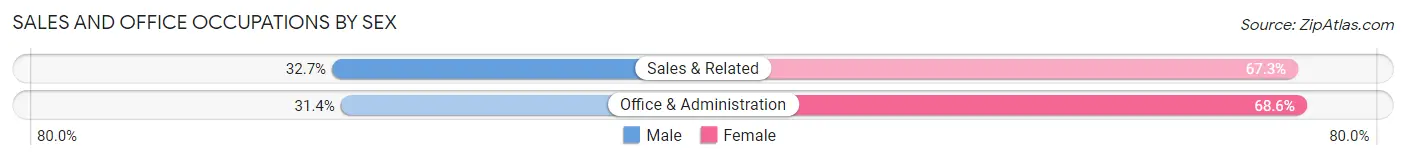
| Occupation | Male | Female |
| Sales & Related | 625 (32.7%) | 1,285 (67.3%) |
| Office & Administration | 740 (31.4%) | 1,618 (68.6%) |
| Total (Category) | 1,365 (32.0%) | 2,903 (68.0%) |
| Total (Overall) | 15,586 (57.2%) | 11,656 (42.8%) |
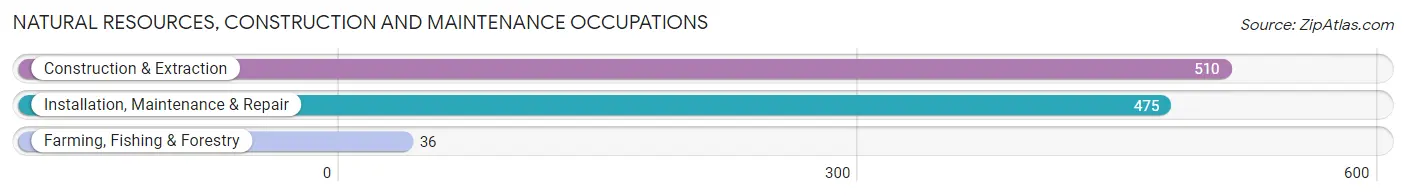
Natural Resources, Construction and Maintenance Occupations
The most common Natural Resources, Construction and Maintenance occupations in Madison are Construction & Extraction (510 | 1.9%), Installation, Maintenance & Repair (475 | 1.7%), and Farming, Fishing & Forestry (36 | 0.1%).
Natural Resources, Construction and Maintenance Occupations by Sex
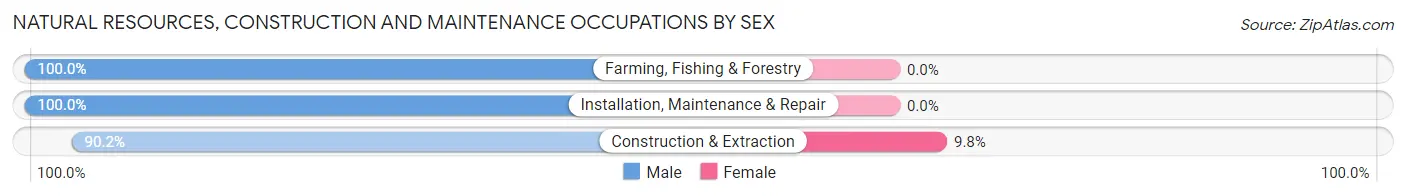
| Occupation | Male | Female |
| Farming, Fishing & Forestry | 36 (100.0%) | 0 (0.0%) |
| Construction & Extraction | 460 (90.2%) | 50 (9.8%) |
| Installation, Maintenance & Repair | 475 (100.0%) | 0 (0.0%) |
| Total (Category) | 971 (95.1%) | 50 (4.9%) |
| Total (Overall) | 15,586 (57.2%) | 11,656 (42.8%) |
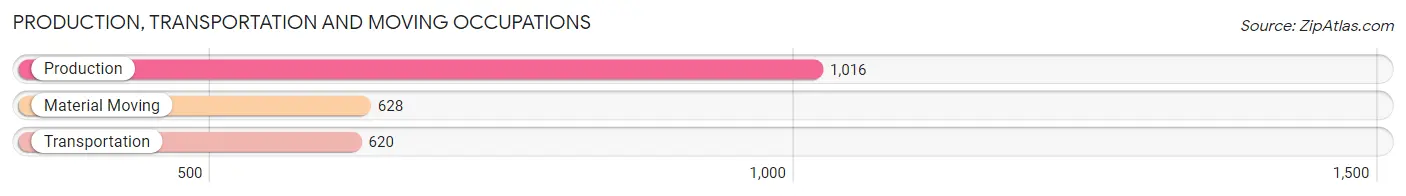
Production, Transportation and Moving Occupations
The most common Production, Transportation and Moving occupations in Madison are Production (1,016 | 3.7%), Material Moving (628 | 2.3%), and Transportation (620 | 2.3%).
Production, Transportation and Moving Occupations by Sex
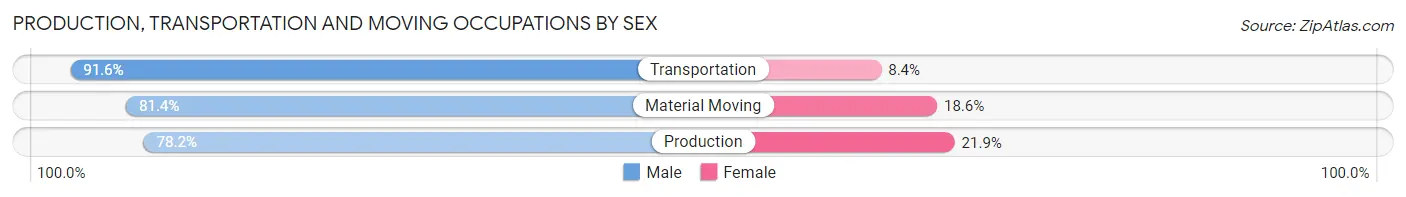
| Occupation | Male | Female |
| Production | 794 (78.1%) | 222 (21.8%) |
| Transportation | 568 (91.6%) | 52 (8.4%) |
| Material Moving | 511 (81.4%) | 117 (18.6%) |
| Total (Category) | 1,873 (82.7%) | 391 (17.3%) |
| Total (Overall) | 15,586 (57.2%) | 11,656 (42.8%) |
Employment Industries by Sex in Madison
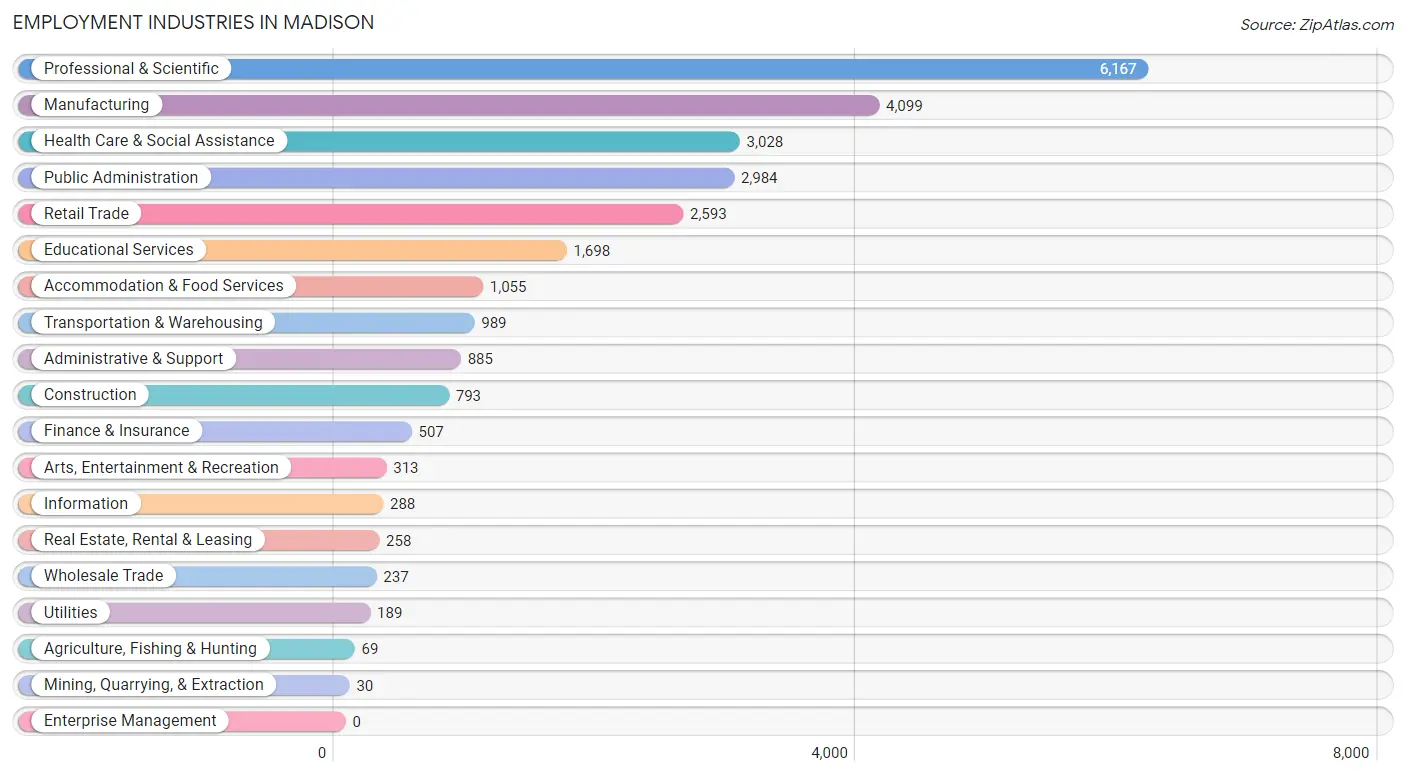
Employment Industries in Madison
The major employment industries in Madison include Professional & Scientific (6,167 | 22.6%), Manufacturing (4,099 | 15.0%), Health Care & Social Assistance (3,028 | 11.1%), Public Administration (2,984 | 11.0%), and Retail Trade (2,593 | 9.5%).
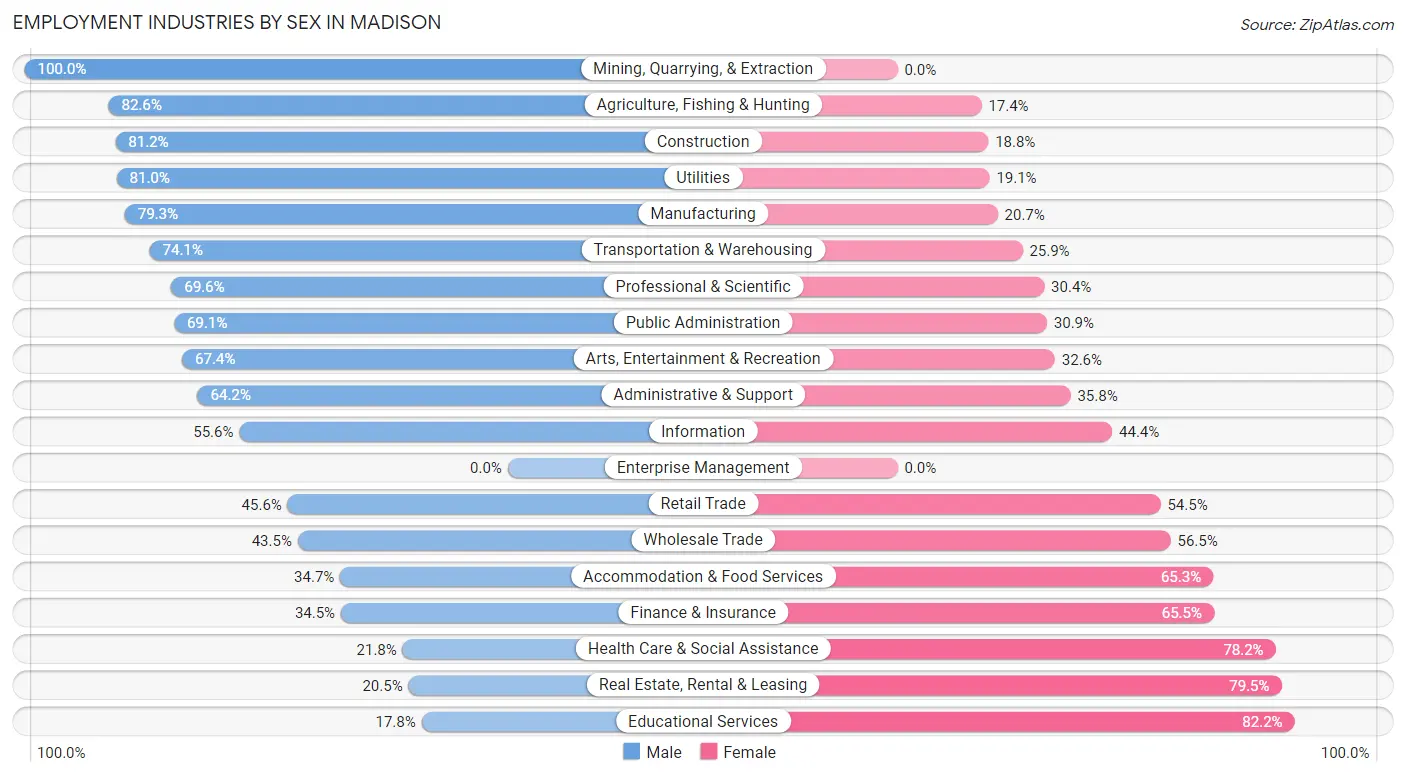
Employment Industries by Sex in Madison
The Madison industries that see more men than women are Mining, Quarrying, & Extraction (100.0%), Agriculture, Fishing & Hunting (82.6%), and Construction (81.2%), whereas the industries that tend to have a higher number of women are Educational Services (82.2%), Real Estate, Rental & Leasing (79.5%), and Health Care & Social Assistance (78.2%).
| Industry | Male | Female |
| Agriculture, Fishing & Hunting | 57 (82.6%) | 12 (17.4%) |
| Mining, Quarrying, & Extraction | 30 (100.0%) | 0 (0.0%) |
| Construction | 644 (81.2%) | 149 (18.8%) |
| Manufacturing | 3,249 (79.3%) | 850 (20.7%) |
| Wholesale Trade | 103 (43.5%) | 134 (56.5%) |
| Retail Trade | 1,181 (45.6%) | 1,412 (54.4%) |
| Transportation & Warehousing | 733 (74.1%) | 256 (25.9%) |
| Utilities | 153 (80.9%) | 36 (19.1%) |
| Information | 160 (55.6%) | 128 (44.4%) |
| Finance & Insurance | 175 (34.5%) | 332 (65.5%) |
| Real Estate, Rental & Leasing | 53 (20.5%) | 205 (79.5%) |
| Professional & Scientific | 4,294 (69.6%) | 1,873 (30.4%) |
| Enterprise Management | 0 (0.0%) | 0 (0.0%) |
| Administrative & Support | 568 (64.2%) | 317 (35.8%) |
| Educational Services | 303 (17.8%) | 1,395 (82.2%) |
| Health Care & Social Assistance | 659 (21.8%) | 2,369 (78.2%) |
| Arts, Entertainment & Recreation | 211 (67.4%) | 102 (32.6%) |
| Accommodation & Food Services | 366 (34.7%) | 689 (65.3%) |
| Public Administration | 2,061 (69.1%) | 923 (30.9%) |
| Total | 15,586 (57.2%) | 11,656 (42.8%) |
Education in Madison
School Enrollment in Madison
The most common levels of schooling among the 16,976 students in Madison are high school (4,272 | 25.2%), elementary school (3,807 | 22.4%), and middle school (3,700 | 21.8%).
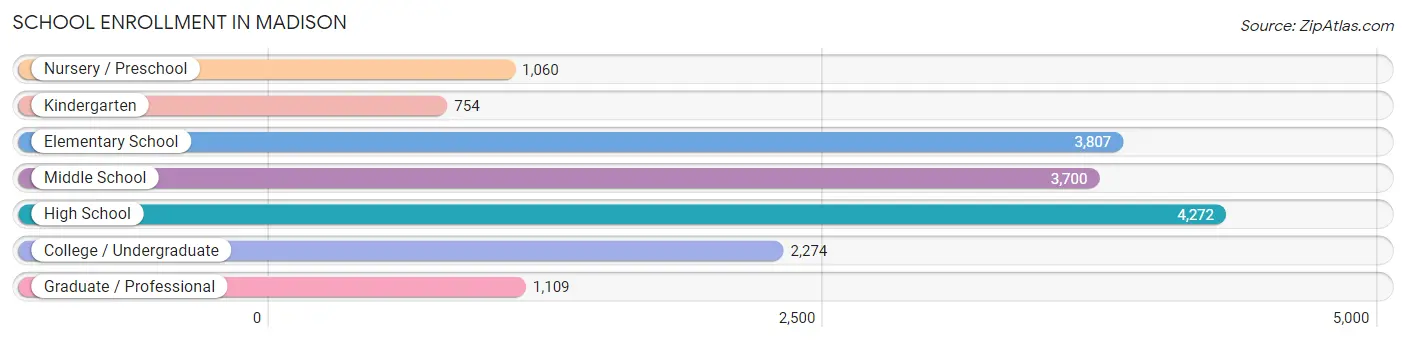
| School Level | # Students | % Students |
| Nursery / Preschool | 1,060 | 6.2% |
| Kindergarten | 754 | 4.4% |
| Elementary School | 3,807 | 22.4% |
| Middle School | 3,700 | 21.8% |
| High School | 4,272 | 25.2% |
| College / Undergraduate | 2,274 | 13.4% |
| Graduate / Professional | 1,109 | 6.5% |
| Total | 16,976 | 100.0% |
School Enrollment by Age by Funding Source in Madison
Out of a total of 16,976 students who are enrolled in schools in Madison, 2,411 (14.2%) attend a private institution, while the remaining 14,565 (85.8%) are enrolled in public schools. The age group of 3 to 4 year olds has the highest likelihood of being enrolled in private schools, with 388 (47.1% in the age bracket) enrolled. Conversely, the age group of 15 to 17 year olds has the lowest likelihood of being enrolled in a private school, with 3,182 (95.4% in the age bracket) attending a public institution.
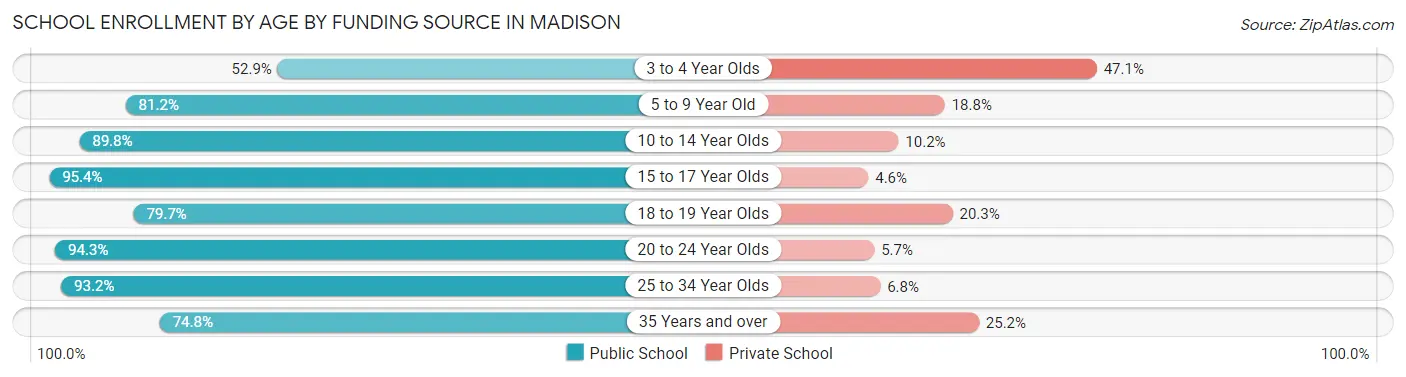
| Age Bracket | Public School | Private School |
| 3 to 4 Year Olds | 435 (52.9%) | 388 (47.1%) |
| 5 to 9 Year Old | 3,543 (81.2%) | 822 (18.8%) |
| 10 to 14 Year Olds | 4,146 (89.8%) | 471 (10.2%) |
| 15 to 17 Year Olds | 3,182 (95.4%) | 153 (4.6%) |
| 18 to 19 Year Olds | 739 (79.7%) | 188 (20.3%) |
| 20 to 24 Year Olds | 1,027 (94.3%) | 62 (5.7%) |
| 25 to 34 Year Olds | 671 (93.2%) | 49 (6.8%) |
| 35 Years and over | 823 (74.8%) | 277 (25.2%) |
| Total | 14,565 (85.8%) | 2,411 (14.2%) |
Educational Attainment by Field of Study in Madison
Engineering (5,894 | 22.7%), business (5,511 | 21.2%), computers & mathematics (2,331 | 9.0%), science & technology (2,155 | 8.3%), and education (2,133 | 8.2%) are the most common fields of study among 25,965 individuals in Madison who have obtained a bachelor's degree or higher.
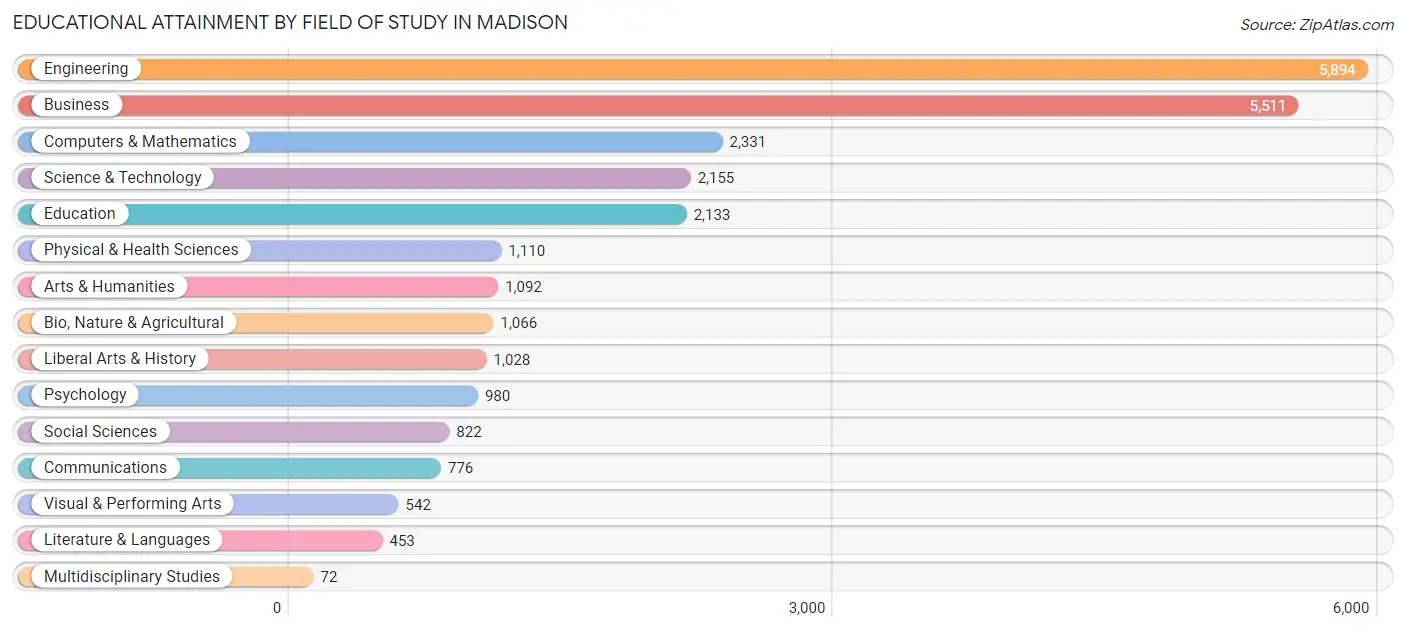
| Field of Study | # Graduates | % Graduates |
| Computers & Mathematics | 2,331 | 9.0% |
| Bio, Nature & Agricultural | 1,066 | 4.1% |
| Physical & Health Sciences | 1,110 | 4.3% |
| Psychology | 980 | 3.8% |
| Social Sciences | 822 | 3.2% |
| Engineering | 5,894 | 22.7% |
| Multidisciplinary Studies | 72 | 0.3% |
| Science & Technology | 2,155 | 8.3% |
| Business | 5,511 | 21.2% |
| Education | 2,133 | 8.2% |
| Literature & Languages | 453 | 1.7% |
| Liberal Arts & History | 1,028 | 4.0% |
| Visual & Performing Arts | 542 | 2.1% |
| Communications | 776 | 3.0% |
| Arts & Humanities | 1,092 | 4.2% |
| Total | 25,965 | 100.0% |
Transportation & Commute in Madison
Vehicle Availability by Sex in Madison
The most prevalent vehicle ownership categories in Madison are males with 2 vehicles (7,766, accounting for 50.8%) and females with 2 vehicles (5,094, making up 67.2%).
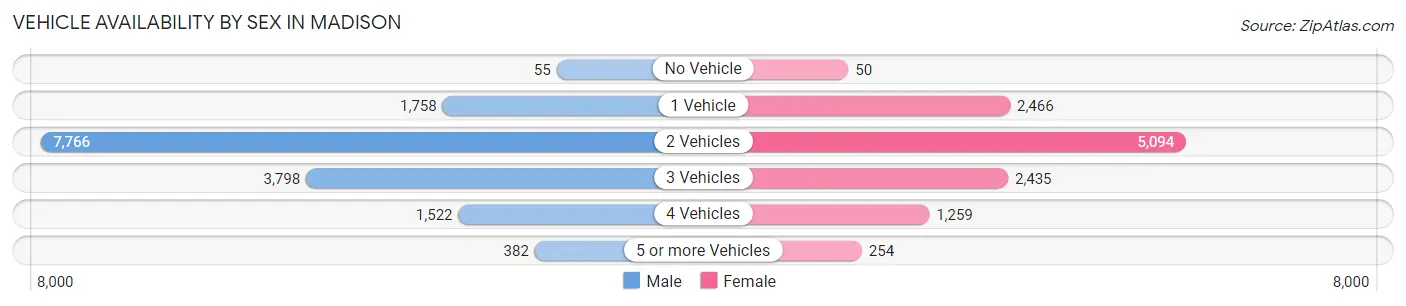
| Vehicles Available | Male | Female |
| No Vehicle | 55 (0.4%) | 50 (0.4%) |
| 1 Vehicle | 1,758 (11.5%) | 2,466 (21.3%) |
| 2 Vehicles | 7,766 (50.8%) | 5,094 (44.1%) |
| 3 Vehicles | 3,798 (24.8%) | 2,435 (21.1%) |
| 4 Vehicles | 1,522 (10.0%) | 1,259 (10.9%) |
| 5 or more Vehicles | 382 (2.5%) | 254 (2.2%) |
| Total | 15,281 (100.0%) | 11,558 (100.0%) |
Commute Time in Madison
The most frequently occuring commute durations in Madison are 20 to 24 minutes (5,439 commuters, 24.2%), 15 to 19 minutes (4,799 commuters, 21.4%), and 30 to 34 minutes (3,172 commuters, 14.1%).
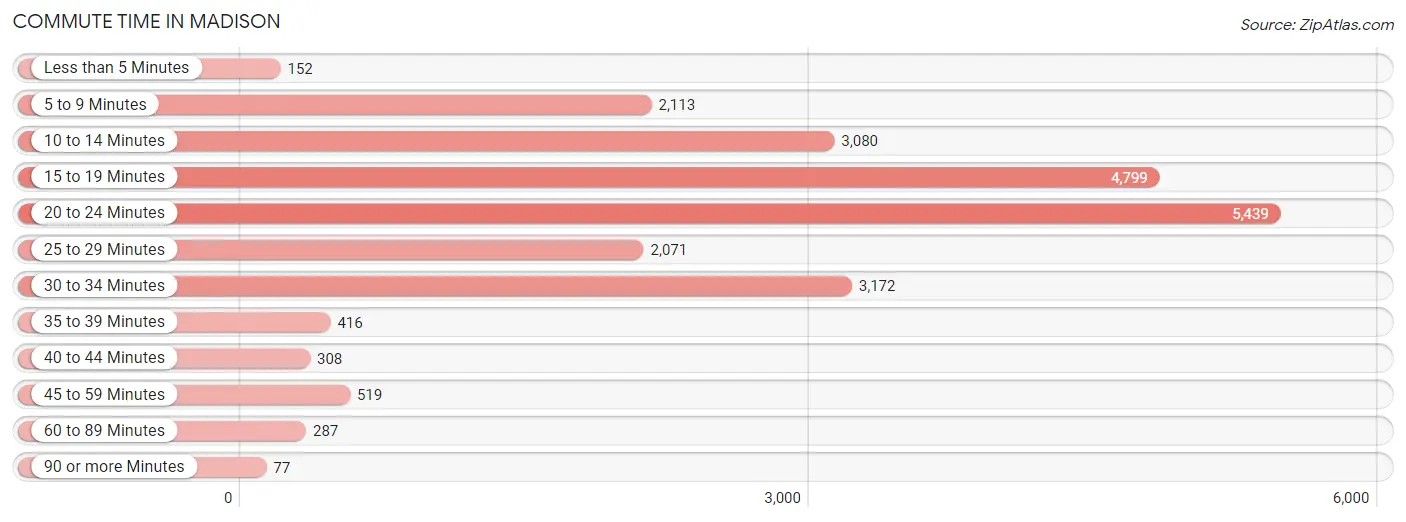
| Commute Time | # Commuters | % Commuters |
| Less than 5 Minutes | 152 | 0.7% |
| 5 to 9 Minutes | 2,113 | 9.4% |
| 10 to 14 Minutes | 3,080 | 13.7% |
| 15 to 19 Minutes | 4,799 | 21.4% |
| 20 to 24 Minutes | 5,439 | 24.2% |
| 25 to 29 Minutes | 2,071 | 9.2% |
| 30 to 34 Minutes | 3,172 | 14.1% |
| 35 to 39 Minutes | 416 | 1.8% |
| 40 to 44 Minutes | 308 | 1.4% |
| 45 to 59 Minutes | 519 | 2.3% |
| 60 to 89 Minutes | 287 | 1.3% |
| 90 or more Minutes | 77 | 0.3% |
Commute Time by Sex in Madison
The most common commute times in Madison are 20 to 24 minutes (3,223 commuters, 25.1%) for males and 20 to 24 minutes (2,216 commuters, 23.1%) for females.
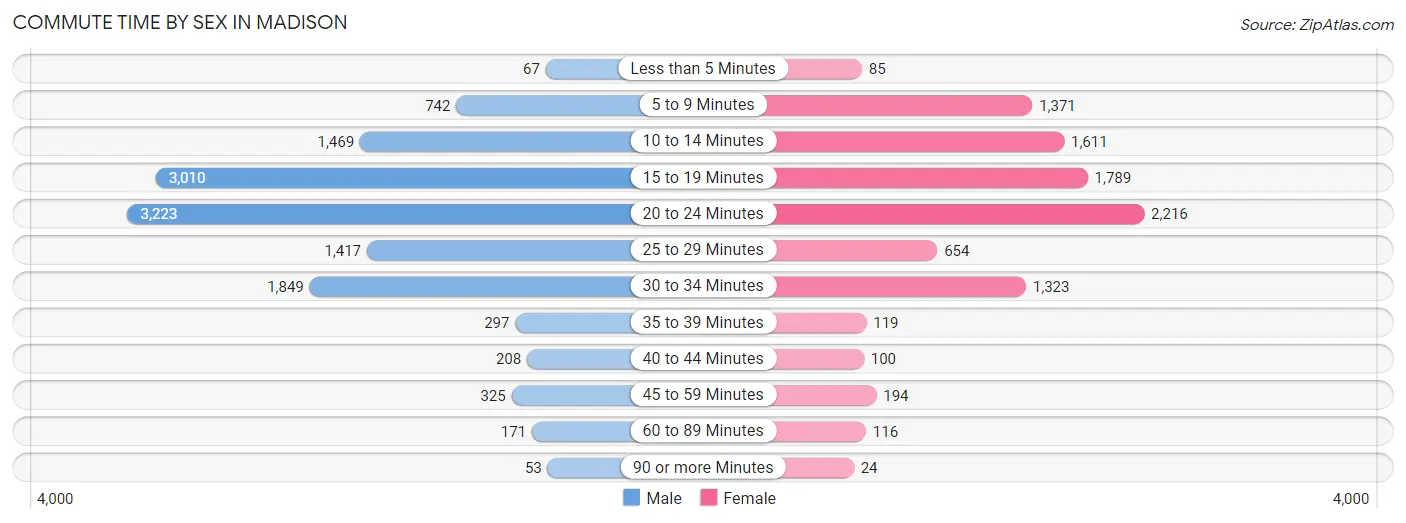
| Commute Time | Male | Female |
| Less than 5 Minutes | 67 (0.5%) | 85 (0.9%) |
| 5 to 9 Minutes | 742 (5.8%) | 1,371 (14.3%) |
| 10 to 14 Minutes | 1,469 (11.5%) | 1,611 (16.8%) |
| 15 to 19 Minutes | 3,010 (23.5%) | 1,789 (18.6%) |
| 20 to 24 Minutes | 3,223 (25.1%) | 2,216 (23.1%) |
| 25 to 29 Minutes | 1,417 (11.0%) | 654 (6.8%) |
| 30 to 34 Minutes | 1,849 (14.4%) | 1,323 (13.8%) |
| 35 to 39 Minutes | 297 (2.3%) | 119 (1.2%) |
| 40 to 44 Minutes | 208 (1.6%) | 100 (1.0%) |
| 45 to 59 Minutes | 325 (2.5%) | 194 (2.0%) |
| 60 to 89 Minutes | 171 (1.3%) | 116 (1.2%) |
| 90 or more Minutes | 53 (0.4%) | 24 (0.3%) |
Time of Departure to Work by Sex in Madison
The most frequent times of departure to work in Madison are 7:00 AM to 7:29 AM (2,422, 18.9%) for males and 7:00 AM to 7:29 AM (1,624, 16.9%) for females.
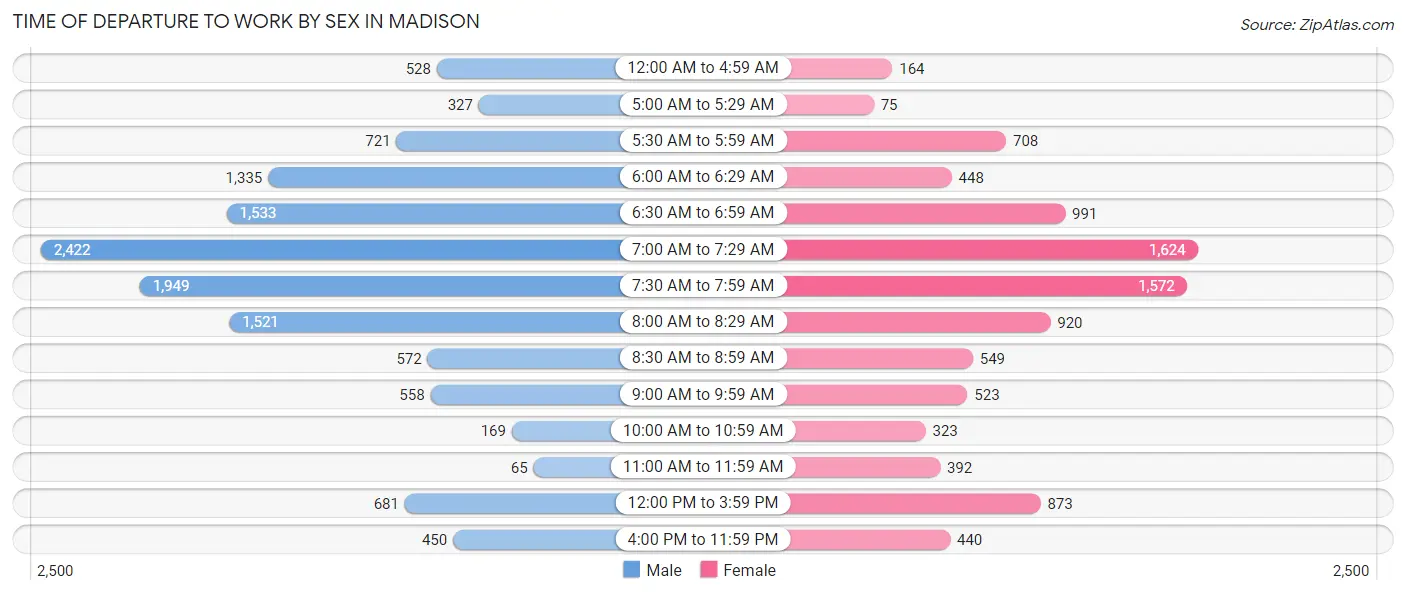
| Time of Departure | Male | Female |
| 12:00 AM to 4:59 AM | 528 (4.1%) | 164 (1.7%) |
| 5:00 AM to 5:29 AM | 327 (2.5%) | 75 (0.8%) |
| 5:30 AM to 5:59 AM | 721 (5.6%) | 708 (7.4%) |
| 6:00 AM to 6:29 AM | 1,335 (10.4%) | 448 (4.7%) |
| 6:30 AM to 6:59 AM | 1,533 (11.9%) | 991 (10.3%) |
| 7:00 AM to 7:29 AM | 2,422 (18.9%) | 1,624 (16.9%) |
| 7:30 AM to 7:59 AM | 1,949 (15.2%) | 1,572 (16.4%) |
| 8:00 AM to 8:29 AM | 1,521 (11.8%) | 920 (9.6%) |
| 8:30 AM to 8:59 AM | 572 (4.5%) | 549 (5.7%) |
| 9:00 AM to 9:59 AM | 558 (4.3%) | 523 (5.4%) |
| 10:00 AM to 10:59 AM | 169 (1.3%) | 323 (3.4%) |
| 11:00 AM to 11:59 AM | 65 (0.5%) | 392 (4.1%) |
| 12:00 PM to 3:59 PM | 681 (5.3%) | 873 (9.1%) |
| 4:00 PM to 11:59 PM | 450 (3.5%) | 440 (4.6%) |
| Total | 12,831 (100.0%) | 9,602 (100.0%) |
Housing Occupancy in Madison
Occupancy by Ownership in Madison
Of the total 22,073 dwellings in Madison, owner-occupied units account for 16,506 (74.8%), while renter-occupied units make up 5,567 (25.2%).
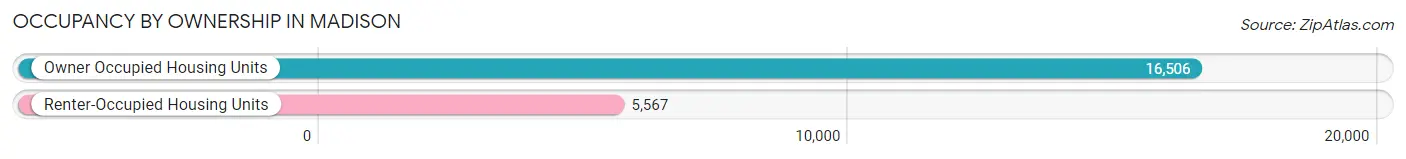
| Occupancy | # Housing Units | % Housing Units |
| Owner Occupied Housing Units | 16,506 | 74.8% |
| Renter-Occupied Housing Units | 5,567 | 25.2% |
| Total Occupied Housing Units | 22,073 | 100.0% |
Occupancy by Household Size in Madison
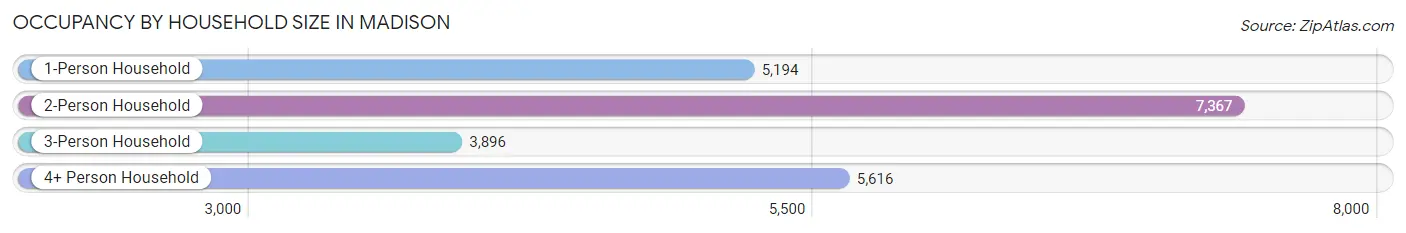
| Household Size | # Housing Units | % Housing Units |
| 1-Person Household | 5,194 | 23.5% |
| 2-Person Household | 7,367 | 33.4% |
| 3-Person Household | 3,896 | 17.6% |
| 4+ Person Household | 5,616 | 25.4% |
| Total Housing Units | 22,073 | 100.0% |
Occupancy by Ownership by Household Size in Madison
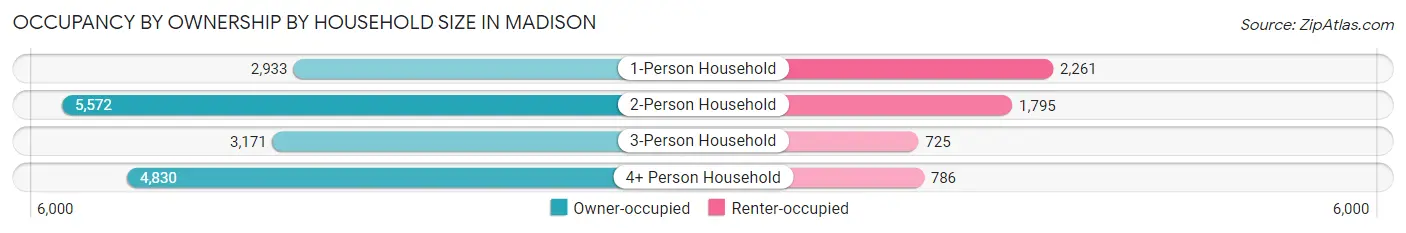
| Household Size | Owner-occupied | Renter-occupied |
| 1-Person Household | 2,933 (56.5%) | 2,261 (43.5%) |
| 2-Person Household | 5,572 (75.6%) | 1,795 (24.4%) |
| 3-Person Household | 3,171 (81.4%) | 725 (18.6%) |
| 4+ Person Household | 4,830 (86.0%) | 786 (14.0%) |
| Total Housing Units | 16,506 (74.8%) | 5,567 (25.2%) |
Occupancy by Educational Attainment in Madison
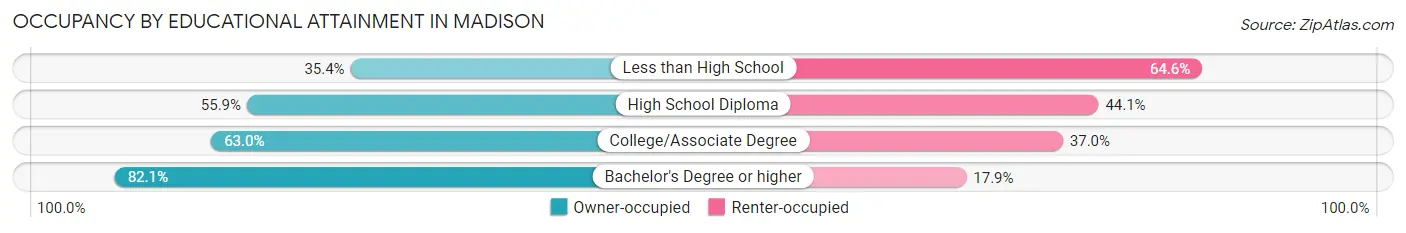
| Household Size | Owner-occupied | Renter-occupied |
| Less than High School | 194 (35.4%) | 354 (64.6%) |
| High School Diploma | 1,367 (55.9%) | 1,077 (44.1%) |
| College/Associate Degree | 2,384 (63.0%) | 1,401 (37.0%) |
| Bachelor's Degree or higher | 12,561 (82.1%) | 2,735 (17.9%) |
Occupancy by Age of Householder in Madison
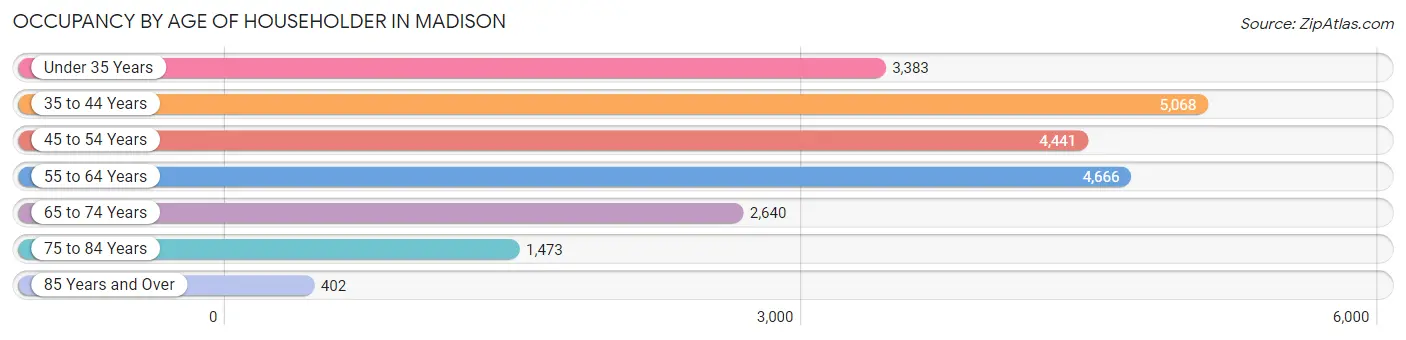
| Age Bracket | # Households | % Households |
| Under 35 Years | 3,383 | 15.3% |
| 35 to 44 Years | 5,068 | 23.0% |
| 45 to 54 Years | 4,441 | 20.1% |
| 55 to 64 Years | 4,666 | 21.1% |
| 65 to 74 Years | 2,640 | 12.0% |
| 75 to 84 Years | 1,473 | 6.7% |
| 85 Years and Over | 402 | 1.8% |
| Total | 22,073 | 100.0% |
Housing Finances in Madison
Median Income by Occupancy in Madison
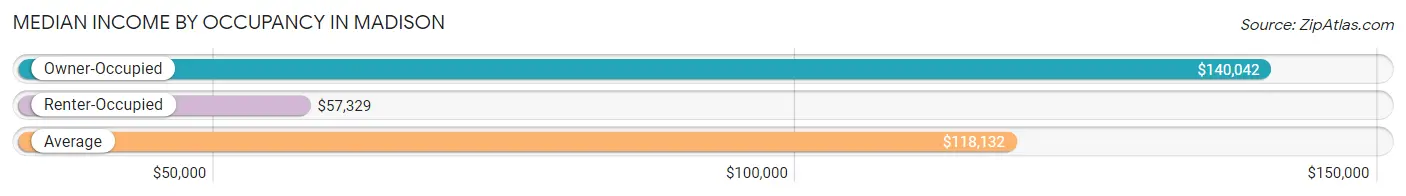
| Occupancy Type | # Households | Median Income |
| Owner-Occupied | 16,506 (74.8%) | $140,042 |
| Renter-Occupied | 5,567 (25.2%) | $57,329 |
| Average | 22,073 (100.0%) | $118,132 |
Occupancy by Householder Income Bracket in Madison
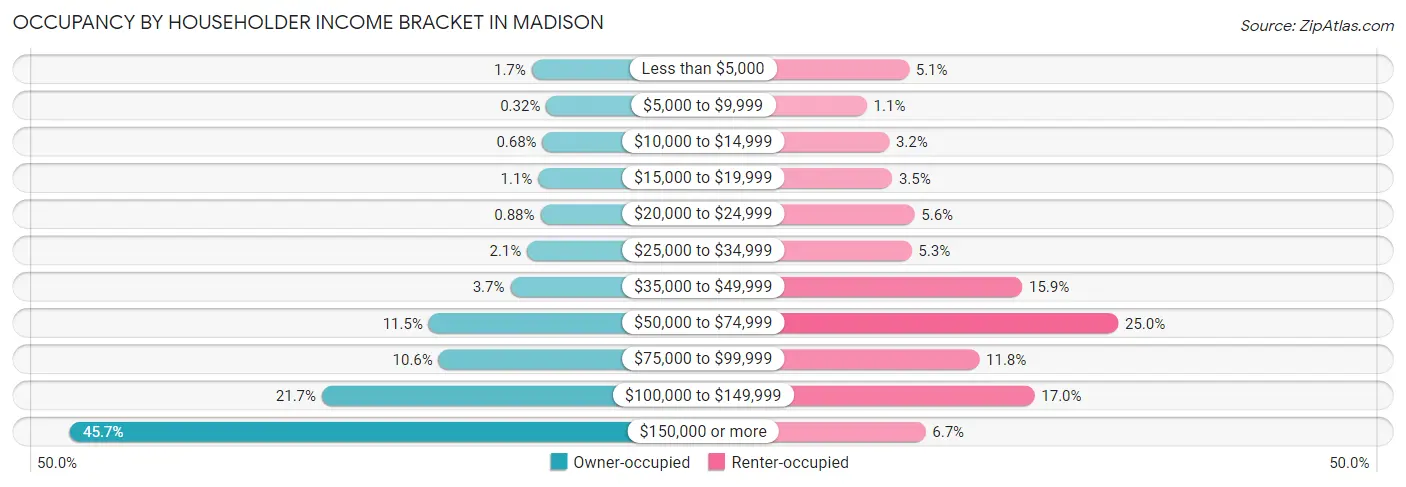
| Income Bracket | Owner-occupied | Renter-occupied |
| Less than $5,000 | 282 (1.7%) | 282 (5.1%) |
| $5,000 to $9,999 | 52 (0.3%) | 59 (1.1%) |
| $10,000 to $14,999 | 112 (0.7%) | 177 (3.2%) |
| $15,000 to $19,999 | 180 (1.1%) | 193 (3.5%) |
| $20,000 to $24,999 | 146 (0.9%) | 312 (5.6%) |
| $25,000 to $34,999 | 353 (2.1%) | 296 (5.3%) |
| $35,000 to $49,999 | 618 (3.7%) | 883 (15.9%) |
| $50,000 to $74,999 | 1,900 (11.5%) | 1,392 (25.0%) |
| $75,000 to $99,999 | 1,745 (10.6%) | 655 (11.8%) |
| $100,000 to $149,999 | 3,580 (21.7%) | 948 (17.0%) |
| $150,000 or more | 7,538 (45.7%) | 370 (6.7%) |
| Total | 16,506 (100.0%) | 5,567 (100.0%) |
Monthly Housing Cost Tiers in Madison
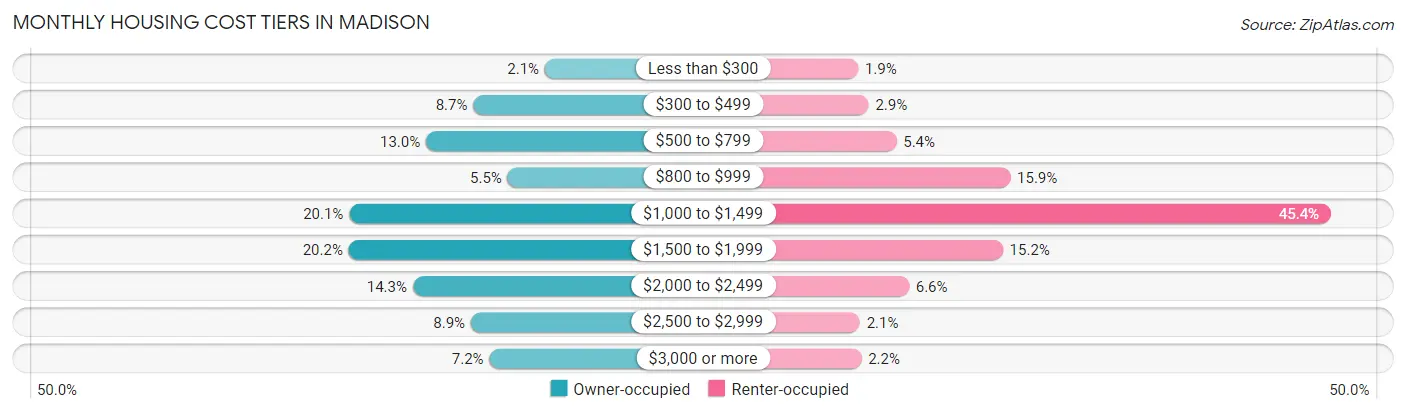
| Monthly Cost | Owner-occupied | Renter-occupied |
| Less than $300 | 346 (2.1%) | 105 (1.9%) |
| $300 to $499 | 1,434 (8.7%) | 159 (2.9%) |
| $500 to $799 | 2,152 (13.0%) | 302 (5.4%) |
| $800 to $999 | 912 (5.5%) | 885 (15.9%) |
| $1,000 to $1,499 | 3,321 (20.1%) | 2,529 (45.4%) |
| $1,500 to $1,999 | 3,327 (20.2%) | 847 (15.2%) |
| $2,000 to $2,499 | 2,353 (14.3%) | 366 (6.6%) |
| $2,500 to $2,999 | 1,471 (8.9%) | 114 (2.1%) |
| $3,000 or more | 1,190 (7.2%) | 122 (2.2%) |
| Total | 16,506 (100.0%) | 5,567 (100.0%) |
Physical Housing Characteristics in Madison
Housing Structures in Madison
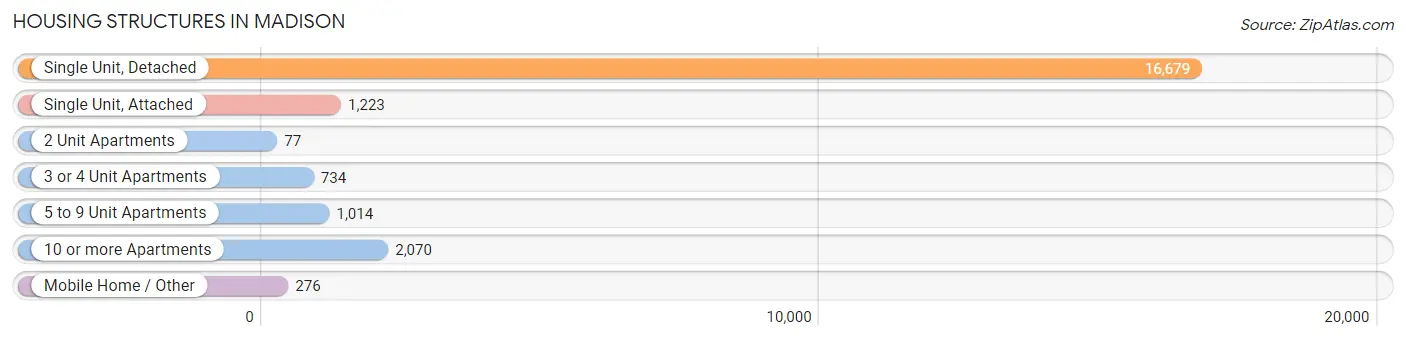
| Structure Type | # Housing Units | % Housing Units |
| Single Unit, Detached | 16,679 | 75.6% |
| Single Unit, Attached | 1,223 | 5.5% |
| 2 Unit Apartments | 77 | 0.4% |
| 3 or 4 Unit Apartments | 734 | 3.3% |
| 5 to 9 Unit Apartments | 1,014 | 4.6% |
| 10 or more Apartments | 2,070 | 9.4% |
| Mobile Home / Other | 276 | 1.3% |
| Total | 22,073 | 100.0% |
Housing Structures by Occupancy in Madison
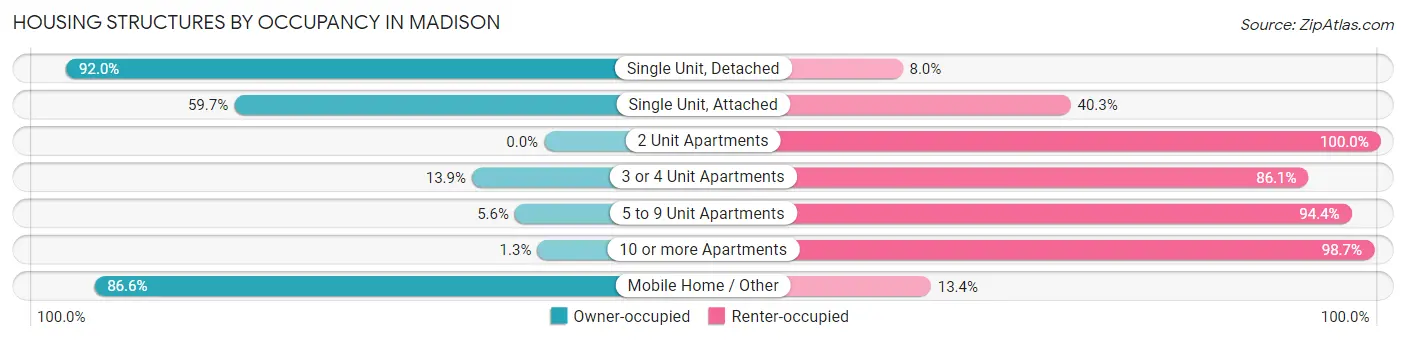
| Structure Type | Owner-occupied | Renter-occupied |
| Single Unit, Detached | 15,351 (92.0%) | 1,328 (8.0%) |
| Single Unit, Attached | 730 (59.7%) | 493 (40.3%) |
| 2 Unit Apartments | 0 (0.0%) | 77 (100.0%) |
| 3 or 4 Unit Apartments | 102 (13.9%) | 632 (86.1%) |
| 5 to 9 Unit Apartments | 57 (5.6%) | 957 (94.4%) |
| 10 or more Apartments | 27 (1.3%) | 2,043 (98.7%) |
| Mobile Home / Other | 239 (86.6%) | 37 (13.4%) |
| Total | 16,506 (74.8%) | 5,567 (25.2%) |
Housing Structures by Number of Rooms in Madison
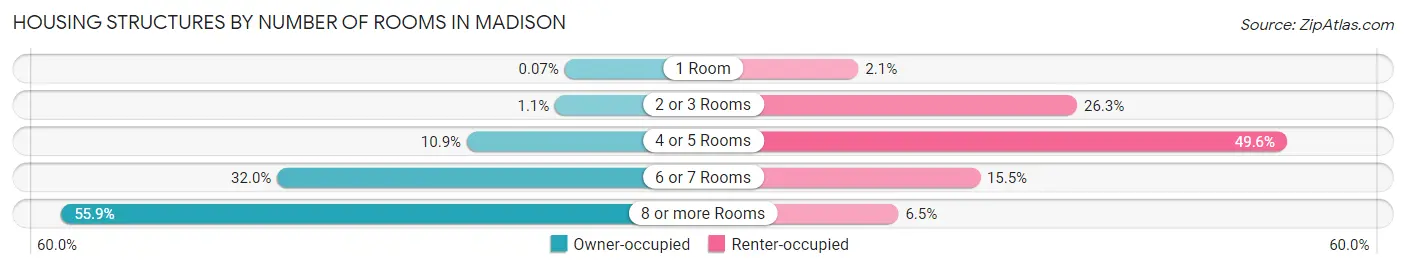
| Number of Rooms | Owner-occupied | Renter-occupied |
| 1 Room | 12 (0.1%) | 114 (2.1%) |
| 2 or 3 Rooms | 185 (1.1%) | 1,465 (26.3%) |
| 4 or 5 Rooms | 1,801 (10.9%) | 2,761 (49.6%) |
| 6 or 7 Rooms | 5,277 (32.0%) | 865 (15.5%) |
| 8 or more Rooms | 9,231 (55.9%) | 362 (6.5%) |
| Total | 16,506 (100.0%) | 5,567 (100.0%) |
Housing Structure by Heating Type in Madison
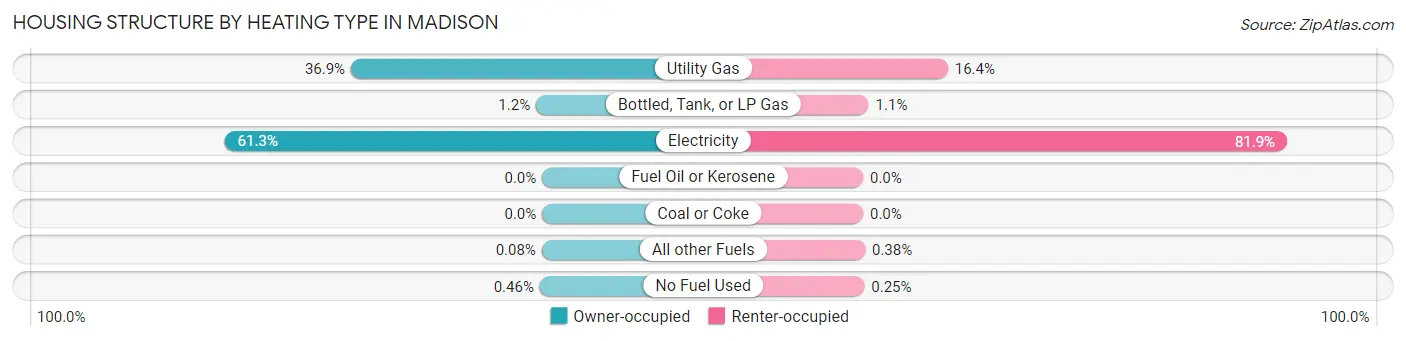
| Heating Type | Owner-occupied | Renter-occupied |
| Utility Gas | 6,098 (36.9%) | 912 (16.4%) |
| Bottled, Tank, or LP Gas | 194 (1.2%) | 60 (1.1%) |
| Electricity | 10,124 (61.3%) | 4,560 (81.9%) |
| Fuel Oil or Kerosene | 0 (0.0%) | 0 (0.0%) |
| Coal or Coke | 0 (0.0%) | 0 (0.0%) |
| All other Fuels | 14 (0.1%) | 21 (0.4%) |
| No Fuel Used | 76 (0.5%) | 14 (0.3%) |
| Total | 16,506 (100.0%) | 5,567 (100.0%) |
Household Vehicle Usage in Madison
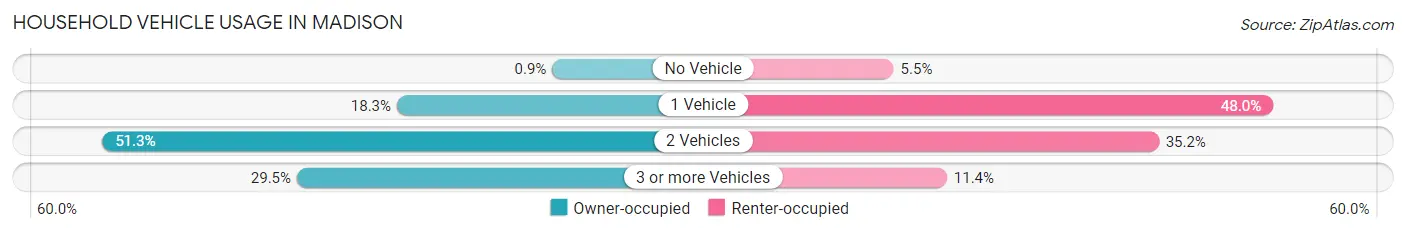
| Vehicles per Household | Owner-occupied | Renter-occupied |
| No Vehicle | 149 (0.9%) | 304 (5.5%) |
| 1 Vehicle | 3,020 (18.3%) | 2,670 (48.0%) |
| 2 Vehicles | 8,467 (51.3%) | 1,957 (35.1%) |
| 3 or more Vehicles | 4,870 (29.5%) | 636 (11.4%) |
| Total | 16,506 (100.0%) | 5,567 (100.0%) |
Real Estate & Mortgages in Madison
Real Estate and Mortgage Overview in Madison
| Characteristic | Without Mortgage | With Mortgage |
| Housing Units | 4,395 | 12,111 |
| Median Property Value | $312,300 | $332,100 |
| Median Household Income | $128,890 | $5,624 |
| Monthly Housing Costs | $555 | $1,190 |
| Real Estate Taxes | $1,635 | $393 |
Property Value by Mortgage Status in Madison
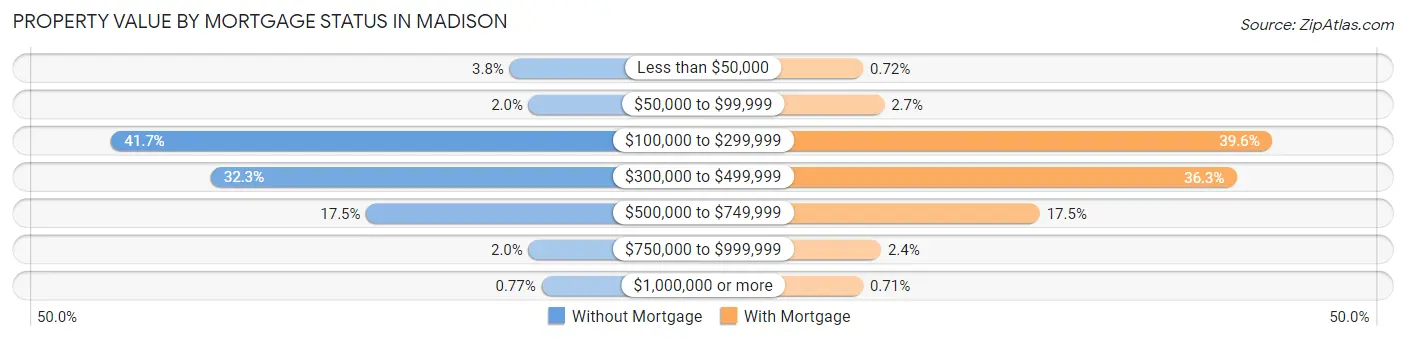
| Property Value | Without Mortgage | With Mortgage |
| Less than $50,000 | 167 (3.8%) | 87 (0.7%) |
| $50,000 to $99,999 | 87 (2.0%) | 331 (2.7%) |
| $100,000 to $299,999 | 1,834 (41.7%) | 4,798 (39.6%) |
| $300,000 to $499,999 | 1,418 (32.3%) | 4,392 (36.3%) |
| $500,000 to $749,999 | 767 (17.4%) | 2,124 (17.5%) |
| $750,000 to $999,999 | 88 (2.0%) | 293 (2.4%) |
| $1,000,000 or more | 34 (0.8%) | 86 (0.7%) |
| Total | 4,395 (100.0%) | 12,111 (100.0%) |
Household Income by Mortgage Status in Madison
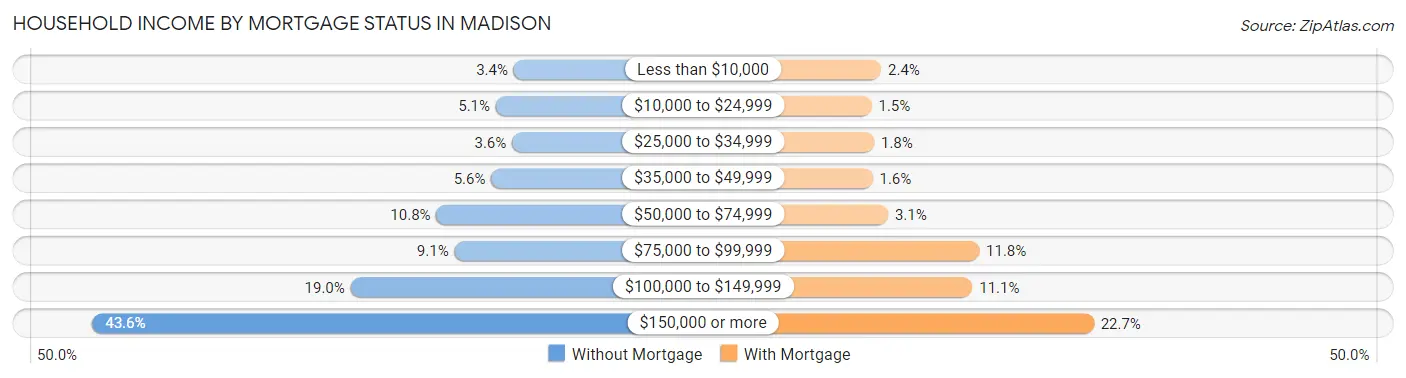
| Household Income | Without Mortgage | With Mortgage |
| Less than $10,000 | 150 (3.4%) | 294 (2.4%) |
| $10,000 to $24,999 | 225 (5.1%) | 184 (1.5%) |
| $25,000 to $34,999 | 157 (3.6%) | 213 (1.8%) |
| $35,000 to $49,999 | 244 (5.6%) | 196 (1.6%) |
| $50,000 to $74,999 | 474 (10.8%) | 374 (3.1%) |
| $75,000 to $99,999 | 398 (9.1%) | 1,426 (11.8%) |
| $100,000 to $149,999 | 833 (19.0%) | 1,347 (11.1%) |
| $150,000 or more | 1,914 (43.5%) | 2,747 (22.7%) |
| Total | 4,395 (100.0%) | 12,111 (100.0%) |
Property Value to Household Income Ratio in Madison
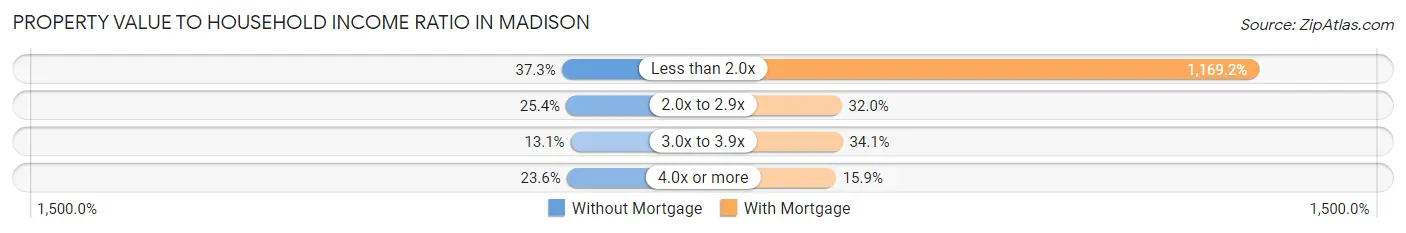
| Value-to-Income Ratio | Without Mortgage | With Mortgage |
| Less than 2.0x | 1,637 (37.2%) | 141,600 (1,169.2%) |
| 2.0x to 2.9x | 1,116 (25.4%) | 3,872 (32.0%) |
| 3.0x to 3.9x | 575 (13.1%) | 4,135 (34.1%) |
| 4.0x or more | 1,038 (23.6%) | 1,924 (15.9%) |
| Total | 4,395 (100.0%) | 12,111 (100.0%) |
Real Estate Taxes by Mortgage Status in Madison
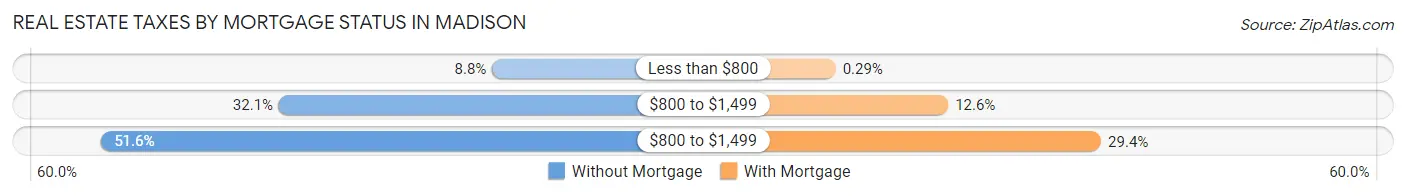
| Property Taxes | Without Mortgage | With Mortgage |
| Less than $800 | 385 (8.8%) | 35 (0.3%) |
| $800 to $1,499 | 1,412 (32.1%) | 1,528 (12.6%) |
| $800 to $1,499 | 2,268 (51.6%) | 3,558 (29.4%) |
| Total | 4,395 (100.0%) | 12,111 (100.0%) |
Health & Disability in Madison
Health Insurance Coverage by Age in Madison
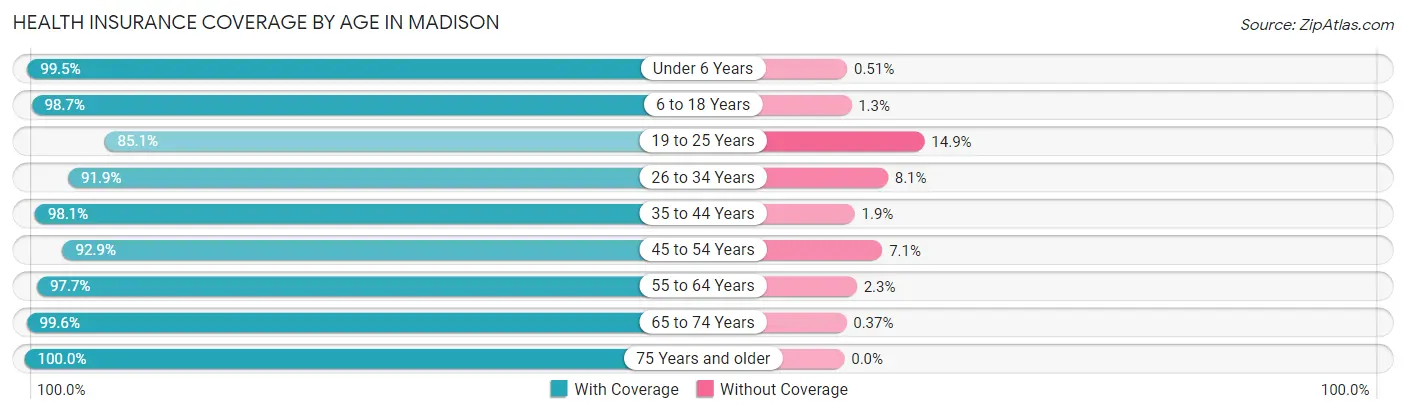
| Age Bracket | With Coverage | Without Coverage |
| Under 6 Years | 3,918 (99.5%) | 20 (0.5%) |
| 6 to 18 Years | 12,432 (98.7%) | 162 (1.3%) |
| 19 to 25 Years | 2,272 (85.1%) | 399 (14.9%) |
| 26 to 34 Years | 5,302 (91.9%) | 468 (8.1%) |
| 35 to 44 Years | 8,691 (98.1%) | 170 (1.9%) |
| 45 to 54 Years | 7,667 (92.9%) | 584 (7.1%) |
| 55 to 64 Years | 7,553 (97.7%) | 179 (2.3%) |
| 65 to 74 Years | 4,030 (99.6%) | 15 (0.4%) |
| 75 Years and older | 2,749 (100.0%) | 0 (0.0%) |
| Total | 54,614 (96.5%) | 1,997 (3.5%) |
Health Insurance Coverage by Citizenship Status in Madison
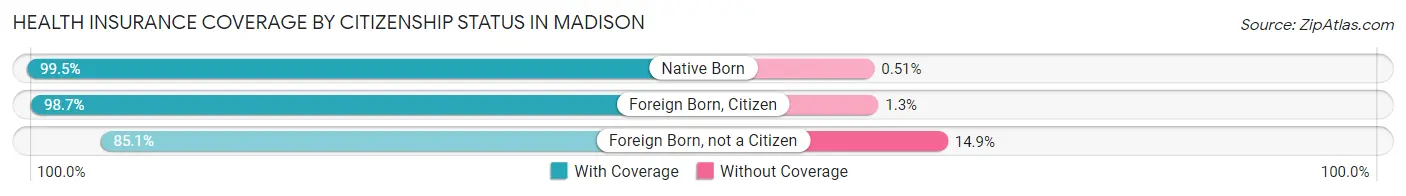
| Citizenship Status | With Coverage | Without Coverage |
| Native Born | 3,918 (99.5%) | 20 (0.5%) |
| Foreign Born, Citizen | 12,432 (98.7%) | 162 (1.3%) |
| Foreign Born, not a Citizen | 2,272 (85.1%) | 399 (14.9%) |
Health Insurance Coverage by Household Income in Madison
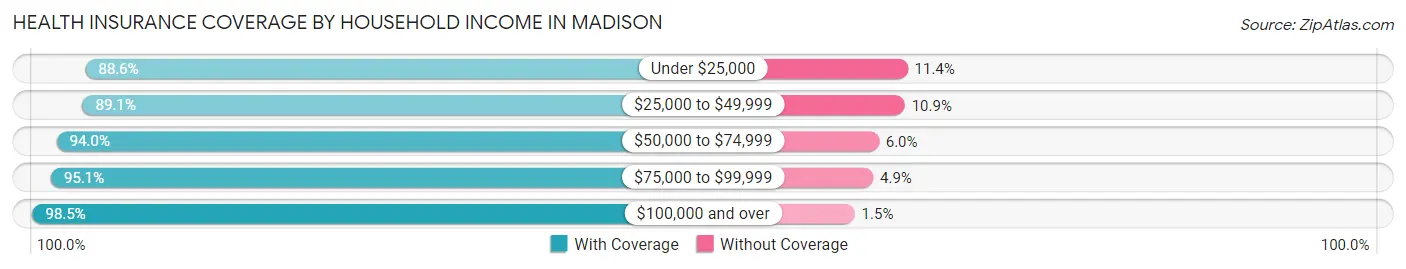
| Household Income | With Coverage | Without Coverage |
| Under $25,000 | 2,583 (88.6%) | 332 (11.4%) |
| $25,000 to $49,999 | 3,530 (89.1%) | 430 (10.9%) |
| $50,000 to $74,999 | 6,357 (94.0%) | 405 (6.0%) |
| $75,000 to $99,999 | 5,496 (95.1%) | 285 (4.9%) |
| $100,000 and over | 36,643 (98.5%) | 545 (1.5%) |
Public vs Private Health Insurance Coverage by Age in Madison
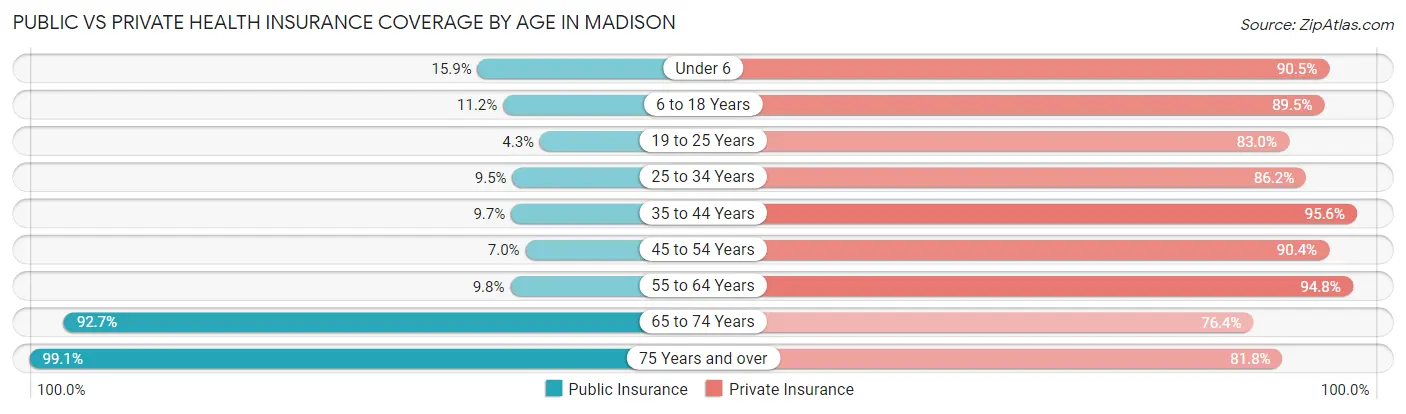
| Age Bracket | Public Insurance | Private Insurance |
| Under 6 | 627 (15.9%) | 3,562 (90.4%) |
| 6 to 18 Years | 1,408 (11.2%) | 11,277 (89.5%) |
| 19 to 25 Years | 116 (4.3%) | 2,216 (83.0%) |
| 25 to 34 Years | 545 (9.5%) | 4,972 (86.2%) |
| 35 to 44 Years | 860 (9.7%) | 8,471 (95.6%) |
| 45 to 54 Years | 581 (7.0%) | 7,460 (90.4%) |
| 55 to 64 Years | 761 (9.8%) | 7,331 (94.8%) |
| 65 to 74 Years | 3,750 (92.7%) | 3,089 (76.4%) |
| 75 Years and over | 2,724 (99.1%) | 2,248 (81.8%) |
| Total | 11,372 (20.1%) | 50,626 (89.4%) |
Disability Status by Sex by Age in Madison
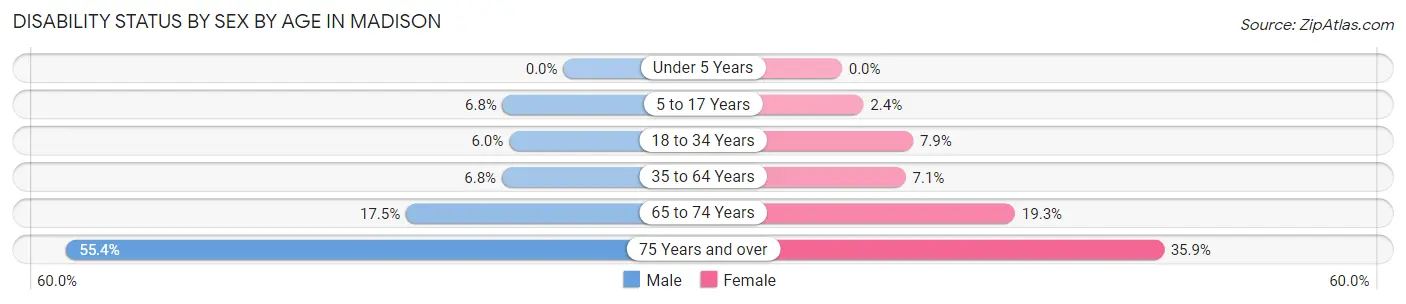
| Age Bracket | Male | Female |
| Under 5 Years | 0 (0.0%) | 0 (0.0%) |
| 5 to 17 Years | 457 (6.8%) | 139 (2.4%) |
| 18 to 34 Years | 274 (6.0%) | 369 (7.9%) |
| 35 to 64 Years | 820 (6.8%) | 914 (7.1%) |
| 65 to 74 Years | 336 (17.5%) | 410 (19.3%) |
| 75 Years and over | 626 (55.3%) | 580 (35.8%) |
Disability Class by Sex by Age in Madison
Disability Class: Hearing Difficulty
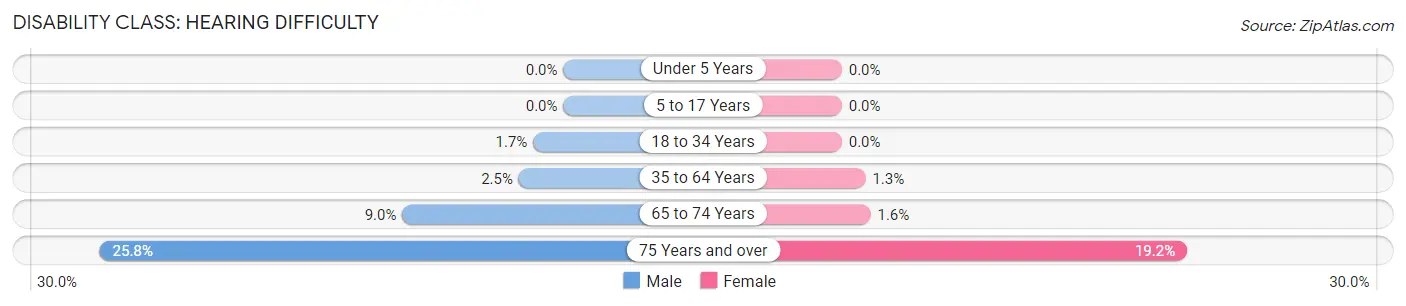
| Age Bracket | Male | Female |
| Under 5 Years | 0 (0.0%) | 0 (0.0%) |
| 5 to 17 Years | 0 (0.0%) | 0 (0.0%) |
| 18 to 34 Years | 76 (1.7%) | 0 (0.0%) |
| 35 to 64 Years | 298 (2.5%) | 170 (1.3%) |
| 65 to 74 Years | 172 (9.0%) | 34 (1.6%) |
| 75 Years and over | 292 (25.8%) | 311 (19.2%) |
Disability Class: Vision Difficulty
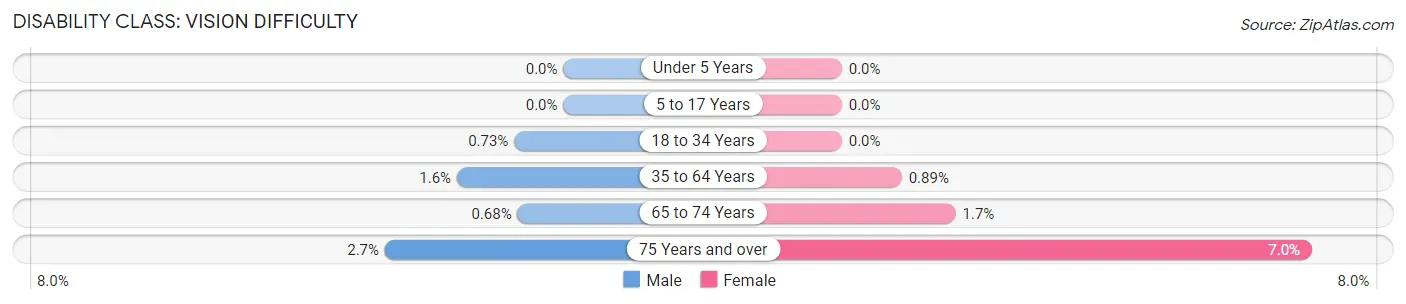
| Age Bracket | Male | Female |
| Under 5 Years | 0 (0.0%) | 0 (0.0%) |
| 5 to 17 Years | 0 (0.0%) | 0 (0.0%) |
| 18 to 34 Years | 33 (0.7%) | 0 (0.0%) |
| 35 to 64 Years | 189 (1.6%) | 114 (0.9%) |
| 65 to 74 Years | 13 (0.7%) | 36 (1.7%) |
| 75 Years and over | 30 (2.6%) | 113 (7.0%) |
Disability Class: Cognitive Difficulty
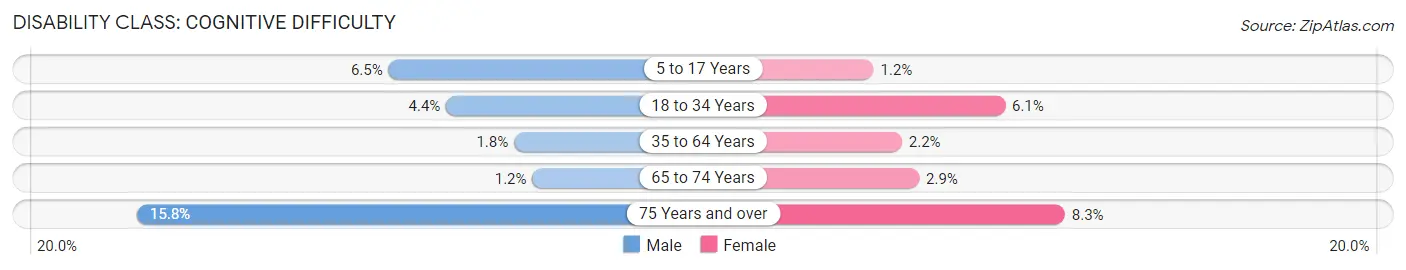
| Age Bracket | Male | Female |
| 5 to 17 Years | 439 (6.5%) | 68 (1.2%) |
| 18 to 34 Years | 197 (4.3%) | 282 (6.1%) |
| 35 to 64 Years | 220 (1.8%) | 286 (2.2%) |
| 65 to 74 Years | 22 (1.1%) | 61 (2.9%) |
| 75 Years and over | 179 (15.8%) | 134 (8.3%) |
Disability Class: Ambulatory Difficulty
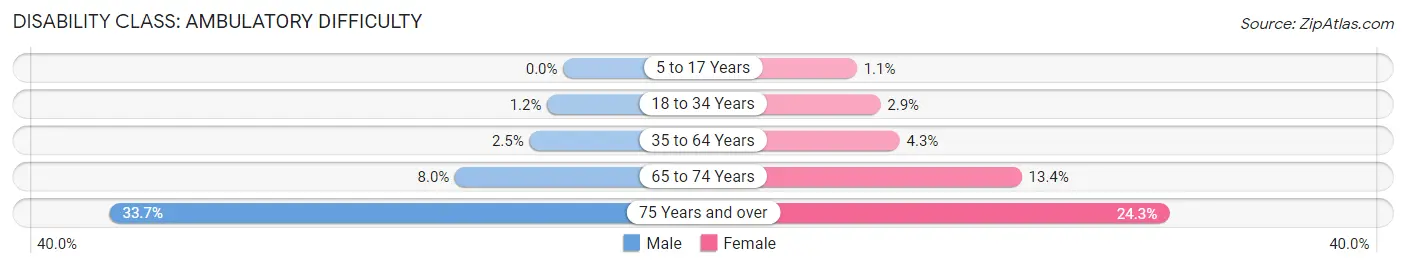
| Age Bracket | Male | Female |
| 5 to 17 Years | 0 (0.0%) | 64 (1.1%) |
| 18 to 34 Years | 54 (1.2%) | 133 (2.9%) |
| 35 to 64 Years | 301 (2.5%) | 551 (4.3%) |
| 65 to 74 Years | 154 (8.0%) | 284 (13.4%) |
| 75 Years and over | 381 (33.7%) | 393 (24.3%) |
Disability Class: Self-Care Difficulty
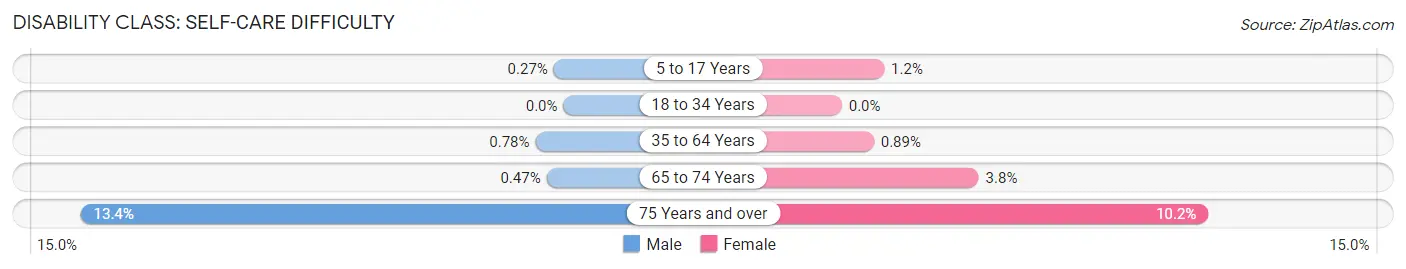
| Age Bracket | Male | Female |
| 5 to 17 Years | 18 (0.3%) | 68 (1.2%) |
| 18 to 34 Years | 0 (0.0%) | 0 (0.0%) |
| 35 to 64 Years | 93 (0.8%) | 114 (0.9%) |
| 65 to 74 Years | 9 (0.5%) | 81 (3.8%) |
| 75 Years and over | 152 (13.4%) | 165 (10.2%) |
Technology Access in Madison
Computing Device Access in Madison
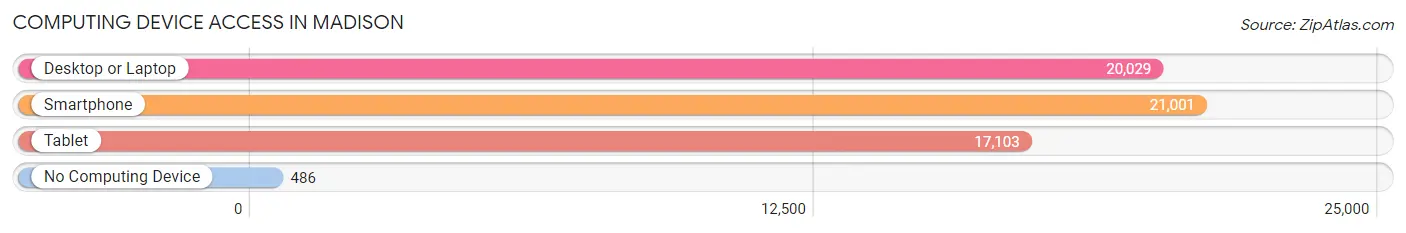
| Device Type | # Households | % Households |
| Desktop or Laptop | 20,029 | 90.7% |
| Smartphone | 21,001 | 95.1% |
| Tablet | 17,103 | 77.5% |
| No Computing Device | 486 | 2.2% |
| Total | 22,073 | 100.0% |
Internet Access in Madison
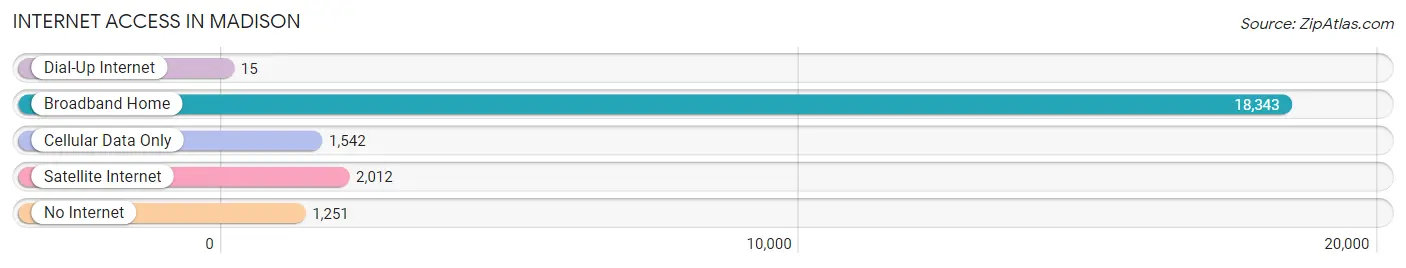
| Internet Type | # Households | % Households |
| Dial-Up Internet | 15 | 0.1% |
| Broadband Home | 18,343 | 83.1% |
| Cellular Data Only | 1,542 | 7.0% |
| Satellite Internet | 2,012 | 9.1% |
| No Internet | 1,251 | 5.7% |
| Total | 22,073 | 100.0% |
Madison Summary
Madison, AL is a city located in Madison County, Alabama, United States. It is the county seat of Madison County and is located in the northern part of the state. The city is part of the Huntsville-Decatur Combined Statistical Area and is the second-largest city in the state. As of the 2010 census, the population of Madison was 42,938.
Geography
Madison is located in the northern part of Madison County, Alabama, at 34°42'N 86°44'W. It is situated in the Tennessee Valley, approximately 10 miles west of Huntsville and approximately 20 miles east of Decatur. The city is located at the intersection of Interstate 565 and U.S. Route 72. The city is located in the foothills of the Appalachian Mountains and is surrounded by several small lakes and rivers.
Climate
Madison has a humid subtropical climate, with hot, humid summers and mild winters. The average annual temperature is 64°F, with an average high of 87°F in July and an average low of 41°F in January. The average annual precipitation is 51.2 inches, with an average of 4.7 inches of snowfall per year.
Demographics
As of the 2010 census, there were 42,938 people, 16,845 households, and 11,845 families residing in the city. The population density was 1,092.3 people per square mile. The racial makeup of the city was 75.3% White, 17.2% African American, 0.3% Native American, 3.3% Asian, 0.1% Pacific Islander, 1.3% from other races, and 2.5% from two or more races. Hispanic or Latino of any race were 4.2% of the population.
Economy
Madison is home to several major employers, including Intergraph Corporation, Teledyne Brown Engineering, and the U.S. Army Aviation and Missile Command. The city is also home to several smaller businesses, including restaurants, retail stores, and professional services. The city is also home to several educational institutions, including the University of Alabama in Huntsville, Calhoun Community College, and the Madison City Schools.
The median household income in Madison was $60,945 in 2017, and the median family income was $76,945. The per capita income in Madison was $31,945 in 2017. The unemployment rate in Madison was 3.7% in 2017.
Conclusion
Madison, AL is a city located in Madison County, Alabama, United States. It is the county seat of Madison County and is located in the northern part of the state. The city is part of the Huntsville-Decatur Combined Statistical Area and is the second-largest city in the state. As of the 2010 census, the population of Madison was 42,938. The city is located in the foothills of the Appalachian Mountains and is surrounded by several small lakes and rivers. Madison has a humid subtropical climate, with hot, humid summers and mild winters. The racial makeup of the city was 75.3% White, 17.2% African American, 0.3% Native American, 3.3% Asian, 0.1% Pacific Islander, 1.3% from other races, and 2.5% from two or more races. The city is home to several major employers, including Intergraph Corporation, Teledyne Brown Engineering, and the U.S. Army Aviation and Missile Command. The median household income in Madison was $60,945 in 2017, and the median family income was $76,945. The per capita income in Madison was $31,945 in 2017. The unemployment rate in Madison was 3.7% in 2017.
Common Questions
What is Per Capita Income in Madison?
Per Capita income in Madison is $51,788.
What is the Median Family Income in Madison?
Median Family Income in Madison is $142,113.
What is the Median Household income in Madison?
Median Household Income in Madison is $118,132.
What is Income or Wage Gap in Madison?
Income or Wage Gap in Madison is 56.0%.
Women in Madison earn 44.0 cents for every dollar earned by a man.
What is Family Income Deficit in Madison?
Family Income Deficit in Madison is $8,795.
Families that are below poverty line in Madison earn $8,795 less on average than the poverty threshold level.
What is Inequality or Gini Index in Madison?
Inequality or Gini Index in Madison is 0.39.
What is the Total Population of Madison?
Total Population of Madison is 56,967.
What is the Total Male Population of Madison?
Total Male Population of Madison is 28,203.
What is the Total Female Population of Madison?
Total Female Population of Madison is 28,764.
What is the Ratio of Males per 100 Females in Madison?
There are 98.05 Males per 100 Females in Madison.
What is the Ratio of Females per 100 Males in Madison?
There are 101.99 Females per 100 Males in Madison.
What is the Median Population Age in Madison?
Median Population Age in Madison is 39.1 Years.
What is the Average Family Size in Madison
Average Family Size in Madison is 3.1 People.
What is the Average Household Size in Madison
Average Household Size in Madison is 2.6 People.
How Large is the Labor Force in Madison?
There are 28,194 People in the Labor Forcein in Madison.
What is the Percentage of People in the Labor Force in Madison?
65.0% of People are in the Labor Force in Madison.
What is the Unemployment Rate in Madison?
Unemployment Rate in Madison is 3.0%.