Loxley, AL Map & Demographics
Loxley Map
Loxley Overview
$35,476
PER CAPITA INCOME
$105,865
AVG FAMILY INCOME
$89,435
AVG HOUSEHOLD INCOME
44.1%
WAGE / INCOME GAP [ % ]
55.9¢/ $1
WAGE / INCOME GAP [ $ ]
0.38
INEQUALITY / GINI INDEX
3,757
TOTAL POPULATION
1,917
MALE POPULATION
1,840
FEMALE POPULATION
104.18
MALES / 100 FEMALES
95.98
FEMALES / 100 MALES
36.3
MEDIAN AGE
3.5
AVG FAMILY SIZE
3.2
AVG HOUSEHOLD SIZE
1,870
LABOR FORCE [ PEOPLE ]
62.7%
PERCENT IN LABOR FORCE
1.0%
UNEMPLOYMENT RATE
Loxley Zip Codes
Loxley Area Codes
Income in Loxley
Income Overview in Loxley
Per Capita Income in Loxley is $35,476, while median incomes of families and households are $105,865 and $89,435 respectively.
| Characteristic | Number | Measure |
| Per Capita Income | 3,757 | $35,476 |
| Median Family Income | 1,018 | $105,865 |
| Mean Family Income | 1,018 | $116,536 |
| Median Household Income | 1,184 | $89,435 |
| Mean Household Income | 1,184 | $106,364 |
| Income Deficit | 1,018 | $0 |
| Wage / Income Gap (%) | 3,757 | 44.13% |
| Wage / Income Gap ($) | 3,757 | 55.87¢ per $1 |
| Gini / Inequality Index | 3,757 | 0.38 |
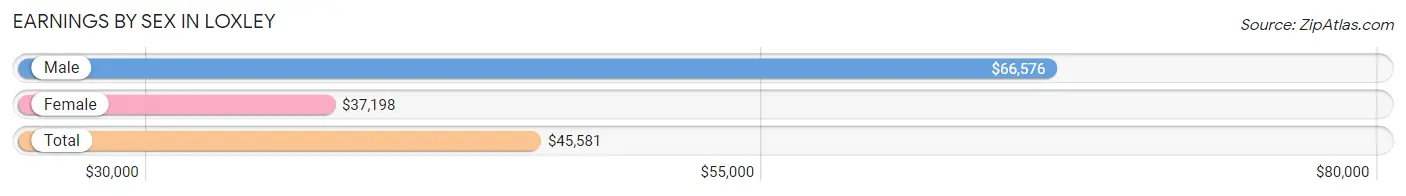
Earnings by Sex in Loxley
Average Earnings in Loxley are $45,581, $66,576 for men and $37,198 for women, a difference of 44.1%.
| Sex | Number | Average Earnings |
| Male | 1,049 (52.7%) | $66,576 |
| Female | 943 (47.3%) | $37,198 |
| Total | 1,992 (100.0%) | $45,581 |
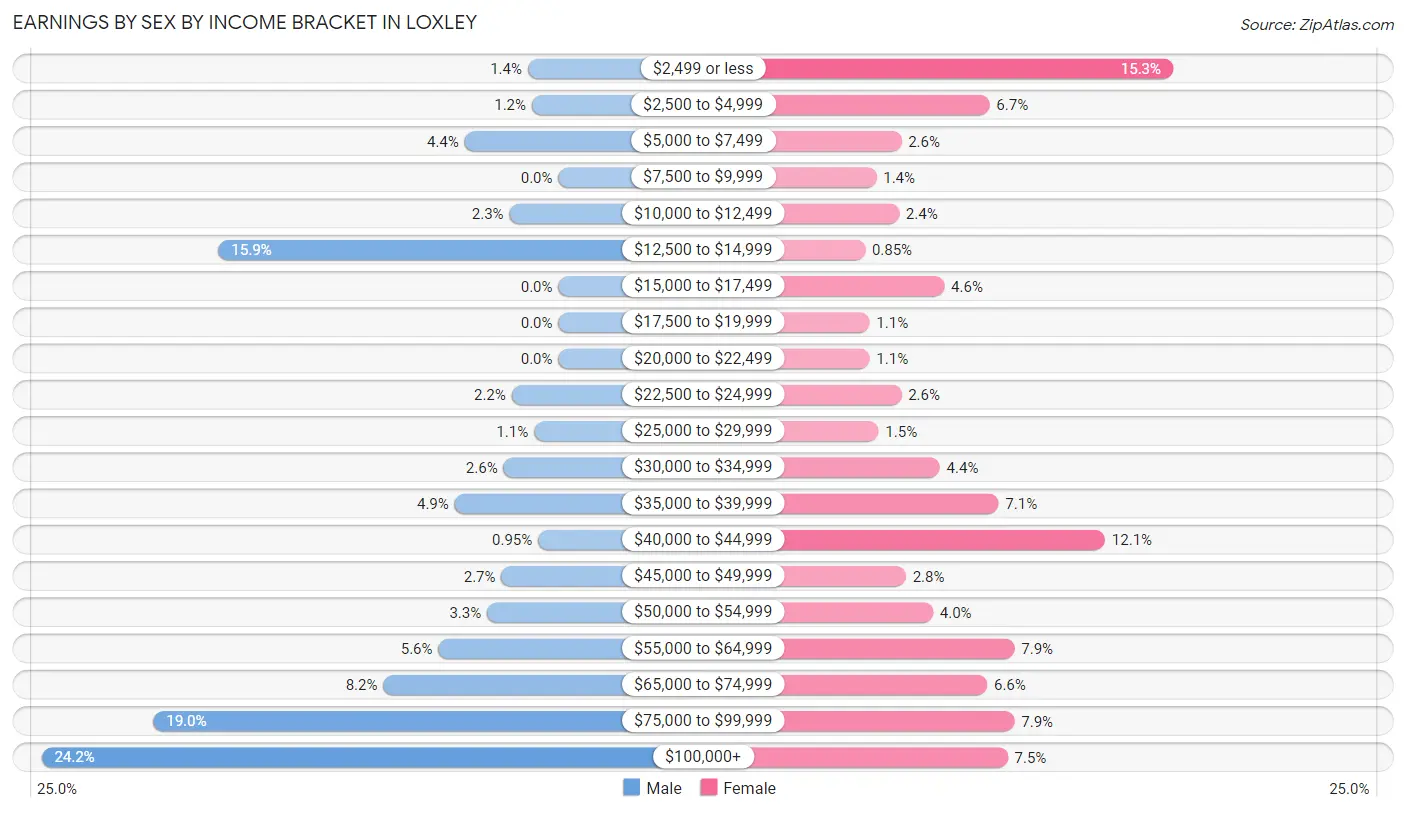
Earnings by Sex by Income Bracket in Loxley
The most common earnings brackets in Loxley are $100,000+ for men (254 | 24.2%) and $2,499 or less for women (144 | 15.3%).
| Income | Male | Female |
| $2,499 or less | 15 (1.4%) | 144 (15.3%) |
| $2,500 to $4,999 | 13 (1.2%) | 63 (6.7%) |
| $5,000 to $7,499 | 46 (4.4%) | 24 (2.5%) |
| $7,500 to $9,999 | 0 (0.0%) | 13 (1.4%) |
| $10,000 to $12,499 | 24 (2.3%) | 23 (2.4%) |
| $12,500 to $14,999 | 167 (15.9%) | 8 (0.9%) |
| $15,000 to $17,499 | 0 (0.0%) | 43 (4.6%) |
| $17,500 to $19,999 | 0 (0.0%) | 10 (1.1%) |
| $20,000 to $22,499 | 0 (0.0%) | 10 (1.1%) |
| $22,500 to $24,999 | 23 (2.2%) | 24 (2.5%) |
| $25,000 to $29,999 | 12 (1.1%) | 14 (1.5%) |
| $30,000 to $34,999 | 27 (2.6%) | 41 (4.3%) |
| $35,000 to $39,999 | 51 (4.9%) | 67 (7.1%) |
| $40,000 to $44,999 | 10 (0.9%) | 114 (12.1%) |
| $45,000 to $49,999 | 28 (2.7%) | 26 (2.8%) |
| $50,000 to $54,999 | 35 (3.3%) | 38 (4.0%) |
| $55,000 to $64,999 | 59 (5.6%) | 74 (7.9%) |
| $65,000 to $74,999 | 86 (8.2%) | 62 (6.6%) |
| $75,000 to $99,999 | 199 (19.0%) | 74 (7.9%) |
| $100,000+ | 254 (24.2%) | 71 (7.5%) |
| Total | 1,049 (100.0%) | 943 (100.0%) |
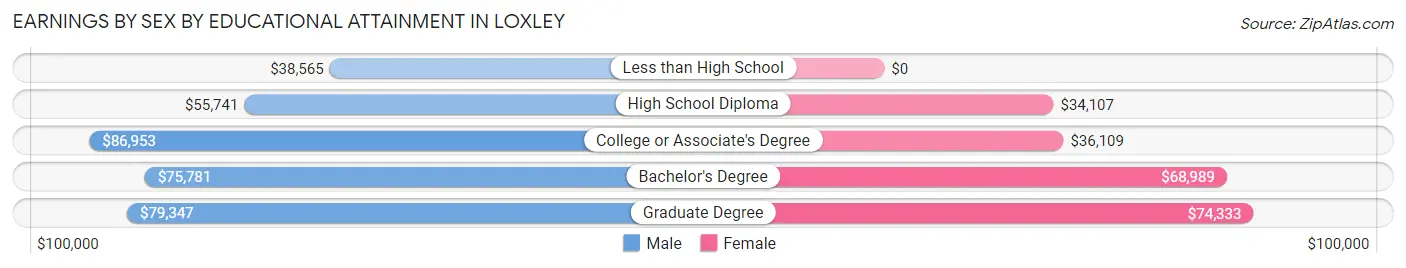
Earnings by Sex by Educational Attainment in Loxley
Average earnings in Loxley are $75,671 for men and $41,671 for women, a difference of 44.9%. Men with an educational attainment of college or associate's degree enjoy the highest average annual earnings of $86,953, while those with less than high school education earn the least with $38,565. Women with an educational attainment of graduate degree earn the most with the average annual earnings of $74,333, while those with high school diploma education have the smallest earnings of $34,107.
| Educational Attainment | Male Income | Female Income |
| Less than High School | $38,565 | $0 |
| High School Diploma | $55,741 | $34,107 |
| College or Associate's Degree | $86,953 | $36,109 |
| Bachelor's Degree | $75,781 | $68,989 |
| Graduate Degree | $79,347 | $74,333 |
| Total | $75,671 | $41,671 |
Family Income in Loxley
Family Income Brackets in Loxley
According to the Loxley family income data, there are 269 families falling into the $100,000 to $149,999 income range, which is the most common income bracket and makes up 26.4% of all families.
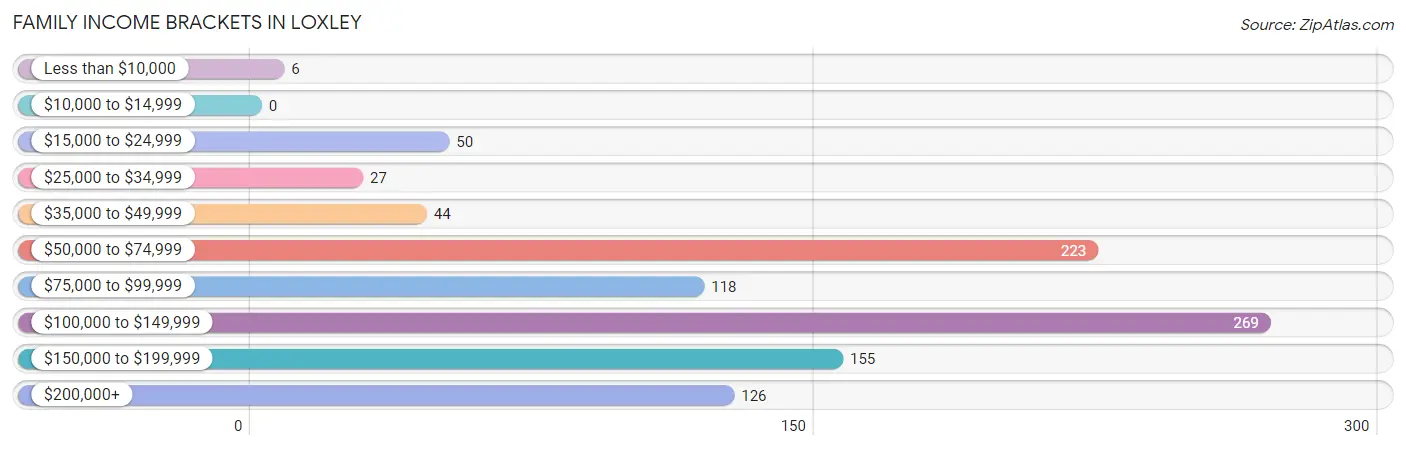
| Income Bracket | # Families | % Families |
| Less than $10,000 | 6 | 0.6% |
| $10,000 to $14,999 | 0 | 0.0% |
| $15,000 to $24,999 | 50 | 4.9% |
| $25,000 to $34,999 | 27 | 2.7% |
| $35,000 to $49,999 | 44 | 4.3% |
| $50,000 to $74,999 | 223 | 21.9% |
| $75,000 to $99,999 | 118 | 11.6% |
| $100,000 to $149,999 | 269 | 26.4% |
| $150,000 to $199,999 | 155 | 15.2% |
| $200,000+ | 126 | 12.4% |
Family Income by Famaliy Size in Loxley
3-person families (265 | 26.0%) account for the highest median family income in Loxley with $115,317 per family, while 2-person families (415 | 40.8%) have the highest median income of $52,032 per family member.
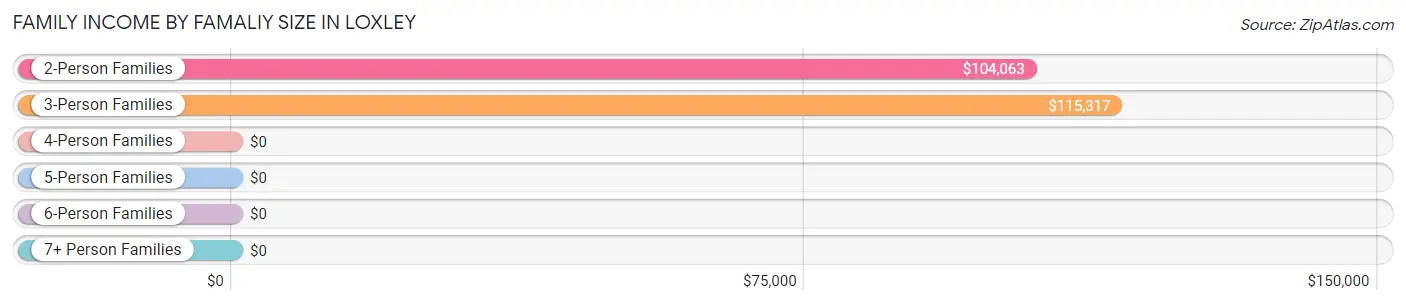
| Income Bracket | # Families | Median Income |
| 2-Person Families | 415 (40.8%) | $104,063 |
| 3-Person Families | 265 (26.0%) | $115,317 |
| 4-Person Families | 267 (26.2%) | $0 |
| 5-Person Families | 65 (6.4%) | $0 |
| 6-Person Families | 2 (0.2%) | $0 |
| 7+ Person Families | 4 (0.4%) | $0 |
| Total | 1,018 (100.0%) | $105,865 |
Family Income by Number of Earners in Loxley
The median family income in Loxley is $105,865, with families comprising 3+ earners (77) having the highest median family income of $168,365, while families with no earners (87) have the lowest median family income of $74,375, accounting for 7.6% and 8.6% of families, respectively.
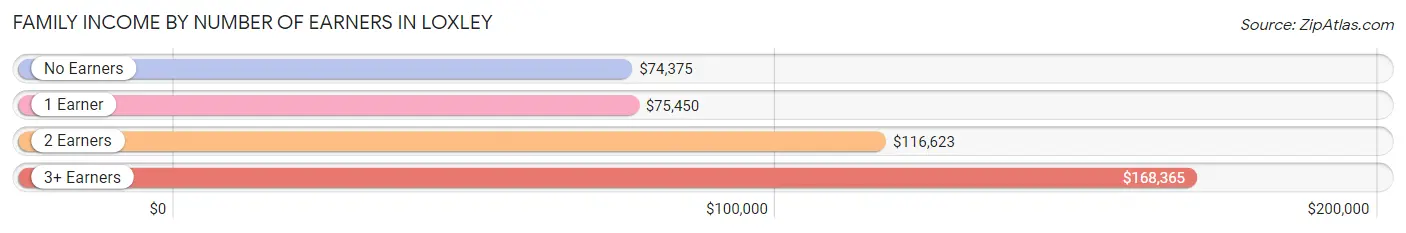
| Number of Earners | # Families | Median Income |
| No Earners | 87 (8.6%) | $74,375 |
| 1 Earner | 275 (27.0%) | $75,450 |
| 2 Earners | 579 (56.9%) | $116,623 |
| 3+ Earners | 77 (7.6%) | $168,365 |
| Total | 1,018 (100.0%) | $105,865 |
Household Income in Loxley
Household Income Brackets in Loxley
With 279 households falling in the category, the $100,000 to $149,999 income range is the most frequent in Loxley, accounting for 23.6% of all households. In contrast, only 21 households (1.8%) fall into the $10,000 to $14,999 income bracket, making it the least populous group.
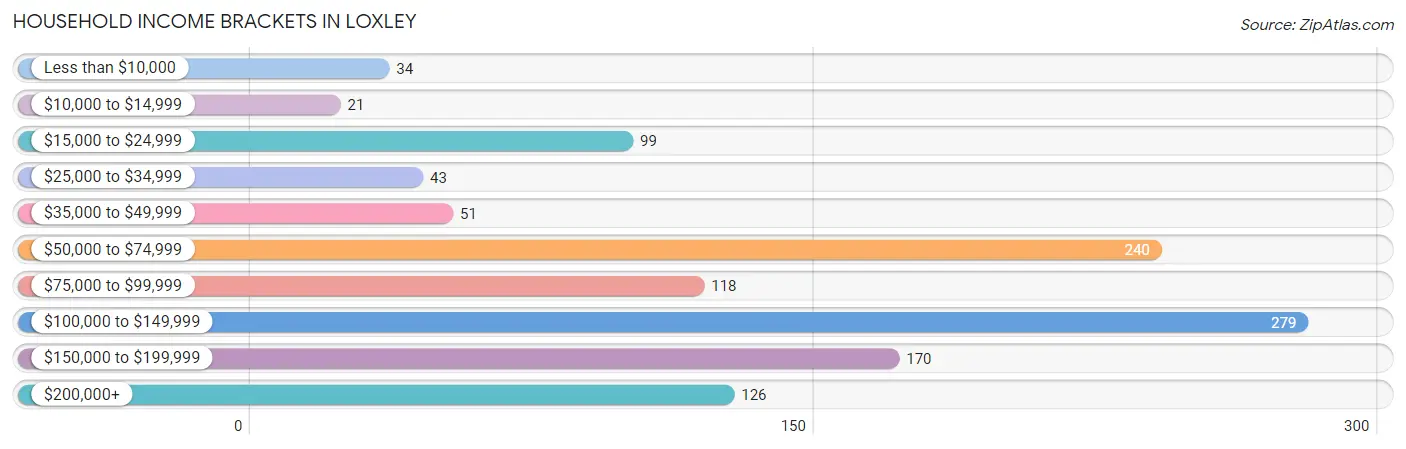
| Income Bracket | # Households | % Households |
| Less than $10,000 | 34 | 2.9% |
| $10,000 to $14,999 | 21 | 1.8% |
| $15,000 to $24,999 | 99 | 8.4% |
| $25,000 to $34,999 | 43 | 3.6% |
| $35,000 to $49,999 | 51 | 4.3% |
| $50,000 to $74,999 | 240 | 20.3% |
| $75,000 to $99,999 | 118 | 10.0% |
| $100,000 to $149,999 | 279 | 23.6% |
| $150,000 to $199,999 | 170 | 14.4% |
| $200,000+ | 126 | 10.6% |
Household Income by Householder Age in Loxley
The median household income in Loxley is $89,435, with the highest median household income of $108,198 found in the 25 to 44 years age bracket for the primary householder. A total of 468 households (39.5%) fall into this category. Meanwhile, the 15 to 24 years age bracket for the primary householder has the lowest median household income of $0, with 12 households (1.0%) in this group.
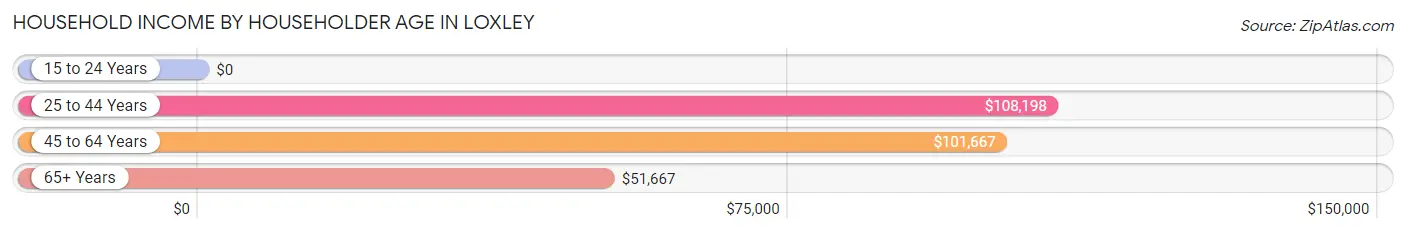
| Income Bracket | # Households | Median Income |
| 15 to 24 Years | 12 (1.0%) | $0 |
| 25 to 44 Years | 468 (39.5%) | $108,198 |
| 45 to 64 Years | 534 (45.1%) | $101,667 |
| 65+ Years | 170 (14.4%) | $51,667 |
| Total | 1,184 (100.0%) | $89,435 |
Poverty in Loxley
Income Below Poverty by Sex and Age in Loxley
With 8.0% poverty level for males and 10.1% for females among the residents of Loxley, 12 to 14 year old males and 35 to 44 year old females are the most vulnerable to poverty, with 38 males (42.7%) and 44 females (19.9%) in their respective age groups living below the poverty level.
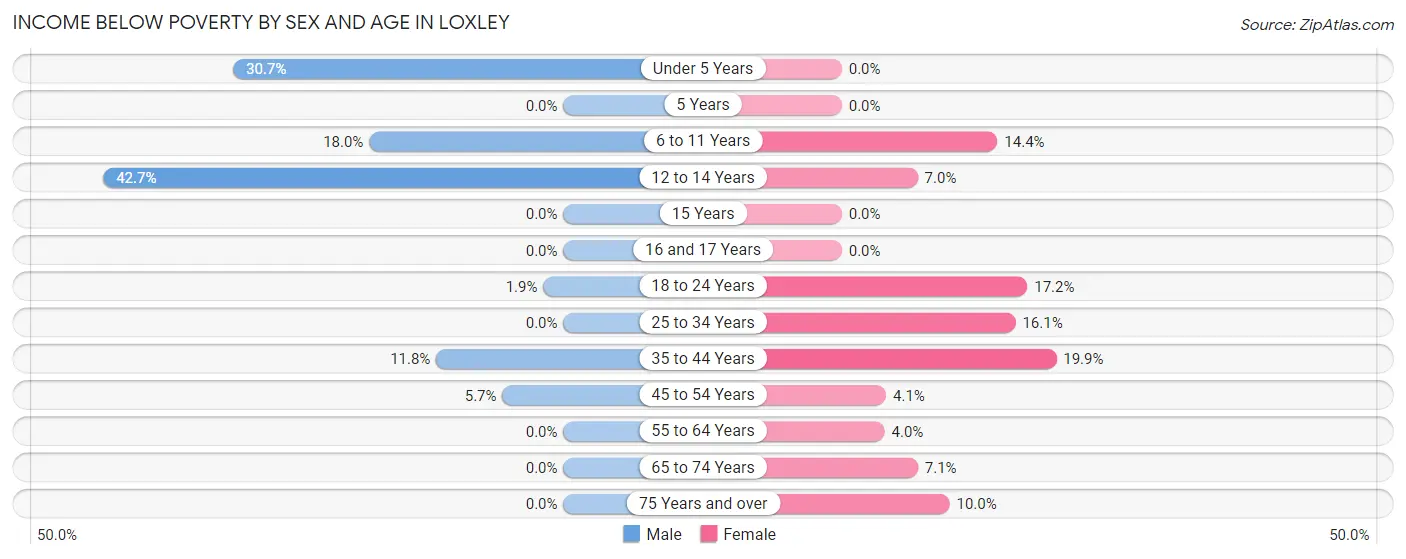
| Age Bracket | Male | Female |
| Under 5 Years | 38 (30.6%) | 0 (0.0%) |
| 5 Years | 0 (0.0%) | 0 (0.0%) |
| 6 to 11 Years | 20 (18.0%) | 13 (14.4%) |
| 12 to 14 Years | 38 (42.7%) | 10 (7.0%) |
| 15 Years | 0 (0.0%) | 0 (0.0%) |
| 16 and 17 Years | 0 (0.0%) | 0 (0.0%) |
| 18 to 24 Years | 7 (1.9%) | 47 (17.2%) |
| 25 to 34 Years | 0 (0.0%) | 39 (16.1%) |
| 35 to 44 Years | 42 (11.8%) | 44 (19.9%) |
| 45 to 54 Years | 9 (5.7%) | 12 (4.1%) |
| 55 to 64 Years | 0 (0.0%) | 11 (4.0%) |
| 65 to 74 Years | 0 (0.0%) | 6 (7.1%) |
| 75 Years and over | 0 (0.0%) | 4 (10.0%) |
| Total | 154 (8.0%) | 186 (10.1%) |
Income Above Poverty by Sex and Age in Loxley
According to the poverty statistics in Loxley, males aged 5 years and females aged under 5 years are the age groups that are most secure financially, with 100.0% of males and 100.0% of females in these age groups living above the poverty line.
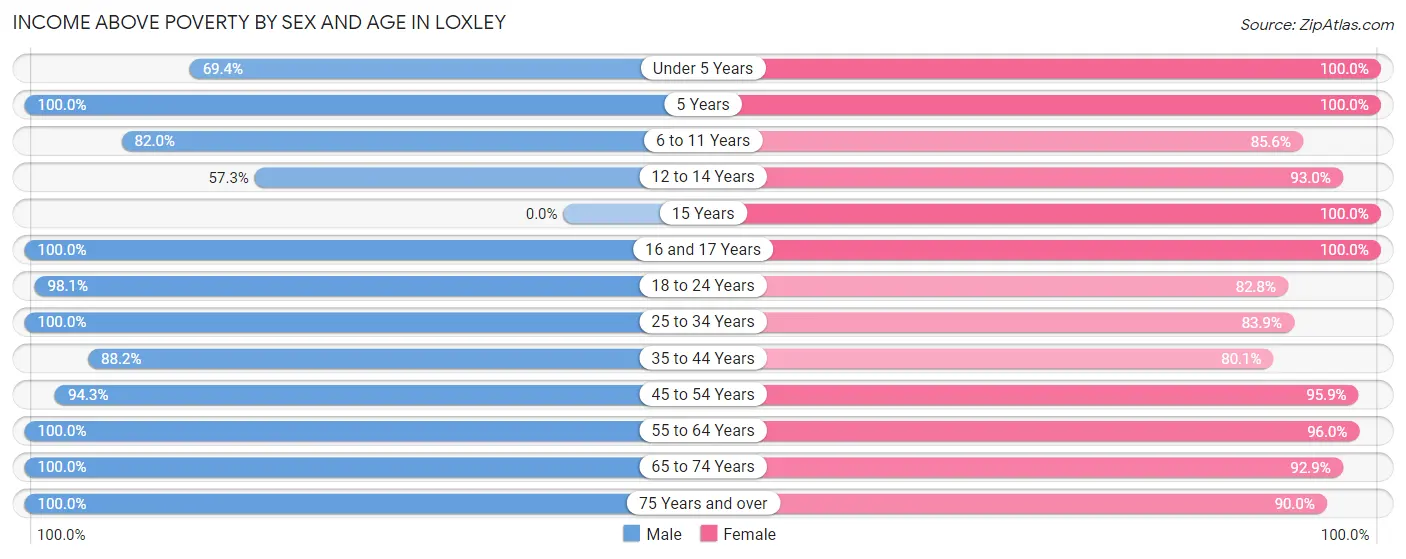
| Age Bracket | Male | Female |
| Under 5 Years | 86 (69.4%) | 145 (100.0%) |
| 5 Years | 57 (100.0%) | 13 (100.0%) |
| 6 to 11 Years | 91 (82.0%) | 77 (85.6%) |
| 12 to 14 Years | 51 (57.3%) | 132 (93.0%) |
| 15 Years | 0 (0.0%) | 4 (100.0%) |
| 16 and 17 Years | 5 (100.0%) | 16 (100.0%) |
| 18 to 24 Years | 370 (98.1%) | 226 (82.8%) |
| 25 to 34 Years | 107 (100.0%) | 203 (83.9%) |
| 35 to 44 Years | 314 (88.2%) | 177 (80.1%) |
| 45 to 54 Years | 150 (94.3%) | 280 (95.9%) |
| 55 to 64 Years | 400 (100.0%) | 266 (96.0%) |
| 65 to 74 Years | 74 (100.0%) | 79 (92.9%) |
| 75 Years and over | 58 (100.0%) | 36 (90.0%) |
| Total | 1,763 (92.0%) | 1,654 (89.9%) |
Income Below Poverty Among Married-Couple Families in Loxley
The poverty statistics for married-couple families in Loxley show that 4.7% or 41 of the total 871 families live below the poverty line. Families with 3 or 4 children have the highest poverty rate of 26.5%, comprising of 9 families. On the other hand, families with no children have the lowest poverty rate of 1.0%, which includes 6 families.
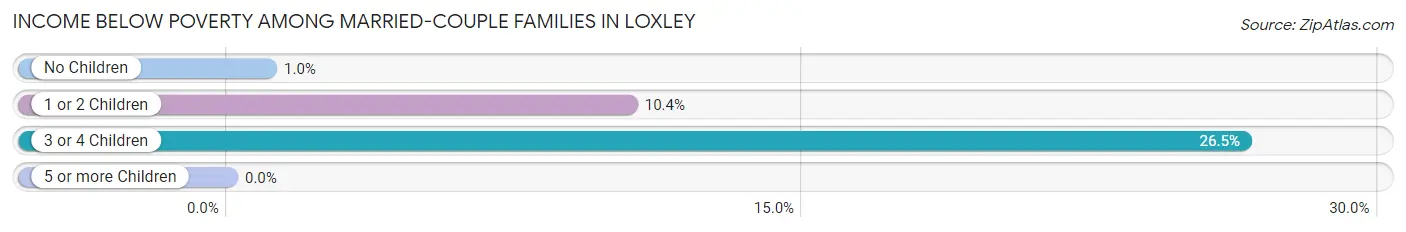
| Children | Above Poverty | Below Poverty |
| No Children | 582 (99.0%) | 6 (1.0%) |
| 1 or 2 Children | 223 (89.6%) | 26 (10.4%) |
| 3 or 4 Children | 25 (73.5%) | 9 (26.5%) |
| 5 or more Children | 0 (0.0%) | 0 (0.0%) |
| Total | 830 (95.3%) | 41 (4.7%) |
Income Below Poverty Among Single-Parent Households in Loxley
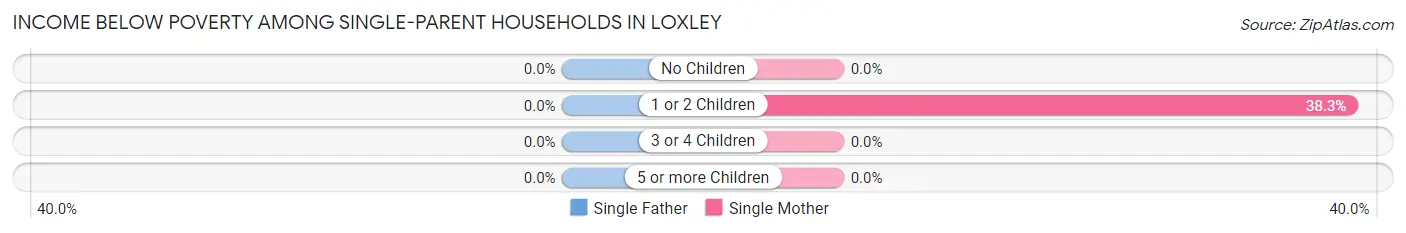
| Children | Single Father | Single Mother |
| No Children | 0 (0.0%) | 0 (0.0%) |
| 1 or 2 Children | 0 (0.0%) | 23 (38.3%) |
| 3 or 4 Children | 0 (0.0%) | 0 (0.0%) |
| 5 or more Children | 0 (0.0%) | 0 (0.0%) |
| Total | 0 (0.0%) | 23 (24.5%) |
Income Below Poverty Among Married-Couple vs Single-Parent Households in Loxley
The poverty data for Loxley shows that 41 of the married-couple family households (4.7%) and 23 of the single-parent households (15.7%) are living below the poverty level. Within the married-couple family households, those with 3 or 4 children have the highest poverty rate, with 9 households (26.5%) falling below the poverty line. Among the single-parent households, those with 1 or 2 children have the highest poverty rate, with 23 household (24.7%) living below poverty.
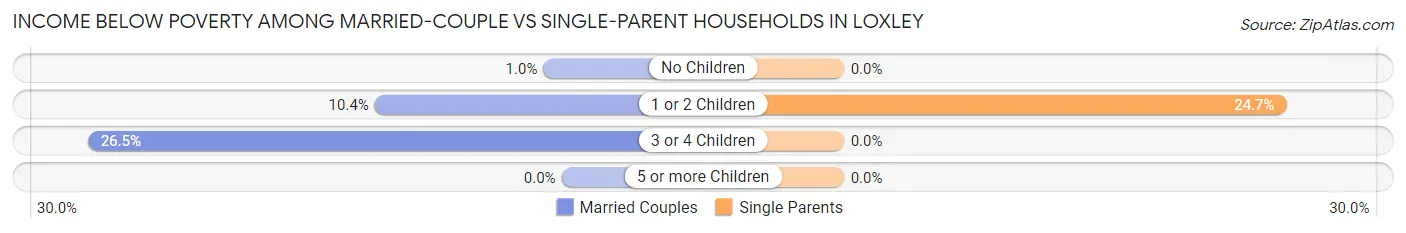
| Children | Married-Couple Families | Single-Parent Households |
| No Children | 6 (1.0%) | 0 (0.0%) |
| 1 or 2 Children | 26 (10.4%) | 23 (24.7%) |
| 3 or 4 Children | 9 (26.5%) | 0 (0.0%) |
| 5 or more Children | 0 (0.0%) | 0 (0.0%) |
| Total | 41 (4.7%) | 23 (15.7%) |
Race in Loxley
The most populous races in Loxley are White / Caucasian (3,410 | 90.8%), Two or more Races (161 | 4.3%), and Hispanic or Latino (148 | 3.9%).
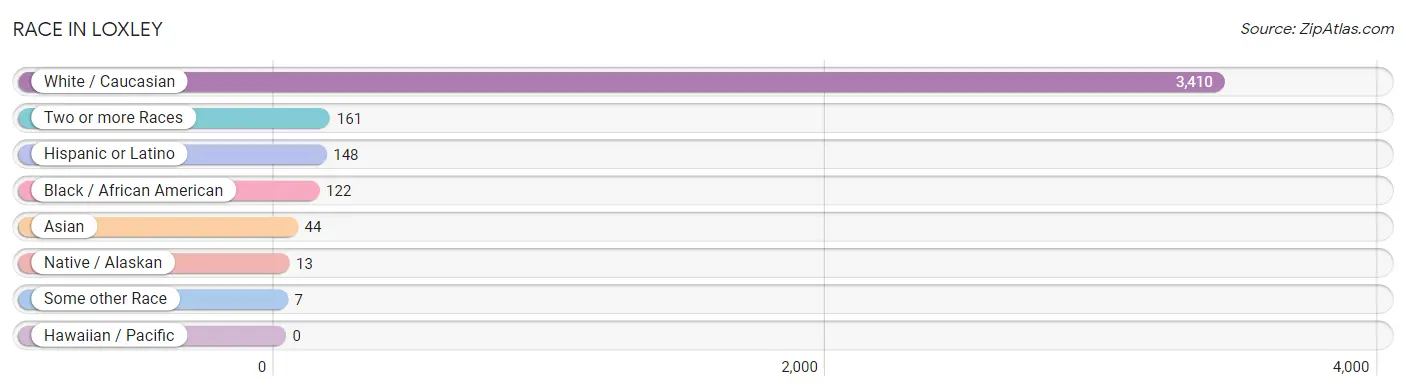
| Race | # Population | % Population |
| Asian | 44 | 1.2% |
| Black / African American | 122 | 3.3% |
| Hawaiian / Pacific | 0 | 0.0% |
| Hispanic or Latino | 148 | 3.9% |
| Native / Alaskan | 13 | 0.4% |
| White / Caucasian | 3,410 | 90.8% |
| Two or more Races | 161 | 4.3% |
| Some other Race | 7 | 0.2% |
| Total | 3,757 | 100.0% |
Ancestry in Loxley
The most populous ancestries reported in Loxley are English (937 | 24.9%), American (702 | 18.7%), Irish (301 | 8.0%), German (240 | 6.4%), and Scottish (156 | 4.2%), together accounting for 62.2% of all Loxley residents.
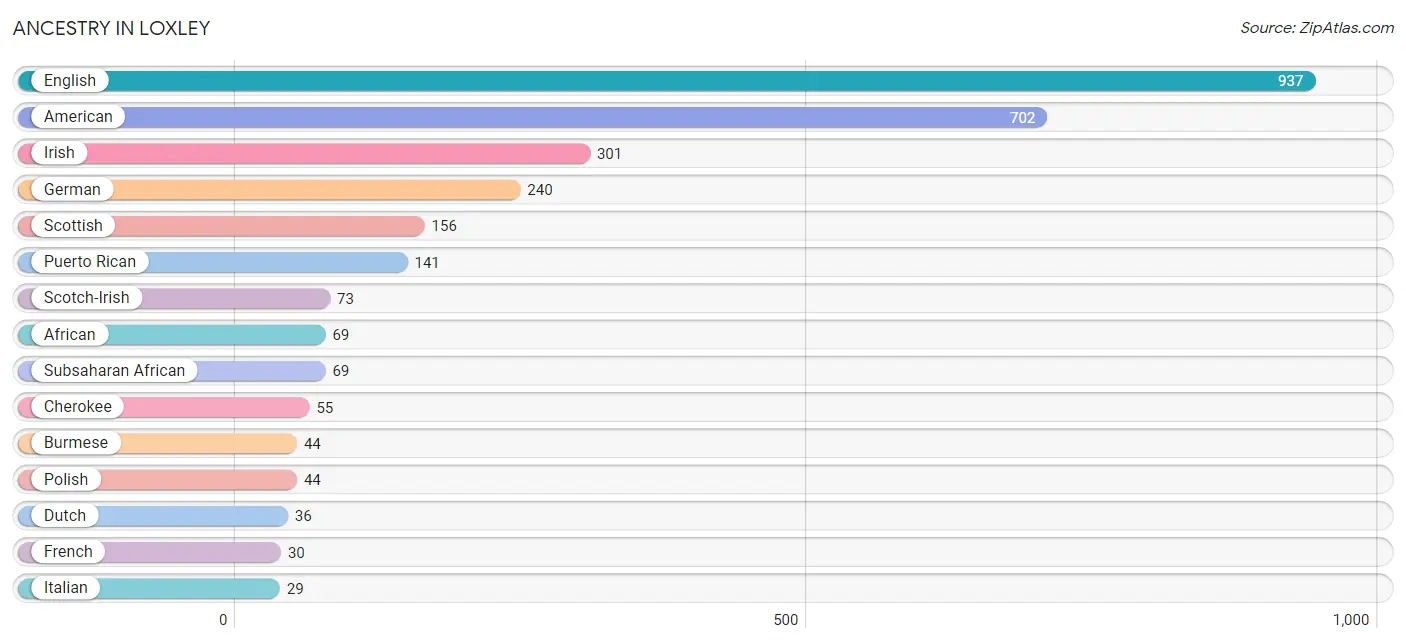
| Ancestry | # Population | % Population |
| African | 69 | 1.8% |
| American | 702 | 18.7% |
| Brazilian | 5 | 0.1% |
| British | 3 | 0.1% |
| Burmese | 44 | 1.2% |
| Cherokee | 55 | 1.5% |
| Czech | 7 | 0.2% |
| Dutch | 36 | 1.0% |
| English | 937 | 24.9% |
| European | 5 | 0.1% |
| French | 30 | 0.8% |
| French Canadian | 7 | 0.2% |
| German | 240 | 6.4% |
| Greek | 4 | 0.1% |
| Haitian | 7 | 0.2% |
| Hungarian | 7 | 0.2% |
| Irish | 301 | 8.0% |
| Italian | 29 | 0.8% |
| Mexican | 7 | 0.2% |
| Norwegian | 16 | 0.4% |
| Polish | 44 | 1.2% |
| Puerto Rican | 141 | 3.7% |
| Russian | 13 | 0.4% |
| Scandinavian | 12 | 0.3% |
| Scotch-Irish | 73 | 1.9% |
| Scottish | 156 | 4.2% |
| Subsaharan African | 69 | 1.8% |
| Swedish | 13 | 0.4% |
| Welsh | 20 | 0.5% | View All 29 Rows |
Immigrants in Loxley
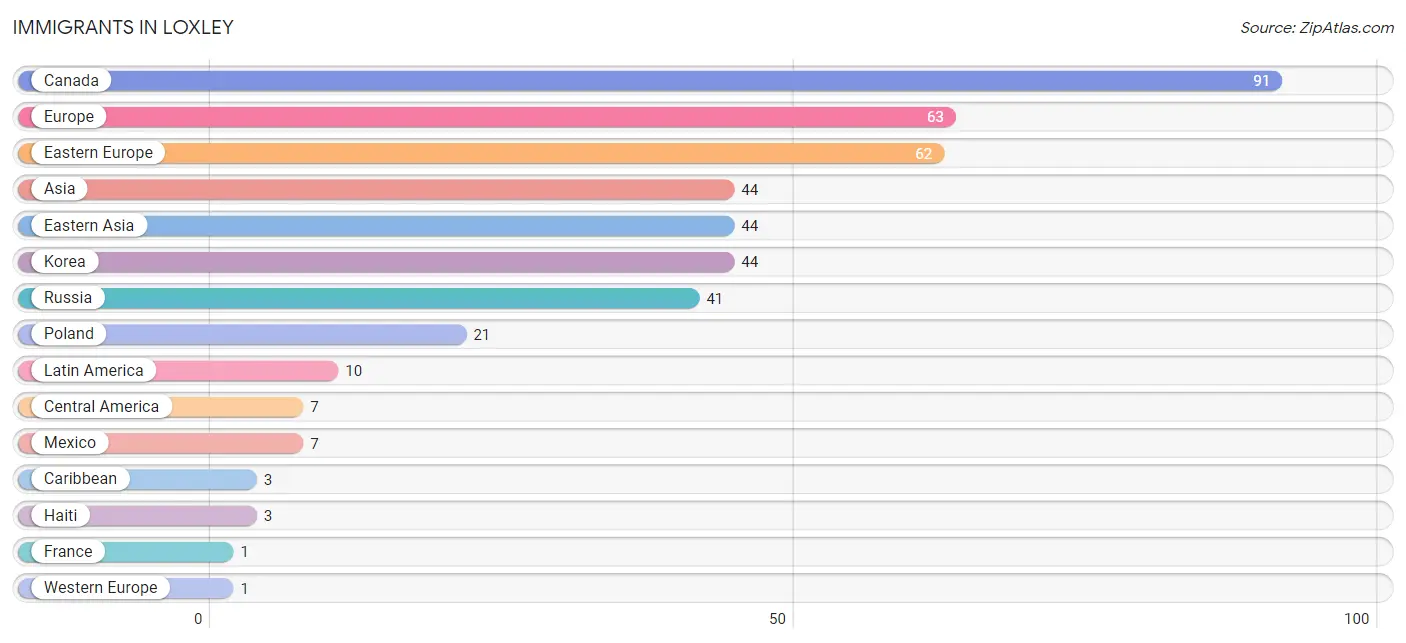
The most numerous immigrant groups reported in Loxley came from Canada (91 | 2.4%), Europe (63 | 1.7%), Eastern Europe (62 | 1.7%), Asia (44 | 1.2%), and Eastern Asia (44 | 1.2%), together accounting for 8.1% of all Loxley residents.
| Immigration Origin | # Population | % Population |
| Asia | 44 | 1.2% |
| Canada | 91 | 2.4% |
| Caribbean | 3 | 0.1% |
| Central America | 7 | 0.2% |
| Eastern Asia | 44 | 1.2% |
| Eastern Europe | 62 | 1.7% |
| Europe | 63 | 1.7% |
| France | 1 | 0.0% |
| Haiti | 3 | 0.1% |
| Korea | 44 | 1.2% |
| Latin America | 10 | 0.3% |
| Mexico | 7 | 0.2% |
| Poland | 21 | 0.6% |
| Russia | 41 | 1.1% |
| Western Europe | 1 | 0.0% | View All 15 Rows |
Sex and Age in Loxley
Sex and Age in Loxley
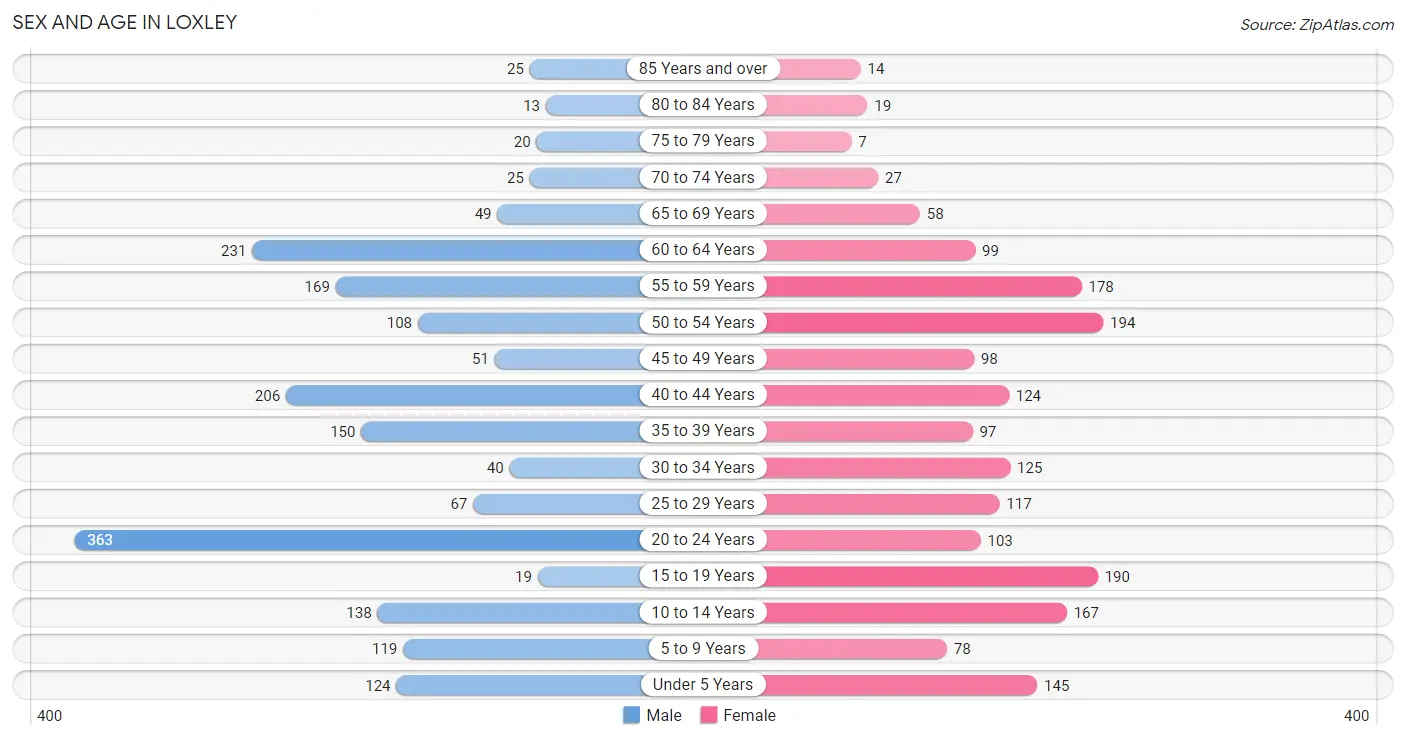
The most populous age groups in Loxley are 20 to 24 Years (363 | 18.9%) for men and 50 to 54 Years (194 | 10.5%) for women.
| Age Bracket | Male | Female |
| Under 5 Years | 124 (6.5%) | 145 (7.9%) |
| 5 to 9 Years | 119 (6.2%) | 78 (4.2%) |
| 10 to 14 Years | 138 (7.2%) | 167 (9.1%) |
| 15 to 19 Years | 19 (1.0%) | 190 (10.3%) |
| 20 to 24 Years | 363 (18.9%) | 103 (5.6%) |
| 25 to 29 Years | 67 (3.5%) | 117 (6.4%) |
| 30 to 34 Years | 40 (2.1%) | 125 (6.8%) |
| 35 to 39 Years | 150 (7.8%) | 97 (5.3%) |
| 40 to 44 Years | 206 (10.7%) | 124 (6.7%) |
| 45 to 49 Years | 51 (2.7%) | 98 (5.3%) |
| 50 to 54 Years | 108 (5.6%) | 194 (10.5%) |
| 55 to 59 Years | 169 (8.8%) | 178 (9.7%) |
| 60 to 64 Years | 231 (12.0%) | 99 (5.4%) |
| 65 to 69 Years | 49 (2.6%) | 58 (3.2%) |
| 70 to 74 Years | 25 (1.3%) | 27 (1.5%) |
| 75 to 79 Years | 20 (1.0%) | 7 (0.4%) |
| 80 to 84 Years | 13 (0.7%) | 19 (1.0%) |
| 85 Years and over | 25 (1.3%) | 14 (0.8%) |
| Total | 1,917 (100.0%) | 1,840 (100.0%) |
Families and Households in Loxley
Median Family Size in Loxley
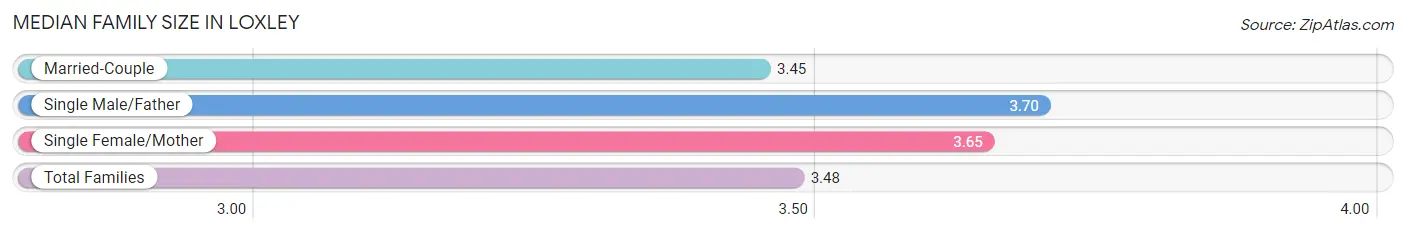
The median family size in Loxley is 3.48 persons per family, with single male/father families (53 | 5.2%) accounting for the largest median family size of 3.7 persons per family. On the other hand, married-couple families (871 | 85.6%) represent the smallest median family size with 3.45 persons per family.
| Family Type | # Families | Family Size |
| Married-Couple | 871 (85.6%) | 3.45 |
| Single Male/Father | 53 (5.2%) | 3.70 |
| Single Female/Mother | 94 (9.2%) | 3.65 |
| Total Families | 1,018 (100.0%) | 3.48 |
Median Household Size in Loxley
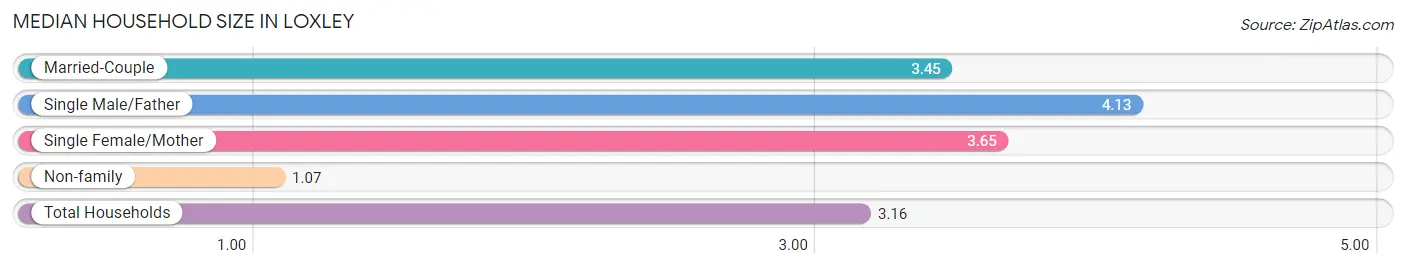
The median household size in Loxley is 3.16 persons per household, with single male/father households (53 | 4.5%) accounting for the largest median household size of 4.13 persons per household. non-family households (166 | 14.0%) represent the smallest median household size with 1.07 persons per household.
| Household Type | # Households | Household Size |
| Married-Couple | 871 (73.6%) | 3.45 |
| Single Male/Father | 53 (4.5%) | 4.13 |
| Single Female/Mother | 94 (7.9%) | 3.65 |
| Non-family | 166 (14.0%) | 1.07 |
| Total Households | 1,184 (100.0%) | 3.16 |
Household Size by Marriage Status in Loxley
Out of a total of 1,184 households in Loxley, 1,018 (86.0%) are family households, while 166 (14.0%) are nonfamily households. The most numerous type of family households are 2-person households, comprising 415, and the most common type of nonfamily households are 1-person households, comprising 153.
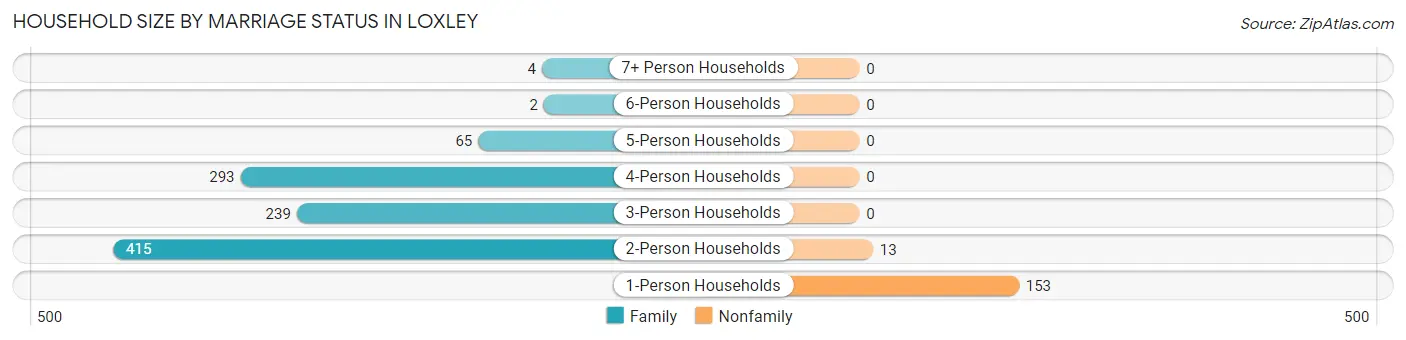
| Household Size | Family Households | Nonfamily Households |
| 1-Person Households | - | 153 (12.9%) |
| 2-Person Households | 415 (35.0%) | 13 (1.1%) |
| 3-Person Households | 239 (20.2%) | 0 (0.0%) |
| 4-Person Households | 293 (24.7%) | 0 (0.0%) |
| 5-Person Households | 65 (5.5%) | 0 (0.0%) |
| 6-Person Households | 2 (0.2%) | 0 (0.0%) |
| 7+ Person Households | 4 (0.3%) | 0 (0.0%) |
| Total | 1,018 (86.0%) | 166 (14.0%) |
Female Fertility in Loxley
Fertility by Age in Loxley
Average fertility rate in Loxley is 56.0 births per 1,000 women. Women in the age bracket of 20 to 34 years have the highest fertility rate with 142.0 births per 1,000 women. Women in the age bracket of 20 to 34 years acount for 100.0% of all women with births.
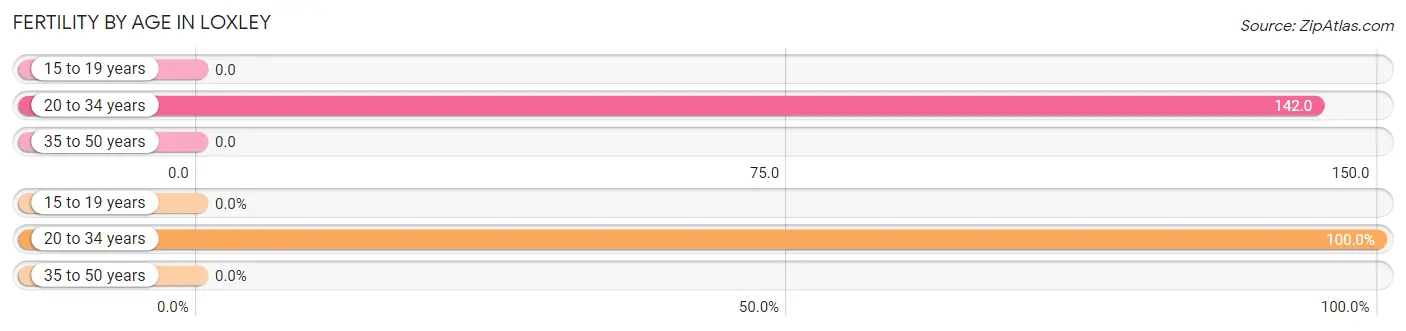
| Age Bracket | Women with Births | Births / 1,000 Women |
| 15 to 19 years | 0 (0.0%) | 0.0 |
| 20 to 34 years | 49 (100.0%) | 142.0 |
| 35 to 50 years | 0 (0.0%) | 0.0 |
| Total | 49 (100.0%) | 56.0 |
Fertility by Age by Marriage Status in Loxley
79.6% of women with births (49) in Loxley are married. The highest percentage of unmarried women with births falls into 20 to 34 years age bracket with 20.4% of them unmarried at the time of birth, while the lowest percentage of unmarried women with births belong to 20 to 34 years age bracket with 20.4% of them unmarried.

| Age Bracket | Married | Unmarried |
| 15 to 19 years | 0 (0.0%) | 0 (0.0%) |
| 20 to 34 years | 39 (79.6%) | 10 (20.4%) |
| 35 to 50 years | 0 (0.0%) | 0 (0.0%) |
| Total | 39 (79.6%) | 10 (20.4%) |
Fertility by Education in Loxley
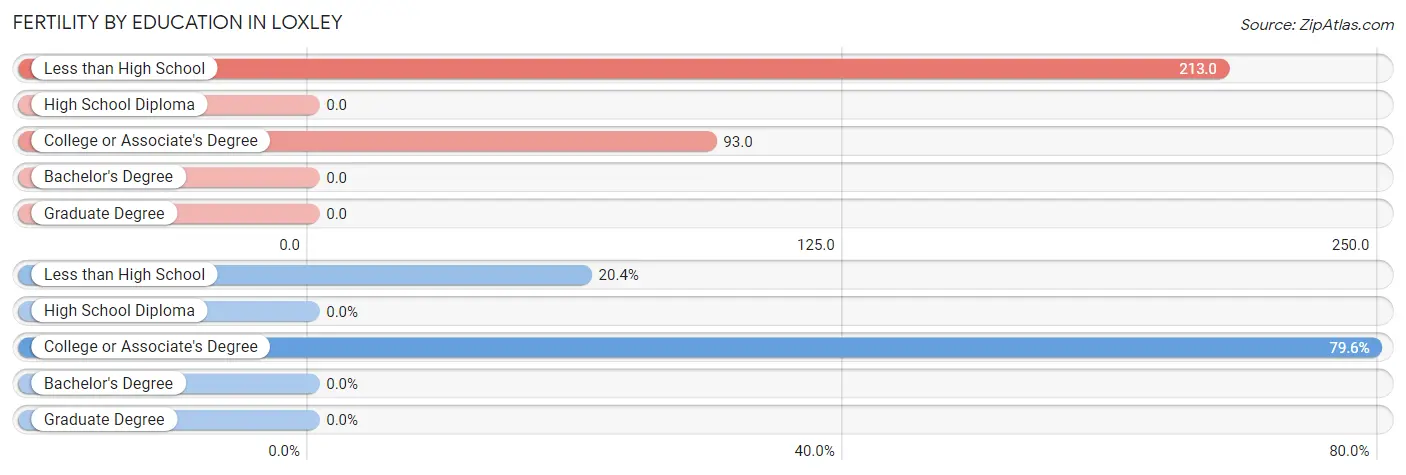
| Educational Attainment | Women with Births | Births / 1,000 Women |
| Less than High School | 10 (20.4%) | 213.0 |
| High School Diploma | 0 (0.0%) | 0.0 |
| College or Associate's Degree | 39 (79.6%) | 93.0 |
| Bachelor's Degree | 0 (0.0%) | 0.0 |
| Graduate Degree | 0 (0.0%) | 0.0 |
| Total | 49 (100.0%) | 56.0 |
Fertility by Education by Marriage Status in Loxley
20.4% of women with births in Loxley are unmarried. Women with the educational attainment of less than high school are most likely to be married with 100.0% of them married at childbirth, while women with the educational attainment of college or associate's degree are least likely to be married with 25.6% of them unmarried at childbirth.
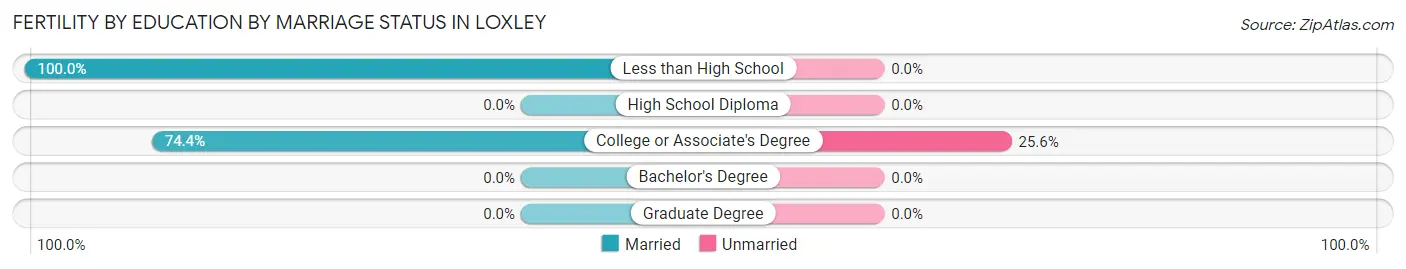
| Educational Attainment | Married | Unmarried |
| Less than High School | 10 (100.0%) | 0 (0.0%) |
| High School Diploma | 0 (0.0%) | 0 (0.0%) |
| College or Associate's Degree | 29 (74.4%) | 10 (25.6%) |
| Bachelor's Degree | 0 (0.0%) | 0 (0.0%) |
| Graduate Degree | 0 (0.0%) | 0 (0.0%) |
| Total | 39 (79.6%) | 10 (20.4%) |
Employment Characteristics in Loxley
Employment by Class of Employer in Loxley
Among the 1,840 employed individuals in Loxley, private company employees (1,306 | 71.0%), local government employees (198 | 10.8%), and self-employed (not incorporated) (109 | 5.9%) make up the most common classes of employment.
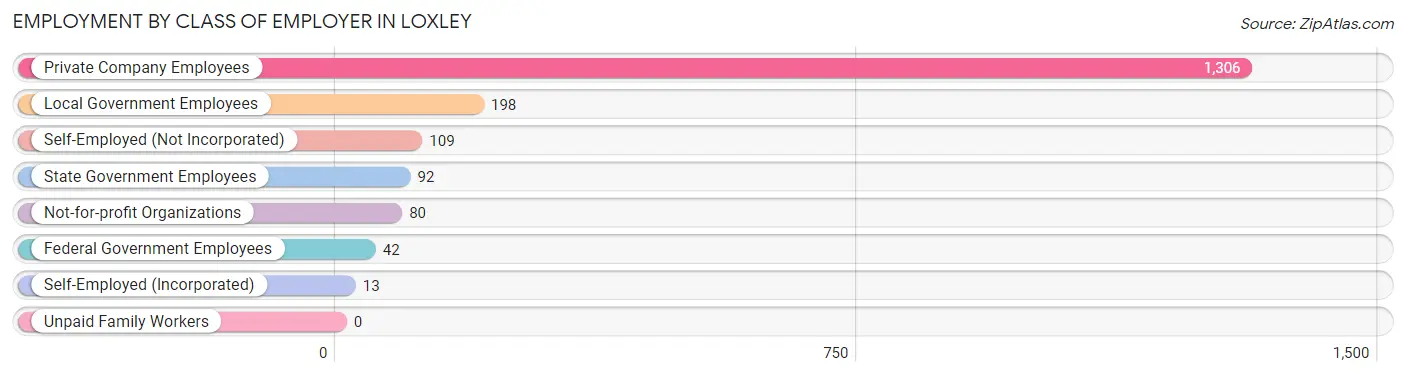
| Employer Class | # Employees | % Employees |
| Private Company Employees | 1,306 | 71.0% |
| Self-Employed (Incorporated) | 13 | 0.7% |
| Self-Employed (Not Incorporated) | 109 | 5.9% |
| Not-for-profit Organizations | 80 | 4.3% |
| Local Government Employees | 198 | 10.8% |
| State Government Employees | 92 | 5.0% |
| Federal Government Employees | 42 | 2.3% |
| Unpaid Family Workers | 0 | 0.0% |
| Total | 1,840 | 100.0% |
Employment Status by Age in Loxley
According to the labor force statistics for Loxley, out of the total population over 16 years of age (2,982), 62.7% or 1,870 individuals are in the labor force, with 1.0% or 19 of them unemployed. The age group with the highest labor force participation rate is 25 to 29 years, with 90.8% or 167 individuals in the labor force. Within the labor force, the 25 to 29 years age range has the highest percentage of unemployed individuals, with 6.0% or 10 of them being unemployed.
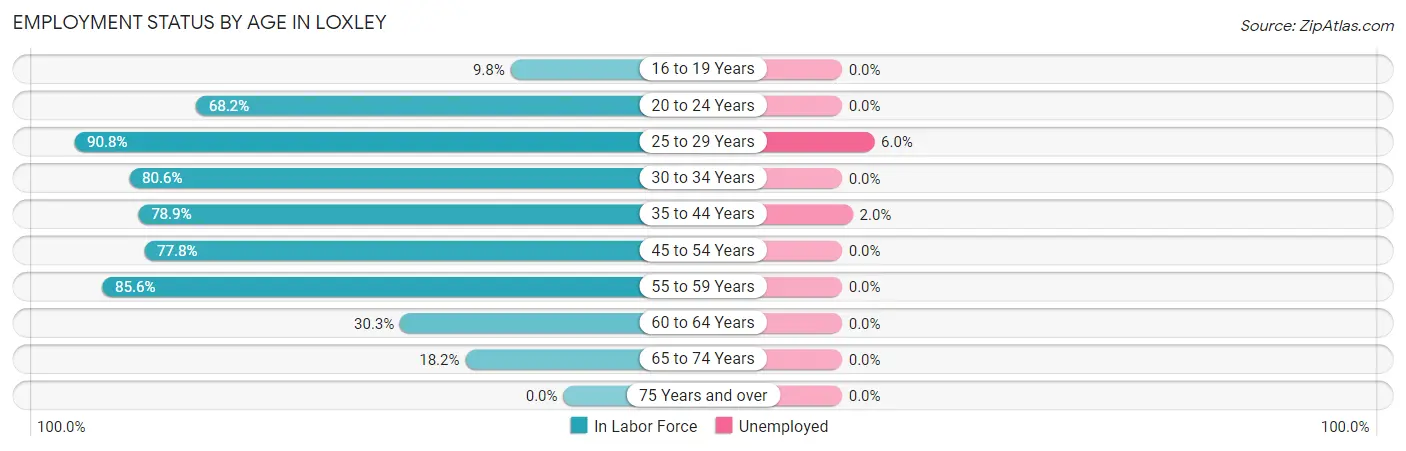
| Age Bracket | In Labor Force | Unemployed |
| 16 to 19 Years | 20 (9.8%) | 0 (0.0%) |
| 20 to 24 Years | 318 (68.2%) | 0 (0.0%) |
| 25 to 29 Years | 167 (90.8%) | 10 (6.0%) |
| 30 to 34 Years | 133 (80.6%) | 0 (0.0%) |
| 35 to 44 Years | 455 (78.9%) | 9 (2.0%) |
| 45 to 54 Years | 351 (77.8%) | 0 (0.0%) |
| 55 to 59 Years | 297 (85.6%) | 0 (0.0%) |
| 60 to 64 Years | 100 (30.3%) | 0 (0.0%) |
| 65 to 74 Years | 29 (18.2%) | 0 (0.0%) |
| 75 Years and over | 0 (0.0%) | 0 (0.0%) |
| Total | 1,870 (62.7%) | 19 (1.0%) |
Employment Status by Educational Attainment in Loxley
According to labor force statistics for Loxley, 73.2% of individuals (1,504) out of the total population between 25 and 64 years of age (2,054) are in the labor force, with 1.3% or 20 of them being unemployed. The group with the highest labor force participation rate are those with the educational attainment of bachelor's degree or higher, with 93.5% or 585 individuals in the labor force. Within the labor force, individuals with less than high school education have the highest percentage of unemployment, with 9.2% or 9 of them being unemployed.
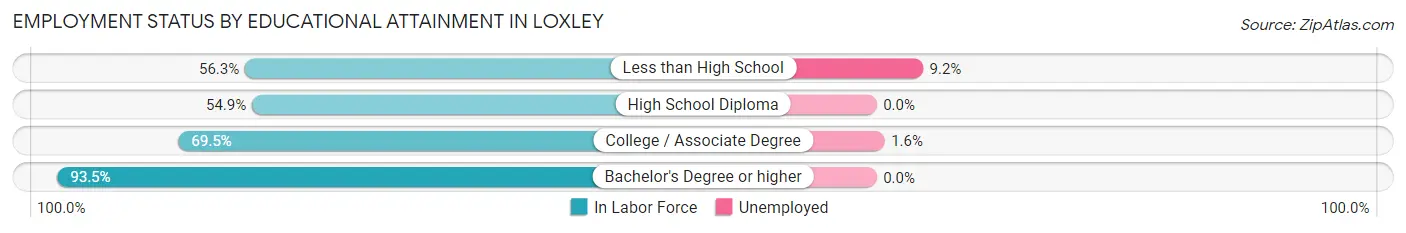
| Educational Attainment | In Labor Force | Unemployed |
| Less than High School | 98 (56.3%) | 16 (9.2%) |
| High School Diploma | 195 (54.9%) | 0 (0.0%) |
| College / Associate Degree | 625 (69.5%) | 14 (1.6%) |
| Bachelor's Degree or higher | 585 (93.5%) | 0 (0.0%) |
| Total | 1,504 (73.2%) | 27 (1.3%) |
Employment Occupations by Sex in Loxley
Management, Business, Science and Arts Occupations
The most common Management, Business, Science and Arts occupations in Loxley are Management (276 | 15.0%), Community & Social Service (276 | 15.0%), Education Instruction & Library (214 | 11.6%), Health Diagnosing & Treating (147 | 8.0%), and Health Technologists (141 | 7.7%).
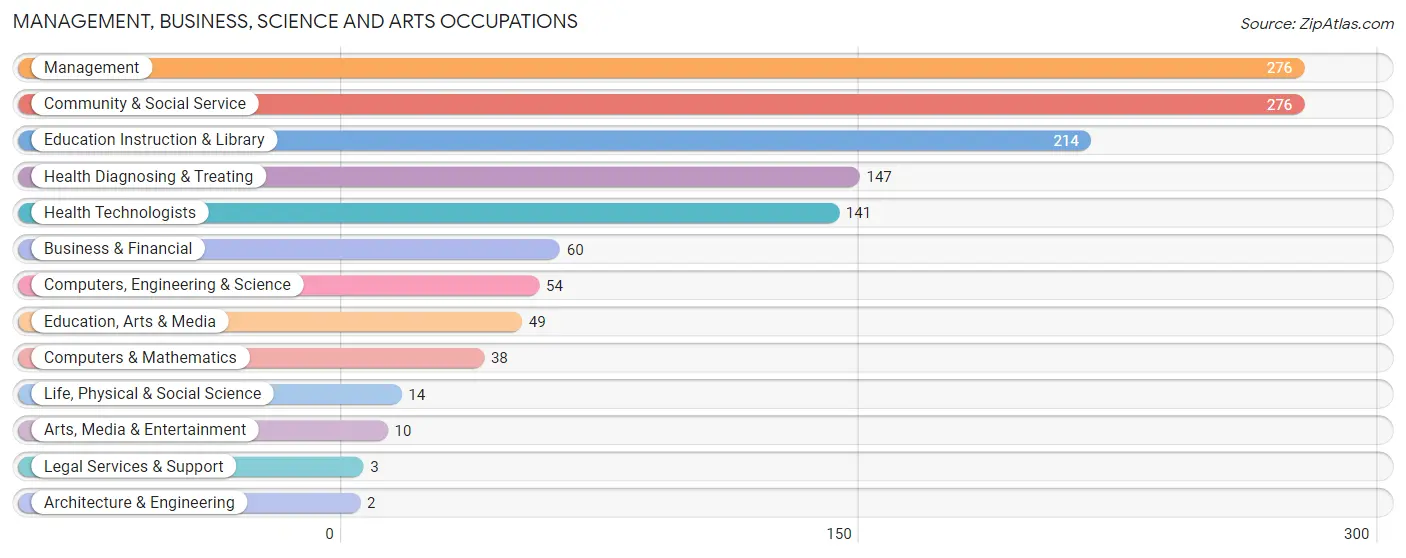
Management, Business, Science and Arts Occupations by Sex
Within the Management, Business, Science and Arts occupations in Loxley, the most male-oriented occupations are Architecture & Engineering (100.0%), Life, Physical & Social Science (100.0%), and Computers, Engineering & Science (83.3%), while the most female-oriented occupations are Legal Services & Support (100.0%), Education, Arts & Media (91.8%), and Health Diagnosing & Treating (80.3%).
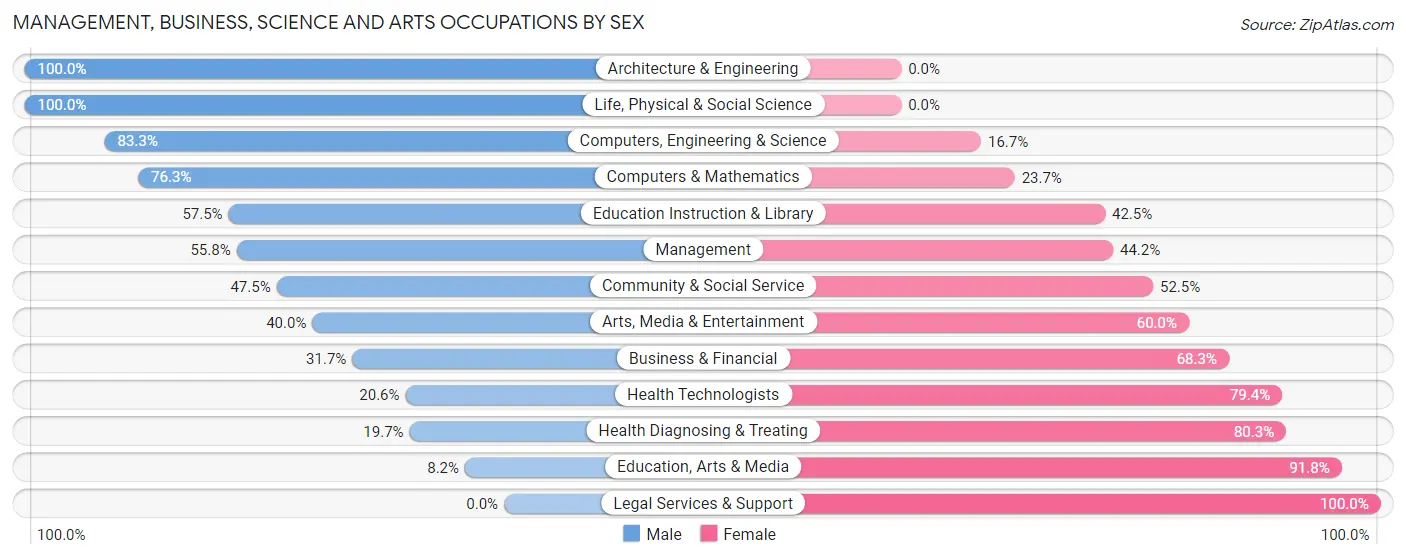
| Occupation | Male | Female |
| Management | 154 (55.8%) | 122 (44.2%) |
| Business & Financial | 19 (31.7%) | 41 (68.3%) |
| Computers, Engineering & Science | 45 (83.3%) | 9 (16.7%) |
| Computers & Mathematics | 29 (76.3%) | 9 (23.7%) |
| Architecture & Engineering | 2 (100.0%) | 0 (0.0%) |
| Life, Physical & Social Science | 14 (100.0%) | 0 (0.0%) |
| Community & Social Service | 131 (47.5%) | 145 (52.5%) |
| Education, Arts & Media | 4 (8.2%) | 45 (91.8%) |
| Legal Services & Support | 0 (0.0%) | 3 (100.0%) |
| Education Instruction & Library | 123 (57.5%) | 91 (42.5%) |
| Arts, Media & Entertainment | 4 (40.0%) | 6 (60.0%) |
| Health Diagnosing & Treating | 29 (19.7%) | 118 (80.3%) |
| Health Technologists | 29 (20.6%) | 112 (79.4%) |
| Total (Category) | 378 (46.5%) | 435 (53.5%) |
| Total (Overall) | 1,023 (55.6%) | 817 (44.4%) |
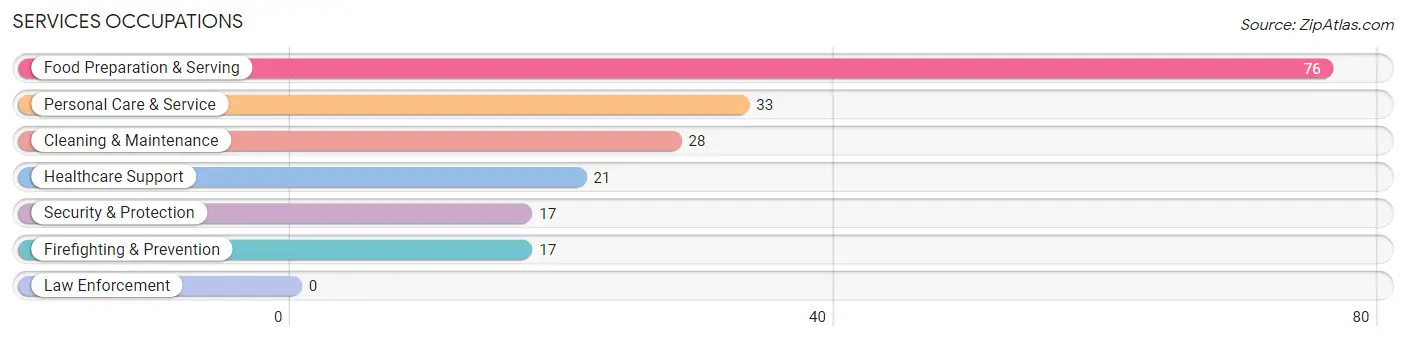
Services Occupations
The most common Services occupations in Loxley are Food Preparation & Serving (76 | 4.1%), Personal Care & Service (33 | 1.8%), Cleaning & Maintenance (28 | 1.5%), Healthcare Support (21 | 1.1%), and Security & Protection (17 | 0.9%).
Services Occupations by Sex
Within the Services occupations in Loxley, the most male-oriented occupations are Security & Protection (100.0%), Firefighting & Prevention (100.0%), and Cleaning & Maintenance (21.4%), while the most female-oriented occupations are Healthcare Support (100.0%), Personal Care & Service (100.0%), and Food Preparation & Serving (84.2%).
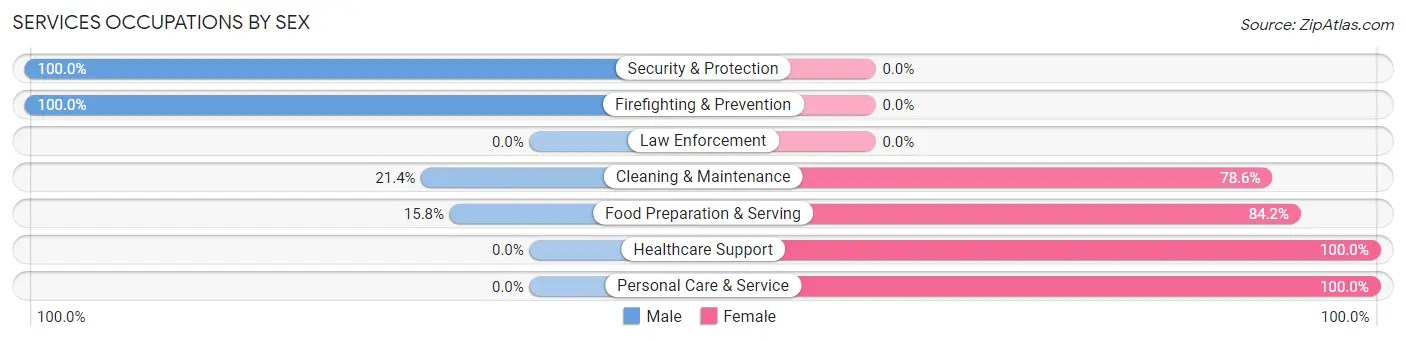
| Occupation | Male | Female |
| Healthcare Support | 0 (0.0%) | 21 (100.0%) |
| Security & Protection | 17 (100.0%) | 0 (0.0%) |
| Firefighting & Prevention | 17 (100.0%) | 0 (0.0%) |
| Law Enforcement | 0 (0.0%) | 0 (0.0%) |
| Food Preparation & Serving | 12 (15.8%) | 64 (84.2%) |
| Cleaning & Maintenance | 6 (21.4%) | 22 (78.6%) |
| Personal Care & Service | 0 (0.0%) | 33 (100.0%) |
| Total (Category) | 35 (20.0%) | 140 (80.0%) |
| Total (Overall) | 1,023 (55.6%) | 817 (44.4%) |
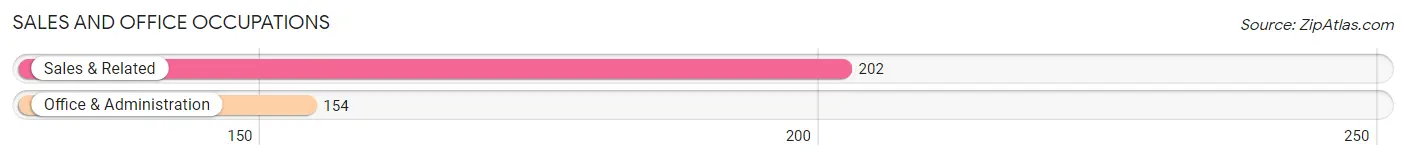
Sales and Office Occupations
The most common Sales and Office occupations in Loxley are Sales & Related (202 | 11.0%), and Office & Administration (154 | 8.4%).
Sales and Office Occupations by Sex
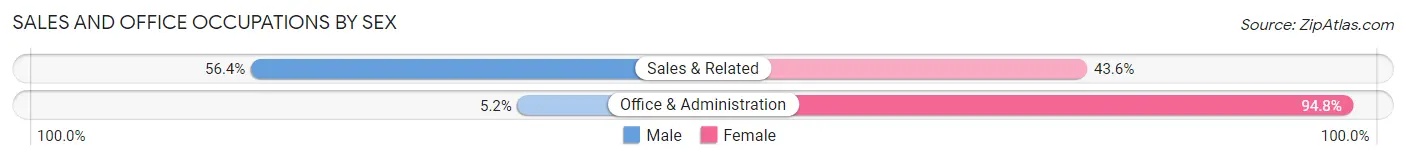
| Occupation | Male | Female |
| Sales & Related | 114 (56.4%) | 88 (43.6%) |
| Office & Administration | 8 (5.2%) | 146 (94.8%) |
| Total (Category) | 122 (34.3%) | 234 (65.7%) |
| Total (Overall) | 1,023 (55.6%) | 817 (44.4%) |
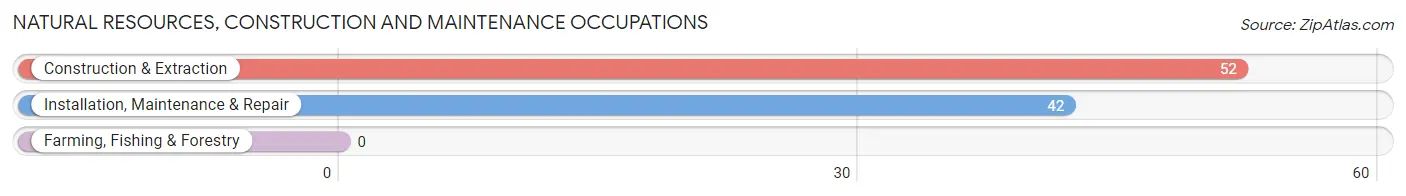
Natural Resources, Construction and Maintenance Occupations
The most common Natural Resources, Construction and Maintenance occupations in Loxley are Construction & Extraction (52 | 2.8%), and Installation, Maintenance & Repair (42 | 2.3%).
Natural Resources, Construction and Maintenance Occupations by Sex
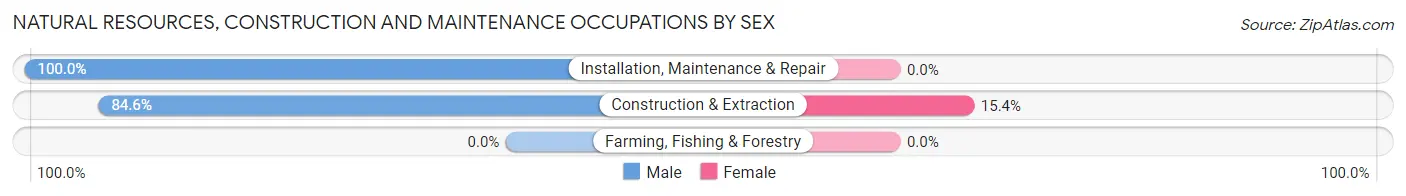
| Occupation | Male | Female |
| Farming, Fishing & Forestry | 0 (0.0%) | 0 (0.0%) |
| Construction & Extraction | 44 (84.6%) | 8 (15.4%) |
| Installation, Maintenance & Repair | 42 (100.0%) | 0 (0.0%) |
| Total (Category) | 86 (91.5%) | 8 (8.5%) |
| Total (Overall) | 1,023 (55.6%) | 817 (44.4%) |
Production, Transportation and Moving Occupations
The most common Production, Transportation and Moving occupations in Loxley are Production (194 | 10.5%), Material Moving (179 | 9.7%), and Transportation (29 | 1.6%).
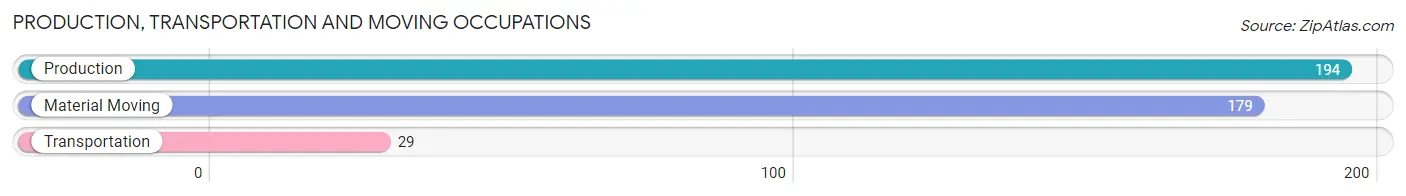
Production, Transportation and Moving Occupations by Sex
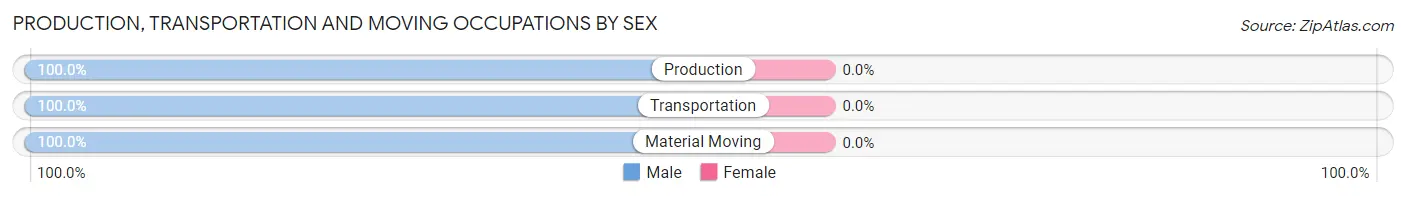
| Occupation | Male | Female |
| Production | 194 (100.0%) | 0 (0.0%) |
| Transportation | 29 (100.0%) | 0 (0.0%) |
| Material Moving | 179 (100.0%) | 0 (0.0%) |
| Total (Category) | 402 (100.0%) | 0 (0.0%) |
| Total (Overall) | 1,023 (55.6%) | 817 (44.4%) |
Employment Industries by Sex in Loxley
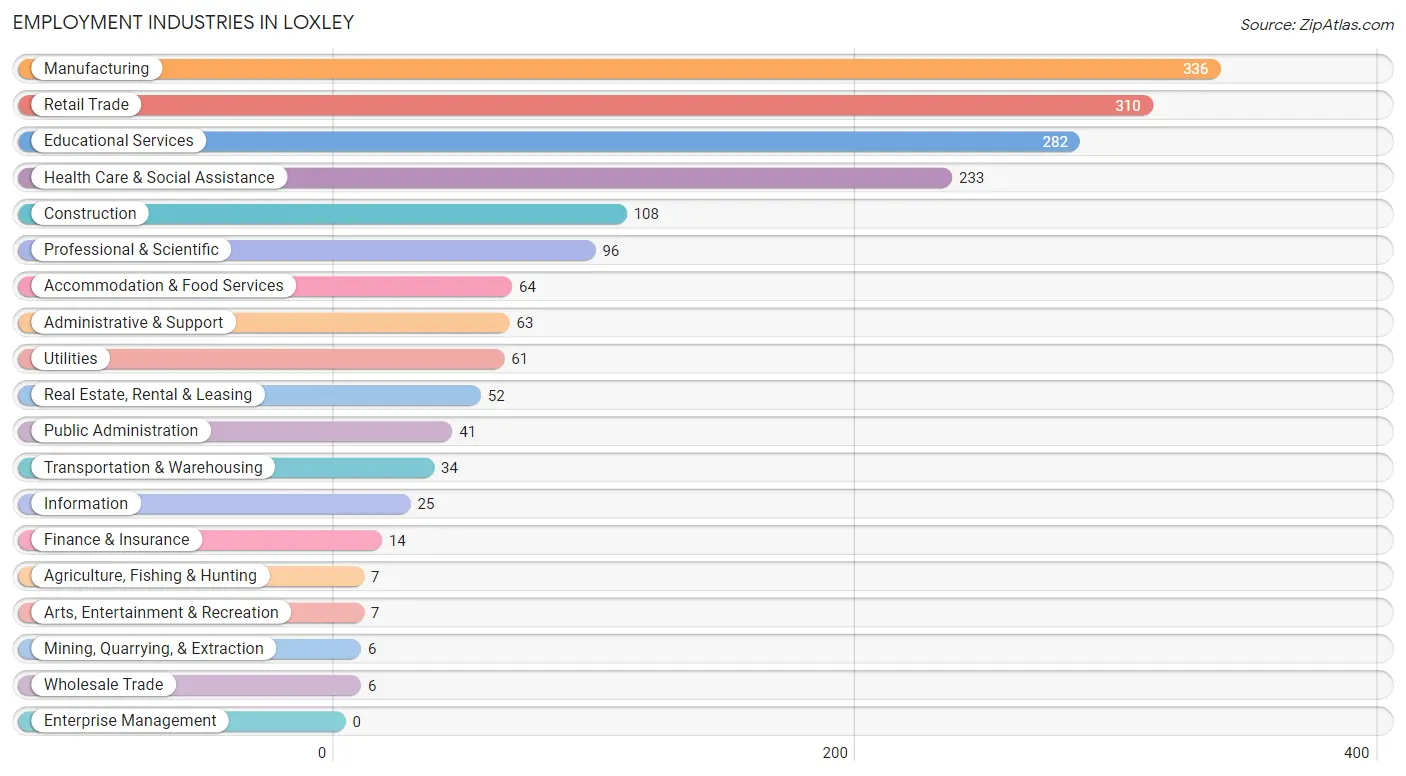
Employment Industries in Loxley
The major employment industries in Loxley include Manufacturing (336 | 18.3%), Retail Trade (310 | 16.9%), Educational Services (282 | 15.3%), Health Care & Social Assistance (233 | 12.7%), and Construction (108 | 5.9%).
Employment Industries by Sex in Loxley
The Loxley industries that see more men than women are Agriculture, Fishing & Hunting (100.0%), Mining, Quarrying, & Extraction (100.0%), and Manufacturing (100.0%), whereas the industries that tend to have a higher number of women are Arts, Entertainment & Recreation (100.0%), Professional & Scientific (99.0%), and Accommodation & Food Services (92.2%).
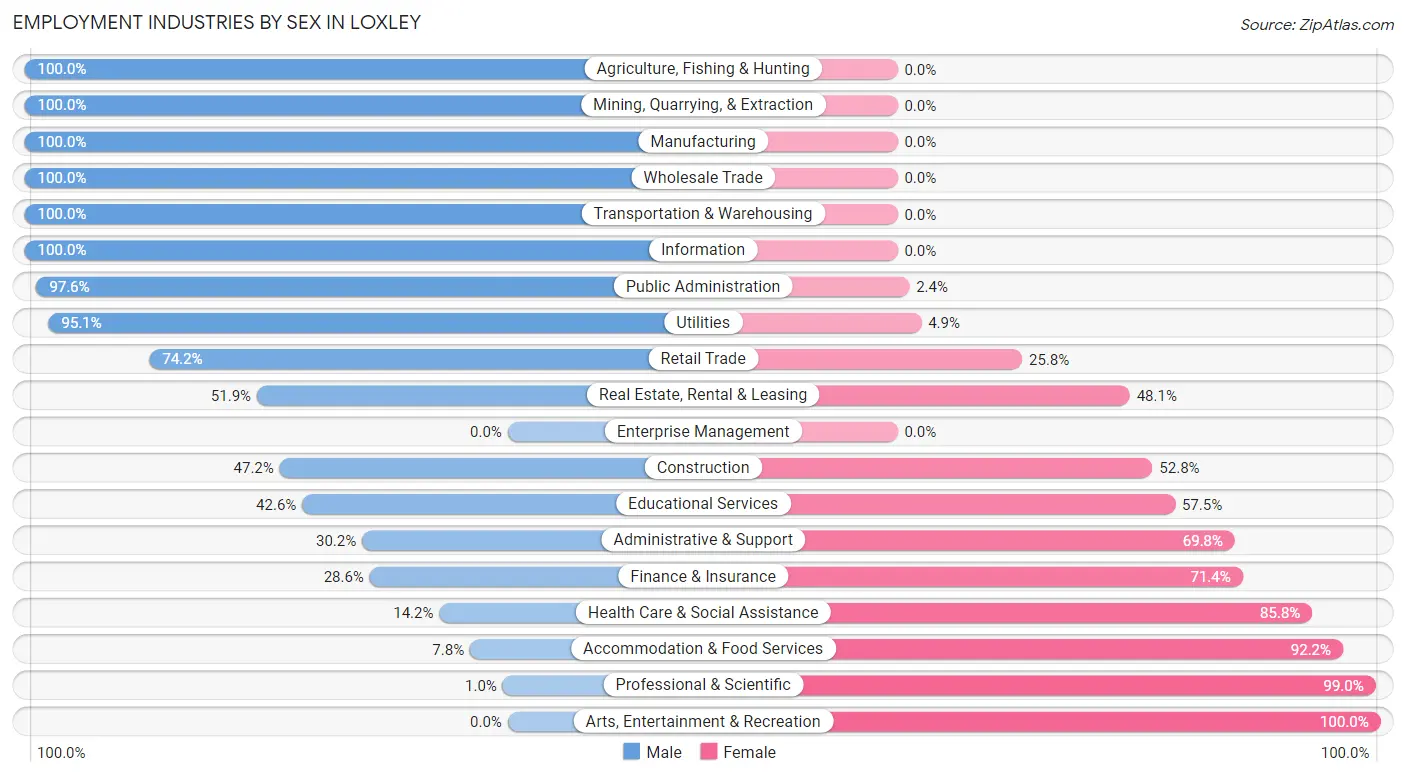
| Industry | Male | Female |
| Agriculture, Fishing & Hunting | 7 (100.0%) | 0 (0.0%) |
| Mining, Quarrying, & Extraction | 6 (100.0%) | 0 (0.0%) |
| Construction | 51 (47.2%) | 57 (52.8%) |
| Manufacturing | 336 (100.0%) | 0 (0.0%) |
| Wholesale Trade | 6 (100.0%) | 0 (0.0%) |
| Retail Trade | 230 (74.2%) | 80 (25.8%) |
| Transportation & Warehousing | 34 (100.0%) | 0 (0.0%) |
| Utilities | 58 (95.1%) | 3 (4.9%) |
| Information | 25 (100.0%) | 0 (0.0%) |
| Finance & Insurance | 4 (28.6%) | 10 (71.4%) |
| Real Estate, Rental & Leasing | 27 (51.9%) | 25 (48.1%) |
| Professional & Scientific | 1 (1.0%) | 95 (99.0%) |
| Enterprise Management | 0 (0.0%) | 0 (0.0%) |
| Administrative & Support | 19 (30.2%) | 44 (69.8%) |
| Educational Services | 120 (42.5%) | 162 (57.5%) |
| Health Care & Social Assistance | 33 (14.2%) | 200 (85.8%) |
| Arts, Entertainment & Recreation | 0 (0.0%) | 7 (100.0%) |
| Accommodation & Food Services | 5 (7.8%) | 59 (92.2%) |
| Public Administration | 40 (97.6%) | 1 (2.4%) |
| Total | 1,023 (55.6%) | 817 (44.4%) |
Education in Loxley
School Enrollment in Loxley
The most common levels of schooling among the 1,066 students in Loxley are college / undergraduate (289 | 27.1%), middle school (268 | 25.1%), and high school (173 | 16.2%).
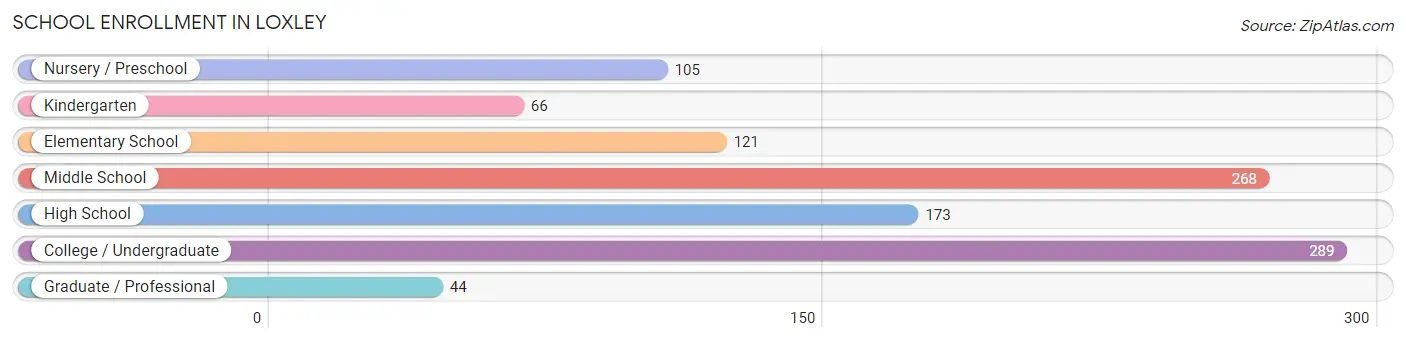
| School Level | # Students | % Students |
| Nursery / Preschool | 105 | 9.9% |
| Kindergarten | 66 | 6.2% |
| Elementary School | 121 | 11.4% |
| Middle School | 268 | 25.1% |
| High School | 173 | 16.2% |
| College / Undergraduate | 289 | 27.1% |
| Graduate / Professional | 44 | 4.1% |
| Total | 1,066 | 100.0% |
School Enrollment by Age by Funding Source in Loxley
Out of a total of 1,066 students who are enrolled in schools in Loxley, 403 (37.8%) attend a private institution, while the remaining 663 (62.2%) are enrolled in public schools. The age group of 20 to 24 year olds has the highest likelihood of being enrolled in private schools, with 145 (73.2% in the age bracket) enrolled. Conversely, the age group of 25 to 34 year olds has the lowest likelihood of being enrolled in a private school, with 32 (100.0% in the age bracket) attending a public institution.
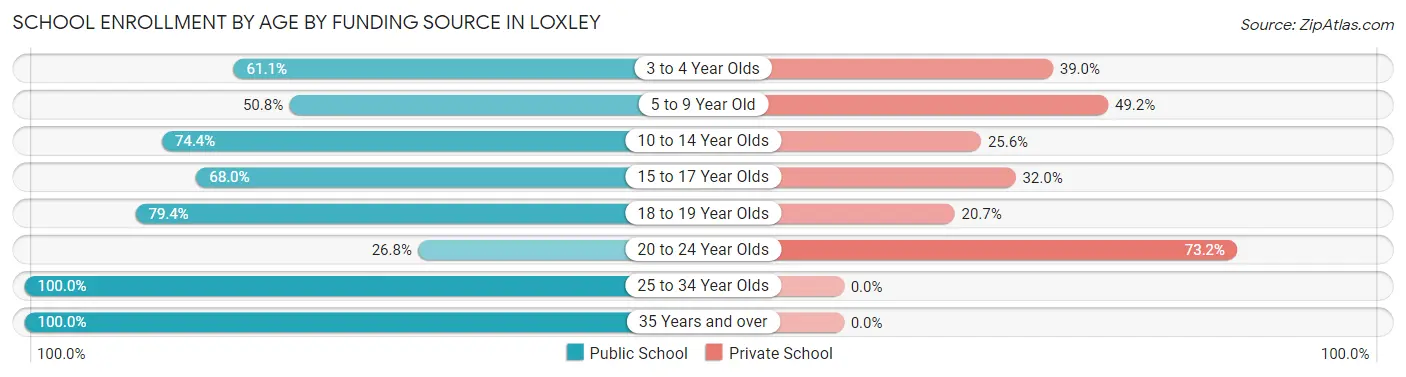
| Age Bracket | Public School | Private School |
| 3 to 4 Year Olds | 58 (61.1%) | 37 (39.0%) |
| 5 to 9 Year Old | 100 (50.8%) | 97 (49.2%) |
| 10 to 14 Year Olds | 227 (74.4%) | 78 (25.6%) |
| 15 to 17 Year Olds | 17 (68.0%) | 8 (32.0%) |
| 18 to 19 Year Olds | 146 (79.3%) | 38 (20.6%) |
| 20 to 24 Year Olds | 53 (26.8%) | 145 (73.2%) |
| 25 to 34 Year Olds | 32 (100.0%) | 0 (0.0%) |
| 35 Years and over | 30 (100.0%) | 0 (0.0%) |
| Total | 663 (62.2%) | 403 (37.8%) |
Educational Attainment by Field of Study in Loxley
Business (160 | 23.3%), science & technology (149 | 21.7%), bio, nature & agricultural (84 | 12.2%), education (84 | 12.2%), and arts & humanities (83 | 12.1%) are the most common fields of study among 686 individuals in Loxley who have obtained a bachelor's degree or higher.
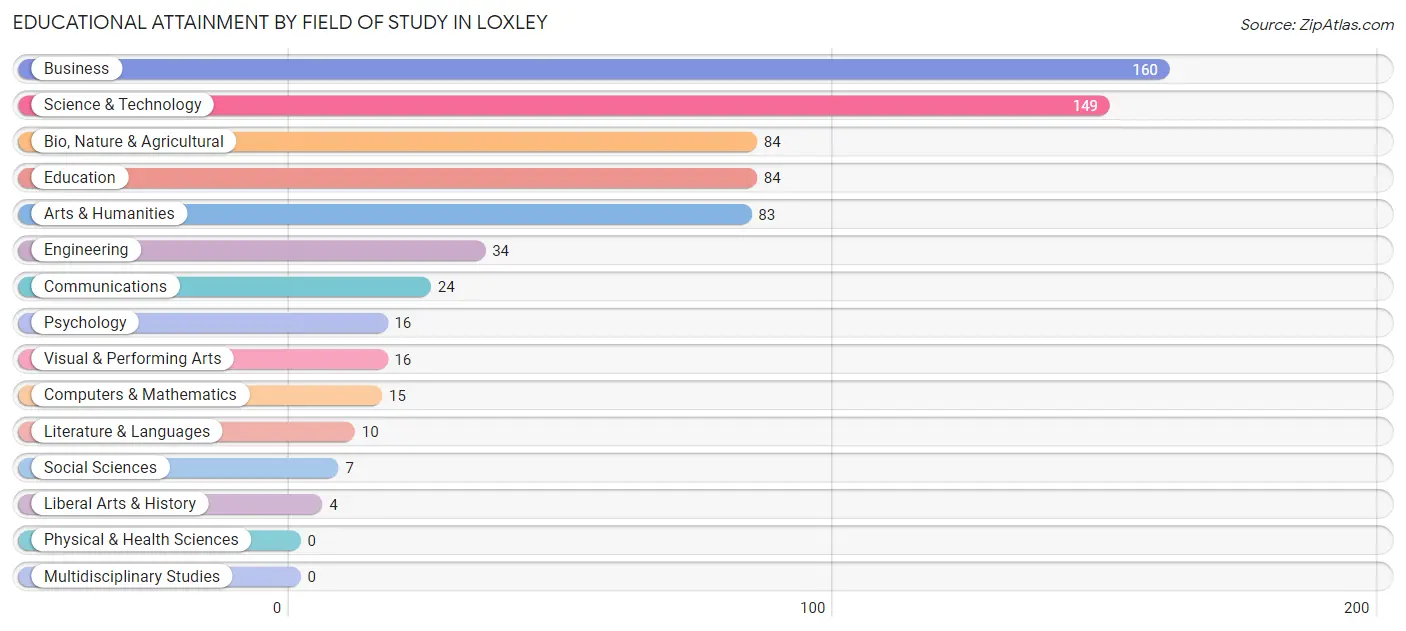
| Field of Study | # Graduates | % Graduates |
| Computers & Mathematics | 15 | 2.2% |
| Bio, Nature & Agricultural | 84 | 12.2% |
| Physical & Health Sciences | 0 | 0.0% |
| Psychology | 16 | 2.3% |
| Social Sciences | 7 | 1.0% |
| Engineering | 34 | 5.0% |
| Multidisciplinary Studies | 0 | 0.0% |
| Science & Technology | 149 | 21.7% |
| Business | 160 | 23.3% |
| Education | 84 | 12.2% |
| Literature & Languages | 10 | 1.5% |
| Liberal Arts & History | 4 | 0.6% |
| Visual & Performing Arts | 16 | 2.3% |
| Communications | 24 | 3.5% |
| Arts & Humanities | 83 | 12.1% |
| Total | 686 | 100.0% |
Transportation & Commute in Loxley
Vehicle Availability by Sex in Loxley
The most prevalent vehicle ownership categories in Loxley are males with 2 vehicles (571, accounting for 55.4%) and females with 2 vehicles (437, making up 70.6%).
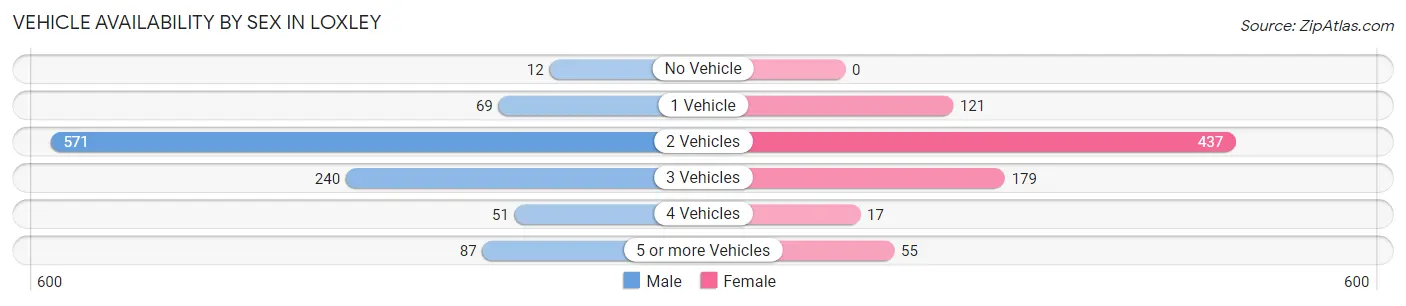
| Vehicles Available | Male | Female |
| No Vehicle | 12 (1.2%) | 0 (0.0%) |
| 1 Vehicle | 69 (6.7%) | 121 (15.0%) |
| 2 Vehicles | 571 (55.4%) | 437 (54.0%) |
| 3 Vehicles | 240 (23.3%) | 179 (22.1%) |
| 4 Vehicles | 51 (5.0%) | 17 (2.1%) |
| 5 or more Vehicles | 87 (8.5%) | 55 (6.8%) |
| Total | 1,030 (100.0%) | 809 (100.0%) |
Commute Time in Loxley
The most frequently occuring commute durations in Loxley are 15 to 19 minutes (388 commuters, 23.5%), 30 to 34 minutes (303 commuters, 18.4%), and 20 to 24 minutes (197 commuters, 11.9%).
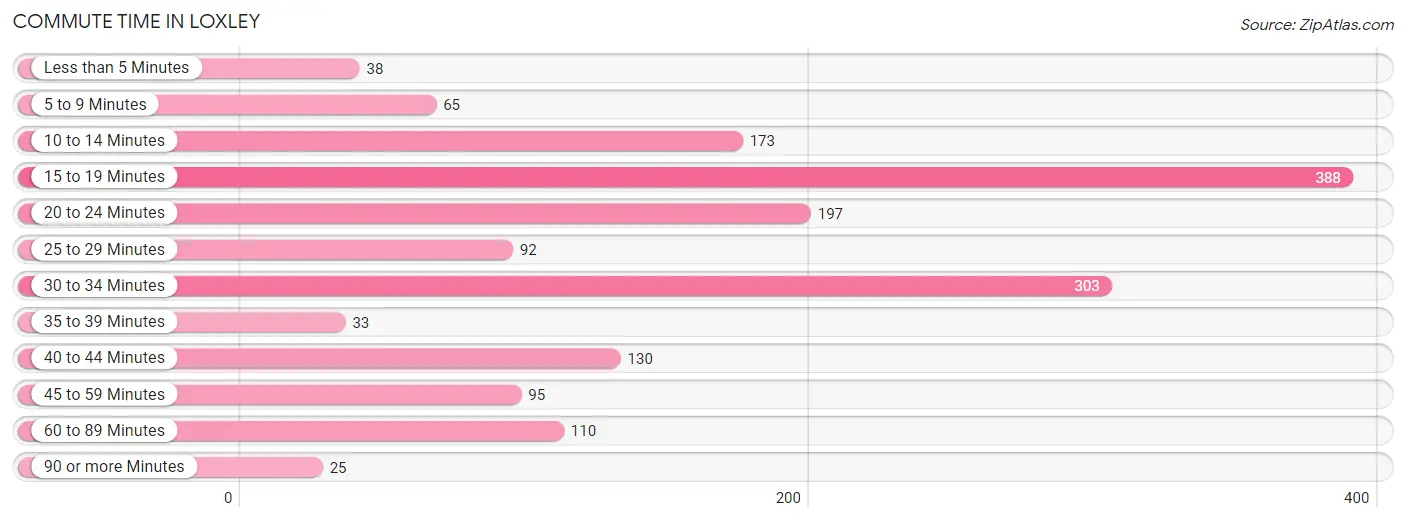
| Commute Time | # Commuters | % Commuters |
| Less than 5 Minutes | 38 | 2.3% |
| 5 to 9 Minutes | 65 | 3.9% |
| 10 to 14 Minutes | 173 | 10.5% |
| 15 to 19 Minutes | 388 | 23.5% |
| 20 to 24 Minutes | 197 | 11.9% |
| 25 to 29 Minutes | 92 | 5.6% |
| 30 to 34 Minutes | 303 | 18.4% |
| 35 to 39 Minutes | 33 | 2.0% |
| 40 to 44 Minutes | 130 | 7.9% |
| 45 to 59 Minutes | 95 | 5.8% |
| 60 to 89 Minutes | 110 | 6.7% |
| 90 or more Minutes | 25 | 1.5% |
Commute Time by Sex in Loxley
The most common commute times in Loxley are 15 to 19 minutes (284 commuters, 29.7%) for males and 30 to 34 minutes (134 commuters, 19.3%) for females.
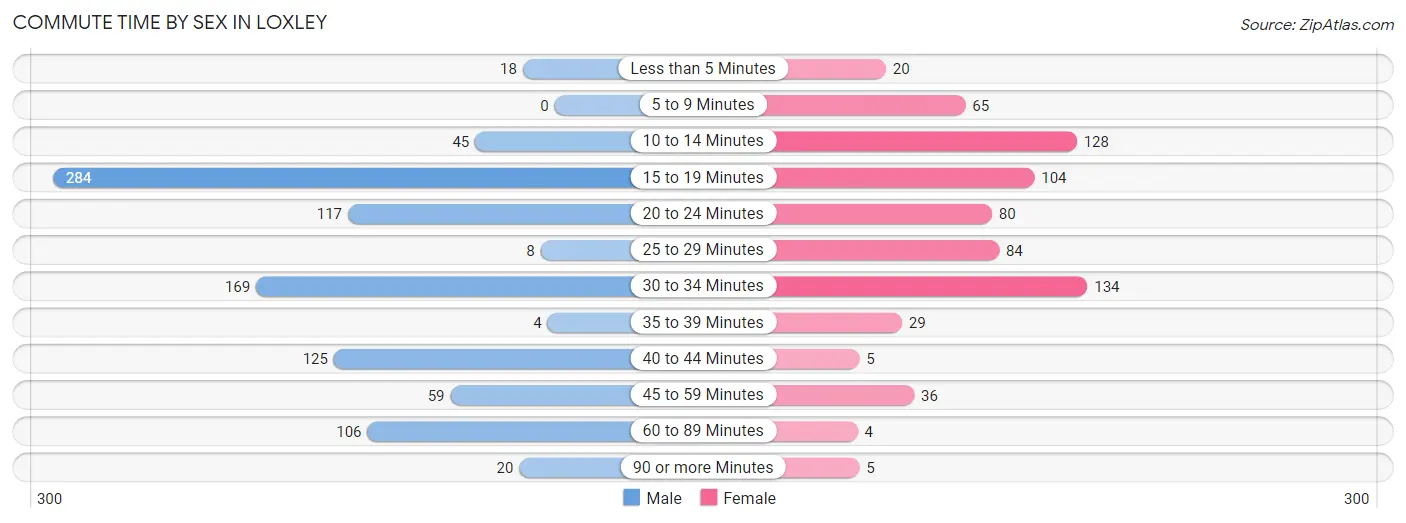
| Commute Time | Male | Female |
| Less than 5 Minutes | 18 (1.9%) | 20 (2.9%) |
| 5 to 9 Minutes | 0 (0.0%) | 65 (9.4%) |
| 10 to 14 Minutes | 45 (4.7%) | 128 (18.4%) |
| 15 to 19 Minutes | 284 (29.7%) | 104 (15.0%) |
| 20 to 24 Minutes | 117 (12.2%) | 80 (11.5%) |
| 25 to 29 Minutes | 8 (0.8%) | 84 (12.1%) |
| 30 to 34 Minutes | 169 (17.7%) | 134 (19.3%) |
| 35 to 39 Minutes | 4 (0.4%) | 29 (4.2%) |
| 40 to 44 Minutes | 125 (13.1%) | 5 (0.7%) |
| 45 to 59 Minutes | 59 (6.2%) | 36 (5.2%) |
| 60 to 89 Minutes | 106 (11.1%) | 4 (0.6%) |
| 90 or more Minutes | 20 (2.1%) | 5 (0.7%) |
Time of Departure to Work by Sex in Loxley
The most frequent times of departure to work in Loxley are 7:00 AM to 7:29 AM (309, 32.4%) for males and 7:30 AM to 7:59 AM (165, 23.8%) for females.
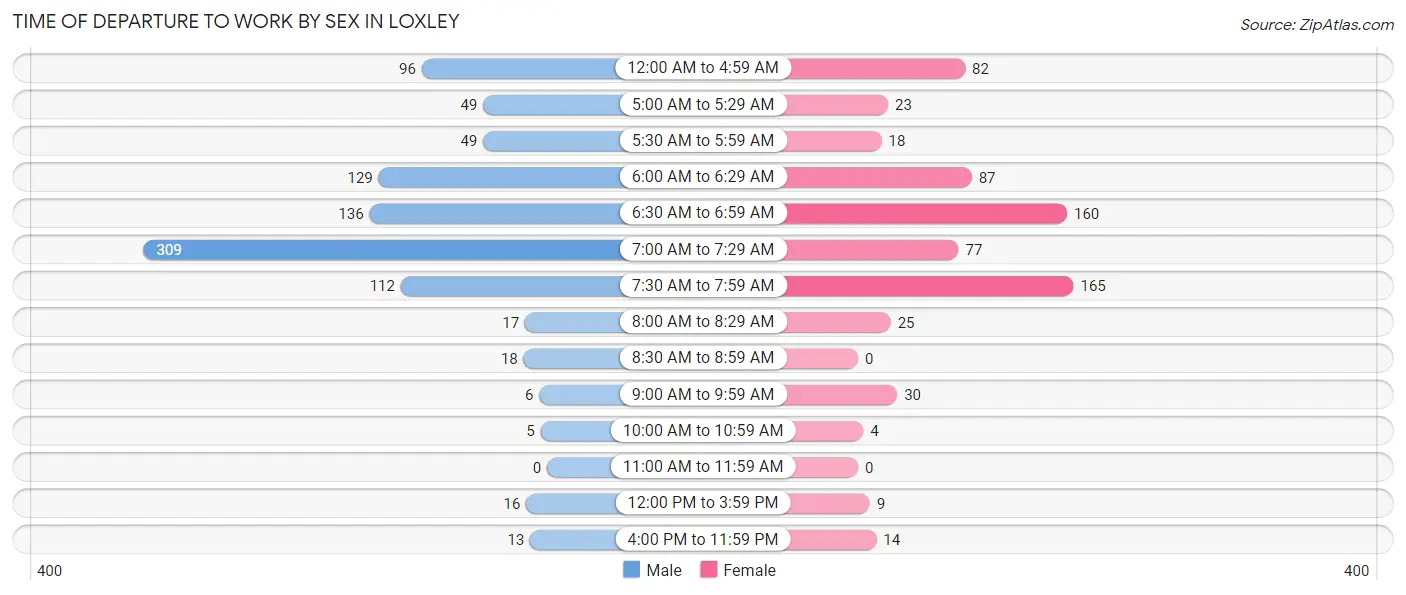
| Time of Departure | Male | Female |
| 12:00 AM to 4:59 AM | 96 (10.1%) | 82 (11.8%) |
| 5:00 AM to 5:29 AM | 49 (5.1%) | 23 (3.3%) |
| 5:30 AM to 5:59 AM | 49 (5.1%) | 18 (2.6%) |
| 6:00 AM to 6:29 AM | 129 (13.5%) | 87 (12.5%) |
| 6:30 AM to 6:59 AM | 136 (14.2%) | 160 (23.1%) |
| 7:00 AM to 7:29 AM | 309 (32.4%) | 77 (11.1%) |
| 7:30 AM to 7:59 AM | 112 (11.7%) | 165 (23.8%) |
| 8:00 AM to 8:29 AM | 17 (1.8%) | 25 (3.6%) |
| 8:30 AM to 8:59 AM | 18 (1.9%) | 0 (0.0%) |
| 9:00 AM to 9:59 AM | 6 (0.6%) | 30 (4.3%) |
| 10:00 AM to 10:59 AM | 5 (0.5%) | 4 (0.6%) |
| 11:00 AM to 11:59 AM | 0 (0.0%) | 0 (0.0%) |
| 12:00 PM to 3:59 PM | 16 (1.7%) | 9 (1.3%) |
| 4:00 PM to 11:59 PM | 13 (1.4%) | 14 (2.0%) |
| Total | 955 (100.0%) | 694 (100.0%) |
Housing Occupancy in Loxley
Occupancy by Ownership in Loxley
Of the total 1,184 dwellings in Loxley, owner-occupied units account for 999 (84.4%), while renter-occupied units make up 185 (15.6%).
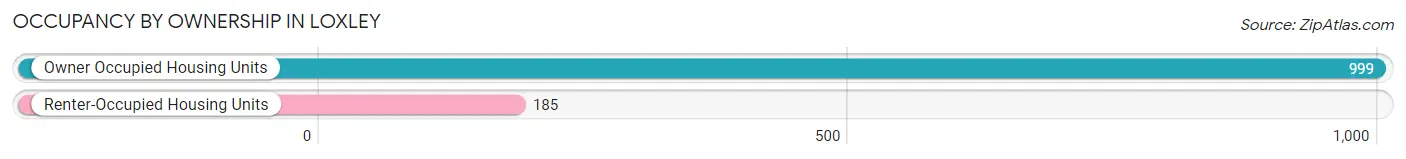
| Occupancy | # Housing Units | % Housing Units |
| Owner Occupied Housing Units | 999 | 84.4% |
| Renter-Occupied Housing Units | 185 | 15.6% |
| Total Occupied Housing Units | 1,184 | 100.0% |
Occupancy by Household Size in Loxley
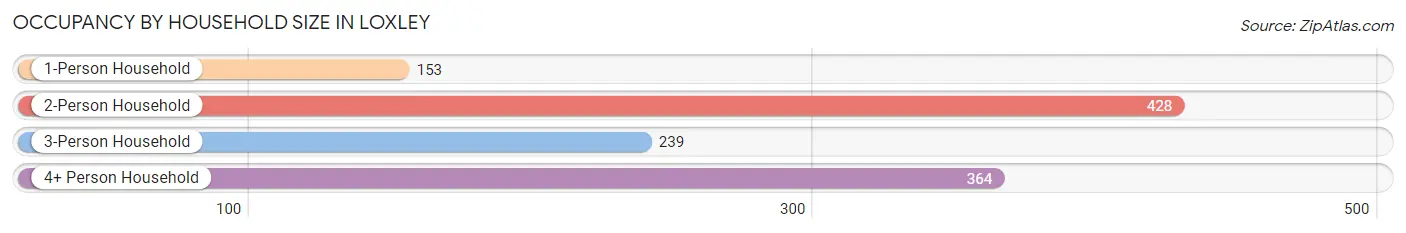
| Household Size | # Housing Units | % Housing Units |
| 1-Person Household | 153 | 12.9% |
| 2-Person Household | 428 | 36.1% |
| 3-Person Household | 239 | 20.2% |
| 4+ Person Household | 364 | 30.7% |
| Total Housing Units | 1,184 | 100.0% |
Occupancy by Ownership by Household Size in Loxley
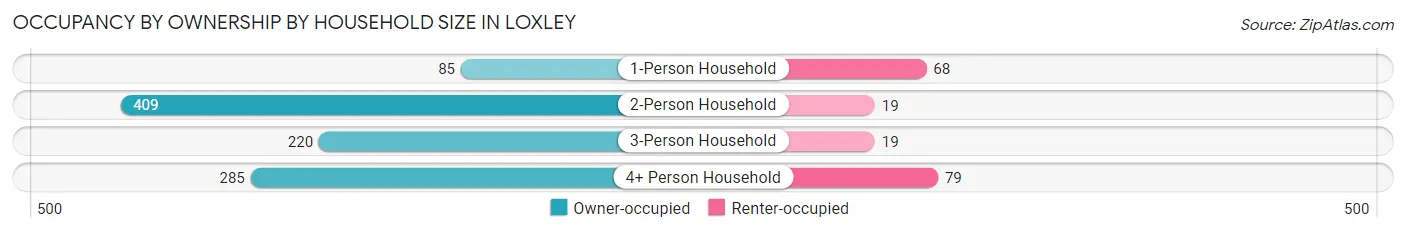
| Household Size | Owner-occupied | Renter-occupied |
| 1-Person Household | 85 (55.6%) | 68 (44.4%) |
| 2-Person Household | 409 (95.6%) | 19 (4.4%) |
| 3-Person Household | 220 (92.0%) | 19 (8.0%) |
| 4+ Person Household | 285 (78.3%) | 79 (21.7%) |
| Total Housing Units | 999 (84.4%) | 185 (15.6%) |
Occupancy by Educational Attainment in Loxley
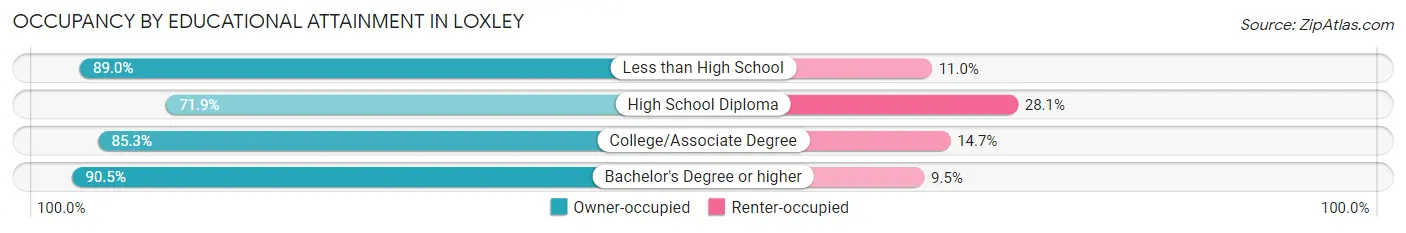
| Household Size | Owner-occupied | Renter-occupied |
| Less than High School | 97 (89.0%) | 12 (11.0%) |
| High School Diploma | 187 (71.9%) | 73 (28.1%) |
| College/Associate Degree | 372 (85.3%) | 64 (14.7%) |
| Bachelor's Degree or higher | 343 (90.5%) | 36 (9.5%) |
Occupancy by Age of Householder in Loxley
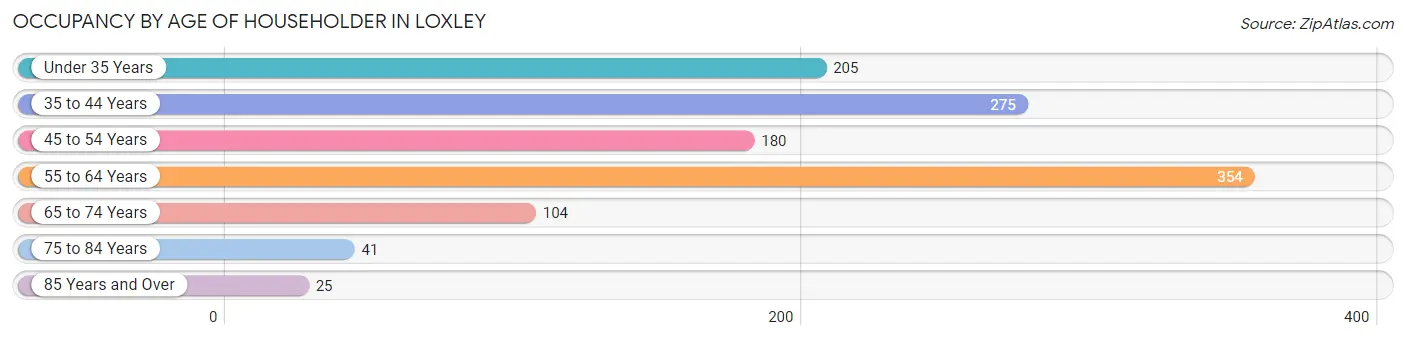
| Age Bracket | # Households | % Households |
| Under 35 Years | 205 | 17.3% |
| 35 to 44 Years | 275 | 23.2% |
| 45 to 54 Years | 180 | 15.2% |
| 55 to 64 Years | 354 | 29.9% |
| 65 to 74 Years | 104 | 8.8% |
| 75 to 84 Years | 41 | 3.5% |
| 85 Years and Over | 25 | 2.1% |
| Total | 1,184 | 100.0% |
Housing Finances in Loxley
Median Income by Occupancy in Loxley
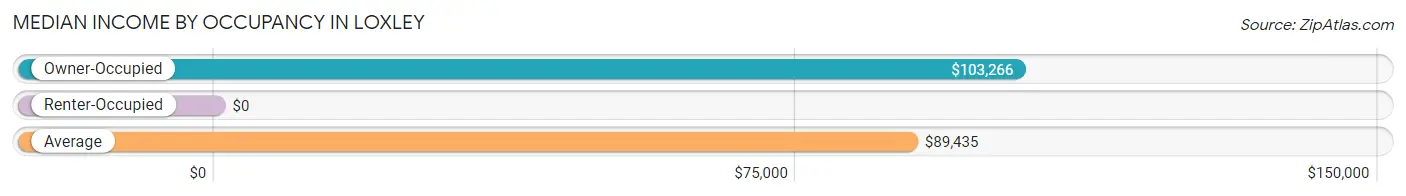
| Occupancy Type | # Households | Median Income |
| Owner-Occupied | 999 (84.4%) | $103,266 |
| Renter-Occupied | 185 (15.6%) | $0 |
| Average | 1,184 (100.0%) | $89,435 |
Occupancy by Householder Income Bracket in Loxley
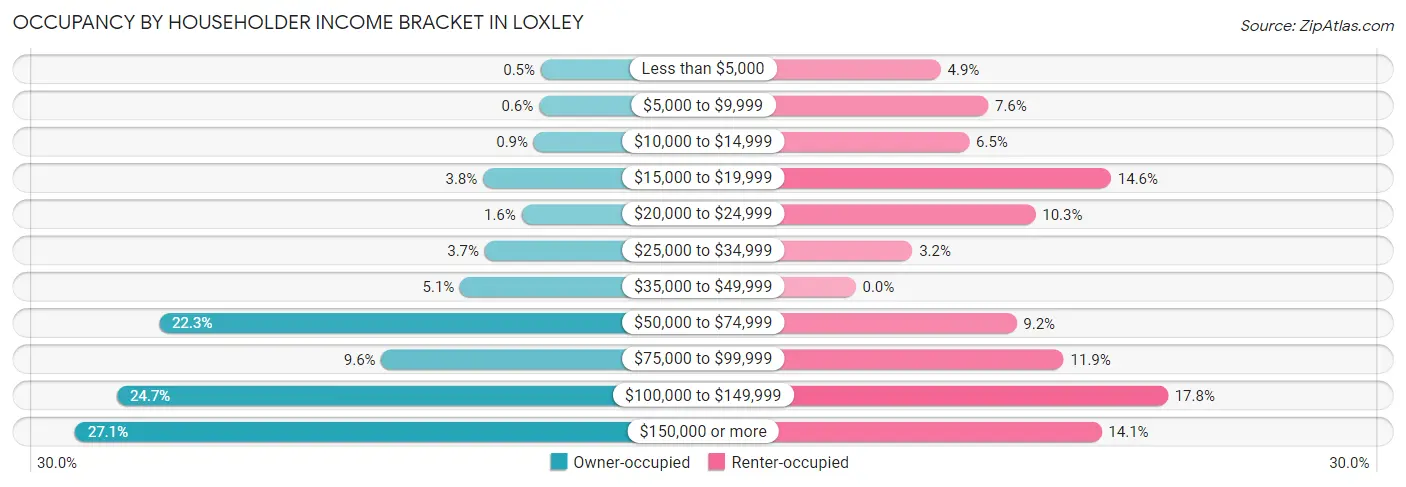
| Income Bracket | Owner-occupied | Renter-occupied |
| Less than $5,000 | 5 (0.5%) | 9 (4.9%) |
| $5,000 to $9,999 | 6 (0.6%) | 14 (7.6%) |
| $10,000 to $14,999 | 9 (0.9%) | 12 (6.5%) |
| $15,000 to $19,999 | 38 (3.8%) | 27 (14.6%) |
| $20,000 to $24,999 | 16 (1.6%) | 19 (10.3%) |
| $25,000 to $34,999 | 37 (3.7%) | 6 (3.2%) |
| $35,000 to $49,999 | 51 (5.1%) | 0 (0.0%) |
| $50,000 to $74,999 | 223 (22.3%) | 17 (9.2%) |
| $75,000 to $99,999 | 96 (9.6%) | 22 (11.9%) |
| $100,000 to $149,999 | 247 (24.7%) | 33 (17.8%) |
| $150,000 or more | 271 (27.1%) | 26 (14.1%) |
| Total | 999 (100.0%) | 185 (100.0%) |
Monthly Housing Cost Tiers in Loxley
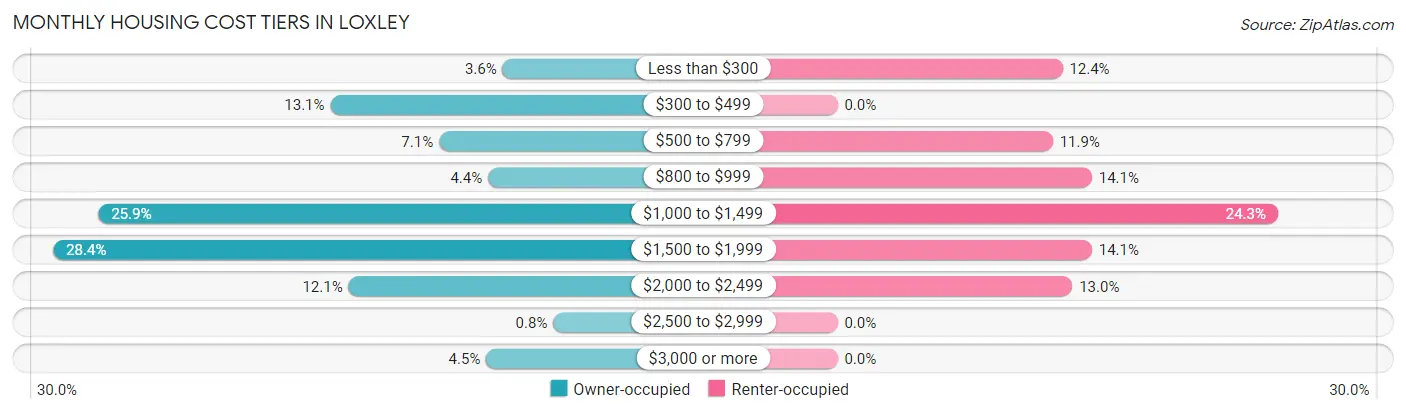
| Monthly Cost | Owner-occupied | Renter-occupied |
| Less than $300 | 36 (3.6%) | 23 (12.4%) |
| $300 to $499 | 131 (13.1%) | 0 (0.0%) |
| $500 to $799 | 71 (7.1%) | 22 (11.9%) |
| $800 to $999 | 44 (4.4%) | 26 (14.1%) |
| $1,000 to $1,499 | 259 (25.9%) | 45 (24.3%) |
| $1,500 to $1,999 | 284 (28.4%) | 26 (14.1%) |
| $2,000 to $2,499 | 121 (12.1%) | 24 (13.0%) |
| $2,500 to $2,999 | 8 (0.8%) | 0 (0.0%) |
| $3,000 or more | 45 (4.5%) | 0 (0.0%) |
| Total | 999 (100.0%) | 185 (100.0%) |
Physical Housing Characteristics in Loxley
Housing Structures in Loxley
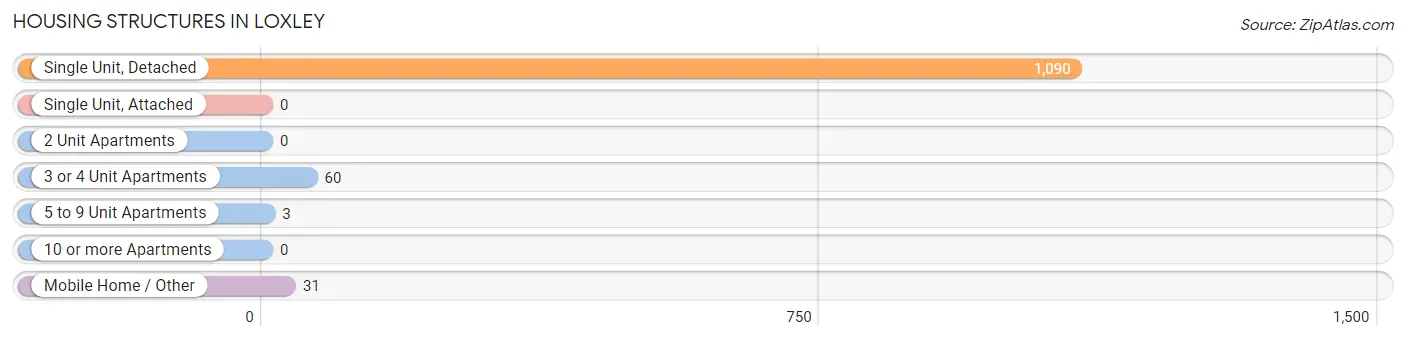
| Structure Type | # Housing Units | % Housing Units |
| Single Unit, Detached | 1,090 | 92.1% |
| Single Unit, Attached | 0 | 0.0% |
| 2 Unit Apartments | 0 | 0.0% |
| 3 or 4 Unit Apartments | 60 | 5.1% |
| 5 to 9 Unit Apartments | 3 | 0.3% |
| 10 or more Apartments | 0 | 0.0% |
| Mobile Home / Other | 31 | 2.6% |
| Total | 1,184 | 100.0% |
Housing Structures by Occupancy in Loxley
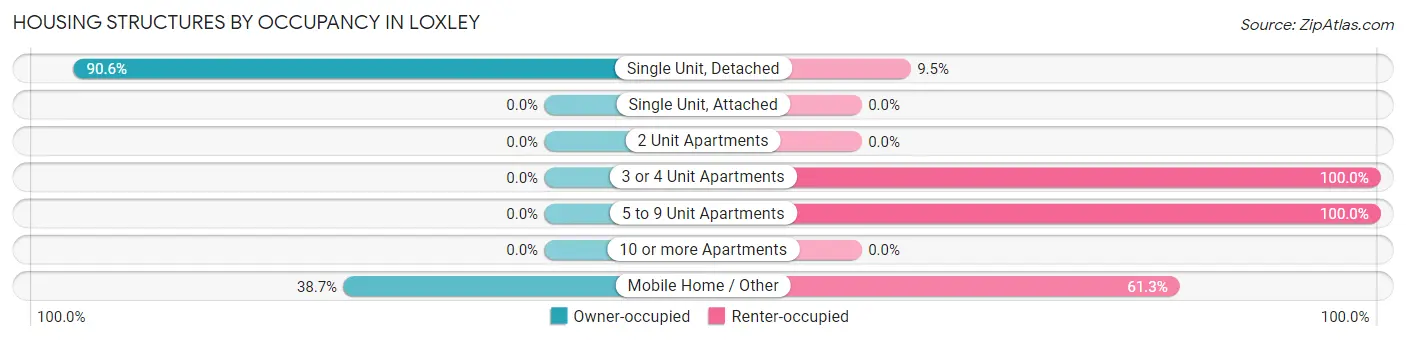
| Structure Type | Owner-occupied | Renter-occupied |
| Single Unit, Detached | 987 (90.5%) | 103 (9.5%) |
| Single Unit, Attached | 0 (0.0%) | 0 (0.0%) |
| 2 Unit Apartments | 0 (0.0%) | 0 (0.0%) |
| 3 or 4 Unit Apartments | 0 (0.0%) | 60 (100.0%) |
| 5 to 9 Unit Apartments | 0 (0.0%) | 3 (100.0%) |
| 10 or more Apartments | 0 (0.0%) | 0 (0.0%) |
| Mobile Home / Other | 12 (38.7%) | 19 (61.3%) |
| Total | 999 (84.4%) | 185 (15.6%) |
Housing Structures by Number of Rooms in Loxley
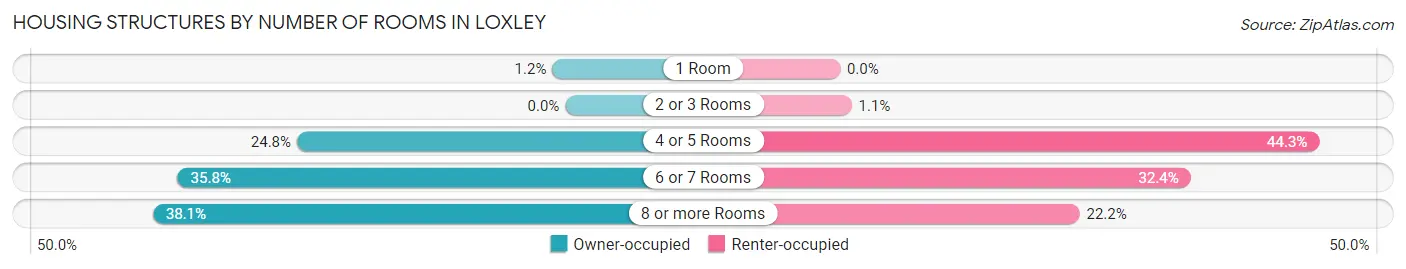
| Number of Rooms | Owner-occupied | Renter-occupied |
| 1 Room | 12 (1.2%) | 0 (0.0%) |
| 2 or 3 Rooms | 0 (0.0%) | 2 (1.1%) |
| 4 or 5 Rooms | 248 (24.8%) | 82 (44.3%) |
| 6 or 7 Rooms | 358 (35.8%) | 60 (32.4%) |
| 8 or more Rooms | 381 (38.1%) | 41 (22.2%) |
| Total | 999 (100.0%) | 185 (100.0%) |
Housing Structure by Heating Type in Loxley
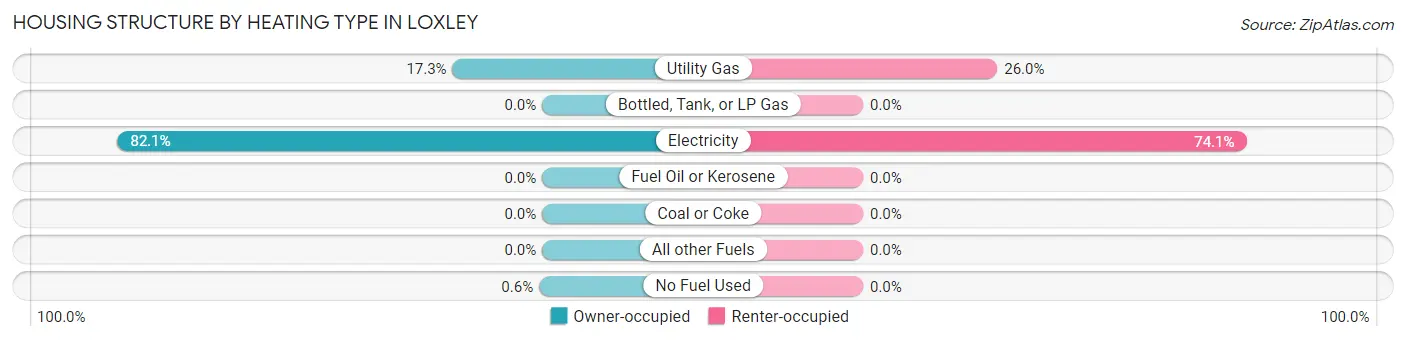
| Heating Type | Owner-occupied | Renter-occupied |
| Utility Gas | 173 (17.3%) | 48 (26.0%) |
| Bottled, Tank, or LP Gas | 0 (0.0%) | 0 (0.0%) |
| Electricity | 820 (82.1%) | 137 (74.1%) |
| Fuel Oil or Kerosene | 0 (0.0%) | 0 (0.0%) |
| Coal or Coke | 0 (0.0%) | 0 (0.0%) |
| All other Fuels | 0 (0.0%) | 0 (0.0%) |
| No Fuel Used | 6 (0.6%) | 0 (0.0%) |
| Total | 999 (100.0%) | 185 (100.0%) |
Household Vehicle Usage in Loxley
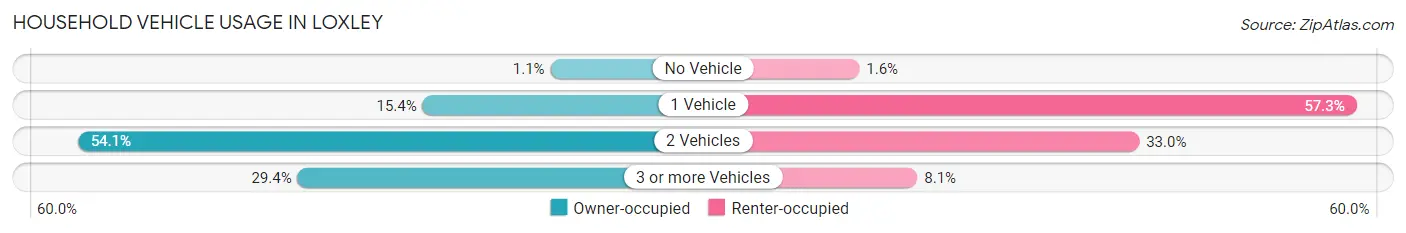
| Vehicles per Household | Owner-occupied | Renter-occupied |
| No Vehicle | 11 (1.1%) | 3 (1.6%) |
| 1 Vehicle | 154 (15.4%) | 106 (57.3%) |
| 2 Vehicles | 540 (54.0%) | 61 (33.0%) |
| 3 or more Vehicles | 294 (29.4%) | 15 (8.1%) |
| Total | 999 (100.0%) | 185 (100.0%) |
Real Estate & Mortgages in Loxley
Real Estate and Mortgage Overview in Loxley
| Characteristic | Without Mortgage | With Mortgage |
| Housing Units | 208 | 791 |
| Median Property Value | $228,600 | $348,100 |
| Median Household Income | $57,143 | $259 |
| Monthly Housing Costs | $368 | $45 |
| Real Estate Taxes | $588 | $15 |
Property Value by Mortgage Status in Loxley
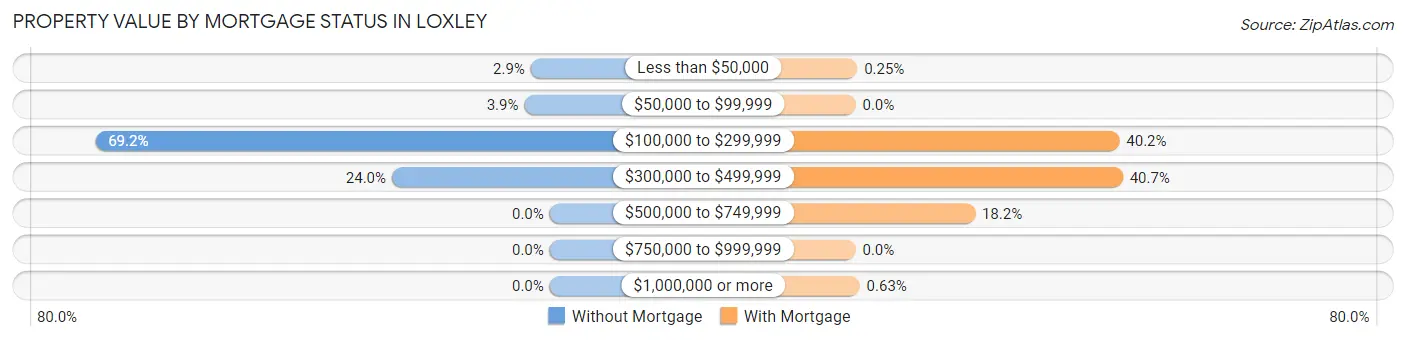
| Property Value | Without Mortgage | With Mortgage |
| Less than $50,000 | 6 (2.9%) | 2 (0.3%) |
| $50,000 to $99,999 | 8 (3.8%) | 0 (0.0%) |
| $100,000 to $299,999 | 144 (69.2%) | 318 (40.2%) |
| $300,000 to $499,999 | 50 (24.0%) | 322 (40.7%) |
| $500,000 to $749,999 | 0 (0.0%) | 144 (18.2%) |
| $750,000 to $999,999 | 0 (0.0%) | 0 (0.0%) |
| $1,000,000 or more | 0 (0.0%) | 5 (0.6%) |
| Total | 208 (100.0%) | 791 (100.0%) |
Household Income by Mortgage Status in Loxley
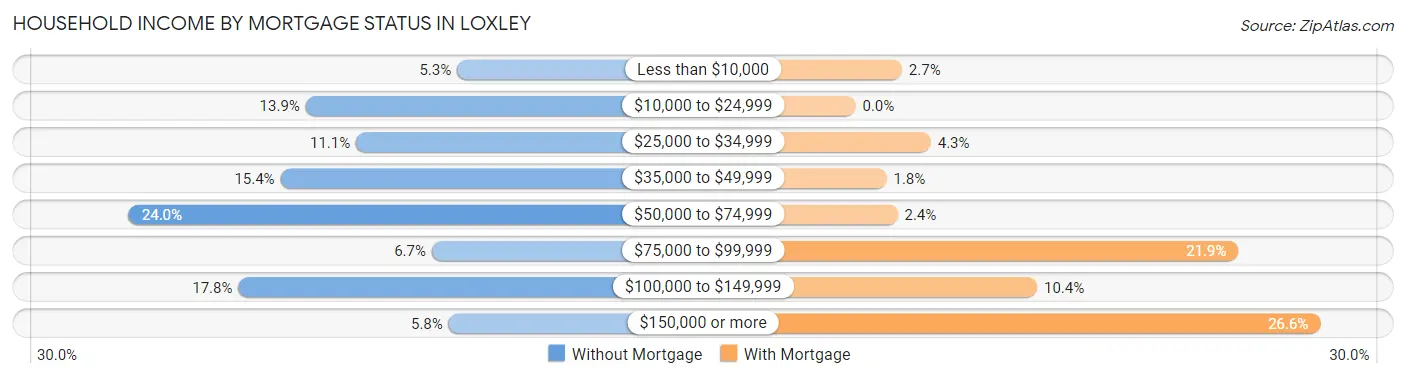
| Household Income | Without Mortgage | With Mortgage |
| Less than $10,000 | 11 (5.3%) | 21 (2.6%) |
| $10,000 to $24,999 | 29 (13.9%) | 0 (0.0%) |
| $25,000 to $34,999 | 23 (11.1%) | 34 (4.3%) |
| $35,000 to $49,999 | 32 (15.4%) | 14 (1.8%) |
| $50,000 to $74,999 | 50 (24.0%) | 19 (2.4%) |
| $75,000 to $99,999 | 14 (6.7%) | 173 (21.9%) |
| $100,000 to $149,999 | 37 (17.8%) | 82 (10.4%) |
| $150,000 or more | 12 (5.8%) | 210 (26.6%) |
| Total | 208 (100.0%) | 791 (100.0%) |
Property Value to Household Income Ratio in Loxley
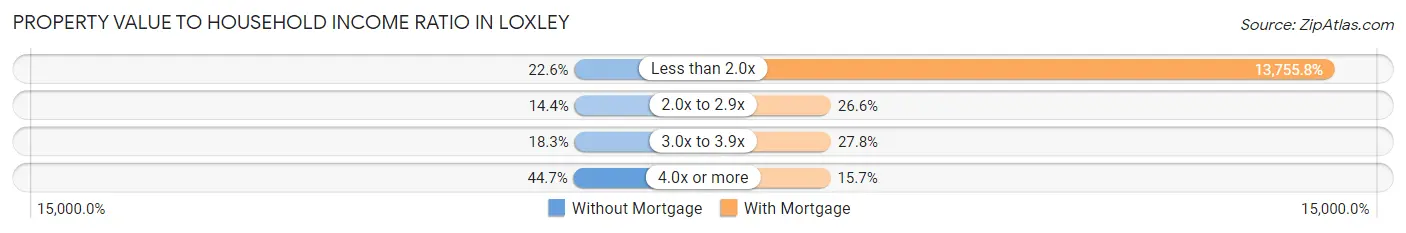
| Value-to-Income Ratio | Without Mortgage | With Mortgage |
| Less than 2.0x | 47 (22.6%) | 108,808 (13,755.8%) |
| 2.0x to 2.9x | 30 (14.4%) | 210 (26.6%) |
| 3.0x to 3.9x | 38 (18.3%) | 220 (27.8%) |
| 4.0x or more | 93 (44.7%) | 124 (15.7%) |
| Total | 208 (100.0%) | 791 (100.0%) |
Real Estate Taxes by Mortgage Status in Loxley
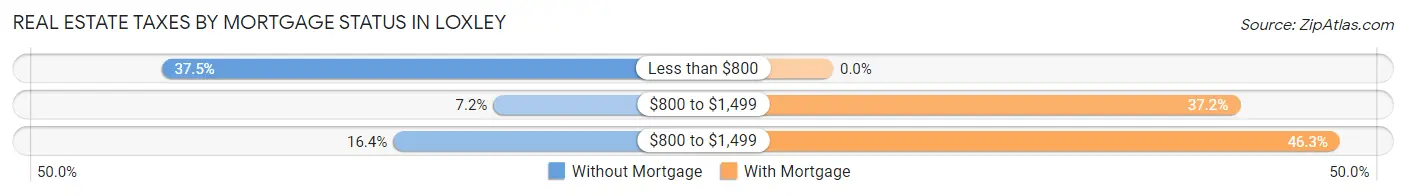
| Property Taxes | Without Mortgage | With Mortgage |
| Less than $800 | 78 (37.5%) | 0 (0.0%) |
| $800 to $1,499 | 15 (7.2%) | 294 (37.2%) |
| $800 to $1,499 | 34 (16.4%) | 366 (46.3%) |
| Total | 208 (100.0%) | 791 (100.0%) |
Health & Disability in Loxley
Health Insurance Coverage by Age in Loxley
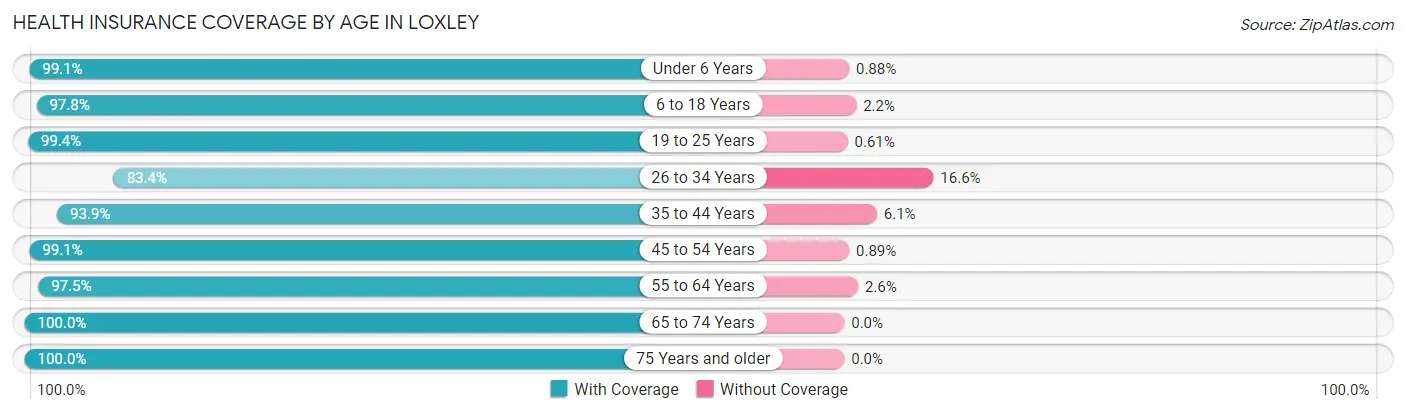
| Age Bracket | With Coverage | Without Coverage |
| Under 6 Years | 336 (99.1%) | 3 (0.9%) |
| 6 to 18 Years | 616 (97.8%) | 14 (2.2%) |
| 19 to 25 Years | 486 (99.4%) | 3 (0.6%) |
| 26 to 34 Years | 281 (83.4%) | 56 (16.6%) |
| 35 to 44 Years | 542 (93.9%) | 35 (6.1%) |
| 45 to 54 Years | 447 (99.1%) | 4 (0.9%) |
| 55 to 64 Years | 649 (97.5%) | 17 (2.5%) |
| 65 to 74 Years | 159 (100.0%) | 0 (0.0%) |
| 75 Years and older | 98 (100.0%) | 0 (0.0%) |
| Total | 3,614 (96.5%) | 132 (3.5%) |
Health Insurance Coverage by Citizenship Status in Loxley
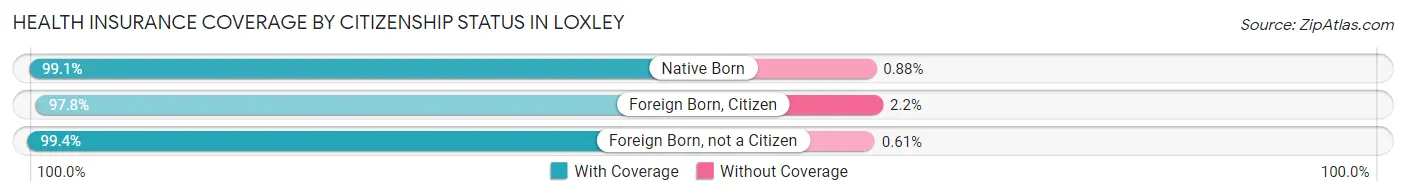
| Citizenship Status | With Coverage | Without Coverage |
| Native Born | 336 (99.1%) | 3 (0.9%) |
| Foreign Born, Citizen | 616 (97.8%) | 14 (2.2%) |
| Foreign Born, not a Citizen | 486 (99.4%) | 3 (0.6%) |
Health Insurance Coverage by Household Income in Loxley
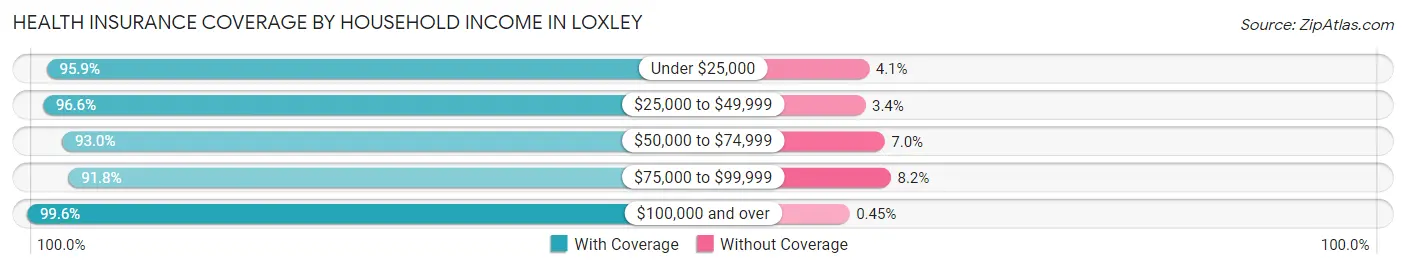
| Household Income | With Coverage | Without Coverage |
| Under $25,000 | 326 (95.9%) | 14 (4.1%) |
| $25,000 to $49,999 | 282 (96.6%) | 10 (3.4%) |
| $50,000 to $74,999 | 899 (93.0%) | 68 (7.0%) |
| $75,000 to $99,999 | 314 (91.8%) | 28 (8.2%) |
| $100,000 and over | 1,782 (99.6%) | 8 (0.4%) |
Public vs Private Health Insurance Coverage by Age in Loxley
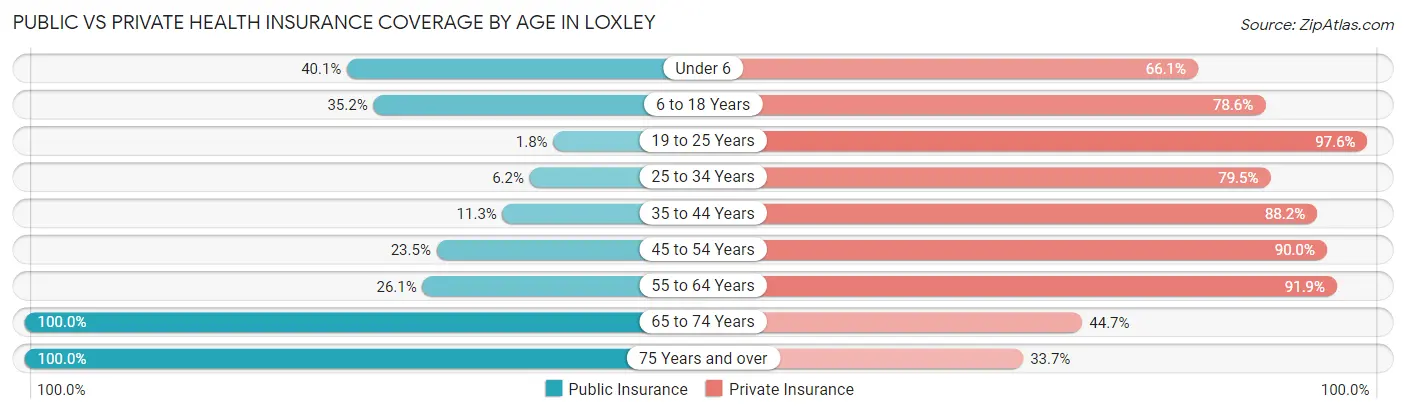
| Age Bracket | Public Insurance | Private Insurance |
| Under 6 | 136 (40.1%) | 224 (66.1%) |
| 6 to 18 Years | 222 (35.2%) | 495 (78.6%) |
| 19 to 25 Years | 9 (1.8%) | 477 (97.6%) |
| 25 to 34 Years | 21 (6.2%) | 268 (79.5%) |
| 35 to 44 Years | 65 (11.3%) | 509 (88.2%) |
| 45 to 54 Years | 106 (23.5%) | 406 (90.0%) |
| 55 to 64 Years | 174 (26.1%) | 612 (91.9%) |
| 65 to 74 Years | 159 (100.0%) | 71 (44.7%) |
| 75 Years and over | 98 (100.0%) | 33 (33.7%) |
| Total | 990 (26.4%) | 3,095 (82.6%) |
Disability Status by Sex by Age in Loxley
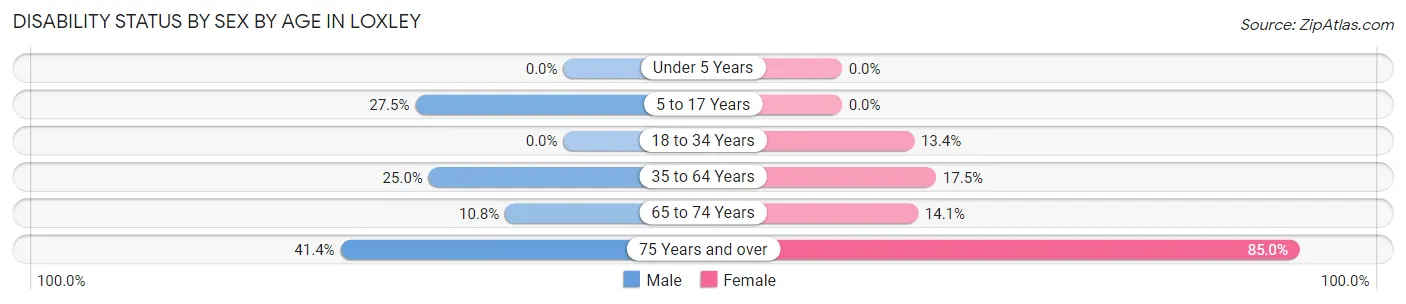
| Age Bracket | Male | Female |
| Under 5 Years | 0 (0.0%) | 0 (0.0%) |
| 5 to 17 Years | 72 (27.5%) | 0 (0.0%) |
| 18 to 34 Years | 0 (0.0%) | 69 (13.4%) |
| 35 to 64 Years | 226 (25.0%) | 138 (17.5%) |
| 65 to 74 Years | 8 (10.8%) | 12 (14.1%) |
| 75 Years and over | 24 (41.4%) | 34 (85.0%) |
Disability Class by Sex by Age in Loxley
Disability Class: Hearing Difficulty
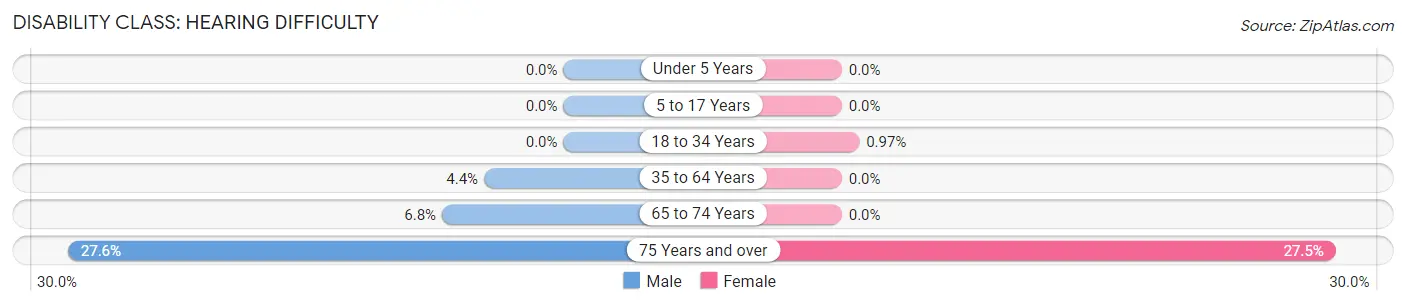
| Age Bracket | Male | Female |
| Under 5 Years | 0 (0.0%) | 0 (0.0%) |
| 5 to 17 Years | 0 (0.0%) | 0 (0.0%) |
| 18 to 34 Years | 0 (0.0%) | 5 (1.0%) |
| 35 to 64 Years | 40 (4.4%) | 0 (0.0%) |
| 65 to 74 Years | 5 (6.8%) | 0 (0.0%) |
| 75 Years and over | 16 (27.6%) | 11 (27.5%) |
Disability Class: Vision Difficulty
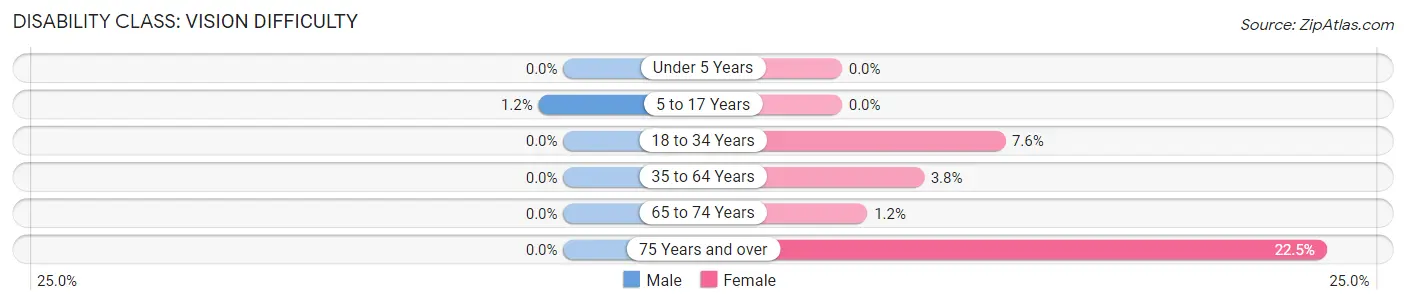
| Age Bracket | Male | Female |
| Under 5 Years | 0 (0.0%) | 0 (0.0%) |
| 5 to 17 Years | 3 (1.1%) | 0 (0.0%) |
| 18 to 34 Years | 0 (0.0%) | 39 (7.6%) |
| 35 to 64 Years | 0 (0.0%) | 30 (3.8%) |
| 65 to 74 Years | 0 (0.0%) | 1 (1.2%) |
| 75 Years and over | 0 (0.0%) | 9 (22.5%) |
Disability Class: Cognitive Difficulty
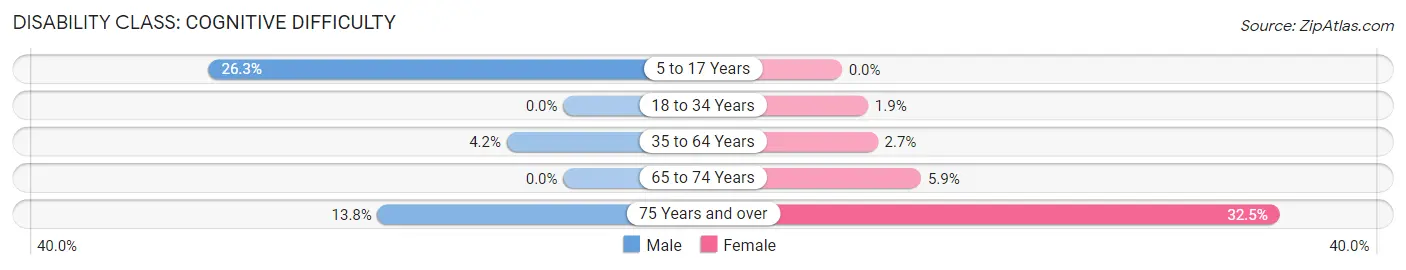
| Age Bracket | Male | Female |
| 5 to 17 Years | 69 (26.3%) | 0 (0.0%) |
| 18 to 34 Years | 0 (0.0%) | 10 (1.9%) |
| 35 to 64 Years | 38 (4.2%) | 21 (2.7%) |
| 65 to 74 Years | 0 (0.0%) | 5 (5.9%) |
| 75 Years and over | 8 (13.8%) | 13 (32.5%) |
Disability Class: Ambulatory Difficulty
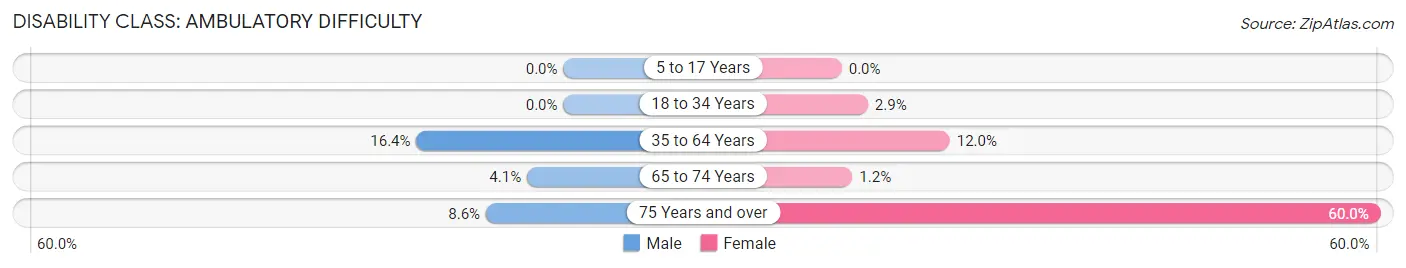
| Age Bracket | Male | Female |
| 5 to 17 Years | 0 (0.0%) | 0 (0.0%) |
| 18 to 34 Years | 0 (0.0%) | 15 (2.9%) |
| 35 to 64 Years | 148 (16.4%) | 95 (12.0%) |
| 65 to 74 Years | 3 (4.1%) | 1 (1.2%) |
| 75 Years and over | 5 (8.6%) | 24 (60.0%) |
Disability Class: Self-Care Difficulty
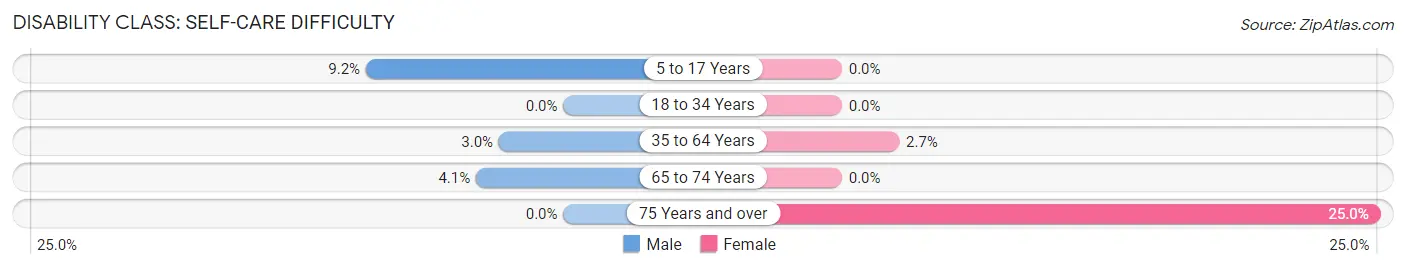
| Age Bracket | Male | Female |
| 5 to 17 Years | 24 (9.2%) | 0 (0.0%) |
| 18 to 34 Years | 0 (0.0%) | 0 (0.0%) |
| 35 to 64 Years | 27 (3.0%) | 21 (2.7%) |
| 65 to 74 Years | 3 (4.1%) | 0 (0.0%) |
| 75 Years and over | 0 (0.0%) | 10 (25.0%) |
Technology Access in Loxley
Computing Device Access in Loxley
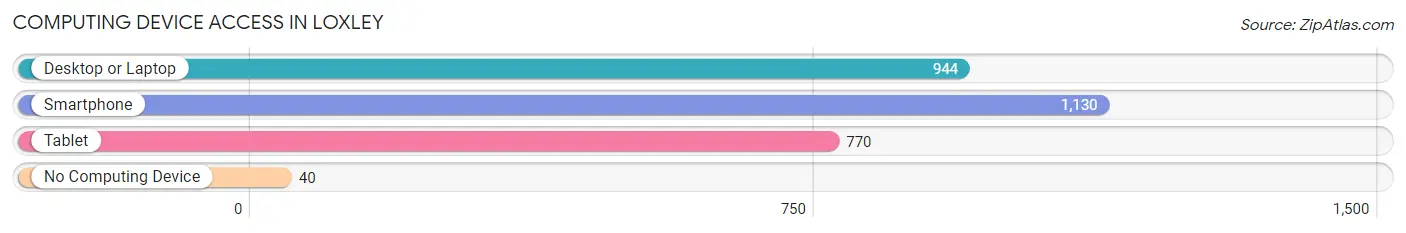
| Device Type | # Households | % Households |
| Desktop or Laptop | 944 | 79.7% |
| Smartphone | 1,130 | 95.4% |
| Tablet | 770 | 65.0% |
| No Computing Device | 40 | 3.4% |
| Total | 1,184 | 100.0% |
Internet Access in Loxley
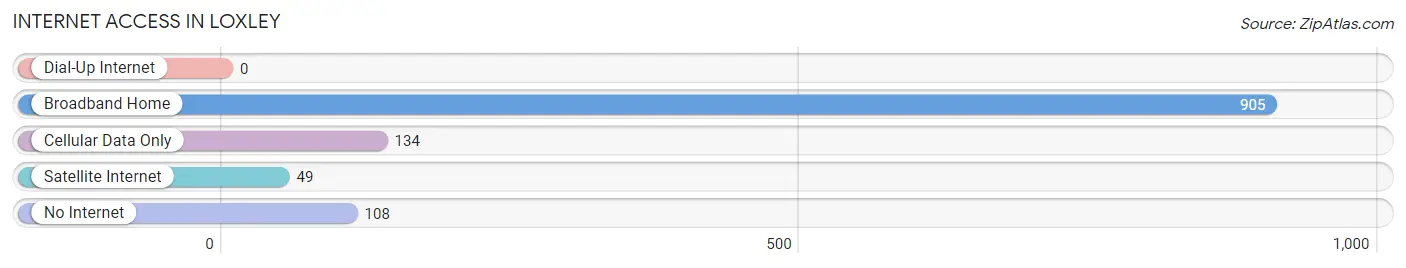
| Internet Type | # Households | % Households |
| Dial-Up Internet | 0 | 0.0% |
| Broadband Home | 905 | 76.4% |
| Cellular Data Only | 134 | 11.3% |
| Satellite Internet | 49 | 4.1% |
| No Internet | 108 | 9.1% |
| Total | 1,184 | 100.0% |
Loxley Summary
Loxley, Alabama is a small town located in Baldwin County, Alabama. It is situated on the banks of the Fish River, and is part of the Mobile metropolitan area. The town has a population of approximately 2,000 people, and is known for its rural charm and friendly atmosphere.
History
Loxley was founded in 1881 by a group of settlers from the nearby town of Robertsdale. The town was named after a local creek, which was named after a local Native American chief. The town was originally a farming community, and the main crops grown were cotton, corn, and peanuts. In the early 1900s, the town began to grow and develop, and by the 1920s, it had become a thriving community.
In the 1950s, the town began to experience a period of growth and development. The town was incorporated in 1956, and the first mayor was elected in 1958. During this time, the town saw the construction of a new school, a library, and a post office.
Geography
Loxley is located in Baldwin County, Alabama, and is situated on the banks of the Fish River. The town is located approximately 25 miles north of Mobile, and is part of the Mobile metropolitan area. The town is surrounded by a number of small towns and communities, including Robertsdale, Summerdale, and Silverhill.
The town has a total area of 4.2 square miles, and has a humid subtropical climate. The average temperature in the summer is around 80 degrees Fahrenheit, and the average temperature in the winter is around 50 degrees Fahrenheit.
Economy
The economy of Loxley is largely based on agriculture and tourism. The town is home to a number of farms, and the main crops grown are cotton, corn, and peanuts. The town is also home to a number of small businesses, including restaurants, retail stores, and service providers.
The town is also home to a number of tourist attractions, including the Loxley Historical Museum, the Loxley Arts Center, and the Loxley Nature Center. The town is also home to a number of festivals and events, including the Loxley Festival of the Arts, the Loxley Music Festival, and the Loxley Harvest Festival.
Demographics
As of the 2010 census, the population of Loxley was 2,000 people. The racial makeup of the town was 97.2% White, 0.7% African American, 0.3% Native American, 0.3% Asian, 0.2% from other races, and 1.5% from two or more races. The median household income was $37,500, and the median family income was $45,000.
The town is home to a number of churches, including the Loxley United Methodist Church, the Loxley Baptist Church, and the Loxley Presbyterian Church. The town is also home to a number of schools, including the Loxley Elementary School, the Loxley Middle School, and the Loxley High School.
Conclusion
Loxley, Alabama is a small town located in Baldwin County, Alabama. It is situated on the banks of the Fish River, and is part of the Mobile metropolitan area. The town has a population of approximately 2,000 people, and is known for its rural charm and friendly atmosphere. The economy of the town is largely based on agriculture and tourism, and the town is home to a number of tourist attractions, including the Loxley Historical Museum, the Loxley Arts Center, and the Loxley Nature Center. The town is also home to a number of churches, schools, and businesses.
Common Questions
What is Per Capita Income in Loxley?
Per Capita income in Loxley is $35,476.
What is the Median Family Income in Loxley?
Median Family Income in Loxley is $105,865.
What is the Median Household income in Loxley?
Median Household Income in Loxley is $89,435.
What is Income or Wage Gap in Loxley?
Income or Wage Gap in Loxley is 44.1%.
Women in Loxley earn 55.9 cents for every dollar earned by a man.
What is Inequality or Gini Index in Loxley?
Inequality or Gini Index in Loxley is 0.38.
What is the Total Population of Loxley?
Total Population of Loxley is 3,757.
What is the Total Male Population of Loxley?
Total Male Population of Loxley is 1,917.
What is the Total Female Population of Loxley?
Total Female Population of Loxley is 1,840.
What is the Ratio of Males per 100 Females in Loxley?
There are 104.18 Males per 100 Females in Loxley.
What is the Ratio of Females per 100 Males in Loxley?
There are 95.98 Females per 100 Males in Loxley.
What is the Median Population Age in Loxley?
Median Population Age in Loxley is 36.3 Years.
What is the Average Family Size in Loxley
Average Family Size in Loxley is 3.5 People.
What is the Average Household Size in Loxley
Average Household Size in Loxley is 3.2 People.
How Large is the Labor Force in Loxley?
There are 1,870 People in the Labor Forcein in Loxley.
What is the Percentage of People in the Labor Force in Loxley?
62.7% of People are in the Labor Force in Loxley.
What is the Unemployment Rate in Loxley?
Unemployment Rate in Loxley is 1.0%.