Crossville, AL Map & Demographics
Crossville Map
Crossville Overview
$21,472
PER CAPITA INCOME
$66,750
AVG FAMILY INCOME
$47,750
AVG HOUSEHOLD INCOME
54.1%
WAGE / INCOME GAP [ % ]
45.9¢/ $1
WAGE / INCOME GAP [ $ ]
0.46
INEQUALITY / GINI INDEX
2,043
TOTAL POPULATION
909
MALE POPULATION
1,134
FEMALE POPULATION
80.16
MALES / 100 FEMALES
124.75
FEMALES / 100 MALES
40.1
MEDIAN AGE
4.0
AVG FAMILY SIZE
3.3
AVG HOUSEHOLD SIZE
861
LABOR FORCE [ PEOPLE ]
51.9%
PERCENT IN LABOR FORCE
2.0%
UNEMPLOYMENT RATE
Crossville Zip Codes
Crossville Area Codes
Income in Crossville
Income Overview in Crossville
Per Capita Income in Crossville is $21,472, while median incomes of families and households are $66,750 and $47,750 respectively.
| Characteristic | Number | Measure |
| Per Capita Income | 2,043 | $21,472 |
| Median Family Income | 417 | $66,750 |
| Mean Family Income | 417 | $72,111 |
| Median Household Income | 573 | $47,750 |
| Mean Household Income | 573 | $64,413 |
| Income Deficit | 417 | $0 |
| Wage / Income Gap (%) | 2,043 | 54.12% |
| Wage / Income Gap ($) | 2,043 | 45.88¢ per $1 |
| Gini / Inequality Index | 2,043 | 0.46 |
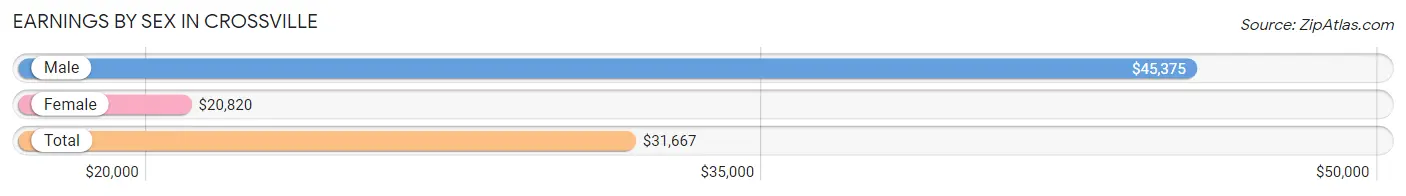
Earnings by Sex in Crossville
Average Earnings in Crossville are $31,667, $45,375 for men and $20,820 for women, a difference of 54.1%.
| Sex | Number | Average Earnings |
| Male | 475 (54.8%) | $45,375 |
| Female | 391 (45.2%) | $20,820 |
| Total | 866 (100.0%) | $31,667 |
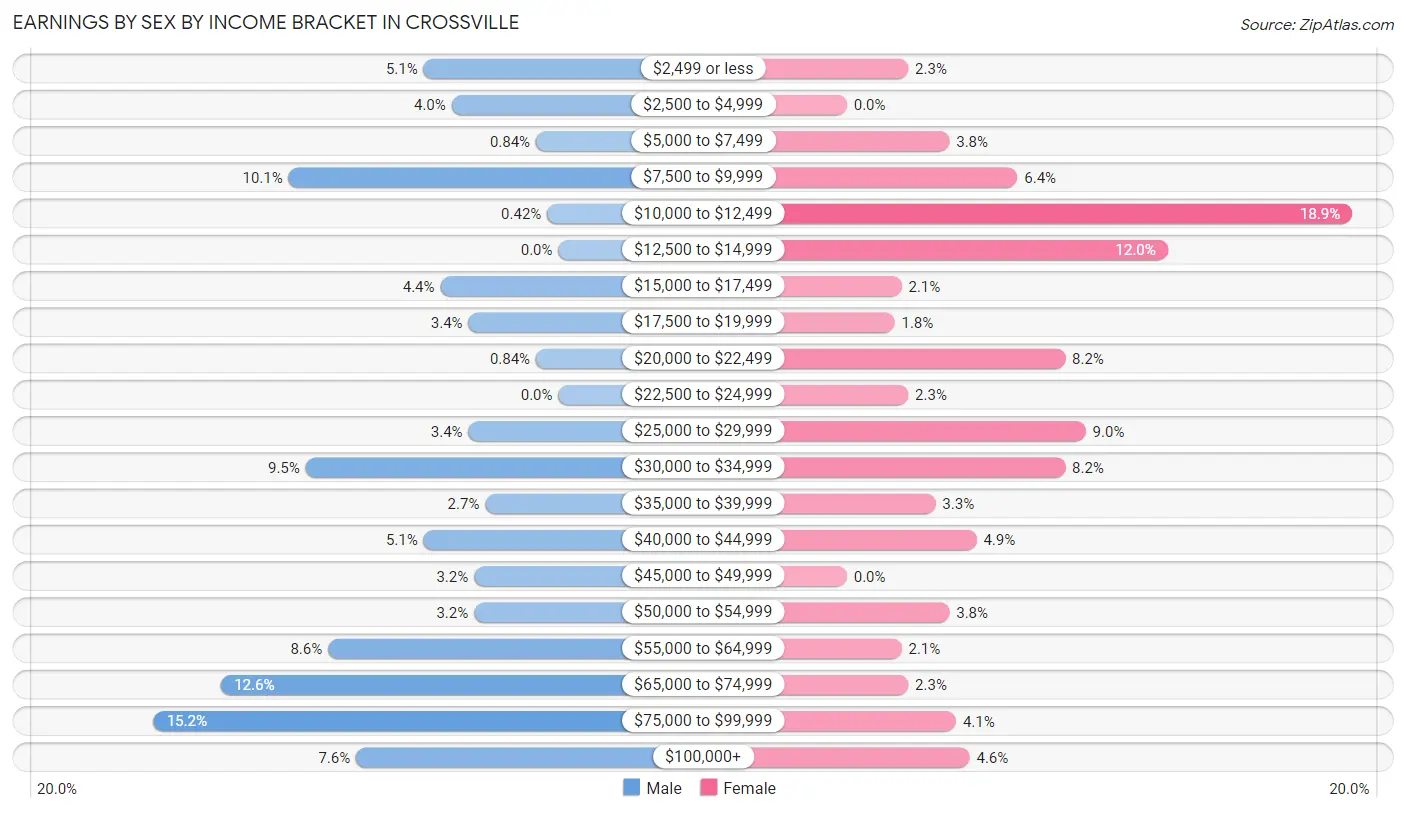
Earnings by Sex by Income Bracket in Crossville
The most common earnings brackets in Crossville are $75,000 to $99,999 for men (72 | 15.2%) and $10,000 to $12,499 for women (74 | 18.9%).
| Income | Male | Female |
| $2,499 or less | 24 (5.1%) | 9 (2.3%) |
| $2,500 to $4,999 | 19 (4.0%) | 0 (0.0%) |
| $5,000 to $7,499 | 4 (0.8%) | 15 (3.8%) |
| $7,500 to $9,999 | 48 (10.1%) | 25 (6.4%) |
| $10,000 to $12,499 | 2 (0.4%) | 74 (18.9%) |
| $12,500 to $14,999 | 0 (0.0%) | 47 (12.0%) |
| $15,000 to $17,499 | 21 (4.4%) | 8 (2.1%) |
| $17,500 to $19,999 | 16 (3.4%) | 7 (1.8%) |
| $20,000 to $22,499 | 4 (0.8%) | 32 (8.2%) |
| $22,500 to $24,999 | 0 (0.0%) | 9 (2.3%) |
| $25,000 to $29,999 | 16 (3.4%) | 35 (8.9%) |
| $30,000 to $34,999 | 45 (9.5%) | 32 (8.2%) |
| $35,000 to $39,999 | 13 (2.7%) | 13 (3.3%) |
| $40,000 to $44,999 | 24 (5.1%) | 19 (4.9%) |
| $45,000 to $49,999 | 15 (3.2%) | 0 (0.0%) |
| $50,000 to $54,999 | 15 (3.2%) | 15 (3.8%) |
| $55,000 to $64,999 | 41 (8.6%) | 8 (2.1%) |
| $65,000 to $74,999 | 60 (12.6%) | 9 (2.3%) |
| $75,000 to $99,999 | 72 (15.2%) | 16 (4.1%) |
| $100,000+ | 36 (7.6%) | 18 (4.6%) |
| Total | 475 (100.0%) | 391 (100.0%) |
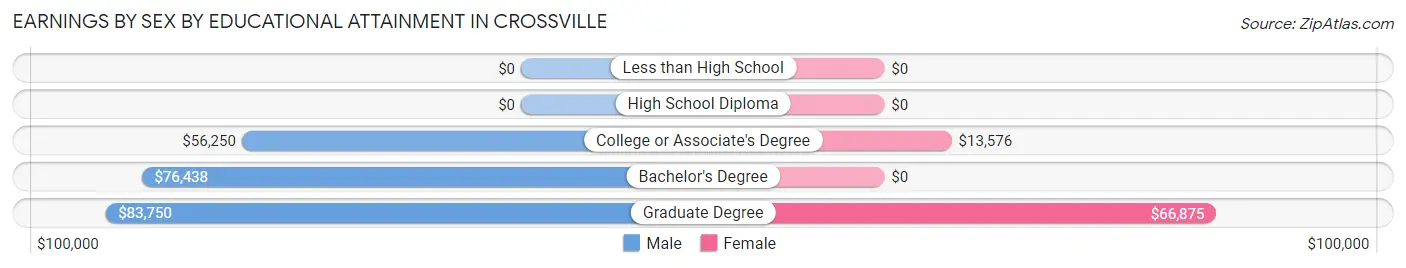
Earnings by Sex by Educational Attainment in Crossville
Average earnings in Crossville are $56,836 for men and $25,625 for women, a difference of 54.9%. Men with an educational attainment of graduate degree enjoy the highest average annual earnings of $83,750, while those with college or associate's degree education earn the least with $56,250. Women with an educational attainment of graduate degree earn the most with the average annual earnings of $66,875, while those with college or associate's degree education have the smallest earnings of $13,576.
| Educational Attainment | Male Income | Female Income |
| Less than High School | - | - |
| High School Diploma | - | - |
| College or Associate's Degree | $56,250 | $13,576 |
| Bachelor's Degree | $76,438 | $0 |
| Graduate Degree | $83,750 | $66,875 |
| Total | $56,836 | $25,625 |
Family Income in Crossville
Family Income Brackets in Crossville
According to the Crossville family income data, there are 78 families falling into the $75,000 to $99,999 income range, which is the most common income bracket and makes up 18.7% of all families. Conversely, the $15,000 to $24,999 income bracket is the least frequent group with only 11 families (2.6%) belonging to this category.
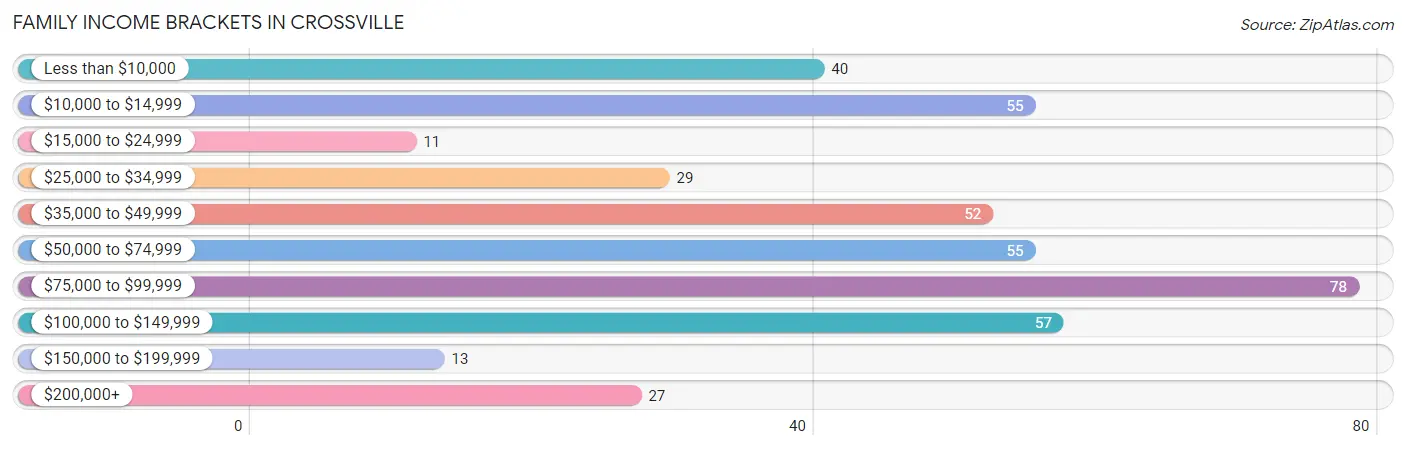
| Income Bracket | # Families | % Families |
| Less than $10,000 | 40 | 9.6% |
| $10,000 to $14,999 | 55 | 13.2% |
| $15,000 to $24,999 | 11 | 2.6% |
| $25,000 to $34,999 | 29 | 7.0% |
| $35,000 to $49,999 | 52 | 12.5% |
| $50,000 to $74,999 | 55 | 13.2% |
| $75,000 to $99,999 | 78 | 18.7% |
| $100,000 to $149,999 | 57 | 13.7% |
| $150,000 to $199,999 | 13 | 3.1% |
| $200,000+ | 27 | 6.5% |
Family Income by Famaliy Size in Crossville
3-person families (66 | 15.8%) account for the highest median family income in Crossville with $91,875 per family, while 3-person families (66 | 15.8%) have the highest median income of $30,625 per family member.
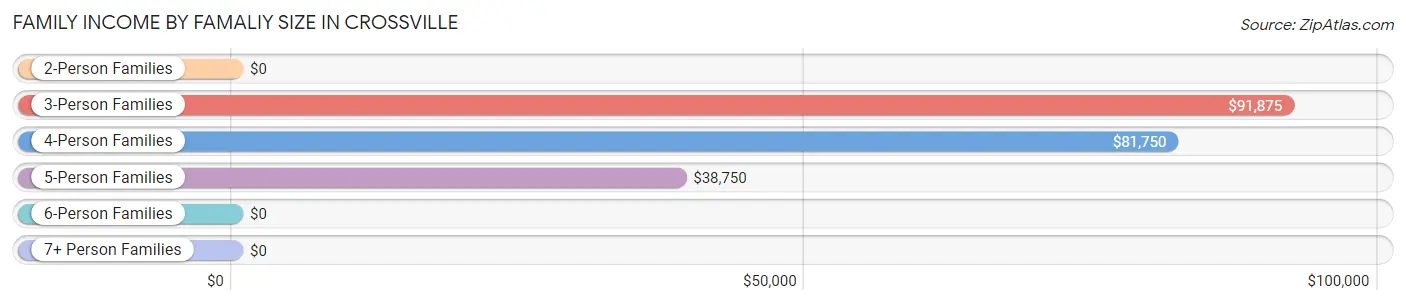
| Income Bracket | # Families | Median Income |
| 2-Person Families | 196 (47.0%) | $0 |
| 3-Person Families | 66 (15.8%) | $91,875 |
| 4-Person Families | 90 (21.6%) | $81,750 |
| 5-Person Families | 43 (10.3%) | $38,750 |
| 6-Person Families | 22 (5.3%) | $0 |
| 7+ Person Families | 0 (0.0%) | $0 |
| Total | 417 (100.0%) | $66,750 |
Family Income by Number of Earners in Crossville
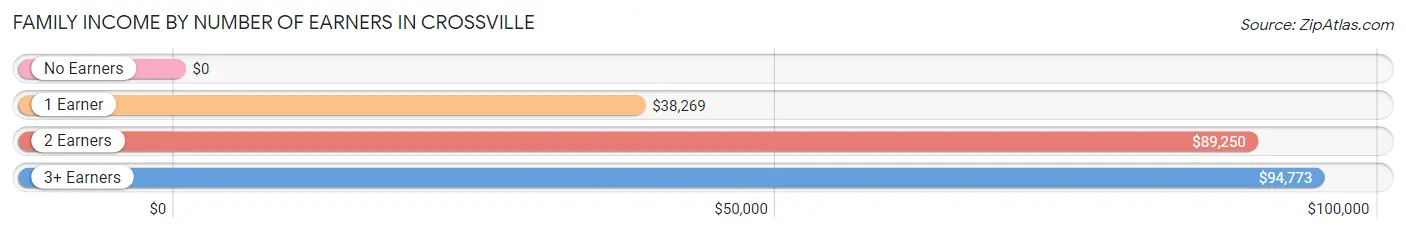
| Number of Earners | # Families | Median Income |
| No Earners | 48 (11.5%) | $0 |
| 1 Earner | 166 (39.8%) | $38,269 |
| 2 Earners | 149 (35.7%) | $89,250 |
| 3+ Earners | 54 (13.0%) | $94,773 |
| Total | 417 (100.0%) | $66,750 |
Household Income in Crossville
Household Income Brackets in Crossville
With 89 households falling in the category, the $10,000 to $14,999 income range is the most frequent in Crossville, accounting for 15.5% of all households. In contrast, only 13 households (2.3%) fall into the $150,000 to $199,999 income bracket, making it the least populous group.
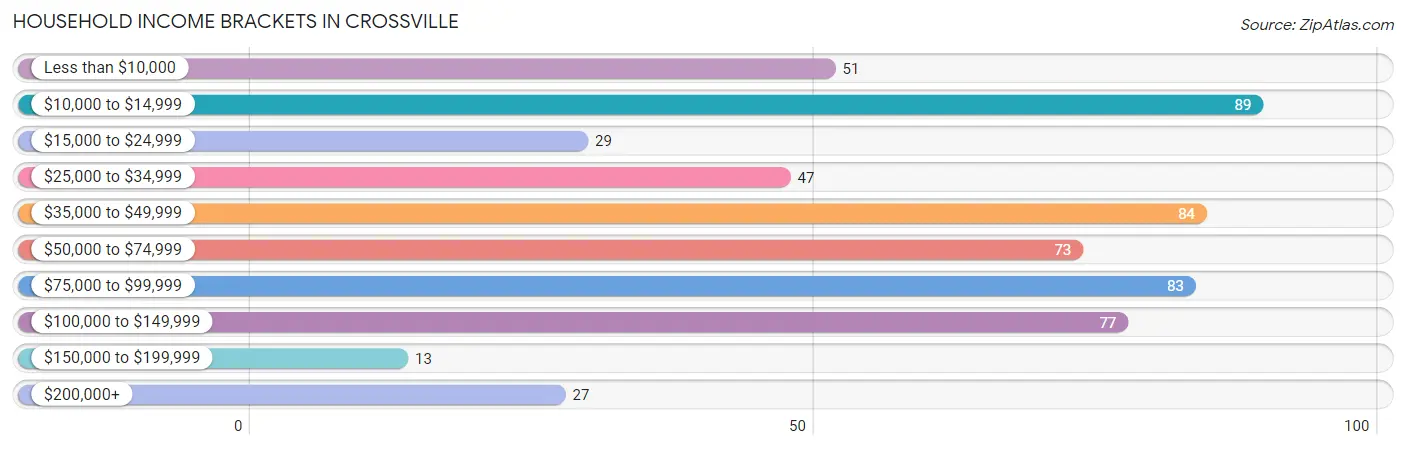
| Income Bracket | # Households | % Households |
| Less than $10,000 | 51 | 8.9% |
| $10,000 to $14,999 | 89 | 15.5% |
| $15,000 to $24,999 | 29 | 5.1% |
| $25,000 to $34,999 | 47 | 8.2% |
| $35,000 to $49,999 | 84 | 14.7% |
| $50,000 to $74,999 | 73 | 12.7% |
| $75,000 to $99,999 | 83 | 14.5% |
| $100,000 to $149,999 | 77 | 13.4% |
| $150,000 to $199,999 | 13 | 2.3% |
| $200,000+ | 27 | 4.7% |
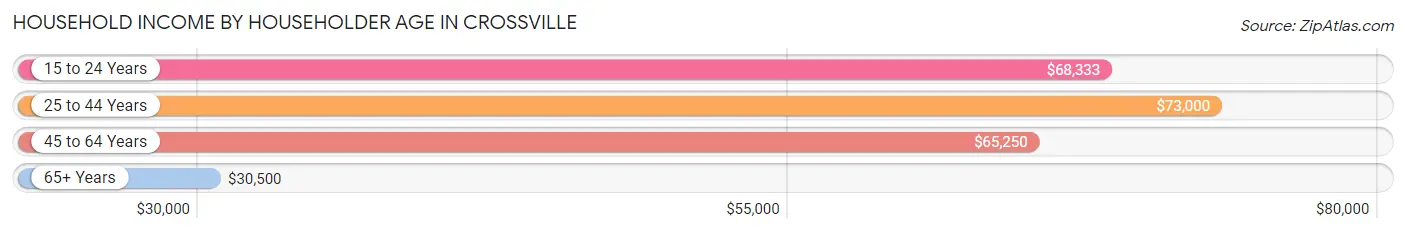
Household Income by Householder Age in Crossville
The median household income in Crossville is $47,750, with the highest median household income of $73,000 found in the 25 to 44 years age bracket for the primary householder. A total of 160 households (27.9%) fall into this category. Meanwhile, the 65+ years age bracket for the primary householder has the lowest median household income of $30,500, with 142 households (24.8%) in this group.
| Income Bracket | # Households | Median Income |
| 15 to 24 Years | 24 (4.2%) | $68,333 |
| 25 to 44 Years | 160 (27.9%) | $73,000 |
| 45 to 64 Years | 247 (43.1%) | $65,250 |
| 65+ Years | 142 (24.8%) | $30,500 |
| Total | 573 (100.0%) | $47,750 |
Poverty in Crossville
Income Below Poverty by Sex and Age in Crossville
With 22.3% poverty level for males and 29.9% for females among the residents of Crossville, 16 and 17 year old males and 12 to 14 year old females are the most vulnerable to poverty, with 17 males (47.2%) and 42 females (71.2%) in their respective age groups living below the poverty level.
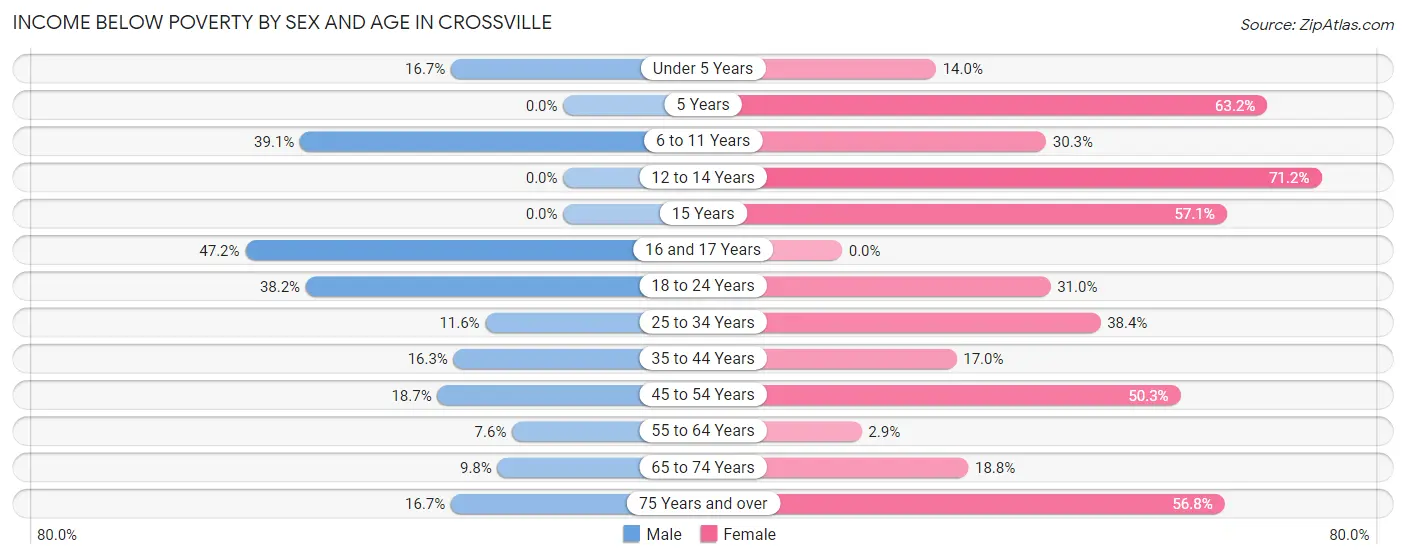
| Age Bracket | Male | Female |
| Under 5 Years | 6 (16.7%) | 12 (14.0%) |
| 5 Years | 0 (0.0%) | 12 (63.2%) |
| 6 to 11 Years | 34 (39.1%) | 20 (30.3%) |
| 12 to 14 Years | 0 (0.0%) | 42 (71.2%) |
| 15 Years | 0 (0.0%) | 8 (57.1%) |
| 16 and 17 Years | 17 (47.2%) | 0 (0.0%) |
| 18 to 24 Years | 60 (38.2%) | 39 (30.9%) |
| 25 to 34 Years | 14 (11.6%) | 33 (38.4%) |
| 35 to 44 Years | 14 (16.3%) | 17 (17.0%) |
| 45 to 54 Years | 20 (18.7%) | 89 (50.3%) |
| 55 to 64 Years | 6 (7.6%) | 5 (2.9%) |
| 65 to 74 Years | 4 (9.8%) | 12 (18.8%) |
| 75 Years and over | 11 (16.7%) | 25 (56.8%) |
| Total | 186 (22.3%) | 314 (29.9%) |
Income Above Poverty by Sex and Age in Crossville
According to the poverty statistics in Crossville, males aged 12 to 14 years and females aged 16 and 17 years are the age groups that are most secure financially, with 100.0% of males and 100.0% of females in these age groups living above the poverty line.
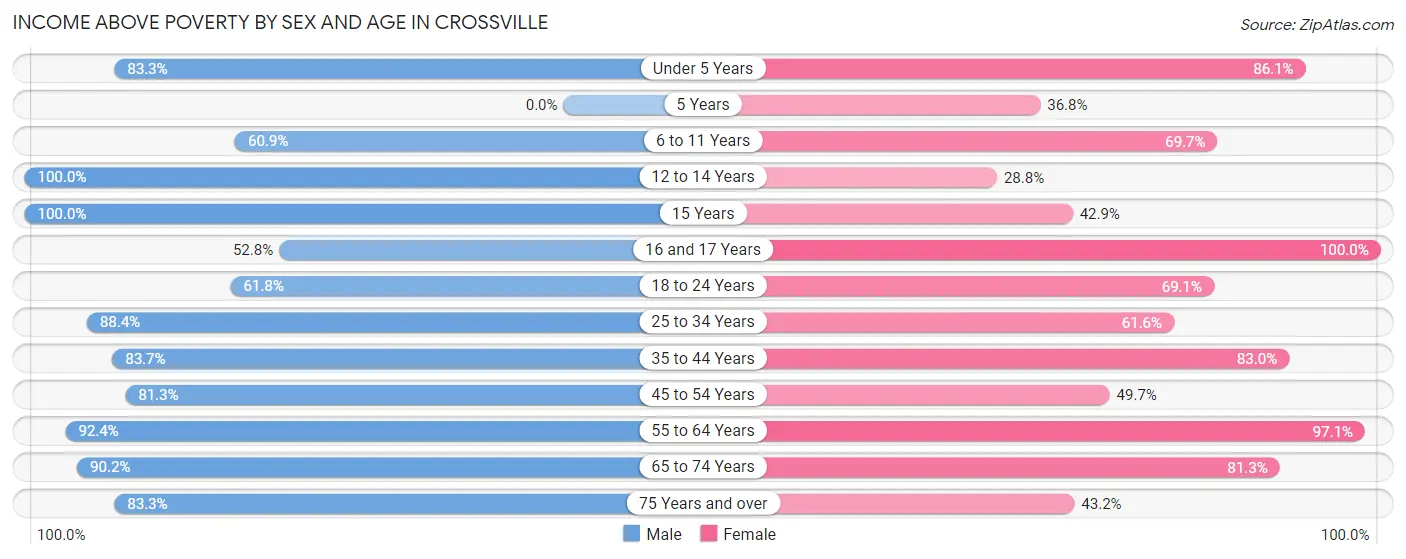
| Age Bracket | Male | Female |
| Under 5 Years | 30 (83.3%) | 74 (86.1%) |
| 5 Years | 0 (0.0%) | 7 (36.8%) |
| 6 to 11 Years | 53 (60.9%) | 46 (69.7%) |
| 12 to 14 Years | 4 (100.0%) | 17 (28.8%) |
| 15 Years | 14 (100.0%) | 6 (42.9%) |
| 16 and 17 Years | 19 (52.8%) | 36 (100.0%) |
| 18 to 24 Years | 97 (61.8%) | 87 (69.1%) |
| 25 to 34 Years | 107 (88.4%) | 53 (61.6%) |
| 35 to 44 Years | 72 (83.7%) | 83 (83.0%) |
| 45 to 54 Years | 87 (81.3%) | 88 (49.7%) |
| 55 to 64 Years | 73 (92.4%) | 167 (97.1%) |
| 65 to 74 Years | 37 (90.2%) | 52 (81.2%) |
| 75 Years and over | 55 (83.3%) | 19 (43.2%) |
| Total | 648 (77.7%) | 735 (70.1%) |
Income Below Poverty Among Married-Couple Families in Crossville
The poverty statistics for married-couple families in Crossville show that 18.4% or 56 of the total 305 families live below the poverty line. Families with 3 or 4 children have the highest poverty rate of 43.8%, comprising of 21 families. On the other hand, families with no children have the lowest poverty rate of 7.8%, which includes 12 families.
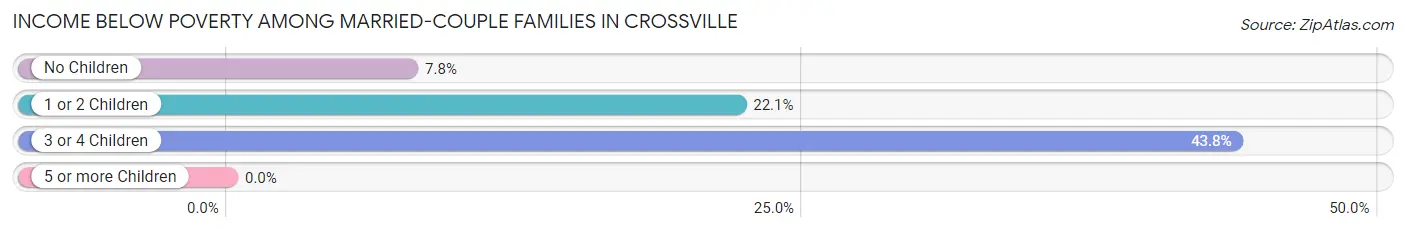
| Children | Above Poverty | Below Poverty |
| No Children | 141 (92.2%) | 12 (7.8%) |
| 1 or 2 Children | 81 (77.9%) | 23 (22.1%) |
| 3 or 4 Children | 27 (56.2%) | 21 (43.8%) |
| 5 or more Children | 0 (0.0%) | 0 (0.0%) |
| Total | 249 (81.6%) | 56 (18.4%) |
Income Below Poverty Among Single-Parent Households in Crossville
According to the poverty data in Crossville, 10.3% or 3 single-father households and 79.5% or 66 single-mother households are living below the poverty line. Among single-father households, those with 1 or 2 children have the highest poverty rate, with 3 households (11.1%) experiencing poverty. Likewise, among single-mother households, those with no children have the highest poverty rate, with 55 households (82.1%) falling below the poverty line.
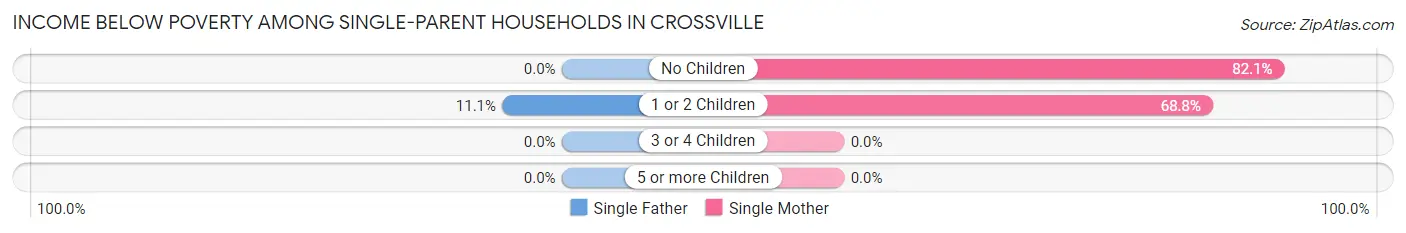
| Children | Single Father | Single Mother |
| No Children | 0 (0.0%) | 55 (82.1%) |
| 1 or 2 Children | 3 (11.1%) | 11 (68.8%) |
| 3 or 4 Children | 0 (0.0%) | 0 (0.0%) |
| 5 or more Children | 0 (0.0%) | 0 (0.0%) |
| Total | 3 (10.3%) | 66 (79.5%) |
Income Below Poverty Among Married-Couple vs Single-Parent Households in Crossville
The poverty data for Crossville shows that 56 of the married-couple family households (18.4%) and 69 of the single-parent households (61.6%) are living below the poverty level. Within the married-couple family households, those with 3 or 4 children have the highest poverty rate, with 21 households (43.8%) falling below the poverty line. Among the single-parent households, those with no children have the highest poverty rate, with 55 household (79.7%) living below poverty.
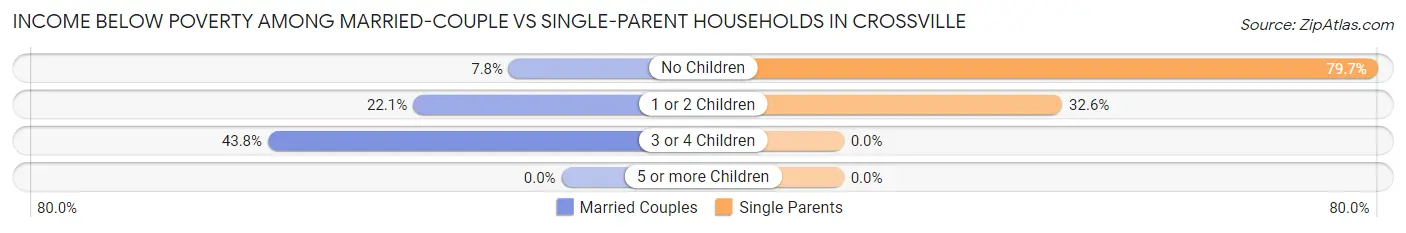
| Children | Married-Couple Families | Single-Parent Households |
| No Children | 12 (7.8%) | 55 (79.7%) |
| 1 or 2 Children | 23 (22.1%) | 14 (32.6%) |
| 3 or 4 Children | 21 (43.8%) | 0 (0.0%) |
| 5 or more Children | 0 (0.0%) | 0 (0.0%) |
| Total | 56 (18.4%) | 69 (61.6%) |
Race in Crossville
The most populous races in Crossville are White / Caucasian (1,733 | 84.8%), Hispanic or Latino (228 | 11.2%), and Some other Race (152 | 7.4%).
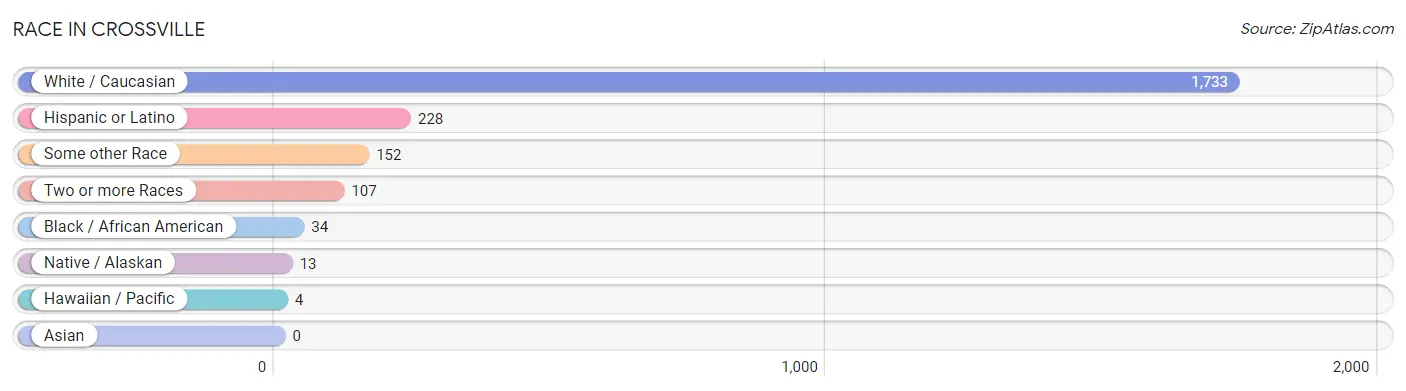
| Race | # Population | % Population |
| Asian | 0 | 0.0% |
| Black / African American | 34 | 1.7% |
| Hawaiian / Pacific | 4 | 0.2% |
| Hispanic or Latino | 228 | 11.2% |
| Native / Alaskan | 13 | 0.6% |
| White / Caucasian | 1,733 | 84.8% |
| Two or more Races | 107 | 5.2% |
| Some other Race | 152 | 7.4% |
| Total | 2,043 | 100.0% |
Ancestry in Crossville
The most populous ancestries reported in Crossville are American (413 | 20.2%), Mexican (185 | 9.1%), Irish (183 | 9.0%), English (103 | 5.0%), and German (57 | 2.8%), together accounting for 46.1% of all Crossville residents.
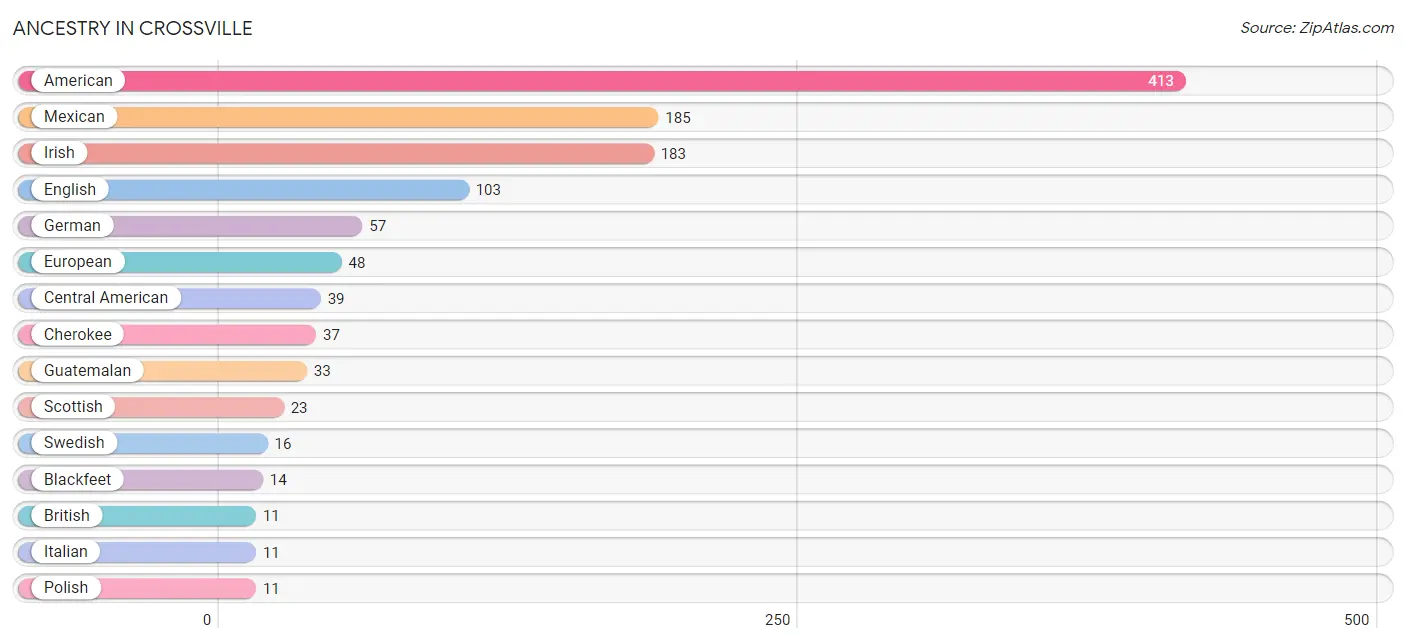
| Ancestry | # Population | % Population |
| American | 413 | 20.2% |
| Blackfeet | 14 | 0.7% |
| British | 11 | 0.5% |
| Central American | 39 | 1.9% |
| Cherokee | 37 | 1.8% |
| English | 103 | 5.0% |
| European | 48 | 2.4% |
| German | 57 | 2.8% |
| Greek | 2 | 0.1% |
| Guamanian / Chamorro | 10 | 0.5% |
| Guatemalan | 33 | 1.6% |
| Irish | 183 | 9.0% |
| Italian | 11 | 0.5% |
| Mexican | 185 | 9.1% |
| Norwegian | 10 | 0.5% |
| Peruvian | 4 | 0.2% |
| Polish | 11 | 0.5% |
| Salvadoran | 6 | 0.3% |
| Scandinavian | 5 | 0.2% |
| Scotch-Irish | 9 | 0.4% |
| Scottish | 23 | 1.1% |
| South American | 4 | 0.2% |
| Swedish | 16 | 0.8% |
| Welsh | 3 | 0.2% | View All 24 Rows |
Immigrants in Crossville
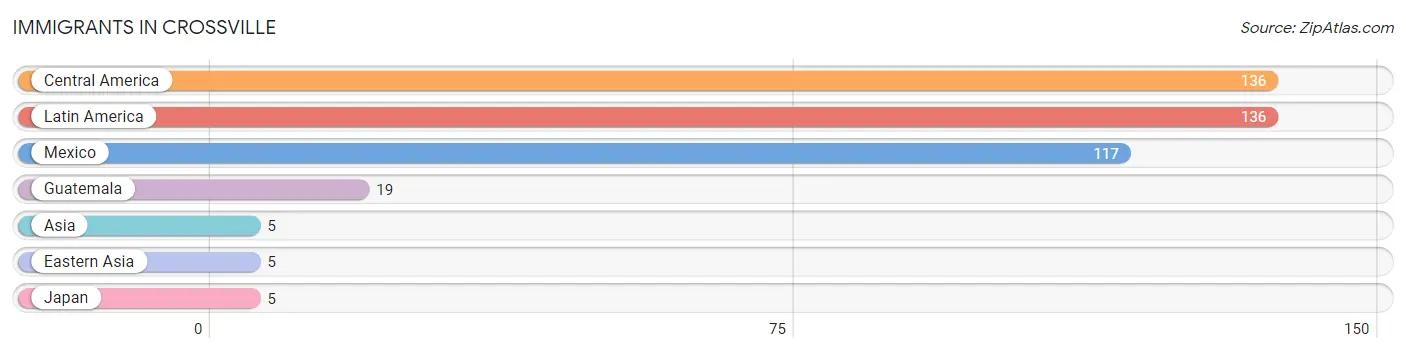
The most numerous immigrant groups reported in Crossville came from Central America (136 | 6.7%), Latin America (136 | 6.7%), Mexico (117 | 5.7%), Guatemala (19 | 0.9%), and Asia (5 | 0.2%), together accounting for 20.2% of all Crossville residents.
| Immigration Origin | # Population | % Population |
| Asia | 5 | 0.2% |
| Central America | 136 | 6.7% |
| Eastern Asia | 5 | 0.2% |
| Guatemala | 19 | 0.9% |
| Japan | 5 | 0.2% |
| Latin America | 136 | 6.7% |
| Mexico | 117 | 5.7% | View All 7 Rows |
Sex and Age in Crossville
Sex and Age in Crossville
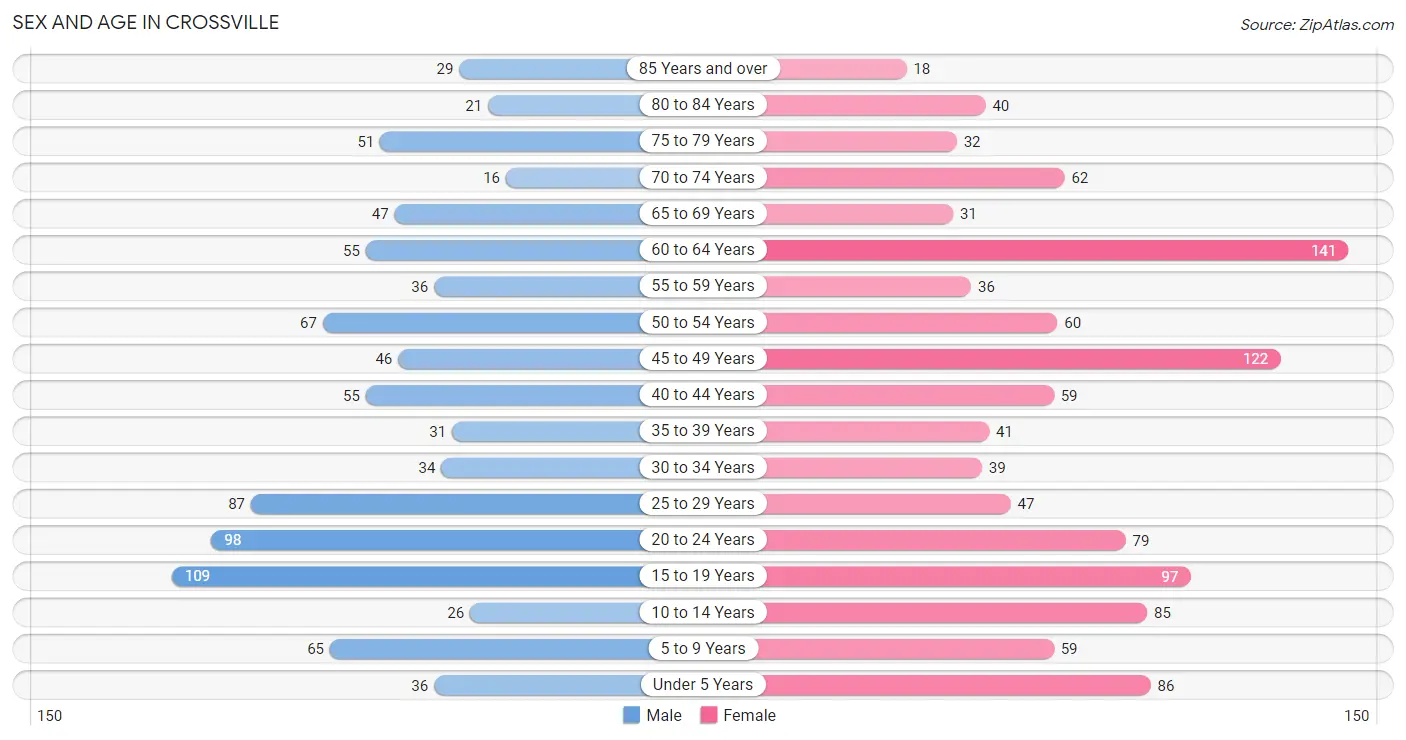
The most populous age groups in Crossville are 15 to 19 Years (109 | 12.0%) for men and 60 to 64 Years (141 | 12.4%) for women.
| Age Bracket | Male | Female |
| Under 5 Years | 36 (4.0%) | 86 (7.6%) |
| 5 to 9 Years | 65 (7.1%) | 59 (5.2%) |
| 10 to 14 Years | 26 (2.9%) | 85 (7.5%) |
| 15 to 19 Years | 109 (12.0%) | 97 (8.6%) |
| 20 to 24 Years | 98 (10.8%) | 79 (7.0%) |
| 25 to 29 Years | 87 (9.6%) | 47 (4.1%) |
| 30 to 34 Years | 34 (3.7%) | 39 (3.4%) |
| 35 to 39 Years | 31 (3.4%) | 41 (3.6%) |
| 40 to 44 Years | 55 (6.0%) | 59 (5.2%) |
| 45 to 49 Years | 46 (5.1%) | 122 (10.8%) |
| 50 to 54 Years | 67 (7.4%) | 60 (5.3%) |
| 55 to 59 Years | 36 (4.0%) | 36 (3.2%) |
| 60 to 64 Years | 55 (6.0%) | 141 (12.4%) |
| 65 to 69 Years | 47 (5.2%) | 31 (2.7%) |
| 70 to 74 Years | 16 (1.8%) | 62 (5.5%) |
| 75 to 79 Years | 51 (5.6%) | 32 (2.8%) |
| 80 to 84 Years | 21 (2.3%) | 40 (3.5%) |
| 85 Years and over | 29 (3.2%) | 18 (1.6%) |
| Total | 909 (100.0%) | 1,134 (100.0%) |
Families and Households in Crossville
Median Family Size in Crossville
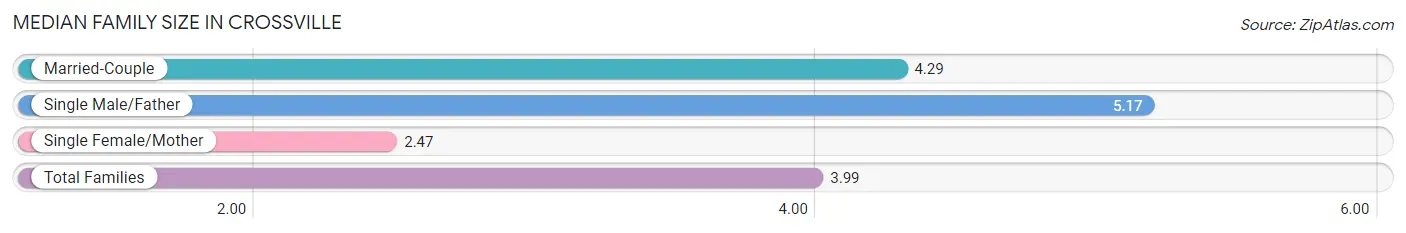
The median family size in Crossville is 3.99 persons per family, with single male/father families (29 | 7.0%) accounting for the largest median family size of 5.17 persons per family. On the other hand, single female/mother families (83 | 19.9%) represent the smallest median family size with 2.47 persons per family.
| Family Type | # Families | Family Size |
| Married-Couple | 305 (73.1%) | 4.29 |
| Single Male/Father | 29 (7.0%) | 5.17 |
| Single Female/Mother | 83 (19.9%) | 2.47 |
| Total Families | 417 (100.0%) | 3.99 |
Median Household Size in Crossville
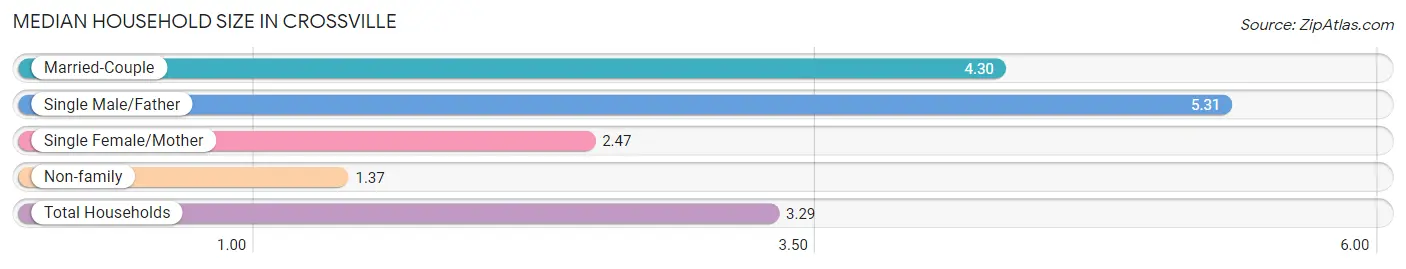
The median household size in Crossville is 3.29 persons per household, with single male/father households (29 | 5.1%) accounting for the largest median household size of 5.31 persons per household. non-family households (156 | 27.2%) represent the smallest median household size with 1.37 persons per household.
| Household Type | # Households | Household Size |
| Married-Couple | 305 (53.2%) | 4.30 |
| Single Male/Father | 29 (5.1%) | 5.31 |
| Single Female/Mother | 83 (14.5%) | 2.47 |
| Non-family | 156 (27.2%) | 1.37 |
| Total Households | 573 (100.0%) | 3.29 |
Household Size by Marriage Status in Crossville
Out of a total of 573 households in Crossville, 417 (72.8%) are family households, while 156 (27.2%) are nonfamily households. The most numerous type of family households are 2-person households, comprising 196, and the most common type of nonfamily households are 1-person households, comprising 123.
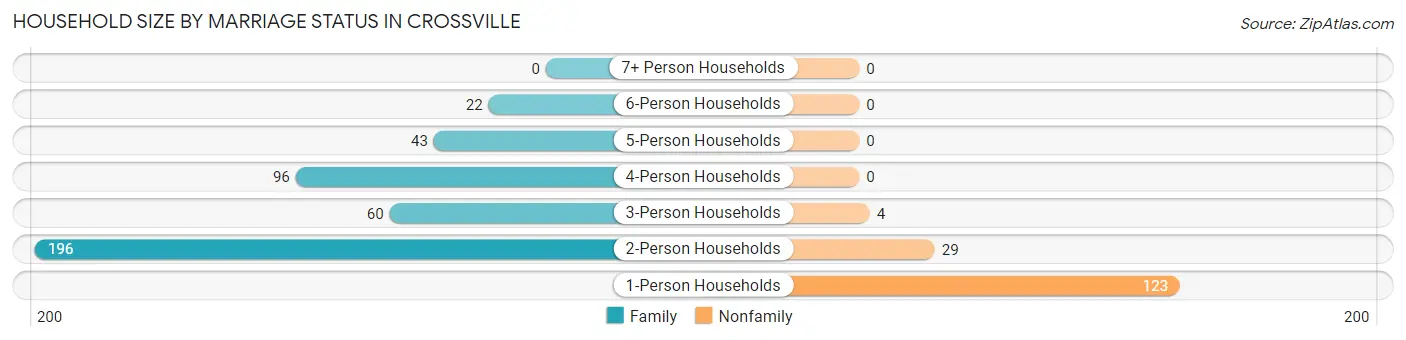
| Household Size | Family Households | Nonfamily Households |
| 1-Person Households | - | 123 (21.5%) |
| 2-Person Households | 196 (34.2%) | 29 (5.1%) |
| 3-Person Households | 60 (10.5%) | 4 (0.7%) |
| 4-Person Households | 96 (16.8%) | 0 (0.0%) |
| 5-Person Households | 43 (7.5%) | 0 (0.0%) |
| 6-Person Households | 22 (3.8%) | 0 (0.0%) |
| 7+ Person Households | 0 (0.0%) | 0 (0.0%) |
| Total | 417 (72.8%) | 156 (27.2%) |
Female Fertility in Crossville
Fertility by Age in Crossville
Average fertility rate in Crossville is 14.0 births per 1,000 women. Women in the age bracket of 20 to 34 years have the highest fertility rate with 30.0 births per 1,000 women. Women in the age bracket of 20 to 34 years acount for 71.4% of all women with births.
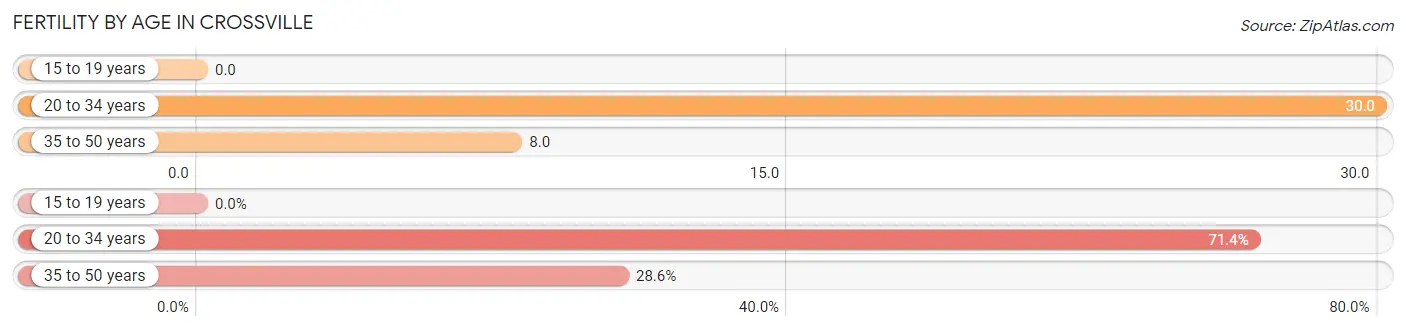
| Age Bracket | Women with Births | Births / 1,000 Women |
| 15 to 19 years | 0 (0.0%) | 0.0 |
| 20 to 34 years | 5 (71.4%) | 30.0 |
| 35 to 50 years | 2 (28.6%) | 8.0 |
| Total | 7 (100.0%) | 14.0 |
Fertility by Age by Marriage Status in Crossville
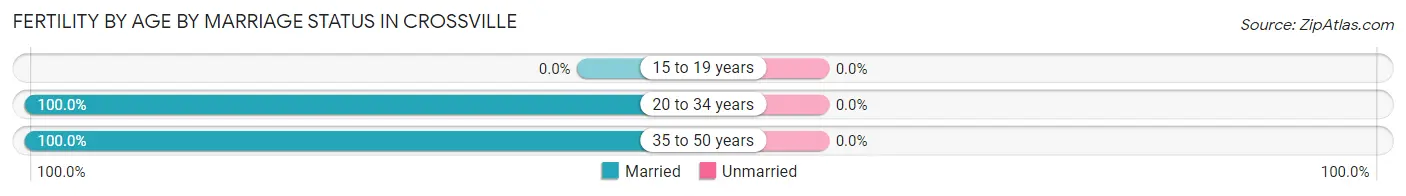
| Age Bracket | Married | Unmarried |
| 15 to 19 years | 0 (0.0%) | 0 (0.0%) |
| 20 to 34 years | 5 (100.0%) | 0 (0.0%) |
| 35 to 50 years | 2 (100.0%) | 0 (0.0%) |
| Total | 7 (100.0%) | 0 (0.0%) |
Fertility by Education in Crossville
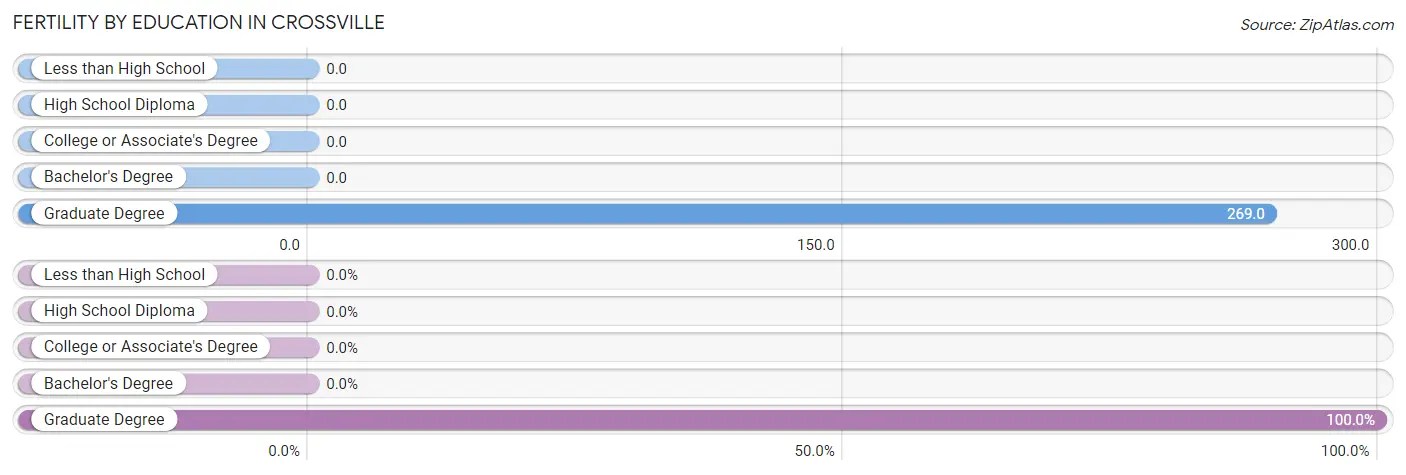
| Educational Attainment | Women with Births | Births / 1,000 Women |
| Less than High School | 0 (0.0%) | 0.0 |
| High School Diploma | 0 (0.0%) | 0.0 |
| College or Associate's Degree | 0 (0.0%) | 0.0 |
| Bachelor's Degree | 0 (0.0%) | 0.0 |
| Graduate Degree | 7 (100.0%) | 269.0 |
| Total | 7 (100.0%) | 14.0 |
Fertility by Education by Marriage Status in Crossville
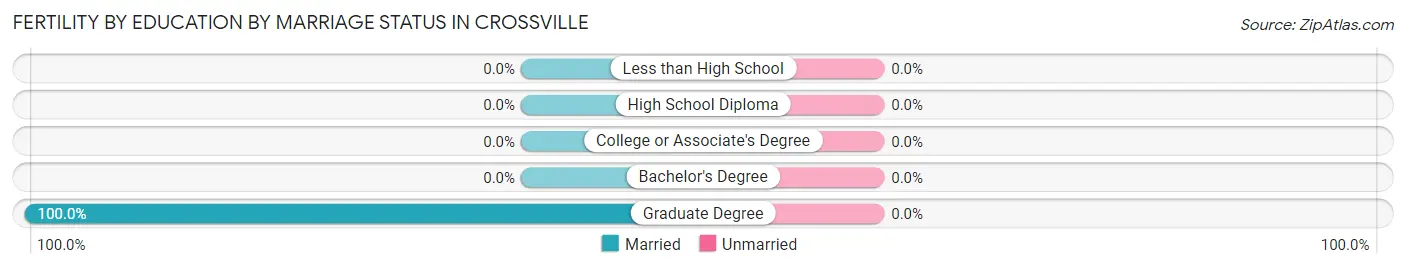
| Educational Attainment | Married | Unmarried |
| Less than High School | 0 (0.0%) | 0 (0.0%) |
| High School Diploma | 0 (0.0%) | 0 (0.0%) |
| College or Associate's Degree | 0 (0.0%) | 0 (0.0%) |
| Bachelor's Degree | 0 (0.0%) | 0 (0.0%) |
| Graduate Degree | 7 (100.0%) | 0 (0.0%) |
| Total | 7 (100.0%) | 0 (0.0%) |
Employment Characteristics in Crossville
Employment by Class of Employer in Crossville
Among the 826 employed individuals in Crossville, private company employees (558 | 67.5%), not-for-profit organizations (75 | 9.1%), and state government employees (66 | 8.0%) make up the most common classes of employment.
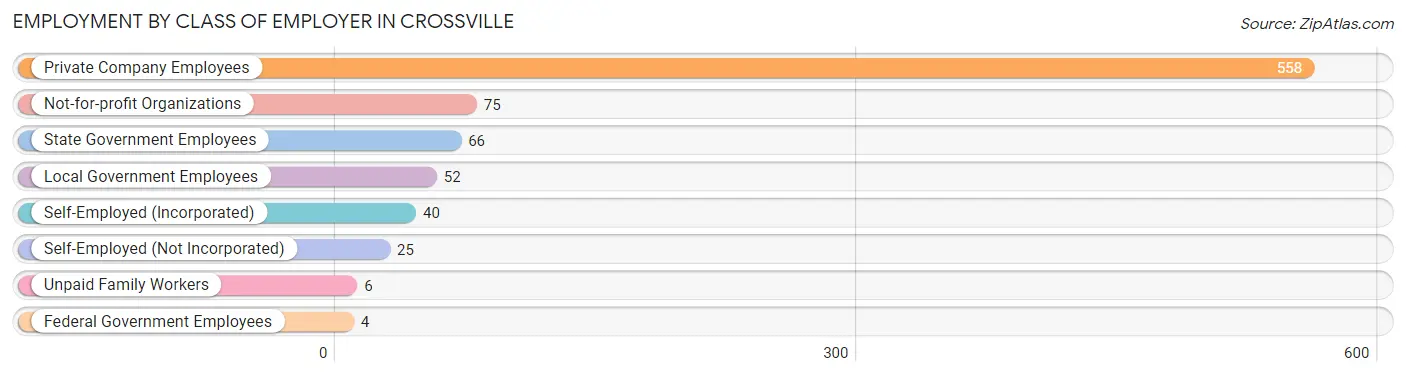
| Employer Class | # Employees | % Employees |
| Private Company Employees | 558 | 67.5% |
| Self-Employed (Incorporated) | 40 | 4.8% |
| Self-Employed (Not Incorporated) | 25 | 3.0% |
| Not-for-profit Organizations | 75 | 9.1% |
| Local Government Employees | 52 | 6.3% |
| State Government Employees | 66 | 8.0% |
| Federal Government Employees | 4 | 0.5% |
| Unpaid Family Workers | 6 | 0.7% |
| Total | 826 | 100.0% |
Employment Status by Age in Crossville
According to the labor force statistics for Crossville, out of the total population over 16 years of age (1,658), 51.9% or 861 individuals are in the labor force, with 2.0% or 17 of them unemployed. The age group with the highest labor force participation rate is 20 to 24 years, with 84.2% or 149 individuals in the labor force. Within the labor force, the 30 to 34 years age range has the highest percentage of unemployed individuals, with 7.0% or 4 of them being unemployed.
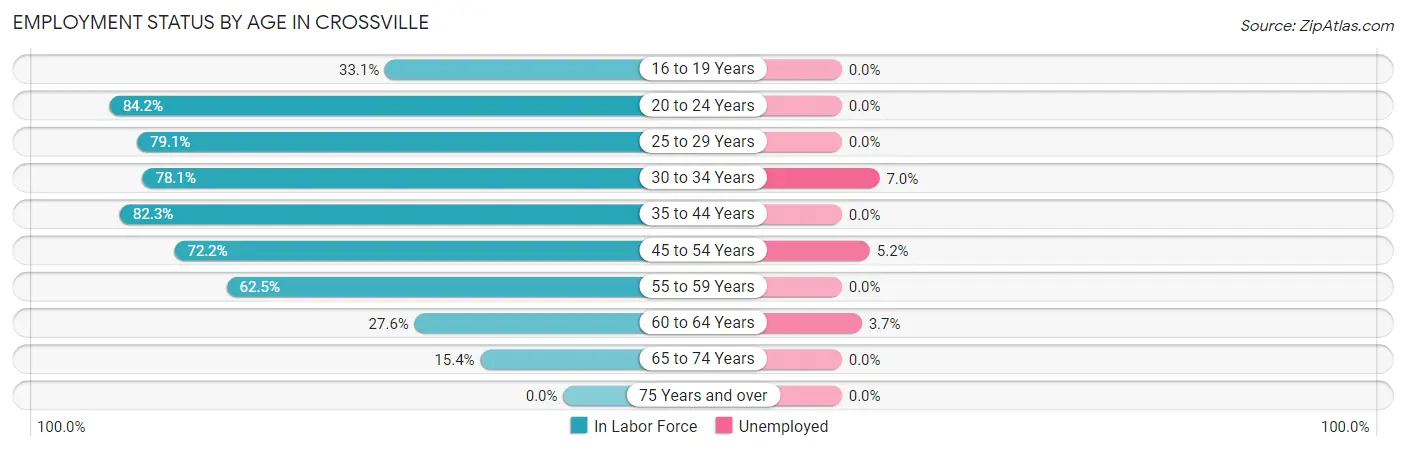
| Age Bracket | In Labor Force | Unemployed |
| 16 to 19 Years | 59 (33.1%) | 0 (0.0%) |
| 20 to 24 Years | 149 (84.2%) | 0 (0.0%) |
| 25 to 29 Years | 106 (79.1%) | 0 (0.0%) |
| 30 to 34 Years | 57 (78.1%) | 4 (7.0%) |
| 35 to 44 Years | 153 (82.3%) | 0 (0.0%) |
| 45 to 54 Years | 213 (72.2%) | 11 (5.2%) |
| 55 to 59 Years | 45 (62.5%) | 0 (0.0%) |
| 60 to 64 Years | 54 (27.6%) | 2 (3.7%) |
| 65 to 74 Years | 24 (15.4%) | 0 (0.0%) |
| 75 Years and over | 0 (0.0%) | 0 (0.0%) |
| Total | 861 (51.9%) | 17 (2.0%) |
Employment Status by Educational Attainment in Crossville
According to labor force statistics for Crossville, 65.7% of individuals (628) out of the total population between 25 and 64 years of age (956) are in the labor force, with 2.7% or 17 of them being unemployed. The group with the highest labor force participation rate are those with the educational attainment of bachelor's degree or higher, with 90.6% or 173 individuals in the labor force. Within the labor force, individuals with less than high school education have the highest percentage of unemployment, with 5.3% or 4 of them being unemployed.
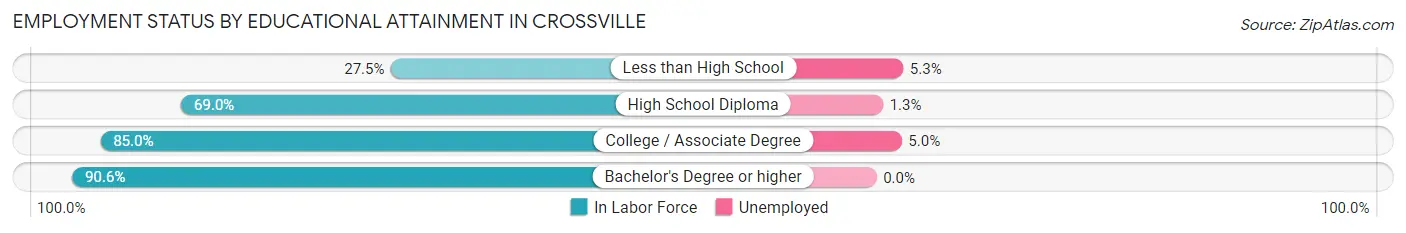
| Educational Attainment | In Labor Force | Unemployed |
| Less than High School | 76 (27.5%) | 15 (5.3%) |
| High School Diploma | 158 (69.0%) | 3 (1.3%) |
| College / Associate Degree | 221 (85.0%) | 13 (5.0%) |
| Bachelor's Degree or higher | 173 (90.6%) | 0 (0.0%) |
| Total | 628 (65.7%) | 26 (2.7%) |
Employment Occupations by Sex in Crossville
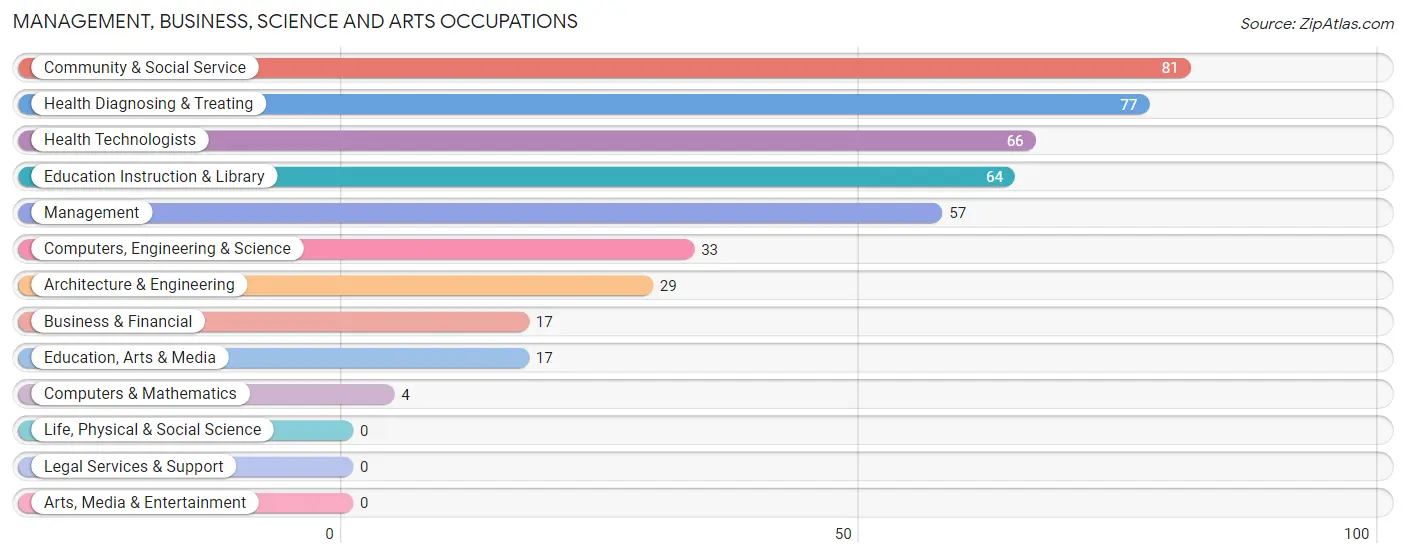
Management, Business, Science and Arts Occupations
The most common Management, Business, Science and Arts occupations in Crossville are Community & Social Service (81 | 9.6%), Health Diagnosing & Treating (77 | 9.1%), Health Technologists (66 | 7.8%), Education Instruction & Library (64 | 7.6%), and Management (57 | 6.8%).
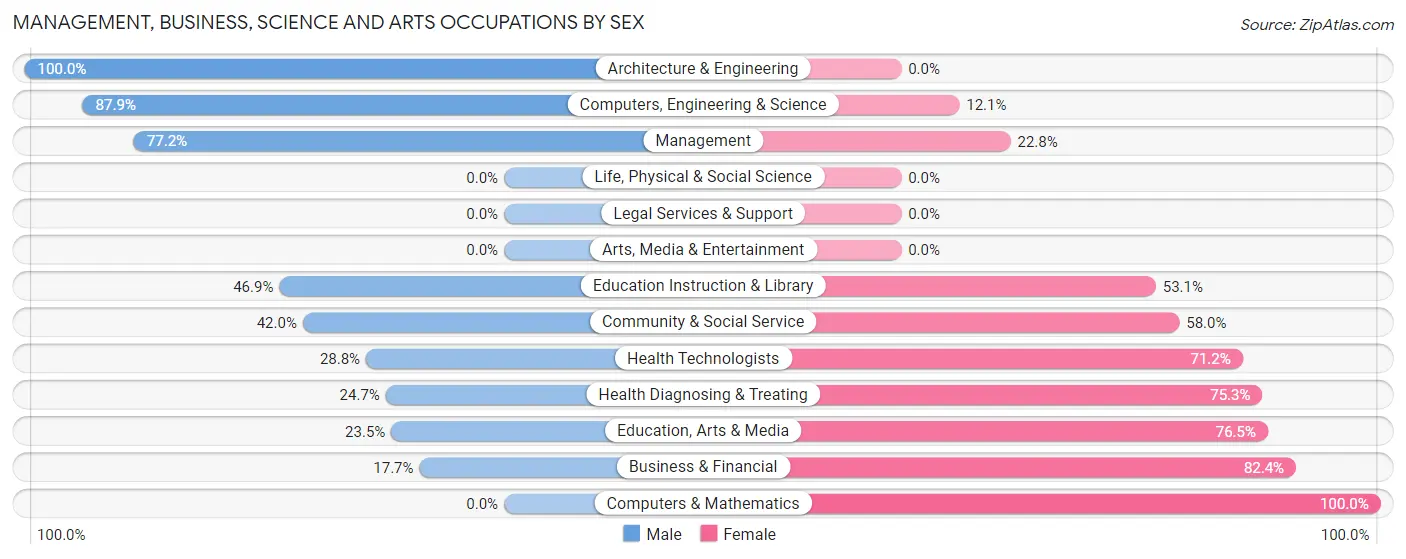
Management, Business, Science and Arts Occupations by Sex
Within the Management, Business, Science and Arts occupations in Crossville, the most male-oriented occupations are Architecture & Engineering (100.0%), Computers, Engineering & Science (87.9%), and Management (77.2%), while the most female-oriented occupations are Computers & Mathematics (100.0%), Business & Financial (82.4%), and Education, Arts & Media (76.5%).
| Occupation | Male | Female |
| Management | 44 (77.2%) | 13 (22.8%) |
| Business & Financial | 3 (17.6%) | 14 (82.4%) |
| Computers, Engineering & Science | 29 (87.9%) | 4 (12.1%) |
| Computers & Mathematics | 0 (0.0%) | 4 (100.0%) |
| Architecture & Engineering | 29 (100.0%) | 0 (0.0%) |
| Life, Physical & Social Science | 0 (0.0%) | 0 (0.0%) |
| Community & Social Service | 34 (42.0%) | 47 (58.0%) |
| Education, Arts & Media | 4 (23.5%) | 13 (76.5%) |
| Legal Services & Support | 0 (0.0%) | 0 (0.0%) |
| Education Instruction & Library | 30 (46.9%) | 34 (53.1%) |
| Arts, Media & Entertainment | 0 (0.0%) | 0 (0.0%) |
| Health Diagnosing & Treating | 19 (24.7%) | 58 (75.3%) |
| Health Technologists | 19 (28.8%) | 47 (71.2%) |
| Total (Category) | 129 (48.7%) | 136 (51.3%) |
| Total (Overall) | 474 (56.2%) | 369 (43.8%) |
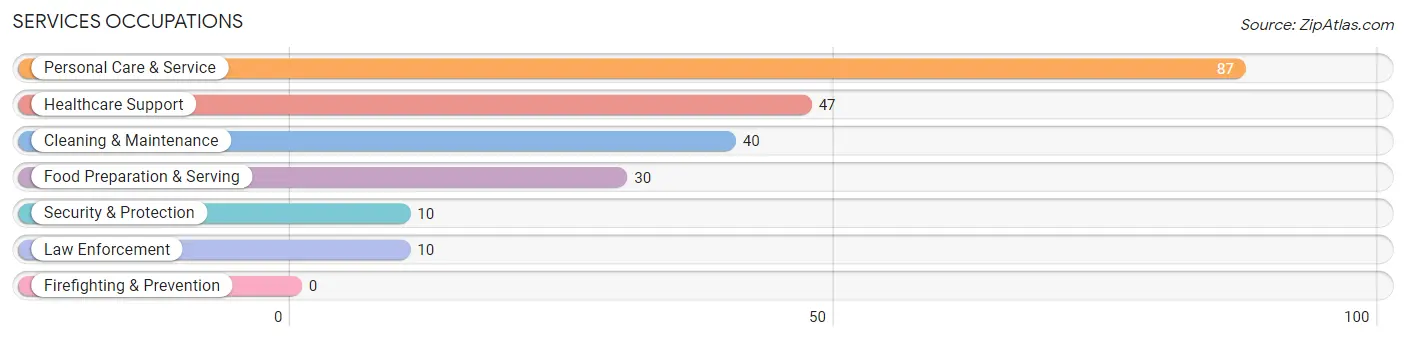
Services Occupations
The most common Services occupations in Crossville are Personal Care & Service (87 | 10.3%), Healthcare Support (47 | 5.6%), Cleaning & Maintenance (40 | 4.7%), Food Preparation & Serving (30 | 3.6%), and Security & Protection (10 | 1.2%).
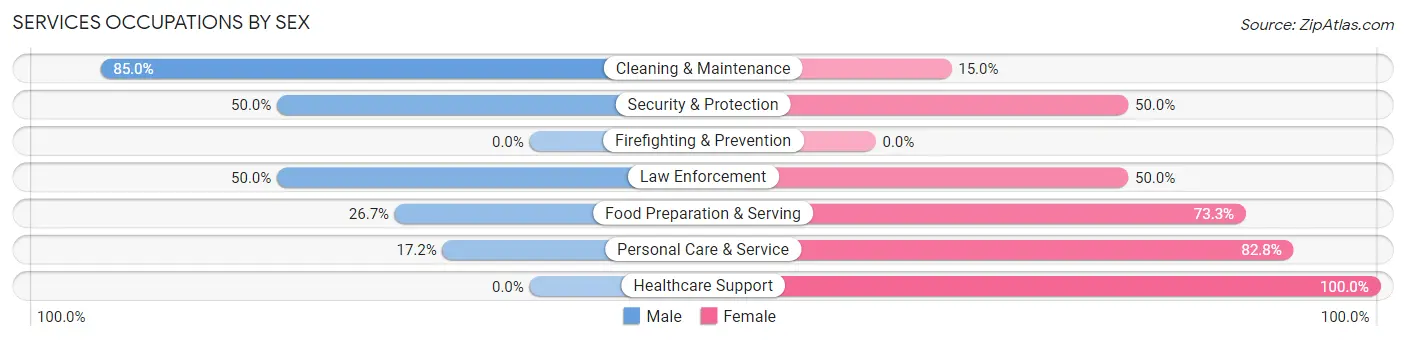
Services Occupations by Sex
Within the Services occupations in Crossville, the most male-oriented occupations are Cleaning & Maintenance (85.0%), Security & Protection (50.0%), and Law Enforcement (50.0%), while the most female-oriented occupations are Healthcare Support (100.0%), Personal Care & Service (82.8%), and Food Preparation & Serving (73.3%).
| Occupation | Male | Female |
| Healthcare Support | 0 (0.0%) | 47 (100.0%) |
| Security & Protection | 5 (50.0%) | 5 (50.0%) |
| Firefighting & Prevention | 0 (0.0%) | 0 (0.0%) |
| Law Enforcement | 5 (50.0%) | 5 (50.0%) |
| Food Preparation & Serving | 8 (26.7%) | 22 (73.3%) |
| Cleaning & Maintenance | 34 (85.0%) | 6 (15.0%) |
| Personal Care & Service | 15 (17.2%) | 72 (82.8%) |
| Total (Category) | 62 (29.0%) | 152 (71.0%) |
| Total (Overall) | 474 (56.2%) | 369 (43.8%) |
Sales and Office Occupations
The most common Sales and Office occupations in Crossville are Office & Administration (55 | 6.5%), and Sales & Related (41 | 4.9%).
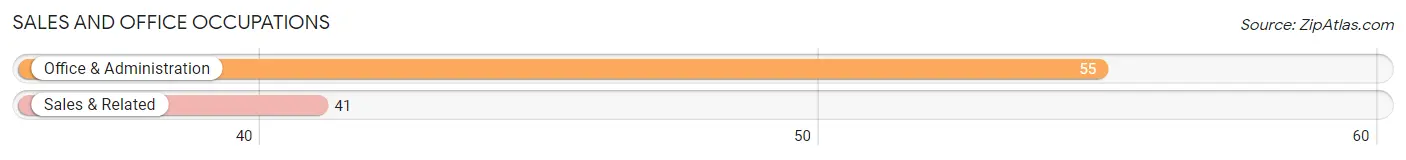
Sales and Office Occupations by Sex
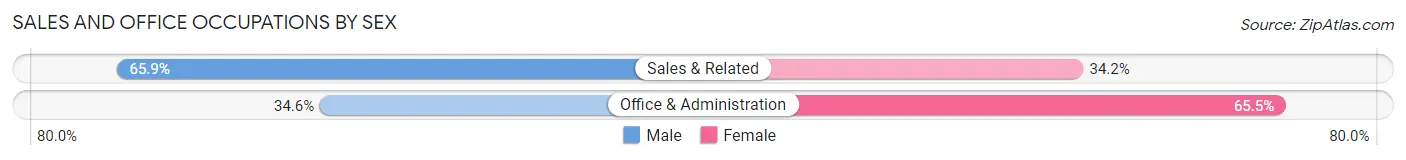
| Occupation | Male | Female |
| Sales & Related | 27 (65.8%) | 14 (34.2%) |
| Office & Administration | 19 (34.5%) | 36 (65.4%) |
| Total (Category) | 46 (47.9%) | 50 (52.1%) |
| Total (Overall) | 474 (56.2%) | 369 (43.8%) |
Natural Resources, Construction and Maintenance Occupations
The most common Natural Resources, Construction and Maintenance occupations in Crossville are Construction & Extraction (87 | 10.3%), and Installation, Maintenance & Repair (20 | 2.4%).
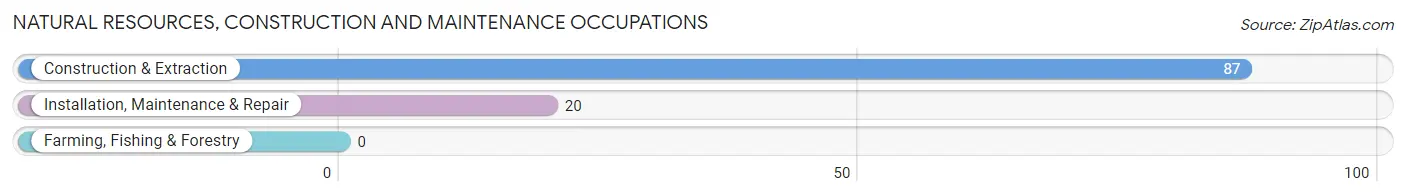
Natural Resources, Construction and Maintenance Occupations by Sex
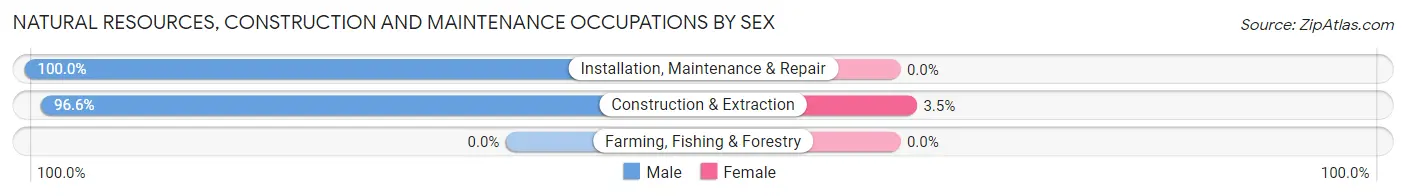
| Occupation | Male | Female |
| Farming, Fishing & Forestry | 0 (0.0%) | 0 (0.0%) |
| Construction & Extraction | 84 (96.6%) | 3 (3.5%) |
| Installation, Maintenance & Repair | 20 (100.0%) | 0 (0.0%) |
| Total (Category) | 104 (97.2%) | 3 (2.8%) |
| Total (Overall) | 474 (56.2%) | 369 (43.8%) |
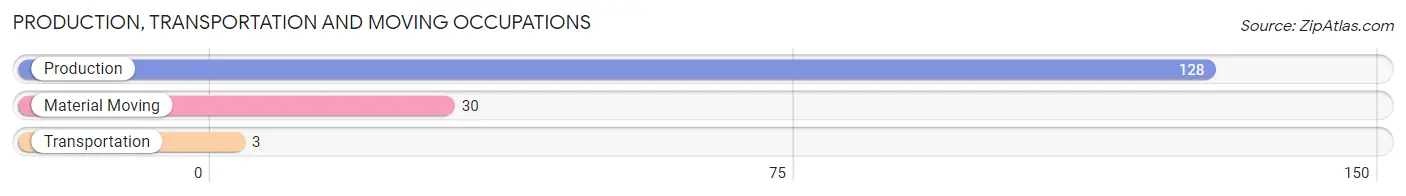
Production, Transportation and Moving Occupations
The most common Production, Transportation and Moving occupations in Crossville are Production (128 | 15.2%), Material Moving (30 | 3.6%), and Transportation (3 | 0.4%).
Production, Transportation and Moving Occupations by Sex
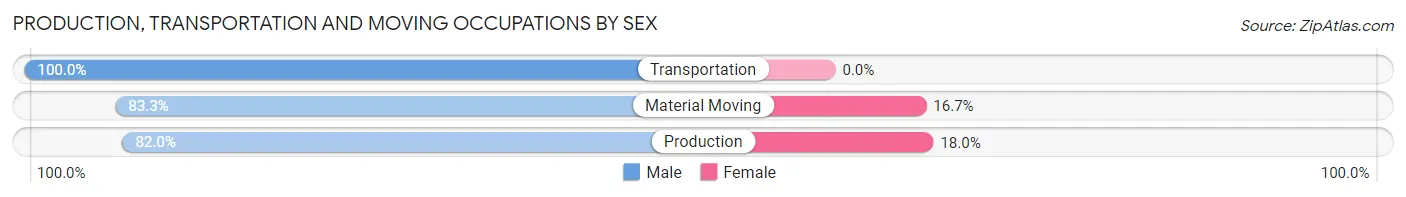
| Occupation | Male | Female |
| Production | 105 (82.0%) | 23 (18.0%) |
| Transportation | 3 (100.0%) | 0 (0.0%) |
| Material Moving | 25 (83.3%) | 5 (16.7%) |
| Total (Category) | 133 (82.6%) | 28 (17.4%) |
| Total (Overall) | 474 (56.2%) | 369 (43.8%) |
Employment Industries by Sex in Crossville
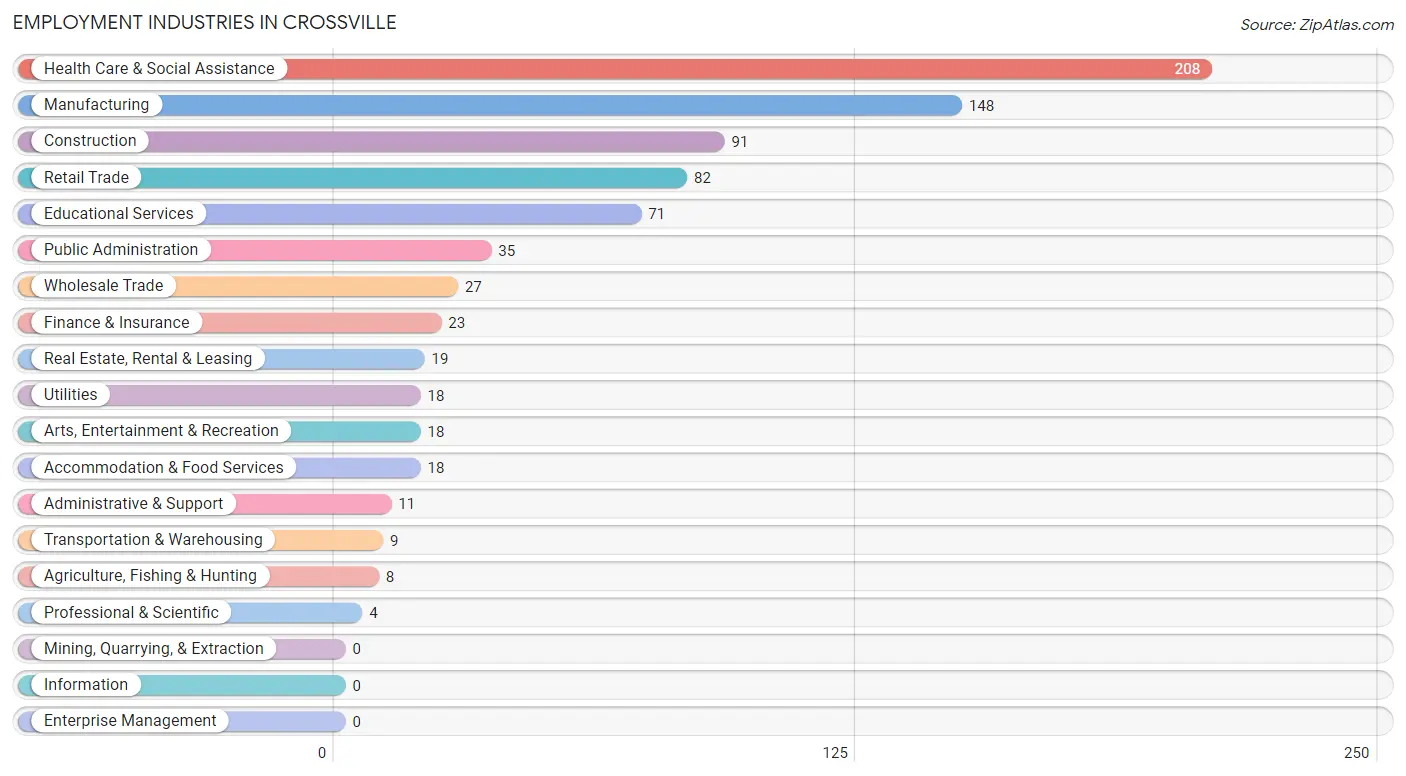
Employment Industries in Crossville
The major employment industries in Crossville include Health Care & Social Assistance (208 | 24.7%), Manufacturing (148 | 17.6%), Construction (91 | 10.8%), Retail Trade (82 | 9.7%), and Educational Services (71 | 8.4%).
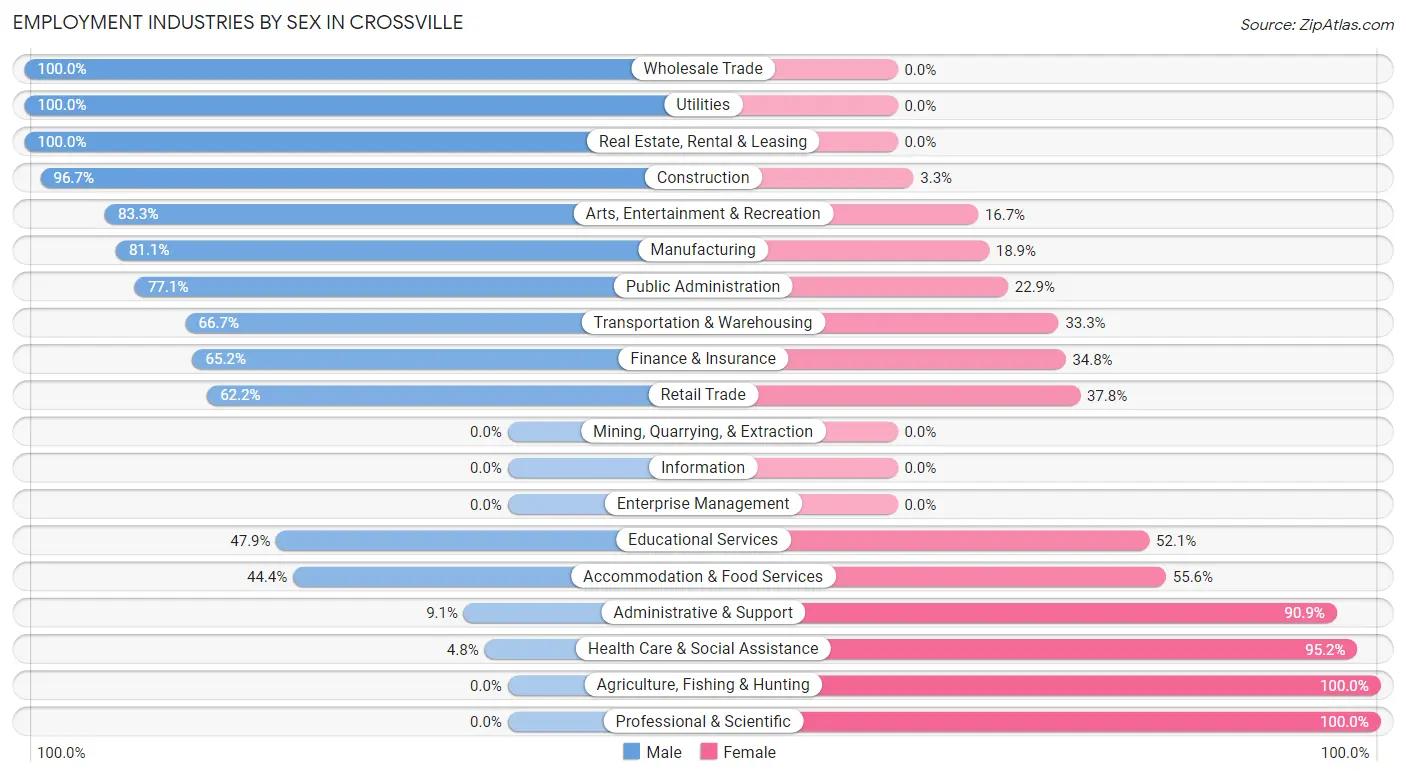
Employment Industries by Sex in Crossville
The Crossville industries that see more men than women are Wholesale Trade (100.0%), Utilities (100.0%), and Real Estate, Rental & Leasing (100.0%), whereas the industries that tend to have a higher number of women are Agriculture, Fishing & Hunting (100.0%), Professional & Scientific (100.0%), and Health Care & Social Assistance (95.2%).
| Industry | Male | Female |
| Agriculture, Fishing & Hunting | 0 (0.0%) | 8 (100.0%) |
| Mining, Quarrying, & Extraction | 0 (0.0%) | 0 (0.0%) |
| Construction | 88 (96.7%) | 3 (3.3%) |
| Manufacturing | 120 (81.1%) | 28 (18.9%) |
| Wholesale Trade | 27 (100.0%) | 0 (0.0%) |
| Retail Trade | 51 (62.2%) | 31 (37.8%) |
| Transportation & Warehousing | 6 (66.7%) | 3 (33.3%) |
| Utilities | 18 (100.0%) | 0 (0.0%) |
| Information | 0 (0.0%) | 0 (0.0%) |
| Finance & Insurance | 15 (65.2%) | 8 (34.8%) |
| Real Estate, Rental & Leasing | 19 (100.0%) | 0 (0.0%) |
| Professional & Scientific | 0 (0.0%) | 4 (100.0%) |
| Enterprise Management | 0 (0.0%) | 0 (0.0%) |
| Administrative & Support | 1 (9.1%) | 10 (90.9%) |
| Educational Services | 34 (47.9%) | 37 (52.1%) |
| Health Care & Social Assistance | 10 (4.8%) | 198 (95.2%) |
| Arts, Entertainment & Recreation | 15 (83.3%) | 3 (16.7%) |
| Accommodation & Food Services | 8 (44.4%) | 10 (55.6%) |
| Public Administration | 27 (77.1%) | 8 (22.9%) |
| Total | 474 (56.2%) | 369 (43.8%) |
Education in Crossville
School Enrollment in Crossville
The most common levels of schooling among the 564 students in Crossville are high school (240 | 42.5%), elementary school (116 | 20.6%), and middle school (82 | 14.5%).
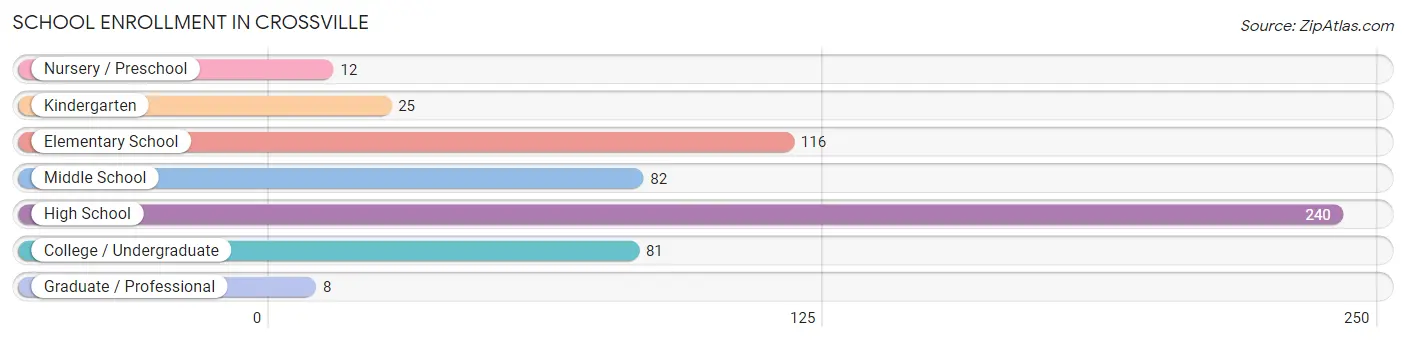
| School Level | # Students | % Students |
| Nursery / Preschool | 12 | 2.1% |
| Kindergarten | 25 | 4.4% |
| Elementary School | 116 | 20.6% |
| Middle School | 82 | 14.5% |
| High School | 240 | 42.5% |
| College / Undergraduate | 81 | 14.4% |
| Graduate / Professional | 8 | 1.4% |
| Total | 564 | 100.0% |
School Enrollment by Age by Funding Source in Crossville
Out of a total of 564 students who are enrolled in schools in Crossville, 62 (11.0%) attend a private institution, while the remaining 502 (89.0%) are enrolled in public schools. The age group of 3 to 4 year olds has the highest likelihood of being enrolled in private schools, with 5 (41.7% in the age bracket) enrolled. Conversely, the age group of 18 to 19 year olds has the lowest likelihood of being enrolled in a private school, with 51 (100.0% in the age bracket) attending a public institution.
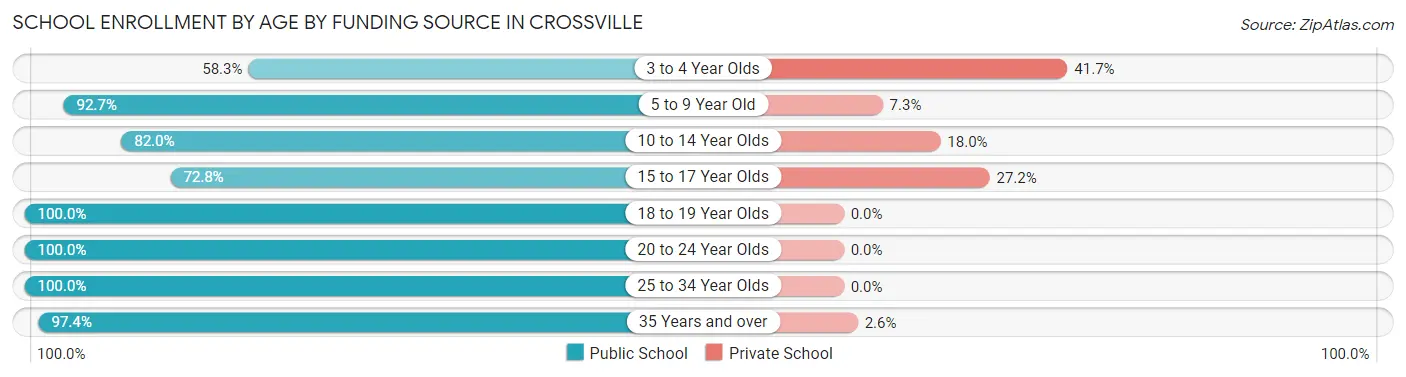
| Age Bracket | Public School | Private School |
| 3 to 4 Year Olds | 7 (58.3%) | 5 (41.7%) |
| 5 to 9 Year Old | 115 (92.7%) | 9 (7.3%) |
| 10 to 14 Year Olds | 91 (82.0%) | 20 (18.0%) |
| 15 to 17 Year Olds | 67 (72.8%) | 25 (27.2%) |
| 18 to 19 Year Olds | 51 (100.0%) | 0 (0.0%) |
| 20 to 24 Year Olds | 51 (100.0%) | 0 (0.0%) |
| 25 to 34 Year Olds | 8 (100.0%) | 0 (0.0%) |
| 35 Years and over | 112 (97.4%) | 3 (2.6%) |
| Total | 502 (89.0%) | 62 (11.0%) |
Educational Attainment by Field of Study in Crossville
Science & technology (64 | 28.4%), education (51 | 22.7%), business (34 | 15.1%), engineering (20 | 8.9%), and arts & humanities (17 | 7.6%) are the most common fields of study among 225 individuals in Crossville who have obtained a bachelor's degree or higher.
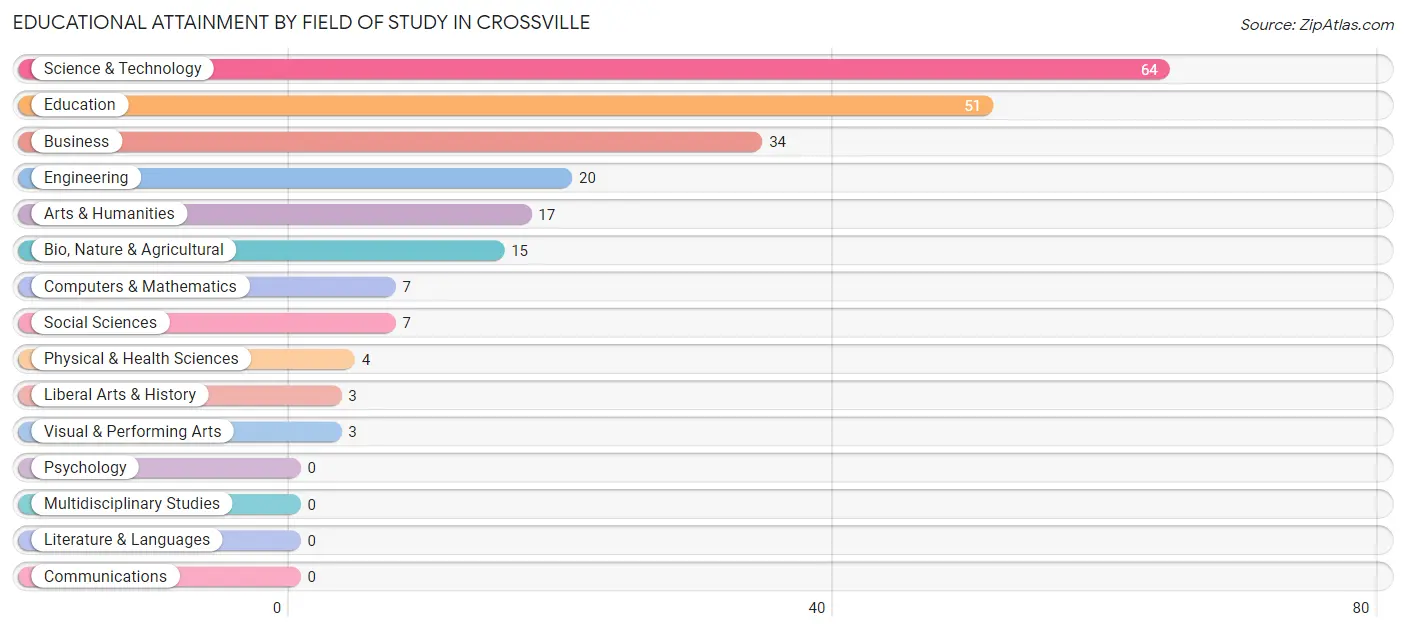
| Field of Study | # Graduates | % Graduates |
| Computers & Mathematics | 7 | 3.1% |
| Bio, Nature & Agricultural | 15 | 6.7% |
| Physical & Health Sciences | 4 | 1.8% |
| Psychology | 0 | 0.0% |
| Social Sciences | 7 | 3.1% |
| Engineering | 20 | 8.9% |
| Multidisciplinary Studies | 0 | 0.0% |
| Science & Technology | 64 | 28.4% |
| Business | 34 | 15.1% |
| Education | 51 | 22.7% |
| Literature & Languages | 0 | 0.0% |
| Liberal Arts & History | 3 | 1.3% |
| Visual & Performing Arts | 3 | 1.3% |
| Communications | 0 | 0.0% |
| Arts & Humanities | 17 | 7.6% |
| Total | 225 | 100.0% |
Transportation & Commute in Crossville
Vehicle Availability by Sex in Crossville
The most prevalent vehicle ownership categories in Crossville are males with 2 vehicles (176, accounting for 37.7%) and females with 2 vehicles (116, making up 49.0%).
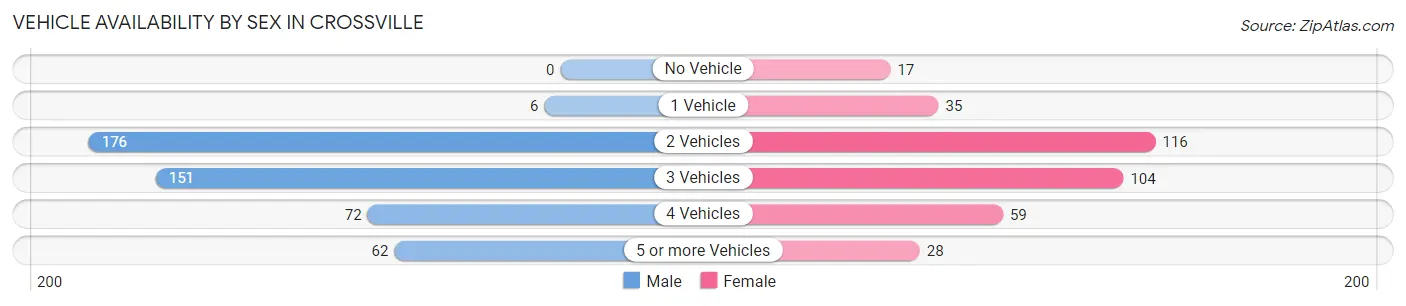
| Vehicles Available | Male | Female |
| No Vehicle | 0 (0.0%) | 17 (4.7%) |
| 1 Vehicle | 6 (1.3%) | 35 (9.8%) |
| 2 Vehicles | 176 (37.7%) | 116 (32.3%) |
| 3 Vehicles | 151 (32.3%) | 104 (29.0%) |
| 4 Vehicles | 72 (15.4%) | 59 (16.4%) |
| 5 or more Vehicles | 62 (13.3%) | 28 (7.8%) |
| Total | 467 (100.0%) | 359 (100.0%) |
Commute Time in Crossville
The most frequently occuring commute durations in Crossville are less than 5 minutes (122 commuters, 15.1%), 25 to 29 minutes (106 commuters, 13.1%), and 30 to 34 minutes (91 commuters, 11.3%).
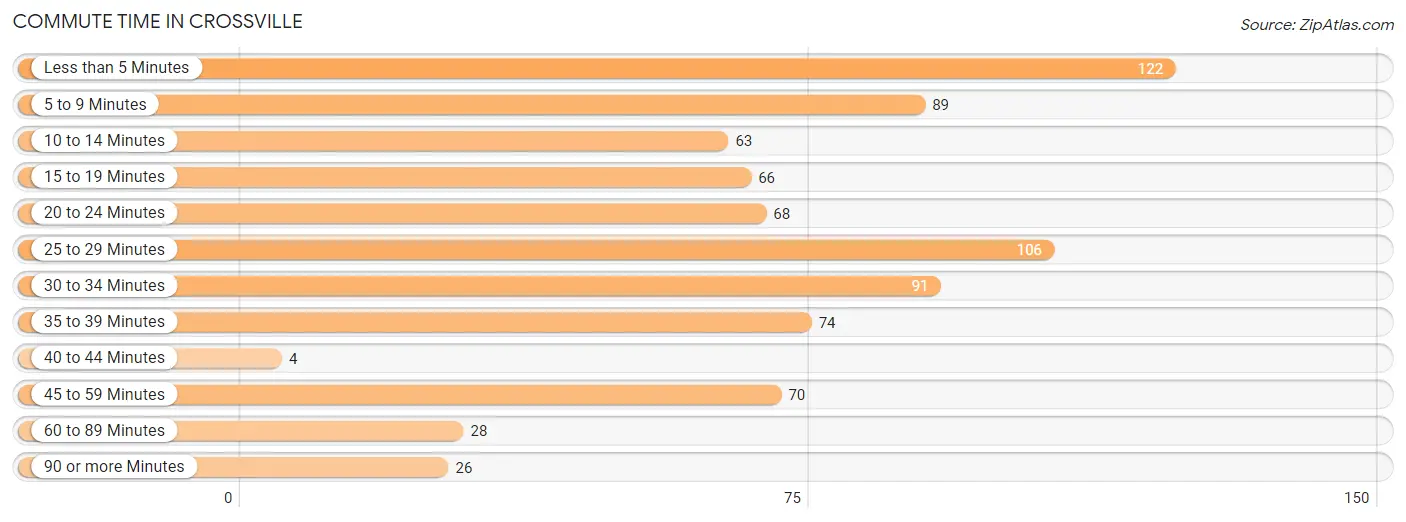
| Commute Time | # Commuters | % Commuters |
| Less than 5 Minutes | 122 | 15.1% |
| 5 to 9 Minutes | 89 | 11.0% |
| 10 to 14 Minutes | 63 | 7.8% |
| 15 to 19 Minutes | 66 | 8.2% |
| 20 to 24 Minutes | 68 | 8.4% |
| 25 to 29 Minutes | 106 | 13.1% |
| 30 to 34 Minutes | 91 | 11.3% |
| 35 to 39 Minutes | 74 | 9.2% |
| 40 to 44 Minutes | 4 | 0.5% |
| 45 to 59 Minutes | 70 | 8.7% |
| 60 to 89 Minutes | 28 | 3.5% |
| 90 or more Minutes | 26 | 3.2% |
Commute Time by Sex in Crossville
The most common commute times in Crossville are 25 to 29 minutes (70 commuters, 15.3%) for males and less than 5 minutes (73 commuters, 20.8%) for females.
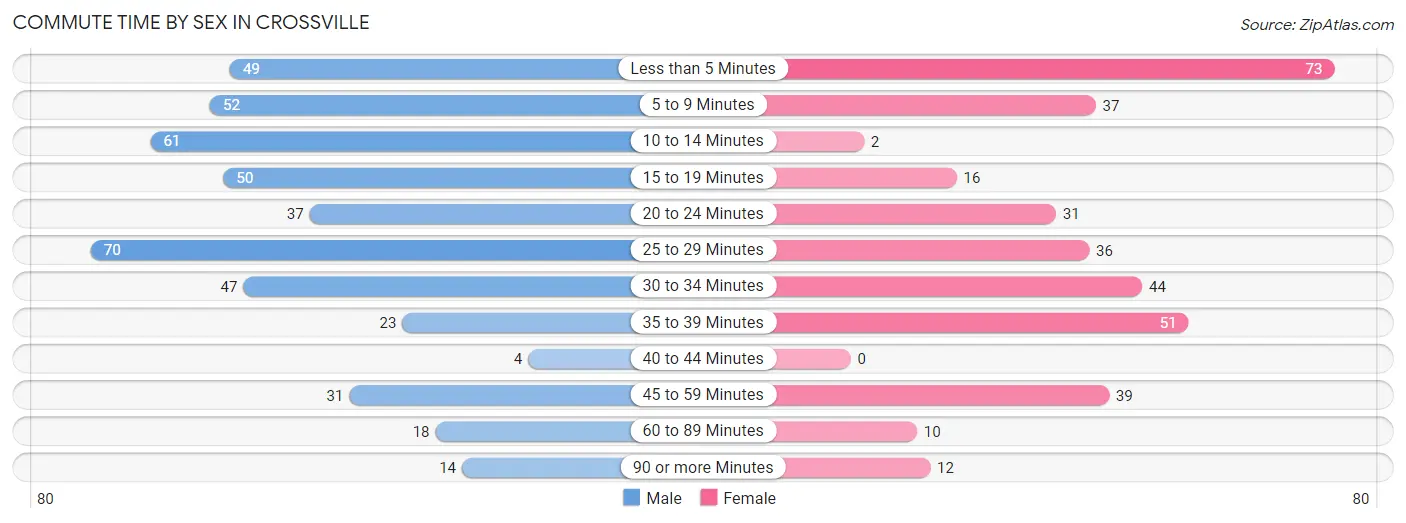
| Commute Time | Male | Female |
| Less than 5 Minutes | 49 (10.7%) | 73 (20.8%) |
| 5 to 9 Minutes | 52 (11.4%) | 37 (10.5%) |
| 10 to 14 Minutes | 61 (13.4%) | 2 (0.6%) |
| 15 to 19 Minutes | 50 (11.0%) | 16 (4.6%) |
| 20 to 24 Minutes | 37 (8.1%) | 31 (8.8%) |
| 25 to 29 Minutes | 70 (15.3%) | 36 (10.3%) |
| 30 to 34 Minutes | 47 (10.3%) | 44 (12.5%) |
| 35 to 39 Minutes | 23 (5.0%) | 51 (14.5%) |
| 40 to 44 Minutes | 4 (0.9%) | 0 (0.0%) |
| 45 to 59 Minutes | 31 (6.8%) | 39 (11.1%) |
| 60 to 89 Minutes | 18 (4.0%) | 10 (2.9%) |
| 90 or more Minutes | 14 (3.1%) | 12 (3.4%) |
Time of Departure to Work by Sex in Crossville
The most frequent times of departure to work in Crossville are 7:00 AM to 7:29 AM (106, 23.3%) for males and 7:00 AM to 7:29 AM (87, 24.8%) for females.
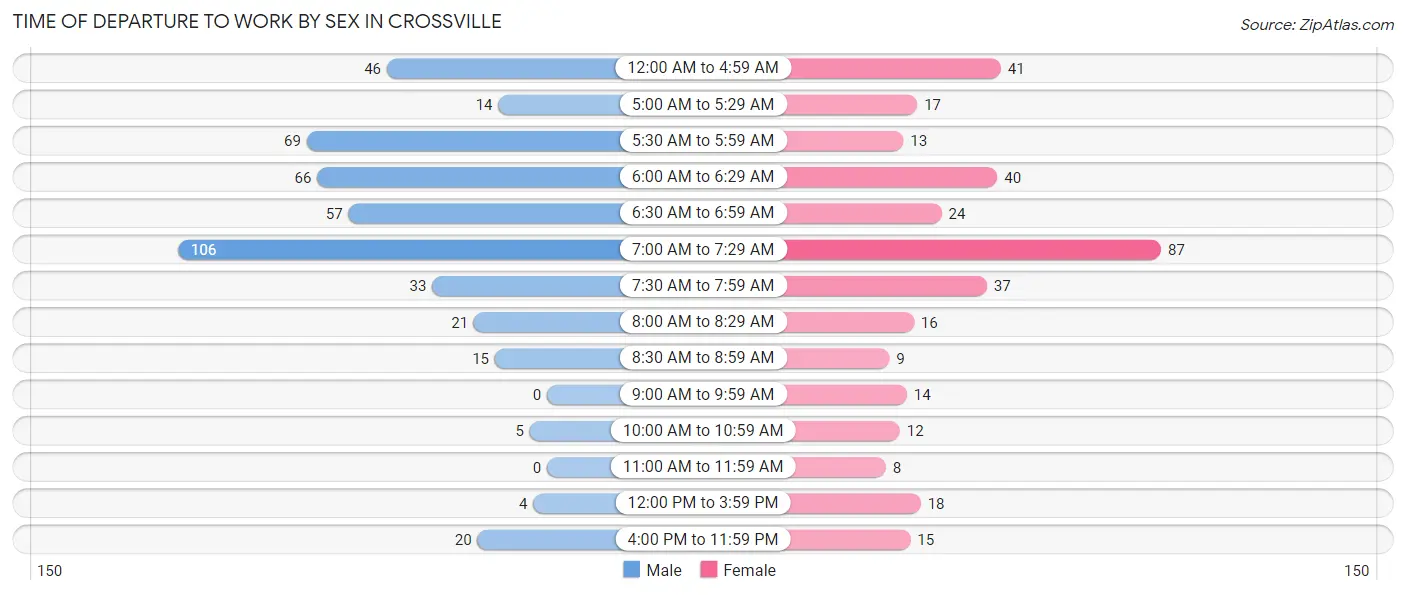
| Time of Departure | Male | Female |
| 12:00 AM to 4:59 AM | 46 (10.1%) | 41 (11.7%) |
| 5:00 AM to 5:29 AM | 14 (3.1%) | 17 (4.8%) |
| 5:30 AM to 5:59 AM | 69 (15.1%) | 13 (3.7%) |
| 6:00 AM to 6:29 AM | 66 (14.5%) | 40 (11.4%) |
| 6:30 AM to 6:59 AM | 57 (12.5%) | 24 (6.8%) |
| 7:00 AM to 7:29 AM | 106 (23.3%) | 87 (24.8%) |
| 7:30 AM to 7:59 AM | 33 (7.2%) | 37 (10.5%) |
| 8:00 AM to 8:29 AM | 21 (4.6%) | 16 (4.6%) |
| 8:30 AM to 8:59 AM | 15 (3.3%) | 9 (2.6%) |
| 9:00 AM to 9:59 AM | 0 (0.0%) | 14 (4.0%) |
| 10:00 AM to 10:59 AM | 5 (1.1%) | 12 (3.4%) |
| 11:00 AM to 11:59 AM | 0 (0.0%) | 8 (2.3%) |
| 12:00 PM to 3:59 PM | 4 (0.9%) | 18 (5.1%) |
| 4:00 PM to 11:59 PM | 20 (4.4%) | 15 (4.3%) |
| Total | 456 (100.0%) | 351 (100.0%) |
Housing Occupancy in Crossville
Occupancy by Ownership in Crossville
Of the total 573 dwellings in Crossville, owner-occupied units account for 369 (64.4%), while renter-occupied units make up 204 (35.6%).
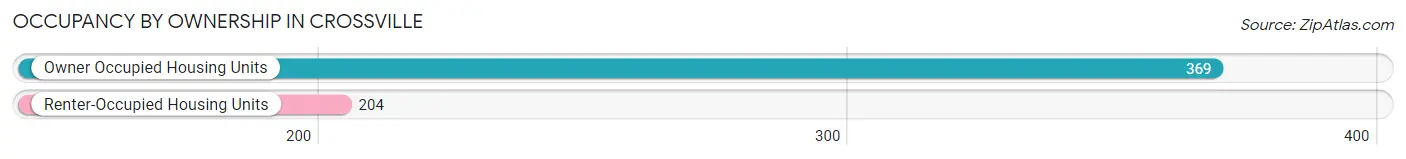
| Occupancy | # Housing Units | % Housing Units |
| Owner Occupied Housing Units | 369 | 64.4% |
| Renter-Occupied Housing Units | 204 | 35.6% |
| Total Occupied Housing Units | 573 | 100.0% |
Occupancy by Household Size in Crossville
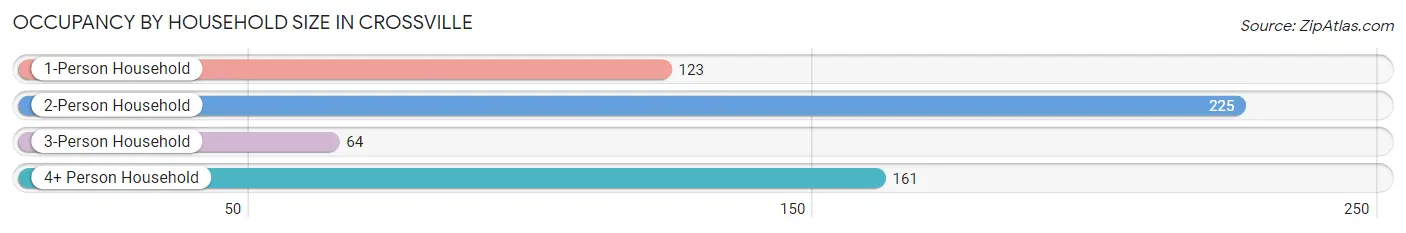
| Household Size | # Housing Units | % Housing Units |
| 1-Person Household | 123 | 21.5% |
| 2-Person Household | 225 | 39.3% |
| 3-Person Household | 64 | 11.2% |
| 4+ Person Household | 161 | 28.1% |
| Total Housing Units | 573 | 100.0% |
Occupancy by Ownership by Household Size in Crossville
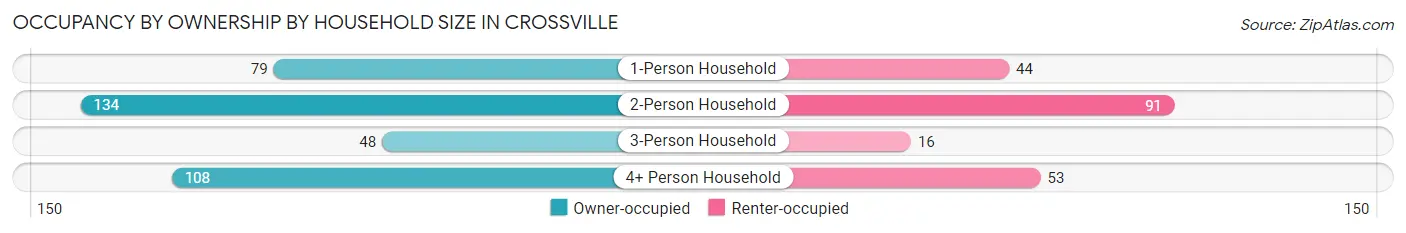
| Household Size | Owner-occupied | Renter-occupied |
| 1-Person Household | 79 (64.2%) | 44 (35.8%) |
| 2-Person Household | 134 (59.6%) | 91 (40.4%) |
| 3-Person Household | 48 (75.0%) | 16 (25.0%) |
| 4+ Person Household | 108 (67.1%) | 53 (32.9%) |
| Total Housing Units | 369 (64.4%) | 204 (35.6%) |
Occupancy by Educational Attainment in Crossville
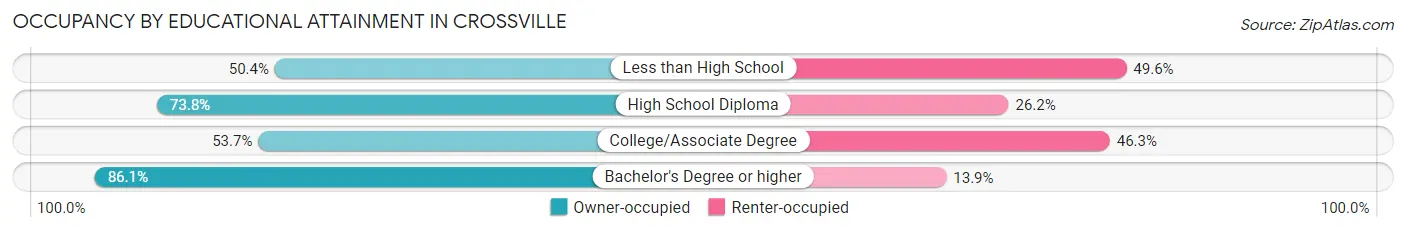
| Household Size | Owner-occupied | Renter-occupied |
| Less than High School | 64 (50.4%) | 63 (49.6%) |
| High School Diploma | 104 (73.8%) | 37 (26.2%) |
| College/Associate Degree | 102 (53.7%) | 88 (46.3%) |
| Bachelor's Degree or higher | 99 (86.1%) | 16 (13.9%) |
Occupancy by Age of Householder in Crossville
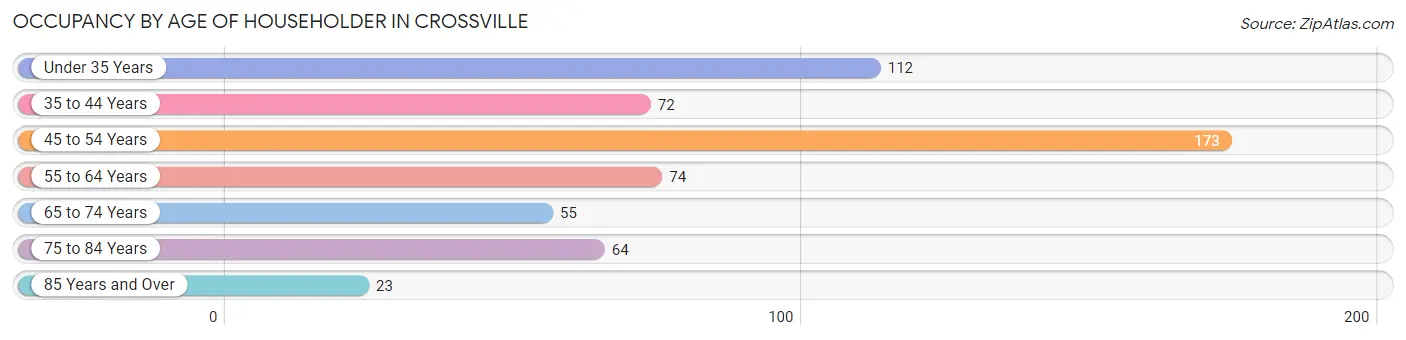
| Age Bracket | # Households | % Households |
| Under 35 Years | 112 | 19.6% |
| 35 to 44 Years | 72 | 12.6% |
| 45 to 54 Years | 173 | 30.2% |
| 55 to 64 Years | 74 | 12.9% |
| 65 to 74 Years | 55 | 9.6% |
| 75 to 84 Years | 64 | 11.2% |
| 85 Years and Over | 23 | 4.0% |
| Total | 573 | 100.0% |
Housing Finances in Crossville
Median Income by Occupancy in Crossville
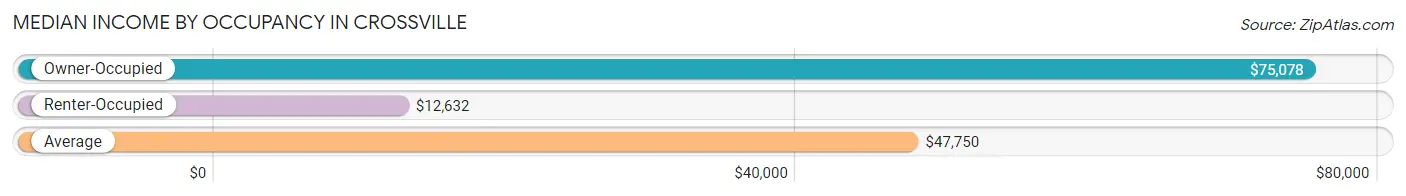
| Occupancy Type | # Households | Median Income |
| Owner-Occupied | 369 (64.4%) | $75,078 |
| Renter-Occupied | 204 (35.6%) | $12,632 |
| Average | 573 (100.0%) | $47,750 |
Occupancy by Householder Income Bracket in Crossville
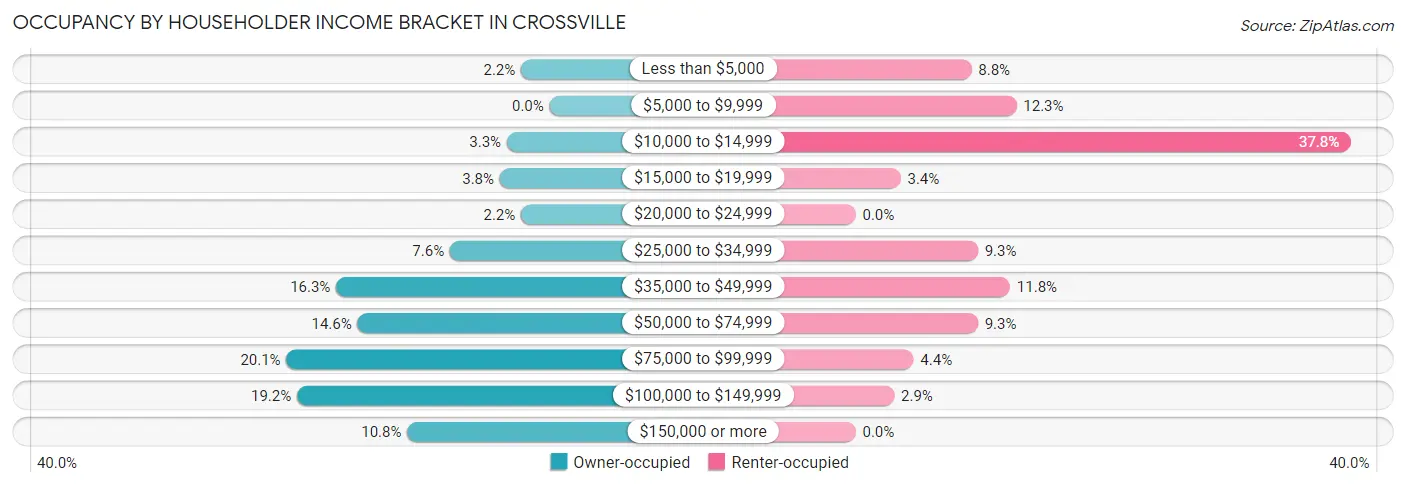
| Income Bracket | Owner-occupied | Renter-occupied |
| Less than $5,000 | 8 (2.2%) | 18 (8.8%) |
| $5,000 to $9,999 | 0 (0.0%) | 25 (12.2%) |
| $10,000 to $14,999 | 12 (3.3%) | 77 (37.8%) |
| $15,000 to $19,999 | 14 (3.8%) | 7 (3.4%) |
| $20,000 to $24,999 | 8 (2.2%) | 0 (0.0%) |
| $25,000 to $34,999 | 28 (7.6%) | 19 (9.3%) |
| $35,000 to $49,999 | 60 (16.3%) | 24 (11.8%) |
| $50,000 to $74,999 | 54 (14.6%) | 19 (9.3%) |
| $75,000 to $99,999 | 74 (20.1%) | 9 (4.4%) |
| $100,000 to $149,999 | 71 (19.2%) | 6 (2.9%) |
| $150,000 or more | 40 (10.8%) | 0 (0.0%) |
| Total | 369 (100.0%) | 204 (100.0%) |
Monthly Housing Cost Tiers in Crossville
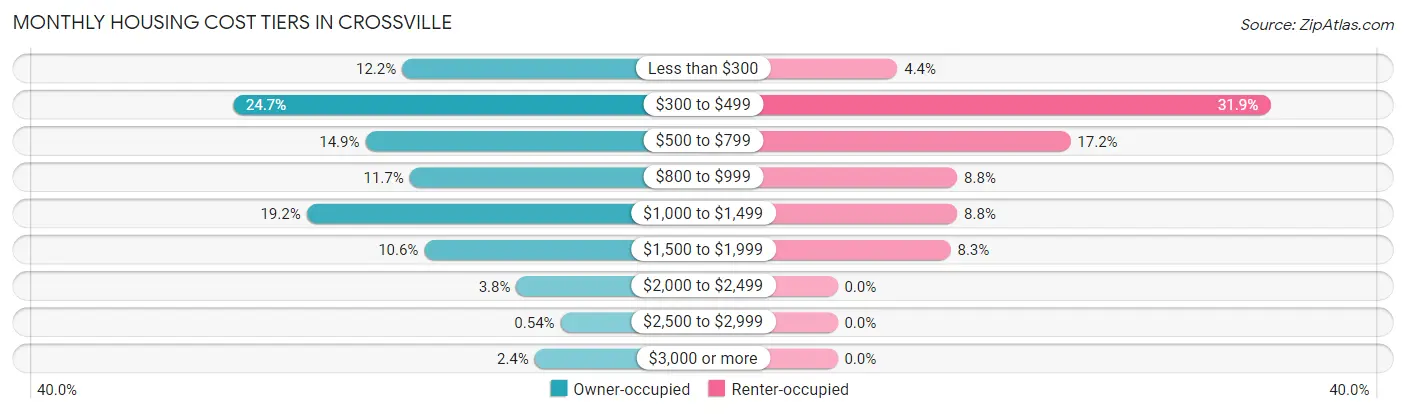
| Monthly Cost | Owner-occupied | Renter-occupied |
| Less than $300 | 45 (12.2%) | 9 (4.4%) |
| $300 to $499 | 91 (24.7%) | 65 (31.9%) |
| $500 to $799 | 55 (14.9%) | 35 (17.2%) |
| $800 to $999 | 43 (11.7%) | 18 (8.8%) |
| $1,000 to $1,499 | 71 (19.2%) | 18 (8.8%) |
| $1,500 to $1,999 | 39 (10.6%) | 17 (8.3%) |
| $2,000 to $2,499 | 14 (3.8%) | 0 (0.0%) |
| $2,500 to $2,999 | 2 (0.5%) | 0 (0.0%) |
| $3,000 or more | 9 (2.4%) | 0 (0.0%) |
| Total | 369 (100.0%) | 204 (100.0%) |
Physical Housing Characteristics in Crossville
Housing Structures in Crossville
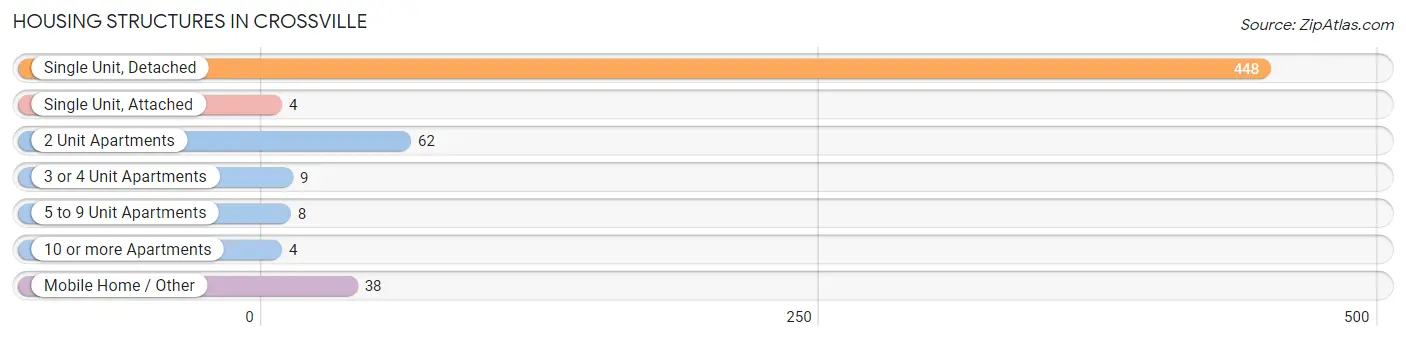
| Structure Type | # Housing Units | % Housing Units |
| Single Unit, Detached | 448 | 78.2% |
| Single Unit, Attached | 4 | 0.7% |
| 2 Unit Apartments | 62 | 10.8% |
| 3 or 4 Unit Apartments | 9 | 1.6% |
| 5 to 9 Unit Apartments | 8 | 1.4% |
| 10 or more Apartments | 4 | 0.7% |
| Mobile Home / Other | 38 | 6.6% |
| Total | 573 | 100.0% |
Housing Structures by Occupancy in Crossville
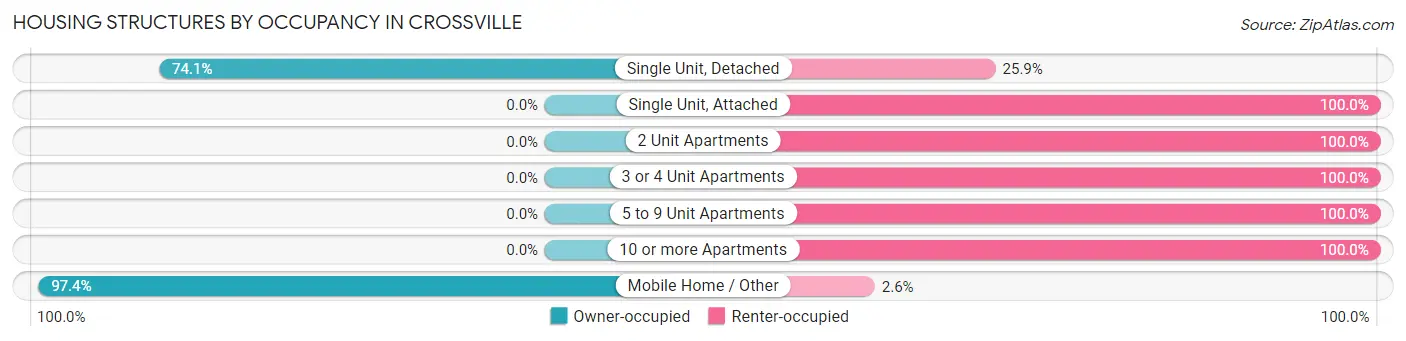
| Structure Type | Owner-occupied | Renter-occupied |
| Single Unit, Detached | 332 (74.1%) | 116 (25.9%) |
| Single Unit, Attached | 0 (0.0%) | 4 (100.0%) |
| 2 Unit Apartments | 0 (0.0%) | 62 (100.0%) |
| 3 or 4 Unit Apartments | 0 (0.0%) | 9 (100.0%) |
| 5 to 9 Unit Apartments | 0 (0.0%) | 8 (100.0%) |
| 10 or more Apartments | 0 (0.0%) | 4 (100.0%) |
| Mobile Home / Other | 37 (97.4%) | 1 (2.6%) |
| Total | 369 (64.4%) | 204 (35.6%) |
Housing Structures by Number of Rooms in Crossville
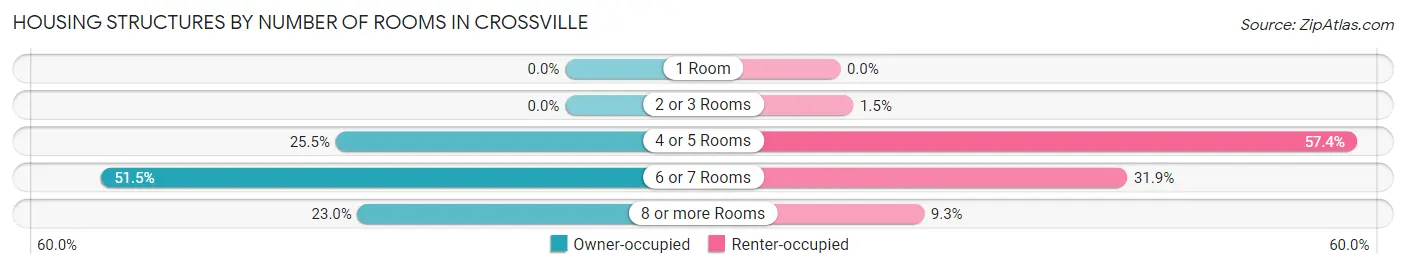
| Number of Rooms | Owner-occupied | Renter-occupied |
| 1 Room | 0 (0.0%) | 0 (0.0%) |
| 2 or 3 Rooms | 0 (0.0%) | 3 (1.5%) |
| 4 or 5 Rooms | 94 (25.5%) | 117 (57.4%) |
| 6 or 7 Rooms | 190 (51.5%) | 65 (31.9%) |
| 8 or more Rooms | 85 (23.0%) | 19 (9.3%) |
| Total | 369 (100.0%) | 204 (100.0%) |
Housing Structure by Heating Type in Crossville
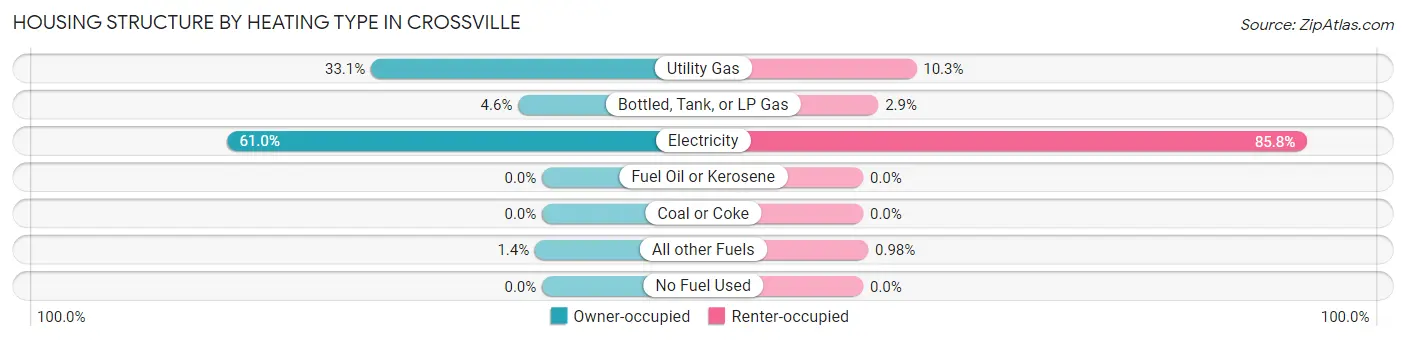
| Heating Type | Owner-occupied | Renter-occupied |
| Utility Gas | 122 (33.1%) | 21 (10.3%) |
| Bottled, Tank, or LP Gas | 17 (4.6%) | 6 (2.9%) |
| Electricity | 225 (61.0%) | 175 (85.8%) |
| Fuel Oil or Kerosene | 0 (0.0%) | 0 (0.0%) |
| Coal or Coke | 0 (0.0%) | 0 (0.0%) |
| All other Fuels | 5 (1.4%) | 2 (1.0%) |
| No Fuel Used | 0 (0.0%) | 0 (0.0%) |
| Total | 369 (100.0%) | 204 (100.0%) |
Household Vehicle Usage in Crossville
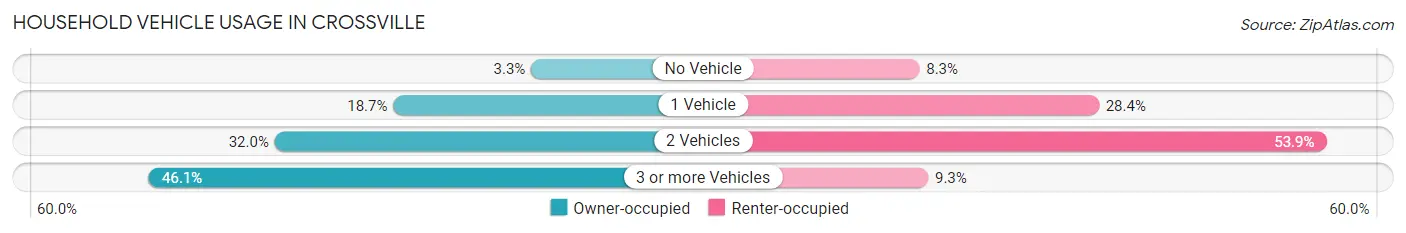
| Vehicles per Household | Owner-occupied | Renter-occupied |
| No Vehicle | 12 (3.3%) | 17 (8.3%) |
| 1 Vehicle | 69 (18.7%) | 58 (28.4%) |
| 2 Vehicles | 118 (32.0%) | 110 (53.9%) |
| 3 or more Vehicles | 170 (46.1%) | 19 (9.3%) |
| Total | 369 (100.0%) | 204 (100.0%) |
Real Estate & Mortgages in Crossville
Real Estate and Mortgage Overview in Crossville
| Characteristic | Without Mortgage | With Mortgage |
| Housing Units | 181 | 188 |
| Median Property Value | $115,400 | $141,100 |
| Median Household Income | $63,750 | $13 |
| Monthly Housing Costs | $379 | $9 |
| Real Estate Taxes | $537 | $13 |
Property Value by Mortgage Status in Crossville
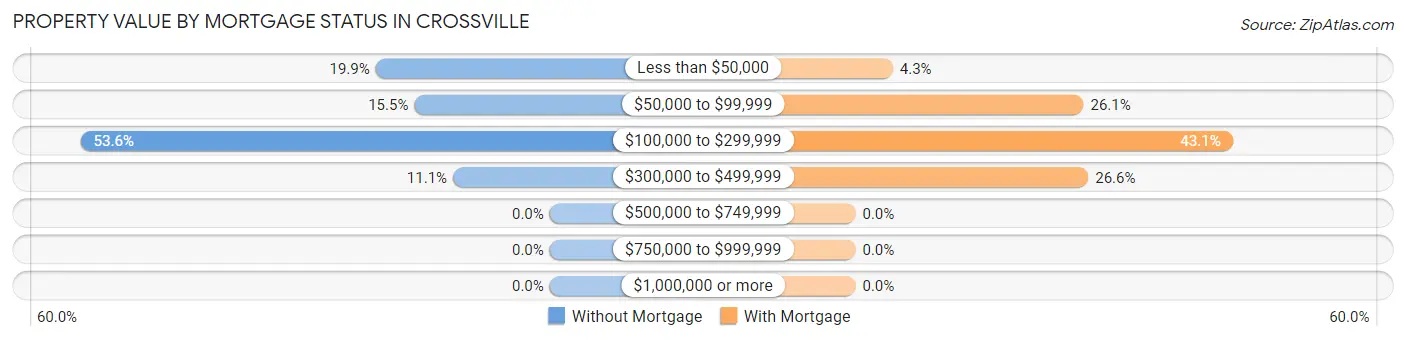
| Property Value | Without Mortgage | With Mortgage |
| Less than $50,000 | 36 (19.9%) | 8 (4.3%) |
| $50,000 to $99,999 | 28 (15.5%) | 49 (26.1%) |
| $100,000 to $299,999 | 97 (53.6%) | 81 (43.1%) |
| $300,000 to $499,999 | 20 (11.1%) | 50 (26.6%) |
| $500,000 to $749,999 | 0 (0.0%) | 0 (0.0%) |
| $750,000 to $999,999 | 0 (0.0%) | 0 (0.0%) |
| $1,000,000 or more | 0 (0.0%) | 0 (0.0%) |
| Total | 181 (100.0%) | 188 (100.0%) |
Household Income by Mortgage Status in Crossville
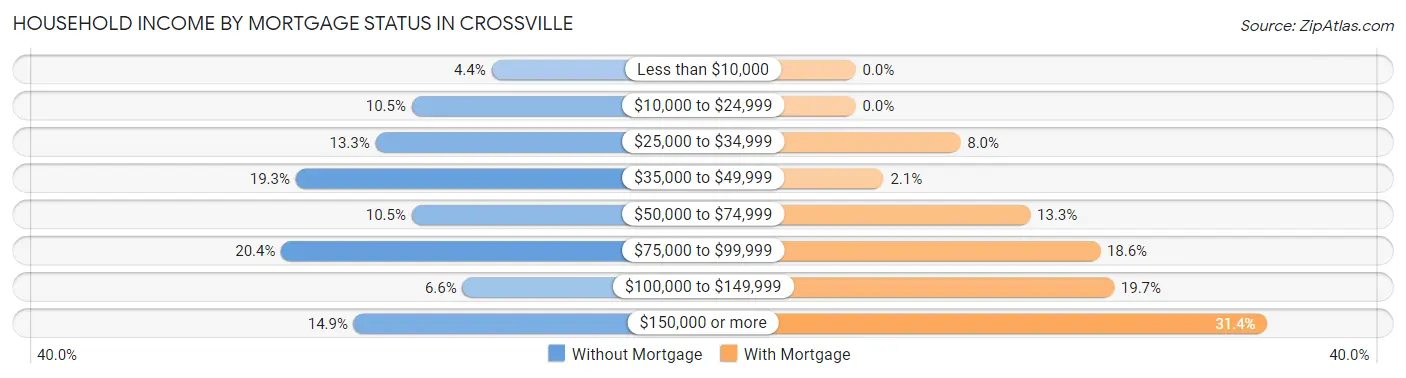
| Household Income | Without Mortgage | With Mortgage |
| Less than $10,000 | 8 (4.4%) | 0 (0.0%) |
| $10,000 to $24,999 | 19 (10.5%) | 0 (0.0%) |
| $25,000 to $34,999 | 24 (13.3%) | 15 (8.0%) |
| $35,000 to $49,999 | 35 (19.3%) | 4 (2.1%) |
| $50,000 to $74,999 | 19 (10.5%) | 25 (13.3%) |
| $75,000 to $99,999 | 37 (20.4%) | 35 (18.6%) |
| $100,000 to $149,999 | 12 (6.6%) | 37 (19.7%) |
| $150,000 or more | 27 (14.9%) | 59 (31.4%) |
| Total | 181 (100.0%) | 188 (100.0%) |
Property Value to Household Income Ratio in Crossville
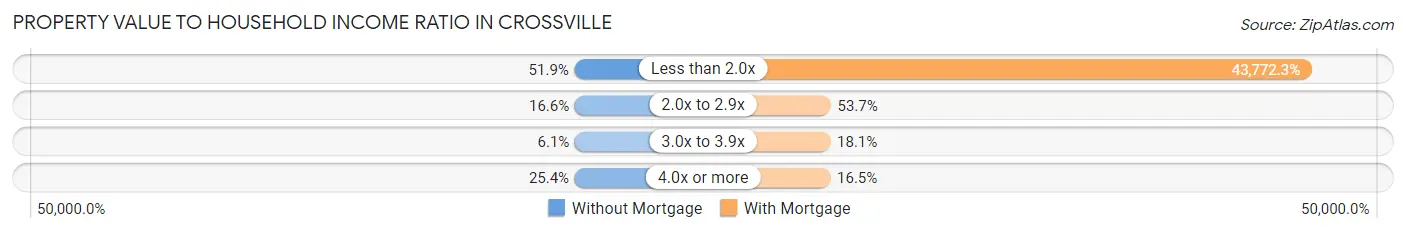
| Value-to-Income Ratio | Without Mortgage | With Mortgage |
| Less than 2.0x | 94 (51.9%) | 82,292 (43,772.3%) |
| 2.0x to 2.9x | 30 (16.6%) | 101 (53.7%) |
| 3.0x to 3.9x | 11 (6.1%) | 34 (18.1%) |
| 4.0x or more | 46 (25.4%) | 31 (16.5%) |
| Total | 181 (100.0%) | 188 (100.0%) |
Real Estate Taxes by Mortgage Status in Crossville
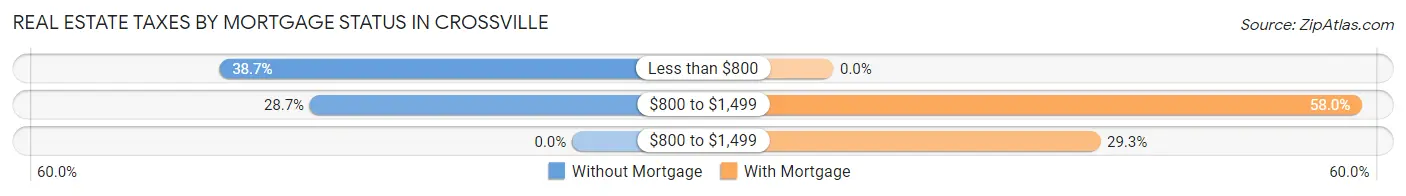
| Property Taxes | Without Mortgage | With Mortgage |
| Less than $800 | 70 (38.7%) | 0 (0.0%) |
| $800 to $1,499 | 52 (28.7%) | 109 (58.0%) |
| $800 to $1,499 | 0 (0.0%) | 55 (29.3%) |
| Total | 181 (100.0%) | 188 (100.0%) |
Health & Disability in Crossville
Health Insurance Coverage by Age in Crossville
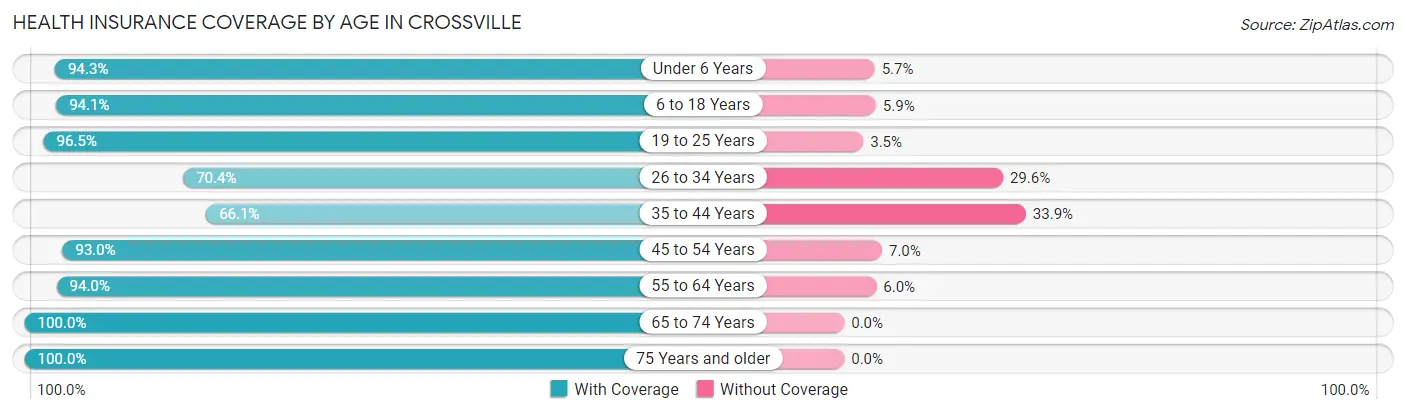
| Age Bracket | With Coverage | Without Coverage |
| Under 6 Years | 133 (94.3%) | 8 (5.7%) |
| 6 to 18 Years | 335 (94.1%) | 21 (5.9%) |
| 19 to 25 Years | 245 (96.5%) | 9 (3.5%) |
| 26 to 34 Years | 138 (70.4%) | 58 (29.6%) |
| 35 to 44 Years | 123 (66.1%) | 63 (33.9%) |
| 45 to 54 Years | 264 (93.0%) | 20 (7.0%) |
| 55 to 64 Years | 236 (94.0%) | 15 (6.0%) |
| 65 to 74 Years | 105 (100.0%) | 0 (0.0%) |
| 75 Years and older | 110 (100.0%) | 0 (0.0%) |
| Total | 1,689 (89.7%) | 194 (10.3%) |
Health Insurance Coverage by Citizenship Status in Crossville
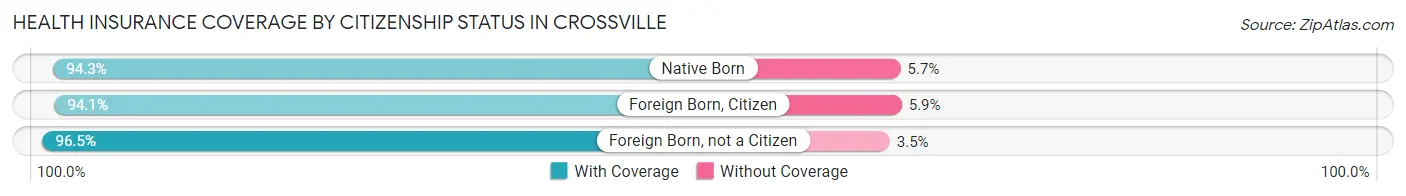
| Citizenship Status | With Coverage | Without Coverage |
| Native Born | 133 (94.3%) | 8 (5.7%) |
| Foreign Born, Citizen | 335 (94.1%) | 21 (5.9%) |
| Foreign Born, not a Citizen | 245 (96.5%) | 9 (3.5%) |
Health Insurance Coverage by Household Income in Crossville
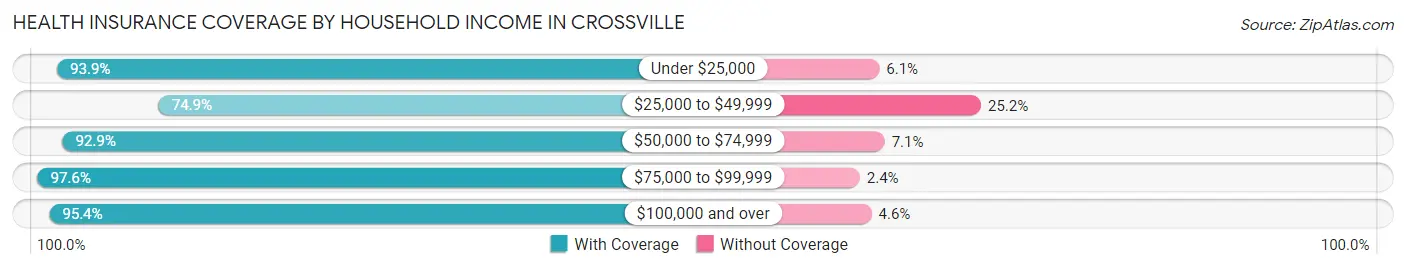
| Household Income | With Coverage | Without Coverage |
| Under $25,000 | 308 (93.9%) | 20 (6.1%) |
| $25,000 to $49,999 | 363 (74.9%) | 122 (25.2%) |
| $50,000 to $74,999 | 327 (92.9%) | 25 (7.1%) |
| $75,000 to $99,999 | 280 (97.6%) | 7 (2.4%) |
| $100,000 and over | 411 (95.4%) | 20 (4.6%) |
Public vs Private Health Insurance Coverage by Age in Crossville
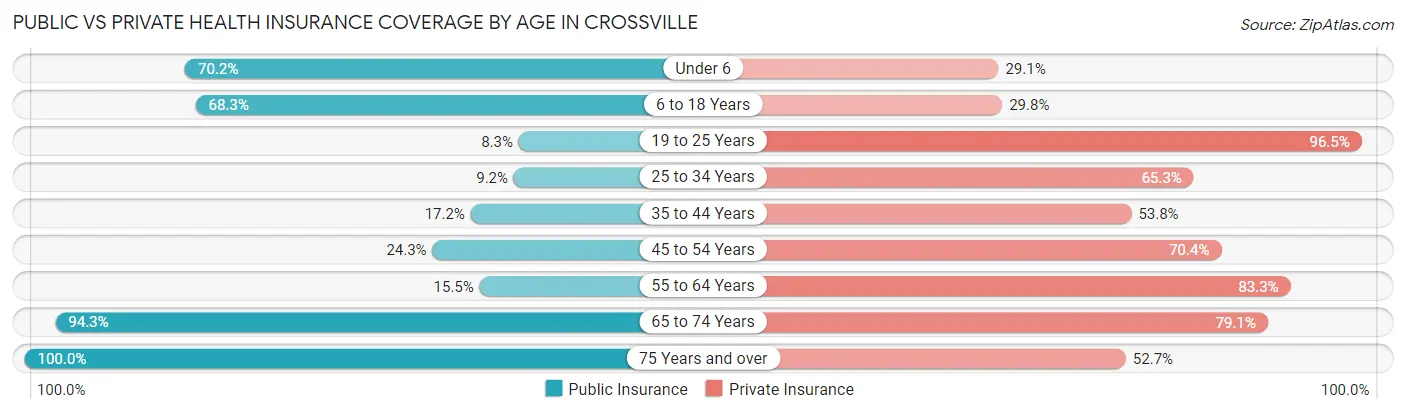
| Age Bracket | Public Insurance | Private Insurance |
| Under 6 | 99 (70.2%) | 41 (29.1%) |
| 6 to 18 Years | 243 (68.3%) | 106 (29.8%) |
| 19 to 25 Years | 21 (8.3%) | 245 (96.5%) |
| 25 to 34 Years | 18 (9.2%) | 128 (65.3%) |
| 35 to 44 Years | 32 (17.2%) | 100 (53.8%) |
| 45 to 54 Years | 69 (24.3%) | 200 (70.4%) |
| 55 to 64 Years | 39 (15.5%) | 209 (83.3%) |
| 65 to 74 Years | 99 (94.3%) | 83 (79.0%) |
| 75 Years and over | 110 (100.0%) | 58 (52.7%) |
| Total | 730 (38.8%) | 1,170 (62.1%) |
Disability Status by Sex by Age in Crossville
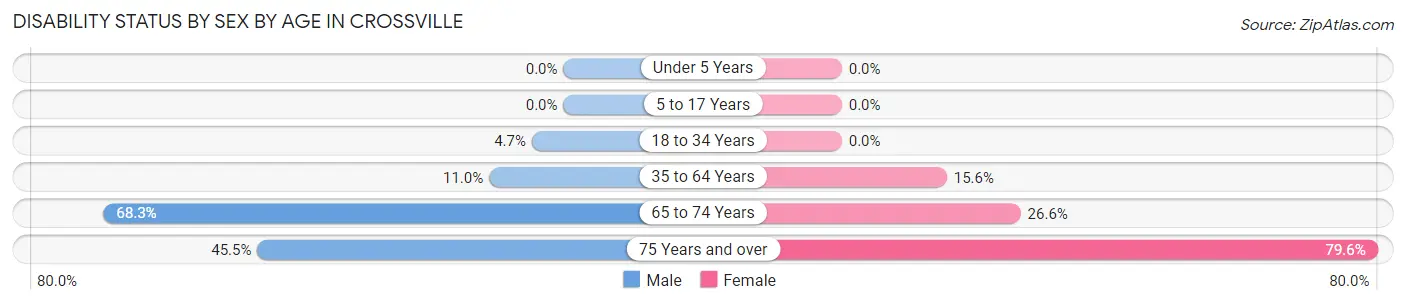
| Age Bracket | Male | Female |
| Under 5 Years | 0 (0.0%) | 0 (0.0%) |
| 5 to 17 Years | 0 (0.0%) | 0 (0.0%) |
| 18 to 34 Years | 13 (4.7%) | 0 (0.0%) |
| 35 to 64 Years | 30 (11.0%) | 70 (15.6%) |
| 65 to 74 Years | 28 (68.3%) | 17 (26.6%) |
| 75 Years and over | 30 (45.5%) | 35 (79.5%) |
Disability Class by Sex by Age in Crossville
Disability Class: Hearing Difficulty
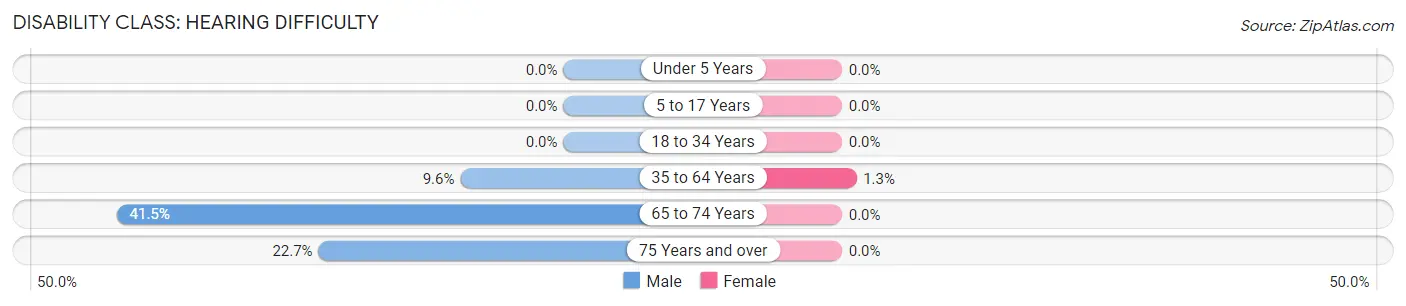
| Age Bracket | Male | Female |
| Under 5 Years | 0 (0.0%) | 0 (0.0%) |
| 5 to 17 Years | 0 (0.0%) | 0 (0.0%) |
| 18 to 34 Years | 0 (0.0%) | 0 (0.0%) |
| 35 to 64 Years | 26 (9.6%) | 6 (1.3%) |
| 65 to 74 Years | 17 (41.5%) | 0 (0.0%) |
| 75 Years and over | 15 (22.7%) | 0 (0.0%) |
Disability Class: Vision Difficulty
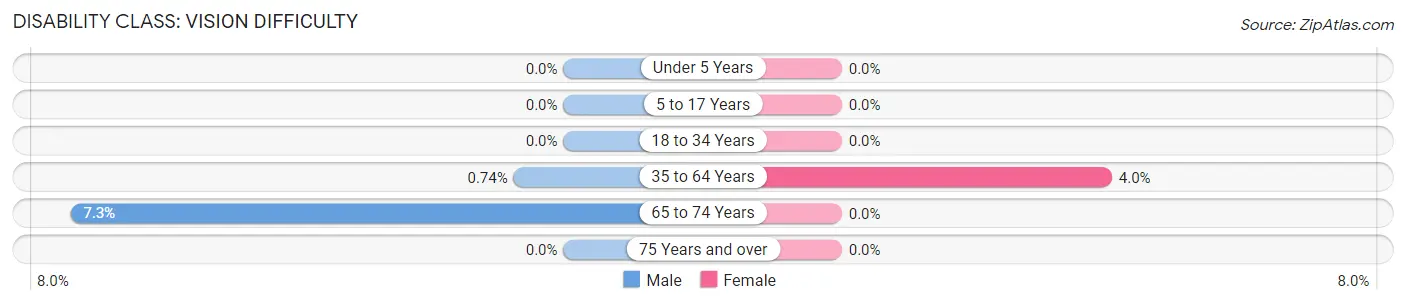
| Age Bracket | Male | Female |
| Under 5 Years | 0 (0.0%) | 0 (0.0%) |
| 5 to 17 Years | 0 (0.0%) | 0 (0.0%) |
| 18 to 34 Years | 0 (0.0%) | 0 (0.0%) |
| 35 to 64 Years | 2 (0.7%) | 18 (4.0%) |
| 65 to 74 Years | 3 (7.3%) | 0 (0.0%) |
| 75 Years and over | 0 (0.0%) | 0 (0.0%) |
Disability Class: Cognitive Difficulty
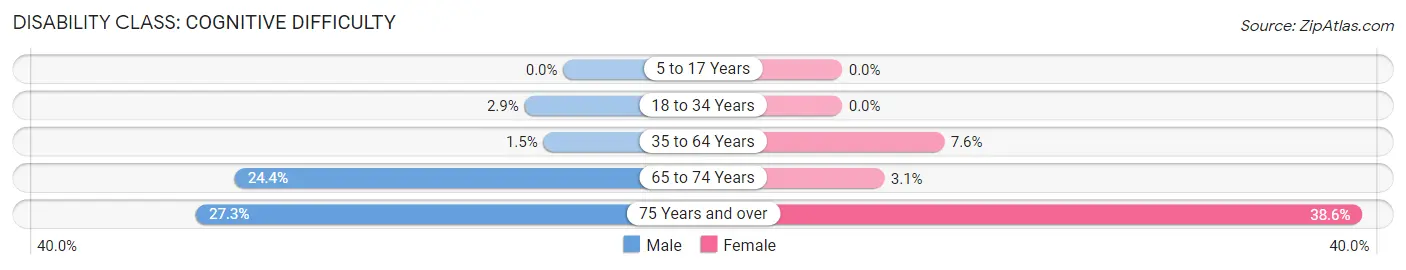
| Age Bracket | Male | Female |
| 5 to 17 Years | 0 (0.0%) | 0 (0.0%) |
| 18 to 34 Years | 8 (2.9%) | 0 (0.0%) |
| 35 to 64 Years | 4 (1.5%) | 34 (7.6%) |
| 65 to 74 Years | 10 (24.4%) | 2 (3.1%) |
| 75 Years and over | 18 (27.3%) | 17 (38.6%) |
Disability Class: Ambulatory Difficulty
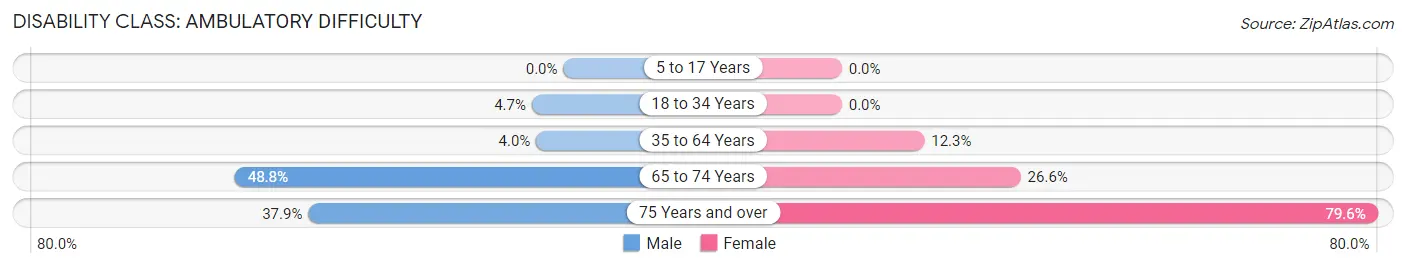
| Age Bracket | Male | Female |
| 5 to 17 Years | 0 (0.0%) | 0 (0.0%) |
| 18 to 34 Years | 13 (4.7%) | 0 (0.0%) |
| 35 to 64 Years | 11 (4.0%) | 55 (12.2%) |
| 65 to 74 Years | 20 (48.8%) | 17 (26.6%) |
| 75 Years and over | 25 (37.9%) | 35 (79.5%) |
Disability Class: Self-Care Difficulty
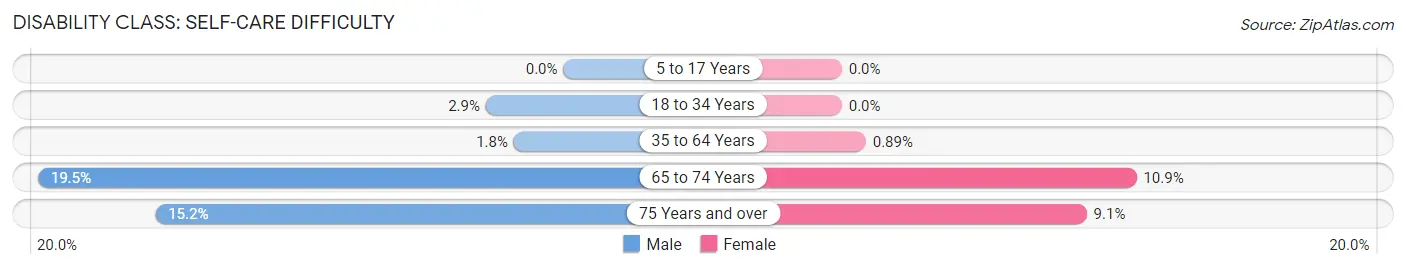
| Age Bracket | Male | Female |
| 5 to 17 Years | 0 (0.0%) | 0 (0.0%) |
| 18 to 34 Years | 8 (2.9%) | 0 (0.0%) |
| 35 to 64 Years | 5 (1.8%) | 4 (0.9%) |
| 65 to 74 Years | 8 (19.5%) | 7 (10.9%) |
| 75 Years and over | 10 (15.1%) | 4 (9.1%) |
Technology Access in Crossville
Computing Device Access in Crossville
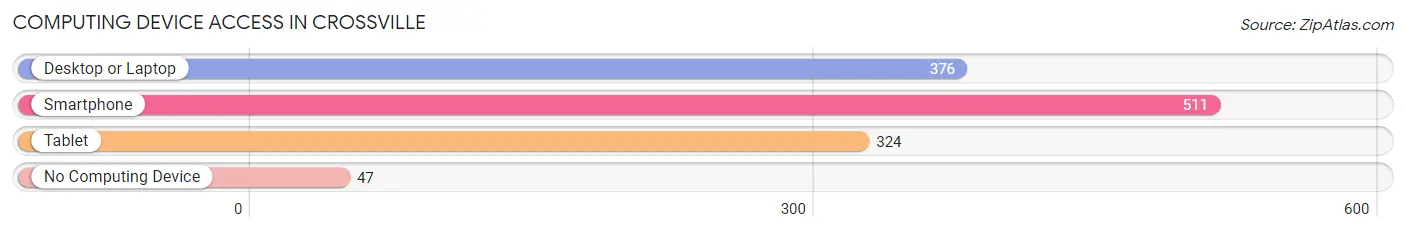
| Device Type | # Households | % Households |
| Desktop or Laptop | 376 | 65.6% |
| Smartphone | 511 | 89.2% |
| Tablet | 324 | 56.5% |
| No Computing Device | 47 | 8.2% |
| Total | 573 | 100.0% |
Internet Access in Crossville
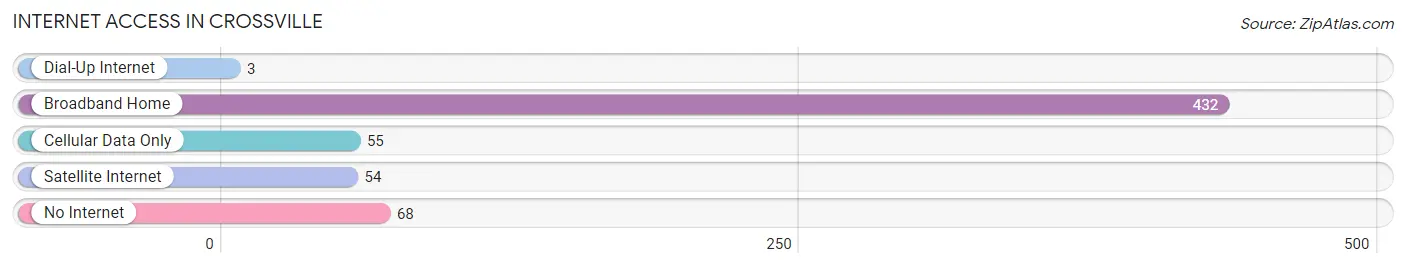
| Internet Type | # Households | % Households |
| Dial-Up Internet | 3 | 0.5% |
| Broadband Home | 432 | 75.4% |
| Cellular Data Only | 55 | 9.6% |
| Satellite Internet | 54 | 9.4% |
| No Internet | 68 | 11.9% |
| Total | 573 | 100.0% |
Crossville Summary
Crossville, Alabama is a small town located in DeKalb County in the northeastern part of the state. It is situated on the banks of the Tennessee River, and is home to a population of approximately 1,500 people. The town was founded in 1836 and has a rich history of industry, agriculture, and commerce.
Geography
Crossville is located in the foothills of the Appalachian Mountains, and is surrounded by rolling hills and lush forests. The town is situated on the banks of the Tennessee River, and is bordered by the cities of Fort Payne and Rainsville. The town is located at an elevation of 890 feet above sea level, and has a total area of 1.3 square miles.
Economy
Crossville’s economy is largely based on agriculture and manufacturing. The town is home to several large farms, which produce a variety of crops including corn, soybeans, and cotton. The town is also home to several manufacturing plants, which produce a variety of products including furniture, textiles, and automotive parts. In addition, the town is home to several small businesses, including restaurants, retail stores, and service providers.
Demographics
As of the 2010 census, Crossville had a population of 1,500 people. The racial makeup of the town was 97.3% White, 0.7% African American, 0.3% Native American, 0.3% Asian, and 1.3% from other races. The median household income was $30,000, and the median family income was $35,000. The per capita income was $14,000.
History
Crossville was founded in 1836 by a group of settlers from Tennessee. The town was named after the nearby Crossville Creek, which was named after a local Native American chief. The town quickly grew and became an important center of commerce and industry. In the late 19th century, the town was home to several large cotton mills, which provided employment for many of the town’s residents. In the early 20th century, the town was home to several large furniture factories, which provided employment for many of the town’s residents.
In the late 20th century, the town’s economy shifted away from manufacturing and towards agriculture and tourism. The town is now home to several large farms, which produce a variety of crops. In addition, the town is home to several tourist attractions, including the Crossville Historic District, which is listed on the National Register of Historic Places.
Crossville is a small town with a rich history and a bright future. The town is home to a diverse population, and is a great place to live, work, and play. The town is home to a variety of businesses, and offers a variety of recreational activities. Crossville is a great place to call home.
Common Questions
What is Per Capita Income in Crossville?
Per Capita income in Crossville is $21,472.
What is the Median Family Income in Crossville?
Median Family Income in Crossville is $66,750.
What is the Median Household income in Crossville?
Median Household Income in Crossville is $47,750.
What is Income or Wage Gap in Crossville?
Income or Wage Gap in Crossville is 54.1%.
Women in Crossville earn 45.9 cents for every dollar earned by a man.
What is Inequality or Gini Index in Crossville?
Inequality or Gini Index in Crossville is 0.46.
What is the Total Population of Crossville?
Total Population of Crossville is 2,043.
What is the Total Male Population of Crossville?
Total Male Population of Crossville is 909.
What is the Total Female Population of Crossville?
Total Female Population of Crossville is 1,134.
What is the Ratio of Males per 100 Females in Crossville?
There are 80.16 Males per 100 Females in Crossville.
What is the Ratio of Females per 100 Males in Crossville?
There are 124.75 Females per 100 Males in Crossville.
What is the Median Population Age in Crossville?
Median Population Age in Crossville is 40.1 Years.
What is the Average Family Size in Crossville
Average Family Size in Crossville is 4.0 People.
What is the Average Household Size in Crossville
Average Household Size in Crossville is 3.3 People.
How Large is the Labor Force in Crossville?
There are 861 People in the Labor Forcein in Crossville.
What is the Percentage of People in the Labor Force in Crossville?
51.9% of People are in the Labor Force in Crossville.
What is the Unemployment Rate in Crossville?
Unemployment Rate in Crossville is 2.0%.